Embed Size (px)
Citation preview

Standard Chartered PLCPillar 3 Disclosures
31 December 2012
Incorporated in England with registered number 966425Principal Office: 1 Aldermanbury Square, London, EC2V 7SB, England

Standard Chartered PLC
Pillar 3 Disclosures
2
Highlights
• Strongly capitalised, with a focus on Core Tier 1, Tier 1 and total capital, to support a conservative, diversified balance sheet with low exposure to higher-risk asset classes and segments.
• Our capital position, allied with strong liquidity, continues to allow us to support our clients and customers.
28,922 31,833 35,339
5,3735,179
5,26110,76710,495
12,088
$million $million $million
2010 2011 2012
Tier 2 capital
Tier 1 capital
Core Tier 1 capital
11.8 11.8 11.7
14.0 13.7 13.4
18.4 17.6 17.4
% % %
2010 2011 2012
Core Tier 1 capital
Tier 1 capital
Total capital
Basel II - Capital Basel II – Capital ratios
Consumer Banking
27% (2011: 27%)
Wholesale Banking
73% (2011: 73%)
Basel II - RWA Basel II – RWA by business
Standard Chartered PLC is headquartered in London where it is regulated by the UK’s Financial Services Authority (FSA). On 1 April 2013, the FSA will cease to exist and from this date onwards Standard Chartered Bank will be authorised by the Prudential Regulation Authority (PRA) and, Standard Chartered PLC Group and Standard Chartered Bank will be regulated by the Financial Conduct Authority (FCA) and the PRA.
Within this document ‘the Group’ refers to Standard Chartered PLC together with its subsidiary undertakings. The Hong Kong Special Administrative Region of the People’s Republic of China is referred to as Hong Kong and includes Macau; India includes Nepal; The Republic of Korea is referred to as Korea or South Korea; Middle East and Other South Asia (MESA) includes, amongst others: Afghanistan, Bahrain, Bangladesh, Egypt, Jordan, Lebanon, Oman, Pakistan, Qatar, Sri Lanka, United Arab Emirates (UAE); and Other Asia Pacific includes, amongst others: Australia, Brunei, Cambodia, China, Indonesia, Japan, Laos, Malaysia, the Philippines, Taiwan, Thailand and Vietnam.
Throughout this document, unless another currency is specified, the word ‘dollar’ or symbol $ means United States dollar.
Throughout this document IRB refers to internal ratings based models used. The Group does not use the Foundation IRB approach.
In January 2012 the Group’s subsidiary in Korea, SC First Bank Korea Ltd, was rebranded to Standard Chartered Bank Korea Ltd and will be referred to as such throughout this document.
Credit Risk82%
(2011: 81%)
Operational Risk10%
(2011: 11%)
Market Risk8%
(2011: 8%)

Standard Chartered PLC
Pillar 3 Disclosures
3
IntroductionStandard Chartered complies with the Basel II framework which has been implemented in the UK through the FSA’s General Prudential sourcebook (GENPRU) and its Prudential sourcebook for Banks, Building Societies and Investment Firms (BIPRU). Basel II is structured around three ‘pillars’. Pillar 3 aims to bolster market discipline through enhanced disclosure by banks. It is the Group’s intention that the Pillar 3 disclosures be viewed as an integral, albeit separately reported, element of the Annual Report and Accounts. The Group considers a number of factors in determining where disclosure is made between the Annual Report and Accounts and Pillar 3, including International Financial Reporting Standards (IFRS), regulatory requirements and industry best practice.
2012 Pillar 3 disclosures Ahead of the implementation of Capital Requirements Directive (CRD) IV, the FSA, the Enhanced Disclosures Task Force (EDTF) and the European Banking Authority (EBA), have made a series of disclosure recommendations. In response to these recommendations, and in consultation with the British Bankers’ Association Disclosure Working Group, we have made changes to our 2012 Pillar 3 disclosures. Principal changes compared with the previous year include new disclosures related to Basel III transitional capital and leverage ratio and enhancement of our securitisation disclosures. We have also removed information that is already disclosed in the 2012 Annual Report and Accounts but have included references to that information where appropriate. A summary of differences and cross references between the Annual Report and Accounts and the Pillar 3 disclosures can be found on pages 60 and 61 of this document.
Risk ManagementThe management of risk lies at the heart of our business. One of the main risks incurred arises from extending credit to customers through our trading and lending operations. Beyond credit risk, Standard Chartered is also exposed to a range of other risk types such as country cross-border, market, liquidity, operational, pension, reputational and other risks that are inherent to the Group’s strategy, product range and geographical coverage. Our approach to the management of risk can be found on page 62 of the Risk review in the 2012 Annual Report and Accounts.
Credit Risk Credit risk is the potential for loss due to the failure of a counterparty to meet its obligations to pay the Group in accordance with agreed terms. Credit exposures may arise from both the banking and trading books.
Credit risk is managed through a framework that sets out policies and procedures covering the measurement and management of credit risk. There is a clear segregation of duties between transaction originators in the businesses and approvers in the Risk function. All credit exposure limits are approved within a defined credit approval authority framework.
From 1 January 2008 the Group has predominantly been using the advanced Internal Ratings Based (IRB) approach for the measurement of credit risk capital. This approach builds on the Group’s risk management practices and is the result of a significant investment in data warehouses and risk models.
Our approach to credit risk and disclosures in respect of problem credit management and provisioning can be found on page 73 of the Risk review in the 2012 Annual Report and Accounts.
Market RiskWe recognise market risk as the potential for loss of earnings or economic value due to adverse changes in financial market rates or prices. Our exposure to market risk arises principally from customer-driven transactions. The objective of our market risk policies and processes is to obtain the best balance of risk and return while meeting customers’ requirements.
The primary categories of market risk for Standard Chartered are interest rate risk, currency exchange rate risk, commodity price risk and equity price risk.
We use a Value at Risk (VaR) model for the measurement of market risk capital for part of the trading book exposures where permission to use such models has been granted by the FSA. Where our market risk exposures are not approved for inclusion in VaR models, the capital requirements are determined using standard rules provided by the regulator.
Our approach to market risk can be found on page 99 of the Risk review in the 2012 Annual Report and Accounts.
Operational RiskOperational risk is the potential for loss arising from the failure of people, process or technology or the impact of external events. Operational risk exposures are managed through a consistent set of management processes that drive risk identification, assessment, control and monitoring. We seek to control operational risks to ensure that operational losses do not cause material damage to the Group’s franchise.
The Group applies the Standardised Approach for determining the capital requirements for operational risk. Our approach to operational risk can be found on pages 111 and 112 of the Risk review in the 2012 Annual Report and Accounts.
Remuneration The remuneration disclosure follows the requirements of the FSA Policy Statement PS10/21 issued in December 2010. Further details on Remuneration can be found on pages 160 to 185 of the Directors’ remuneration report in the 2012 Annual Report and Accounts.
Basel IIIBasel III rules published in December 2010 and updated in June 2011 by the Basel Committee on Banking Supervision (BCBS) are due to be implemented via EU legislation (the package of reforms commonly referred to as CRD IV comprising the current proposals for a Capital Requirements Regulation and a Capital Requirements Directive). In response to the Financial Policy Committee (FPC) and the FSA disclosure recommendations in the UK, the Group has provided Basel III transitional capital and leverage ratio disclosures. These disclosures illustrate the potential impact of the new regulation on regulatory capital.
VerificationPillar 3 disclosures are not subject to audit, although the 2008 disclosures were reviewed by KPMG to ensure compliance with Chapter 11 of the FSA BIPRU Handbook. This review has not been repeated since there has been no significant change to the BIPRU requirements. The 2012 Pillar 3 disclosures have been reviewed and verified by senior management.
FrequencyIn accordance with Group policy the Pillar 3 disclosures will be made annually as at 31 December and will be published on the Standard Chartered PLC website www.standardchartered.com aligning with the publication date of the Group’s Annual Report and Accounts.

Standard Chartered PLC
Pillar 3 Disclosures
4
Contents
Highlights ..............................................................................................2
Introduction ...........................................................................................3
Contents ...............................................................................................4
1. Scope of Basel framework.................................................................5
1.1. Accounting and regulatory consolidation................................6-7
2. Capital...............................................................................................8
2.1. Basel II Capital structure ....................................................8-13
2.2. Basel III Capital structure ..................................................14-18
3. Credit risk ........................................................................................19
3.1. Internal Ratings Based Approach to credit risk .......................19
3.2. Standardised Approach to credit risk .....................................19
3.3 Internal Ratings Based models..........................................20-21
3.4. Regulatory capital requirements........................................22-23
3.5. Exposure values ...............................................................24-29
3.6. Credit risk mitigation ........................................................30-31
3.7. Regulatory expected loss vs impairment charges ...................32
3.8. Risk grade profile ..............................................................33-37
3.9. Counterparty credit risk in the trading book.......................38-40
3.10. Securitisation....................................................................41-47
4. Market risk .................................................................................48-49
5. Operational risk ...............................................................................50
6. Remuneration.............................................................................51-53
7. Immaterial portfolios ........................................................................54
8. Forward looking statements.............................................................54
9. Acronyms........................................................................................55
Glossary.........................................................................................56-59
Summary of differences between the Pillar 3 disclosures and the
Risk review of the Annual Report and Accounts ...................................60
Summary of cross-references between the Pillar 3 disclosures
and the Risk review of the Annual Report and Accounts ......................61
Tables
1: Comparison of accounting and regulatory consolidation................7
2: Capital base...............................................................................8-9
3: Risk weighted assets and capital ratios .........................................9
4: Capital instruments: Preference shares........................................10
5: Capital instruments: Innovative Tier 1 securities ...........................10
6: Capital instruments – Upper Tier 2 ..............................................11
7: Capital instruments – Lower Tier 2 subordinated notes................12
8: Capital resources of significant subsidiaries .................................13
9: CRD IV transitional capital base (own funds)...........................16-17
10: Leverage ratio .............................................................................18
11: Wholesale Banking model results ................................................21
12: Regulatory capital requirements...................................................22
13: Regulatory capital requirements of significant subsidiaries ...........23
14: Exposure at default by geography ..........................................24-25
15: Exposure at default by industry ..............................................26-27
16: Exposure at default by maturity ..............................................28-29
17: IRB exposure at default after CRM ..............................................30
18: Credit risk mitigation ....................................................................31
19: Regulatory expected loss ............................................................32
20: Exposure at default after CRM by risk grade ................................34
21: Undrawn commitments by risk grade ..........................................35
22: Exposure weighted average LGD by risk grade............................36
23: Exposure weighted average risk weight .......................................37
24: Counterparty credit risk - derivatives............................................39
25: Counterparty credit risk by derivative type ...................................40
26: Securitisation: notional amount....................................................42
27: Securitisation programmes (as originator) ....................................44
28: Securitisation programmes - capital requirement .........................45
29: Securitisation programmes by risk weight....................................47
30: Securitisation programmes by region...........................................47
31: Market risk capital requirement ....................................................48
32: Market risk capital requirement for significant subsidiaries ...........49
33: Stressed VaR ..............................................................................49
34: Operational risk capital requirement by business .........................50
35: Operational risk capital requirement for significant subsidiaries ....50
36: Code staff employees remuneration by business.........................51
37: Code staff employees remuneration by fixed/variable
compensation .............................................................................51
38: Deferred remuneration.................................................................51
39: Significant payments and severance............................................51

Standard Chartered PLC
Pillar 3 Disclosures
5
1. Scope of Basel frameworkBasel IIPillar 1The Group’s lead supervisor, the FSA, formally approved underlying models and the Group’s use of the IRB approach for calculating regulatory capital requirements in 2007 and since 1 January 2008, the Group has been using the IRB approach for the measurement of credit risk capital requirements. The IRB models approved by the FSA cover 80 per cent of the Group’s credit risk weighted assets (RWA), (2011: 79 per cent).
The Group applies a VaR model for the measurement of market risk capital in accordance with the scope of the permission to use such a model granted by the FSA. Where the Group’s market risk exposures are not approved for inclusion in its VaR model, capital requirements are based on standard rules provided by the regulator which are less risk sensitive.
The Group is also required to calculate a capital charge to cover operational risk for which the Group applies the Standardised Approach.
Pillar 2Pillar 2 requires banks to undertake a comprehensive assessment of their risks and to determine the appropriate amounts of capital to be held against these risks where other suitable mitigants are not available. This risk and capital assessment is commonly referred to as the Internal Capital Adequacy Assessment Process (ICAAP). The range of risks that need to be covered by the ICAAP is much broader than Pillar 1, which covers only credit risk, market risk and operational risk.
The Group has developed an ICAAP framework which closely integrates the risk and capital assessment processes, and ensures that adequate levels of capital are maintained to support the Group’s current and projected demand for capital under expected and stressed conditions.
The ICAAP framework has been designed to be applied consistently across the organisation to meet the Pillar 2 requirements of local regulators. A description of the risk management framework is set out on page 62 of the Risk review in the Group’s 2012 Annual Report and Accounts.
Under Pillar 2, the FSA is required to undertake a review of the Group’s ICAAP. This is currently referred to as the Supervisory Review and Evaluation Process (SREP). The SREP forms part of the FSA’s Advanced Risk Response Operating Framework (ARROW) and determines the minimum regulatory capital requirements of the Group, referred to as Individual Capital Guidance (ICG).
Pillar 3Pillar 3 aims to provide a consistent and comprehensive disclosure framework that enhances comparability between banks and further promotes improvements in risk practices. The Group has implemented a Pillar 3 policy and procedure framework to address the requirements laid down for Pillar 3 disclosure. The information provided here has been reviewed and verified by senior management and is in accordance with the rules in force at the time of publication and laid out in the FSA Handbook and BIPRU chapter 11, covering both the qualitative and quantitative items. Disclosure relating to remuneration follows the requirements of FSA Policy Statement PS10/21 issued in December 2010.
In response to recommendations from the FSA, EDTF and the EBA, a number of changes have been made to the 2012 Annual Report and Accounts and Pillar 3 disclosures. These include an increase in cross-referencing, the removal of duplication from Pillar 3 disclosures and additional disclosures in respect of the accounting and regulatory consolidation, Basel III transitional capital and the leverage ratio. In order to facilitate navigation between the 2012 Annual Report and Accounts and Pillar 3 disclosures a summary of differences and cross-references has been included in both documents. This summary can be found on pages 60 and 61 of this document.
Pages 119 and 120 of the 2012 Annual Report and Accounts include tables describing the movement in total capital and risk-weighted assets during the year. Pages 111 and 112 include enhanced disclosures on operational risk.
Pillar 3 disclosures include a comparison of the accounting and regulatory consolidation (see Table 1) and provide the constituent parts of the capital base under Basel III, as if 31 December 2012 was the first day of the CRD IV transitional period, which runs from 1 January 2013 until the end point of 1 January 2022 (see Table 9). The leverage ratio (see Table 10) is based on both the end point Tier 1 capital under Basel III and a measure of Tier 1 capital that includes in full Additional Tier 1 instruments that are expected to be phased out during the transitional period.
Further details and disclosures of risk, liquidity, capital management and remuneration are presented in the 2012 Annual Report and Accounts.

Standard Chartered PLC
Pillar 3 Disclosures
6
1.1. Accounting and regulatory consolidationThe Pillar 3 disclosures are made for the consolidated Standard Chartered PLC Group. The principal undertakings presented below are the same as those disclosed in the 2012 Annual Report and Accounts, and Table 8 on page 13 of this document provides additional disclosures of the capital resources for those significant subsidiaries that represent at least 10 per cent of the Group’s regulatory capital requirements, in accordance with BIPRU 11.4.5.
The accounting policy for consolidation is provided in note 1 of the financial statements in the 2012 Annual Report and Accounts. All banking subsidiaries are fully consolidated, and the treatment is the same for both regulatory and accounting
purposes. For associates, the regulatory treatment differs from the accounting policy, which applies the equity accounting method. Investments in associates that are between 20 and 50 per cent owned are proportionately consolidated for regulatory purposes and the investment in associates that are between 10 and 20 per cent owned are deducted from capital resources. Joint ventures are proportionately consolidated for both accounting and regulatory purposes.
The regulatory consolidation approaches used by the Group are shown below, which identifies the principal undertakings, including, investments, associates and joint ventures, which are all principally engaged in the business of banking and provision of other financial services.
Type Description Regulatory consolidation Principal undertakings
Investment The Group holds less than 10 per cent of the issued share capital
The Group risk weights the investment
Agricultural Bank of China
Investment The Group holds at least 10 per cent and less than 20 per cent of the issued share capital
The Group deducts the carrying value of the investment from its regulatory capital
Asia Commercial Bank
China Bohai Bank
Associate The Group holds at least 20 per cent and up to 50 per cent of the issued share capital
The Group proportionately consolidates its share of the assets, liabilities, income, expenses and exposures
Fleming Family & Partners
Joint Venture
The Group enters into a contractual arrangement to exercise joint control over an undertaking
The Group proportionately consolidates its share of the assets, liabilities, income, expenses and exposures
PT Bank Permata Tbk
Subsidiary The Group holds more than 50 per cent of the issued share capital
The Group fully consolidates the undertaking
Standard Chartered Bank
Standard Chartered Bank Korea Limited
Standard Chartered Bank Malaysia Berhad
Standard Chartered Bank (Pakistan) Limited
Standard Chartered Bank (Taiwan) Limited
Standard Chartered Bank (Hong Kong) Limited
Standard Chartered Bank (China) Limited
Standard Chartered Bank (Thai) Public Company Limited
Standard Chartered Bank Nigeria Limited
Standard Chartered Bank Kenya Limited
Standard Chartered Private Equity Limited, Hong Kong

Standard Chartered PLC
Pillar 3 Disclosures
7
1.1. Accounting and regulatory consolidation continuedTable 1 below shows that the difference between the basis of consolidation for accounting and regulatory purposes is not material. The difference is due to consolidation adjustments made for the proportionate consolidation of associates. The
more significant difference between the two bases is the treatment of capital, which is presented in Table 2 on pages 8 and 9. The assets and liabilities presented in Table 1 under the regulatory scope of consolidation are before any regulatory adjustments.
Table 1: Comparison of accounting and regulatory consolidation
2012 Accounting
Balance Sheet as in published
financial statements
Consolidation of banking
associates/ other entities
Under regulatory
scope of consolidation
$million $million $million
AssetsCash and balances at central banks 61,043 8 61,051 Financial assets held at fair value through profit or loss 27,084 27,084 Derivative financial instruments 49,496 49,496 Loans and advances to banks 68,381 68,381 Loans and advances to customers 283,885 283,885 Investment securities 99,413 1 99,414 Other assets 28,818 2 28,820 Current tax assets 215 215 Prepayments and accrued income 2,581 2 2,583 Interests in associates 953 (35) 918 Goodwill and intangible assets 7,312 1 7,313 Property, plant and equipment 6,646 1 6,647 Deferred tax assets 691 691
Total assets 636,518 (20) 636,498
LiabilitiesDeposits by banks 36,477 36,477 Customer accounts 377,639 377,639 Financial liabilities held at fair value 23,064 23,064 Derivative financial instruments 47,192 47,192 Debt securities in issue 55,979 55,979 Other liabilities 24,504 1 24,505 Current tax liabilities 1,069 1,069 Accruals and deferred income 4,860 3 4,863 Subordinated liabilities and other borrowed funds 18,799 18,799
of which tier 1 capital instruments 3,758 3,758 of which tier 2 capital instruments 1 15,041 15,041
Deferred tax liabilities 161 161 Provisions for liabilities and charges 215 1 216 Retirement benefit obligations 504 504 Share capital 1,207 5 1,212 Reserves 44,155 (30) 44,125 Non-controlling interests 693 - 693
Total liabilities and equity 636,518 (20) 636,498 1 Tier 2 capital includes eligible Tier 2 instruments, which are included in regulatory capital of $12,989 million.

Standard Chartered PLC
Pillar 3 Disclosures
8
2. Capital 2.1. Basel II Capital structureCapital managementThe Capital section of the 2012 Annual Report and Accounts on page 116 provides our approach to capital management. Table 2 below summarises the consolidated capital position of the Group.
Movement in capitalCore Tier 1 capital increased by $3,506 million since 31 December 2011. This increase is principally due to profit of $4,887 million, partly offset with dividends paid to shareholders of $1,407 million.
Other Tier 1 capital after regulatory adjustments increased by $82 million since 31 December 2011, due mainly to favourable
exchange movements. Tier 2 capital increased by $1,641 million since 31 December 2011, principally due to issuances of US Dollar and Euro denominated debt totalling $3,222 million, partly offset by redemptions totalling $1,447 million and amortisation of $163 million.
A movement in total capital can be found on page 119 of the 2012 Annual Report and Accounts.
In light of the uncertain economic environment and evolving regulatory debate on banks' capital structures, the Group continues to believe it is appropriate to remain strongly capitalised with a Core Tier 1 capital ratio of 11.7 per cent, Tier 1 capital ratio of 13.4 per cent and total capital ratio of 17.4 per cent.
Table 2: Capital base2012 2011
$million $million
Shareholders' equity
Parent company shareholders' equity per balance sheet 45,362 40,714 Preference shares classified as equity included in other Tier 1 capital (1,495) (1,494)
43,867 39,220 Non-controlling interests
Non-controlling interests per balance sheet 693 661 Non-controlling Tier 1 capital included in other Tier 1 capital (320) (320)
373 341 Regulatory adjustments
Unrealised (gains) losses on available-for-sale debt securities (97) 282 Unrealised gains on available-for-sale equity securities included in Tier 2 capital (490) (241) Cash flow hedge reserve (81) 13 Other adjustments (35) (46)
(703) 8 Deductions
Goodwill and other intangible assets (7,312) (7,061) 50 per cent excess of expected losses 1 (966) (702) 50 per cent of tax on expected losses 240 186 50 per cent of securitisation positions (118) (106) Other regulatory adjustments (42) (53)
(8,198) (7,736)
Core Tier 1 capital 35,339 31,833
Other Tier 1 capital
Preference shares included within shareholder's equity (refer to Table 4) 1,495 1,494 Preference shares included within 'Subordinated debt and other borrowings' (refer to Table 4) 1,205 1,194 Innovative Tier 1 securities (excluding non-controlling Tier 1 capital) (refer to Table 5) 2,553 2,506 Non-controlling Tier 1 capital (refer to Table 5) 320 320
5,573 5,514 Deductions
50 per cent of tax on expected losses 240 186 50 per cent of material holdings (552) (521)
(312) (335)
Total Tier 1 capital 40,600 37,012 1 Excess of expected losses in respect of advanced IRB portfolios are shown gross of tax benefits.

Standard Chartered PLC
Pillar 3 Disclosures
9
2.1. Basel II Capital structure continuedTable 2: Capital base continued
2012 2011
$million $million
Tier 2 capital:Qualifying subordinated liabilities:2
Subordinated liabilities and other borrowed funds as per balance sheet 18,799 16,717 Preference shares eligible for Tier 1 capital3 (1,205) (1,194) Innovative Tier 1 securities eligible for Tier 1 capital (2,553) (2,506) Adjustments relating to fair value hedging and non-eligible securities (2,052) (1,669)
12,989 11,348 Regulatory adjustments
Reserves arising on revaluation of available-for-sale equities 490 241 Portfolio impairment provision 248 239
738 480 Deductions
50 per cent excess of expected losses1 (966) (702) 50 per cent of material holdings (552) (521) 50 per cent of securitisation positions (118) (106)
(1,636) (1,329)
Total Tier 2 capital 12,091 10,499
Deductions from Tier 1 and Tier 2 capital (3) (4)
Total capital base 52,688 47,507 1 Excess of expected losses in respect of advanced IRB portfolios are shown gross of tax benefits.2 Consists of perpetual subordinated debt $1,314 million (2011: $1,489 million) and other eligible subordinated debt $11,675 million (2011:
$9,859 million). Lower Tier 2 instruments that mature within 5 years include amortisation.3 Represents $1,336 million (2011: $1,338 million) reported in note 32 of the financial statements in the 2012 Annual Report and Accounts,
after deduction of $131 million (2011: $144 million) of ineligible fair value gains.
Table 3: Risk weighted assets and capital ratios2012 2011
$million $million
Risk weighted assets Credit risk 246,650 220,394 Operational risk 30,761 28,762 Market risk 24,450 21,354
Total risk weighted assets 301,861 270,510
Capital ratiosCore Tier 1 capital 11.7% 11.8%Tier 1 capital 13.4% 13.7%
Total capital ratio 17.4% 17.6%
Further information on risk weighted assets including a movement table and analysis by business and geography can be found on page 120 in the Capital section of the 2012 Annual Report and Accounts.

Standard Chartered PLC
Pillar 3 Disclosures
10
2.1. Basel II Capital structure continuedCapital instruments issued by the GroupAll capital instruments included in the capital base meet the requirements of the rules and guidance in GENPRU. For regulatory purposes, capital is categorised into two main categories, or tiers, depending on the degree of permanence and loss absorbency exhibited. These are Tier 1 and Tier 2 capital which are described below where relevant.
Tier 1 capitalTier 1 capital comprises permanent share capital, profit and loss account and other eligible reserves, equity non-controlling interests, perpetual non-cumulative preference shares and innovative Tier 1 instruments, after the deduction of certain regulatory adjustments.
Permanent share capital is an item of capital issued by an organisation to an investor, which is fully paid-up and where the proceeds of issue are immediately and fully available. There is no obligation to pay a coupon or dividend to the shareholder.
The capital is available for unrestricted and immediate use to cover risks and losses, and enable the organisation to continue trading. It can only be redeemed on the winding-up of the organisation.
Profit and loss account and other eligible reserves are accumulated resources included in shareholders’ funds in an organisation’s balance sheet, with certain regulatory adjustments applied.
Equity non-controlling interests represent the equity stakes held by non-controlling shareholders in the Group’s undertakings.
Perpetual non-cumulative preference shares are permanent holdings, for which there is no obligation to pay a dividend, and the dividend payment is not cumulative. Such shares do not generally carry voting rights, but rank higher than ordinary shares for dividend payments and in the event of a winding-up or other return of capital. The following table sets out details of the preference shares in issue and their primary terms:
Table 4 : Capital instruments - Preference shares
Description Terms2012
$million
2011
$million
Hybrid Tier 1 capital with no incentive to redeem 1
£100 million 8.250 per cent Preference shares
Perpetual Non-cumulative Irredeemable 3 146 143
£100 million 7.375 per cent Preference shares
Perpetual Non-cumulative Irredeemable 3 145 137
$750 million 7.014 per cent Preference shares
Perpetual Non-cumulative Redeemable (callable Jul 2037, re-set to 3 month LIBOR plus 1.46 per cent) 2
748 747
$750 million 6.409 per cent Preference shares
Perpetual Non-cumulative Redeemable (callable Jan 2017, re-set to 3 month LIBOR plus 1.51 per cent) 2
747 747
$925 million 8.125 per cent Preference shares
Perpetual Non-cumulative Redeemable (callable Nov 2013) 3 914 914
2,700 2,688
1 Treated as Tier 1 capital under GENPRU TP8A. GENPRU TP8A relates to the eligibility of hybrid capital instruments for inclusion in Innovative Tier 1 Capital.
2 These preference shares are treated as equity from an accounting perspective, and included in ‘other Tier 1 Capital’ on page 8.3 These preference shares are treated as subordinated debt from an accounting perspective, and included in ‘subordinated debt and other
borrowings’ on page 8.
Innovative Tier 1 securities are deeply subordinated debt instruments which despite their legal form, have loss absorbency qualities and can therefore be included as Tier 1 capital. The following table sets out the Innovative Tier 1 securities in issue and their primary terms:
Table 5 : Capital instruments - Innovative Tier 1 securities
Description Terms2012
$million
2011
$million
Hybrid Tier 1 capital with incentive to redeem 1
£600 million 8.103 per cent Preferred securities
Perpetual Cumulative Redeemable (callable May 2016 and annually thereafter, step-up in May 2016 to 5 year UK gilts plus 4.275 per cent) 2
1,059 1,017
$300 million 7.267 per cent Hybrid tier 1 securities
Non-perpetual Non-cumulative Redeemable (callable Mar 2014, maturity Mar 2034, extendable for 30 year periods, 7.267 per cent to Mar 2014, step-up in Mar 2014 to 3 month LIBOR plus 4.29 per cent) 2
320 320
$1,500 million 9.5 per cent Preferred Securities
Perpetual Cumulative Redeemable, (callable Dec 2014, step-up in Dec 2014 to 5 year Treasuries plus 6.78 per cent) 2
1,494 1,489
2,873 2,826
1 Treated as Tier 1 capital under GENPRU TP8A. GENPRU TP8A relates to the eligibility of hybrid capital instruments for inclusion in Innovative Tier 1 Capital.
2 These securities are treated as non-controlling interests for accounting purposes and are included in ‘other Tier 1 Capital’ on page 8.
Standard Chartered PLC
Pillar 3 Disclosures
11
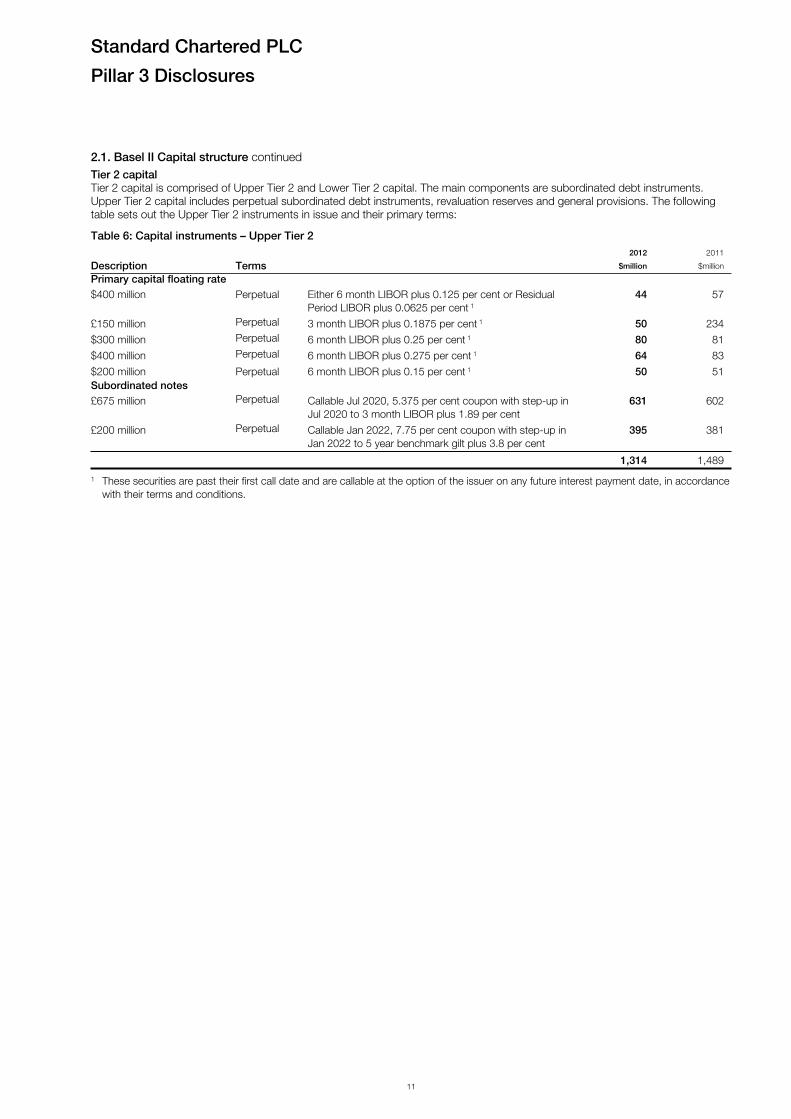
2.1. Basel II Capital structure continued Tier 2 capitalTier 2 capital is comprised of Upper Tier 2 and Lower Tier 2 capital. The main components are subordinated debt instruments. Upper Tier 2 capital includes perpetual subordinated debt instruments, revaluation reserves and general provisions. The following table sets out the Upper Tier 2 instruments in issue and their primary terms:
Table 6: Capital instruments – Upper Tier 2
Description Terms2012
$million
2011
$million
Primary capital floating rate$400 million Perpetual Either 6 month LIBOR plus 0.125 per cent or Residual
Period LIBOR plus 0.0625 per cent 1
44 57
£150 million Perpetual 3 month LIBOR plus 0.1875 per cent 1 50 234
$300 million Perpetual 6 month LIBOR plus 0.25 per cent 1 80 81
$400 million Perpetual 6 month LIBOR plus 0.275 per cent 1 64 83
$200 million Perpetual 6 month LIBOR plus 0.15 per cent 1 50 51Subordinated notes£675 million Perpetual Callable Jul 2020, 5.375 per cent coupon with step-up in
Jul 2020 to 3 month LIBOR plus 1.89 per cent631 602
£200 million Perpetual Callable Jan 2022, 7.75 per cent coupon with step-up in Jan 2022 to 5 year benchmark gilt plus 3.8 per cent
395 381
1,314 1,489
1 These securities are past their first call date and are callable at the option of the issuer on any future interest payment date, in accordance with their terms and conditions.

Standard Chartered PLC
Pillar 3 Disclosures
12
2.1. Basel II Capital structure continuedLower Tier 2 capitalLower Tier 2 capital consists of dated capital instruments i.e. of a fixed term, which are normally of medium to long-term maturity with an original maturity of at least five years. For regulatory purposes, it is a requirement that these instruments be amortised on a straight-line basis in their final five years of maturity. The following table sets out the Lower Tier 2 instruments in issue net of amortisation and their primary terms:
Table 7: Capital instruments - Lower Tier 2 subordinated notes
Description Terms2012
$million2011
$million
£300 million 6 per cent Maturing Jan 2018, callable Jan 2013, step-up in Jan 2013 to 3 month LIBOR plus 0.79 per cent
486 465
£700 million 7.75 per cent Maturing Apr 2018 1,133 1,085€750 million 3.625 per cent Maturing Feb 2017, callable Feb 2012, step-up in Feb 2012
to 3 month EURIBOR plus 0.87 per cent1- 974
€675 million Floating rate Maturing Mar 2018, callable Mar 2013, coupon 3 month EURIBOR plus 0.30 per cent, step-up in Mar 2013 to 3 month LIBOR plus 0.80 per cent
890 876
€1,100 million 5.875 per cent Maturing Sep 2017 1,351 1,426€750 million 3.63 per cent Maturing Nov 2022 980 -$700 million 8 per cent Maturing May 2031 426 426$100 million Floating rate Maturing Mar 2018, callable Mar 2013, coupon 3 month
LIBOR plus 0.30 per cent, step-up in Mar 2013 to 3 month LIBOR plus 0.80 per cent
100 100
$1,000 million 6.4 per cent Maturing Sep 2017 930 996$300 million Floating rate Maturing Apr 2017, callable Apr 2012, coupon 3 month
LIBOR plus 0.25 per cent, step-up in Apr 2012 to 3 month LIBOR plus 0.75 per cent2
- 300
$22 million 9.75 per cent Maturing Jun 2021, callable Jun 2016, step-up in Jun 2016 to 6 month LIBOR plus 6.6035 per cent
22 25
$750 million 5.875 per cent Maturing Jun 2020 745 745$1,000 million 5.7 per cent Maturing Jan 2022 995 -$1,250 million 4.0 per cent Maturing Jul 2022, callable Jul 2017 1,244 -BWP 75 million Floating rate Maturing Nov 2017, 91 day BOBC plus 0.40 per cent, step-
up in Nov 2012 to 91 day BOBC plus 0.90 per cent3 - 10
IDR 1,750 billion 11 per cent Maturing Jun 2018 76 82JPY 10,000 million 3.35 per cent Maturing Apr 2023, callable Apr 2018, step-up in Apr 2018
to 4.35 per cent115 130
KRW 90 billion 6.05 per cent Maturing Mar 2018 84 78KRW 260 billion 6.08 per cent Maturing Apr 2018, callable Apr 2013 243 225KRW 300 billion 7.05 per cent Maturing Apr 2019, callable Apr 2014, step-up in Apr 2014
to 7.55 per cent280 260
KRW 270 billion 4.67 per cent Maturing Dec 2021, callable Dec 2016 252 234MYR 500 million 4.28 per cent Maturing Nov 2017, callable Nov 2012, step-up in Nov 2012
to 3 month KLIBOR plus 0.69 per cent4- 155
SGD 450 million 5.25 per cent Maturing Apr 2023, callable Apr 2018, step-up in Apr 2018 to 6 month SGDSOR plus 3.1025 per cent
367 346
SGD 750 million 4.15 per cent Maturing Oct 2021,callable Oct 2016, re-set in Oct 2016 to 5 year SGDSOR plus 2.975 per cent
612 591
TWD 10 billion 2.9 per cent Maturing Oct 2019, callable Oct 2014, step-up in Oct 2014 to 3.4 per cent
344 330
11,675 9,859
1 In February 2012, Standard Chartered Bank exercised its right to redeem these securities in full.2 In April 2012, Standard Chartered Bank (Hong Kong) Limited exercised its right to call these securities in full.3 In November 2012, Standard Chartered Bank Botswana Limited gave notice of its intention to exercise its right to call these securities in
full. The securities were redeemed in full in January 2013.4 In November 2012, Standard Chartered Bank Malaysia Berhad exercised its right to call these securities in full.

Standard Chartered PLC
Pillar 3 Disclosures
13
2.1. Basel II Capital structure continuedRegulatory deductionsThe FSA requires deductions and prudential filters to be applied in calculating capital for regulatory purposes. The following items are deducted from Core Tier 1 capital:
Goodwill, which is the accounting adjustment recognised in the preparation of a group’s consolidated accounts arising on an acquisition; and
Intangible assets such as software licences.
The following are deducted from Core Tier 1 and Tier 2 capital in equal proportions:
The excess of expected loss over related provisions; and
The retained portion of the securitisation asset pool which has been assigned a risk weighting of 1250 per cent.
Material holdings (being investments in excess of 10 per cent of the share capital of a credit or financial institution) are deducted from Tier 1 and Tier 2 capital in equal proportions.
Lending of a capital nature to a connected party or guarantees provided to such a party are deducted from the total of Tier 1 and Tier 2 capital.
Capital resources of significant subsidiariesFor local capital adequacy purposes, a range of approaches are applied in accordance with the regulatory requirements in force in each jurisdiction. Wherever possible, the approaches adopted at the Group level are applied locally.
The capital resources of the Group’s more significant subsidiaries are presented below. These subsidiaries are Standard Chartered Bank (a UK incorporated banking entity including overseas branches, and certain subsidiaries which are permitted to be consolidated for capital adequacy purposes), Standard Chartered Bank (Hong Kong) Limited and Standard Chartered Bank Korea Limited. The capital resources of these subsidiaries are calculated in accordance with the regulatory requirements applicable in the countries in which they are incorporated, and therefore cannot be aggregated, but are presented to align with the Group format.
Table 8: Capital resources of significant subsidiaries2012 2011
Standard Chartered
Bank
Standard Chartered
Bank (HK) Ltd
Standard Chartered
Bank Korea Ltd
Standard Chartered
Bank
Standard Chartered
Bank (HK) Ltd
Standard Chartered
Bank Korea Ltd
$million $million $million $million $million $million
Local Regulator FSA HKMA FSS FSA HKMA FSS
Core Tier 1 capitalCalled up ordinary share capital 12,054 12 1,826 12,054 12 1,139 Eligible reserves1 11,352 4,970 2,197 10,088 4,281 2,316 Non-controlling interests - 3 - - 7 - 50 per cent excess of expected losses (561) - - (408) - - 50 per cent of securitisation positions (116) - - (90) - - Goodwill and other intangible assets (1,702) (198) (52) (1,615) (186) (39)Other regulatory adjustments (2) (23) (104) (7) (37) (100)
Total Core Tier 1 capital 21,025 4,764 3,867 20,022 4,077 3,316
Innovative Tier 1 securities 2,553 - 326 2,507 - 300 Preference shares 2,414 - - 2,415 - - 50 per cent of tax on expected losses1 110 - - 113 - - 50 per cent of material holdings (6,647) (356) - (7,113) (381) -
Total Tier 1 capital 19,455 4,408 4,193 17,944 3,696 3,616
Tier 2 capitalEligible revaluation reserves 125 3 192 85 - 6 Regulatory Reserve - 45 19 - 42 100 Portfolio impairment provision (applicable to Standardised portfolios) 66 21 110 66 20 78 Excess provision over EL - 194 97 - 174 - 50 per cent excess of expected losses (561) - - (408) - - Qualifying subordinated liabilities: Perpetual subordinated debt 3,114 - - 3,289 - 258 Other eligible subordinated debt 11,919 1,454 859 8,123 1,686 798 Amortisation of qualifying subordinated liabilities - - - - - - 50 per cent of material holdings (6,648) (356) - (7,113) (381) - 50 per cent of securitisation positions (116) - - (90) - - Other regulatory deductions - - - - (21) -
Total Tier 2 capital 7,899 1,361 1,277 3,952 1,520 1,240
Deductions from Tier 1 and Tier 2 capital2 (2,298) (26) - (2,268) (26) -
Total capital base 25,056 5,743 5,470 19,628 5,190 4,856 1 The tax benefit on excess expected losses is included 50 per cent in ‘Eligible reserves’ and ‘50 per cent in tax on excess expected losses’.2 Total deductions from Tier 1 and Tier 2 for Standard Chartered Bank primarily relate to lending of a capital nature.

Standard Chartered PLC
Pillar 3 Disclosures
14
2.2. Basel III Capital structureThere remains significant uncertainty surrounding both the final rules and definitions in CRD IV and the implementation dates and timing of transitional periods in Europe. Consequently, the CRD IV transitional capital (own funds) position presented in this disclosure could lack precision and change significantly following the final rules and definitions being published. The amounts subject to transitional arrangements do not take account of management actions during the period, such as the accretion of profits and the issuance of eligible regulatory capital. The CRD IV position presented here does not constitute either the likely outcome or a capital forecast.
In response to a greater demand for information on the impact of Basel III recommendations, and ahead of the implementation in Europe of these proposals as part of the package of reforms commonly referred to as CRD IV, comprising the current proposals for a Capital Requirements Regulation and Capital Requirements Directive, the FSA asked banks to prepare a capital reconciliation as at 31 December 2012, taking into account the effects of the proposed CRD IV transitional arrangements as if 31 December 2012 was the start of the transitional period, which for the purposes of this disclosure is expected to run from 1 January 2013 to 1 January 2019. The period during which we amortise grandfathered capital instruments is expected to end by 1 January 2022. In preparing these disclosures we have assumed that the Basel III proposals will be applied by the FSA and that implementation will not be accelerated beyond that permitted by the draft CRD IV proposals.
We present here a reconciliation of the Group’s Core Tier 1 capital, as reported in Table 2 on pages 8 and 9, to the transitional and end point total capital positions under CRD IV. The disclosure shows the effects of transitional arrangements, being those amounts that will increase or decrease items of capital, and regulatory adjustments as the Group moves through the transitional period.
Although the CRD IV rules have not been finalised, we expect our Common Equity Tier 1 (CET1) ratio would be around 100 bps lower than our reported Basel II Core Tier 1 ratio on a pro forma basis. This movement is driven by increased RWAs, in particular the introduction of capital requirements for Credit Valuation Adjustments (CVA) and increased regulatory deductions from CET1. The actual outcome will depend on how the emerging rules are implemented, what the future shape of the Group is and the extent to which the Group’s regulators give recognition to the Group’s implementation of internal models for the calculation of RWA.
Basis of preparationThe own funds disclosure presented in the 2012 Pillar 3 disclosures in Table 9 on pages 16 and 17 is based on the EBA consultation, in June 2012, on the Disclosure for Own Funds by institutions (EBA/CP/2012/04). The Group has aligned its disclosure with the proposed transitional template included in that consultation, where appropriate, omitting items that are either not relevant or immaterial to the Group and in line with the guidance issued by the FSA. The basis of the disclosure is the July 2011 CRD IV text, with the exception of the calculation of eligible non-controlling interest, which has been based on the Basel III text published in December 2010 and updated in June 2011.
New regulatory adjustments to CET1 are phased in from January 2014, so do not impact the transitional capital position at 31 December 2012. We have considered the phasing out of grandfathered capital instruments, being those that are not expected to comply fully with the final CRD IV rules, and calculated a declining ceiling to the recognition of these instruments over time. New regulatory adjustments and deductions from CET1 include deferred tax assets that depend on the future profitability of the Group and do not arise from temporary differences and the requirement to leave in reserves any gains and losses associated with assets in the available for sale category. The effect of these, and all other relevant adjustments and deductions, is shown in the ‘amounts subject to transitional arrangements’ column of the own funds disclosure.
Under Basel II, banks are permitted to recognise in Core Tier 1 capital some of the non-controlling interest on the balance sheet, where that non-controlling interest is in common shares. Under Basel III proposals, banks are required to calculate how much surplus capital in the less than wholly-owned banking subsidiaries is available for recognition in the consolidated capital resources of the Group. In accordance with FSA guidance, we have used the BCBS Basel III text, as at June 2011, as the basis for this calculation and the impact of this change is shown in amounts subject to transitional arrangements.
The definition of Core Tier 1, as reported in the 2012 Annual Report and Accounts, requires the deduction in full of goodwill and other intangibles. However, for the purposes of the transitional CRD IV capital position, goodwill and other intangibles are deducted from Additional Tier 1 (AT1), and any excess amount is deducted from CET1 where there is insufficient AT1 capital available. At the end of the transitional period, we expect goodwill and intangible assets to be deducted in full from CET1.
Material holdings, as presented in the Capital section of the 2012 Annual Report and Accounts, fall below the thresholds prescribed in the July 2011 CRD IV text, which requires the deduction of significant investments in undertakings in the financial sector where they exceed 10 per cent of the Group’s CRD IV capital base, before any adjustments for significant investments and deferred tax assets that depend on the future profitability of the bank and do not arise from temporary differences. Amounts falling below the thresholds are risk-weighted at 250 per cent.
The CRD IV proposed rules give banks a choice as to whether to deduct from CET1 or risk weight at 1250 per cent any securitisation positions that attract 1250 per cent risk-weight and free deliveries that have remained unsettled for more than 5 business days after the contractual settlement date. For the purposes of the own funds disclosure, the Group deducts these positions, in line with the current approach for the Basel II capital position, as shown in Table 9 on pages 16 and 17 of this document.
Own funds disclosure The basis for future disclosure of CET1, AT1 and Tier 2 capital within Pillar 3 is not yet clear since CRD IV has not yet been finalised. The following comments refer to Table 9 on pages 16 and 17.

Standard Chartered PLC
Pillar 3 Disclosures
15
2.2. Basel III Capital structure continuedOn a fully phased basis, CET1 is $33,752 million, AT1 is $0 million, Total Tier 1 is $33,752 million, Tier 2 is $6,100 million and Total Capital is $39,852 million. These figures are derived from applying the transitional impacts shown in the transitional column and the immediate CRD IV impacts shown in the first column of Table 10.
The CRD IV outcome compares to Basel II Core Tier 1 of $35,339 million, Total Tier 1 of $40,600 million, Tier 2 of $12,091 million and Total Capital of $52,688 million as shown in Table 2 on pages 8 and 9.
Common Equity Tier 1• The 2012 column shows the CET1 position of $39,393
million including the immediate pro forma impact of CRD IV with a further deduction of $5,641 million shown in the transition column.
• Certain items previously deducted from Basel II CT1 have been added back in the 2012 column in the computation of CET1.
• There are a number of deductions that are taken from AT1 capital, to the extent there is sufficient AT1 capacity that will transfer to CET1 over the transition period. As there are more deductions than there is AT1 capacity at the outset, a portion of these are taken from AT1 and the remainder is deducted from CET1. At the end of the transitional period, we expect these to be deducted in full from CET1.
Additional Tier 1 • The 2012 column shows the AT1 net position of zero with no
net amounts subject to transition. This is the result of the interplay between the extent of recognition afforded to the AT1 securities which is exactly offset by the amount of goodwill and other intangibles deducted from AT1 (with the remainder deducted from CET1).
• As guided by the FSA, the initial extent of AT1 recognition is derived from the CRD IV transitional rules which are not yet finalised. This means that 10 per cent of the AT1 capital instruments ($557 million) has not been recognised immediately, since they all have terms that constitute incentives to redeem and were issued before July 2011.
• The remainder of the current AT1 capital instruments ($5,573 million) is shown in the transitional column implying that all the AT1 capital instruments will be afforded zero recognition at some point in the future.
Tier 2• The 2012 column shows the CRD IV Tier 2 position of
$11,605 million including the immediate impact of CRD IV with a further deduction of $5,505 million shown in the transitional column.
• The 2012 column shows $7,347 million of Tier 2 instruments as fully qualifying under the proposed CRD IV on the grounds that they do not contain incentives to redeem, and are issued by either Standard Chartered Bank or Standard Chartered PLC. The Group considers it unlikely that these instruments will be impacted by the proposed CRD IV.
• The transitional column implies the ultimate de-recognition of $7,061 million of Tier 2 instruments, although it is believed unlikely that all these instruments will be afforded zero Tier 2 capital credit before they are called or mature.
• The other Tier 2 amounts in the transitional column relate to regulatory adjustments made to Tier 2 capital that will be applied to CET1 by the end of the transitional period, including the excess of expected losses, securitisation positions and revaluation reserves on AFS assets (equities).

Standard Chartered PLC
Pillar 3 Disclosures
16
2.2. Basel III Capital structure continued
Table 9: CRD IV transitional capital base (own funds)
2012
Amounts subject to
transitional arrangements End point
$million $million $million
Core Tier 1 Capital 35,339 - 35,339 Add back regulatory adjustments 9,221 - 9,221
Goodwill and other intangibles assets 7,312 - 7,312 Unrealised gains on available-for-sale debt securities 97 - 97 Unrealised gains on available-for-sale equity securities 490 - 490 Cash flow hedge reserve 81 - 81 Non-controlling interests in Other Tier 1 320 - 320 Other regulatory adjustments 77 - 77 50 per cent excess of expected losses 966 - 966 50 per cent of tax on expected losses (240) - (240) 50 per cent of securitisation positions 118 - 118
Common Equity Tier 1 capital before regulatory adjustments 44,560 - 44,560
Eligible capital instruments 1,207 - 1,207 Share premium 3,981 - 3,981 Retained earnings 26,561 - 26,561 Accumulated other comprehensive income 12,811 - 12,811
Regulatory Adjustments (4,577) (5,992) (10,569)
Goodwill and other intangible assets, net of any related deferred tax liability1 (3,922) (3,461) (7,383) Additional value adjustments2 (210) - (210) Cash flow hedge reserve (81) - (81) Defined benefit pension assets (7) - (7) Excess of expected losses3 (1,932) (1,932) Ineligible non-controlling interests4 (320) (269) (589) Deferred tax assets that depend on future profitability and do not relate to timing differences5 (37) (330) (367)
Exposure amounts of the following items, which qualify for 1250% risk-weight (3) (236) (239)
Securitisation positions - (236) (236) Free deliveries (3) - (3)
Regulatory adjustments applied in respect of Pre-CRD IV requirements (587) 587 -
Unrealised gains on available-for-sale debt securities6 (97) 97 - Unrealised gains on available-for-sale equity securities6 (490) 490 -
Common Equity Tier 1 capital 39,393 (5,641) 33,752
Additional Tier 1 Capital instruments 5,573 (5,573) -
of which: classified as equity under applicable accounting standards 1,495 (1,495) - of which: classified as debt under applicable accounting standards 4,078 (4,078) -
Qualifying capital instruments subject to phase out from Additional Tier 1 5,573 (5,573) -
of which: Additional Tier 1 capital instruments issued by subsidiaries and held by third parties 2,873 (2,873) -
Amount excluded from Additional Tier 1 due to cap7 (557) 557 -
Regulatory Adjustments (5,016) 5,016 -
Intangibles assets net of any related deferred tax liability (3,461) 3,461 - 50 per cent excess of expected losses (966) 966 - Significant direct and indirect holdings of capital instruments of relevant entities8 (471) 471 - Securitisation positions (118) 118 -
Total Tier 1 capital 39,393 (5,641) 33,752

Standard Chartered PLC
Pillar 3 Disclosures
17
2.2. Basel III Capital structure continuedTable 9: CRD IV transitional capital base (own funds) continued
2012
Amounts subject to
transitional arrangements End point
$million $million $million
Tier 2 capital instruments and provisions
Capital instruments and related share premium accounts 12,989 (7,061) 5,928
Eligible capital instruments and related premium9 7,347 (1,419) 5,928 Instruments issued by subsidiaries and held by third parties subject to phase out from Tier 2 5,642 (5,642) -
Amount excluded from Tier 2 due to cap10 (564) 564 -
Portfolio impairment provision included in Tier 2 in respect of standardised exposures11 248 - 248
Tier 2 capital before regulatory adjustments 12,673 (6,497) 6,176
Regulatory Adjustments (1,068) 992 (76)
Direct and indirect holdings of own Tier 2 instruments and subordinated loans (3) - (3) Significant direct and indirect holdings of capital instruments of relevant entities (471) 398 (73) 50 per cent excess of expected losses (966) 966 - Securitisation positions (118) 118 - Revaluation reserve 490 (490) -
Tier 2 capital after regulatory adjustments 11,605 (5,505) 6,100
Total capital 50,998 (11,146) 39,852 1 Goodwill and other intangibles as shown in Table 1 on page 7 are net of any associated deferred tax liability that would be extinguished if
the assets become impaired or derecognised under the relevant accounting standards. For 31 December 2012 the amount of associated deferred tax liability was $92 million. The goodwill also includes $163 million of goodwill embedded within the Group’s investments in the capital of other banks and financial institutions.
2 The estimated Prudent Valuation Adjustment (PVA) and Debit Valuation Adjustment (DVA) for 31 December 2012 are $115 million and $25 million respectively, which we recognise in full in the first year of the transitional period.
3 Banks are required to deduct from capital the excess of expected losses over accounting provisions. Under CRD IV, banks are not permitted to adjust this deduction for any tax benefits that would arise should accounting provisions increase to the level of expected losses.
4 The amount of non-controlling interest eligible for inclusion in CET1 is based on the level of surplus capital in the subsidiary giving rise to the minority interest. The calculation of this adjustment is based on the methodology proposed in BCBS Basel III text published in December 2010 and updated in June 2011.
5 Banks are required to deduct in full from CET1, the amount of deferred tax assets that are dependent on the future profitability of the Group to be realised and where such assets do not relate to timing differences. The FSA requires banks to deduct 10 per cent of such assets in the first year of the transitional period.
6 Under CRD IV, unrealised gains or losses related to available-for-sale assets and debt securities are to remain in CET1.7 As per the July 2011 CRD IV text, banks are required to 'phase out' over a 10 year period those Additional Tier 1 capital instruments that
do not comply fully with CRD IV requirements (Article 49) at the 1 January 2013. As at 31 December 2012, the cap on Additional Tier 1 capital instruments subject to phase out arrangements is $5,016 million. The Group deducts from Additional Tier 1 capital any amount above the cap.
8 Significant is defined as a holding of at least 10 per cent of the issued share capital of relevant institutions, being financial institutions and insurance undertakings. Under Basel II, these are described as material holdings and are deducted from Tier 1 and Tier 2 capital. However, under CRD IV, the deduction is made using a corresponding deduction approach. The amount deducted excludes any goodwill embedded within the value of the investment.
9 The eligible Tier 2 capital includes instruments issued by Standard Chartered Bank, $7,061 million of subordinated notes, which the Group expects to be subject to a deduction of $1,419 million in the future under Articles 82 and 83 of the July 2011 CRD IV text.
10 As per the July 2011 CRD IV text, banks are required to 'phase out' over a 10 year period those Tier 2 capital instruments that do not comply fully with CRD IV requirements (Article 60) at the 1 January 2013. As at 31 December 2012, the cap on Tier 2 capital instruments subject to phase out arrangements is $5,078 million. The Group deducts from Tier 2 capital any amount above the cap.
11 Banks are permitted to include in Tier 2 capital, portfolio impairment provisions up to a maximum of 1.25 per cent of credit risk-weighted assets under the standardised approach, as presented in Table 12 on page 22. As at 31 December 2012, the cap was $680 million.

Standard Chartered PLC
Pillar 3 Disclosures
18
2.2. Basel III Capital structure continuedLeverage ratioThe leverage ratio is one of the proposals included in the package of reforms developed by the BCBS to address the lessons of the global financial crisis. The BCBS’s intention is for the leverage ratio to constrain the build-up of leverage in the banking sector, and supplement risk-based requirements with a simple, non-risk based backstop measure of leverage.
The proposed leverage ratio compares Tier 1 capital to total exposures, which includes those exposures held off balance sheet as adjusted by stipulated credit conversion factors. The BCBS will monitor the leverage ratio during a parallel run period from 1 January 2013 to 1 January 2017. The BCBS’s current intention is to require a minimum leverage ratio of 3 per cent. This parallel run period will be used to assess whether the proposed leverage ratio remains suitable through the credit cycle and for different business models, and to develop appropriate tracking and disclosure templates. The international timeline set out by the BCBS for publication of the leverage ratio is from 1 January 2015.
The UK FPC recommended in November 2012 that the FSA encourage UK banks to disclose a Basel III leverage ratio from the beginning of 2013, two years in advance of the BCBS’s recommended start date. This is despite a report from the EDTF, which concluded that banks should not disclose the Basel III leverage and liquidity ratios until the rules and requirements are final and in force.
The Group is committed to a transparent and open disclosure. However, in the case of the leverage ratio that we are being required to disclose, this is difficult to achieve given the evolving nature of this new requirement, the significant uncertainty that its early disclosure presents, the potential for changes in definitions and calibration and its disregard for the impact of any earnings accretion and other management actions over the transitional period. As such, whilst we are required to disclose a leverage ratio by the FPC, we would recommend that this published leverage ratio be treated with a high degree of caution.
As the leverage ratio is intended by the BCBS to be a simple and backstop tool, we would recommend that it be used only in conjunction with established risk sensitive methodologies.
Table 10 sets out the Group’s leverage ratio on the two bases defined and mandated by the FPC and the FSA. The exposure measure is calculated on the basis of accounting values for assets and adjusted for off-balance sheet transactions. The Tier 1 capital (end-point) basis represents pro forma Tier 1 based on full CRD IV implementation. It gives no credit to any of the Group’s Additional Tier 1 instruments as these are issued under current rules and will be phased out over the CRD IV transitional phase to 2022 unless they are called at an earlier date. Due to the continuing uncertainty as to the end state CRD IV rules on capital eligibility we (like all European Union banks) have not yet been able to issue CRD IV compliant Additional Tier 1 instruments. The Tier 1 capital (transitional) basis also represents pro forma Tier 1 based on full CRD IV implementation save only that full recognition is given to existing AT1 instruments that will ultimately be phased out during the transitional period.
The Group’s leverage ratios on both an end point (of 4.5 per cent) and transitional basis (of 5.3 per cent) are above the BCBS’s currently proposed minimum leverage ratio of 3 per cent.
When evaluating the Group’s leverage ratio, we recommend that the following points be considered:
• The leverage ratio is based on proposals that are neither finalised nor yet in force. Such uncertainty presents challenges to the calculation of, and the ability to draw meaningful conclusions from, the published ratios. It could also require more complex reconciliations between disclosure frameworks.
• The leverage ratio uses a definition of Tier 1 capital that will exist at 1 January 2022, after completion of the transition to CRD IV. This is based on definitions of capital that are not yet finalised and so give rise to a measure of capital and leverage that is potentially inconsistent with the regulatory end state.
• The leverage ratio does not reflect the impact of equity generation and business growth throughout the relevant period, nor any other potential balance sheet management actions, such as capital issuance.
• The FPC and the FSA have confirmed that disclosure of the leverage ratio by UK banks from early 2013 will not be accompanied by the implementation of minimum standards, although these are expected to be implemented after the relevant definitions and calibration of the leverage ratio have been finalised.
Table 10: Leverage ratio2012
$million
Tier 1 capital (end point)1 33,752 Tier 1 capital (transitional)2 39,325 Exposure measure 742,534 Leverage ratio (end point) 4.5%Leverage ratio (transitional) 5.3%
Total on balance sheet assets 636,518
Derivatives financial instruments 49,496 Securities financing transactions 10,660 All other on balance sheet items 576,362
Off balance sheet transactions3 120,623
Unconditionally cancellable 11,014 Other 109,609
Recognition of regulatory netting benefits4 (5,731)Deductions from CRD IV Tier 1 capital5 (8,876)
Total exposure measure for leverage ratio 742,534 1 This represents Tier 1 capital based on the CRD IV rules as at
January 2022 at the end of the transitional period.2 This represents the sum of Tier 1 capital (end point) and the full
amount of Additional Tier 1 instruments that are expected to phase out during the transitional period ($5,573 million)
3 Off balance sheet transactions reflect 10 per cent of unconditionally cancellable commitments and 100 per cent of all other off balance sheet commitments, as reported in note 42 to the financial statements of the 2012 Annual Report and Accounts.
4 Basel III rules allow the recognition of Basel II netting benefits for derivatives but require that the Group includes an add-on for potential future exposure (PFE) on derivative transactions.
5 Deductions from Tier 1 capital have been applied as presented within the end point column in Table 9 on pages 16 and 17 ($10,569 million and $239 million), excluding that relating to excess of expected losses ($1,932 million).

Standard Chartered PLC
Pillar 3 Disclosures
19
3. Credit riskCredit risk is the potential for loss due to the failure of a counterparty to meet its obligations to pay the Group in accordance with agreed terms. Credit exposures may arise from both the banking and trading books.
Our approach to credit risk can be found on pages 65 to 68 of the Risk review in the 2012 Annual Report and Accounts.
3.1. Internal Ratings Based Approach to credit riskThe Group uses the IRB approaches to manage credit risk for the majority of its portfolios. This allows the Group to use its own internal estimates of Probability of Default (PD), Loss Given Default (LGD), Exposure at Default (EAD) and Credit Conversion Factor (CCF) to determine an asset risk weighting. The IRB models cover 80 per cent of the Group’s credit risk RWA (2011: 79 per cent).
PD is the likelihood that an obligor will default on an obligation within 12 months. All banks utilising an IRB approach must assign an internal PD to all borrowers in each borrower grade. EAD is the expected amount of exposure to a particular obligor at the point of default. CCF is an internally modelled parameter based on historical experience to determine the amount that is expected to be further drawn down from the undrawn portion of a facility. LGD is the percentage of EAD that a lender expects to lose in the event of obligor default, in economic downturn periods.
All assets under the IRB approach have sophisticated PD, LGD and EAD/CCF models developed to support the credit decision making process. RWA under the IRB approach is determined by regulatory specified formulae dependent on the Group’s estimates of PD, LGD, EAD and CCF. The development, use and governance of models under the IRB approach is covered in more detail in section 3.3 Internal Ratings Based models.
Regulation (BIPRU 4.2.30) allows IRB banks to elect to permanently exclude certain exposures from the IRB approach and use the Standardised Approach. These are known as permanent exemptions, and are required to be no greater than 15 per cent of the Group’s credit risk RWA.
The permanent exemptions for Consumer Banking include:
• Africa – all retail portfolios;
• Private Banking; and
• Portfolios where the size or nature makes application of the advanced approach inefficient.
For Wholesale Banking, permanent exemptions apply to:
• Private Equity;
• Development Organisations;
• Jordan and Lebanon;
• Purchased receivables.
The Group also applies the Standardised Approach to portfolios that are currently being transitioned to the IRB approach in accordance with the Group’s ‘IRB Roll Out Plan’. During 2012 the Group was given approval to use an IRB model for the Hong Kong SME portfolio. Direct comparability between current and prior year data for certain portfolios may not be possible during this transition period.
3.2. Standardised Approach to credit riskThe Standardised Approach is applied to portfolios that are classified as permanently exempt from the IRB approach, and those portfolios that are currently under transition to the IRB approach in accordance with the Group’s ‘IRB Roll Out Plan’.
The Standardised Approach to credit risk measures credit risk pursuant to fixed risk weights and is the least sophisticated of the capital calculation methodologies under Basel II. The risk weight applied under the Standardised Approach is given by the FSA and is based on the asset class to which the exposure is assigned.
For sovereigns, corporates and institutions, external ratings are used to assign risk weights. These external ratings must come from FSA approved rating agencies, known as External Credit Assessment Institutions (ECAI); which currently includes Moody’s, Standard & Poor’s and Fitch. The Group uses the ECAI ratings from these agencies in its day to day business, which are tracked and kept updated. Assessments provided by approved ECAI are mapped to credit quality steps as prescribed by the FSA.
The Group currently does not use assessments provided by export credit agencies for the purpose of evaluating RWA in the Standardised Approach.

Standard Chartered PLC
Pillar 3 Disclosures
20
3.3. Internal Ratings Based modelsModel governanceThe IRB models used by the Group calculate a PD, LGD and EAD, and the model performance data is contained in Table 11: Wholesale Banking model results.
Models are developed by analytics teams within the Consumer Banking and Wholesale Banking Risk functions. The model development process is conducted and documented in line with specific criteria setting out the minimum standards for model development. All IRB models are validated by a model validation team reporting to the Group Chief Credit Officer, thereby maintaining independence from the model build processes. Model validation findings are presented to the Group Model Assessment Committee (MAC) which in turn makes approval recommendations to the Consumer Banking and Wholesale Banking Risk Committees. These decision making bodies are comprised of divisional senior management whose role is to challenge model assumptions and performance and agree on appropriate model use for business decision making and regulatory capital calculations. The Group Risk Committee (GRC) and Board Risk Committee (BRC) periodically review overall model performance.
The model validation process involves a qualitative and quantitative assessment of the model, data, systems and governance. This would typically include an assessment of the:
• model assumptions;
• validity of the technical approach used;
• statistical and empirical measures of performance;
• appropriateness of intended model use;
• model application and infrastructure;
• data integrity and history;
• model response to changes in internal and external environment - the extent to which the model provides point in time or through the cycle measures of risk;
• model monitoring standards and triggers; and
• levels of conservatism applied.
Statistical testing is used to determine a model’s discriminatory power, predicted versus observed/realised performance and stability over time with pre-defined thresholds for passing such tests.
PD model developmentThe Group employs a variety of techniques to develop its PD models. In each case the appropriate approach is dictated by the availability and appropriateness of both internal and external data.
If there is a perceived weakness in the data, for example shorter histories or fewer instances of default, an appropriate amount of conservatism is applied to predicted default rates.
The general approaches fall into three categories:
Default History Based (‘Good-Bad’) – where a sufficient number of defaults are available, the Group deploys a variety of statistical methods to determine the likelihood of default on existing exposures. These methods afford very high discriminatory power by identifying counterparty exposure characteristics that have a significant predictive ability. The majority of the Group’s consumer and corporate exposures are rated under such an approach.
Shadow Rating Approach – if it is determined that the Group’s internal data does not provide a sufficient default history (for example, so called ‘low default portfolios’), then the Group develops models which are designed to be comparable to the ranking of issuer ratings assigned by established external credit assessment institutions, where those agencies have access to large databases of defaults over a long time period on a variety of credit obligations.
Constrained Expert Judgement – for certain types of exposure there is little or no internal default history, and no reliable external ratings. In such rare cases, the Group has quantitative frameworks to incorporate the expert opinions of the Group’s credit risk management personnel into the model development process.
LGD model developmentThe Group develops LGD models by assessing recoveries and the forced sale value of collateral together with the economic costs in securing these recoveries, and the timing in which such cash flows occur. All such cash flows are then measured at net present value using a suitable discount rate to derive a recovery rate. LGD is therefore the EAD less these estimated recoveries.
Recoveries are estimated based upon empirical evidence which has shown that factors such as customer segment, product and geography have predictive content.
All LGD models are conservatively calibrated to a ‘downturn’, with lower collateral values and recoveries on exposures, compared to those estimated over the long run.
EAD model developmentAn EAD model is developed for uncertain exposure products such as lines of credit, credit cards, overdrafts and other commitments. Based on the Group’s experience (and supplemented by external data), EAD models assess changes to limits and the likely draw-down of undrawn committed and uncommitted limits as an exposure approaches default. The factor generated by the model and applied to the undrawn limit is referred to as the CCF.
The Group has used conservative assumptions in assessing EAD, in keeping with the expected experience in an economic downturn.
Model useIn addition to supporting credit decisions, IRB models also support risk-based pricing methodologies and measures used to assess business performance such as Economic Capital, Economic Revenue and Economic Profit.
The use of models is governed by a suite of policies:
• the credit grading policy and procedure which defines the applicability of each model, details the procedure for use and sets the conditions and approval authority required to override model output; and
• the Group Model Risk Policy - IRB Models specifies that models are subject to regular monitoring and review with the underlying Group Model Standards for IRB Credit Risk Models specifying statistical thresholds and other triggers which determine when models need to be redeveloped.

Standard Chartered PLC
Pillar 3 Disclosures
21
3.3. Internal Ratings Based models continuedWholesale Banking model resultsWholesale Banking models have been developed from a data-set which runs to over a decade, including default and recovery experience from the 1997 Asian financial crisis. This data has been used to calibrate estimates of PD to the Group’s long run experience. Actual (‘point in time’) default rates will typically differ from this ‘through the cycle’ experience as economies move above or below cyclical norms.
Probability of DefaultIRB PD estimates are computed as of 1 January 2012 and are compared with default observations through 31 December 2012. The historical default experience for institutions, central governments or central banks is minimal, so the predicted PD for institutions reflects a particularly low number of defaults. For central governments or central banks, there were no defaults during 2012. The actual default rate among corporates and institutions exposures in 2012 remained below IRB model predictions as at the beginning of 2012, reflecting the impact of the Group’s prudent and proactive credit management during this challenging environment.
Loss Given DefaultThe calculation of realised versus predicted LGD is affected by the fact that it may take a number of years for the workout process to be completed. As such, an observed recovery value cannot be assigned to the majority of the 2012 defaults, making it therefore not meaningful to compute realised versus predicted outcomes in a manner similar to that for PD and EAD.
The predicted LGD is a downturn LGD based on the model outputs as of 1 January 2012. For the realised LGD, on the other hand, instead of restricting its computation to 2012 defaults only, we have used the long run average realisations from 1995 to 2012, including downturn periods. Therefore, the predicted LGD is not directly comparable to the realised LGD.
The predicted LGD estimate takes into account the impact of enhanced risk mitigation techniques (e.g. netting) and proactive Early Alert risk management actions. These have been more prevalent in recent years and are therefore not reflected in the long run average LGD to the same extent as they are in the predicted LGD.
The increased level of netting agreements achieved with institutions over recent years results in the predicted LGD for institutions being materially lower than the long run realised value. In determining realised LGD we apply a principle of including unresolved cases that had been in workout for a number of years, unless they are still in active litigation. Therefore, the 2012 realised LGD for institutions is inflated by the inclusion of a few defaults during the 2008 global financial crisis which are still under workout, but deemed resolved by the above stated principle.
The same effect, albeit to a lower degree, applies to corporates, where realised LGD largely reflects losses during the Asian financial crisis. Also recent trends and mitigation techniques put in place in recent years, which are taken into account in the predicted LGD, will not be fully reflected in the long run average LGD.
Exposure at DefaultEAD takes into consideration potential drawdown of commitment as a counterparty defaults by estimating the CCF of undrawn commitments. For assets which defaulted in 2012, the comparison of realised versus predicted EAD is summarised in the ratio of the EAD one year prior to default to the outstanding amount at time of default. The ratios for both corporates and institutions are larger than one, indicating that the predicted EAD is higher than the realised outstanding amount at default. This is explained by the regulatory guidance to assign conservatism to the CCF of certain exposure types, as well as by the impact of management action leading to a reduction in actual exposure prior to default.
Table 11: Wholesale Banking model results
Predicted PD Observed PD Predicted LGD Realised LGDPredicted/
Realised
% % % % EAD
IRB Exposure ClassCentral governments or central banks 0.16 - 28.16 N/A N/AInstitutions 0.21 0.14 18.39 56.27 1.1 Corporates 1.47 1.04 41.24 52.53 1.2
Consumer Banking model results The Group has a strong monitoring and governance process in place to identify and mitigate model performance issues. While the majority of Consumer Banking’s IRB models are conservative and over predict for PD, LGD and EAD, any under predicting portfolios are subject to a model adjustment and have a remediation plan. Based on model monitoring results in 2012, RWA from post model adjustments applied to under predicting portfolios increased from $0.8 billion in 2011 to $1.4 billion in 2012.
Due to the wide spread of countries and products within Consumer Banking, an aggregation of the predicted and observed values for the IRB models at asset class level are deemed not meaningful, while disclosures at country and product level are considered to be proprietary information.

Standard Chartered PLC
Pillar 3 Disclosures
22
3.4. Regulatory capital requirementsThe table below presents the minimum regulatory credit risk capital requirements, including counterparty credit risk, as at 31 December 2012, calculated as 8 per cent of RWA based on the approaches described above in sections 3.1 and 3.2. The regulatory credit risk capital requirement below of $19,731 million is substantially lower, even with the inclusion of market risk $1,956 million (Table 31) and operational risk $2,461 million (Table 34), than total capital resources of $52,688 million in Table 2.
Table 12: Regulatory capital requirements
2012 2011
Regulatory Capital
Requirement
Risk weighted
assetsEAD before the
effect of CRM
Regulatory Capital
Requirement
Risk weighted
assetsEAD before the
effect of CRM
Credit Risk Capital $million $million $million $million $million $million
IRB Exposure ClassCentral governments or central banks 1,383 17,282 128,587 917 11,462 107,446 Institutions 1,400 17,506 105,794 1,301 16,264 98,779 Corporates 8,731 109,143 166,920 7,919 98,986 158,646 Retail, of which 2,385 29,812 97,214 2,001 25,022 90,240
Secured by real estate collateral 643 8,033 62,654 620 7,752 60,674 Qualifying revolving retail 593 7,413 18,379 555 6,942 17,607 Retail SME 71 890 1,629 39 486 1,179 Other retail 1,078 13,476 14,552 787 9,842 10,780
Securitisation positions 290 3,627 26,057 248 3,105 20,827 Non-credit obligation assets 53 660 660 26 321 321
Total IRB 14,242 178,030 525,232 12,412 155,160 476,259
Standardised Exposure ClassCentral governments or central banks 47 587 1,664 87 1,089 1,625 Multilateral Development Banks - - 7,849 - - 4,910 Institutions 108 1,355 3,123 56 700 2,030 Corporates 1,017 12,715 20,980 985 12,318 19,443 Retail 1,064 13,300 19,277 906 11,329 16,555 Secured on real estate property 751 9,391 18,226 724 9,051 18,701 Past due items 103 1,288 1,211 107 1,337 1,203 Items belonging to regulatory high risk categories 63 782 573 40 498 342 Other items1 1,198 14,980 17,803 1,100 13,756 16,323
Total Standardised 4,351 54,398 90,706 4,005 50,078 81,132 Counterparty credit risk capital component (credit risk in the trading book) 1,138 14,222 56,447 1,213 15,156 54,284
Concentration risk capital component2 - - - - - -
Total 19,731 246,650 672,385 17,630 220,394 611,675 1 Other items include cash, equity holdings, fixed assets, prepayments and accrued income.2 The concentration risk capital component is the additional capital requirement to be held where exposures in the Trading Book to a
counterparty exceeds 25 per cent of capital resources.
The growth in credit risk capital requirements during 2012 was driven mainly by increased exposures to central governments or central banks, due to an increase in liquid balances, and to corporates, due to asset growth in Wholesale Banking, in particular within transaction banking and corporate finance in the Americas, UK and Europe region.
IRB other retail growth was mainly driven by an increase in personal loans in Korea, due in part to foreign currency translation differences. Overall, qualifying revolving retail exposure increased during 2012 due to growth in credit card balances in Hong Kong and Singapore.
The increase in standardised retail exposures results from asset growth in Hong Kong Private Banking and the SME portfolios in Malaysia, India and Indonesia.

Standard Chartered PLC
Pillar 3 Disclosures
23
3.4. Regulatory capital requirements continuedThe minimum credit risk capital requirements of the Group's significant subsidiaries are calculated in accordance with the regulatory requirements applicable in the countries in which they are incorporated, and against which we are required to hold capital. The regulatory requirements presented below have been aligned with the Group format.
Table 13: Regulatory capital requirements of significant subsidiaries
2012 2011
Standard Chartered
Bank
Standard Chartered
Bank (HK) Ltd
Standard Chartered
Bank Korea Ltd
Standard Chartered
Bank
Standard Chartered
Bank (HK) Ltd
Standard Chartered
Bank Korea Ltd
Credit Risk Capital $million $million $million $million $million $million
Local Regulator FSA HKMA FSS FSA HKMA FSS
IRB Exposure ClassCentral governments or central banks 590 37 - 378 21 - Institutions 1,364 288 - 1,258 253 - Corporates 5,548 1,438 598 4,958 1,357 538 Retail, of which 754 534 736 618 475 680
Secured by real estate collateral 322 106 162 305 102 157 Qualifying revolving retail 269 135 52 179 129 45 Retail SME - 17 - 13 - Other retail 163 276 522 134 231 478
Securitisation positions 173 16 12 154 8 13 Non-credit obligation assets - - - 17 - - Other1 - 286 - - 216 -
Total IRB 8,429 2,599 1,346 7,383 2,330 1,231
Standardised Exposure ClassCentral governments or central banks 19 - 2 22 - 3 Institutions 62 1 65 43 3 56 Corporates 471 119 454 422 126 402 Retail 471 10 17 408 10 15 Secured on real estate property 131 18 - 128 19 - Past due items 21 25 - 27 46 - Items belonging to regulatory high risk categories 4 - - 4 - 138 Securitisation positions - - 85 - - - Other items 599 29 163 433 22 206
Total Standardised 1,778 202 786 1,487 226 820 Counterparty credit risk capital component (credit risk in the trading book) 1,068 1 120 1,064 2 175
Concentration risk capital component2 - - - - - -
Total 11,275 2,802 2,252 9,934 2,558 2,226 1 The IRB exposure class ‘Other’ is an asset class under the Hong Kong Monetary Authority (HKMA) regulations.2 The concentration risk capital component is the additional capital requirement to be held where exposure to a trading book counterparty
exceeds 25 per cent of capital resources.
For Standard Chartered Bank, the growth in credit risk capital requirements during 2012 is driven by increased exposures to corporates, which is due to asset growth in Wholesale Banking, in particular within transaction banking and corporate finance in the Americas, UK & Europe region and growth in qualifying revolving retail exposures driven by growth in credit card balances in Singapore.
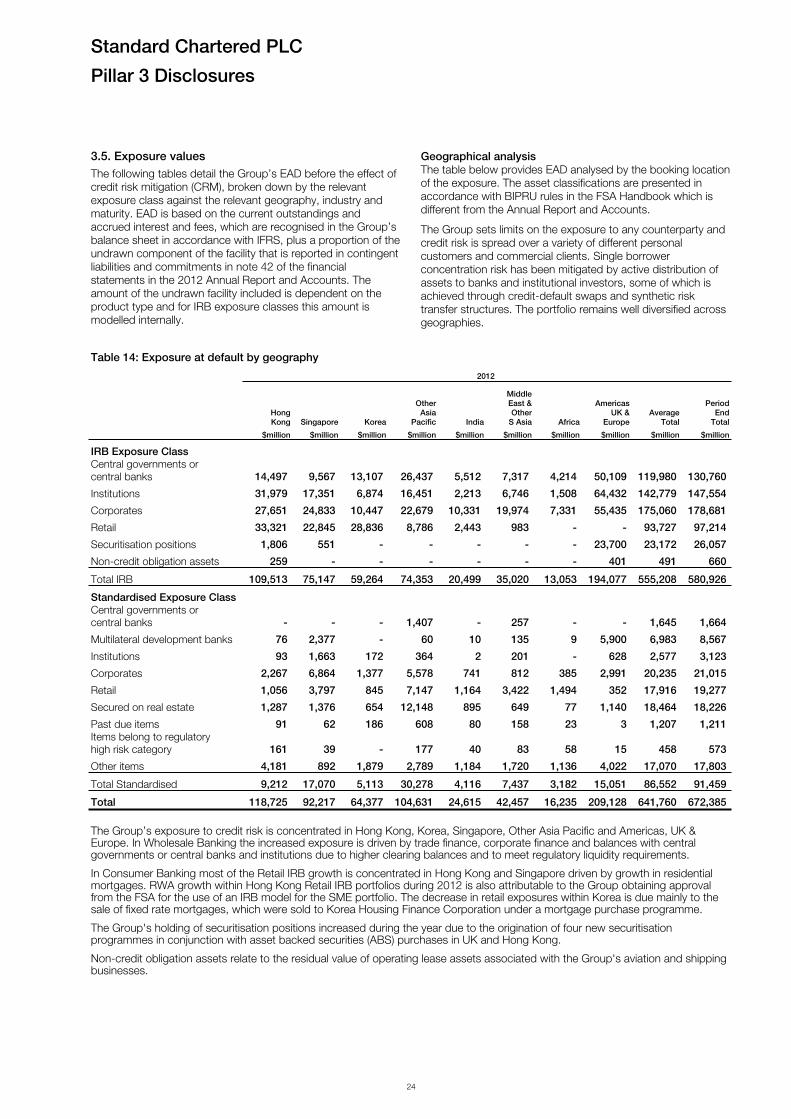
Standard Chartered PLC
Pillar 3 Disclosures
24
3.5. Exposure valuesThe following tables detail the Group’s EAD before the effect of credit risk mitigation (CRM), broken down by the relevant exposure class against the relevant geography, industry and maturity. EAD is based on the current outstandings and accrued interest and fees, which are recognised in the Group’s balance sheet in accordance with IFRS, plus a proportion of the undrawn component of the facility that is reported in contingent liabilities and commitments in note 42 of the financial statements in the 2012 Annual Report and Accounts. The amount of the undrawn facility included is dependent on the product type and for IRB exposure classes this amount is modelled internally.
Geographical analysis The table below provides EAD analysed by the booking location of the exposure. The asset classifications are presented in accordance with BIPRU rules in the FSA Handbook which is different from the Annual Report and Accounts.
The Group sets limits on the exposure to any counterparty and credit risk is spread over a variety of different personal customers and commercial clients. Single borrower concentration risk has been mitigated by active distribution of assets to banks and institutional investors, some of which is achieved through credit-default swaps and synthetic risk transfer structures. The portfolio remains well diversified across geographies.
Table 14: Exposure at default by geography
2012
Hong Kong Singapore Korea
Other Asia
Pacific India
Middle East & Other
S Asia Africa
Americas UK &
EuropeAverage
Total
Period End
Total
$million $million $million $million $million $million $million $million $million $million
IRB Exposure ClassCentral governments or central banks 14,497 9,567 13,107 26,437 5,512 7,317 4,214 50,109 119,980 130,760
Institutions 31,979 17,351 6,874 16,451 2,213 6,746 1,508 64,432 142,779 147,554
Corporates 27,651 24,833 10,447 22,679 10,331 19,974 7,331 55,435 175,060 178,681
Retail 33,321 22,845 28,836 8,786 2,443 983 - - 93,727 97,214
Securitisation positions 1,806 551 - - - - - 23,700 23,172 26,057
Non-credit obligation assets 259 - - - - - - 401 491 660
Total IRB 109,513 75,147 59,264 74,353 20,499 35,020 13,053 194,077 555,208 580,926
Standardised Exposure ClassCentral governments or central banks - - - 1,407 - 257 - - 1,645 1,664
Multilateral development banks 76 2,377 - 60 10 135 9 5,900 6,983 8,567
Institutions 93 1,663 172 364 2 201 - 628 2,577 3,123
Corporates 2,267 6,864 1,377 5,578 741 812 385 2,991 20,235 21,015
Retail 1,056 3,797 845 7,147 1,164 3,422 1,494 352 17,916 19,277
Secured on real estate 1,287 1,376 654 12,148 895 649 77 1,140 18,464 18,226
Past due items 91 62 186 608 80 158 23 3 1,207 1,211 Items belong to regulatory high risk category 161 39 - 177 40 83 58 15 458 573
Other items 4,181 892 1,879 2,789 1,184 1,720 1,136 4,022 17,070 17,803
Total Standardised 9,212 17,070 5,113 30,278 4,116 7,437 3,182 15,051 86,552 91,459
Total 118,725 92,217 64,377 104,631 24,615 42,457 16,235 209,128 641,760 672,385
The Group’s exposure to credit risk is concentrated in Hong Kong, Korea, Singapore, Other Asia Pacific and Americas, UK & Europe. In Wholesale Banking the increased exposure is driven by trade finance, corporate finance and balances with central governments or central banks and institutions due to higher clearing balances and to meet regulatory liquidity requirements.
In Consumer Banking most of the Retail IRB growth is concentrated in Hong Kong and Singapore driven by growth in residential mortgages. RWA growth within Hong Kong Retail IRB portfolios during 2012 is also attributable to the Group obtaining approval from the FSA for the use of an IRB model for the SME portfolio. The decrease in retail exposures within Korea is due mainly to the sale of fixed rate mortgages, which were sold to Korea Housing Finance Corporation under a mortgage purchase programme.
The Group's holding of securitisation positions increased during the year due to the origination of four new securitisation programmes in conjunction with asset backed securities (ABS) purchases in UK and Hong Kong.
Non-credit obligation assets relate to the residual value of operating lease assets associated with the Group's aviation and shipping businesses.

Standard Chartered PLC
Pillar 3 Disclosures
25
3.5. Exposure values continued Table 14: Exposure at default by geography continued
2011
Hong Kong Singapore Korea
Other Asia
Pacific India
Middle East & Other
S Asia Africa
Americas UK &
EuropeAverage
Total
Period End
Total
$million $million $million $million $million $million $million $million $million $million
IRB Exposure ClassCentral governments or central banks 12,398 8,776 10,996 27,007 5,380 6,040 2,736 35,866 98,792 109,199
Institutions 28,774 16,223 7,525 16,721 4,069 5,849 1,434 57,409 128,572 138,004
Corporates 24,929 21,733 10,652 23,488 9,860 20,161 6,763 53,853 162,307 171,439
Retail 28,741 17,367 32,621 8,417 2,196 898 - - 90,147 90,240
Securitisation positions 562 252 - - - - - 20,013 19,693 20,827
Non-credit obligation assets 111 - - - - - - 210 264 321
Total IRB 95,515 64,351 61,794 75,633 21,505 32,948 10,933 167,351 499,775 530,030
Standardised Exposure ClassCentral governments or central banks - - - 1,198 - 427 - - 1,324 1,625
Multilateral development banks 46 1,725 - 50 11 82 43 3,441 4,146 5,398
Institutions 145 835 83 451 6 23 15 472 1,784 2,030
Corporates 3,299 6,071 888 4,597 740 841 307 2,711 17,913 19,454
Retail 1,448 3,493 309 6,020 1,087 2,711 1,150 337 15,251 16,555
Secured on real estate 1,976 1,495 85 12,648 898 857 60 682 18,258 18,701
Past due items 331 98 99 413 105 132 23 2 1,016 1,203 Items belong to regulatory high risk category 95 - 61 123 48 - 5 10 477 342
Other items 3,299 989 2,229 2,667 760 1,658 916 3,819 16,065 16,337
Total Standardised 10,639 14,706 3,754 28,167 3,655 6,731 2,519 11,474 76,234 81,645
Total 106,154 79,057 65,548 103,800 25,160 39,679 13,452 178,825 576,009 611,675
The exposure associated within the Other Asia Pacific and Africa regions has been restated for 2011 following a transfer of governance of the Mauritius franchise from Other Asia Pacific to Africa.

Standard Chartered PLC
Pillar 3 Disclosures
26
3.5. Exposure values continuedIndustry analysisThe mortgage portfolio makes up 64 per cent of the Consumer Banking IRB asset classes, compared to 67 per cent in 2011. The Wholesale Banking portfolio is well diversified across industry, with no significant concentration within the broad
industry classifications of Manufacturing; Financing, Insurance and Business Services; Commerce; or Transport, Storage and Communication. The industry classifications below are aligned with those in the Risk review section of the 2012 Annual Report and Accounts although immaterial industries are included in ‘Other’.
Table 15: Exposure at default by industry
2012
Loans to Individuals - Mortgage
Loans to Individuals
- Other SME CommerceManu-
facturingCommercial Real Estate Government
Financing Insurance &
Business Services
Transport & Storage & Communi-
cation Other Total
EAD $million $million $million $million $million $million $million $million $million $million $million
IRB Exposure ClassCentral governments or central banks - - - 249 - 15 126,112 3,786 - 598 130,760
Institutions - 29 - 24 109 125 302 146,312 20 633 147,554
Corporates - 69 6,545 39,879 48,072 12,741 734 11,103 18,674 40,864 178,681
Retail 62,629 32,931 1,654 - - - - - - - 97,214 Securitisation positions - - - 2,035 - - - 2,073 209 21,740 26,057 Non-credit obligation assets - - - - - - - - 655 5 660
Total IRB 62,629 33,029 8,199 42,187 48,181 12,881 127,148 163,274 19,558 63,840 580,926
Standardised Exposure ClassCentral governments or central banks - - - - - - 138 238 - 1,288 1,664 Multilateral development banks - - - 50 - - 1,501 2,195 - 4,821 8,567
Institutions - 1 - - - - - 2,944 - 178 3,123
Corporates 1 24 14,704 802 2,161 1 4 471 314 2,533 21,015
Retail - 12,980 6,297 - - - - - - - 19,277 Secured on real estate 15,636 25 2,432 37 8 2 - 48 1 37 18,226
Past due items 178 432 296 53 110 3 - 45 19 75 1,211 Items belong to regulatory high risk category - - 141 188 54 90 - 21 - 79 573
Other items 1 114 - 841 1,105 66 - 1,151 146 14,379 17,803
Total Standardised 15,816 13,576 23,870 1,971 3,438 162 1,643 7,113 480 23,390 91,459
Total 78,445 46,605 32,069 44,158 51,619 13,043 128,791 170,387 20,038 87,230 672,385
Exposure growth was seen across a broad range of industry sectors during 2012, with the main increase in IRB exposures in central governments or central banks and institutions, which increased by $22.7 billion and $9.1 billion respectively. The Group placed excess liquidity within these sectors to meet increasing regulatory liquidity requirements.

Standard Chartered PLC
Pillar 3 Disclosures
27
3.5. Exposure values continued Table 15: Exposure at default by industry continued
2011
Loans to Individuals
- Mortgage
Loans to Individuals
- Other SME CommerceManu-
facturingCommercial Real Estate Government
Financing Insurance
& Business Services
Transport & Storage & Communi-
cation Other Total
EAD $million $million $million $million $million $million $million $million $million $million $million
IRB Exposure ClassCentral governments or central banks - - - 221 30 485 103,434 4,007 - 1,022 109,199
Institutions - 28 - 291 8 69 369 137,189 50 - 138,004
Corporates 2 43 5,563 35,145 43,455 10,930 805 16,294 17,264 41,938 171,439
Retail 60,675 28,386 1,179 - - - - - - - 90,240 Securitisation positions - - - 17 - - - 1,622 150 19,038 20,827 Non-credit obligation assets - - - - 56 - - - 262 3 321
Total IRB 60,677 28,457 6,742 35,674 43,549 11,484 104,608 159,112 17,726 62,001 530,030
Standardised Exposure ClassCentral governments or central banks - - - - - - 7 - - 1,618 1,625 Multilateral development banks - - - 50 - - 774 1,369 - 3,205 5,398
Institutions - - - - - - - 1,438 - 592 2,030
Corporates - - 13,711 1,208 1,744 - 5 154 350 2,282 19,454
Retail - 10,489 6,066 - - - - - - - 16,555 Secured on real estate 15,386 - 3,228 - - - - - - 87 18,701
Past due items 162 382 326 84 30 2 27 61 - 129 1,203 Items belong to regulatory high risk category - - 78 28 110 92 - 26 - 8 342
Other items 1 121 - 133 171 - - 576 80 15,255 16,337
Total Standardised 15,549 10,992 23,409 1,503 2,055 94 813 3,624 430 23,176 81,645
Total 76,226 39,449 30,151 37,177 45,604 11,578 105,421 162,736 18,156 85,177 611,675
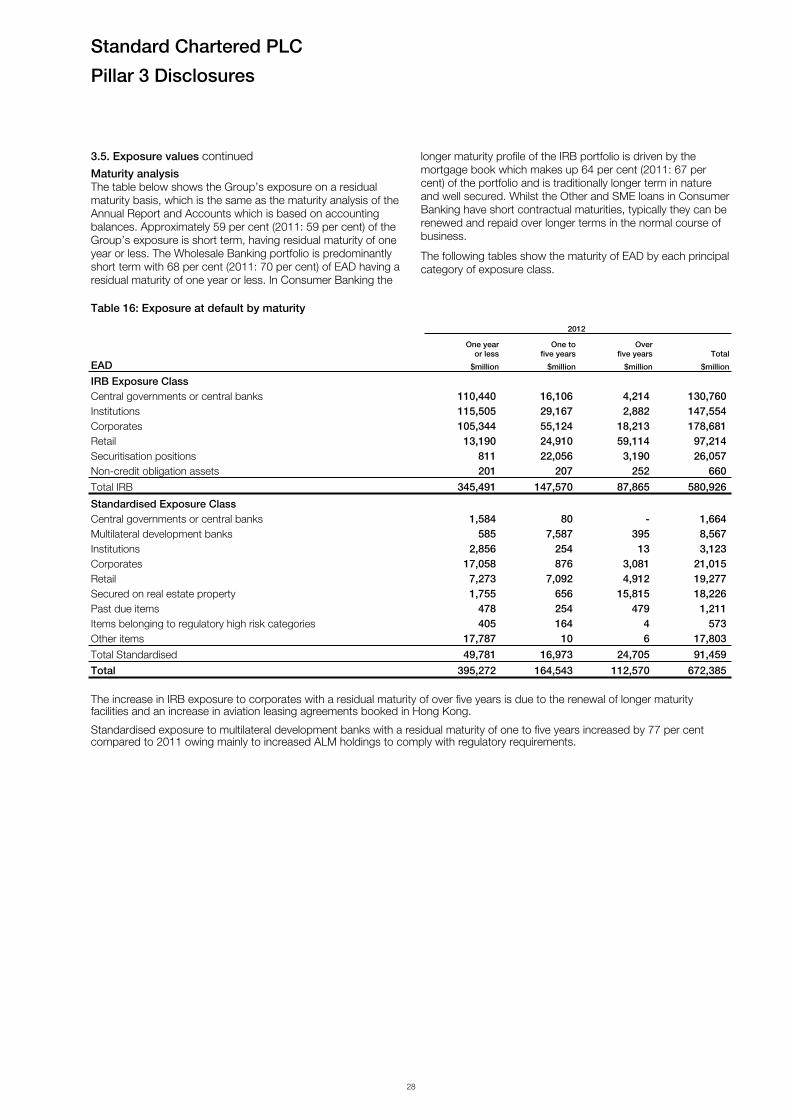
Standard Chartered PLC
Pillar 3 Disclosures
28
3.5. Exposure values continuedMaturity analysisThe table below shows the Group’s exposure on a residual maturity basis, which is the same as the maturity analysis of the Annual Report and Accounts which is based on accounting balances. Approximately 59 per cent (2011: 59 per cent) of the Group’s exposure is short term, having residual maturity of one year or less. The Wholesale Banking portfolio is predominantly short term with 68 per cent (2011: 70 per cent) of EAD having a residual maturity of one year or less. In Consumer Banking the
longer maturity profile of the IRB portfolio is driven by the mortgage book which makes up 64 per cent (2011: 67 per cent) of the portfolio and is traditionally longer term in nature and well secured. Whilst the Other and SME loans in Consumer Banking have short contractual maturities, typically they can be renewed and repaid over longer terms in the normal course of business.
The following tables show the maturity of EAD by each principal category of exposure class.
Table 16: Exposure at default by maturity
2012
One year or less
One to five years
Over five years Total
EAD $million $million $million $million
IRB Exposure ClassCentral governments or central banks 110,440 16,106 4,214 130,760 Institutions 115,505 29,167 2,882 147,554 Corporates 105,344 55,124 18,213 178,681 Retail 13,190 24,910 59,114 97,214 Securitisation positions 811 22,056 3,190 26,057 Non-credit obligation assets 201 207 252 660
Total IRB 345,491 147,570 87,865 580,926
Standardised Exposure ClassCentral governments or central banks 1,584 80 - 1,664 Multilateral development banks 585 7,587 395 8,567 Institutions 2,856 254 13 3,123 Corporates 17,058 876 3,081 21,015 Retail 7,273 7,092 4,912 19,277 Secured on real estate property 1,755 656 15,815 18,226 Past due items 478 254 479 1,211 Items belonging to regulatory high risk categories 405 164 4 573 Other items 17,787 10 6 17,803
Total Standardised 49,781 16,973 24,705 91,459
Total 395,272 164,543 112,570 672,385
The increase in IRB exposure to corporates with a residual maturity of over five years is due to the renewal of longer maturity facilities and an increase in aviation leasing agreements booked in Hong Kong.
Standardised exposure to multilateral development banks with a residual maturity of one to five years increased by 77 per cent compared to 2011 owing mainly to increased ALM holdings to comply with regulatory requirements.

Standard Chartered PLC
Pillar 3 Disclosures
29
3.5. Exposure values continued Table 16: Exposure at default by maturity continued
2011
One year or less
One to five years
Over five years Total
EAD $million $million $million $million
IRB Exposure ClassCentral governments or central banks 91,360 15,167 2,672 109,199 Institutions 107,500 26,552 3,952 138,004 Corporates 105,427 51,795 14,217 171,439 Retail 10,851 20,989 58,400 90,240 Securitisation positions 1,386 18,105 1,336 20,827 Non-credit obligation assets 66 99 156 321
Total IRB 316,590 132,707 80,733 530,030
Standardised Exposure ClassCentral governments or central banks 1,625 - - 1,625 Multilateral development banks 856 4,277 265 5,398 Institutions 2,028 2 - 2,030 Corporates 16,037 834 2,583 19,454 Retail 6,354 6,049 4,152 16,555 Secured on real estate property 1,963 718 16,020 18,701 Past due items 511 334 358 1,203 Items belonging to regulatory high risk categories 113 229 - 342 Other items 16,278 37 22 16,337
Total Standardised 45,765 12,480 23,400 81,645
Total 362,355 145,187 104,133 611,675

Standard Chartered PLC
Pillar 3 Disclosures
30
3.6. Credit risk mitigationPotential credit losses from any given account, customer or portfolio are mitigated using a range of tools such as collateral, netting agreements, credit insurance, credit derivatives and other guarantees. The reliance that can be placed on these mitigants is carefully assessed in light of issues such as legal certainty and enforceability, market valuation, correlation risk and counterparty risk of the guarantor. Where appropriate,
credit derivatives are used to reduce credit risks in the portfolio. Due to their potential impact on income volatility, such derivatives are used in a controlled manner with reference to their expected volatility. Risk mitigation policies determine the eligibility of collateral types.
Our approach to credit risk mitigation can be found on pages 66, 68, 79 and 89 in the Risk review section of the 2012 Annual Report and Accounts.
Table 17: IRB exposure at default after CRM
2012 2011
EAD after the effect of CRM
Of which: EADcovered by
guarantees/creditderivatives
EAD after theeffect of CRM
Of which: EADcovered by
guarantees/creditderivatives
$million $million $million $million
IRB Exposure ClassCentral governments or central banks 124,207 159 103,340 79 Institutions 124,572 3,515 114,571 2,662 Corporates 145,832 8,792 141,016 9,200 Retail 38,006 10 32,352 -Securitisation positions 24,869 1,487 19,758 1,286 Non-credit obligation assets 660 321 -
Total IRB 458,146 13,963 411,358 13,227
Table 17 above provides ‘EAD after the effect of CRM’ with exposure shown against the exposure class of the original counterparty rather than the guarantor.
Table 18 below identifies the effect of credit risk mitigation on EAD for the IRB and standardised portfolios. Eligible financial collateral consists primarily of cash, debt securities, equities and gold.
All collateral shown below meets FSA Handbook BIPRU Chapter 5 eligibility rules. Eligible credit risk mitigation includes funded and unfunded protection. Funded protection is where the Group can either take rights over assets, or reduce its liabilities, when the borrower does not pay, and unfunded protection relates to instances where the Group enters into an agreement with a third party to step in and make payment when the borrower defaults.
Eligible credit risk mitigation includes but is not limited to netting agreements, collateral, guarantees and credit derivatives. To be eligible for recognition, credit risk mitigation must meet the eligibility criteria in the FSA handbook, which includes but is not limited to the requirement for agreements to be legally enforceable in all jurisdictions.
The growth in IRB was mainly in other eligible collateral received from corporate customers in Korea, Indonesia and UAE.
The main type of collateral for the Group’s standardised portfolio is real estate property which accounts for 63 per cent (2011: 69 per cent) of all credit risk mitigants.

Standard Chartered PLC
Pillar 3 Disclosures
31
3.6. Credit risk mitigation continued
Table 18: Credit risk mitigation
2012
EAD before theeffect of CRM
EAD covered byeligible financial
collateral
EAD covered byother eligible
collateralEAD after theeffect of CRM
of which: EAD covered by
guarantees/creditderivatives
$million $million $million $million $million
IRB Exposure ClassCentral governments or central banks 130,760 954 315 129,491 5,429 Institutions 147,554 16,320 5,855 125,379 4,320 Corporates 178,681 12,084 26,856 139,741 2,726 Retail 97,214 4 59,204 38,006 1 Securitisation positions 26,057 1,188 - 24,869 1,487 Non-credit obligation assets 660 - - 660 -
Total IRB 580,926 30,550 92,230 458,146 13,963
Standardised Exposure ClassCentral governments or central banks 1,893 - - 1,893 178 Multilateral development banks 8,567 - - 8,567 7 Institutions 2,894 - - 2,894 2,704 Corporates 21,015 7,486 - 13,529 8 Retail 19,277 1,506 - 17,771 7 Secured on real estate property 18,226 20 16,000 2,206 - Past due items 1,211 14 170 1,027 - Items belonging to regulatory high risk categories 573 48 - 525 - Other items 17,803 25 - 17,778 -
Total Standardised 91,459 9,099 16,170 66,190 2,904
Total 672,385 39,649 108,400 524,336 16,867
Table 18 provides 'EAD before CRM' and 'EAD after CRM' with exposure shown against the exposure class of the guarantor.
2011
EAD before theeffect of CRM
EAD covered byeligible financial
collateral
EAD covered byother eligible
collateralEAD after theeffect of CRM
of which: EAD covered by
guarantees/creditderivatives
$million $million $million $million $million
IRB Exposure ClassCentral governments or central banks 109,199 854 208 108,137 4,937 Institutions 138,004 16,982 4,369 116,653 4,683 Corporates 171,439 14,161 23,141 134,137 2,321 Retail 90,240 - 57,888 32,352 -Securitisation positions 20,827 1,069 - 19,758 1,286 Non-credit obligation assets 321 - - 321 -
Total IRB 530,030 33,066 85,606 411,358 13,227
Standardised Exposure ClassCentral governments or central banks 1,625 - - 1,625 7 Multilateral development banks 5,398 - - 5,398 11 Institutions 2,030 - - 2,030 1,928 Corporates 19,454 6,526 - 12,928 4 Retail 16,555 1,415 - 15,140 -Secured on real estate property 18,701 67 18,135 499 -Past due items 1,203 16 155 1,032 -Items belonging to regulatory high risk categories 342 9 1 332 -Other items 16,337 49 - 16,288 -
Total Standardised 81,645 8,082 18,291 55,272 1,950
Total 611,675 41,148 103,897 466,630 15,177
Table 18 provides 'EAD before CRM' and 'EAD after CRM' with exposure shown against the exposure class of the guarantor.

Standard Chartered PLC
Pillar 3 Disclosures
32
3.7. Regulatory expected loss vs impairment chargesImpairment for regulatory purposes is under the expected loss model whereas impairment in the financial accounts is based on incurred loss whereby the Group recognises a provision where there is objective evidence of a loss.
The table below compares the regulatory expected loss of $3.3 billion, calculated at 31 December 2011 in respect of 2012, against the net impairment charge for 2012 of $0.9 billion. This results in a gap between the two measures of $2.4 billion compared to $2.6 billion when the 31 December 2010 regulatory expected loss of $3.2 billion is compared to the 2011 net individual charge of $0.6 billion.
Regulatory expected loss is based on a through-the-cycle methodology using risk parameters and observations over a period of time. It is a conservative and appropriately prudent calculation underpinning regulatory capital requirements, but:
• does not take account of any benefit from management actions to reduce exposures to riskier customers, clients or segments as conditions deteriorate;
• does not take account of any diversification benefit; and
• is calculated in accordance with rules which enforce a certain level of conservatism.
Regulatory expected loss therefore bears little resemblance to impairment as defined for accounting purposes. This is illustrated by the table below which shows expected loss consistently at a multiple of impairment even following the financial crisis of 2008.
The net individual impairment charge is a point in time actual charge raised in accordance with accounting standards that require the Group to either provide for or write-off debts when certain conditions are met as described in the problem credit management and provisioning section on page 73 of the Risk review in the 2012 Annual Report and Accounts.
During 2012, regulatory expected loss increased as a result of portfolio growth and credit migration within Wholesale Banking, in particular in India and Korea. The Group continues to be disciplined in its approach to risk management and proactive in collection efforts to minimise account delinquencies.
As explained in note 1 of the financial statements in the 2012 Annual Report and Accounts, the International Accounting Standards Board (IASB) during the first quarter of 2013 is expected to issue its latest proposals on the recognition of credit losses, proposing an expected loss versus an incurred loss model. This approach is likely to be different from the methodology required for measuring regulatory expected loss.
Table 19: Regulatory expected loss2011 2012 2010 2011
Regulatory expected loss
Net individual impairment
charge1 Regulatory
expected loss
Net individual impairment
charge
$million $million $million $million
IRB Exposure ClassCentral governments or central banks 67 - 45 -Institutions 448 6 447 12 Corporates 1,904 537 1,751 317 Retail, of which 929 359 954 255
Secured by real estate collateral 125 8 127 3 Qualifying revolving retail 422 185 470 126 Retail SME 14 46 17 36 Other retail 368 120 340 90
Total IRB 3,348 902 3,197 584
2009 2010 2008 2009
Regulatory expected loss
Net individual impairment
charge1 Regulatory
expected loss
Net individual impairment
charge
$million $million $million $million
IRB Exposure ClassCentral governments or central banks 60 - 27 -Institutions 406 6 200 122 Corporates 1,680 324 1,056 683 Retail, of which 773 340 788 537
Secured by real estate collateral 101 6 111 13 Qualifying revolving retail 380 163 379 252 Retail SME 31 38 50 77 Other retail 261 133 248 195
Total IRB 2,919 670 2,071 1,342 1 Excludes ‘other credit risk provisions’.

Standard Chartered PLC
Pillar 3 Disclosures
33
3.8. Risk grade profileExposures by internal credit grading For IRB portfolios a standard alphanumeric credit risk-grading system is used in both Wholesale and Consumer Banking. The grading is based on the Group’s internal estimate of probability of default over a one-year horizon, with customers or portfolios assessed against a range of quantitative and qualitative factors. The numeric grades run from 1 to 14 and some of the grades are sub-classified A, B or C. Lower credit grades are indicative of a lower likelihood of default. Credit grades 1A to 12C are assigned to performing customers or accounts, while credit grades 13 and 14 are assigned to non-performing or defaulted customers.
The Group’s credit grades in Wholesale Banking are not intended to replicate external credit grades, and ratings assigned by ECAI are not used in determining internal credit grades. Nonetheless, as the factors used to grade a borrower may be similar, a borrower rated poorly by an ECAI is typically expected to be assigned a weak internal credit grade.
As an indicative guide for reference the mapping below presents the Group’s credit grades in relation to that of Standard & Poor’s credit ratings.
Standard & Poor’s Mapping
SCB Credit Grade Corporate/NBFI Bank
1A AAA AAA/AA+
1B AA+ AA/AA-
2A AA A+
2B AA- A
3A AA- A/A-
3B A+ A-/BBB+
4A A/A- BBB+
4B A-/BBB+ BBB
5A BBB BBB/BBB-
5B BBB- BBB-/BB+
6A BB+ BB+
6B BB+ BB
7A BB BB/BB-
7B BB BB-
8A BB- BB-/B+
8B BB- B+
9A B+ B
9B B+ B/B-
10A B B-
10B B B-/CCC
11A/B/C B- CCC
12A/B/C NA NA
Credit grades for Consumer Banking accounts covered by IRB models are based on a probability of default. These models are based on application and behavioural scorecards which make use of credit bureau information as well as the Group’s own data. For Consumer Banking portfolios where IRB models have not yet been developed, the probability of default is calculated using historical portfolio delinquency flow rates and expert judgement, where applicable.
IRB models cover a substantial majority of the Group’s loans and are used extensively in assessing risks at customer and portfolio level, setting strategy and optimising the Group’s risk-return decisions.
The Group makes use of internal risk estimates of PD, LGD and EAD in the areas of:
• Credit Approval and Decision – The level of authority required for the sanctioning of credit requests and the decision made is based on a combination of PD, LGD and EAD of the obligor with reference to the nominal exposure;
• Pricing – In Wholesale Banking a pre-deal pricing calculator is used which takes into consideration PD, LGD and EAD in the calculation of expected loss and economic capital for the proposed transactions to ensure appropriate return. In Consumer Banking a standard approach to risk-return assessment is used to assess the risk using PD, LGD and EAD against the expected income for pricing and risk decisions;
• Limit Setting – In Wholesale Banking single name concentration limits are determined by PD, LGD and EAD. The limits operate on a sliding scale to ensure that the Group does not have over concentration of low credit quality assets. In Consumer Banking, the estimates of PD, LGD and EAD are used in the credit approval documents to define the credit boundaries and risk limits. It is also used in the score cut-off analysis to limit underwriting within the lower quality or unprofitable score bands;
• Provisioning – Portfolio Impairment Provisions (PIP) are raised at the portfolio level and are set with reference to expected loss which is based on PD, LGD and EAD amongst other quantitative and qualitative factors;
• Risk Appetite – PD, LGD and EAD models provide some of the key inputs into the risk-based methodologies used in the assessment of business and market variables which in turn are key components in the approach taken in setting Risk Appetite; and
• Economic Capital – PD, LGD and EAD are key components of the model used to calculate Economic Capital which is used in the pricing and performance measurement processes at business unit, portfolio and client relationship level.

Standard Chartered PLC
Pillar 3 Disclosures
34
3.8. Risk grade profile continuedThe following table sets out analysis of EAD within the IRB portfolios by internal credit grading and Basel II exposure classes. EAD has been calculated after taking into account the
impact of credit risk mitigation. Where exposure is guaranteed or covered by credit derivatives, exposure is shown against the asset class of the guarantor or derivative counterparty. 76 per cent (2011: 75 per cent) of exposures are classified as credit grades 1 to 5.
Table 20: Exposure at default after CRM by risk grade
2012
Grades 1-5 Grades 6-8 Grades 9-11 Grade 12 Grades 13-14 Total
EAD $million $million $million $million $million $million
Total exposureCentral governments or central banks 122,648 4,309 2,534 - - 129,491 Institutions 113,061 9,558 2,013 36 711 125,379 Corporates 69,989 50,267 13,841 2,254 3,390 139,741 Retail, of which 16,325 11,442 8,904 700 635 38,006
Retail exposures secured by real estate collateral 2,009 1,047 315 16 53 3,440 Qualifying revolving retail 10,261 3,695 3,768 375 279 18,378 Retail SME 466 943 187 11 18 1,625 Other retail 3,589 5,757 4,634 298 285 14,563
Securitisation positions 24,712 104 53 - - 24,869 Non-credit obligation assets 168 402 48 4 38 660
Total IRB 346,903 76,082 27,393 2,994 4,774 458,146
2011
Grades 1-5 Grades 6-8 Grades 9-11 Grade 12 Grades 13-14 Total
EAD $million $million $million $million $million $million
Total exposureCentral governments or central banks 102,331 3,950 1,855 1 - 108,137 Institutions 105,166 9,696 959 250 582 116,653 Corporates 69,519 48,727 11,515 1,633 2,743 134,137 Retail, of which 14,005 9,918 7,333 596 500 32,352
Retail exposures secured by real estate collateral 1,519 989 210 16 52 2,786 Qualifying revolving retail 9,587 4,035 3,349 400 236 17,607 Retail SME 401 676 76 9 17 1,179 Other retail 2,498 4,218 3,698 171 195 10,780
Securitisation positions 19,573 124 61 - - 19,758 Non-credit obligation assets 169 106 25 21 - 321
Total IRB 310,763 72,521 21,748 2,501 3,825 411,358
Exposure growth during 2012 in the Group’s IRB portfolio continues to be focussed in the better quality grades, Grades 1-5 and is driven mainly by the placement of excess liquidity within central governments or central banks. The increase in Grades 12, 13 and 14 for corporates is caused by downgrades in India and Korea within Wholesale Banking.
For securitisation positions, the external ratings of the tranches within the programmes have been mapped to internal credit grades, whereas previously we used the rating afforded by the securitisation Special Purpose Entity (SPE). The Group’s holdings of such positions reflect highly rated tranches and the growth during 2012 results from further purchases of ABS and the origination of securitisation programmes, as can be seen in Tables 26 and 27 on pages 42 and 44 respectively.

Standard Chartered PLC
Pillar 3 Disclosures
35
3.8. Risk grade profile continued
The following table sets out analysis of undrawn commitments by internal credit grading and Basel II exposure classes.
Table 21: Undrawn commitments by risk grade
2012
Grades 1-5 Grades 6-8 Grades 9-11 Grade 12 Grades 13-14 Total
$million $million $million $million $million $million
Undrawn commitmentsCentral governments or central banks 98 20 57 - - 175 Institutions 4,269 722 64 1 9 5,065 Corporates 32,836 12,692 2,614 33 31 48,206 Retail, of which 6,485 3,331 985 24 9 10,834
Retail exposures secured by real estate collateral 4,012 1,591 637 2 1 6,243 Retail SME 18 127 4 - 7 156 Other retail 2,455 1,613 344 22 1 4,435
Total IRB 43,688 16,765 3,720 58 49 64,280
2011
Grades 1-5 Grades 6-8 Grades 9-11 Grade 12 Grades 13-14 Total
$million $million $million $million $million $million
Undrawn commitmentsCentral governments or central banks 38 17 47 - - 102 Institutions 3,115 626 13 35 9 3,798 Corporates 30,931 11,726 2,910 38 51 45,656 Retail, of which 4,206 2,463 666 14 2 7,351
Retail exposures secured by real estate collateral 2,548 1,025 467 2 1 4,043 Qualifying revolving retail - - - - - - Retail SME 13 153 1 - - 167 Other retail 1,645 1,285 198 12 1 3,141
Total IRB 38,290 14,832 3,636 87 62 56,907

Standard Chartered PLC
Pillar 3 Disclosures
36
3.8. Risk grade profile continuedTables 22 and 23 set out exposure weighted average LGD and exposure weighted average risk weight of the credit risk trading and non-trading books respectively. These weighted averages have been calculated using EAD before taking into account the impact of credit risk mitigation. The average exposure weighted LGD across the IRB portfolio is 37 per cent (2011: 33 per cent).
Table 22: Exposure weighted average LGD by risk grade
2012
Grades 1-5 Grades 6-8 Grades 9-11 Grade 12 Grades 13-14 Total
% % % % % %
Exposure weighted average LGDCentral governments or central banks 46 46 46 - - 46 Institutions 26 31 34 39 39 27 Corporates 44 37 33 40 53 40 Retail, of which 29 47 63 70 53 38
Retail exposures secured by real estate collateral 13 19 19 19 19 15 Qualifying revolving retail 85 79 82 81 75 83 Retail SME 23 55 69 58 66 48 Other retail 78 83 84 86 81 82
Total IRB 36 39 43 46 51 37
2011
Grades 1-5 Grades 6-8 Grades 9-11 Grade 12 Grades 13-14 Total
% % % % % %
Exposure weighted average LGDCentral governments or central banks 28 41 41 41 - 29 Institutions 25 29 33 35 45 26 Corporates 43 39 31 46 55 41 Retail, of which 28 44 54 66 49 36
Retail exposures secured by real estate collateral 13 18 18 19 19 14 Qualifying revolving retail 85 83 81 82 76 84 Retail SME 21 43 68 55 51 37 Other retail 71 79 83 85 82 79
Total IRB 31 39 39 50 53 33
The FSA introduced a floor of 45 per cent to the unsecured LGD associated with central governments or central bank exposures during 2012, which increased LGD from 29 per cent to 46 per cent. The Group experienced no defaults with such exposures during the period. The LGD associated with the Retail SME portfolio increased by 30 per cent during 2012 following the FSA approving the use of an IRB model for the Hong Kong SME portfolio.

Standard Chartered PLC
Pillar 3 Disclosures
37
3.8. Risk grade profile continued
Table 23: Exposure weighted average risk weight
2012
Grades 1-5 Grades 6-8 Grades 9-11 Grade 12 Grades 13-14 Total
% % % % % %
Exposure weighted average risk weightCentral governments or central banks 8 88 127 - - 13 Institutions 11 49 81 211 111 16 Corporates 32 71 103 230 298 66 Retail, of which 7 44 103 201 119 31
Retail exposures secured by real estate collateral 4 26 59 108 93 13 Qualifying revolving retail 7 31 112 235 165 40 Retail SME 9 64 105 148 158 55 Other retail 40 87 132 215 109 93
Securitisation positions 9 357 1161 - - 13 Non-credit obligation assets 100 100 100 100 100 100
Total IRB 13 64 104 224 240 33
2011
Grades 1-5 Grades 6-8 Grades 9-11 Grade 12 Grades 13-14 Total
% % % % % %
Exposure weighted average risk weightCentral governments or central banks 6 73 109 211 - 11 Institutions 11 47 95 195 120 16 Corporates 32 74 85 241 340 62 Retail, of which 6 38 90 200 115 28
Retail exposures secured by real estate collateral 4 22 54 114 86 13 Qualifying revolving retail 7 32 108 240 161 39 Retail SME 8 50 104 142 167 41 Other retail 36 85 129 212 116 91
Securitisation positions 8 193 1,145 - - 14 Non-credit obligation assets 100 100 100 100 - 100
Total IRB 14 63 88 226 270 32
For securitisation positions, the external ratings of the tranches within the programmes have been mapped to internal credit grades, whereas previously we used the rating afforded by the securitisation SPE. The Group’s holdings of such positions reflects highly rated tranches and the growth during 2012 results from further purchases of ABS and the origination of securitisation programmes, as can be seen in Tables 26 and 27 on pages 42 and 44 respectively.
The average risk weight for corporates increased from 62 per cent to 66 per cent during 2012, due to credit migration across Wholesale Banking, in particular within India and Korea, in conjunction with a reduction in the value of eligible financial collateral. An increase in facilities with longer maturities, including leasing agreements for aircraft and shipping, also contributed to a higher average risk-weight when compared to 2011.
The average risk weight for our corporate exposures in Grades 13 and 14 reduced during 2012, from 340 per cent to 298 per cent, due to an increase in the Group’s level of individual impairment charges during the year.

Standard Chartered PLC
Pillar 3 Disclosures
38
3.9. Counterparty credit risk in the trading bookCounterparty credit risk (CCR) is the risk that the Group’s counterparty in a foreign exchange, interest rate, commodity, equity or credit derivative contract defaults prior to maturity date of the contract and that the Group at the time has a claim on the counterparty. CCR arises predominantly in the trading book, but also arises in the non-trading book due to hedging of external funding.
The credit risk arising from all financial derivatives is managed as part of the overall lending limits to banks and customers.
The Group seeks to negotiate Credit Support Annexes (CSAs) with counterparties on a case by case basis, where collateral is deemed a necessary or desirable mitigant to the exposure. The credit terms of the CSA are specific to each legal document and determined by the credit risk approval unit responsible for the counterparty. The nature of the collateral will be specified in the legal document and will typically be cash or highly liquid securities.
The Group further reduces its credit exposures to counterparties by entering into contractual netting agreements which result in a single amount owed by or to the counterparty through netting the sum of the positive (amounts owed by the counterparty) and negative (amounts owed by the Group) mark-to-market (MTM) values of these transactions. Following International Accounting Standard (IAS) 32 requirements, exposures are however presented on a gross basis in the financial statements as such transactions are not intended to be settled net in the ordinary course of business.
A daily operational process takes place to calculate the MTM on all trades captured under the CSA. Additional collateral will be called from the counterparty if total uncollateralised MTM exposure exceeds the threshold and minimum transfer amount specified in the CSA. Additional collateral may be required from the counterparty to provide an extra buffer to the daily variation margin process.
Credit reservesUsing risk factors such as PD and LGD a regulatory expected loss is calculated for each counterparty across the CCR portfolio, and based on this calculation credit reserves are set aside for traded products. The reserve is a dynamic calculation based on the expected risk profile for each counterparty, alongside PD and LGD factors.
In line with market convention, the Group negotiates CSA terms for certain counterparties where the thresholds related to each party are dependent on their ECAI long term rating. Such clauses are typically mutual in nature. It is therefore recognised that a downgrade in the Group’s rating could result in counterparties seeking additional collateral calls to cover negative MTM portfolios where thresholds are lowered.
Wrong way riskWrong way risk occurs when an exposure increase is coupled with a decrease in the credit quality of the obligor. For example, as the MTM on a derivative contract increases in favour of the Group, the counterparty may increasingly be unable to meet its payment, margin call or collateral posting requirements. The Group employs various policies and procedures to ensure that wrong way risk exposures are recognised upfront and monitored.
Exposure value calculationExposure values for regulatory capital purposes on over the counter traded products are calculated according to the CCR Current Exposure Method. This is calculated as the sum of the current replacement cost and the potential future credit exposure. The current replacement cost is the USD equivalent amount owed by the counterparty to the Group for various financial derivative transactions. The potential future credit exposure is an add-on based on a percentage of the notional principal of each transaction. Such percentages are prescribed by the FSA in the BIPRU guidelines and vary according to the underlying asset class and tenor of each trade. The benefit from master netting agreements is applied to the portfolio of counterparty trades in the CCR calculation according to the Net to Gross Ratio rules provided in the FSA Handbook BIPRU 13.

Standard Chartered PLC
Pillar 3 Disclosures
39
3.9. Counterparty credit risk in the trading book continuedThe following tables cover the credit exposure on derivative transactions after taking into account the benefits from legally enforceable netting agreements and the capital requirement by derivative type. The notional values settled with central counterparties and on a Recognised Trading Exchange are also shown.
Table 24: Counterparty credit risk - derivatives
2012
EAD before credit risk mitigation
Netting benefits
Netted current credit exposure
Collateral held
Net derivatives credit exposure
$million $million $million $million $million
Derivative contracts 84,301 44,891 39,410 3,304 36,107 Repo style transactions 14,417 - 14,417 8,345 6,072 Credit derivatives1 3,973 1,353 2,620 87 2,532
Total 102,691 46,244 56,447 11,736 44,711 1 Of the $2,620 million netted current credit exposure, $1,114 million of protection has been purchased and $1,506 million of protection has
been sold.
2011
EAD before credit risk mitigation
Netting benefits
Netted current credit exposure
Collateral held
Net derivatives credit exposure
$million $million $million $million $million
Derivative contracts 88,561 48,285 40,276 2,610 37,666 Repo style transactions 13,100 - 13,100 10,296 2,804 Credit derivatives1 5,043 4,135 908 4 904
Total 106,704 52,420 54,284 12,910 41,374 1 Of the $908 million netted current credit exposure, $817 million of protection has been purchased and $91 million of protection has been
sold.

Standard Chartered PLC
Pillar 3 Disclosures
40
3.9. Counterparty credit risk in the trading book continuedThe following tables cover the notional value, the credit exposure on derivative transactions after taking into account the benefits from legally enforceable netting agreements and the capital requirement by derivative type. The notional values settled by central counterparties and on a Recognised Trading Exchange are also shown.
Table 25: Counterparty credit risk by derivative type
2012
Notionalvalue
Netted current
credit exposures
Regulatory capital
requirement
Derivatives gross notional
value traded OTC
Of which settled by
central counterparties
Derivatives gross notional
value traded on Recognised
Trading Exchange
$million $million $million $million $million $million
Derivative contracts: Interest rate contracts 1,914,852 9,536 320 1,914,852 615,448 - Foreign exchange contracts 2,083,219 25,922 514 2,083,219 7 - Equity and stock index options 12,223 442 10 7,520 - 4,703 Commodity contracts 138,642 3,511 199 132,010 - 6,632 Credit derivatives: Credit default swaps 57,891 2,357 50 Total return swaps 3,295 263 8
Total derivatives 4,210,122 42,031 1,101 4,137,601 615,455 11,335
Repo style transactions: Repo 7,199 21 Reverse repo 7,219 16
Total 56,449 1,138
2011
Notional value
Netted current
credit exposures
Regulatory capital
requirement
Derivatives gross notional
value traded OTC
Of which settled by
central counterparties
Derivatives gross notional
value traded on Recognised
Trading Exchange
$million $million $million $million $million $million
Derivative contracts: Interest rate contracts 2,525,804 9,210 339 2,525,804 453,758 - Foreign exchange contracts 2,228,871 27,846 652 2,228,871 - - Equity and stock index options 12,057 395 18 12,057 - - Commodity contracts 62,426 2,825 162 42,134 - 20,292 Credit derivatives: Credit default swaps 75,901 749 11 Total return swaps 1,875 159 7
Total derivatives 4,906,934 41,184 1,189 4,808,866 453,758 20,292
Repo style transactions: Repo 4,646 6 Reverse repo 8,454 17
Total 54,284 1,212

Standard Chartered PLC
Pillar 3 Disclosures
41
3.10. SecuritisationSecuritisation is defined as a structure where the cash flow from a pool of assets is used to service obligations to at least two different tranches or classes of creditors.
Securitisations may be categorised as either:
• traditional securitisation: assets are sold to a SPE, which finances the purchase by issuing notes in different tranches with different risk and return profiles. Cash flow arising from those assets is used by the SPE to service its debt obligations, or:
• synthetic transaction: a securitisation whereby only the credit risk, or part of the credit risk of a pool of assets is transferred to a third party via credit derivatives. The pool of assets remains on the Group’s balance sheet.
Securitisation activities are undertaken by the Group for a variety of purposes, by various businesses acting in a different capacity:
• Risk mitigation, funding and capital management (as Originator);
• Fee generation (as arranger/ lead manager);
• Risk taking (as investor).
The Group has $26.1 billion (2011: $20.8 billion) of EAD classified as securitisation positions, as shown in Section 3.5 Exposure values on Table 14 on page 24. These transactions meet the criteria to qualify as securitisation positions under the FSA’s securitisation framework and the particulars of these transactions are discussed below. In addition to these positions, the Group has transferred to third parties by way of securitisation the rights to any collection of principal and interest on customer loan assets with a face value of $1.3 billion (2011: $2.2 billion), which do not qualify as securitisation positions under the FSA framework and are not detailed within this section. Further details can be found on page 68 of the 2012 Annual Report and Accounts.
Asset Backed SecuritiesThe carrying value of Asset Backed Securities (ABS) purchased by Wholesale Banking of $4.5 billion (2011: $2.1 billion), held either as investments or arranged for clients, represents 0.7 per cent of the Group’s total assets (2011: 0.3 per cent).
The year on year increase in this portfolio is mainly attributable to high quality ABS paper purchased by the Asset and Liability Management (ALM) desk with the intention to diversify the bank’s liquidity deployment. These purchases by ALM are governed by a set of portfolio limits and standards which include an aggregate portfolio limit besides sub limits on the underlying collateral types, jurisdictions, originators, issue size, seniority, rating and tenor.
The credit quality of the ABS exposures remains strong. With the exception of those securities which have been subject to an impairment charge, over 90 per cent of the overall portfolio is rated A- or better, and 61 per cent of the overall portfolio is rated as AAA. The portfolio is broadly diversified across asset classes and geographies, and there is no direct exposure to the US sub-prime market. The portfolio has an average credit grade of AA.
46 per cent of the overall portfolio is invested in Residential Mortgage Backed Securities (RMBS), with a weighted average credit rating of AA+ (AA- in 2011).
10 per cent of the overall portfolio is in Commercial Mortgage Backed Securities (CMBS), of which $107 million is in respect of US CMBS. The weighted average credit grade of the CMBS portfolio is at BBB- (BBB+ in 2011).
5 per cent of the overall portfolio is in Collateralised Debt Obligations (CDOs). This includes $23 million of exposures to CDOs of ABS (Mezzanine and High Grade), of which $20 million have been impaired. The remainder of the other CDOs amounting to $264 million has a weighted average credit rating of AA.
39 per cent of the overall portfolio is in Other ABS, which includes securities backed by loans to corporates or corporate SMEs, student loans, auto loans, and diversified payment types, with a weighted credit rating of AA.
The notional and carrying values of the ABS purchased or retained by the Group are shown in the table below analysed by underlying asset type. ABS are accounted for as financial assets. For further details regarding recognition and impairment, refer to note 1 of the financial statements on page 205 of the 2012 Annual Report and Accounts. The ABS portfolio is assessed frequently for objective evidence of impairment. In 2012, this consisted of a net recovery of $3 million in the impaired book.
Valuation of retained interest is initially and subsequently determined using market price quotations where available or internal pricing models that utilise variables such as yield curves, prepayment speeds, default rates, loss severity, interest rate volatilities and spreads. The assumptions used for valuation are based on observable transactions in similar securities and are verified by external pricing sources, where available.
The ABS portfolio is closely managed by a centralised dedicated team. The team has developed a detailed analysis and reporting framework of the underlying portfolio to allow senior management to make an informed holding decision with regards to specific assets, asset classes or parts of an asset class. These ABS portfolio reports are closely monitored by the Risk function in the Group.

Standard Chartered PLC
Pillar 3 Disclosures
42
3.10. Securitisation continued
Table 26: Securitisation: notional amount2012
Notional amount
Carrying value of asset backed
securities
Traditional securitisation programmes
Synthetic securitisation programmes
$million $million $million
Residential mortgages (RMBS) 2,114 2,160 - Commercial mortgages (CMBS) 355 467 11 CDOs of ABS – RMBS 3 23 - CDOs Other: Leveraged loans/Trust preferred/Real Estate 200 237 - Other ABS: Credit card receivables 229 229 - Student loans 88 100 - Auto loans 674 673 - Diversified payment types 662 669 - Other assets 194 198 -
Total 4,519 4,756 11
2011
Notional amount
Carrying value of asset backed
securities
Traditional securitisation programmes
Synthetic securitisation programmes
$million $million $million
Residential mortgages (RMBS) 688 769 -Commercial mortgages (CMBS) 488 621 12 CDOs of ABS – RMBS 9 30 -CDOs Other: Leveraged loans/Trust preferred/Real Estate 232 268 10 Other ABS: Credit card receivables - - - Loans to corporates or Corporate SMEs 24 25 - Student loans 124 138 - Auto loans 51 52 - Diversified payment types 291 299 - Other assets 189 198 -
Total 2,096 2,400 22

Standard Chartered PLC
Pillar 3 Disclosures
43
3.10. Securitisation continuedWholesale Banking Portfolio ManagementThe Group via its Wholesale Banking Portfolio Management (WBPM) unit buys synthetic protection for its banking book credit portfolio. Securitisation provides capacity for client-focused growth and improves efficiency of economic and regulatory capital. The Group as the originator performs multiple roles, including protection buyer, calculation agent and credit event monitor agent. The protection buyer executes and maintains securitisation transactions. The calculation agent computes periodic coupon payments and loss payouts. The credit event monitor agent validates and provides notifications of credit events.
The ALM unit performs a different role, acting as deposit taker for funds collected from the credit protection provider. Deposits collected enhance the liquidity position of the Group and eliminate counterparty risk for deals where the Group is the protection buyer.
The securitised assets consist of commercial loans and trade finance facilities extended by the Group’s branches and subsidiaries to borrowers mainly from the emerging markets of Asia, Africa and Middle East. The securitised assets are subject to changes in general economic conditions, performance of relevant financial markets, political events and developments or trends in a particular industry. Historically, the trading volume of loans in these emerging markets has been small relative to other more developed debt markets due to limited liquidity in the secondary loan market.
Underlying securitised exposures are originated by the Group in its ordinary course of business. Given the synthetic nature of securitisations originated by WBPM, the securitised assets remain on the Group’s balance sheet and continue to be subject to the Group’s credit review and monitoring process and risk methodology. Accordingly retained positions are not hedged.
In its role as credit event monitor agent, WBPM monitors the credit risk of the underlying securitised assets by leveraging on the Group’s client and risk management system.
As of 31 December 2012 $79 million of Trade Finance and $3 million of Commercial Loans totalling $82 million (2011: $56 million) of securitised exposures were classified as impaired and past due.
The Group has eleven synthetic securitisation transactions originated and managed by WBPM, with an aggregate hedge capacity of $22.1 billion (2011: $19.3 billion). Of the eleven transactions, seven are private deals with bilateral investors and four are public deals distributed to a broad spectrum of investors. The Group originated four synthetic securitisations in 2012 with an aggregate hedge capacity of up to $7.8 billion. Of the $7.8 billion newly originated capacity, $5.0 billion of synthetic securitisations were originated to replace maturing transactions and the remaining $2.8 billion was new capacity. All eleven transactions are structured as non-disclosed pools for reason of client confidentiality.
WBPM as the originator has not acted as sponsor to securitise third-party exposure and does not manage or advise any third-party entity that invests in the securitisation positions. Table 27 below provides details of current securitisation programmes originated and managed by the Group.

Standard Chartered PLC
Pillar 3 Disclosures
44
3.10. Securitisation continuedTable 27: Securitisation programmes (as originator)
2012
Underlying facilities hedged ECAI Public/Private Start dateScheduled maturity
Maximum notional$million
Retained exposures1
$million
Outstanding exposures2
$million
SUPRA TF Trade Finance Not Rated Private Apr 2010 Oct 2013 850 799 820Start VI Commercial Loan Not Rated Public Nov 2010 Apr 2014 1,250 1,162 1,135Mana III Trade Finance Moody’s Private Dec 2012 Jun 2014 3,500 3,290 3,256Sumeru Commercial Loan Not Rated Private Jun 2010 Sep 2014 3,296 3,041 2,903Sealane II Trade Finance Moody’s Public Aug 2011 Feb 2015 3,000 2,820 2,826Shangren II Trade Finance Moody’s Private Dec 2011 Mar 2015 2,500 2,325 2,311Pamir Trade Finance Moody’s Private Oct 2011 Apr 2015 1,500 1,410 1,398Start VII Commercial Loan Moody’s Public Dec 2011 Jun 2015 2,000 1,860 1,867Pumori Commercial Loan Moody’s Private Mar 2012 Sep 2015 1,250 1,162 1,162Oryza 1 Commercial Loan Moody’s Private Jun 2012 Dec 2015 1,500 1,395 1,353Start VIII Commercial Loan Moody’s Public Nov 2012 May 2016 1,500 1,395 1,361
Total 22,146 20,659 20,392
During the year the following securitisation programmes were originated: Mana III, Start VIII (replaced Mana II and Asiamea respectively), Pumori and Oryza 1.
2011
Underlying facilities hedged ECAI Public/Private Start dateScheduled maturity
Maximum notional$million
Retained exposures1
$million
Outstanding exposures2
$million
Asiamea Commercial Loan Not Rated Private Dec 2007 Dec 2012 1,500 1,399 1,248Mana II Trade Finance Moody’s Private Nov 2011 Feb 2013 3,500 3,290 3,288SUPRA TF Trade Finance Not Rated Private Apr 2010 Oct 2013 850 799 812Start VI Commercial Loan Not Rated Public Nov 2010 Apr 2014 1,250 1,162 1,127Sumeru Commercial Loan Not Rated Private Jun 2010 Sep 2014 3,246 2,995 2,966Sealane II Trade Finance Moody’s Public Aug 2011 Feb 2015 3,000 2,820 2,732Shangren II Trade Finance Moody’s Private Dec 2011 Mar 2015 2,500 2,325 2,235Pamir Trade Finance Moody’s Private Oct 2011 Apr 2015 1,500 1,410 1,370Start VII Commercial Loan Moody’s Public Dec 2011 Jun 2015 2,000 1,860 1,748Total 19,346 18,060 17,526
1 Exposures that have not been sold to investors but have been retained by the Group.2 Underlying exposures that have been securitised in the programmes.

Standard Chartered PLC
Pillar 3 Disclosures
45
3.10. Securitisation continuedTable 28: Securitisation programmes - capital requirement
Table 28 below provides details of the capital requirement for securitisation programmes that have been originated by the Group.
2012
Underlying facilities hedged Start dateScheduled maturity
Maximum notional$million
Capital Requirement before securitisation
$million
Capital Requirementafter securitisation1
$million
SUPRA TF Trade Finance Apr 2010 Oct 2013 850 37 13Start VI Commercial Loan Nov 2010 Apr 2014 1,250 79 23Mana III Trade Finance Dec 2012 Jun 2014 3,500 178 55Sumeru Commercial Loan Jun 2010 Sep 2014 3,296 198 78Sealane II Trade Finance Aug 2011 Feb 2015 3,000 158 57Shangren II Trade Finance Dec 2011 Mar 2015 2,500 130 22Pamir Trade Finance Oct 2011 Apr 2015 1,500 85 29Start VII Commercial Loan Dec 2011 Jun 2015 2,000 132 42Pumori Commercial Loan Mar 2012 Sep 2015 1,250 87 27Oryza 1 Commercial Loan Jun 2012 Dec 2015 1,500 105 33Start VIII Commercial Loan Nov 2012 May 2016 1,500 95 33
Total 22,146 1,284 4121 Capital requirement after securitisation includes $69 million capital retained due to currency and collateral haircuts.
2011
Underlying facilities hedged Start date Scheduled maturity
Maximum notional$million
Capital Requirement before securitisation
$million
Capital Requirementafter securitisation1
$million
Asiamea Commercial Loan Dec 2007 Dec 2012 1,500 84 48Mana II Trade Finance Dec 2012 Jun 2014 3,500 182 51SUPRA TF Trade Finance Apr 2010 Oct 2013 850 35 13Start VI Commercial Loan Nov 2010 Apr 2014 1,250 77 24Sumeru Commercial Loan Jun 2010 Sep 2014 3,246 189 76Sealane II Trade Finance Aug 2011 Feb 2015 3,000 155 57Shangren II Trade Finance Dec 2011 Mar 2015 2,500 124 23Pamir Trade Finance Oct 2011 Apr 2015 1,500 77 29Start VII Commercial Loan Dec 2011 Jun 2015 2,000 123 43 Total 19,346 1,046 364
1 Capital requirement after securitisation includes $77 million capital retained due to currency and collateral haircuts, and future premium payments.

Standard Chartered PLC
Pillar 3 Disclosures
46
3.10. Securitisation continuedThe Group has engaged in structures such as the ones outlined in the tables above in order to transfer credit risk of a pool of assets to a third party via credit derivatives.
Typically, these synthetic securitisation transactions are facilitated through entities which are considered to be SPEs for accounting purposes.
In these transactions, the underlying assets are not sold into the relevant SPE. Instead, the credit risk of the underlying assets is transferred to the SPEs synthetically via credit default swaps whereby the SPEs act as sellers of credit protection and receive premiums paid by the Group in return. The SPEs in turn issue credit-linked notes to third party investors who fund the credit protection in exchange for coupon on the notes purchased. The premium received by the SPEs and interest earned on the funded amount of the purchased notes are passed through to the third party investors as coupon on the purchased notes. Payment to the third party investors is made in accordance with the priority of payments stipulated in the transaction documents.
For all transactions except Mana III, notes were issued by SPEs. For the Mana III transaction, notes were issued directly by Standard Chartered Bank under its Structured Product Programme.
AccountingThe SPEs associated with the programmes above are not consolidated into the Group. SPEs are only consolidated when the Group has control of the SPE. Control is assessed based on the Group’s exposure to the majority of the risks of the SPE and the right to obtain the majority of the benefits of the SPE. The assessment of risks and benefits is based on the assessed risk exposures at inception and these risks and benefits are re-considered if and when circumstances change. These circumstances may include situations when the Group acquires additional interests in the SPE, or the Group acquires control of the financial and operating policies of the SPE.
In the synthetic securitisation transactions such as those listed above, the underlying assets are not transferred into the associated SPE. Since the Group continues to own or hold all of the risks and returns relating to these assets and the credit protection afforded by the synthetic securitisation only serves to protect the Group against losses upon the occurrence of certain credit events, the assets are not de-recognised from the Group balance sheet. The assets will be fully de-recognised from the Group balance sheet if all the risks and returns relating to the assets have been transferred to the relevant SPE, and this typically entails a true sale of the assets to the SPE. Alternatively, the assets can be partially de-recognised from the Group balance sheet if a significant portion of risks and returns relating to the assets are transferred to the SPE and only a portion of the assets that is commensurate with the retained risk and return of the assets is recognised on the Group balance sheet.
Retained notes are initially valued at cost and subsequently determined using market price quotations where available, or in their absence, dealer quotes. The assumptions used for valuation are based on observable transactions in similar securities and are verified by external pricing sources, where available.
Governance of securitisation activities Securitisation transactions proposed for funding and capital management must first obtain support from the respective Balance Sheet Committee (BSC), which manages the capital requirements of the business, before going to Group Capital Management Committee (GCMC) for final approval and Liquidity Management Committee (LMC) for noting.
Execution of each securitisation transaction must either be under an individual Transaction Programme Authorisation or Product Program Framework; such that all relevant support, control and risk functions are involved in the transaction. Specifically, Compliance covers issues like confidentiality of clients’ information and insider information, Group Tax provides an opinion on taxation, and Finance advises on the accounting and regulatory treatment and facilitates communication with the regulator.
Basel II for securitisation positionsThe calculation of risk-weighted exposure amounts for securitisation positions is based on the following two calculation methods advised by the FSA:
• IRB method for third party senior securitisation positions bought and securitisation positions originated and retained by the Group (including haircuts due to currency and collateral mismatch); and
• Standardised Approach for the residual risk-weighted exposure amounts for all other securitisation positions originated by the Group and sold.
All existing securitisation transactions originated by the Group, in the table above, meet the credit risk transfer requirement to be accounted for as securitisations under the Basel II regulatory capital regime.
The table below presents a summary of the securitisation positions retained and the carrying value of ABS purchased or arranged by the Group, analysed by risk weight band and geographical breakdown. The majority of the exposures are rated AAA.

Standard Chartered PLC
Pillar 3 Disclosures
47
3.10. Securitisation continued
Table 29: Securitisation programmes by risk weight
2012
Regulatory capital requirement
Securitisation programmes1 ABS Total
Securitisation programmes1 ABS2 Total
Risk weight bands $million $million $million $million $million $million
0% – 20% 19,498 3,814 23,312 121 25 146 20% – 40% 593 375 968 18 23 41 40% – 60% 312 34 346 13 5 18 60% – 80% - 162 162 - 2 2 100% and above 70 88 158 6 9 15 Deducted from regulatory capital 186 46 232 - - -
Total 20,659 4,519 25,178 158 64 222
2011
Regulatory capital requirement
Securitisation programmes1 ABS Total
Securitisation programmes1 ABS2 Total
Risk weight bands $million $million $million $million $million $million
0% – 20% 17,315 1,275 18,590 106 4 99 20% – 40% 387 313 700 12 13 21 40% – 60% 100 260 360 4 2 13 60% – 80% 70 78 148 4 4 12 80% – 100% - 46 46 - 18 28 100% and above 26 89 115 3 10 3 Deducted from regulatory capital 162 35 197 - - -
Total 18,060 2,096 20,156 129 51 176 1 Retained exposures that are included in the securitisation programmes originated by the Group and have not been sold to investors.2 ABS regulatory capital requirement excludes securitisation positions held in the trading book, which attract a market risk capital
requirement of $3 million (2011: $2 million).
Table 30: Securitisation programmes by region
2012 2011
Securitisation programmes1 ABS Total
Securitisation programmes1 ABS Total
$million $million $million $million $million $million
Hong Kong 2,949 - 2,949 3,430 - 3,430 Singapore 1,508 - 1,508 1,258 14 1,272 Korea 1,649 606 2,255 1,154 455 1,609 Other Asia Pacific 5,169 298 5,467 4,395 48 4,443 India 2,768 - 2,768 2,767 - 2,767 Middle East & Other S Asia 3,539 296 3,835 3,096 280 3,376 Africa 1,382 - 1,382 806 6 812 Americas, UK & Europe 3,182 3,319 6,501 2,421 1,293 3,714
Total 22,146 4,519 26,665 19,327 2,096 21,423 1 In the table above securitisation programmes presents the maximum notional of the securitised exposures by geography. The securitised
exposures in 2011 are $19 million lower than the maximum notional (as presented in Table 28), due to Asiamea which was not replenished to the maximum notional.

Standard Chartered PLC
Pillar 3 Disclosures
48
4. Market riskStandard Chartered recognises market risk as the potential for loss of earnings or economic value due to adverse changes in financial market rates or prices. The Group is exposed to market risk arising principally from customer-driven transactions. The objective of the Group’s market risk policies and processes is to achieve the optimal balance of risk and return while meeting customers’ requirements.
The primary categories of market risk for Standard Chartered are:
• interest rate risk: arising from changes in yield curves, credit spreads and implied volatilities on interest rate options;
• equity price risk: arising from changes in the prices of equities, equity indices, equity baskets and implied volatilities on related options;
• commodity price risk: arising from changes in commodity prices and commodity option implied volatilities; covering energy, precious metals, base metals and agriculture; and
• currency exchange rate risk: arising from changes in exchange rates and implied volatilities on foreign exchange options;
Market risk regulatory capitalThe FSA specifies minimum capital requirements against market risk in the trading book. Interest rate risk in the non-trading book is covered separately under the Pillar 2 framework. The FSA has granted the Group Capital Adequacy Directive 2 (CAD2) internal model approval covering the majority of interest rate, foreign exchange, precious metals, base metals, energy and agriculture market risk in the trading book. In 2012 the CAD2 scope was extended to include coal market risk in the trading book. CRD 3 introduced the Stressed VaR model at the end of December 2011. Positions outside the CAD2 scope are assessed according to standard FSA rules.
At 31 December 2012 the Group’s market risk regulatory capital requirement was $1,956 million (31 December 2011: $1,708 million). The increase was driven by the introduction of CRD 3 in December 2011 together with position changes in 2012, and an increase in the Equity capital requirements due to the growth of the Equity business.
Valuation frameworkProducts may only be traded subject to a formally approved Product Programme which identifies the risks, controls and regulatory treatment. The control framework is assessed by the relevant Group functions as well as Group Internal Audit (GIA) on an ongoing basis.
Valuation of financial assets and liabilities held at fair value is subject to an independent review by Valuation Control within the Finance function. For those financial assets and liabilities whose fair value is determined by reference to externally quoted prices or market observable pricing inputs or to a valuation model, an assessment is made by Valuation Control against external market data and consensus services. Valuation Control also ensures adherence to the valuation adjustment policies to incorporate bid/ask spreads, model risk and other reserves, and, where appropriate, to mark all positions in accordance with prevailing accounting and regulatory guidelines.
The Financial Markets Valuation Committee, a sub-committee of the Group Market Risk Committee, provides oversight and governance of all Financial Markets valuation adjustment and price testing policies and reviews the results of the valuation control process on a monthly basis.
Our approach to market risk can be found on pages 99 to 102 of the Risk review in the 2012 Annual Report and Accounts. This includes tables which show the average, high and low trading and non-trading VaR over the year 2012, and 31 December 2012 actual position on page 100. Market risk VaR coverage and Group Treasury market risk, including the table which shows Group Treasury Net Interest Income (NII) sensitivity to parallel shifts in yield curves can be found on page 101.
The minimum regulatory market risk capital requirements for the trading book are presented below for the Group.
Table 31: Market risk capital requirement
2012 2011
Regulatory capital
requirement
Risk Weighted
Assets
Regulatory capital
requirement
Risk Weighted
Assets
Market risk capital requirements for trading book $million $million $million $million
Interest rate1 431 5,388 404 5,054 Equity 159 1,987 86 1,073 Options 451 5,625 414 5,183 Commodity2 3 50 36 445 Foreign exchange2 168 2,100 98 1,220 Internal Models Approach3 744 9,300 670 8,379
Total 1,956 24,450 1,708 21,354 1 Securitisation positions contributed $2.3 million to the interest rate position risk requirement (PRR) and $28.8 million to interest rate RWA
as at 31 December 2012.2 Commodity and foreign exchange cover non-trading book as well as trading book.3 Where the risks are not within the approved scope of the internal models approach, they are captured in the relevant category above
based on the Standardised Approach.

Standard Chartered PLC
Pillar 3 Disclosures
49
4. Market risk continuedThe minimum regulatory market risk capital requirement for the trading book is presented below for the Group’s significant subsidiaries in accordance with local regulatory requirements applicable in the countries in which they are incorporated.
Table 32: Market risk capital requirement for significant subsidiaries
2012 2011
Standard Chartered
Bank
Standard Chartered
Bank (HK) Ltd
Standard Chartered
Bank Korea Ltd
Standard Chartered
Bank
Standard Chartered
Bank (HK) Ltd
Standard Chartered
Bank Korea Ltd
Market Risk Capital Requirements for Trading Book $million $million $million $million $million $million
Local Regulator FSA HKMA FSS FSA HKMA FSS
Interest rate1 371 122 3 322 112 4 Equity 159 29 13 86 - 5 Options 451 - - 412 - - Commodity2 3 4 - 36 - - Foreign exchange2 156 10 - 130 19 - Internal Models Approach3 707 9 127 670 9 23
Total 1,847 174 143 1,656 140 32
Market Risk – RWA 23,092 2,173 1,791 20,695 1,750 400 1 For Standard Chartered Bank securitisation positions contributed $2.3 million to the interest rate Position Risk Requirement (PRR) and
$28.8 million to Interest rate RWA as at 31 December 2012.2 Commodity and foreign exchange cover non-trading book as well as trading book.3 Where the risks are not within the approved scope of the internal models approach, they are captured in the relevant category above
based on the Standardised Approach.
Internal Models Approach – Stressed VaR The table below shows the average, high and low Stressed VaR for the period January 2012 to December 2012 and the actual position on 31 December 2012. The Stressed VaR results reflect only the Group portfolio covered by the internal model approach and are calculated at a 99 per cent confidence level.
Table 33: Stressed VaR
January to December 2012 October to December 2011
Average High1 Low1 Actual2 Average High1 Low1 Actual2
$million $million $million $million $million $million $million $million
Stressed VaR 38.5 67.4 22.2 38.5 32.8 42.9 24.1 30.6 1 Highest and lowest VaR for each risk factor are independent and usually occur on different days. 2 Actual one day VaR as at period end date.

Standard Chartered PLC
Pillar 3 Disclosures
50
5. Operational riskMeasurementThe Group uses the Standardised Approach consistent with the FSA’s BIPRU 6.4 requirements to assess its regulatory and internal capital requirements for operational risk. Under the Standardised Approach, a pre-determined beta co-efficient is applied to the average income for the previous three years
across each of the eight business lines prescribed in FSA’s BIPRU, to determine the operational risk capital requirement. Our approach to the management of operational risk can be found on pages 111 and 112 in the Risk review of the 2012 Annual Report and Accounts. The table below details the operational risk capital requirement for the Group:
Table 34: Operational risk capital requirement by business2012 2011
Operational risk capital
requirement
Operational risk capital
requirement
$million $million
Consumer Banking 753 744 Wholesale Banking 1,708 1,557
Total 2,461 2,301
The increase in operational risk capital requirements reflects the strong performance of the Group over the period. The table below details the operational risk capital requirement for the Group’s significant subsidiaries presented in accordance with the regulatory requirements applicable in the countries in which they are incorporated.
Table 35: Operational risk capital requirement for significant subsidiaries
2012 2011
Operational risk capital
requirement
Operational risk capital
requirement
Subsidiary Local Regulators $million $million
Standard Chartered Bank FSA 1,403 1,259 Standard Chartered Bank (HK) Ltd HKMA 394 355 Standard Chartered Bank Korea Ltd FSS 241 237

Standard Chartered PLC
Pillar 3 Disclosures
51
6. RemunerationThe following tables show the remuneration decisions made by the Group in respect of 2012 and the subsequent sections provide brief information on the decision-making policies for remuneration and the links between pay and performance. More detailed information on the Group’s performance and reward philosophy, process and policies is contained in the
Directors’ remuneration report (DRR) of the 2012 Annual Report and Accounts, which can be found on pages 160 to 185.
These disclosures reflect the requirements of the Financial Services Authority (FSA) Prudential sourcebook for Banks, Building Societies and Investment Firms (BIPRU) 11.5.18 (1) - (7).
Table 36: Code staff employees remuneration by businessConsumer
BankingWholesale
Banking Other2
Aggregate remuneration expenditure for Code Staff1 $000's $000's $000's
2012 18,566 119,088 88,398 2011 18,676 124,759 97,479
1 Code staff are those Group employees whose professional activities could have a material impact on the Group’s risk profile. Further information is shown below.
2 Includes all support functions and general management positions, executive and non-executive directors.
Table 37: Code staff employees remuneration by fixed/variable compensation
2012 2011
Senior Management4
Other Code Staff Employees
Senior Management4
Other Code Staff EmployeesAnalysis of remuneration for Code Staff employees
between fixed and variable compensation $000's $000's $000's $000's
Fixed compensation1 44,195 14,808 41,357 14,794 Variable compensation 110,411 56,638 112,816 71,946 Up front cash 20,287 12,150 21,041 15,691 Up front shares 20,065 11,650 20,095 14,208 Deferred awards2 45,540 27,936 46,816 35,713 Performance shares3 24,519 4,902 24,864 6,334
Number of code staff 78 35 77 35 1 Fixed compensation includes base salary and other cash allowances, and in the case of non-executive directors, any fees.2 Includes any element of deferred cash for senior management (2012: $11,580,392 and 2011: $8,537,280) and other code staff employees
(2012: $10,180,340 and 2011: $14,172,362).3 Includes the expected value of any performance shares to be granted in respect of 2011 and 2012 performance respectively. 4 Senior Management is defined below in the section on Code Staff on page 52.
Table 38: Deferred remuneration
2012 2011
Senior Management
Other Code Staff Employees
Senior Management
Other Code Staff Employees
Analysis of deferred remuneration1 $000's $000's $000's $000's
Start of the year (1 January) 219,377 79,114 254,916 110,869 Awarded during the financial year2 111,177 42,982 84,928 46,417 Vested during the year3 109,106 43,351 67,547 38,171 Non vested due to performance adjustments4 17,147 433 7,480 123 Close of the year (31 December)5 239,659 86,242 223,718 101,155
1 Deferred remuneration includes both deferred awards and performance shares. Code staff populations in 2011 and 2012 differ.2 Value of deferred remuneration awarded during the year is based on the share price at grant.3 Value of vested deferred remuneration during the year is based on the share price as at 31 December in that year. 4 Value of deferred remuneration which has lapsed as a result of (i) performance conditions not being satisfied or (ii) claw-back.5 Value of deferred remuneration as at 31 December is based on the share price at the respective dates in that year.
Table 39: Significant payments and severance
2012 2011
Senior Management
Other Code Staff Employees
Senior Management
Other Code Staff Employees
Analysis of sign-on payments and severance $000's $000's $000's $000's
Sign-on payments1 1,632 4,800 700 -Severance payments2 - 396 381 -
1 Includes the value of any guaranteed performance awards (cash or shares) which were made on appointment. In 2012 and 2011 there were two and one employee(s) respectively.
2 In 2012 and in 2011 this relates to one employee respectively.

Standard Chartered PLC
Pillar 3 Disclosures
52
6. Remuneration continuedGovernance and alignment to regulatory best practiceThe Board Remuneration Committee (the Committee) has oversight of all reward policies for the Group’s employees. It is responsible for setting the principles and governance framework for all compensation decisions. The DRR in the 2012 Annual Report and Accounts provides more information on the Committee’s role and focus, details of which can be found on pages 160 to 185.
The Committee’s terms of reference are available at www.standardchartered.com
To ensure there is appropriate, formal input to the decision making process there are a number of business specific Reward Plan Committees (RPCs) responsible for making sure that information from the risk, compliance and human resources functions are taken into account. The accuracy of the finance data used in the decision making process is overseen by risk and finance representatives jointly.
Decisions on reward for control function employees are determined independently of the business and they do not personally participate in any business specific plan to maintain independence.
The Group Reward Plan Committee (GRPC), which includes the Group Chief Executive, the Group Finance Director, the Group Head of Human Resources and Communications and the Group Chief Risk Officer (GCRO), oversees each of the business specific RPCs to ensure consistency across the Group. The GRPC ensures compensation decision making is in accordance with the Group’s established performance and reward strategy and acts as a link to the Committee, providing feedback to the other RPCs as necessary.
Aligning performance and reward The Group’s One Bank philosophy and approach to remuneration applies consistently to all employees including Code Staff and is central to the Group’s performance and reward philosophy. This ensures that behaviours, including prudent risk management and values are rewarded as well as business performance. The Group believes that performance and related reward outcomes should be a consequence of both how performance is delivered and what is delivered. This is taken into account in all personal objectives, performance assessments and reward decisions made within the Group and has a tangible impact on the reward that employees receive.
All employees have the opportunity to receive an element of performance-related compensation, subject to their contractual entitlement. Typically, the higher the total compensation, the greater the proportion delivered in variable compensation (through a mix of cash and shares, both upfront and deferred, depending on the individual and quantum of the award).
The variable compensation element is differentiated by performance. The Group’s aim is to achieve a high performance culture in which every employee has a clear set of objectives, receives ongoing feedback on performance and behaviour and is appropriately rewarded for their individual contribution. Differentiating performance and values ratings at all levels enables targeting of spend towards those who have made the most effective contribution to the Group’s performance and unique culture, recognises and aids retention of the Group’s highest performers and balances this with affordability considerations. There is no direct formulaic link between business income generated by an individual and that individual’s reward.
Understanding the Code Staff criteriaThe following groups of employees have been identified as meeting the FSA’s criteria for Code Staff:
• Employees performing a Significant Influence Function (SIF) within the Group;
• Senior managers. In accordance with the FSA Remuneration Code this includes direct reports to a director of Standard Chartered Bank (the regulated entity) who are the head of a significant business function or business group with Risk and/or profit and loss accountability and not previously classified as SIF;
• Other staff identified as risk takers.
The combination of the first two categories above are referred to in this report as “senior management”.
Per the FSA’s definition, “risk takers”, are those whose professional activities are deemed to have a potentially material impact on the firm’s risk profile, and are drawn from the following areas:
• Heads of material support or control functions (not already classified as senior managers or SIFs);
• Heads of significant Corporate Finance (CF) and Financial Markets (FM) units (this includes all product sales or trading businesses) and who sit on the CF or FM leadership teams;
• Other designated risk professionals not otherwise covered above;
• Other designated Wholesale Banking employees not otherwise covered above.
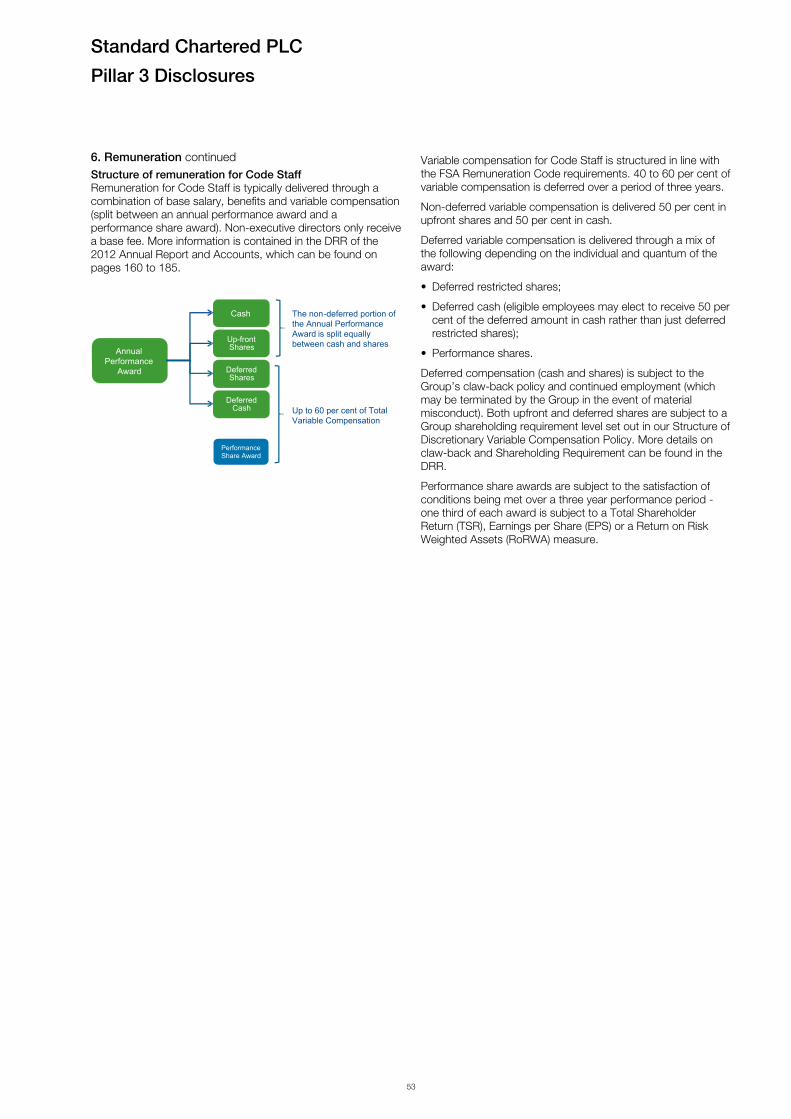
Standard Chartered PLC
Pillar 3 Disclosures
53
6. Remuneration continuedStructure of remuneration for Code StaffRemuneration for Code Staff is typically delivered through a combination of base salary, benefits and variable compensation (split between an annual performance award and a performance share award). Non-executive directors only receive a base fee. More information is contained in the DRR of the 2012 Annual Report and Accounts, which can be found on pages 160 to 185.
Variable compensation for Code Staff is structured in line with the FSA Remuneration Code requirements. 40 to 60 per cent of variable compensation is deferred over a period of three years.
Non-deferred variable compensation is delivered 50 per cent in upfront shares and 50 per cent in cash.
Deferred variable compensation is delivered through a mix of the following depending on the individual and quantum of the award:
• Deferred restricted shares;
• Deferred cash (eligible employees may elect to receive 50 per cent of the deferred amount in cash rather than just deferred restricted shares);
• Performance shares.
Deferred compensation (cash and shares) is subject to the Group’s claw-back policy and continued employment (which may be terminated by the Group in the event of material misconduct). Both upfront and deferred shares are subject to a Group shareholding requirement level set out in our Structure of Discretionary Variable Compensation Policy. More details on claw-back and Shareholding Requirement can be found in the DRR.
Performance share awards are subject to the satisfaction of conditions being met over a three year performance period - one third of each award is subject to a Total Shareholder Return (TSR), Earnings per Share (EPS) or a Return on Risk Weighted Assets (RoRWA) measure.
The non-deferred portion of the Annual Performance Award is split equally between cash and shares
Annual Performance
Award Deferred Shares
Performance Share Award
Up-front Shares
Cash
Deferred Cash Up to 60 per cent of Total
Variable Compensation

Standard Chartered PLC
Pillar 3 Disclosures
54
7. Immaterial portfoliosNon Trading Book Equities & Specialised Lending ExposuresFor the purposes of BIPRU requirements 11.5.15 and 11.5.11 the holdings of non-trading book equities and the specialised lending portfolio are considered immaterial. At 31 December
2012, non-trading book equity holdings amount to $4.3 billion (2011: $3.1 billion) and specialised lending exposure total $3.3 billion (2011: $3.9 billion), which together total less than two per cent of the Group’s total exposure after credit risk mitigation. The 2011 non-trading book equity holdings have been restated to include the Group’s strategic equity investments.
8. Forward looking statementsIt is possible that this document could or may contain forward-looking statements that are based on current expectations or beliefs, as well as assumptions about future events. These forward-looking statements can be identified by the fact that they do not relate only to historical or current facts. Forward-looking statements often use words such as anticipate, target, expect, estimate, intend, plan, goal, believe, will, may, should, would, could or other words of similar meaning. Undue reliance should not be placed on any such statements because, by their very nature, they are subject to known and unknown risks and uncertainties and can be affected by other factors that could cause actual results, and the Group’s plans and objectives, to differ materially from those expressed or implied in the forward-looking statements.
There are several factors that could cause actual results to differ materially from those expressed or implied in forward looking statements. Among the factors that could cause actual results to differ materially from those described in the forward looking statements are changes in the global, political, economic, business, competitive, market and regulatory forces, future exchange and interest rates, changes in tax rates and future business combinations or dispositions.
The Group undertakes no obligation to revise or update any forward looking statement contained within this document, regardless of whether those statements are affected as a result of new information, future events or otherwise.
There remains significant uncertainty surrounding both the final rules and definitions in CRD IV and the implementation dates and timing of transitional periods in Europe. Consequently, the CRD IV transitional capital (own funds) position presented in this disclosure could lack precision and change significantly following the final rules and definitions being published. The amounts subject to transitional arrangements do not take account of management actions during the period, such as the accretion of profits and the issuance of eligible regulatory capital. The CRD IV position presented here does not constitute either the likely outcome or a capital forecast.
The Group is committed to a transparent and open disclosure. However, in the case of the leverage ratio that we are being required to disclose, this is difficult to achieve given the evolving nature of this new requirement, the significant uncertainty that its early disclosure presents, the potential for changes in definitions and calibration and its disregard for the impact of any earnings accretion and other management actions over the transitional period. As such, whilst we are required to disclose a leverage ratio by the FPC, we would recommend that this published leverage ratio be treated with a high degree of caution.

Standard Chartered PLC
Pillar 3 Disclosures
55
9. Acronyms
ABS Asset Backed SecuritiesALM Asset and Liability ManagementARROW Advanced Risk Response Operating FrameworkAT1 Additional Tier 1BCBS Basel Committee on Banking SupervisionBSC Balance Sheet CommitteeBIPRU Prudential sourcebook for Banks, Building Societies and Investment FirmsBRC Board Risk CommitteeCAD2 Capital Adequacy Directive 2CCF Credit Conversion FactorCCR Counterparty Credit RiskCDOs Collateralised Debt ObligationsCET1 Common Equity Tier 1CMBS Commercial Mortgage Backed SecuritiesCRD Capital Requirements DirectiveCRM Credit Risk MitigationCRO Chief Risk OfficerCSA Credit Support AnnexCVA Credit Valuation AdjustmentDRR Directors Remuneration ReportDVA Debit Valuation AdjustmentEAD Exposure at DefaultEBA European Banking AuthorityECAI External Credit Assessment InstitutionsEDTF Enhanced Disclosures Task ForceFCA Financial Conduct AuthorityFPC Financial Policy CommitteeFSA Financial Services Authority (UK)FSS Financial Supervisory Service (South Korea)GALCO Group Asset and Liability CommitteeGCMC Group Capital Management CommitteeGCRO Group Chief Risk OfficerGENPRU General Prudential sourcebook for Banks, Building Societies, Insurers, and Investment FirmsGIA Group Internal AuditGRC Group Risk CommitteeGRPC Group Reward Plan CommitteeHKMA Hong Kong Monetary AuthorityIAS International Accounting StandardIASB International Accounting Standards BoardICAAP Internal Capital Adequacy Assessment ProcessICG Individual Capital GuidanceIRB advanced Internal Ratings Based approachesIFRS International Financial Reporting StandardsLGD Loss Given DefaultLMC Liquidity Management CommitteeMAC Model Assessment CommitteeMTM Mark-to-MarketNII Net Interest IncomePD Probability of DefaultPIP Portfolio Impairment ProvisionPRA Prudential Regulation AuthorityPRR Position Risk RequirementPVA Prudent Valuation AdjustmentRMBS Residential Mortgage Backed SecuritiesRPC Reward Plan CommitteeRWA Risk Weighted AssetsSIF Significant Influence FunctionSME Small and Medium - sized EnterpriseSPE Special Purpose EntitySREP Supervisory Review and Evaluation ProcessWBPM Wholesale Banking Portfolio ManagementVaR Value at Risk

Standard Chartered PLC
Pillar 3 Disclosures
56
Glossary
Advanced Internal Rating Based (IRB) approach
The advanced IRB approach under the Basel II framework is used to calculate credit risk capital based on the Group’s own estimates of certain parameters.
Arrears A debt or other financial obligation is considered to be in a state of arrears when payments are overdue. Loans and advances are considered to be delinquent when consecutive payments are missed. Also known as ‘delinquency’.
Asset Backed Securities (ABS) Securities that represent an interest in an underlying pool of referenced assets. The referenced pool can comprise any assets which attract a set of associated cash flows but are commonly pools of residential or commercial mortgages and in the case of Collateralised Debt Obligations (CDOs), the reference pool may be ABS.
Attributable profit to ordinary shareholders
Profit for the year after non-controlling interests and the declaration of dividends on preference shares classified as equity.
Basel II The capital adequacy framework issued by the Basel Committee on Banking Supervision (BCBS) in June 2006 in the form of the ‘International Convergence of Capital Measurement and Capital Standards’.
Basel 2.5 In 2009 the European Commission proposed further changes to the CRD (CRD3) to address the lessons of the financial crisis. These changes reflected international developments and follow the agreements reached by the Basel Committee on Banking Supervision (BCBS). They included higher capital requirements for re-securitisations, upgrading disclosure standards for securitisation exposures and strengthening market risk capital requirements.
Basel III In December 2010, the BCBS issued the Basel III rules text, which were updated in June 2011, and represents the details of strengthened global regulatory standards on bank capital adequacy and liquidity. The new requirements were to be phased starting on 1 January 2013 with full implementation expected by the 1 January 2019, although the implementation date in Europe under CRD IV has been delayed.
Credit Conversion Factor (CCF) CCF is an internally modelled parameter based on historical experience to determine the amount that is expected to be further drawn down from the undrawn portion in a committed facility.
Common equity tier 1 capital Common Equity Tier 1 capital consists of the common shares issued by the bank and related share premium, retained earnings, accumulated other comprehensive income and other disclosed reserves, eligible non-controlling interests and regulatory adjustments required in the calculation of Common Equity Tier 1.
Core Tier 1 capital Core Tier 1 capital comprises called-up ordinary share capital and eligible reserves plus non-controlling interests, less goodwill and other intangible assets and deductions relating to excess expected losses over eligible provisions and securitisation positions as specified by the UK’s Financial Services Authority (FSA).
Core Tier 1 ratio Core Tier 1 capital as a percentage of risk weighted assets.
CRD 3 See Basel 2.5.
CRD IV Represents the Capital Requirements Directive (CRD) and Capital Requirements Regulation (CRR) that implement the Basel III proposals in Europe.
Credit quality step Credit Quality Steps (CQS) are used to derive the risk-weight to be applied to exposures treated under the Standardised approach to credit risk.
Credit risk Credit risk is the potential for loss due to the failure of a counterparty to meet its obligations to pay the Group in accordance with agreed terms. Credit exposures may arise from both the banking and trading books.
Credit risk mitigation (CRM) Credit risk mitigation is a process to mitigate potential credit losses from any given account, customer or portfolio by using a range of tools such as collateral, netting agreements, credit insurance, credit derivatives and other guarantees.
Credit Valuation Adjustment (CVA)
Under Basel III proposals, the Group would be required to hold additional regulatory capital in respect of mark to market losses associated with derivative transactions.
Debit Valuation Adjustment (DVA)
Adjustments required to Tier 1 capital to derecognise any unrealised fair value gains and losses associated with fair valued liabilities that are attributable to the market’s perception of the Group’s credit worthiness.
Expected Loss (EL) The Group measure of anticipated loss for exposures captured under an internal ratings based credit risk approach for capital adequacy calculations. It is measured as the Group-modelled view of anticipated loss based on Probability of Default (PD), Loss Given Default (LGD) and Exposure at Default (EAD), with a one-year time horizon.
Exposure Credit exposures represent the amount lent to a customer, together with any undrawn commitment.

Standard Chartered PLC
Pillar 3 Disclosures
57
Glossary continued
Exposure at Default (EAD) The estimation of the extent to which the Group may be exposed to a customer or counterparty in the event of, and at the time of, that counterparty’s default. At default, the customer may not have drawn the loan fully or may already have repaid some of the principal, so that exposure is typically less than the approved loan limit.
External Credit Assessment Institutions (ECAI)
For the Standardised Approach to credit risk for sovereigns, corporates and institutions, external ratings are used to assign risk weights. These external ratings must come from FSA approved rating agencies, known as External Credit Assessment Institutions (ECAI); namely Moody’s, Standard & Poor’s and Fitch.
Fair value The value of an asset or liability when it is transacted on an arm’s length basis between knowledgeable and willing parties.
Foundation Internal Ratings Based (Foundation IRB) Approach
A method of calculating credit risk capital requirements using internal PD models but with supervisory estimates of LGD and conversion factors for the calculation of EAD.
Free delivery When a bank takes receipt of a debt or equity security, a commodity or foreign exchange without making payment, or where a bank delivers a debt or equity security, a commodity or foreign exchange without receiving payment.
Haircut A haircut, or volatility adjustment, ensures the value of exposures and collateral are adjusted to account for the volatility caused by foreign exchange or maturity mismatches, when the currency and maturity or an exposure differ materially to the currency and maturity of the associated collateral.
Held-to-maturity Held-to-maturity assets are non-derivative financial assets with fixed or determinable payments and fixed maturities that the Group’s management has the intention and ability to hold to maturity.
Impaired loans Loans where individual identified impairment provisions have been raised and also include loans which are collateralised or where indebtedness has already been written down to the expected realisable value. The impaired loan category may include loans, which, while impaired, are still performing.
Impairment allowances Impairment allowances are a provision held on the balance sheet as a result of the raising of a charge against profit for the incurred loss. An impairment allowance may either be identified or unidentified and individual (specific) or collective (portfolio).
Impairment losses Impairment losses are incurred on a financial asset or a group of financial assets is if, and only if, there is objective evidence of impairment as a result of one or more events occurring after the initial recognition of the asset (a loss event), and that loss event (or events) has an impact on the estimated future cash flows of the financial asset or group of financial assets that can be reliably estimated.
Individually assessed loan impairment provisions
Also known as specific impairment provisions. Impairment is measured individually for assets that are individually significant to the Group. Typically assets within the Wholesale Banking business of the Group are assessed individually.
Individual impairment charge The amount of individually assessed loan impairment provisions that are charged to the income statement in the reporting period.
Individual liquidity guidance Guidance given to the Group about the amount, quality and funding profile of liquidity resources that the FSA has asked the Group to maintain.
Innovative Tier 1 Capital Innovative Tier 1 capital consists of instruments which incorporate certain features, the effect of which is to weaken (but only marginally) the key characteristics of Tier 1 capital (that is,fully subordinated, perpetual and non-cumulative). Innovative Tier 1 capital is subject to a limit of 15 per cent of total Tier 1 capital.
Institution In accordance with the Capital Adequacy Directive and the Banking Consolidation Directive, an institution is a credit institution or an investment firm.
Interest rate risk (IRR) Interest rate risk arises due to the investment of equity and reserves into rate-sensitive assets, as well as some tenor mismatches between debt issuance and placements.
Internal ratings-based approach (‘IRB’)
The IRB approach is used to calculate risk weighted assets in accordance with the Basel Capital Accord where capital requirements are based on a firm’s own estimates of certain parameters.
Items belonging to regulatory high-risk categories
In relation to the Standardised Approach to credit risk, items which attract a risk-weight of 150 per cent. This includes exposures arising from venture capital business and certain positions in collective investment schemes.
Loans and advances This represents lending made under bilateral agreements with customers entered into in the normal course of business and is based on the legal form of the instrument. An example of a loan product is a home loan.
Loss Given Default (LGD) LGD is the percentage of an exposure that a lender expects to lose in the event of obligor default in economic downturn periods.
Mark-to-market approach One of the approaches available to banks to calculate the exposure value associated with derivative transactions. The approach calculates the current replacement cost of derivative contracts, by determining the market value of the contract and considering any potential future exposure.

Standard Chartered PLC
Pillar 3 Disclosures
58
Glossary continued
Maturity The time from the reporting date to the contractual maturity date of an exposure, capped at five years. Maturity is considered as part of the calculation of risk-weights for the Group’s exposures treated under the Internal Ratings based approach to credit risk and for the calculation of market risk capital requirements.
Minimum capital requirement Minimum capital required to be held for credit, market and operational risk.
Multilateral Development Banks An institution created by a group of countries to provide financing for the purpose of development. Under the standardised approach to credit risk, eligible multilateral development banks attract a zero per cent risk-weight.
Past due items Under the standardised approach to credit risk, exposures that are 90 days past due attract a risk-weight of 100 per cent where impairment provisions cover at least 20 per cent of the exposure. Otherwise, a risk-weight of 150 per cent must be applied.
Pillar 1 The first Pillar of the three pillars of Basel II, which provides the approach to the calculation of the minimum capital requirements for credit, market and operational risk. Minimum capital requirements are 8 per cent of the Group’s risk-weighted assets.
Pillar 2 Pillar 2, 'Supervisory Review', requires banks to undertake a comprehensive assessment of their risks and to determine the appropriate amounts of capital to be held against these risks where other suitable mitigants are not available.
Pillar 3 Pillar 3 aims to provide a consistent and comprehensive disclosure framework that enhances comparability between banks and further promotes improvements in risk practices.
Point in time (PIT) Considers the economic conditions at the point in the economic cycle at which default occurs when estimating the probability of default
Probability of Default (PD) PD is an internal estimate for each borrower grade of the likelihood that an obligor will default on an obligation within 12 months.
Prudent Valuation Adjustment (PVA)
This represents adjustments to Tier 1 capital where the prudent value of a position in the trading book is assessed by the Group as being materially below the fair value recognised in the financial statements.
Regulatory capital Regulatory capital represents the sum of Tier 1 Capital and Tier 2 Capital after taking into account any regulatory adjustments. The Group is required to maintain regulatory capital at a minimum of 8 per cent of its risk weighted assets.
Residential Mortgage-Backed Securities (RMBS)
Securities that represent interests in a group of residential mortgages. Investors in these securities have the right to cash received from future mortgage payments (interest and/or principal).
Retail Internal Ratings Based (Retail IRB) Approach
In accordance with the FSA handbook BIPRU 4.6, the approach to calculating credit risk capital requirements for eligible retail exposures.
Risk appetite Risk appetite is an expression of the amount of risk we are willing to take in pursuit of our strategic objectives, reflecting our capacity to sustain losses and continue to meet our obligations arising from a range of different stress trading conditions.
Risk weighted assets (RWAs) A measure of a bank’s assets adjusted for their associated risks. Risk weightings are established in accordance with the Basel Capital Accord as implemented by the FSA.
Securitisation Securitisation is a process by which debt instruments are aggregated into a pool, which is used to back new securities. A company sells assets to a special purpose entity (SPE) who then issues securities backed by the assets based on their value. This allows the credit quality of the assets to be separated from the credit rating of the original company and transfers risk to external investors.
Special Purpose Entities (SPEs) SPEs are entities that are created to accomplish a narrow and well defined objective. There are often specific restrictions or limits around their ongoing activities. Transactions with SPEs take a number of forms, including:– The provision of financing to fund asset purchases, or commitments to provide finance for future
purchases.– Derivative transactions to provide investors in the SPE with a specified exposure.– The provision of liquidity or backstop facilities which may be drawn upon if the SPE experiences
future funding difficulties.– Direct investment in the notes issued by SPEs.
Standardised Approach In relation to credit risk, a method for calculating credit risk capital requirements using External Credit Assessment Institutions (ECAI) ratings and supervisory risk weights. In relation to operational risk, a method of calculating the operational capital requirement by the application of a supervisory defined percentage charge to the gross income of eight specified business lines.
Stressed Value at Risk (VaR) A regulatory market risk measure based on potential market movements for a continuous one-year period of stress for a trading portfolio.
Sub-prime Sub-prime is defined as loans to borrowers typically having weakened credit histories that include payment delinquencies and potentially more severe problems such as court judgements and bankruptcies.

Standard Chartered PLC
Pillar 3 Disclosures
59
Glossary continued
Through the cycle (TTC) Reduces the volatility in the estimation of the probability of default by considering the average conditions over the economic cycle at the point of default, versus the point in time approach, which considers the economic conditions at the point of the economic cycle at which the default occurs.
Tier 1 capital Tier 1 capital comprises Core Tier 1 capital plus innovative Tier 1 securities and preference shares and tax on excess expected losses less material holdings in credit or financial institutions.
Tier 1 capital ratio Tier 1 capital as a percentage of risk weighted assets.
Tier 1 capital notes ('Innovative Tier 1')
Innovative Tier 1 capital consists of instruments which incorporate certain features, the effect of which is to weaken marginally the key characteristics of Tier 1 capital (that is, fully subordinated, perpetual and non-cumulative). Innovative Tier 1 capital is subject to a limit of 15 per cent of total Tier 1 capital.
Tier 2 capital Tier 2 capital comprises qualifying subordinated liabilities, allowable portfolio impairment provision and unrealised gains in the eligible revaluation reserves arising from the fair valuation of equity instruments held as available-for-sale.
Trading book Trading book is defined as per the FSA’s Handbook BIPRU.BIPRU 1.2.3 states 'The trading book of a firm consists of all position in CRD financial instrument and commodities held either with trading intent or in order to hedge other elements of the trading book and which are either free of any restrictive covenants on their tradability or ability to be hedged'
Write downs After an advance has been identified as impaired and is subject to an impairment allowance, the stage may be reached whereby it is concluded that there is no realistic prospect of further recovery. Write downs will occur when and to the extent that, the whole or part of a debt is considered irrecoverable.
Wrong-way risk The risk that the probability of default associated with counterparty to a derivative transaction increases when the exposure increases.
Value at Risk (VaR) VaR, in general, is a quantitative measure of market risk that applies recent historical market conditions to estimate the potential future loss in market value that will not be exceeded in a set time period at a set statistical confidence level.

Standard Chartered PLC
Pillar 3 Disclosures
60
Summary of differences between Pillar 3 disclosures and the Risk review section of the Annual Report and AccountsThe Group’s Pillar 3 disclosures for 31 December 2012 provide details from a regulatory perspective on certain aspects of credit risk, market risk and operational risk. The quantitative disclosures in the Pillar 3 disclosures will not, however, be directly comparable to those in the Risk review of the Annual
Report and Accounts as they are largely based on internally modelled risk metrics such as PD, LGD and EAD under Basel rules, whereas the quantitative disclosures in the Risk review are based on IFRS. EAD differs from the IFRS exposure primarily due to the inclusion of undrawn credit lines and off-balance sheet commitments. In addition, a number of the credit risk disclosures within the Pillar 3 disclosures are only provided for the internal ratings based portfolio, which represents 80 per cent of our credit risk RWA.
Topic Annual Report and Accounts Pillar 3 disclosures
Basis of requirements • The Group’s Annual Report is prepared in accordance with the requirements of IFRS, the UK Companies Act 2006, and the UK, Hong Kong and India Listing rules.
• The Group’s Pillar 3 disclosures provide details on risk from a regulatory perspective to fulfil Basel II rule requirements, which have been implemented in the UK through GENPRU and BIPRU.
Basis of preparation • The quantitative credit risk disclosures in the Risk review are based on IFRS.
• Loans and advances are analysed between Consumer Banking (split by product), Wholesale Banking (split by standard industry classification codes).
• Market risk disclosures are presented using VaR methodology for the trading and non- trading books.
• Provides details from a regulatory perspective on certain aspects of credit risk, market risk and operational risk. For credit risk this is largely based on internally modelled risk metrics such as PD, LGD and EAD under Basel rules.
• Loans and advances are analysed between those that are IRB and standardised, split by standard BIPRU categories.
• Market risk and operational risk disclosures are based on the capital required.
Coverage • All external assets which have an exposure to credit risk.
• Market risk exposure is the trading and non-trading books.
• Liquidity risk analysis of contractual maturities, liquid assets and encumbered assets.
• A number of the credit risk disclosures within the Pillar 3 disclosures are only provided for the IRB portfolio, which represents 80 per cent of our credit risk RWA. The remainder of the portfolio is on the standardised rules as prescribed in the BIPRU sourcebook.

Standard Chartered PLC
Pillar 3 Disclosures
61
Summary of cross references between Pillar 3 disclosures and the Risk review section of the Annual Report and Accounts
Topic Annual Report and Accounts Pillar 3 disclosures
Credit rating and measurement
• Overview of credit risk management credit grading and the use of IRB models. Page 65.
• Maximum exposure to credit risk set out on page 68.
• Internal credit grading analysis provided by business for loans neither past due nor impaired on page 71.
• External credit grading analysis for unimpaired debt securities and treasury bills is set out on page 93.
• A detailed analysis of IRB and standardised approach to credit risks is set out on pages 19 to 21.
• A more detailed explanation of IRB models is set out on pages 20 and 21.
• For the IRB portfolio, page 33 provides an indicative mapping of the Group’s credit grades in relation to Standard & Poor’s credit ratings.
• Minimum regulatory capital requirements for credit risk on pages 22 and 23.
• Credit grade analysis provided for the IRB portfolio only. EAD within the IRB portfolio after CRM, Undrawn commitments, exposure weighted average LGD and weighted average risk weight internal credit grade on pages 34 to 37.
Credit risk mitigation • CRM approach is set out on page 66.• Overview of fair value of collateral held and
other credit risk mitigants for the loan portfolio, with further details on Consumer Banking (CB) collateral provided on page 79 and Wholesale Banking (WB) on page 89.
• Quantitative overview of other risk mitigants including:– Securitisations - includes disclosures of both
retail transferred and synthetic securitisation.– Master netting, CSAs and cash collateral for
derivatives.
• Provides details on CRM from a regulatory perspective by providing EAD after CRM by IRB exposure class. Explanation is given on what constitutes eligible collateral including explanations of funded and unfunded protection. The main type of collateral for the Group’s standardised portfolio is also disclosed. Please refer to pages 30 and 31.
• Extensive disclosures on securitisation including notional and carrying amounts, details of securitisation programmes where the Group is an originator, the accounting and governance of securitisation activities and retained exposures and carrying value by risk weight band and by geography. Please refer to pages 41 to 47.
• EAD for items subject to CCR risk pre and post credit mitigation is disclosed. The products that are covered under CCR include ‘repo style’ transactions and derivative transactions. Please refer to pages 38 to 40.
Loan portfolio • Group overview of the loan portfolio provided by business by geography is on page 69. A more detailed analysis by CB product is set out on pages 76 and 77 and by WB counterparty (based on standard industry classifications) on page 85.
• Maturity analysis provided on pages 70, 77 and 86.
• EAD by geography, split between IRB and standardised portfolios (page 24) and by industry types (as specified by BIPRU) on page 26.
• Maturity of EAD, split by IRB and standardised on page 28.
Problem credit management and provisioning
• Provisioning approach set out on page 73 and definition on non-performing loans on page 73.
• Disclosures of non-performing loans, neither past due nor impaired, past due and impaired loans, individual impairment charge and portfolio Impairment charge by geography, product and industry.
• Disclosures around the expected loss model used for regulatory purposes and a tabular disclosure showing the regulatory expected loss against the net individual impairment charge. Please refer to page 32.
Market risk • Details of the VaR methodology, and VAR (trading and non trading) is disclosed by risk type on page 99 to 101.
• Details on Group Treasury’s market risk, including a table showing a parallel shift in the yield curves, on pages 101 and 102.
• Provides details of the internal model approvals, such as the CAD2 granted by the FSA and the extension of the CAD2 scope to include coal market risk.
• Market risk capital requirements for the trading book disclosed by risk type on pages 48 and 49.