Embed Size (px)
Citation preview

Standard 2.2 Review Worksheet Name _______________________________ Algebra 1 Date ___________________ Block _______ 1. Describe the following graphs as Linear, quadratic, exponential or other. _________________________ _________________________ Graph A Graph B 2. What are some similarities about the graphs? 3. What are some differences about the graphs?
4. Describe the following tables as Linear, quadratic, exponential or other.
_________________________ _________________________ Table A Table B 5. Name one similarity about tables? 6. Name one difference about the tables?

Standard 3.1 Review Algebra 1 1. Determine the Domain and Range of the table below.
Domain: _______________________________
Range: ________________________________
Function or not? _________________________
Why? _________________________________ 2 Determine the Domain and Range of the graph below.
Domain: _______________________________ Range: ________________________________ Function or not? _________________________ Why? _________________________________ 3. Determine the Domain and Range of the graph below. Domain: _______________________________ Range: ________________________________ Function or not? _________________________ Why? _________________________________ 4. Determine the Domain and Range of the graph below.
Domain: _______________________________ Range: ________________________________ Function or not? _________________________
Why? _________________________________
x y -3 9 1 1 3 9 4 16

5. Determine the Domain and Range of the graph below. Domain: _______________________________
Range: ________________________________ Function or not? _________________________ Why? _________________________________ 6. Graph and determine the Domain and Range of the function: f(x) = x2 +2. Domain: __________________________________ Range: ____________________________________ What type of function? _______________________ (linear, quadratic, exponential or other) Why? ______________________________________
7. Determine the Domain and Range of the function: 1
52
y x= +
Domain: __________________________________ What type of function? _________________
(linear, quadratic, exponential or other) Range: ____________________________________ Why? ______________________________
8. A glass of orange juice left on the counter heats up at a constant rate. One of your friends determined that this increase in temperature could be modeled by the equation )224(2 += hT
where T is the temperature in Fahrenheit and h in the numbers of hours it has been sitting out.
Determine and mathematically justify an appropriate domain and range for this situation. Domain: __________________________________ Range: __________________________________

9. In a soccer game, the path of a ball kicked towards the net could be modeled by the equation
xxxH 1616)( 2 +−= where x is the time in seconds, and H(x) is the height in feet of the ball. Determine and mathematically justify an appropriate domain and range for this situation.
Domain: __________________________________ Range: ___________________________________ Standard 3.2 Review Algebra 1
Complete the following tables 1.)
Input 0 2 4 6 8 10 12
Output 10 8 6 2 -2
2.)
Input -1 0 1 2 3 4 7
Output
1 3 9 81
3.)
Input -3 -2 -1 0 1 2 10
Output 11 6 3 2 6
The graph below models the height of a basketball (meters) vs. time (seconds).
4.) What type of relationship is represented by the graph?
5.) When is the ball at its maximum height?
6.) Make a prediction about how long it will take the basketball to fall to zero meters.
The graph to the right represents temperature vs. pressure.
7.) What type of relationship is represented by the graph?
8.) Make a prediction about the pressure when the temperature is .
9.) Make a prediction about the pressure when the temperature is .
10.) Make a prediction about the temperature when
the pressure is 400 mm.
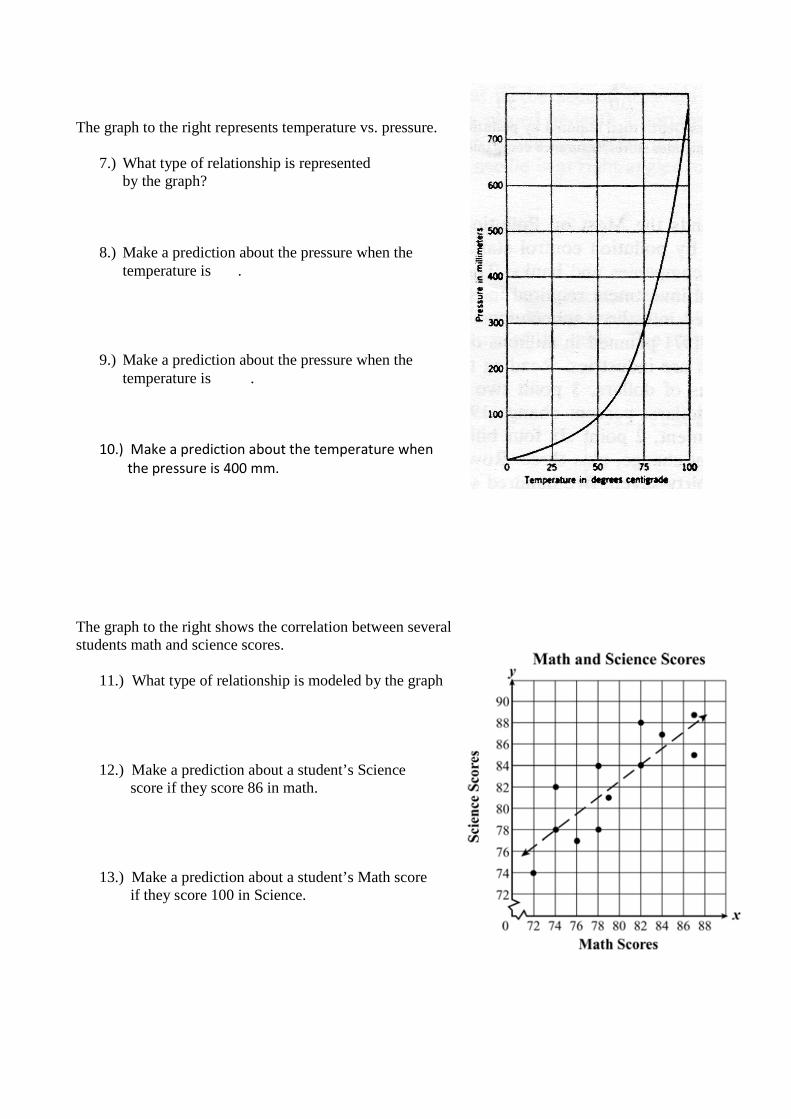
The graph to the right shows the correlation between several students math and science scores.
11.) What type of relationship is modeled by the graph
12.) Make a prediction about a student’s Science score if they score 86 in math.
13.) Make a prediction about a student’s Math score if they score 100 in Science.