Embed Size (px)
Citation preview

Stand and Deliver: Effects ofBoston’s Charter High Schools
on College Preparation,Entry, and Choice
Joshua D. Angrist, Massachusetts Institute of Technologyand National Bureau of Economic Research
Sarah R. Cohodes, Teachers College, Columbia University
Susan M. Dynarski, University of Michigan and National Bureauof Economic Research
Parag A. Pathak, Massachusetts Institute of Technologyand National Bureau of Economic Research
Christopher R. Walters, University of California, Berkeley,and National Bureau of Economic Research
We use admissions lotteries to estimate effects of attendance at Bos-ton’s charter high schools on college preparation and enrollment.Charter schools increase pass rates on Massachusetts’ high-stakesexit exam,with largeeffectsonthe likelihoodofqualifyingfora state-sponsored scholarship. Charter attendance also boosts SAT scoressharply and increases the likelihoodof taking anAdvancedPlacementðAPÞ exam, the number of AP exams taken, and AP scores. Char-ters induce a substantial shift from 2- to 4-year institutions, though
This research was funded by the US Department of Education through Insti-tute for Education Sciences grant no. 08120031 and by the New Schools Venture
[ Journal of Labor Economics, 2016, vol. 34, no. 2, pt. 1]© 2016 by The University of Chicago. All rights reserved. 0734-306X/2016/3402-0002$10.00Submitted August 6, 2013; Accepted August 8, 2014; Electronically published January 22, 2016
000
This content downloaded from 018.004.054.097 on February 29, 2016 12:07:25 PMAll use subject to University of Chicago Press Terms and Conditions (http://www.journals.uchicago.edu/t-and-c).
the effect on overall college enrollment is modest. Charter effects oncollege-related outcomes are strongly correlatedwith charter effectson earlier tests.
I. Introduction
A growing body of evidence indicates that many urban charter schoolshave large, positive effects on the test scores of disadvantaged students.Oversubscribed charter schools in Boston increase the test scores of low-income students by a third of a standard deviation a year—enough to elim-inate the black-white test score gap in a few years of attendance ðAbdul-kadiroglu et al. 2011Þ. Similar effects have been found in New York CityðDobbie and Fryer 2011Þ and in a nationwide study of oversubscribed ur-ban charter schools ðClark et al. 2011Þ.Although encouraging, gains on state-mandated standardized tests pro-
vide an inconclusive gauge of the benefits of charter attendance. Like otherAmerican public schools, charters are evaluated in part by the performanceof their students on these tests. A growing literature suggests that educa-tors respond strategically to the incentive to boost test scores ðNeal andSchanzenbach 2010Þ. In some cases, teachers have been found to cheat inorder to avoid sanctions or to garner the rewards associated with highscores on tests used for accountability ðJacob and Levitt 2003Þ.The potentially distortionary effect of test-based accountability may be
especially large in the charter sector, where schools whose students dopoorly on state assessments can be closed. In our Massachusetts setting,for example, 14 out of 96 charters granted through 2013 have been lost.Charter schools would appear to have a particularly strong incentive toteach to the test, at the expense, perhaps, of a focus on the development ofskills with a longer-term payoff.This paper assesses the consequences of Boston charter high school at-
tendance for outcomes beyond the test scores used for accountability pur-poses. We look here at outcomes where the link with human capital and
Fund. Grateful thanks go to Boston’s charter schools, to Kamal Chavda and theBoston Public Schools, and to Carrie Conaway, Cliff Chuang, and the staff of theMassachusetts Department of Elementary and Secondary Education for data andassistance. Caroline Hoxby, Tom Kane, and seminar participants at Chicago,Columbia,LondonSchool ofEconomics,NationalUniversity of Singapore,NBERSummer Institute, Oberlin College, the Society of Labor Economists, ToulouseSchool of Economics, Singapore Management University, and Uppsala Universityprovided helpful comments. Pathak thanks the National Science Foundation forresearch support. Annice Correia provided excellent research and administrativesupport. Daisy Sun and Peter Hull provided expert research assistance. The viewsexpressed here are those of the authors alone. Contact the corresponding author,Joshua Angrist, at [email protected]. Information concerning access to the dataused in this article is available as supplementary material online.
000 Angrist et al.
This content downloaded from 018.004.054.097 on February 29, 2016 12:07:25 PMAll use subject to University of Chicago Press Terms and Conditions (http://www.journals.uchicago.edu/t-and-c).

future earnings seems likely to be sustained and strong, focusing on vari-ables that are essential to or facilitate postsecondary schooling. These out-comes include high school graduation, the attainment of state competencythresholds, scholarship qualification, Advanced Placement ðAPÞ and SATperformance, college enrollment, type of institution, and college persis-tence. Few of these measures are targeted for accountability purposes.Postsecondary schooling is also strongly linked with earnings, althoughwecannot, as yet, look at earnings directly.Our analysis covers Boston’s charter high schools for cohorts who
applied when there were more applicants than seats. OversubscribedMassachusetts charters allocate seats by lottery, thereby generating ourresearch design. For our purposes, an analysis of high schools is both anecessity and a virtue. It is necessary to study high schools because moststudents applying to charters in earlier grades are not yet old enough togenerate data on postsecondary outcomes. Charter high schools are alsoof substantial policy interest: a growing literature suggests that high schoolmay be too late for cost-effective human capital interventions ðsee, e.g.,Cunha, Heckman, and Schennach 2010Þ. Consistent with this view, im-pact analyses of interventions for urban youth have mostly generated dis-appointing results.1 We assess whether charter high schools produce mean-ingful long-term gains for disadvantaged urban youth.Our findings suggest that the gains from Boston’s high-performing
charter high schools extend well beyond high-stakes tests. Charter atten-dance doubles the likelihood that a student sits for an Advanced PlacementðAPÞ exam, with especially large gains in the share of students taking sci-ence exams. Attending a charter school quadruples the likelihood of takingan AP Calculus exam and increases the fraction of students earning an APCalculus score high enough to qualify for college credit from 2%, for non-charter attendees, to 13%, for charter attendees. Charters also boost SATscores sharply, especially inmath. Importantly, our estimated SATgains areabout as large as the estimated gains on the state’s high-stakes high schoolexit exam, in spite of the fact that SAT scores are unrelated to state-mandatedaccountability standards. Although overall college enrollment effects arenot statistically significant, charter attendance induces a clear shift from2-year to 4-year colleges, with gains most pronounced at 4-year public in-stitutions inMassachusetts.Our analysis also links gains on accountability assessments to gains in
later outcomes, finding that effects on the two sets of outcomes are highly
1 For example, Dynarski et al. ð1998Þ and Dynarski and Gleason ð2002Þ docu-ment an array of discouraging findings for interventions meant to reduce dropoutrates. See also Dynarski and Wood ð1997Þ and Kemple and Snipes ð2000Þ for re-sults on alternative schools and career academies, where the findings are mixed atbest.
Effects of Boston’s Charter High Schools 000
This content downloaded from 018.004.054.097 on February 29, 2016 12:07:25 PMAll use subject to University of Chicago Press Terms and Conditions (http://www.journals.uchicago.edu/t-and-c).
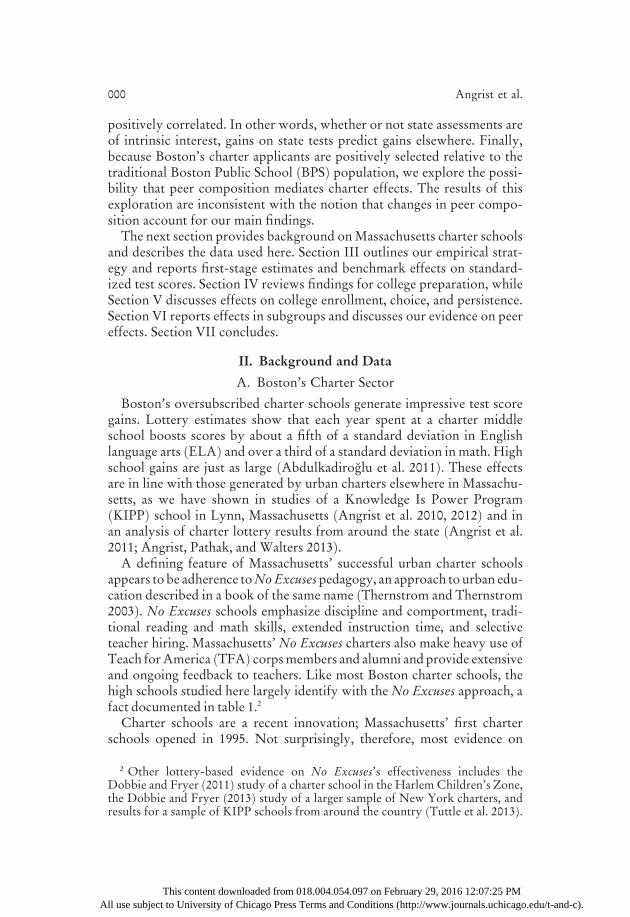
positively correlated. In other words, whether or not state assessments areof intrinsic interest, gains on state tests predict gains elsewhere. Finally,because Boston’s charter applicants are positively selected relative to thetraditional Boston Public School ðBPSÞ population, we explore the possi-bility that peer composition mediates charter effects. The results of thisexploration are inconsistent with the notion that changes in peer compo-sition account for our main findings.The next section provides background onMassachusetts charter schools
and describes the data used here. Section III outlines our empirical strat-egy and reports first-stage estimates and benchmark effects on standard-ized test scores. Section IV reviews findings for college preparation, whileSection V discusses effects on college enrollment, choice, and persistence.Section VI reports effects in subgroups and discusses our evidence on peereffects. Section VII concludes.
II. Background and Data
A. Boston’s Charter Sector
Boston’s oversubscribed charter schools generate impressive test scoregains. Lottery estimates show that each year spent at a charter middleschool boosts scores by about a fifth of a standard deviation in Englishlanguage arts ðELAÞ and over a third of a standard deviation in math. Highschool gains are just as large ðAbdulkadiroglu et al. 2011Þ. These effectsare in line with those generated by urban charters elsewhere in Massachu-setts, as we have shown in studies of a Knowledge Is Power ProgramðKIPPÞ school in Lynn, Massachusetts ðAngrist et al. 2010, 2012Þ and inan analysis of charter lottery results from around the state ðAngrist et al.2011; Angrist, Pathak, and Walters 2013Þ.A defining feature of Massachusetts’ successful urban charter schools
appears to be adherence toNoExcusespedagogy, an approach to urban edu-cation described in a book of the same name ðThernstrom and Thernstrom2003Þ. No Excuses schools emphasize discipline and comportment, tradi-tional reading and math skills, extended instruction time, and selectiveteacher hiring. Massachusetts’No Excuses charters also make heavy use ofTeach forAmerica ðTFAÞ corpsmembers and alumni andprovide extensiveand ongoing feedback to teachers. Like most Boston charter schools, thehigh schools studied here largely identify with theNo Excuses approach, afact documented in table 1.2
Charter schools are a recent innovation; Massachusetts’ first charterschools opened in 1995. Not surprisingly, therefore, most evidence on
2 Other lottery-based evidence on No Excuses’s effectiveness includes theDobbie and Fryer ð2011Þ study of a charter school in the Harlem Children’s Zone,the Dobbie and Fryer ð2013Þ study of a larger sample of New York charters, andresults for a sample of KIPP schools from around the country ðTuttle et al. 2013Þ.
000 Angrist et al.
This content downloaded from 018.004.054.097 on February 29, 2016 12:07:25 PMAll use subject to University of Chicago Press Terms and Conditions (http://www.journals.uchicago.edu/t-and-c).

Tab
le1
BostonHighScho
olCha
racteristics
PublicHigh
Schools
Charters
Serving
Grades
9–12
Only
Charters
Serving
Grades
9–12
Charters
intheStudy
ð1Þ
ð2Þ
ð3Þ
ð4Þ
A.Schoolcharacteristics:
No.ofyears
open
1514
14HaveSaturday
school
3schools
5schools
5schools
Average
mathinstructionsðm
inutesÞ
83.5
92.0
97.3
Average
readinginstructionðm
inutesÞ
89.8
92.0
97.3
NoExcuses
3schools
5schools
5schools
Daysper
year
180
189
190
191
Average
minutesper
day
392
477
478
489
Average
per
pupilexpenditure
ð$Þ
16,902
a15,842
b13,694
13,499
Title
Ieligible
22schools
4schools
7schools
6schools
No.ofschools
insample
224
76
B.Teacher
characteristicsðgrades
9–12
onlyÞ:
No.ofteachersper
school
4517
1616
Student/teacher
ratio
13.8
13.1
12.4
12.6
Proportionofhighly
qualified
teachers
.70
.88
.90
.91
Proportionofteacherslicensedin
teachingassign
ment
.89
.80
.69
.64
Proportionofcore
classestaugh
tbyhighly
qualified
teachers
.93
.97
.97
.96
Average
teacher
age
4132
3332
Proportionofteachersage32
andyounger
.23
.64
.63
.69
Proportionofteachersage49
andolder
.30
.09
.08
.04
Proportionofteachersassign
edto
SPED
orELL
classes
.17
.08
.06
.06
Proportionofteachersassign
edto
APclasses
.04
.07
.07
.07
No.ofteachersin
sample
993c
71121
101
NOTE.—
ThistablereportscharacteristicsofBostoncharterschoolsandBostonpublicschoolsoperatingin
academ
icyear2012–13.Inform
ationoncharterschoolsin
panelA
isfrom
a2010
–11
survey
ofschooladministrators,exceptforper
pupilexpenditures,whicharefiscal
year2011
figu
resobtained
from
http://w
ww.doe.mass.edu/charter/finance
/revexp/.Dataforpublicschoolswereobtained
from
www.nctq.org,www.bostonpublicschools.org
andhttp://profiles.doe.mass.eduandreferto
academ
icyear2010
–11,except
foraverageminutesper
day,w
hichwereextractedfrom
theBostonPublicSchoolswebsite
inMarch
2013.A
verage
per
pupilexpendituresincludespendingforallgradelevelsfor
both
publicandcharterschools
andareweigh
tedbystudentenrollment.Teacher
characteristicsin
panel
Barederived
from
MassachusettsEPIM
Steacher
dataandSIMS
administrativedata.PanelBreportsaverages
forteachersem
ployed
inthe2010–11
and2011
–12
schooly
ears.See
thethedataappendix
ðapp.A
Þfordetails.E
xceptwhereotherwise
noted,entriesin
panel
Aareaverages
across
schools.
aThisfigu
recorrespondsto
thetotalreported
expendituresin
theMassachusettsDESE
DistrictProfilesFinance
Table“T
otalExp
enditure
per
Pupil,AllFunds,byFunction”
forfiscal
year2011
andisan
enrollment-weigh
tedaverageofin-districtandout-of-districtexpenditures.
bDataforMatch
CharterHighSchoolincludespendingat
theMatch
middle
schoolas
well.
c2010
–11
EPIM
Steacher
dataforWestRoxb
ury
Academ
yaremissing,
asthisschoolopened
inacadem
icyear2011
–12.
This content downloaded from 018.004.054.097 on February 29, 2016 12:07:25 PMAll use subject to University of Chicago Press Terms and Conditions (http://www.journals.uchicago.edu/t-and-c).
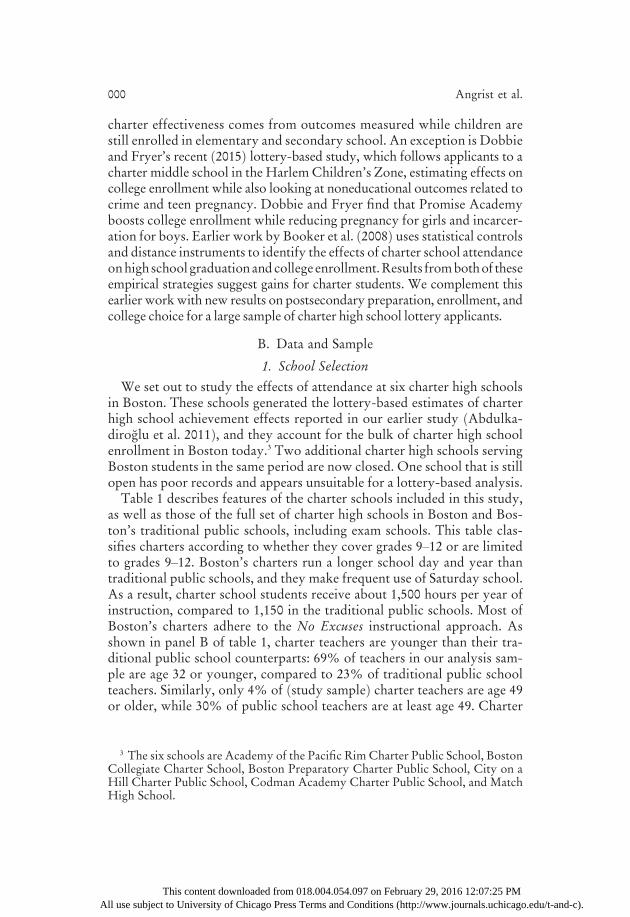
charter effectiveness comes from outcomes measured while children arestill enrolled in elementary and secondary school. An exception is Dobbieand Fryer’s recent ð2015Þ lottery-based study, which follows applicants to acharter middle school in the HarlemChildren’s Zone, estimating effects oncollege enrollment while also looking at noneducational outcomes related tocrime and teen pregnancy. Dobbie and Fryer find that Promise Academyboosts college enrollment while reducing pregnancy for girls and incarcer-ation for boys. Earlier work by Booker et al. ð2008Þ uses statistical controlsand distance instruments to identify the effects of charter school attendanceonhigh schoolgraduationandcollegeenrollment.Results frombothof theseempirical strategies suggest gains for charter students. We complement thisearlier workwith new results on postsecondary preparation, enrollment, andcollege choice for a large sample of charter high school lottery applicants.
B. Data and Sample
1. School Selection
We set out to study the effects of attendance at six charter high schoolsin Boston. These schools generated the lottery-based estimates of charterhigh school achievement effects reported in our earlier study ðAbdulka-diroglu et al. 2011Þ, and they account for the bulk of charter high schoolenrollment in Boston today.3 Two additional charter high schools servingBoston students in the same period are now closed. One school that is stillopen has poor records and appears unsuitable for a lottery-based analysis.Table 1 describes features of the charter schools included in this study,
as well as those of the full set of charter high schools in Boston and Bos-ton’s traditional public schools, including exam schools. This table clas-sifies charters according to whether they cover grades 9–12 or are limitedto grades 9–12. Boston’s charters run a longer school day and year thantraditional public schools, and they make frequent use of Saturday school.As a result, charter school students receive about 1,500 hours per year ofinstruction, compared to 1,150 in the traditional public schools. Most ofBoston’s charters adhere to the No Excuses instructional approach. Asshown in panel B of table 1, charter teachers are younger than their tra-ditional public school counterparts: 69% of teachers in our analysis sam-ple are age 32 or younger, compared to 23% of traditional public schoolteachers. Similarly, only 4% of ðstudy sampleÞ charter teachers are age 49or older, while 30% of public school teachers are at least age 49. Charter
3 The six schools are Academy of the Pacific RimCharter Public School, BostonCollegiate Charter School, Boston Preparatory Charter Public School, City on aHill Charter Public School, Codman Academy Charter Public School, and MatchHigh School.
000 Angrist et al.
This content downloaded from 018.004.054.097 on February 29, 2016 12:07:25 PMAll use subject to University of Chicago Press Terms and Conditions (http://www.journals.uchicago.edu/t-and-c).

class sizes are smaller than those at traditional public schools. Per pupilexpenditures are broadly similar across sectors, with traditional publichigh schools spending about $1,000 more per student. All public schoolsin Boston, including charters, qualify for Title I aid.
2. Student Data
Massachusetts charter schools admit students by lottery when they havemore applicants than seats. We collected lists of charter school applicantsand information on the results of admissions lotteries from individual char-ter schools. These lists were then matched to administrative records cov-ering all Massachusetts public school students. Our analysis sample is lim-ited to charter applicants who applied for a charter school seat from fall2002 through fall 2009. Additional information on applicant lotteries ap-pears in the data appendix ðapp. AÞ and table A1.We matched applicant records to administrative data using applicants’
names, cohorts, and grades of application. Where available, informationon date of birth, town of residence, race or ethnicity, and gender was usedto break ties. Among applicants eligible for our study, 94% were matchedto state data.4 Applicants were excluded from the analysis if they were dis-qualified from the lottery ðthese are mostly applicants to the wrong gradeÞ.We also omit siblings of current charter students, late applicants, and someout-of-area applicants. Students submitting charter applications in multi-ple years appear only once in the sample, with data recorded for the firstapplication only. Information on baseline demographics and test scorescomes from the most recent pre-lottery data available in the state database.In addition to providing demographic information and scores on state as-sessments, state administrative records include AP and SAT scores for allpublic school students tested in Massachusetts.Information on college enrollment and choice comes from the National
Student Clearinghouse ðNSCÞ. TheMassachusetts Department of Elemen-tary and Secondary Education routinely requests an NSC match for Mas-sachusetts high school graduates; as described in the data appendix, wecombined the graduate files with supplemental information on nongrad-uates. NSC data record enrollment spells at participating postsecondary
4 Match rates differ little by win/loss status, a fact documented in app. table A2.Online app. table B3 shows that results for applicant cohorts where match rate dif-ferentials are largest ðmostly recent cohorts with projected graduation dates after2009Þ are typically similar to those for the full sample, though effects on readingscores are somewhat smaller for the balanced cohorts. Appendix B, table B4, re-ports Lee ð2009Þ bounds accounting for differential attrition. The bounds implysubstantial and significant test score impacts in both subjects.
Effects of Boston’s Charter High Schools 000
This content downloaded from 018.004.054.097 on February 29, 2016 12:07:25 PMAll use subject to University of Chicago Press Terms and Conditions (http://www.journals.uchicago.edu/t-and-c).
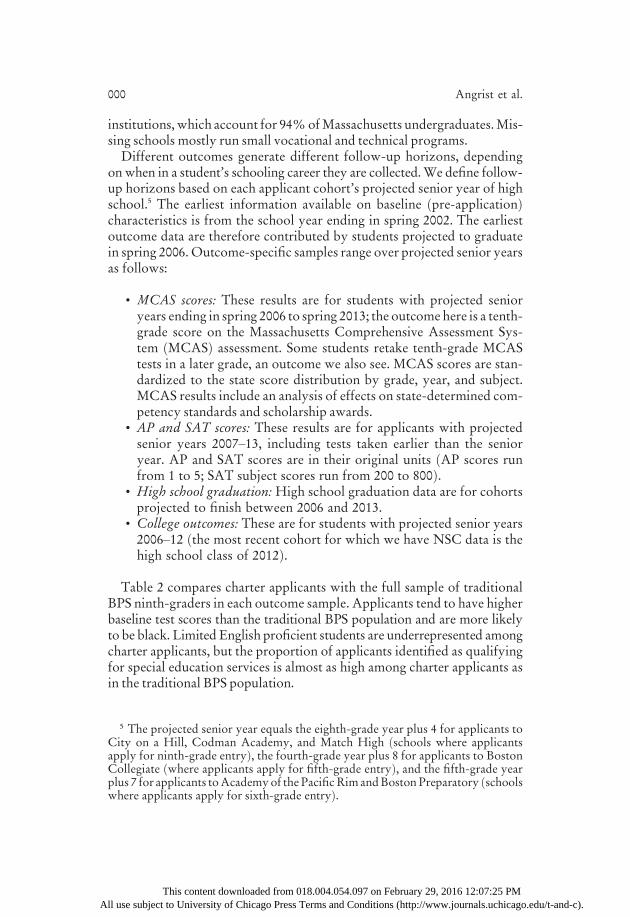
institutions, which account for 94%ofMassachusetts undergraduates.Mis-sing schools mostly run small vocational and technical programs.Different outcomes generate different follow-up horizons, depending
onwhen in a student’s schooling career they are collected.We define follow-up horizons based on each applicant cohort’s projected senior year of highschool.5 The earliest information available on baseline ðpre-applicationÞcharacteristics is from the school year ending in spring 2002. The earliestoutcome data are therefore contributed by students projected to graduatein spring 2006.Outcome-specific samples range over projected senior yearsas follows:
• MCAS scores: These results are for students with projected senioryears ending in spring 2006 to spring 2013; the outcomehere is a tenth-grade score on the Massachusetts Comprehensive Assessment Sys-tem ðMCASÞ assessment. Some students retake tenth-grade MCAStests in a later grade, an outcome we also see. MCAS scores are stan-dardized to the state score distribution by grade, year, and subject.MCAS results include an analysis of effects on state-determined com-petency standards and scholarship awards.
• AP and SAT scores: These results are for applicants with projectedsenior years 2007–13, including tests taken earlier than the senioryear. AP and SAT scores are in their original units ðAP scores runfrom 1 to 5; SAT subject scores run from 200 to 800Þ.
• High school graduation:High school graduation data are for cohortsprojected to finish between 2006 and 2013.
• College outcomes: These are for students with projected senior years2006–12 ðthe most recent cohort for which we have NSC data is thehigh school class of 2012Þ.
Table 2 compares charter applicants with the full sample of traditionalBPS ninth-graders in each outcome sample. Applicants tend to have higherbaseline test scores than the traditional BPS population and are more likelyto be black. Limited English proficient students are underrepresented amongcharter applicants, but the proportion of applicants identified as qualifyingfor special education services is almost as high among charter applicants asin the traditional BPS population.
5 The projected senior year equals the eighth-grade year plus 4 for applicants toCity on a Hill, Codman Academy, and Match High ðschools where applicantsapply for ninth-grade entryÞ, the fourth-grade year plus 8 for applicants to BostonCollegiate ðwhere applicants apply for fifth-grade entryÞ, and the fifth-grade yearplus 7 for applicants toAcademyof thePacificRimandBostonPreparatory ðschoolswhere applicants apply for sixth-grade entryÞ.
000 Angrist et al.
This content downloaded from 018.004.054.097 on February 29, 2016 12:07:25 PMAll use subject to University of Chicago Press Terms and Conditions (http://www.journals.uchicago.edu/t-and-c).

Table 2Descriptive Statistics
All BPSNinth-Graders
CharterLottery Applicants
Mean MeanImmediateOffer Gap
WaitlistOffer Gap
ð1Þ ð2Þ ð3Þ ð4ÞA. Projected senior year 2006–13
ðMCAS outcome sampleÞ:Female .496 .540 .025 2.014
ð.019Þ ð.011ÞBlack .421 .613 2.004 2.001
ð.018Þ ð.010ÞHispanic .308 .250 .006 2.002
ð.016Þ ð.009ÞAsian .101 .033 2.003 .002
ð.006Þ ð.003ÞSubsidized lunch .743 .729 .020 2.006
ð.017Þ ð.010ÞSpecial education .204 .182 .012 2.009
ð.015Þ ð.008ÞLimited English proficiency .120 .035 2.001 .002
ð.007Þ ð.004ÞBaseline MCAS ELA 2.489 2.298 2.046 .026
ð.035Þ ð.019ÞBaseline MCAS Math 2.427 2.312 2.027 .018
ð.035Þ ð.020Þp-value .805 .748Charter attendance .297Immediate offer .308Waitlist offer .347N 29,846 3,685
B. Other outcome samples:Projected senior year 2007–13:
Took any AP .268 .286Took SAT .496 .642N 22,467 3,672
Projected senior year 2006–12:On-time college enrollment .368 .488N 26,584 3,205
NOTE.—This table shows descriptive statistics for Boston Public School ðBPSÞ students and charter lot-tery applicants as well as differences by lottery offer status. Column 1 shows means for BPS ninth-gradersprojected to graduate between 2006 and 2013, assuming normal academic progress from eighth grade. Col-umn2 showsmeans for charter applicants in the sameprojected graduationyear range.Columns 3 and4 reportcoefficients from regressions of characteristics on immediate andwaitlist lottery offers, controlling for risk setindicators. The sample for these regressions is restricted to charter lottery applicantswith tenth-gradeMCASELA ðMassachusetts Comprehensive Assessment System English language artsÞ scores. The p-values arefrom tests of the hypothesis that all coefficients are zero. Baseline grade is defined as fourth grade for BostonCollegiate applicants, fifth grade for Boston Preparatory and Academy of the Pacific Rim applicants, andeighth grade for Match High, Codman Academy, and City on a Hill applicants. The baseline grade for BPSninth-graders is eighth grade. PanelB showsoutcomemeans for theAP/SATandNSCanalysis samples.On-time college enrollment indicates enrollment by the semester after projected high school graduation. Stan-dard errors are shown in parentheses.
This content downloaded from 018.004.054.097 on February 29, 2016 12:07:25 PMAll use subject to University of Chicago Press Terms and Conditions (http://www.journals.uchicago.edu/t-and-c).
III. Empirical Framework
A. Models and Instruments
We estimate the effects of charter school attendance on high school grad-uation rates, measures of AP and SAT test-taking and scores, college en-rollment and type, and college persistence. As a benchmark, we also reportresults for tenth-grade MCAS scores, including effects on competencythresholds in Massachusetts and eligibility for the state’s Adams Scholar-ship, which grants public university tuition waivers to public high schoolstudents based on a combination ofMCASmath and ELA cutoffs.Our lottery-based empirical strategy is motivated by the observation
that charter attendance is a choice that may be correlated with motivation,ability, or family background. Conventional regression estimates of the ef-fects of charter attendance may therefore fail to capture causal effects. Toeliminate selection bias, our empirical strategy uses randomly assignedcharter lotteryoffers toestimate theeffectsof attendingcharter schools.Thesecond-stage equation for our lottery-based two-stage least squares ð2SLSÞanalysis links charter school attendance with outcomes as follows:
yi 5 oj
djdij 1 g0Xi 1 rCi 1 εi; ð1Þ
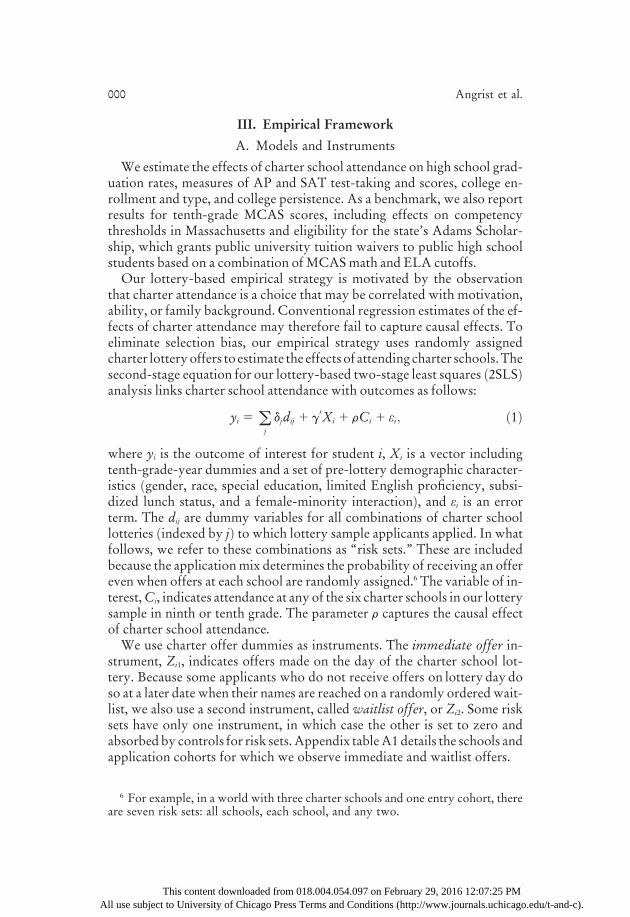
where yi is the outcome of interest for student i, Xi is a vector includingtenth-grade-year dummies and a set of pre-lottery demographic character-istics ðgender, race, special education, limited English proficiency, subsi-dized lunch status, and a female-minority interactionÞ, and εi is an errorterm. The dij are dummy variables for all combinations of charter schoollotteries ðindexed by jÞ to which lottery sample applicants applied. In whatfollows, we refer to these combinations as “risk sets.” These are includedbecause the applicationmix determines the probability of receiving an offereven when offers at each school are randomly assigned.6 The variable of in-terest,Ci, indicates attendance at any of the six charter schools in our lotterysample in ninth or tenth grade. The parameter r captures the causal effectof charter school attendance.We use charter offer dummies as instruments. The immediate offer in-
strument, Zi1, indicates offers made on the day of the charter school lot-tery. Because some applicants who do not receive offers on lottery day doso at a later date when their names are reached on a randomly orderedwait-list, we also use a second instrument, called waitlist offer, or Zi2. Some risksets have only one instrument, in which case the other is set to zero andabsorbed by controls for risk sets.Appendix tableA1details the schools andapplication cohorts for which we observe immediate and waitlist offers.
6 For example, in a world with three charter schools and one entry cohort, thereare seven risk sets: all schools, each school, and any two.
000 Angrist et al.
This content downloaded from 018.004.054.097 on February 29, 2016 12:07:25 PMAll use subject to University of Chicago Press Terms and Conditions (http://www.journals.uchicago.edu/t-and-c).

The first stage for our 2SLS procedure is
Ci 5 oj
mjdij 1 b0Xi 1 p1Zi1 1 p2Zi2 1 hi; ð2Þ
where two separate parameters, p1 and p2, capture the effects of immediateand waitlist offers on charter attendance. As in the second-stage equation,the first stage includes risk set controls, tenth-grade-year dummies, andbaseline demographic characteristics. With two instruments used to esti-mate a single causal effect, we can interpret 2SLS estimates as a statisticallyefficient weighted average of what we would get from an estimation strat-egy that uses the instruments one at a time. Standard errors are clustered atthe tenth-grade-school-by-year level.Randomly assigned lottery offers are independent of student ability or
family background. Consistent with presumed random assignment, col-umns 3 and 4 of table 2 show that pre-lottery demographic variables and testscores are similar for offered and nonoffered students. Specifically, differ-ences in baseline characteristics by offer status are small and statisticallyinsignificant for all variables tested, and p-values from joint tests are high.Although random assignment ensures apples-to-apples comparisons
among all those who apply, this statistical comparability is threatened bydifferential attrition between offered and nonoffered students. Appendixtable A3 documents an MCAS follow-up rate close to 80%. Moreover,panel B, which reports the effect of lottery offers on the likelihood studentscontribute an MCAS score to our analysis sample, shows no significanteffects of lottery offers on follow-up. Follow-up rates for further down-stream outcomes are largely determined by whether a student is seen in aMassachusetts school in twelfth grade. Here too the estimates in panel Bare encouraging, with no systematic difference between offered and non-offered students.
B. First-Stage Estimates and an MCAS Benchmark
A waitlist admissions offer in a charter lottery boosts the probability ofcharter enrollment by 24 percentage points. This can be seen in column 3of table 3,which reportswaitlist offer first-stage estimates.Column2 showsthat an immediate offer boosts charter enrollment by an additional 13 points.The first-stage effect of an offer immediately following lottery day is there-fore 37 percentage points.7
The relationship between lottery offers and charter enrollment—the sizeof the first stage—is determined by the likelihood that an applicant choosesto accept an offer. Our first-stage estimates are far from one because manylottery winners choose not to enroll in charter schools. This is driven in
7 First-stage estimates differ slightly across outcomes due to small changes insample composition.
Effects of Boston’s Charter High Schools 000
This content downloaded from 018.004.054.097 on February 29, 2016 12:07:25 PMAll use subject to University of Chicago Press Terms and Conditions (http://www.journals.uchicago.edu/t-and-c).

Tab
le3
Lottery
Estim
ates
ofEffects
onTen
th-G
rade
MCASScores
byPr
ojectedSenior
Year
CharterEnrollmentðF
irst
StageÞ
MCASScoresðR
educedForm
and2SLSÞ
Subject
Nonoffered
Mean
ð1Þ
Immediate
Offer
ð2Þ
Waitlist
Offer
ð3Þ
Noncharter
Mean
ð4Þ
Immediate
Offer
ð5Þ
Waitlist
Offer
ð6Þ
Charter
Effect
ð7Þ
A.Seniors
in2006–13
ðMCASoutcomesampleÞ:
Standardized
ELA
.104
.373***
.239***
2.285
.148***
.136***
.408***
½.306
�ð.0
47Þ
ð.042Þ
½.833�
ð.046Þ
ð.044Þ
ð.102Þ
N3,685
Standardized
math
.106
.374***
.241***
2.233
.221***
.152***
.592***
½.307
�ð.0
48Þ
ð.041Þ
½.911�
ð.058Þ
ð.054Þ
ð.117Þ
N3,629
B.Seniors
in2006–12
ðNSC
outcomesampleÞ:
Standardized
ELA
.097
.363***
.228***
2.296
.110**
.073
.304**
½.296
�ð.0
53Þ
ð.048Þ
½.830�
ð.055Þ
ð.050Þ
ð.127Þ
N3,008
Standardized
math
.097
.365***
.230***
2.241
.178***
.118*
.489***
½.296
�ð.0
53Þ
ð.048Þ
½.893�
ð.068Þ
ð.065Þ
ð.146Þ
N2,965
NOTE.—
Thistable
reportsfirst-stage,
reducedform
,andtw
o-stage
leastsquares
estimates
fortheeffectsofBostoncharterattendance
ontenth-gradeMCASðM
assachusetts
Comprehensive
Assessm
entSy
stem
Þtestscores.ThepanelA
sampleincludes
studentsprojected
tograduatebetween2006
and2013;thepanelBsampleincludes
studentsprojected
tograduatebetween2006
and2012.Theendogenousvariable
isan
indicatorforcharterattendance
inninth
ortenth
grade.
Theinstruments
areim
mediate
andwaitlistoffer
dummies.Im
mediate
offer
isequal
toonewhen
astudentisoffered
aseat
inanycharterschoolim
mediately
followingthelottery,w
hilewaitlistoffer
isequal
tooneforstudents
offered
seatslater.Allmodelscontrolforrisk
sets,tenth-gradecalendar
yeardummies,race,sex,specialeducation,lim
ited
Englishproficiency,subsidized
lunch
status,andafemale
byminority
dummy.Standarderrorsareclustered
attheschool-yearlevelintenth
grade.Themeansin
col.1areforstudentswhoreceived
nocharteroffer,w
hilethemeansin
col.4
arefornoncharterstudents.Standarderrors
arereported
inparentheses,andstandarddeviationsarereported
inbrackets.
*Sign
ificantat
the10%
level.
**Sign
ificantat
the5%
level.
***
Sign
ificantat
the1%
level.
This content downloaded from 018.004.054.097 on February 29, 2016 12:07:25 PMAll use subject to University of Chicago Press Terms and Conditions (http://www.journals.uchicago.edu/t-and-c).

part by the variety of options available to Boston high school students:online appendix table C1 shows that some accepted applicants opt for atraditional public school, one of Boston’s pilot schools, or an exam school.In addition, some students who receive no offer in the lotteries for whichwe have data receive one at a later date, further reducing the first stage. The2SLS estimates adjust for differences between offers and enrollment, withthe resulting estimates capturing causal effects for those who comply withði.e., enroll in a charter school in response toÞ the offers recorded in our dataðImbens and Angrist 1994Þ.As a starting point, table 3 also reports first-stage, reduced form, and
2SLS estimates similar to those reported in our earlier Boston study fortenth-grade MCAS scores ðAbdulkadiroglu et al. 2011Þ. Column 7, whichshows second-stage estimates of the parameter r from equation ð1Þ, in-dicates that attendance at the charter high schools in our sample booststenth-gradeELA scores by 0.4j, that is, four-tenths of a standard deviation,while raising math scores by almost 0.6j.8
The analysis of longer-term outcomes necessarily covers fewer appli-cant cohorts than are available for an analysis of MCAS scores. As a checkon the representativeness of the subsamples used to produce the estimatesof effects on later outcomes, we constructed 2SLS estimates of MCAS ef-fects for the subsample of applicants contributing to our college-going anal-ysis below. Estimates of effects on tenth-gradeMCAS scores in the college-going sample, reported in panel B of table 3, are similar to estimates forthe full MCAS sample.
IV. College Preparation
A. MCAS Thresholds
Charter school attendance has large effects on the likelihood applicantsscore in the upper-two MCAS score categories. This can be seen in col-umn 2 of table 4, which documents large and statistically significant in-creases in the likelihood charter applicants earn scores at a level deemed“Proficient” or “Advanced.”Since 2003, high school graduation inMassachusetts has been determined
in part by tenth-gradeMCAS scores. The initial state competency standardrequired students to pass the Needs Improvement threshold with scaled
8 The estimates reported in our earlier study, Abdulkadiroglu et al. ð2011Þ, aresmaller than this because the former are scaled to measure the effect of years ofcharter attendance, while those reported here show a charter enrollment effect,without adjusting for years attended.We opted for a dummy-endogenous-variableapproach because this produces consistent specifications across outcomes, whilesidestepping issues related to timing and reverse causality. High school graduation,e.g., causes years of charter enrollment as well as vice versa.
Effects of Boston’s Charter High Schools 000
This content downloaded from 018.004.054.097 on February 29, 2016 12:07:25 PMAll use subject to University of Chicago Press Terms and Conditions (http://www.journals.uchicago.edu/t-and-c).

Tab
le4
Lottery
Estim
ates
ofEffects
onHighScho
olMileston
es
MCASPerform
ance
Categories
ðMathandELA
CombinedÞ
GradeProgressionandGraduation
NoncharterMean
Effect
NoncharterMean
Effect
Category
ð1Þ
ð2Þ
Category
ð3Þ
ð4Þ
NeedsIm
provementorhigher
.975
.014
Starttw
elfthgradeontimeðN
53,920Þ
.781
2.024
ð.015Þ
ð.049Þ
Proficientorhigher
.543
.171**
Repeattw
elfthgradeðN
52,415Þ
.070
.124**
ð.071Þ
ð.050Þ
Advancedorhigher
.076
.161***
4-yeargraduationðN
53,920Þ
.687
2.145***
ð.034Þ
ð.055Þ
Meets
competency
determination
.740
.147**
5-yeargraduationðN
53,208Þ
.787
2.003
ð.065Þ
ð.059Þ
Eligible
forAdam
sScholarship
usingBPScutoffs
.198
.242***
ð.058Þ
N3,608
NOTE.—
This
table
reportstw
o-stage
leastsquares
estimates
oftheeffectsofBostoncharterattendance
ontenth-gradeMCASðM
assachusettsComprehensive
Assessm
ent
System
Þperform
ance
catego
ries,eligibilityfortheAdam
sScholarship,andprogressionthrough
highschool.Thecompetency
determinationrequires
scaled
scoresof220in
both
ELA
andmathfortheclassesof2006
–9andscoresof240in
both
subjectsfortheclassesof2010
–13.A
studentiseligiblefortheAdam
sScholarship
ifheorsheisproficientin
both
subjects,advancedin
atleastonesubject,andscoresam
ongthetop25
%oftheBostondistrictonhisorher
firstattempt.BPScutoffsforprojected
graduationcohorts2012
and2013
areim
putedwiththe2011
cutoff.A
student“n
eedsim
provement”
ifheorshescoresat
orabove
220onboth
tests;“isproficient”
ifheorshescoresat
orabove
240onboth
tests;
and“isadvanced”ifheorshescoresatorabove
260onboth
tests.Non–Adam
sMCASoutcomes
indicatewhether
astudentreached
thethreshold
onanyattempt.Startinggrade12
ontimeisoneifastudentisobserved
intw
elfthgradebyhisorher
projected
senioryear,assumingnorm
alacadem
icprogressfrom
baseline.
Repeattw
elfthisoneifastudent
repeatstw
elfthgradeforat
least1academ
icyear.Five-yeargraduationisequalto
oneifastudentgraduates
bytheyearfollowinghisorher
projected
graduationyear.Thesample
forrepeattw
elfthand5-yeargraduationincludes
students
projected
tograduatebyspring2012.Allother
outcomesamplesincludestudents
projected
tograduatefrom
2006
through
2013.T
hesampleforrepeattw
elfthisrestricted
tostudentswhostartedtw
elfthgradeontime.Thenoteto
table3detailsthe2SLSmodelsusedto
construct
theseestimates.
Standarderrors
areshownin
parentheses.
**Sign
ificantat
the5%
level.
***
Sign
ificantat
the1%
level.
This content downloaded from 018.004.054.097 on February 29, 2016 12:07:25 PMAll use subject to University of Chicago Press Terms and Conditions (http://www.journals.uchicago.edu/t-and-c).

scores of 220 in both math and ELA; for the graduating class of 2010 andonward, standardswere increased to require Proficient scores of at least 240in math, ELA, and science.9 Consistent with the score gains documented intable 3, charter attendance boosts the likelihood of meeting competencystandards, with a gain of 15 points. This estimate also appears in column 2of table 4.Beginningwith the high school class of 2005, the state has used theMCAS
to determine qualification for public university tuition waivers, an awardknown as the Adams Scholarship. Qualification for an Adams Scholar-ship requires an MCAS score in the Advanced category in either ELA ormath, a score that is at least Proficient in the subject where the Advancedstandard is not met, and a total MCAS score in the upper quartile of thedistribution of scores in a scholarship candidate’s home school district.10
Awardees qualify for a tuition waiver at a Massachusetts public college oruniversity.11 As can be seen at the bottom of column 2 of table 4, charterattendance increases the likelihood of qualifying for an Adams Scholar-ship by 24 percentage points. This finding is notable in view of concernsregarding racial imbalance in eligibility for some scholarship programsðDynarski 2000Þ. Attendance at Boston charter schools increases scholar-ship eligibility for a mostly poor minority population.The nature of the charter-induced shift in the distribution of MCAS
scores emerges clearly in figure 1. This figure plots estimated score distri-butions for lottery compliers, that is, for applicants who take a charter seatwhen offered one in a lottery but enroll in a traditional public school oth-erwise.We plot densities for compliers because, as with our 2SLS estimates,such comparisons are purged of the selection bias that contaminates anunadjusted contrast between those who do and do not enroll in a charterschool. Comparisons for compliers therefore have a causal interpretation.Complier distributions are estimated here by adapting methods intro-
duced by Abadie ð2002, 2003Þ. Specifically, for a grid of values, v, in thesupport of an outcome variable, yi, we estimate equations of the followingform:
Khðv2 yiÞð12CiÞ5 ojk0jðvÞdij 1 g0ðvÞð12CiÞ1 u0iv; ð3Þ
Khðv2 yiÞCi 5 ojk1jðvÞdij 1 g1ðvÞCi 1 u1iv; ð4Þ9 See http://www.doe.mass.edu/mcas/graduation.html for details. Updated rules
include an exception for students who pass the Needs Improvement threshold onlyand also meet personal goals. We ignore this exception here.
10 Charter school students can earn a scholarship in either the district of atten-dance ðthe charter schoolÞ or the district of residence ðBostonÞ. The Adams Schol-arship cutoff is defined here using BPS thresholds.
11 Cohodes andGoodman ð2014Þ estimate effects of Adams Scholarships on col-lege enrollment and choice, showing these appear to increase enrollment in publicuniversities in spite of the fact that they cover only a small portion of college costs.
Effects of Boston’s Charter High Schools 000
This content downloaded from 018.004.054.097 on February 29, 2016 12:07:25 PMAll use subject to University of Chicago Press Terms and Conditions (http://www.journals.uchicago.edu/t-and-c).
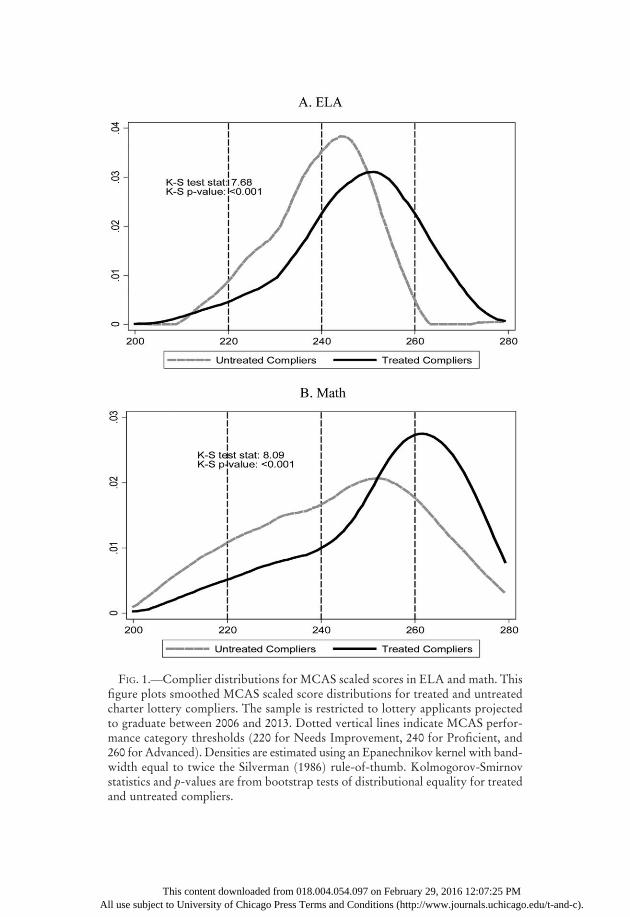
FIG. 1.—Complier distributions for MCAS scaled scores in ELA and math. Thisfigure plots smoothed MCAS scaled score distributions for treated and untreatedcharter lottery compliers. The sample is restricted to lottery applicants projectedto graduate between 2006 and 2013. Dotted vertical lines indicate MCAS perfor-mance category thresholds ð220 for Needs Improvement, 240 for Proficient, and260 for AdvancedÞ. Densities are estimated using an Epanechnikov kernel with band-width equal to twice the Silverman ð1986Þ rule-of-thumb. Kolmogorov-Smirnovstatistics and p-values are from bootstrap tests of distributional equality for treatedand untreated compliers.
This content downloaded from 018.004.054.097 on February 29, 2016 12:07:25 PMAll use subject to University of Chicago Press Terms and Conditions (http://www.journals.uchicago.edu/t-and-c).
where charter attendance Ci is treated as an endogenous regressor and in-strumentedwith lottery offers.HereKhðvÞ5 ð1=2ÞKðv=hÞ is a kernel func-tion with bandwidth h. The resulting estimates of g1ðvÞ and g0ðvÞ describedensities for treated ðcharterÞ and untreated ðnoncharterÞ compliers.12
The x-axis in figure 1 marks MCAS score category cutoffs; these occurat 20-point intervals. Charter school attendance clearly pushes the first-attempt score distribution into the upper-three score groups. The effect ofcharter attendance on ELA scores is striking: very few noncharter stu-dents achieve at an Advanced level, while many charter students are in theAdvanced group. Kolmogorov-Smirnov tests of distributional equality sug-gest that the distributional shifts documented in this figure are very unlikelyto be a chance finding.
B. Grade Progression and High School Graduation
Does charter attendance also increase high school graduation rates? Per-haps surprisingly given the gains in test score graduation requirements re-ported in column 2 of table 4, the estimates in column 4 of this table suggestnot. In fact, charter attendance reduces the likelihood a student graduates ontime by 14.5 percentage points, a statistically significant effect.13 This neg-ative estimate falls to zero when the outcome is graduation within 5 yearsof ninth-grade entry. Interestingly, charter schools appear nomore likely tocause students to repeat ninth, tenth, or eleventh grade than are traditionalpublic schools. This is apparent from an analysis of effects on the likelihoodof starting twelfth grade on time. Instead, it appears that many charterstudents take an additional twelfth-grade year to graduate, perhaps due totheir more rigorous graduation requirements. The subset of students takingan additional year in high school may be substituting the high school yearfor remediation in community college.14
C. SAT-Taking and Scores
The SAT is a major milestone for college-bound high school students,and for many it is a major hurdle on the path to college. Designed to bechallenging for all takers, SAT scores are a special concern for low-incomeand minority applicants. Gaps in SAT scores by race and socioeconomic
12 The grid for v covers each percentile of the observed MCAS distribution; thekernel is Epanechnikov, with bandwidth twice the Silverman ð1986Þ rule-of-thumb.Walters ð2013Þ shows that this method produces consistent estimates of densityfunctions for compliers.
13 On-time graduation dates are determined by counting from the entry grade tograde 12.
14 High school is less expensive for the student, but Massachusetts communitycollege per pupil expenditures are around $10,000 per student, compared to about$14,000 in high school.
Effects of Boston’s Charter High Schools 000
This content downloaded from 018.004.054.097 on February 29, 2016 12:07:25 PMAll use subject to University of Chicago Press Terms and Conditions (http://www.journals.uchicago.edu/t-and-c).

status that might be attributable to family background and school qualityare further accentuated by the willingness of higher-income families to in-vest in SAT preparation classes ðsee, e.g., Bowen and Bok 2000Þ.Many high schoolers in Boston’s traditional public schools take the SAT,
and charter attendance does little to change this rate. As can be seen in thefirst two columns of table 5, nearly two-thirds of noncharter students inour applicant sample take the SAT, while the estimated effect of charterattendance on SAT-taking is about 8 points, a gap far from statisticalsignificance.15
SAT scores are much lower in Boston than in the rest of the state, withfewer than 10% of noncharter students in our applicant sample scoringabove the state median on the composite test ðthe sum of math, verbal, andwriting scoresÞ. About three-quarters of noncharter students score in thelowest quartile of the state distribution or do not take the SAT. Charterattendance increases the share of students scoring above the bottom quar-tile by 15 percentage points ðfrom 27% to 42%, as can be seen in col. 6Þ.16Gains in math contribute most to this boost in composite scores; effectson verbal and writing scores are smaller, though still statistically signifi-cant. Charter attendance increases the probability that applicants earn anSAT reasoning score ðthe sum of math and verbalÞ above the state median,with math again the largest contributor to this gain.Table 5 also reports SAT score effects estimated in samples limited to
those who take the test. Because charter attendance has little effect on thedecision to take the SAT, such conditional comparisons are unlikely to bebiased by compositional shifts. These conditional results show that Bos-ton’s charters have large and statistically significant effects on SAT scores,especially in math. Specifically, charter attendance boosts average mathscores by 52 points, a gain that amounts to over four-tenths of a standarddeviation in the US score distribution.17 This is almost as large ðin standarddeviation unitsÞ as the MCAS math effect reported in table 3, suggestingthat the gains in math skills demonstrated on the MCAS carry over to theSAT. The score gain in verbal and writing is about 26 points in each sub-ject. Although charter attendance has smaller effects on verbal and writingscores, the composite SAT score gain is estimated to be about 104 points,
15 Charter applicants are positively selected, as shown by their somewhat higherbaseline test scores than the general BPS population. Similarly, the SAT-takingrate among applicants of 0.63 exceeds the SAT-taking rate of 0.49 in the noncharterBPS population.
16 In this calculation, we assign an SAT score of zero to those who do not takethe test.
17 Means ðand standard deviationsÞ of the US SAT distribution in 2012 were 512ð117Þ in math, 496 ð114Þ in verbal, 488 ð114Þ in writing, 1010 ð214Þ for reasoning,and 1498 ð316Þ for the composite.
000 Angrist et al.
This content downloaded from 018.004.054.097 on February 29, 2016 12:07:25 PMAll use subject to University of Chicago Press Terms and Conditions (http://www.journals.uchicago.edu/t-and-c).

Tab
le5
Lottery
Estim
ates
ofEffects
onSA
TTest-Tak
ingan
dScores
TookSA
TReasoningðT
opScore
51600Þ
Composite
ðTopScore
52400Þ
Noncharter
Mean
Effect
Noncharter
Mean
Effect
Noncharter
Mean
Effect
ð1Þ
ð2Þ
ð3Þ
ð4Þ
ð5Þ
ð6Þ
TookSA
T.635
.084
½.481
�ð.0
63Þ
Score
above
bottom
quartile
.267
.165***
.265
.147***
½.443�
ð.057
Þ½.4
41�
ð.056Þ
Score
above
median
.103
.124***
.094
.108***
½.304�
ð.041
Þ½.2
92�
ð.036Þ
Score
intopquartile
.033
.017
.027
.008
½.178�
ð.016
Þ½.1
62�
ð.016Þ
Average
score
ðfortakersÞ
855.5
78.1***
1,268.2
104.3***
½173.9�
ð23.9Þ
½250.3�
ð34.3Þ
Mathð800Þ
Verbal
ð800Þ
Writingð800Þ
Noncharter
Mean
Effect
Noncharter
Mean
Effect
Noncharter
Mean
Effect
ð1Þ
ð2Þ
ð3Þ
ð4Þ
ð5Þ
ð6Þ
Score
above
bottom
quartile
.315
.174**
.271
.139***
.289
.101*
½.465
�ð.0
68Þ
½.445�
ð.054
Þ½.4
53�
ð.056Þ
Score
above
median
.126
.166***
.112
.086**
.104
.079**
½.332
�ð.0
49Þ
½.315�
ð.042
Þ½.3
06�
ð.037Þ
Score
intopquartile
.042
.065**
.034
.011
.029
.037
½.201
�ð.0
27Þ
½.180�
ð.019
Þ½.1
67�
ð.024Þ
Average
score
ðfortakersÞ
439.1
52.1***
416.4
26.0**
412.7
26.2**
½98.3�
ð14.3Þ
½91.0�
ð12.9Þ
½89.3�
ð12.6Þ
NOTE.—
Thistablereportstw
o-stage
leastsquares
estimates
oftheeffectsofBostoncharterattendance
onSA
Ttest-takingandscores.Thesampleincludes
studentsprojected
tograduatebetween2007
and2013.S
AToutcomes
arecoded
usingthelasttesttaken
byeach
student.Theaveragescore
outcomeisforasampleofSA
Ttakers.Other
outcomes
are
equalto
zero
fornon-SATtakers.Score
quartilevalues
arefrom
thedistributionofMassachusettsSA
Ttakers.Maxim
um
possiblescoresareshownin
parentheses
nextto
outcome
labels.Thenoteto
table3detailsthe2SLSmodelsusedto
constructtheestimates.Standarddeviationsareshownin
brackets,andstandarderrorsareshownin
parentheses.N
oftotal
sample
53,672;
Nofsample
takingtheSA
T5
2,378.
*Sign
ificantat
the10
%level.
**Sign
ificantat
the5%
level.
***
Sign
ificantat
the1%
level.
This content downloaded from 018.004.054.097 on February 29, 2016 12:07:25 PMAll use subject to University of Chicago Press Terms and Conditions (http://www.journals.uchicago.edu/t-and-c).
a large and statistically significant result. The gain here amounts to almostone-third of a standard deviation in the US composite score distribution.The corresponding effect on SAT reasoning is 78 points, also a large gain.The effect of charter attendance on the SAT score distribution is sum-
marized in figure 2, which plots the distribution of SAT scores for treatedand untreated lottery compliers ðestimated as in fig. 1Þ. Charter school at-tendance causes a pronounced rightward distributional shift in all threeSAT subjects, as well as for the composite score. Formal statistical tests ofdistributional equality suggest these shifts are very unlikely to be a chancefinding. On balance, Boston’s charter high schools produce substantialgains on the SAT as well as the MCAS.
D. AP-Taking and Scores
Advanced Placement coursework allows high schoolers to experiencethe rigor of college-level courses and potentially earn college credit. Fiveof the six charter schools in our sample offer AP classes, and one schoolrequires its students to pass AP exams in order to graduate. As shown intable 6, charter school attendance increases the probability that a studenttakes at least one AP exam by 30 percentage points. Consequently, almost60% of charter students take at least one AP test, compared with 28% ofstudents in traditional public schools.18
Charter attendance increases the average number of AP tests that stu-dents take by over a full exam, a result that can be seen in the second rowof table 6. Gains in AP scores are more modest. Charter school attendanceincreases the likelihood of taking a test and earning a score of at least 2 by16 percentage points, a statistically and quantitatively significant gain. Buta score of 3 or better is required to earn college credit, and many collegesand universities require at least a 4. Charter attendance increases the prob-ability of earning a score of 3 by 12 percentage points, a large effect relativeto the noncharter mean of 8%. At the same time, charter attendance gen-erates no significant increase in the likelihood of earning a 4 or 5.19 Notethat by including zeros for nontakers in this analysis of score impact, weavoid bias from possible composition effects due to the large effect of charterattendance on the likelihood applicants take a test.AP results by subject, reported in columns 3–10 of table 6, show a large
increase in the likelihood charter applicants take tests in science, calculus,
18 The AP-taking effect does not reflect a lack of AP options in traditionalpublic schools. BPS schools offer AP classes at the same or higher rates thancharter schools. See online appendix tables C3 and C4 for details.
19 The University of Massachussetts–Amherst and the University of Massachus-setts–Boston require at least a 4 on the AP Calculus exam for college credit, athreshold that most Boston students do not meet.
000 Angrist et al.
This content downloaded from 018.004.054.097 on February 29, 2016 12:07:25 PMAll use subject to University of Chicago Press Terms and Conditions (http://www.journals.uchicago.edu/t-and-c).

FIG.2.—Complier
distributionsforSA
Tscores.Thisfigu
replots
smoothed
SATscore
distributionsfortreatedanduntreatedcharterlottery
compliers.Thesample
isrestricted
tolotteryapplicants
whoareprojected
tograduatebetween2007
and2013.Densities
areestimated
usingan
Epanechnikovkernelwithbandwidth
equal
totw
icetheSilverman
ð1986Þ
rule-of-thumb.K
olm
ogo
rov-Sm
irnovstatistics
andp-values
arefrom
bootstrap
testsofdistributional
equalityfortreatedanduntreatedcompliers.
This content downloaded from 018.004.054.097 on February 29, 2016 12:07:25 PMAll use subject to University of Chicago Press Terms and Conditions (http://www.journals.uchicago.edu/t-and-c).

Tab
le6
Lottery
Estim
ates
ofEffects
onAdv
ancedPlacem
entTest-Tak
ingan
dScores
AllAPExams
Science
Calculus
USHistory
English
Noncharter
Mean
Effect
Noncharter
Mean
Effect
Noncharter
Mean
Effect
Noncharter
Mean
Effect
Noncharter
Mean
Effect
ð1Þ
ð2Þ
ð3Þ
ð4Þ
ð5Þ
ð6Þ
ð7Þ
ð8Þ
ð9Þ
ð10Þ
Tookexam
.279
.298***
.103
.308***
.070
.223***
.041
.181**
.162
.083
ð.062Þ
ð.052Þ
ð.061Þ
ð.078Þ
ð.069Þ
No.ofexam
s.586
1.037***
.119
.293***
ð.245Þ
ð.060Þ
Score
2orhigher
.156
.162**
.035
.067**
.025
.128***
.029
.087**
.105
.067
ð.064Þ
ð.030Þ
ð.049Þ
ð.041Þ
ð.048Þ
Score
3orhigher
.083
.122**
.020
.045**
.019
.108***
.019
.058***
.035
.038
ð.051Þ
ð.018Þ
ð.039Þ
ð.022Þ
ð.026Þ
Score
4or5
.046
.050
.011
2.003
.011
.036*
.011
.021
.014
.008
ð.032Þ
ð.010Þ
ð.020Þ
ð.017Þ
ð.012Þ
NOTE.—
Thistablereportstw
o-stage
leastsquares
estimates
oftheeffectsofBostoncharterattendance
onAPtest-takingandscores.Thesampleincludes
studentsprojected
tograduatebetween2007
and2013.Outcomes
areequal
tozero
fornontakers.Science
subjectsincludeBiology
,Chem
istry,Physics
B,Physics
Mechanics,Physics
Electricity/
Magnetism,ComputerScience
A,ComputerScience
AB,andEnvironmentalScience.Outcomes
forcalculuscombineCalculusAB
andCalculusBC.Outcomes
forEnglish
combineEnglishLiterature
andEnglishLangu
age.Thenote
totable
3detailsthe2SLSmodelsusedto
construct
theseestimates.Standarderrors
areshownin
parentheses.N
53,672.
*Sign
ificantat
the10
%level.
**Sign
ificantat
the5%
level.
***
Sign
ificantat
the1%
level.
This content downloaded from 018.004.054.097 on February 29, 2016 12:07:25 PMAll use subject to University of Chicago Press Terms and Conditions (http://www.journals.uchicago.edu/t-and-c).
and history, three of the most common categories of AP exams. Parallel-ing charters’ large effect onMCASmath scores, the clearest AP score gainsemerge for calculus. Charter attendance boosts the probability of takingthe AP Calculus test by 22 percentage points and increases the likelihoodof earning a score of at least 2 by nearly 13 points. The corresponding im-pact on the likelihoodof earning a 3 onAPCalculus is 11 percentage points;relative to the noncharter mean of 1.9%, this implies that charter atten-dance more than quintuples the chances a student earns a 3 in calculus.There is also an effect on the 4 or higher threshold, with charter attendanceincreasing the likelihood of scoring in the highest categories by a mar-ginally significant 3.6 percentage points. This is more than three times theprobability of scoring 4 or higher for noncharter students. Charter atten-dance also increases AP scores in science and US history, with more stu-dents scoring above a 2 and above a 3 in both subjects. Charter schools havelittle effect on AP English test-taking or scores.
V. College Enrollment and Choice
The charter schools in this study focus on college readiness. Nearly halfof the applicants in our sample enroll in college immediately in the fall af-ter graduation, while 60% start college within 18 months of expected highschool graduation.While the estimated effect of charter attendance on col-lege attendance is positive, it is not large enough to generate a statisticallysignificant gain. This can be seen in the first row of table 7, which reportsenrollment rates and charter effects for two subsamples. The first sampleincludes cohorts for whomwe have college attendance data for the fall im-mediately following their expected high school graduation ðthe “within6 months” sampleÞ. The second, smaller, sample includes cohorts we canfollow for an additional year ðthe “within 18 months” sampleÞ. Columns 2and 4 report enrollment effects on applicants who can be followed in thesetwo windows. The estimated enrollment effects of 0.028 and 0.075 are notprecise enough to rule out chance findings.While the estimates of overall enrollment effects are inconclusive, the
results in table 7 show a clear shift from 2-year colleges to 4-year colleges.Specifically, in the 6-month enrollment window, charter attendance de-creases 2-year attendance by 11 points, while increasing 4-year attendanceby13points.Thedecline in2-year attendance is again11points in the longertimewindow,while the estimated gain in 4-year attendance is an even larger18 percentage points. Gains in 4-year attendance are large enough to gen-erate highly significant estimates, with confidence intervals well away fromzero.The gains in 4-year enrollment documented in table 7 are driven en-
tirely by increases in attendance at public 4-year schools, with no effect
Effects of Boston’s Charter High Schools 000
This content downloaded from 018.004.054.097 on February 29, 2016 12:07:25 PMAll use subject to University of Chicago Press Terms and Conditions (http://www.journals.uchicago.edu/t-and-c).

on private attendance. The last row of table 7 shows that most of this gainis generated by enrollment at Massachusetts public colleges. In fact, theBoston campus of the University of Massachusetts is the modal institutionfor former charter students in our sample. The Adams Scholarship likelycontributes to this pattern, though college counseling may also play a role.In a recent study, Cohodes and Goodman ð2014Þ argue that Adams
Scholarship awards tend to reduce the selectivity of colleges chosen bymany scholarship winners. We therefore estimated the effects of charterattendance on college selectivity as measured by Barron’s rankings ðnotshownÞ. College selectivity downgrading does not appear to be a conse-quence of charter attendance, perhaps because most of Boston’s Adamsscholarship recipients come from lower-income backgrounds. The Cohodesand Goodman findings are driven by higher-income students who mightotherwise have attended private schools.In addition to college enrollment, we look briefly at college persistence,
asmeasured by the likelihood of enrolling for 3 or 5 semesters. The samplesavailable for such an analysis are necessarily smaller than those available tostudy college enrollment. Persistence results within 18 months of high
Table 7Lottery Estimates of Effects on College Enrollment
Within 6 Months Within 18 Months
Noncharter Mean Effect Noncharter Mean Effectð1Þ ð2Þ ð3Þ ð4Þ
Any postsecondary enrollment .497 .028 .596 .075ð.066Þ ð.081Þ
2-year .123 2.107** .186 2.108*ð.046Þ ð.061Þ
4-year .374 .134** .410 .183**ð.064Þ ð.073Þ
4-year public .143 .141*** .148 .145**ð.053Þ ð.060Þ
4-year private .231 2.007 .262 .038ð.069Þ ð.081Þ
4-year Massachusetts public .123 .121** .126 .115**ð.049Þ ð.057Þ
N 3,205 2,599
NOTE.—This table reports two-stage least squares estimates of the effects of Boston charter schoolattendance on college enrollment. Enrollment within 6 months ðcols. 1 and 2Þ is defined as enrollment bythe semester following a student’s projected high school graduation, while enrollment within 18 monthsðcols. 3 and 4Þ is defined as enrollment within two fall semesters after projected graduation. The within6 months enrollment sample includes students projected to graduate in 2012 or earlier. The within18 months sample includes students projected to graduate in 2011 or earlier. The note to table 3 details the2SLS models used to construct these estimates. Standard errors are shown in parentheses.
* Significant at the 10% level.** Significant at the 5% level.*** Significant at the 1% level.
000 Angrist et al.
This content downloaded from 018.004.054.097 on February 29, 2016 12:07:25 PMAll use subject to University of Chicago Press Terms and Conditions (http://www.journals.uchicago.edu/t-and-c).

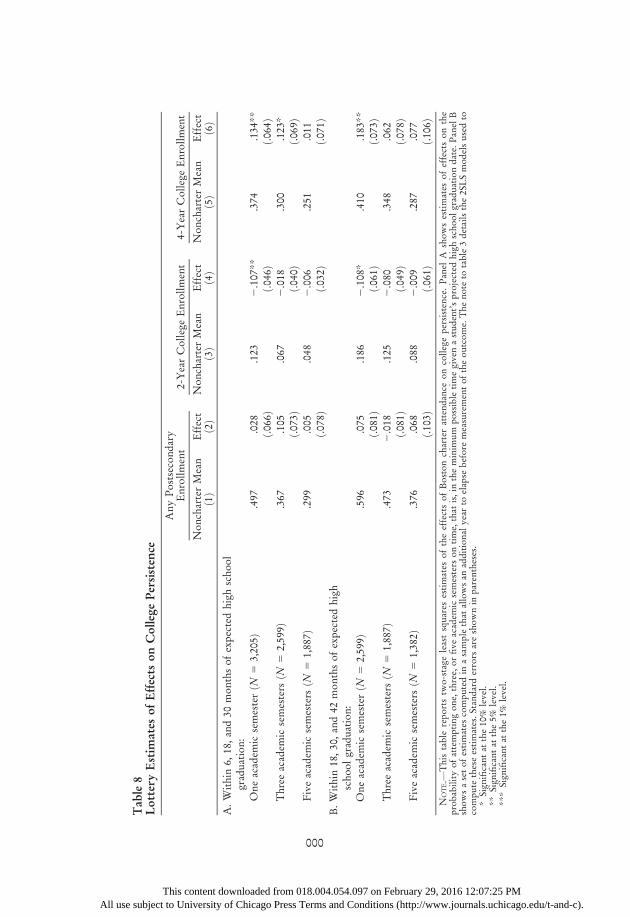
school graduation, reported in table 8, suggest that charter attendance in-creases the fraction of students who attempt at least 3 academic semestersat 4-year schools by about 12 points, a marginally significant effect. Thecorresponding estimate in panel B, computed in a sample window that al-lows an additional year to elapse before measurement of the outcome, issmaller ð6 percentage pointsÞ but less precisely estimated. Estimated effectson 5-plus semesters of enrollment are similarly imprecise.Taken together, the estimates reported here show that charter high school
attendance generates gains through college preparation and institutionalchoice as well as in short-run achievement. Figure 3 summarizes the rela-tionship between short-run and long-run impacts. This figure plots MCASestimates against estimates for longer-run outcomes for each of the within-risk-set experiments in our charter lottery data. Each risk set is representedby a bubble, with bubble sizes inversely proportional to the standard errorof theMCAS estimate for that risk set. As can be seen in panel A, SAT scoregains track MCAS gains closely. Likewise, risk sets where score gains arelarger also appear to generate larger 4-year enrollment effects, though herethe relationship between impacts is looser than for the two test scoresðshown in panel BÞ. These findings suggest that the short-run effects ofBoston’s charter high schools on MCAS scores are a reliable guide to theirlonger-run effects.
VI. Additional Results
A. Effects in Subgroups
Estimates of effects within subgroups pinpoint the characteristics ofstudents who benefit most from charter attendance. This section brieflysummarizes a large set of subgroup results reported in online appendix B.Results for most outcomes are similar for boys and girls. For example,estimates of effects on SAT scores and 4-year college enrollment are largeand positive for both boys and girls, though these gender-specific effectsare not precisely estimated. In view of evidence that many educational in-terventions do not work well for males, this finding seems noteworthyðsee, e.g., Anderson 2008; Angrist, Lang, and Oreopoulos 2009; Legewieand DiPrete 2012; Deming et al. 2014Þ.MCAS, SAT, and 4-year enrollment effects are larger for special needs
students than for other applicants. Similarly, students with baseline scoresbelow the sample median are more likely to gain from charter attendancethan are high-scorers.20 Effects on MCAS scores are somewhat larger for
20 Here the sample is split by whether the sum of baseline math and ELA scoresis below the median of this measure in the full MCAS ELA sample.
Effects of Boston’s Charter High Schools 000
This content downloaded from 018.004.054.097 on February 29, 2016 12:07:25 PMAll use subject to University of Chicago Press Terms and Conditions (http://www.journals.uchicago.edu/t-and-c).
Tab
le8
Lottery
Estim
ates
ofEffects
onCollege
Persistenc
e
AnyPostsecondary
Enrollment
2-YearCollegeEnrollment
4-YearCollegeEnrollment
NoncharterMean
Effect
NoncharterMean
Effect
NoncharterMean
Effect
ð1Þ
ð2Þ
ð3Þ
ð4Þ
ð5Þ
ð6Þ
A.Within
6,18,and30
monthsofexpectedhighschool
graduation:
Oneacadem
icsemesterðN
53,205Þ
.497
.028
.123
2.107**
.374
.134**
ð.066Þ
ð.046Þ
ð.064Þ
Threeacadem
icsemesters
ðN5
2,599Þ
.367
.105
.067
2.018
.300
.123*
ð.073Þ
ð.040Þ
ð.069Þ
Fiveacadem
icsemesters
ðN5
1,887Þ
.299
.005
.048
2.006
.251
.011
ð.078Þ
ð.032Þ
ð.071Þ
B.Within
18,30,and42
monthsofexpectedhigh
schoolgraduation:
Oneacadem
icsemesterðN
52,599Þ
.596
.075
.186
2.108*
.410
.183**
ð.081Þ
ð.061Þ
ð.073Þ
Threeacadem
icsemesters
ðN5
1,887Þ
.473
2.018
.125
2.080
.348
.062
ð.081Þ
ð.049Þ
ð.078Þ
Fiveacadem
icsemesters
ðN5
1,382Þ
.376
.068
.088
2.009
.287
.077
ð.103Þ
ð.061Þ
ð.106Þ
NOTE.—
This
table
reportstw
o-stage
leastsquares
estimates
oftheeffectsofBostoncharterattendance
oncollegepersistence.Panel
Ashowsestimates
ofeffectsonthe
probabilityofattemptingone,
three,
orfive
academ
icsemesters
ontime,that
is,in
theminim
um
possible
timegivenastudent’sprojected
highschoolgraduationdate.
Panel
Bshowsasetofestimates
computedin
asample
that
allowsan
additional
yearto
elapse
before
measurementoftheoutcome.
Thenote
totable
3detailsthe2SLSmodelsusedto
compute
theseestimates.Standarderrors
areshownin
parentheses.
*Sign
ificantat
the10
%level.
**Sign
ificantat
the5%
level.
***
Sign
ificantat
the1%
level.
000
This content downloaded from 018.004.054.097 on February 29, 2016 12:07:25 PMAll use subject to University of Chicago Press Terms and Conditions (http://www.journals.uchicago.edu/t-and-c).
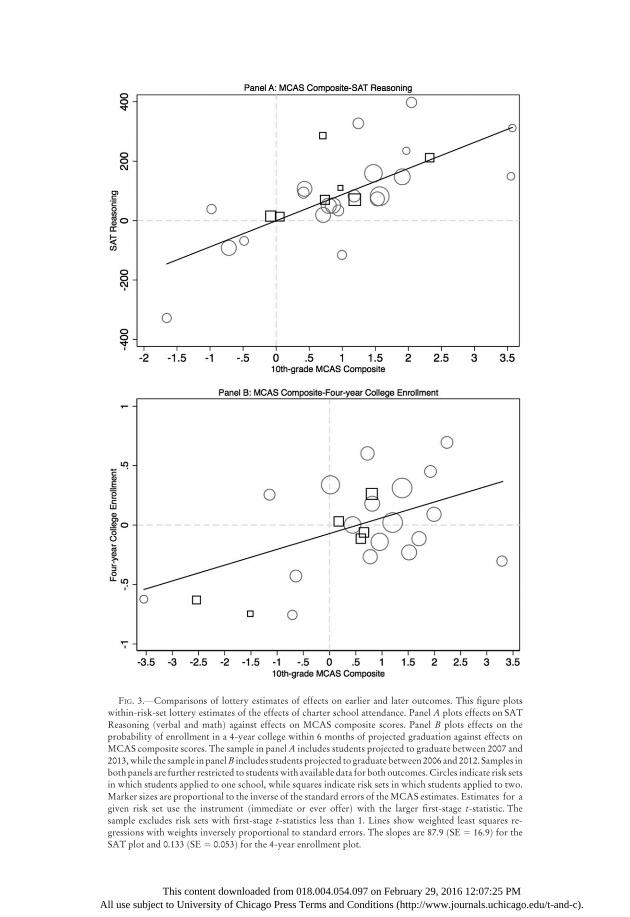
FIG. 3.—Comparisons of lottery estimates of effects on earlier and later outcomes. This figure plotswithin-risk-set lottery estimates of the effects of charter school attendance. Panel A plots effects on SATReasoning ðverbal and mathÞ against effects on MCAS composite scores. Panel B plots effects on theprobability of enrollment in a 4-year college within 6 months of projected graduation against effects onMCAS composite scores. The sample in panelA includes students projected to graduate between 2007 and2013,while the sample in panelB includes students projected to graduate between2006 and 2012. Samples inboth panels are further restricted to studentswith available data for both outcomes.Circles indicate risk setsin which students applied to one school, while squares indicate risk sets in which students applied to two.Marker sizes are proportional to the inverse of the standard errors of theMCAS estimates. Estimates for agiven risk set use the instrument ðimmediate or ever offerÞ with the larger first-stage t-statistic. Thesample excludes risk sets with first-stage t-statistics less than 1. Lines show weighted least squares re-gressions with weights inversely proportional to standard errors. The slopes are 87.9 ðSE 5 16.9Þ for theSAT plot and 0.133 ðSE 5 0.053Þ for the 4-year enrollment plot.
This content downloaded from 018.004.054.097 on February 29, 2016 12:07:25 PMAll use subject to University of Chicago Press Terms and Conditions (http://www.journals.uchicago.edu/t-and-c).

below-median students, and the effect on composite SAT scores is alsolarger for the lower-scoring group. The effect of charter attendance on4-year college enrollment is driven entirely by students whose scores arebelowmedian at baseline, andmuch of the 4-year effect on this group comesfrom an increase in the overall rate of college enrollment rather than a shiftfrom 2-year to 4-year institutions.The subgroup analysis shows a less consistent pattern by poverty status
ðas proxied by qualification for a subsidized lunchÞ, with the disadvan-taged group gaining more in college enrollment and AP-taking but less onthe SAT. This finding is notable given recent evidence that apparentlycollege-ready poor students often choose not to attend 4-year institutionsðBowen, Chingos, andMcPherson 2009; Hoxby andAvery 2012Þ. Overall,Boston’s charter high schools boost keyoutcomes formost subgroups,withlarge effects on at-risk groups, including boys, special education students,and those who enter high school with low achievement.21
B. The Peer Channel
Charter schools are sometimes said to generate gains by the selective re-tention of higher-performing students ðsee, e.g., Skinner 2009Þ. In thisview, charter effectiveness is at least partly attributed to a tendency to ejecttrouble-makers and stragglers, leaving a student population that is easierto teach. Importantly, the causal interpretation of our lottery-based esti-mation strategy is unaffected by selective retention because we follow allwinners and losers, regardless of whether they stay in the charter school.Moreover, the charter enrollment variable is “switched on” even for stu-dents who spend only a single day enrolled in a charter school. Thus, out-comes for poor-performing charter students who leave the school stillcount on the charter side of our IV estimation strategy.At the same time, selective retention, if substantial, may lead to a favor-
able population mix that generates positive peer effects on students whoremain enrolled in charters. In otherwords, charter schoolsmay dowell formost of their students in part because a few bad apples who would other-wise be disruptive to all are encouraged to leave. While not invalidatingthe evidence of gains reported here, this peer channel has different policyimplications than other explanations of charter effectiveness, such as dif-ferences in teacher quality or training.
21 In addition to looking at heterogeneity in effects across subgroups of stu-dents, we also asked whether the results are driven by any one charter school.Online appendix table B3 reports estimates for key outcomes in samples that dropdata for one school at a time. The results are similar across samples, suggesting thatthe overall results are not due to the performance of any one school.
000 Angrist et al.
This content downloaded from 018.004.054.097 on February 29, 2016 12:07:25 PMAll use subject to University of Chicago Press Terms and Conditions (http://www.journals.uchicago.edu/t-and-c).

We explore the peer channel by looking directly at school switching andhow this affects peer composition. School switching is defined as being ob-served in two or more schools after a lottery application. As shown inpanel B, column 1, of table 9, Boston’s charter lottery applicants are highlymobile: more than 40% of the sample changes schools by this measure.Column 2, which reports 2SLS estimates of effects on school switching,shows that charter enrollment raises the likelihood of a switch by about2 percentage points, though this change is not significantly different fromzero. The switching estimate increases to roughly 9 percentage points, againnot significant, when switching is defined to omit natural transitionalgrades such as from fifth to sixth ðsome charters have unusual grade struc-tures, a fact that might alter transition ratesÞ.Might this evidence of differential switching account for the charter
school gains reported here? Panel A assesses the explanatory power of thepeer channel by showing the effects of charter enrollment on peer qualitythroughout high school. Here, peer quality is defined as the average base-line test score of the studentswithwhom a lottery applicant attends school.Not surprisingly, given the positive selection of charter applicants, char-ter enrollment is associated with increases in peer achievement in the firstpost-lottery year: the effect here is roughly 0.19j in each subject. This com-positioneffectwouldbe even larger if not for the fact, documented in the lastrow of panel B, that charter enrollment reduces exam school enrollment. Inotherwords, the counterfactual for some charter students is an exam school,which also enrolls positively selected peers.Panel A also shows, however, that the positive effect of charter atten-
dance on peer quality falls through high school: peer composition effectsshrink as students progress through school and are not significantly dif-ferent from zero after the second year. The pattern of peer compositioneffects is driven, in part, by increasing peer quality in the schools attendedby those who lose charter lotteries. This is documented in figure 4, whichplots the profile of mean peer quality for charter lottery compliers sepa-rately by treatment status. Mean peer quality for compliers is estimatedusing methods similar to those used to construct the densities in figures 1and 2.22 Figure 4 documents a large initial gap in favor of lottery winners.This gap closes with time, as peer quality rises more sharply for complierswho lose the lottery. This pattern is likely driven by high dropout ratesat traditional public schools among students with the lowest baselinescores. These results suggest that positive charter effects cannot be attri-buted to low-quality peers leaving charter schools. If anything, selective
22 Specifically, we estimate versions of eqs. ð3Þ and ð4Þ that put the level of peercomposition on the left-hand side, without kernel weighting.
Effects of Boston’s Charter High Schools 000
This content downloaded from 018.004.054.097 on February 29, 2016 12:07:25 PMAll use subject to University of Chicago Press Terms and Conditions (http://www.journals.uchicago.edu/t-and-c).

Tab
le9
Lottery
Estim
ates
ofEffects
onScho
olSw
itch
ingan
dPe
erQua
lity
First
Yearafter
Lottery
SecondYearafter
Lottery
ThirdYearafter
Lottery
FourthYearafter
Lottery
Noncharter
Mean
Effect
Noncharter
Mean
Effect
Noncharter
Mean
Effect
Noncharter
Mean
Effect
ð1Þ
ð2Þ
ð3Þ
ð4Þ
ð5Þ
ð6Þ
ð7Þ
ð8Þ
A.Peerquality:
PeerbaselineELA
2.417
.188***
2.353
.137**
20.295
.081
2.276
.048
ð.061Þ
ð.064
Þð.0
64Þ
ð.060Þ
Peerbaselinemath
2.414
.193***
2.349
.139**
2.284
.116*
2.264
.066
ð.067Þ
ð.069
Þð.0
62Þ
ð.064Þ
Peerbaselinesum
ofELA
andmath
2.815
.368***
2.688
.277**
2.567
.197
2.528
.111
ð.125Þ
ð.129
Þð.1
23Þ
ð.120Þ
N3,841
3,881
3,557
3,467
B.Schoolsw
itching:
Anysw
itch
.403
.019
ð.072Þ
N3,772
Switch
excludingtransitional
grades
.365
.086
ð.071Þ
N3,758
Everattendan
exam
school
.162
2.084**
ð.036Þ
N3,920
NOTE.—
Thistable
reportstw
o-stage
leastsquares
estimates
oftheeffectsofBostoncharterattendance
onschoolsw
itchingandpeerquality.Thesample
includes
applicants
projected
tograduatebetween2006
and2013.Theanysw
itch
outcomeindicates
students
observed
intw
oormore
schools
atanytimeafterthelottery.Transitional
grades
are
excludingbyomittingsw
itches
afterthefirstschool’sexitgrade.Peerqualityismeasuredas
theaveragebaselinescore
ofother
studentsin
thesameschoolandyear.Thenoteto
table3
detailsthe2SLSmodelsusedto
compute
theseestimates.Standarderrors
areshownin
parentheses.
*Sign
ificantat
the10%
level.
**Sign
ificantat
the5%
level.
***Sign
ificantat
the1%
level.
000
This content downloaded from 018.004.054.097 on February 29, 2016 12:07:25 PMAll use subject to University of Chicago Press Terms and Conditions (http://www.journals.uchicago.edu/t-and-c).

FIG. 4.—Peer quality for charter lottery compliers. This figure plots mean peerquality in the first, second, third, and fourth years after the lottery for treated anduntreated charter lottery compliers. The sample includes lottery applicants whoare projected to graduate between 2006 and 2013. Peer quality is measured as theaverage baseline score for other students in the same school and year.
000
This content downloaded from 018.004.054.097 on February 29, 2016 12:07:25 PMAll use subject to University of Chicago Press Terms and Conditions (http://www.journals.uchicago.edu/t-and-c).

exit of low achievers is more pronounced at Boston’s traditional publicschools.23
VI. Conclusion
This paper uses randomized admission lotteries to ask whether Boston’scharter high schools affect outcomes beyond the standardized tests thatare used for statutory accountability reviews and charter renewal. Charterschools may be particularly likely to “teach to the test,” since they are atrisk of closure if their students score poorly. We therefore estimate chartereffects on high school graduation, college attendance, and college choice,outcomes that are more clearly linked to long-term economic well-beingthan state assessments.We also look at performance on SAT andAdvancedPlacement subject exams, assessments not directly involved with account-ability that might also be connected with postsecondary gains. Our esti-mates suggest that Boston’s charters improve educational outcomes in manydomains.24
Charter attendance has no clear effect on high school graduation, thoughcharter students take slightly longer to complete their degrees. Charterattendance also has no statistically significant effect on the overall likeli-hood of college enrollment, but it shifts students away from 2-year insti-tutions and toward 4-year colleges. The shift toward 4-year colleges isconsistent with the substantial gains in college readiness seen for charterstudents. In particular, charter attendance more than doubles the likeli-hood of sitting for an Advanced Placement exam, with especially large ef-fects on the likelihood of taking and passing AP Calculus. This finding isnoteworthy since very few poor nonwhite students in Boston ðor otherurban areasÞ take and pass AP Calculus.Charters significantly increase SAT scores, with charter students scor-
ing a third of a standard deviation higher than students in Boston’s tradi-tional public schools. Charter attendance also increases the probability thatstudents pass the score thresholds for high-stakes exams required for highschool graduation and boosts the likelihood that students qualify for anexam-based public college scholarship. Boston’s charter high schools seem
23 We also explored the importance of the peer channel by estimating 2SLSmodels where the endogenous variable is peer quality. The results of this analysisare reported in online appendix table B5. These models imply that, in order forpeers to account for the estimated effect of charters, a 1j increase in initial peerquality must improve a student’s test score by between 1.8 and 2j. This peer mul-tiplier is implausibly large relative to peer effects estimated elsewhere, includingHoxby ð2000Þ ð0.3–0.5jÞ, Hanushek et al. ð2003Þ ð0.15–0.24jÞ, and other studiessummarized in Sacerdote ð2011Þ’s recent survey.
24 Also weighing against the “teaching to the test” hypothesis, Cohodes ð2015Þreports no difference in effects on frequently and infrequently tested MCAS itemareas for a sample of Boston middle school charters.
000 Angrist et al.
This content downloaded from 018.004.054.097 on February 29, 2016 12:07:25 PMAll use subject to University of Chicago Press Terms and Conditions (http://www.journals.uchicago.edu/t-and-c).
to be highly effective for subgroups that are often difficult to serve, includ-ing boys, special education students, and students with low achievement athigh school entry.In view of often-voiced concerns about the effect of charter schools on
student attrition, we looked briefly at charter attendance effects on schoolswitching and peer composition. Charter students have somewhat higherbaseline test scores than other Boston students. At the same time, we seethat charter attendance does not produce increasingly favorable selectionof peers. In fact, charter peers become more like peers at traditional pub-lic schools as students progress through high school because attrition forweak students is even more pronounced in the traditional public sector. Ittherefore seems unlikely that changes in peer composition are the primarydriver of our findings.A final important result is the correlation between gains on state-
mandated assessments and gains elsewhere. While MCAS scores may notbe of intrinsic interest, schools that tend to boost these also tend to increaseSAT scores and 4-year college enrollment. In other words, causal effects onMCAS scores appear to predict effects that may be more closely tied tohuman capital and earnings.As a caveat, it is worth noting that our results apply to charter lottery
applicants, a group that may differ from nonapplicants. In addition, ourestimates may not reflect the effects of expanding the number of seats inBoston’s charter sector, which depend on the supply of teachers and otherinputs, as well as potential effects of changes in peer mix for students whoremain in traditional public schools. The estimates reported here showgains for recent cohorts of charter applicants. As these cohorts continueto progress through college and enter the labor market, we plan to use ourlottery-based research design to determine whether the effects reportedhere extend to college completion, employment, and earnings.
Appendix AData Appendix
Lists of charter applicants and lottery winners are constructed fromrecords provided by individual charter schools. Information on schoolsattended and student demographics come from the Student InformationManagement System ðSIMSÞ, a centralized database that covers all publicschool students in Massachusetts. Test scores are from the MassachusettsComprehensive Assessment System ðMCASÞ. Advanced Placement ðAPÞand Scholastic Aptitude Test ðSATÞ scores are provided by the CollegeBoard. College attendance information comes from the National StudentClearinghouse ðNSCÞ. This appendix describes each data source anddetailsthe procedures used to clean and match them.
Effects of Boston’s Charter High Schools 000
This content downloaded from 018.004.054.097 on February 29, 2016 12:07:25 PMAll use subject to University of Chicago Press Terms and Conditions (http://www.journals.uchicago.edu/t-and-c).

Lottery Data
Data Description and Sample Restrictions
Our sample of applicants is obtained from records of lotteries held at sixMassachusetts charter schools between 2002 and 2009. The participatingschools and lottery years are listed in table A1. A total of 26 school-specificentry cohorts are included in the analysis. Lotteries for three participatingschools, Match High, Codman Academy, and City on a Hill, were con-ducted for entry to ninth grade; two schools, Boston Preparatory andAcad-emy of the Pacific Rim, held lotteries for sixth-grade entry. Records forBoston Collegiate are from fifth-grade entry lotteries.The raw lottery records typically include applicant names, dates of birth,
contact information, and other information used to define lottery groups,such as sibling status. The first five rows in table A1 show the sample re-strictions we impose on the raw lottery records. We exclude duplicate ap-plicants and applicants listed as applying to the wrong entry grade.We alsodrop late applicants, out-of-area applicants, and sibling applicants, as thesegroups are typically not included in the standard lottery process. Impos-ing these restrictions reduces the number of lottery records from 9,256 to8,851.
Lottery Offers
In addition to the data described above, the lottery records also includeinformation regarding offered seats. We used this information to recon-struct indicator variables for whether lottery participants received ran-domized offers. We make use of two sources of variation in charter offers,which differ in timing. The immediate offer instrument captures offersmade on the day of the charter school lottery. Thewaitlist offer instrumentcaptures offers made later, as a consequence of movement down a ran-domly sequenced waiting list. The pattern of instrument availability acrossschools and applicant cohorts is documented in panel B of appendixtable A1. In some years, all applicants eventually received offers, in whichcase only the immediate offer instrument contributes to the analysis; thesecases are listed as “Exhausted” for the waitlist offer instrument. As docu-mented in table 2, immediate and waitlist offer rates were 31% and 35%,respectively, in our MCAS analysis sample, and these rates were similar inthe samples for other outcomes.
SIMS Data
Data Description
Our study uses SIMS data from the 2001–2 school year through the2012–13 school year. The SIMS records information on demographics and
000 Angrist et al.
This content downloaded from 018.004.054.097 on February 29, 2016 12:07:25 PMAll use subject to University of Chicago Press Terms and Conditions (http://www.journals.uchicago.edu/t-and-c).
schools attended for all students in Massachusetts public schools. An ob-servation in the SIMS refers to a student in a school in a year, though thereare some student-school-year duplicates for students that switch grades orprograms within a school and year. The SIMS includes a unique studentidentifier known as the SASID, which is used tomatch students from otherdata sources as described below.
Coding of Demographics and Attendance
The SIMS variables used in our analysis include grade, year, name, townof residence, date of birth, gender, race, special education and limitedEnglish proficiency status, free or reduced-price lunch receipt, and school at-tended. We constructed a wide-format data set that captures demographicand attendance information for every student in each year in which he orshe is present in a Massachusetts public school. This file uses informationfrom the longest-attended school in the first calendar year spent in eachgrade. Attendance ties were broken at random; this affects only 0.007% ofrecords. Students classified as special education, limited English profi-ciency, or eligible for a free or reduced-price lunch in any record within aschool-year-grade retain that designation for the entire school-year-grade.The SIMS also includes exit codes for the final time a student is observed inthe database. These codes are used to determine high school graduates andtransfers.Wemeasure charter school attendance in ninth or tenth grade. A student
is coded as attending a charter in his or her ninth-grade or tenth-grade yearwhen there is any SIMS record reporting charter attendance in that year.Students who attend more than one charter school within a year are as-signed to the charter they attended longest.
MCAS Data
We use MCAS data from the 2001–2 school year through the 2012–13school year. Each observation in the MCAS database corresponds to astudent’s test results in a particular grade and year. The MCAS outcomesof interest are math and English language arts ðELAÞ tests in grade 10. Wealso use baseline tests taken prior to charter application, which are fromfourth grade or eighth grade depending on a student’s application grade.The raw test score variables are standardized to have mean zero and stan-dard deviation one within a subject-grade-year in Massachusetts. We alsomake use of scaled scores, which are used to determine whether studentsmeetMCAS thresholds, which areNeeds Improvement, Proficient, andAd-vanced. Unless otherwise noted, we only use the first test taken in a par-ticular subject and grade.
Effects of Boston’s Charter High Schools 000
This content downloaded from 018.004.054.097 on February 29, 2016 12:07:25 PMAll use subject to University of Chicago Press Terms and Conditions (http://www.journals.uchicago.edu/t-and-c).

AP and SAT Data
We use AP and SAT data files provided to the Massachusetts Depart-ment of Elementary and Secondary Education ðDESEÞ by the CollegeBoard. The AP and SAT files include scores on all AP exams and SAT testsfor graduation cohorts 2007 and 2013; for studentswho took the SATmorethan once, the file includes only the score for themost recent exam. TheAPand SATfiles also include SASID identifiers, which are used tomerge theseoutcomes with the SIMS database.
NSC Data
Data on college outcomes comes from the National Student Clearing-house ðNSCÞ database, which captures enrollment for 94% of under-graduates in Massachusetts. We combine information from five separatesearches of the NSC database:
• A 2010 search for all students in the SIMS database between 2002–9with projected graduation years earlier than 2014, assuming normalacademic progress from the last observed grade and year ðnot re-stricted to students who graduated high schoolÞ
• A 2011 search of students who graduated from Massachusetts publichigh schools in the class of 2010
• A 2012 search of all students who graduated from Massachusettspublic high schools in the classes of 2003–10
• A 2013 search of students who graduated from Massachusetts publichigh schools in the classes of 2003–12
• A 2013 search of all students in the charter applicant sample with theprojected graduation between 2006–13
All students in our charter applicant sample were included in the 2010NSC search, and Massachusetts high school graduates were included inmultiple searches. College types are coded using the first attended collegeafter the last date a student is observed in the SIMS. NSC searches wereconducted using criteria like name and date of birth; the NSC files alsoinclude SASIDs, which are used to merge the college outcomes with theSIMS database.
Matching Data Sets
TheMCAS,AP, SAT, andNSCdata files aremerged to themaster SIMSdata file using the unique SASID identifier. The lottery records do notinclude SASIDs; these records arematchedmanually to the SIMS by name,application year, and application grade. In some cases, this procedure didnot produce a unique match. We accepted some matches based on fewer
000 Angrist et al.
This content downloaded from 018.004.054.097 on February 29, 2016 12:07:25 PMAll use subject to University of Chicago Press Terms and Conditions (http://www.journals.uchicago.edu/t-and-c).

criteriawhere the information on grade, year and townof residence seemedto make sense.Our matching procedure successfully located most applicants in the
SIMS database. The sixth row of panel A of table A1 reports the numberof applicant records matched to the SIMS in each applicant cohort. Theoverall match rate across all cohorts was 94% ð8,342/8,851Þ.Once matched to the SIMS, each student is associated with a unique
SASID; at this point, we can therefore determine which students appliedto multiple schools in our lottery sample. Following the match, we re-shape the lottery data set to contain a single record for each student. Ifstudents applied in more than 1 year, we keep only records associated withthe earliest year of application. Our lottery analysis also excludes studentswho did not attend a Boston Public Schools ðBPSÞ school at baseline, asstudents applying from private schools have lower follow-up rates. Thisrestriction eliminates 22% of charter applicants. Of the remaining 4,711charter applicants, 3,685 ð78%Þ contribute a score to our MCAS ELAanalysis.
Effects of Boston’s Charter High Schools 000
This content downloaded from 018.004.054.097 on February 29, 2016 12:07:25 PMAll use subject to University of Chicago Press Terms and Conditions (http://www.journals.uchicago.edu/t-and-c).

Tab
leA1
Lottery
Records
A.Sample
RestrictionsbyProjected
SeniorYear
2006
2007
2008
2009
2010
2011
2012
2013
All
Totalnumber
ofrecords
600
450
940
883
1,117
1,533
1,753
1,980
9,256
Excludingdisqualified
applicants
600
450
940
883
1,117
1,530
1,753
1,968
9,241
Excludinglate
applicants
590
446
930
880
1,117
1,530
1,733
1,968
9,194
Excludingapplicants
from
out
ofarea
590
446
930
880
1,114
1,529
1,733
1,950
9,172
Excludingsiblings
570
437
905
864
1,101
1,482
1,642
1,850
8,851
Excludingrecordsnotmatched
totheSIMS
509
419
858
816
1,055
13,95
15,47
1,743
8,342
Reshapingto
onerecord
per
student-year
437
419
632
594
799
1,025
1,100
1,273
6,279
Excludingrepeatapplications
437
419
629
589
778
1,004
1,028
1,164
6,048
InBostonschoolsat
baseline
289
337
511
481
607
850
761
875
4,711
Excludingapplicants
without
tenth-gradeELA
232
267
415
378
482
664
571
676
3,685
000
This content downloaded from 018.004.054.097 on February 29, 2016 12:07:25 PMAll use subject to University of Chicago Press Terms and Conditions (http://www.journals.uchicago.edu/t-and-c).

A.Sample
RestrictionsbyProjected
SeniorYear
B.Im
mediate
andWaitlistOffer
RecordsbySchoolandCohort
Application
Year
Acceptance
Status
Boston
Preparatory
Academ
yof
PacificRim
Boston
Collegiate
Cityon
aHill
Codman
Academ
yMatch
Entrygrade:
66
59
99
2002
Immediate
Notopen
Norecords
Yes
Exh
austed
Norecords
Yes
Waitlist
Yes
Yes
Yes
2003
Immediate
Notopen
Norecords
Yes
Norecords
Norecords
Yes
Waitlist
Yes
Yes
2004
Immediate
Incomplete
records
Norecords
Yes
Exh
austed
Yes
Yes
Waitlist
Yes
Yes
Exh
austed
Yes
2005
Immediate
Yes
Yes
Yes
Yes
Incomplete
records
Yes
Waitlist
Exh
austed
Yes
Yes
Yes
Yes
2006
Immediate
Yes
Yes
Yes
Incomplete
records
Yes
Waitlist
Yes
Yes
Yes
Yes
2007
Immediate
Tooyoungfor
follow-up
Yes
Norecords
Yes
Waitlist
Yes
Yes
2008
Immediate
Yes
Yes
Yes
Waitlist
Exh
austed
Yes
Yes
2009
Immediate
Yes
Yes
Yes
Waitlist
Yes
Yes
Yes
N211
180
267
1,867
144
2,326
NOTE.—
PanelAsummarizes
thesamplerestrictionsim
posedforthelotteryanalysis.Disqualified
applicationsareduplicaterecordsandapplicationsto
thewronggrade.In
panel
B,“
Exh
austed”indicates
that
everyapplicanteventually
received
anoffer.“
Yes”meansthat
lotteryrecordswithnonmissinginform
ationwereavailableandthat
someapplicants
did
notgetoffers.“Incomplete
records”
indicates
schoolsandyears
forwhichlotteryrecordsareinadequateto
allow
reliable
codingofoffers.Thelastrow
showsthenumber
of
applicantsto
each
schoolin
thelotterysampleexcludingapplicantswithouttenth-gradeELA
scores.Cohortsaretooyoungforfollow-upifthey
donotgenerateAP,S
AT,h
igh
schoolgraduation,o
rcollege-go
ingoutcomes
intimeforourstudy.F
orCityonaHill2009
andMatch
2008
applicants,w
eim
pute
immediate
offersusing2008
CityonaHilland
2007
Match
immediate
offer
cutoffs.Startingin
2006,Academ
yofPacificRim
has
operated
grades
from
5to
12.
000
This content downloaded from 018.004.054.097 on February 29, 2016 12:07:25 PMAll use subject to University of Chicago Press Terms and Conditions (http://www.journals.uchicago.edu/t-and-c).

Table A2Matching School Lottery Data to SIMS
Number ofApplicants
SampleMean
ImmediateOffer
WaitlistOffer
Projected Senior Year ð1Þ ð2Þ ð3Þ ð4Þ2006 570 .912 2.016 .034
ð.023Þ ð.027Þ2007 437 .959 2.006 2.007
ð.025Þ ð.028Þ2008 905 .950 .000 2.002
ð.007Þ ð.019Þ2009 864 .944 2.001 .005
ð.005Þ ð.018Þ2010 1,101 .959 2.004 .024**
ð.003Þ ð.012Þ2011 1,482 .941 2.007*** .043***
ð.003Þ ð.014Þ2012 1,642 .942 2.008*** .056***
ð.002Þ ð.012Þ2013 1,850 .942 2.003** .026**
ð.001Þ ð.011ÞAll cohorts 8,851 .944 2.002 .028***
ð.006Þ ð.006ÞNOTE.—This table summarizes the match from the lottery records to the Student Information Man-
agement System ðSIMSÞ administrative data. The sample excludes disqualified applicants, late applicants,out-of-area applicants, and siblings. Columns 3 and 4 report coefficients from regressions of an indicatorfor a successful SIMS match on immediate and waitlist offer dummies. The immediate offer dummy isequal to one when a student is offered a seat in any charter school immediately following the lottery, whilethe waitlist offer dummy is equal to one for students offered seats later. All regressions include risk setdummies. Standard errors are shown in parentheses.
** Significant at the 5% level.*** Significant at the 1% level.
000
This content downloaded from 018.004.054.097 on February 29, 2016 12:07:25 PMAll use subject to University of Chicago Press Terms and Conditions (http://www.journals.uchicago.edu/t-and-c).

Tab
leA3
Attrition
A.Follow-upRates
B.AttritionDifferentialsbyOffer
Status
ELA
Math
Observed
inGrade12
Projected
SeniorYear
Either
Math
orELA
ð1Þ
ELA
ð2Þ
Math
ð3Þ
Observed
inGrade12
ð4Þ
Immediate
Offer
ð5Þ
Waitlist
Offer
ð6Þ
Immediate
Offer
ð7Þ
Waitlist
Offer
ð8Þ
Immediate
Offer
ð9Þ
Waitlist
Offer
ð10Þ
2006
.803
.803
.803
.747
.021
.031
.021
.031
2.046
.069
ð.047
Þð.0
53Þ
ð.047Þ
ð.053
Þð.0
51Þ
ð.062Þ
2007
.795
.792
.789
.774
.038
2.063
2.017
2.036
2.007
.017
ð.096
Þð.0
66Þ
ð.105Þ
ð.065
Þð.1
00Þ
ð.062Þ
2008
.820
.812
.800
.765
.076*
2.037
.063
2.037
.027
2.017
ð.040
Þð.0
43Þ
ð.042Þ
ð.045
Þð.0
45Þ
ð.049Þ
2009
.794
.786
.771
.765
.030
2.060
.029
2.046
.010
2.050
ð.042
Þð.0
42Þ
ð.043Þ
ð.043
Þð.0
43Þ
ð.043Þ
2010
.797
.794
.784
.766
.042
2.008
.040
2.014
.007
2.031
ð.039
Þð.0
40Þ
ð.039Þ
ð.041
Þð.0
43Þ
ð.042Þ
2011
.785
.781
.759
.751
2.049
.041
2.059
.050
.005
.047
ð.038
Þð.0
32Þ
ð.039Þ
ð.033
Þð.0
38Þ
ð.034Þ
2012
.757
.750
.744
.745
.036
2.022
.037
2.013
.028
2.015
ð.036
Þð.0
36Þ
ð.036Þ
ð.036
Þð.0
36Þ
ð.036Þ
2013
.775
.773
.759
.744
2.011
2.018
2.018
2.005
2.018
2.029
ð .032
Þð.0
34Þ
ð.033Þ
ð.034
Þð.0
33Þ
ð.035Þ
AllCohorts
.787
.782
.770
.755
.014
2.010
.008
2.002
.000
2.004
ð.014
Þð.0
14Þ
ð.015Þ
ð.015
Þð.0
15Þ
ð.015Þ
NOTE.—
Thistablesummarizes
attritionfortenth-gradeMCASscoresandtw
elfth-gradeenrollmentstatusforcharterschoollotteryapplicants.C
olumns1–
3show
fractionsof
applicantswithobserved
MCASscoresin
each
subject
amongthose
expectedto
takethetest,assumingnorm
alacadem
icprogressafterthelottery.C
olumn4showsthefractionof
applicants
withtw
elfth-graderecordsin
theSIMSadministrativedatabase.Columns5–
10reportcoefficients
from
regressionsofindicators
forfollow-updataonim
mediate
and
waitlistoffer
dummies.Regressionsalso
controlforrisk
setdummies.Standarderrors
areshownin
parentheses.N
54,711.
*Sign
ificantat
the10
%level.
000
This content downloaded from 018.004.054.097 on February 29, 2016 12:07:25 PMAll use subject to University of Chicago Press Terms and Conditions (http://www.journals.uchicago.edu/t-and-c).
References
Abadie, Alberto. 2002. Bootstrap tests for distributional treatment effectsin instrumental variables models. Journal of the American StatisticalAssociation 97, no. 457:284–92.
———. 2003. Semiparametric instrumental variable estimation of treat-ment response models. Journal of Econometrics 113, no. 2:231–63.
Abdulkadiroglu, Atila, Joshua Angrist, Susan Dynarski, Thomas J. Kane,and Parag Pathak. 2011. Accountability and flexibility in public schools:Evidence from Boston’s charters and pilots. Quarterly Journal of Eco-nomics 126, no. 2:699–748.
Anderson, Michael L. 2008. Multiple inference and gender differences inthe effects of early intervention: A reevaluation of the Abecedarian,Perry Preschool, and Early Training Projects. Journal of the AmericanStatistical Association 103, no. 484:1481–95.
Angrist, Joshua D., Sarah R. Cohodes, Susan M. Dynarski, Jon Fullerton,Thomas J. Kane, Parag A. Pathak, and Christopher R. Walters. 2011.Student achievement in Massachusetts’ charter schools. Report, Centerfor Education Policy Research at Harvard University.
Angrist, Joshua D, Susan M. Dynarski, Thomas J. Kane, Parag A. Pathak,and Christopher R.Walters. 2010. Inputs and impacts in charter schools:KIPP Lynn. American Economic Review 100, no. 2:239–43.
———. 2012. Who benefits from KIPP? Journal of Policy Analysis andManagement 31, no. 4:837–60.
Angrist, Joshua D., Daniel Lang, and Philip Oreopoulos. 2009. Incentivesand services for college achievement: Evidence from a randomized trial.American Economic Journal: Applied Economics 1, no. 1:136–63.
Angrist, JoshuaD., ParagA. Pathak, andChristopher R.Walters. 2013. Ex-plaining charter school effectiveness.American Economic Journal: AppliedEconomics 5, no. 4:1–27.
Booker, Kevin, Tim R. Sass, Brian Gill, and Ron Zimmer. 2008. Goingbeyond test scores: Evaluating charter school impact on educationalattainment in Chicago and Florida. Report, RAND, Santa Monica, CA.
Bowen, William G., and Derek Bok. 2000. The shape of the river: Long-term consequences of considering race in college and university admis-sions. Princeton, NJ: Princeton University Press.
Bowen, William G., Matthew M. Chingos, and Michael S. McPherson.2009.Crossing the finish line: Completing college at America’s public uni-versities. Princeton, NJ: PrincetonUniversity Press.
Clark, Melissa A., Philip Gleason, Christina Clark Tuttle, and Marsha K.Silverberg. 2011. Do charter schools improve student achievement? Ev-idence from a national randomized study. Mathematica Policy ResearchReports 7273, Mathematica Policy Research, Princeton, NJ.
000 Angrist et al.
This content downloaded from 018.004.054.097 on February 29, 2016 12:07:25 PMAll use subject to University of Chicago Press Terms and Conditions (http://www.journals.uchicago.edu/t-and-c).
Cohodes, Sarah. 2015. Teaching to the student: Charter school effec-tiveness in spite of perverse incentives. Education Finance and Policy,forthcoming, published online July 14, 2015.
Cohodes, Sarah, and Joshua Goodman. 2014. Merit aid, college quality,and college completion: Massachusetts’ Adams Scholarship as an in-kindsubsidy.American Economic Journal: Applied Economics 6, no. 4:251–85.
Cunha, Flavio, James J. Heckman, and Susanne M. Schennach. 2010.Estimating the technology of cognitive and noncognitive skill forma-tion. Econometrica 78, no. 3:883–931.
Deming, David J., Justine S. Hastings, Thomas J. Kane, and Douglas O.Staiger. 2014. School choice, school quality and postsecondary attain-ment. American Economic Review 104, no. 3:991–1013.
Dobbie,Will, and RolandG. Fryer. 2011. Are high-quality schools enoughto increase achievement among the poor? Evidence from the HarlemChildren’s Zone. American Economic Journal: Applied Economics 3,no. 3:158–87.
———. 2013. Getting beneath the veil of effective schools: Evidence fromNew York City. American Economic Journal: Applied Economics 5,no. 4:28–60.
———. 2015. The medium-term impacts of high-achieving charter schools.Journal of Political Economy 123, no. 5:985–1037.
Dynarski, Mark, and Philip Gleason. 2002. How can we help? What wehave learned from recent federal dropout prevention evaluations. Journalof Education for Students Placed at Risk 7, no. 1:43–69.
Dynarski, Mark, Philip Gleason, Anu Rangarajan, and Robert Wood. 1998.Impacts of dropout prevention programs. Technical report, MathematicaPolicy Research, Inc., Princeton, NJ.
Dynarski, Mark, and Robert Wood. 1997. Helping high-risk youths:Results for the Alternative Schools Demonstration Program. Technicalreport, Mathematica Policy Research, Inc. Princeton, NJ.
Dynarski, Susan M. 2000. Hope for whom? Financial aid for the middleclass and its impact on college attendance.National Tax Journal 53, no. 3:629–61.
Hanushek, Eric, John Kain, J. M. Markman, and Steve Rivkin. 2003. Doespeer ability affect student achievement? Journal of Applied Econometrics18, no. 5:527–44.
Hoxby,Caroline. 2000. Peer effects in the classroom:Learning fromgenderand race variation. NBER Working Paper no. 7867, National Bureau ofEconomic Research, Cambridge, MA.
Hoxby, Caroline M., and Christopher Avery. 2012. The missing “one-offs”: Thehidden supplyof high-achieving, low-income students.NBERWorking Paper no. 18586, National Bureau of Economic Research,Cambridge, MA.
Effects of Boston’s Charter High Schools 000
This content downloaded from 018.004.054.097 on February 29, 2016 12:07:25 PMAll use subject to University of Chicago Press Terms and Conditions (http://www.journals.uchicago.edu/t-and-c).

Imbens, Guido W., and Joshua D. Angrist. 1994. Identification and esti-mation of local average treatment effects.Econometrica 62, no. 2:467–75.
Jacob, Brian A., and Steven D. Levitt. 2003. Rotten apples: An investi-gation of the prevalence and predictors of teacher cheating. QuarterlyJournal of Economics 118, no. 3:843–77.
Kemple, James J. and Jason C. Snipes. 2000. Career academies: Impactson students’ engagement and performance in high school. Report, Man-power Demonstration Research Corporation, New York.
Lee, David S. 2009. Training, wages, and sample selection: Estimatingsharp bounds on treatment effects.Review of Economic Studies 76, no. 3:1071–1102.
Legewie, Joscha, and Thomas A. DiPrete. 2012. School context and thegender gap in educational achievement. American Sociological Review77, no. 3:463–85.
Neal, Derek, and Diane Whitmore Schanzenbach. 2010. Left behind bydesign: Proficiency counts and test-based accountability.Review of Eco-nomics and Statistics 92, no. 2:263–83.
Sacerdote, Bruce. 2011. Peer effects in education: How might they work,how big are they, and how much do we know thus far? InHandbook ofthe economics of education, vol. 3, ed. Erik Hanushek, Stephen Machin,and Ludger Woessmann, 249–77. Amsterdam: Elsevier.
Silverman, Bernard W. 1986. Density estimation for statistics and dataanalysis, vol. 26. Boca Raton, FL: CRC.
Skinner, Kathleen J. 2009. Charter school success or selective out-migrationof low achievers? Effects of enrollment management on student achieve-ment.Technicalreport,MassachusettsTeachersAssociation,Quincy,MA.
Thernstrom, Abigail M., and Stephan Thernstrom. 2003. No excuses:Closing the racial gap in learning. New York: Simon & Schuster.
Tuttle, Christina Clark, Brian Gill, Philip Gleason, Virginia Knechtel, IraNichols-Barrer, and Alexandra Resch. 2013. KIPP middle schools: Im-pacts on achievement and other outcomes. Report, Mathematica PolicyResearch, Inc., Princeton, NJ.
Walters, Christopher R. 2013. Essays in labor economics. PhD diss.,Massachusetts Institute of Technology.
000 Angrist et al.
This content downloaded from 018.004.054.097 on February 29, 2016 12:07:25 PMAll use subject to University of Chicago Press Terms and Conditions (http://www.journals.uchicago.edu/t-and-c).