Embed Size (px)
Citation preview
Stand-Alone Hybrid Energy Systems
by
Hiteshi Sharma
Bachelor of Technology, Punjab Technical University, 2012
A Thesis Submitted in Partial Fulfillment of the
Requirements for the Degree of
MASTER OF APPLIED SCIENCE
in the Department of Electrical and Computer Engineering
c© Hiteshi Sharma, 2018
University of Victoria
All rights reserved. This thesis may not be reproduced in whole or in part, by
photocopying or other means, without the permission of the author.
ii
Stand-Alone Hybrid Energy Systems
by
Hiteshi Sharma
Bachelor of Technology, Punjab Technical University, 2012
Supervisory Committee
Dr. Fayez Gebali, Supervisor
(Department of Electrical and Computer Engineering)
Dr. T. Aaron Gulliver, Member
(Department of Electrical and Computer Engineering)
iii
ABSTRACT
Portugal is highly dependent on imported fuels when it comes to the energy sector. The
government continuously aims at creating a sustainable and competitive renewable energy
system. The need for balancing the supply and load demand in the electrical sector is
a priority. To promote economic development in Portugal, the government always intend
to initiate new projects like the construction of the solar plant. The United Kingdom
(UK) solar company WELink Energy will develop a 220MW solar plant in south Portugal
and have signed an Engineering, Procurement and Construction (EPC) agreement with
China Triumph International Engineering Cooperation (CTIEC). There are 4 ongoing solar
projects in Algarve that will produce enough electricity to fulfill the load demand. The
problem that the government is facing is the expansion of hybrid power system using other
renewable resources in order to overcome climatic changes. In order to design a hybrid
system, it is very important for the government to consider the minimum net present cost
configuration for fulfilling the load demand. The standalone hybrid system consists of a
photovoltaic array (PV), a wind turbine (WT), a diesel generator (DG) and a battery.
Different scenarios have been considered using HOMER software to obtain the lowest net
present cost of the hybrid system. The results will establish the configuration to eradicate
the problems the villagers are undergoing due to unavailability of electricity. This will lead
to enhanced job opportunities and better living conditions in Algarve.
iv
Contents
Supervisory Committee ii
Abstract iii
Table of Contents iv
List of Tables vii
List of Figures viii
Acknowledgements ix
Dedication x
1 Introduction 1
1.1 Problem definition and motivation . . . . . . . . . . . . . . . . . . . . . . . 1
1.2 Objective of the Thesis . . . . . . . . . . . . . . . . . . . . . . . . . . . . . . 2
1.3 Contribution . . . . . . . . . . . . . . . . . . . . . . . . . . . . . . . . . . . 2
1.4 Outline of the Thesis . . . . . . . . . . . . . . . . . . . . . . . . . . . . . . . 2
1.5 List of Abbreviations . . . . . . . . . . . . . . . . . . . . . . . . . . . . . . . 3
2 Literature Review 4
2.1 Wind , PV and Battery Hybrid System . . . . . . . . . . . . . . . . . . . . 4
2.2 PV and Diesel Generator and Battery Hybrid System . . . . . . . . . . . . 5
2.3 Wind , PV , Hydro and Battery Hybrid System . . . . . . . . . . . . . . . . 6
2.4 Wind , Diesel Generator and Battery Hybrid System . . . . . . . . . . . . . 6
2.5 PV , Hydro , Diesel Generator and Battery Hybrid System . . . . . . . . . 7
2.6 Wind , PV and Fuel Cell Hybrid System . . . . . . . . . . . . . . . . . . . . 7
2.7 Wind , PV , Diesel Generator and Battery Hybrid System . . . . . . . . . . 7
2.8 Wind , PV , Diesel Generator , Fuel Cell and Battery Hybrid System . . . . 8
2.9 PV Biomass and Battery Hybrid System . . . . . . . . . . . . . . . . . . . . 8
2.10 Micro-power System . . . . . . . . . . . . . . . . . . . . . . . . . . . . . . . 8
v
3 Modelling System Components 10
3.1 Introduction to HOMER Software . . . . . . . . . . . . . . . . . . . . . . . 12
3.1.1 Principle of Operation in HOMER . . . . . . . . . . . . . . . . . . . 12
3.2 Review of Photovoltaic Panels . . . . . . . . . . . . . . . . . . . . . . . . . . 14
3.2.1 Perturb and Observe (P&O) . . . . . . . . . . . . . . . . . . . . . . 16
3.2.2 Incremental Conductance . . . . . . . . . . . . . . . . . . . . . . . . 16
3.2.3 Constant Voltage . . . . . . . . . . . . . . . . . . . . . . . . . . . . . 16
3.3 Wind Turbine Conversion System . . . . . . . . . . . . . . . . . . . . . . . . 17
3.3.1 Wind Turbine . . . . . . . . . . . . . . . . . . . . . . . . . . . . . . . 17
3.3.2 Betz Rule . . . . . . . . . . . . . . . . . . . . . . . . . . . . . . . . . 18
3.3.3 Operating Region of the Wind Turbine . . . . . . . . . . . . . . . . 18
3.3.4 Electrical Generators . . . . . . . . . . . . . . . . . . . . . . . . . . . 20
3.3.5 Power Conversion Schemes . . . . . . . . . . . . . . . . . . . . . . . 21
3.3.6 Rectification . . . . . . . . . . . . . . . . . . . . . . . . . . . . . . . 21
3.3.7 Bidirectional Inverter . . . . . . . . . . . . . . . . . . . . . . . . . . 22
3.3.8 Mathematical Model of Converter . . . . . . . . . . . . . . . . . . . 22
3.3.9 Charge Controller . . . . . . . . . . . . . . . . . . . . . . . . . . . . 22
3.3.10 Mathematical Model of Charge Controller . . . . . . . . . . . . . . . 23
3.4 Energy Storage . . . . . . . . . . . . . . . . . . . . . . . . . . . . . . . . . . 23
3.4.1 Battery Selection . . . . . . . . . . . . . . . . . . . . . . . . . . . . . 24
3.4.2 Mathematical Model of Battery Bank . . . . . . . . . . . . . . . . . 25
3.5 Diesel Generator Power Systems . . . . . . . . . . . . . . . . . . . . . . . . 25
3.5.1 Diesel Generator Selection . . . . . . . . . . . . . . . . . . . . . . . . 26
3.5.2 Diesel Generator Sizing in Hybrid System . . . . . . . . . . . . . . . 26
3.5.3 Mathematical Model of Diesel Generator Subsystem . . . . . . . . . 26
4 System Configuration and Simulation Results 27
4.1 Selection of Study Area and Load Assessment . . . . . . . . . . . . . . . . . 27
4.1.1 Input to renewable systems using HOMER . . . . . . . . . . . . . . 27
4.1.2 Photovoltaic Resource Specifications . . . . . . . . . . . . . . . . . . 29
4.1.3 Wind Turbine Specifications . . . . . . . . . . . . . . . . . . . . . . . 30
4.1.4 Battery Bank Specifications . . . . . . . . . . . . . . . . . . . . . . . 31
4.1.5 Diesel Generator Specifications . . . . . . . . . . . . . . . . . . . . . 31
4.1.6 Converter Specifications . . . . . . . . . . . . . . . . . . . . . . . . . 32
4.2 HOMER Simulations . . . . . . . . . . . . . . . . . . . . . . . . . . . . . . . 32
4.3 System Controls . . . . . . . . . . . . . . . . . . . . . . . . . . . . . . . . . 32
4.4 Analysis . . . . . . . . . . . . . . . . . . . . . . . . . . . . . . . . . . . . . . 33
4.5 Simulation Results . . . . . . . . . . . . . . . . . . . . . . . . . . . . . . . . 34
vi
4.5.1 Optimization of Hybrid PV Wind Model . . . . . . . . . . . . . . . . 34
4.5.2 Constraints . . . . . . . . . . . . . . . . . . . . . . . . . . . . . . . . 34
4.5.3 Minimization of Cost . . . . . . . . . . . . . . . . . . . . . . . . . . . 35
4.5.4 Scenario 1- PV , Diesel Generator . . . . . . . . . . . . . . . . . . . 36
4.5.5 Scenario 2- PV , Wind Turbine . . . . . . . . . . . . . . . . . . . . . 36
4.5.6 Simulation Scenario 3- PV , Wind Turbine , Diesel Generator . . . . 38
4.5.7 Scenario 4- PV , Wind Turbine , Diesel Generator . . . . . . . . . . 40
4.5.8 Scenario 5- PV , Wind Turbine , Diesel Generator . . . . . . . . . . 40
4.5.9 Scenario 6- PV , Diesel Generator . . . . . . . . . . . . . . . . . . . 43
4.5.10 Scenario 7- PV , Wind Turbine , Diesel Generator . . . . . . . . . . 45
4.5.11 Scenario 8- PV , Diesel Generator , Wind Turbine . . . . . . . . . . 45
4.5.12 Discussion . . . . . . . . . . . . . . . . . . . . . . . . . . . . . . . . . 47
5 Conclusion 49
5.1 Contribution . . . . . . . . . . . . . . . . . . . . . . . . . . . . . . . . . . . 49
Bibliography 51
vii
List of Tables
Table 4.1 Load Profile Month (kW) vs. Hour . . . . . . . . . . . . . . . . . . . 28
Table 4.2 Input Photovoltaic Resource . . . . . . . . . . . . . . . . . . . . . . . 29
Table 4.3 Average Monthly Wind Velocity . . . . . . . . . . . . . . . . . . . . . 30
Table 4.4 Storage Specifications . . . . . . . . . . . . . . . . . . . . . . . . . . . 31
Table 4.5 Result for Scenario 1 . . . . . . . . . . . . . . . . . . . . . . . . . . . 36
Table 4.6 Electrical Production for Scenario 1 . . . . . . . . . . . . . . . . . . . 36
Table 4.7 Diesel Hours of Operation for Scenario 1 . . . . . . . . . . . . . . . . 37
Table 4.8 Result for Scenario 2 . . . . . . . . . . . . . . . . . . . . . . . . . . . 37
Table 4.9 Electrical Production for Scenario 2 . . . . . . . . . . . . . . . . . . . 38
Table 4.10 Result for Scenario 3 . . . . . . . . . . . . . . . . . . . . . . . . . . . 38
Table 4.11 Electrical Production for Scenario 3 . . . . . . . . . . . . . . . . . . . 39
Table 4.12 Diesel Hours of Operation for Scenario 3 . . . . . . . . . . . . . . . . 40
Table 4.13 Result for Scenario 4 . . . . . . . . . . . . . . . . . . . . . . . . . . . 41
Table 4.14 Electrical Production for Scenario 4 . . . . . . . . . . . . . . . . . . . 41
Table 4.15 Diesel Hours of Operation for Scenario 4 . . . . . . . . . . . . . . . . 41
Table 4.16 Result for Scenario 5 . . . . . . . . . . . . . . . . . . . . . . . . . . . 41
Table 4.17 Electrical Production for Scenario 5 . . . . . . . . . . . . . . . . . . . 42
Table 4.18 Diesel Hours of Operation for Scenario 5 . . . . . . . . . . . . . . . . 43
Table 4.19 Result for Scenario 6 . . . . . . . . . . . . . . . . . . . . . . . . . . . 43
Table 4.20 Electrical Production for Scenario 6 . . . . . . . . . . . . . . . . . . . 44
Table 4.21 Diesel Hours of Operation for Scenario 6 . . . . . . . . . . . . . . . . 44
Table 4.22 Result for Scenario 7 . . . . . . . . . . . . . . . . . . . . . . . . . . . 45
Table 4.23 Electrical Production for Scenario 7 . . . . . . . . . . . . . . . . . . . 45
Table 4.24 Result for Scenario 8 . . . . . . . . . . . . . . . . . . . . . . . . . . . 46
Table 4.25 Electrical Production for Scenario 8 . . . . . . . . . . . . . . . . . . . 47
Table 4.26 Diesel Hours of Operation for Scenario 8 . . . . . . . . . . . . . . . . 47
viii
List of Figures
Figure 3.1 Schematic of the overall system [1] . . . . . . . . . . . . . . . . . . . 11
Figure 3.2 Solar cell circuit diagram [2] . . . . . . . . . . . . . . . . . . . . . . 14
Figure 3.3 I-V characteristics of the solar cell [2] . . . . . . . . . . . . . . . . . 15
Figure 3.4 Wind turbine operating regions [5] . . . . . . . . . . . . . . . . . . . 19
ix
ACKNOWLEDGEMENTS
I would like to express my appreciation to my supervisor Dr. Fayez Gebali for his
support, encouragement and continuous motivation during my research. I would like to
thank him for sharing his immense knowledge and guiding me to make my report better
at every step. I would also like to express my gratitude to my university, for giving me
an insight of my project and offering me an opportunity to study with them in a highly
knowledgeable university helped me in exhibiting my leadership qualities in a diversify
environment. My sincere thanks to the library of University of Victoria for providing me
productive information that was beneficial for my research. Lastly I would like to thank
my family members for their constant support and being my strength throughout my life.

x
DEDICATION
I would like to dedicate my work to Professor Dr. Fayez Gebali, the late Dr. Subhasis
Nandi, my parents Mr N.K Sharma, Mrs Vanita Sharma, my husband Mr Ishatpreet Singh
Grewal and my mother in law Mrs Jasbir Kaur Grewal.
Chapter 1
Introduction
1.1 Problem definition and motivation
Many remote communities cannot be economically or physically connected to an electric
grid around the world. The electricity demand is supplied by an isolated diesel generator.
The operating cost associated with the generators may be too high due to discontinued
fossil fuels along with the maintenance of the system. In such cases , renewable energy
resources play an alternative solution to supplement the generators in off-grid regions. It is
seen from the literature review that the hybrid system can reduce the total life cycle cost
(LCC) for a standalone hybrid system used in remote areas. Standalone system can provide
economically feasible and reliable solution for local needs. Portugal is highly dependent on
imported fuels when it comes to the energy sector. The government continuously aim at
creating a sustainable and competitive renewable energy system. The need for balancing the
supply and load demand in the electrical sector is a priority. The Algarve is a highly popular
tourist destination and developed region in Portugal. To promote economic development
in Portugal , the government always intend to initiate new projects like the construction of
the solar plant. The United Kingdom (UK) solar company WELink Energy will develop a
220MW solar plant in south Portugal and have signed an Engineering , Procurement and
Construction (EPC) agreement with China Triumph International Engineering Cooperation
(CTIEC). There are 4 ongoing solar projects in Algarve that will produce enough electricity
to fulfill the load demand. The problem that the government is facing is the expansion of
hybrid power system using other renewable resources in order to overcome climatic obli-
gations. In order to design a hybrid system , it is very important for the government to
consider the minimum net present cost configuration for fulfilling the load demand. The
hybrid system consists of a photovoltaic array (PV) , a wind turbine (WT) , a diesel gener-
ator (DG) and a battery. Different scenarios have been considered using HOMER software
to obtain the lowest net present cost of the hybrid system. The results will establish the
2
configuration to eradicate the problems the villagers are undergoing due to unavailability
of electricity. This will lead to enhanced job opportunities and better living conditions in
Algarve.
Electricity prices in Portugal have increased on an average by 7.8% and 6.2% annually
for domestic and industrial customers , respectively. The Portuguese government boosts the
promotion of hydroelectric resources and supports the development of renewable sources like
wind , hydro , photovoltaic and biomass. The country is strongly dependent on imported
energy resources especially oil. In Portugal , approximately 45% of electricity comes from
renewable resources. To achieve the full potential of renewable resources , it is important
to design and optimize a renewable hybrid system which has minimum life cycle cost. Life
Cycle Cost (LCC) analysis is required to optimize different configurations. LCC is used for
calculating the system from inception to disposal. It is important to have a backup source
of power generation like diesel generator in this work.
1.2 Objective of the Thesis
The aim of the thesis is to minimize the life cycle cost for a hybrid standalone power system.
The software tool HOMER was used to estimate the cost of a hybrid system consisting of
solar and wind energy sources. Battery bank and diesel generator were used to provide
excess energy storage and production when the primary sources like solar and wind are not
available. The standalone hybrid system can be modelled near the consume requirement
which can reduce the transmission cost , transportation cost and the losses.
1.3 Contribution
The contributions of this work are:
1. A hybrid stand-alone energy system was studied using HOMER software. The hybrid
system consisted of a photovoltaic array and a wind turbine. A backup diesel generator
was used together with a lithium battery storage.
2. The life cycle cost of the system is estimated using several simulation scenarios with
constraints on the size of the PV array and wind turbine size.
1.4 Outline of the Thesis
The thesis is divided into five chapters. Chapter 1 describes the overall structure of the
thesis with the aim of the research. Chapter 2 covers the literature review of the methods
that have been implemented for this hybrid system. Chapter 3 deals with the system
3
components review about the photovoltaic cell and wind turbine and their mathematical
modelling. Chapter 4 describes the system configuration and simulation results. This is
followed by Chapter 5 which deals with the conclusion.
1.5 List of Abbreviations
Item Comment
CRF Capital recovery factor for the system
DG Diesel generator
DOD Depth of discharge
HOMER Hybrid optimization model for electric renewables
LCC Life cycle cost
NPC Net present cost
O&M Operation and maintenance
PV Photovoltaic module
PI Proportional integral controller
RES Renewable energy system
SOC State of charge
WT Wind turbine
PMSG Permanent magnet synchronous generator
AC Alternating current
DC Direct current
P&O Perturb and observe
HAWT Horizontal axis wind turbine
VAWT Vertical axis wind turbine
MOSFET Metal oxide semiconductor field effect transistor
IGBT Insulated gate bipolar transistor
PWM Pulse width module
DFIG Doubly fed induction generator
4
Chapter 2
Literature Review
2.1 Wind , PV and Battery Hybrid System
Liu et al. [7] was successful in investigating the performance of photovoltaic array under
various circumstances and climatic conditions. The aim was to optimize the size and slope
of PV array in the system. Under four climatic zones , tropical , sub-tropical , hot arid and
warm temperature , the performance of the PV system is studied and an optimized condi-
tion was reached using HOMER software. Finally , it was concluded that PV system can
effectively bring down the electric bills and to alleviate carbon dioxide emission. HOMER
software was used by Elhassan et al. [8] in Khartoum to develop an efficient power system
of sustainable and reliable renewable energy to meet domestic power needs and the total
life-cycle cost. For this purpose , the basic data of solar radiation , wind speed and other
input information were collected and after that hybrid optimization simulation model was
developed. The simulation was used to identify the most technically reliable renewable sys-
tem meeting household demands. Bekele et al. [9] did some research to check the possibility
of electricity supply to a remotely located area in Ethiopia , which is detached from the
main electricity grid. Here for power generation , a hybrid system is used consisting of solar
panels and wind generator. HOMER software has been used for analysis. Ultimately they
came out with a few feasible and reliable power supply systems , sorted according to their
net present cost.
HOMER software has been effectively used to study the optimal sizing and operational
strategy of hybrid renewable energy system by Razak et al. [10]. This hybrid energy includes
wind energy and solar energy. Furthermore , emission to the atmosphere is nil considering
this design and also the use of diesel generator can be minimized by maximizing the use
of the renewable energy. Different combinations of generating system are tried out in this
study to obtain the optimal configuration.
Daud et al. [11] effectively developed a hybrid system especially based on photovoltaic
5
and wind energy , using a computer program for designing and sizing purpose , to meet the
load demand of a family house in Palestine according to their requirements. Wind and solar
measurements are used as the inputs. The hybrid system minimizes the cost of generation
of electricity throughout the lifetime of the project. It is seen that using hybrid energy
as the major energy resource for any place proves beneficial both in economic sector and
conservation of natural resources HOMER software is used for optimization purpose , in
this study.
Another use of HOMER software was made by Kusakana et al. [12] to investigate the
possibility and feasibility of using a stand-alone solar/micro hydro-power system for cost-
effective power generation which can meet the power requirements of a typical remote
and isolated rural area. Here optimization was used effectively to improve the technical
configuration and economical performances of the hybrid system.
Lim et al. [13] developed a combination of PV output power and battery power as the
backup source to meet the load demands with variable speed generator i.e. both traditional
constant speed generator and novel variable-speed generators. To improve the reliability
of this system a fossil fuel based constant speed generator is used since renewable power
generation technology is largely affected by climatic conditions. Demiroren et al. [14] carried
out a study based on HOMER software to develop a system so as to meet the daily load
demands of Gokceada , the biggest island of Turkey , using renewable power generation
technology. Here , the hybrid system is made up of solar panels , wind turbines and
batteries for backup power. Values of components are determined using simulations. The
cost of energy is also taken care of so that it can be minimized.
Iqbal [15] used HOMER software to study the feasibility and reliability of a zero energy
home in Newfoundland. The input data was year-round recorded wind speed information
, solar data and information of power consumption in a typical R-2000 house in New-
foundland. Here optimization was done using HOMER. The performance of the system is
analyzed as a whole and detailed elaboration is presented in this study. In another study ,
developed by Dalton et al. [16] renewable energy technology is used to meet the load demand
of a large hotel located in a subtropical coastal area of Queensland in Australia. HOMER
software was used for optimization purpose. After successive experiments and analysis , it
was concluded that wind energy is more feasible and reliable than PV panels and also more
economic as renewable technology in large-scale operations.
2.2 PV and Diesel Generator and Battery Hybrid System
HOMER software has been effectively used by P. Lilienthal [17] to design an optimization
model which can analyze all small power technologies individually and hybrid systems too
to identify the most cost-effective solution to energy requirements. Here with the inputs
6
of renewable resource and daily and monthly load profile , the minimum total discounted
cost will be formulated. Baharudin et al. [18] effectively used HOMER software to opti-
mize and design a PV power system for desalination of seawater located at Kuala Perlis.
The design consists of site selection , load selection , system sizing and cost-effectiveness.
The feasibility and reliability of this design are also verified along with the experimental
setup for desalination system. Another study [19] presents the use of HOMER software for
the designing and modelling a power system for domestic use for a particular family for
household usage in Boulder , Colorado. Here a PV grid is used for power generation with
a battery bank for back up power. Cost-effectiveness is considered in this study , Lim et
al. [20] forecasted solar irradiance and load demands in supervisory control to develop an
off-grid hybrid energy system. Here models are developed for foreseeing and predicting the
solar resource and load demand. These models are used to control an off-grid PV variable
speed diesel generators hybrid energy system.
2.3 Wind , PV , Hydro and Battery Hybrid System
Bekele et al. [21] carried out another study in Ethiopia to identify the reliability and feasi-
bility of a hybrid system consisting of hydro-power , solar energy and wind generator. An
experiment is carried out to meet the load demands for lighting , radio , television , electric
baker , water pumps and flour mills. Primary schools and health posts are also taken care
of. They came out with a system generating power at a cost of less than $0.16 per kWh.
2.4 Wind , Diesel Generator and Battery Hybrid System
Since wind energy sometimes fails to produce the required power output given to the me-
teorological variations of the area under consideration , Rehman [22] incorporated diesel
generator as the backup , in a study of a diesel plant of a village in the Northeastern part of
Saudi Arabia. HOMER is used for modelling and designing of the system. For simulation
purposes , various wind speed data was collected. Fuel prices are kept inside a certain
range during the simulation program , and the effectiveness of the system is discussed.
Khadem [23] studied the utility of wind home system in a coastal region of Bangladesh
using HOMER software. Here there is a possibility of using wind power as a renewable
energy technology since wind potential is more or less to that extent in this region. With a
variation of wind speed between 4 m/s , it was concluded that considering environmental
influence , power consumption and remote accessibility wind home system is applicable in
most of the coastal regions.
7
2.5 PV , Hydro , Diesel Generator and Battery Hybrid Sys-
tem
Beluco et al. [24] designed a hybrid system using solar energy , hydro-power and diesel
generator. The aim was to evaluate the power generation during peak sunlight hours. The
optimization models consist of two variations , one having PV module , diesel generators
and micro hydro-power plants and another with PV modules and hydro-power plants. grid-
based
2.6 Wind , PV and Fuel Cell Hybrid System
Alam et al. [25] used HOMER software to propose a hybrid power generation system for
application in remote areas. This hybrid system is a combination of PV panels , wind turbine
and fuel cell. For maintaining uniformity in hydrogen supply for fuel cell an electrolyzer
and a reformer are also taken into consideration. This particular combination of renewable
technology has been found to be successful in meeting the load requirement for standalone
applications at remote locations. Turkay et al. [26] researched about the feasibility and
reliability of a hybrid system using HOMER. The system consisted of solar and wind energy
and hydrogen as the storage unit to fulfill the power demand as a standalone system. Input
data used were technological options , cost of components and recourse compliance with
final results being feasible system configurations based on net present cost.
2.7 Wind , PV , Diesel Generator and Battery Hybrid Sys-
tem
Bajpai [27] designed a hybrid model to improve the electrical supply at the telecom service
providers installations. Since problems arose while using only diesel generators , renewable
energy resources like solar photovoltaic , wind turbine generators or both are used. It
was concluded that using renewable technology prove to be more economical than a single
storage system. Rajoriya et al. [28] for power generation in the remote hilly rural area in
India with the help of hybrid power generation system successfully used HOMER software.
The final design was the one with least emissions of environmental pollutants such as carbon
dioxide , carbon monoxide , hydrocarbon , particulate matter , sulphur dioxide and nitrous
oxide. This design consisted of five wind turbines (10 kW) , PV panel (9 kW) , 30 batteries
(6 V , 6.94 kWh each) and a diesel generator (65 kW). The final net present cost of the
setup was $1,270,921 with a capital cost of $148,133 with the cost of energy of $0.296/kWh.
8
2.8 Wind , PV , Diesel Generator , Fuel Cell and Battery
Hybrid System
Badawe et al. [29] made effective use of HOMER software to present a study for opti-
mization and comparison between renewable technology and conventional power generation
techniques for a telecommunication site in Mulligan , Labrador , in Canada. Renewable
technology reduces environmental pollution along with lowering the overall cost of power
production. Badawe et al. [29] came up with a solution that was cost-effective , thus re-
ducing the operational time of the diesel generator , as a result , reducing emission level in
turn.
2.9 PV Biomass and Battery Hybrid System
Barsoum et al. [30] used HOMER for designing , modelling and cost simulation of standalone
solar and biomass energy in Sarawak. The main objective of this setup was to develop an
optimized , reliable , feasible and autonomous system for meeting the power requirements of
the area under consideration and along with that also to ensure cost-effectiveness. HOMER
software again comes into play in the Islands of Indian Sundarbans by Mitra et al. [31]
to supply electricity to remote villages through renewable energy technology. Around 20
islands with more than 100000 households inhabiting in 131 villages in India need electricity
as a very basic need of their daily living. Since the wind potential in this region is very low
so the renewable technologies used are biomass and solar panels.
2.10 Micro-power System
Lambert et al. [32] used HOMER software for micro-power system to compare power gen-
eration technology across a wide range of applications. A system generating electricity
and heat to meet a certain load is referred to as a micro-power system. Here the power
systems physical behaviour and total life-cycle cost are optimized using HOMER. Hafez
et al. [33] successfully used HOMER software for the most favourable and ideal planning
, designing and modelling of a renewable energy based supply system for micro-grids. For
elaborate analysis four different types of designs are developed viz. a diesel-only , a fully
renewable-based , a diesel-renewable mixed and an external grid-connected to a micro-grid
configuration. These designs are also analyzed on an economical basis and for all the anal-
ysis and designing HOMER software is used. Since India is an area wise very vast country
with certain variations in climatic conditions , so to ensure uninterrupted power supply
hybrid system consisting of PV panel , wind generator , hydro-power , battery bank and
the diesel generator is considered in this study. These components need to be studied to

9
know about their various advantages and disadvantages so as to calculate their outputs
which can meet the specific power requirements of the area under consideration.
10
Chapter 3
Modelling System Components
In this chapter , the components of the hybrid system are discussed. A standalone hybrid
system consists of a photovoltaic array (PV) , a wind turbine (WT) , a battery backup and a
diesel generator (DG) to supply the load. A standalone wind or solar power system will face
problems in meeting the load demand with changing weather condition. Optimum designing
is essential for the hybrid system , which ensures battery bank usage and prolongs the
battery life. Nowadays computer simulation software are available for getting the optimum
configuration. This is executed by comparing the performances and energy production
costs of different configurations of wind power and PV hybrid generating systems. Apart
from these , other requirements like transmission and distribution of power generated from
the hybrid system , protection from discharging of battery beyond limits , or over-voltage
protection , have to be fulfilled. Hence , a charge controller and an inverter are used in
the hybrid system. The Hybrid Optimization Model for Electric Renewable (HOMER) is a
computer modelling software to assist in the design of hybrid systems. HOMER models a
hybrid system’s physical behaviour and its life cycle cost (LCC) , which is defined as the total
cost of installing and operating the system over it’s life span. HOMER allows the modeller
to compare numerous design options based on economic and technological benefits. There
are various simulation softwares in the market. Some of them are HOMER , RETScreen ,
HySim , Hybrid designer and Hybrid 2 but HOMER was selected because it is cost effective
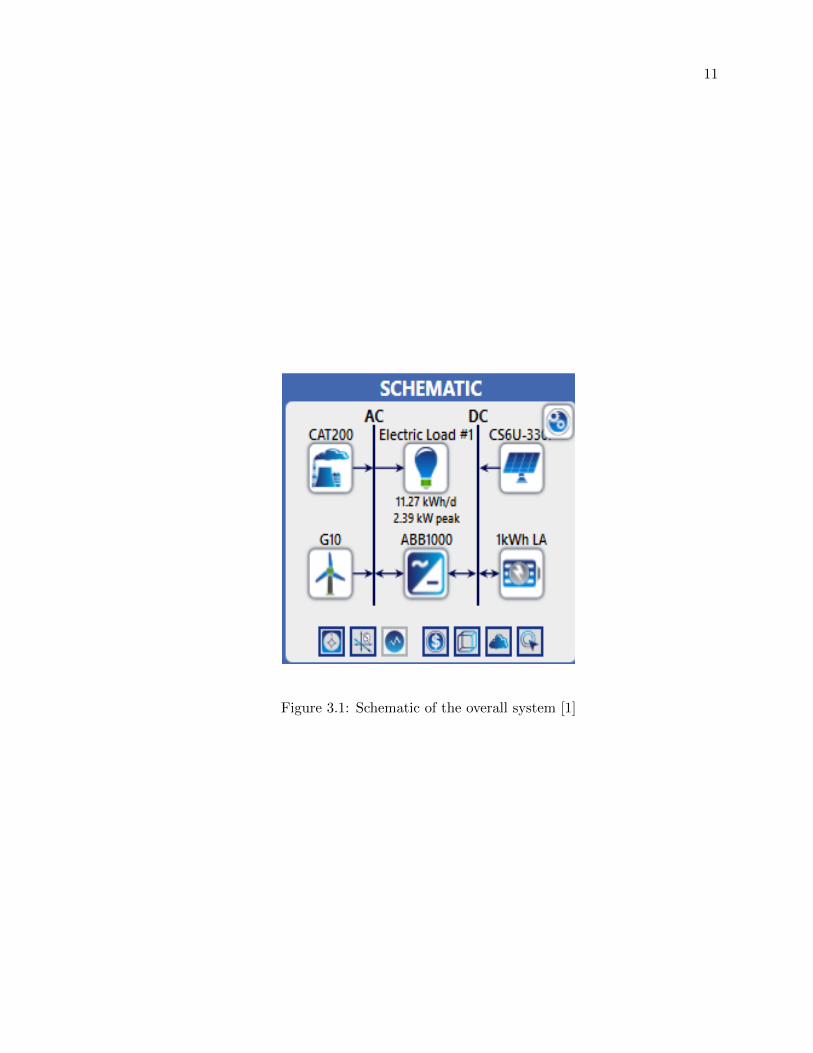
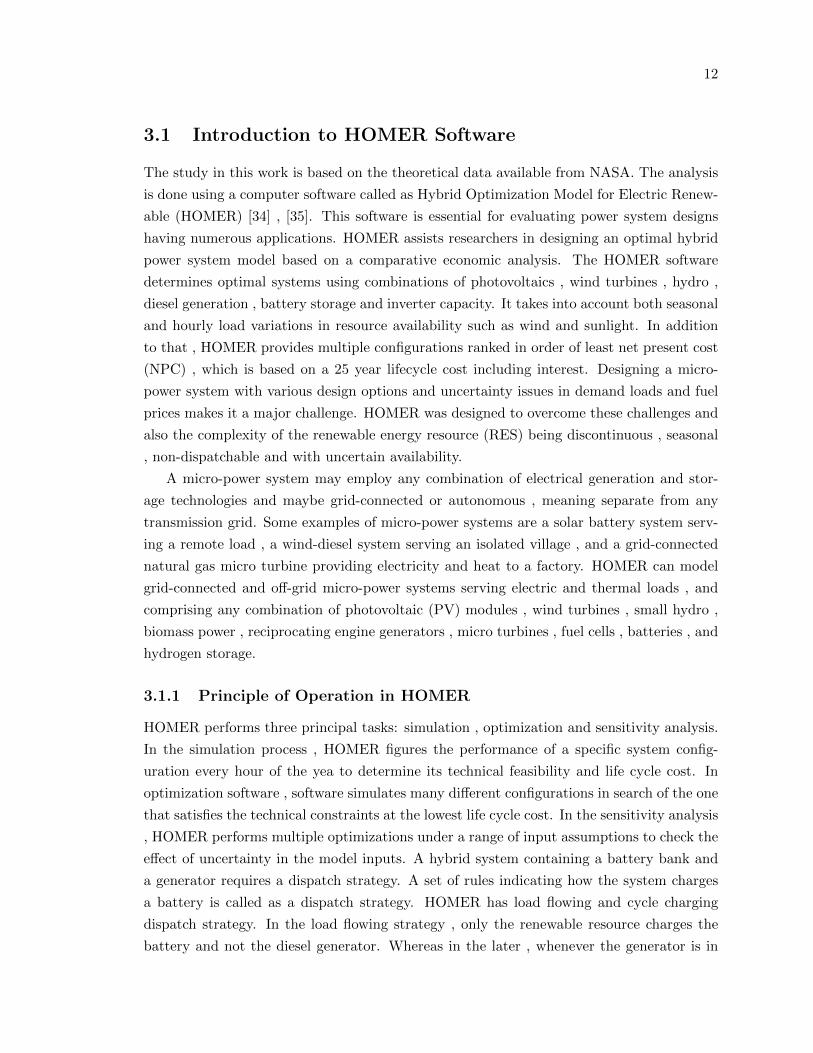
and accurate in optimization. Figure 3.1 shows the overall system components [1] as defined
by the CAD tool HOMER , which will be discussed below. The hybrid system components
are CAT200 as the diesel generator , G10 selected as the wind turbine , ABB1000 as the
converter , CS6U-330P as the photovoltaic panel and 1kWh LA as the battery backup
source. Every source is connected to the electrical load.
11
Figure 3.1: Schematic of the overall system [1]
12
3.1 Introduction to HOMER Software
The study in this work is based on the theoretical data available from NASA. The analysis
is done using a computer software called as Hybrid Optimization Model for Electric Renew-
able (HOMER) [34] , [35]. This software is essential for evaluating power system designs
having numerous applications. HOMER assists researchers in designing an optimal hybrid
power system model based on a comparative economic analysis. The HOMER software
determines optimal systems using combinations of photovoltaics , wind turbines , hydro ,
diesel generation , battery storage and inverter capacity. It takes into account both seasonal
and hourly load variations in resource availability such as wind and sunlight. In addition
to that , HOMER provides multiple configurations ranked in order of least net present cost
(NPC) , which is based on a 25 year lifecycle cost including interest. Designing a micro-
power system with various design options and uncertainty issues in demand loads and fuel
prices makes it a major challenge. HOMER was designed to overcome these challenges and
also the complexity of the renewable energy resource (RES) being discontinuous , seasonal
, non-dispatchable and with uncertain availability.
A micro-power system may employ any combination of electrical generation and stor-
age technologies and maybe grid-connected or autonomous , meaning separate from any
transmission grid. Some examples of micro-power systems are a solar battery system serv-
ing a remote load , a wind-diesel system serving an isolated village , and a grid-connected
natural gas micro turbine providing electricity and heat to a factory. HOMER can model
grid-connected and off-grid micro-power systems serving electric and thermal loads , and
comprising any combination of photovoltaic (PV) modules , wind turbines , small hydro ,
biomass power , reciprocating engine generators , micro turbines , fuel cells , batteries , and
hydrogen storage.
3.1.1 Principle of Operation in HOMER
HOMER performs three principal tasks: simulation , optimization and sensitivity analysis.
In the simulation process , HOMER figures the performance of a specific system config-
uration every hour of the yea to determine its technical feasibility and life cycle cost. In
optimization software , software simulates many different configurations in search of the one
that satisfies the technical constraints at the lowest life cycle cost. In the sensitivity analysis
, HOMER performs multiple optimizations under a range of input assumptions to check the
effect of uncertainty in the model inputs. A hybrid system containing a battery bank and
a generator requires a dispatch strategy. A set of rules indicating how the system charges
a battery is called as a dispatch strategy. HOMER has load flowing and cycle charging
dispatch strategy. In the load flowing strategy , only the renewable resource charges the
battery and not the diesel generator. Whereas in the later , whenever the generator is in
13
use , it produces more power than required to the serve the load and charges the battery
as well. In HOMER software , we need to follow the steps for defining the system. Below
is a brief introduction to the steps for simulation of the system.
Step 1 Defining the power system: The power system is defined by clicking the Ad-
d/Remove Button in the HOMER software. Then we are capable of selecting a number of
different components like generators , multiple loads , PV arrays , battery banks and wind
turbines and other power system components.
Step 2 Defining the site load: Load is defined as the demand of electricity demand. For a
single site HOMER models two different loads which are primary and secondary loads.The
average daily consumption the system is averagely determined by HOMER based on the
outlines power profiles.
Step 3 Wind and solar resources: Wind resources are determined using NASA surface
methodology and solar energy database where wind direction is considered at 50 meters
above the earth surface. The monthly average wind speed is provided as the database for
the given month over 10 years. The average annual wind speed is a good indicator for
running a wind turbine at a given location and generally , values above 5 m/s with few
months below 4 m/s are considered adequate for satisfactory results. We see the year-round
wind speed in m/s. This can be clearly fed as input in HOMER software so as to help in
critical optimization of renewable energy technology.
HOMER runs based on directly imported solar resources from the NASA surfaces
methodology and solar energy database by entering the GPS coordinates.
Step 4 Calculating Results: HOMER calculates the different combinations of possible
feasible design based on the inputs provided and simulates the power system while we
click on the calculate button. We are capable of comparing the standard diesel generator
configuration with renewable energy like wind and solar models according to the design
requirements. We can evaluate the financial and renewable indicators of different models
by sensitivity analysis on diesel price and primary loads. HOMER models a specific system
configuration by performing an hourly time series simulation of its operation over one year.
It steps through the year one hour at a time calculating the available renewable power. It
compares it with the load and decides what needs to be done with surplus power. When
the calculation for a year is completed , HOMER makes sure that system satisfies the
constraints imposed by the user.
Step 5 Simulation Results: Comprehensive set of data can be accessed by clicking on
each of the displayed solutions , providing the detail on each component. The electrical
tab provides an overview of the overall and monthly electricity production of the various
sources of the system. The size of the solar panels can be increased in order to counter-
balance the shortage of electrical provision. Adding more batteries and increasing the size
of the photovoltaic cell can improve the system performance. At the same time , capital
14
expenditure of overall system will increase when adequate space is not provided for the site
for additional equipment.
3.2 Review of Photovoltaic Panels
Solar cells have low efficiency. The major issue using a photovoltaic array (PV) cell con-
nected in series is the internal resistance. It can become worse when the irradiance is not
uniform or partial. In areas where there is a lot of plantations , this issue is common. The
cells which are under shade produces less current , but these cells are also forced to carry
the same current due to the series circuit. There are a lot of schematics (configurations)
proposed in the literature according to Volker Quaschning article [36]. The solar radiation
denotes the solar radiation received in a particular area and recorded during a specific time
frame. This is also called as insolation. If the specific span of time is an hour or a day then
the solar irradiation is called as hourly or daily accordingly and the unit of measurement is
kWh/m2/time.
The circuit diagram of a PV cell can be obtained after considering the following param-
eters [37]:
1. Temperature dependence of the diode reverse saturation current.
2. Temperature dependence of the photo current
3. Series resistance (internal losses due to the current flow) , which gives a more accurate
shape between the maximum power point and the open circuit voltage.
4. Shunt resistance , in parallel with the diode , this corresponds to the leakage current
to the ground.
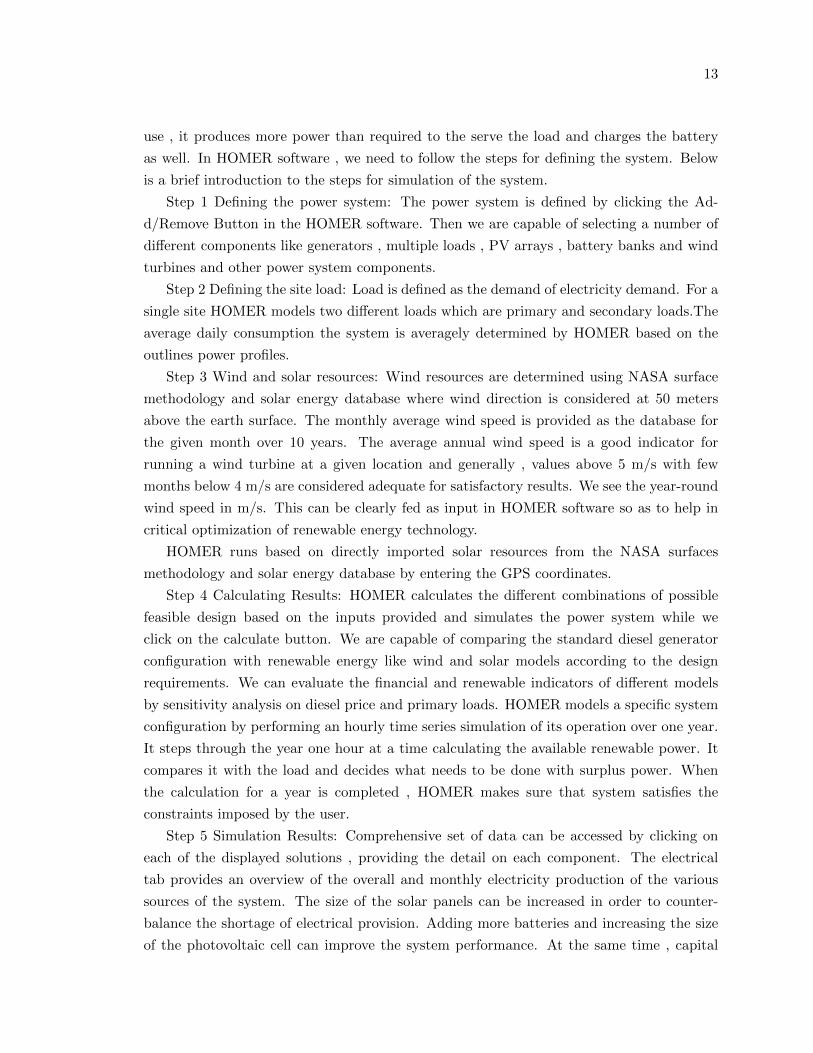
Figure 3.2 shows a circuit diagram of a solar cell [2] where the series and shunt resistances
are ignored. From Fig. 3.2 , we can write the load current as
Iph Id
Load
I
+
-
V
Figure 3.2: Solar cell circuit diagram [2]
15
I = Iph − Id (3.1)
where Iph is the photocurrent due to solar radiation and Id is the diode current which is
given by the usual expression
Id = Is × (eV/VT − 1) (3.2)
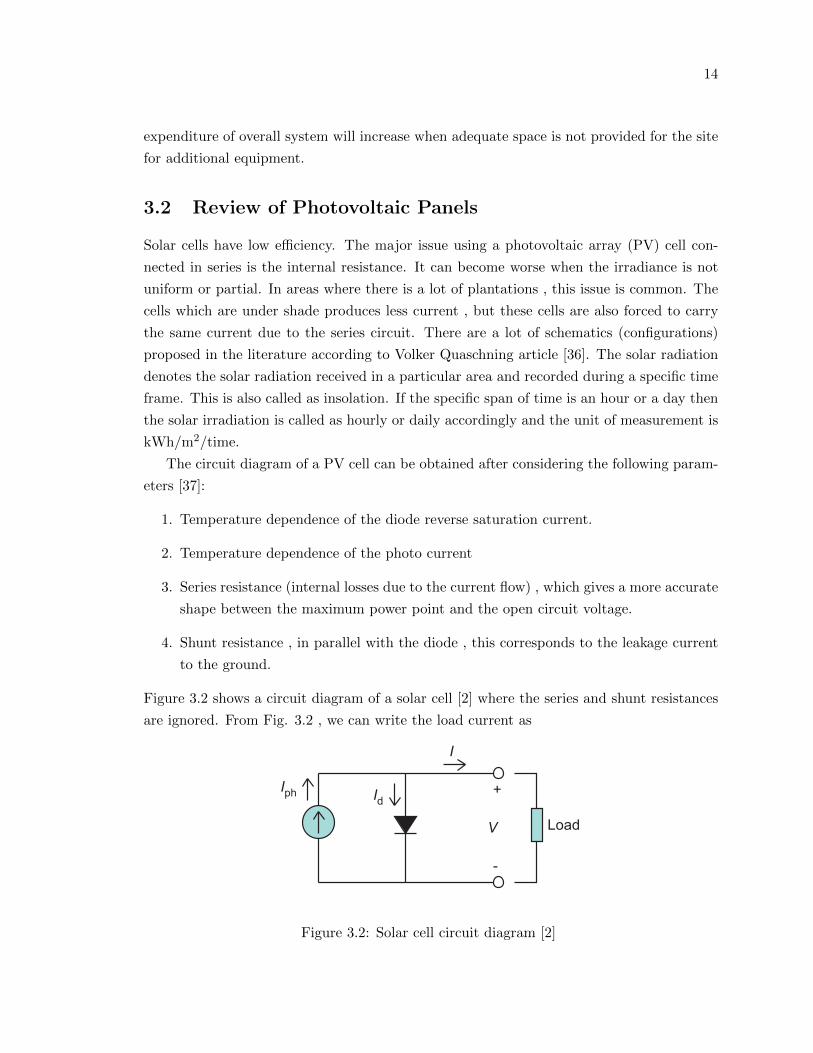
Where Is is the reverse saturation current and VT ≈ .26 mV is the thermal voltage. Fig 3.3
shows the I-V characteristics of the solar cell [2].
Isc
I
VVoc
pm
Figure 3.3: I-V characteristics of the solar cell [2]
Figure 3.3 we have the following quantities: Voc is the open-circuit voltage , Isc is the
short circuit current and pm is the maximum power available as indicated as [38].
Isc = Iph (3.3)
Voc = VT ln(1 +IphIs
) (3.4)
The maximum power point pm is obtained by finding maximum value of the product p =
I × V .
Using the solar radiation on a tilted surface , the hourly energy output is [39] , [40] , [41]
Epv = Gt×A× P × ηpv (3.5)
where Gt is the hourly irradiance in kWh/m2 , A is the surface area in m2 , P is the PV
penetration level factor , which is defined as the ratio of total peak PV power to peak
apparent power [42] and ηpv is the efficiency of PV array.
There are different algorithms that are used to estimate the maximum power point such
as P&O , constant voltage and incremental conductance [3].
16
3.2.1 Perturb and Observe (P&O)
In this method , the voltage is changed in small portions and this perturbation causes
the power of the solar module to change. If the power increases due to the perturbation
then the perturbation is continued in the same direction. After the peak power is reached
the power at the power change is zero and next instant decreases and hence after that ,
the perturbation reverses in direction. When the stable condition arrives , the algorithm
oscillates around the peak power point. In order to maintain the power variation small then
the perturbation size needs to be reduced. The technique is advanced in such a style that it
sets a reference voltage of the module corresponding to the peak voltage of the module. A
Proportional Integrator (PI) controller then transfers the operating point of the module to
that particular voltage level. This algorithm fails to track the maximum power point under
fast-changing atmospheric conditions and power loss can also be observed [3].
3.2.2 Incremental Conductance
This method takes the incremental conductance (dI/dV ) of the PV array to compute the
sign change in power with respect to the voltage (dP/dV ). This method computes the
maximum power by comparing the incremental conductance (∆i/∆v) to the array conduc-
tance (I/V). If the value of the incremental conductance I is equal to the value of array
conductance , then that is the value of MPP. The controller will maintain this voltage un-
til the irradiance changes and this iteration is repeated. This relationship is derived from
the fact that (dP/dV ) is negative when the MPPT is to the right side curve of the MPP
and positive when it is to the left side curve of the MPP. This algorithm has advantages
over P&O in that it can determine when the MPPT has reached the MPP , where P&O
oscillates around the MPP. Also , incremental conductance can track rapidly increasing and
decreasing irradiance conditions with higher precision than perturb and observe [3].
3.2.3 Constant Voltage
The term constant voltage in MPP tracking is used to describe different techniques by
different authors , one in which the output voltage is regulated to a constant value under
all conditions and one in which the output voltage is regulated based on a constant ratio
to the measured open circuit voltage (VOC). The latter technique is referred to in contrast
as the open voltage method by some authors. If the output voltage is held constant , there
is no attempt to track the maximum power point , so it is not a maximum power point
tracking technique in a strict sense , though it does have some advantages in cases when
the MPP tracking tends to fail , and thus it is sometimes used to supplement an MPPT
method in those cases. In the constant voltage MPPT method (also known as the open
voltage method) , the power delivered to the load is momentarily interrupted and the open-
17
circuit voltage with zero current is measured. The controller then resumes operation with
the voltage controlled at a fixed ratio , such as 0.76 , of the open-circuit voltage VOC [3].
This is usually a value that has been determined to be the maximum power point , either
empirically or based on modelling , for expected operating conditions. The operating point
of the PV array is thus kept near the MPP by regulating the array voltage and matching
it to the fixed reference voltage Vref = kVOC . The value of Vref may be also chosen to
give optimal performance relative to other factors as well as the MPP , but the central
idea in this technique is that Vref is determined by a ratio of VOC . One of the inherent
approximations to the constant voltage ratio method is that the ratio of the MPP voltage
to VOC is only approximately constant , so it leaves room for further possible optimization.
3.3 Wind Turbine Conversion System
Wind Turbine (WT) conversion system is used to convert wind energy into mechanical
energy that can be useful for generating power. A wind turbine is a rotating machine
that takes power from the wind using aerodynamically designed blades. The useful power
depends on the wind speed but it is important to control and limit the power at higher
speeds to avoid system damage. The WT consists of different components: aerodynamics
, mechanical and electrical systems. The various components composed of wind turbine
blades , a power electronic converter , a generator and all related control systems [45].
3.3.1 Wind Turbine
Nowadays the wind turbines are very common and they transform kinetic to rotating me-
chanical power. The two basic configurations of the modern wind turbine based on the
direction of the rotating shaft or axis are Horizontal axis and Vertical axis turbine. These
wind turbines are a very wide range , extending from few tens or hundreds of watts for
small machines to as much as 5 megawatts of power for a very large turbine. Horizontal
axis wind turbines (HAWT) have blades like airplane propellers. HAWT typically has either
2-3 blades or a large number of blades. The latter is known as high-solidity devices and
include multi-blade wind turbines used for water pumping on farms. On the other hand
, the wind turbines with 2 or 3 blades are largely vacant , having only a small fraction
of this area solid and are referred to as low-solidity devices. The low-solidity turbines are
almost universally employed to generate electricity. Vertical axis wind turbines (VAWTs)
have blades that go from top to bottom. Savonius is the most common type of these wind
turbines and Darrieus is one of the most popular in the global market. Wind can be trapped
in any direction by these turbines without any need to reposition the rotor with the change
in wind directions.
18
The hourly energy generated (Ew) by wind generator and the rated power output (Pw)
is [46]
Pw = 1/2 × ρw ×A× v3 × Cp(λ, β) × ηt × ηg (3.6)
Ew = Pw × t (3.7)
Where:ρw is the density of air in 1.22kg/m3 ,
A is the swept area (m2) ,
v is the wind speed (m/s) ,
Cp is the performance coefficient of the turbine ,
λ is the tip speed ratio of the rotor blade tip speed to wind speed ,
β is the blade pitch angle (deg) as 0◦ ,
ηt is the wind turbine efficiency ,
ηg is the generator efficiency.
3.3.2 Betz Rule
According to the Betz rule , we can only convert less than 59% of the kinetic energy to
mechanical energy using wind turbine. This is because the wind has some kinetic velocity
even after passing through the wind turbine. Within the turbine , most of the energy
is converted into useful electricity , while other losses can be in the gearbox , bearings ,
generator , converters and others. Most practical rotors with three blades can have an
efficiency of about 50% approximately.
3.3.3 Operating Region of the Wind Turbine
The operating region of a variable pitch variable speed wind turbine can be described by
their power curve , which gives estimated output power as a function of wind speed [47].
Wind speed power curve is the characteristic , the shape of which depends on the blade area
, the choice of airfoil , the number of blades , the shape of the blade , the cut-in wind speed
, the shutdown speed , the rated speed and gearing and generator efficiencies , the speed of
rotation , the optimum tip-speed ratio. The power output of a wind turbine changes with
the wind speed and wind turbine power curve.The description of the three distinct wind
speed points that are important for describing the power curve is below
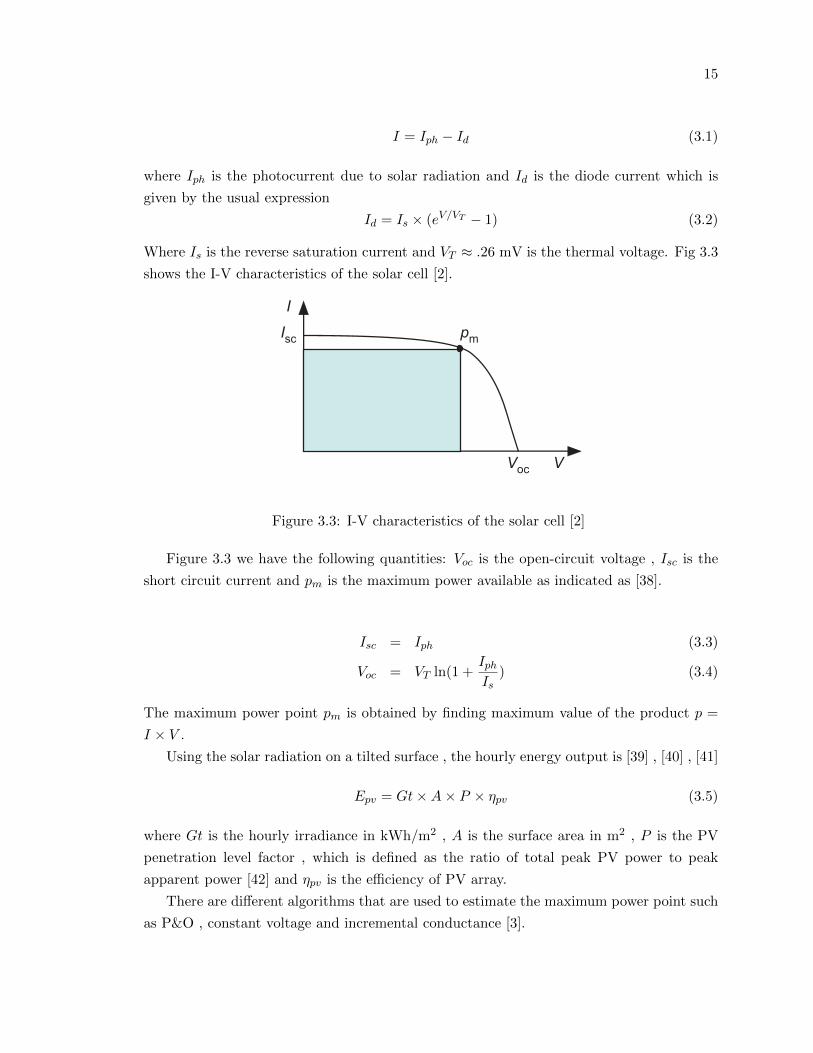
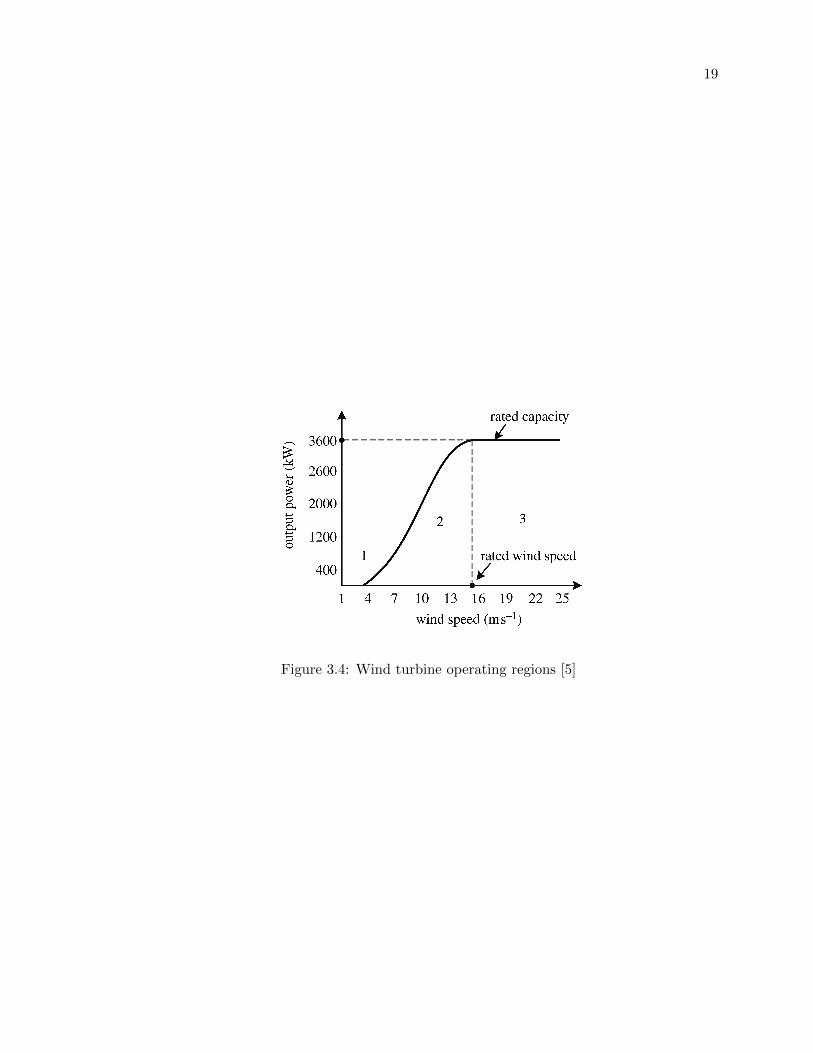
Figure 3.4 shows the operating regions of a wind turbine Some terms are defined for a
wind turbine:
1. Cut-in Wind Speed: The lowest wind speed at which the wind turbine starts to
generate electricity.
19
Figure 3.4: Wind turbine operating regions [5]
20
2. Rated Speed: Rated wind speed is the speed at which the wind turbine generator
generated the rated power , which usually is the maximum power wind turbine can
produce.
3. Cut-out Wind Speed: Wind speed at which the turbine terminates power generation
and is shut down (with automatic brakes or by brake pitching) to protect the turbine
from mechanical damage.
3.3.4 Electrical Generators
The electrical generator is the unit that converts mechanical energy from the turbine into
electrical energy. Generators are composed of a stator , a rotor , a rotating element and a
static element. Different types of generators are explained below.
1. Asynchronous Generator
Asynchronous generators are also called as induction generators. The stator must be
connected to an external source of power to start the circulation of current through
the stator windings. The grid generally supplies to the source. This rotating current
is sent to the rotor through the short circuit for initial excitation. The stator current
produces rotating magnetic flux , which will help the rotor to rotate in the same
direction. Although the rotor will rotate at a slightly lower speed than the magnetic
field , called slip speed. In our work , we have used CAT 200 which is permanent
magnet diesel generator.
Induction generators can only produce electricity when the rotor rotates at a speed
above the synchronous speed. The synchronous frequency is generally accepted as the
frequency of the supply grid. For each generator , there is a speed , which corresponds
to this frequency , called the synchronous speed. However , induction generators have
the ability to produce power at varying rotor speeds. There are two types of commonly
used rotors , the squirrel-cage rotor , and the wound rotor. The squirrel-cage rotor
has current-carrying longitudinal bars around the shaft that are connected by rings
, which look similar to a hamster wheel. These bars will spin in concurrence with
the rotating magnetic field of the stator. This type of rotor is more commonly used
today due to the fact that they require less maintenance and are less expensive to
manufacture.
The wound rotor induction generator is also known as a doubly fed induction generator
or a DFIG. This is because both the rotor and the stator have windings that participate
in the electrical conversion process. Slip rings and brushes electrically connect the two
elements to transfer power between the shaft of the rotor and the electrical system.
21
These rings and brushes are the reason for the high maintenance required for these
generators.
2. Synchronous Generator
Synchronous generators can produce constant power at a synchronous speed. There
is less maintenance required for these types of generators because they do not require
slip rings or brushes to transfer electricity from the rotor to the electrical system. In
this work , it is a standalone system so the electric load is connected to the source.
They also do not require the supply grid to begin excitation in the rotor , so they can
be run in island model or as the sole power generation facility. Synchronous generators
can supply up to 100% of a facility power requirements , whereas induction generators
can only supply up to 1/3 because they depend on the reactive power from the supply
grid. Yet another benefit to the synchronous generator is that voltage regulation is
possible , which is not the case with induction generators.
There are also different types of rotors for the synchronous generator family. The
brushless wound rotor type is a modified version of the DFIG where the rotor still
contains windings , but there is an internal DC source to begin excitation. The
internal exciter will begin the spinning of the rotor , which will then lock into the
stator rotating magnetic flux and continue to rotate at the synchronous speed [48].
3. Permanent Magnet Synchronous Generator (PMSG)
PMSG uses a permanent magnet as its excitation field instead of an electromagnetic
coil. These types of generators tend to be more expensive due to the material required
to make them. However , the cost of the material continues to decline , and they are
becoming more and more common in the energy industry due to their high reliability
and low maintenance [49].
3.3.5 Power Conversion Schemes
Power conversion for wind energy systems generally occurs in two stages. The first stage is
rectification , where the alternating current (AC) is transformed into direct current (DC).
The second stage is where the direct current is transformed back into the alternating current.
3.3.6 Rectification
Rectification is the first stage in the conversion process , also known as AC/DC stage.
The most common type of rectification process is a three-phase diode bridge , where the
top diode passes the positive cycle of the sine wave and the bottom diode will pass the
negative cycle of the sine wave , making both cycles positive. A rectification system can
be made by the combination of IGBTs or MOSFETs as switching devices. They can form
22
a complex system because each device will require individual switching signals , such as
pulse width modulated (PWM) signal [50] Although they are sufficient than passive diode
circuits and control systems can be applied to them , which helps in improving the power
quality. A capacitor is used for smoothening the rectified output wave , as it tends to be a
bit sinusoidal. It is also called as DC link.
3.3.7 Bidirectional Inverter
A bidirectional inverter is an indispensable element in a hybrid system that contains a
storage system and a backup diesel generator. It can transfer power simultaneously in both
directions. It can function as a rectifier circuit which changes AC diesel generator voltage
to DC voltage and charges the battery bank; hence providing an AC bus to the DC bus
path. On the other hand , it acts as an inverter which changes DC voltage to AC voltage
needed by the load and thus provides a path from DC bus to the AC load. In order to
fulfill the demands , an optimal model , simulation and design needs to be developed using
HOMER software.
3.3.8 Mathematical Model of Converter
The converter contains both rectifier and inverter. The PV panel and the battery are
connected to the DC bus. The wind turbine and the diesel generator sub-systems are
connected to AC bus. The electric load is connected between these busses.
The rectifier is used to transform the surplus AC power from the wind energy generator
and diesel generator to DC power of constant voltage , when the energy generated by the
hybrid energy system exceeds the load demand. The rectifier model is [51] , [52] , [38]
ERec outt = ηRec × ESur ACt (3.8)
ESur ACt = EDGt− ELoadt (3.9)
where ERec outt is the hourly energy output from rectifier (kWh) , ηRec is the efficiency of
the rectifier , ESur(AC)t is the amount of surplus energy from AC sources (kWh) and EDGt
is the energy generated on hourly basis by diesel generator.
3.3.9 Charge Controller
A charge controller is essential in a hybrid system with a storage device. It protects the
battery in case of both excessive overcharge and deep discharge. It can switch the battery
from the load when a state of discharge is reached. It can also switch the battery from the
DC bus when it is fully charged. Charge controller can be adjusted to deal with different
23
charging and discharging conditions. The charge controller plays the role of an interface
between each of wind turbine , PV panel and the DC bus where the battery is connected.
Controls can be located at a number of places throughout the WECS [53]. Initially ,
with an active rectifier , the rotational speed of the generator can be sensed and controlled
through a Proportional Integral Derivative (PID) controller. This will optimize the conver-
sion coefficient to maintain maximum power output. Also , an early power factor correction
circuit will help maintaining the power quality throughout the system. Secondly , a control
system can be implemented through the grid-side inverter PWM signal. It can be used to
maintain a constant voltage on the DC link , which will decouple the grid from power fluctu-
ations due to wind variations. Control system can also use output current feedback control
to manage output active and reactive power for a full power factor correction approach.
A supplementary control system can also be implemented for the addition of a storage
system. The storage cells will connect through the capacitor bank , requiring a DC/DC
conversion and controls system. This set of controls will maintain voltage regulation when
the turbine is producing excess power. It will also ensure proper power delivery during low
or no wind situations.
3.3.10 Mathematical Model of Charge Controller
To prevent overcharging of a battery , a charge controller is used to sense when the batteries
are fully charged and to stop or decrease the amount of energy flowing from the energy source
to the batteries. The model of the charge controller is presented below [51] , [39] , [54]
ECC outt = ECC int× ηCC (3.10)
ECC int = ERec outt+ ESur DCt (3.11)
where ECC outt is the hourly energy output from the charge controller (kWh) , ECC int is
the hourly energy input to the charge controller (kWh) , ηCC is the efficiency of the charge
controller , ERec outt is the hourly energy output from the rectifier (kWh) and ESur DCt is
the amount of surplus energy from DC sources (kWh).
3.4 Energy Storage
Solar and wind power are renewable resources but these resources are limited to the weather
conditions. This is a common issue which the small-scale industries are facing these days.
Therefore , to rectify this mismatch between the power required and the ability to generate
power , we need a storage system. It is less expensive and common nowadays. Ultra-
capacitors have a lower internal resistance , so they can provide a surge of power faster than
24
a battery , however , batteries can provide power for a longer period. For hydro electricity ,
the most common type of storing device is the reservoir. Pumping water up the hill into the
reservoir turns the electrical energy generated by the wind and PV array into gravitational
potential energy. But the drawback of this kind of storage device is its dependency on
how many dams and reservoirs we can have which makes it expensive. Another option for
storing energy is called as a compressed air energy storage system. This system works by the
electricity that help in compressing the air inside the tank. The compressed air is released
to power the wind turbine. Another large-scale energy storage system is the hydrogen fuel
cells , which works on the principle of splitting water into hydrogen and oxygen and storing
the hydrogen [55] , [40]. The stored hydrogen can be used in the fuel cell , where it will react
with the oxygen to generate electricity , with water as the by-product. But this system has
a limited scope based on the availability of places required to store hydrogen. A battery is
used as a backup system and it also maintains a constant voltage across the load. They are
used to store excess energy for later use. The energy is stored in electromechanical form
and is used in wide variety of applications.
3.4.1 Battery Selection
The output power from the wind turbine and PV panel varies with weather conditions
throughout the day. Therefore it is not possible to meet the load demand all the time with
individual PV or a wind turbine. This can be compensated using a battery between the
DC bus of the hybrid system and the load which acts as a backup power supply during the
power crisis. If an excess of energy is generated by the PV and wind turbine after meeting
the load demand , that excess energy is stored by charging the battery , for future use.
Two main types of batteries used in hybrid systems are nickel-cadmium battery and lead
acid battery. Nickel-cadmium batteries are expensive , have lower energy efficiency and
limited upper operating temperature. Hence lead-acid batteries are most commonly used
in the hybrid systems. The Depth of Discharge (DOD) is a measure of how much energy
has been withdrawn from a storage device , expressed as a percentage of full capacity. For
example , if the DOD of the battery as mentioned by the manufacturer is 50% then only
50% of the battery capacity will be consumed by the load. The state of charge (SOC) is
the reserve of the depth of discharge (DOD). It indicates the present state of the battery
in use. The battery cycle is a complete period of discharge and recharge. Generally , it is
considered to be discharging from 100% to 20% DOD and then back to 100%. The expected
number of cycles a battery can deliver is an indicator of its performance. The average
depth of discharge is inversely proportional to the cycle life. When selecting a battery type
, usually lead-acid battery is chosen. Generally , lead-acid batteries are more cost-effective
than nickel-cadmium batteries , but the latter may be a better choice for greater battery
ruggedness. Nickel-cadmium batteries can perform well under rigorous working conditions.
25
Selection of battery voltage depends on inverter and controller available. They usually come
under voltage ratings of 12 , 24 , 48 , 120 and 240 V DC and thus batteries are required
to be connected in series to meet the requirement. The number of batteries string that
can be connected together is limited to about five without rigorous monitoring and higher
maintenance cost. Therefore once the battery bank capacity has been selected the size of
the individual battery type must be chosen accordingly. Same battery characteristics must
be connected together so as to avoid one battery overcharged and the other undercharged.
3.4.2 Mathematical Model of Battery Bank
The battery state of charge SOC is the cumulative sum of the daily charge/discharge
transfers. At any hour t the state of the battery is related to the previous state of charge
and to the energy production and consumption situation of the system during time from
t−1 to t. During the charging process , when the total output of all generators exceeds the
load demand , the available battery bank capacity at the hour t can be described by [56]
EBatt = EBatt− 1 + ECC outt× ηchg (3.12)
where EBatt is the energy stored in the battery at the hour t , ECCt is the hourly energy
input to charge controller (kWh) and ηchg is the battery charging efficiency.
On the other hand , when the load demand is greater than the available energy generated
, the battery bank is in discharging state. Therefore , the available battery bank capacity
at hour t can be expressed as
EBatt = EBatt− 1 − Eneededt (3.13)
where EBatt is the energy stored in the battery at the hour t , ENeededt is the hourly load
demand at a particular period of time.
Let d be the ratio of minimum allowable SOC voltage limit to the maximum SOC voltage
across the battery terminals when it is fully charged. The Depth of Discharge (DOD) is
defined as:
DOD% = (1 − d) × 100 (3.14)
3.5 Diesel Generator Power Systems
A diesel generator is a combination of a diesel engine with an alternator to generate electrical
energy. The most common cases where diesel generators are used is as follows
1. If some places are not connected to the power grid
26
2. An emergency power-supply in case the grid fails
3. To avoid low-load or power crisis.
3.5.1 Diesel Generator Selection
A diesel generator should be selected such that it meets the load demands but also runs on
an average at high load levels. If a battery storage is installed for a short duration with the
diesel generator , it helps to overcome peak load demands and thus reduces the capacity of
a diesel generator. The diesel generator charges the battery via charger that converts AC to
DC energy. The battery allows the generator to operate close to its rated values resulting
in a decrease of fuel consumption [6].
3.5.2 Diesel Generator Sizing in Hybrid System
Several generators can run in parallel and are able to fulfill different load levels. The
diesel generator integrated with various renewable resources contribute a lot. A diesel
generator adds reliability in a hybrid system. Regular repair and maintenance is always
recommended to enhance the life span of the generator. Diesel generators are used either
when the battery’s state of charge has fallen below a specific value or if the battery and
renewable energy resource cannot meet the load demands. Diesel generators may shut off if
there is sufficient power available from renewable resources and from the battery to supply
the load demand.
3.5.3 Mathematical Model of Diesel Generator Subsystem
For higher efficiency the diesel generator will always operate within the range of 80 to 100
percent of their kW rating. A diesel generator consumes fuel to produce electricity and
also heat as a by-product. The physical properties of the generator are its minimum and
maximum electrical output , expected lifetime in operating hours , the type of fuel it uses
and its fuel curve , which relates the quantity of fuel consumed to the produced electrical
power.
27
Chapter 4
System Configuration and
Simulation Results
4.1 Selection of Study Area and Load Assessment
In HOMER software for the selected area of Portugal (39 ◦ 39’ N and -8◦ 22’ W) , the solar
radiation and wind speed data are downloaded from NASA for the time period between
2005-2012. The data has been analyzed to assess utilization of hybrid PV , wind , battery
and diesel generator power systems to meet the load requirements for the standalone sys-
tem. The wind turbines , solar and other renewables produced an average of 52 percent of
Portugal’s electricity as of 2015 , which is just 8 percent of the country’s target of 60 percent
by 2020. As per a report in the Guardian [60] , Portugal ran for four days (approximately
107 hours) straight on renewable energy alone. This shows the importance of renewable
energy.
The basic energy requirements for assessing the load in such areas can be classified as
domestic and industrial. In the domestic sector electricity is required for appliances. The
electrical load from small manufacturing units , cold storage , small milk processing plants
and cottage industries in the village sums up the rural industrial load. The primary load
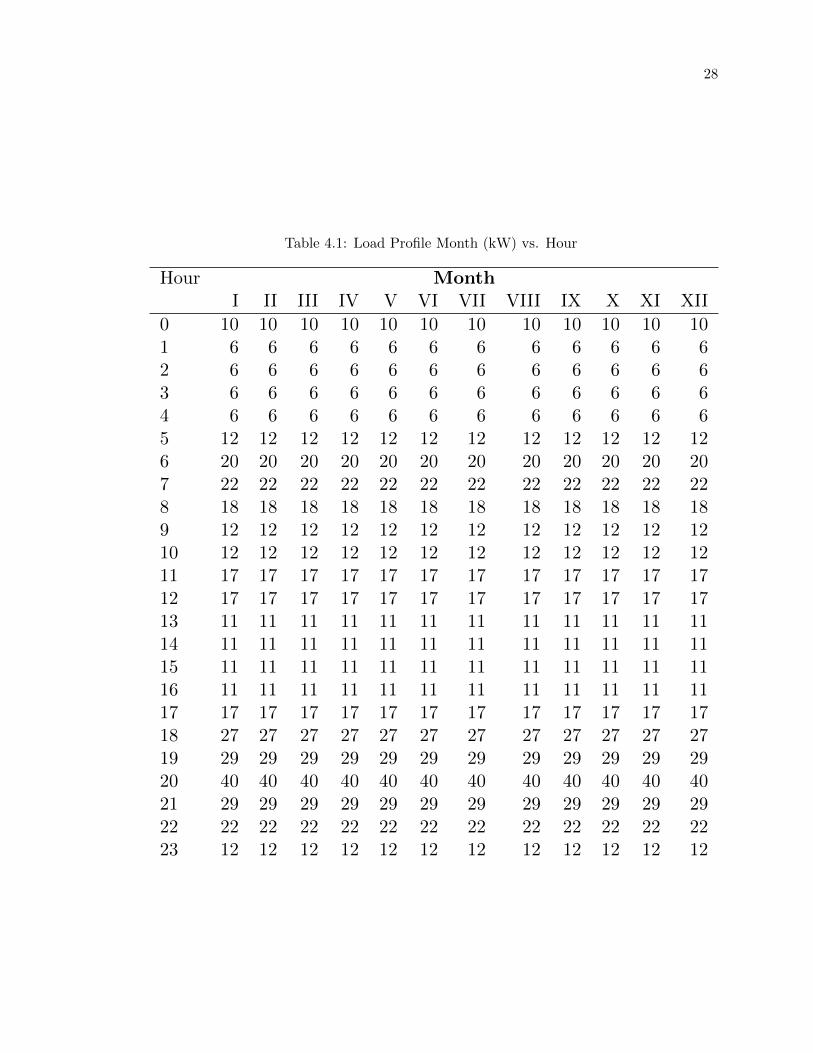
for the selected site is downloaded from the HOMER software. The electric load profile is
shown in Table 4.1 which shows the scaled average load is 60 kWh/d. Scaled data is created
by multiplying baseline data value which is 389.5 kWh/d by the common load factor. Load
factor is defined as a dimensionless number equal to the average load divided by the peak
load. Common load factor is 0.28 in this work.
4.1.1 Input to renewable systems using HOMER
Our study area has three types of loads namely residential load , industrial load , and
agricultural load and we are considering only residential load in this work [61]. In this
28
Table 4.1: Load Profile Month (kW) vs. Hour
Hour MonthI II III IV V VI VII VIII IX X XI XII
0 10 10 10 10 10 10 10 10 10 10 10 101 6 6 6 6 6 6 6 6 6 6 6 62 6 6 6 6 6 6 6 6 6 6 6 63 6 6 6 6 6 6 6 6 6 6 6 64 6 6 6 6 6 6 6 6 6 6 6 65 12 12 12 12 12 12 12 12 12 12 12 126 20 20 20 20 20 20 20 20 20 20 20 207 22 22 22 22 22 22 22 22 22 22 22 228 18 18 18 18 18 18 18 18 18 18 18 189 12 12 12 12 12 12 12 12 12 12 12 1210 12 12 12 12 12 12 12 12 12 12 12 1211 17 17 17 17 17 17 17 17 17 17 17 1712 17 17 17 17 17 17 17 17 17 17 17 1713 11 11 11 11 11 11 11 11 11 11 11 1114 11 11 11 11 11 11 11 11 11 11 11 1115 11 11 11 11 11 11 11 11 11 11 11 1116 11 11 11 11 11 11 11 11 11 11 11 1117 17 17 17 17 17 17 17 17 17 17 17 1718 27 27 27 27 27 27 27 27 27 27 27 2719 29 29 29 29 29 29 29 29 29 29 29 2920 40 40 40 40 40 40 40 40 40 40 40 4021 29 29 29 29 29 29 29 29 29 29 29 2922 22 22 22 22 22 22 22 22 22 22 22 2223 12 12 12 12 12 12 12 12 12 12 12 12
29
thesis , our focus is on the input renewable resources and also to meet the required load
demand using a photovoltaic system , a wind turbine , a diesel generator and a battery
bank.
4.1.2 Photovoltaic Resource Specifications
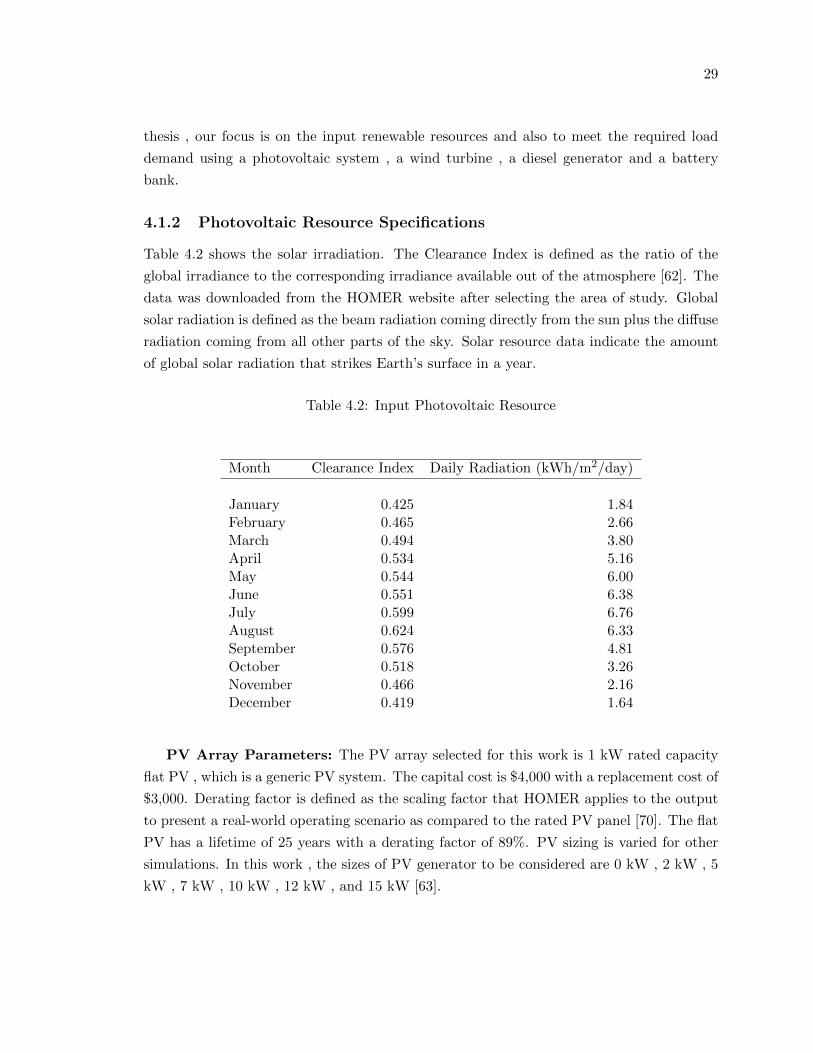
Table 4.2 shows the solar irradiation. The Clearance Index is defined as the ratio of the
global irradiance to the corresponding irradiance available out of the atmosphere [62]. The
data was downloaded from the HOMER website after selecting the area of study. Global
solar radiation is defined as the beam radiation coming directly from the sun plus the diffuse
radiation coming from all other parts of the sky. Solar resource data indicate the amount
of global solar radiation that strikes Earth’s surface in a year.
Table 4.2: Input Photovoltaic Resource
Month Clearance Index Daily Radiation (kWh/m2/day)
January 0.425 1.84February 0.465 2.66March 0.494 3.80April 0.534 5.16May 0.544 6.00June 0.551 6.38July 0.599 6.76August 0.624 6.33September 0.576 4.81October 0.518 3.26November 0.466 2.16December 0.419 1.64
PV Array Parameters: The PV array selected for this work is 1 kW rated capacity
flat PV , which is a generic PV system. The capital cost is $4,000 with a replacement cost of
$3,000. Derating factor is defined as the scaling factor that HOMER applies to the output
to present a real-world operating scenario as compared to the rated PV panel [70]. The flat
PV has a lifetime of 25 years with a derating factor of 89%. PV sizing is varied for other
simulations. In this work , the sizes of PV generator to be considered are 0 kW , 2 kW , 5
kW , 7 kW , 10 kW , 12 kW , and 15 kW [63].
30
4.1.3 Wind Turbine Specifications
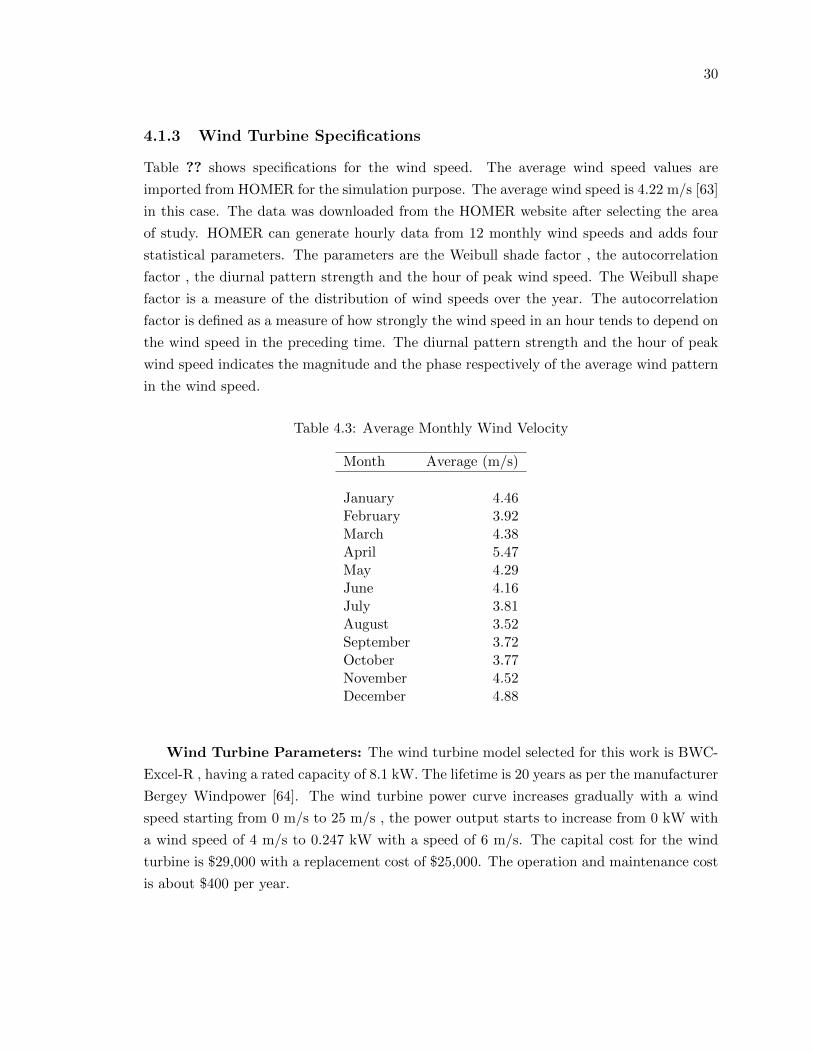
Table ?? shows specifications for the wind speed. The average wind speed values are
imported from HOMER for the simulation purpose. The average wind speed is 4.22 m/s [63]
in this case. The data was downloaded from the HOMER website after selecting the area
of study. HOMER can generate hourly data from 12 monthly wind speeds and adds four
statistical parameters. The parameters are the Weibull shade factor , the autocorrelation
factor , the diurnal pattern strength and the hour of peak wind speed. The Weibull shape
factor is a measure of the distribution of wind speeds over the year. The autocorrelation
factor is defined as a measure of how strongly the wind speed in an hour tends to depend on
the wind speed in the preceding time. The diurnal pattern strength and the hour of peak
wind speed indicates the magnitude and the phase respectively of the average wind pattern
in the wind speed.
Table 4.3: Average Monthly Wind Velocity
Month Average (m/s)
January 4.46February 3.92March 4.38April 5.47May 4.29June 4.16July 3.81August 3.52September 3.72October 3.77November 4.52December 4.88
Wind Turbine Parameters: The wind turbine model selected for this work is BWC-
Excel-R , having a rated capacity of 8.1 kW. The lifetime is 20 years as per the manufacturer
Bergey Windpower [64]. The wind turbine power curve increases gradually with a wind
speed starting from 0 m/s to 25 m/s , the power output starts to increase from 0 kW with
a wind speed of 4 m/s to 0.247 kW with a speed of 6 m/s. The capital cost for the wind
turbine is $29,000 with a replacement cost of $25,000. The operation and maintenance cost
is about $400 per year.
31
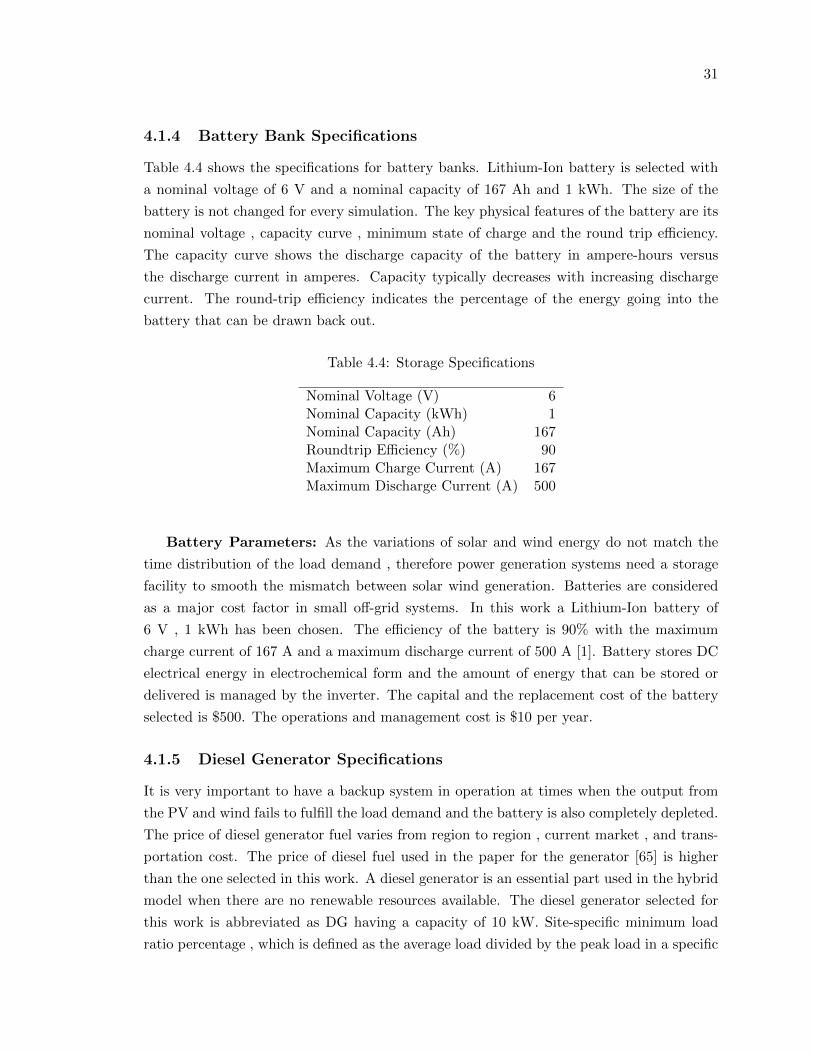
4.1.4 Battery Bank Specifications
Table 4.4 shows the specifications for battery banks. Lithium-Ion battery is selected with
a nominal voltage of 6 V and a nominal capacity of 167 Ah and 1 kWh. The size of the
battery is not changed for every simulation. The key physical features of the battery are its
nominal voltage , capacity curve , minimum state of charge and the round trip efficiency.
The capacity curve shows the discharge capacity of the battery in ampere-hours versus
the discharge current in amperes. Capacity typically decreases with increasing discharge
current. The round-trip efficiency indicates the percentage of the energy going into the
battery that can be drawn back out.
Table 4.4: Storage Specifications
Nominal Voltage (V) 6Nominal Capacity (kWh) 1Nominal Capacity (Ah) 167Roundtrip Efficiency (%) 90Maximum Charge Current (A) 167Maximum Discharge Current (A) 500
Battery Parameters: As the variations of solar and wind energy do not match the
time distribution of the load demand , therefore power generation systems need a storage
facility to smooth the mismatch between solar wind generation. Batteries are considered
as a major cost factor in small off-grid systems. In this work a Lithium-Ion battery of
6 V , 1 kWh has been chosen. The efficiency of the battery is 90% with the maximum
charge current of 167 A and a maximum discharge current of 500 A [1]. Battery stores DC
electrical energy in electrochemical form and the amount of energy that can be stored or
delivered is managed by the inverter. The capital and the replacement cost of the battery
selected is $500. The operations and management cost is $10 per year.
4.1.5 Diesel Generator Specifications
It is very important to have a backup system in operation at times when the output from
the PV and wind fails to fulfill the load demand and the battery is also completely depleted.
The price of diesel generator fuel varies from region to region , current market , and trans-
portation cost. The price of diesel fuel used in the paper for the generator [65] is higher
than the one selected in this work. A diesel generator is an essential part used in the hybrid
model when there are no renewable resources available. The diesel generator selected for
this work is abbreviated as DG having a capacity of 10 kW. Site-specific minimum load
ratio percentage , which is defined as the average load divided by the peak load in a specific
32
time period , is 30 with a lifetime of 12,000 hours. The capital cost of a diesel generator is
$6000 with a fuel cost of $0.40/L [1].
4.1.6 Converter Specifications
The converter is used which can work in both ways like an inverter-rectifier based on the
direction of power flow. In this work , we have selected a converter having an efficiency of
95%. The converter size , which is a decision variable , refers to the inverter capacity which
means the maximum amount of power the device can produce by inverting the dc power.
The converter size is also varied for simulations from 0 kW , 2 kW , 4 kW , 6 kW , 8 kW
and 10 kW. The capital cost of the converter is $900 with a lifetime of 29 years.
4.2 HOMER Simulations
Simulation, optimization and sensitivity analysis are the three major actions run by HOMER.
In the simulation process, different micro-power system configurations for every hour of the
year are generated with their technical feasibility and LCC. In the optimization process ,
HOMER simulates many different configurations in search of the one that satisfies the con-
straints at the lowest LCC. In the sensitivity analysis , multiple optimizations are performed
on the selected configurations with a range of uncertain input parameters that are assumed
to affect the model inputs with time. Examples of uncertainties are the fuel price and the
average wind speed. The effects of these can be analyzed with the help of the sensitivity
analysis.
Simulation results help in identifying which configuration is the most optimized and
feasible solution. The simulator helps in determining how different sources or hybrid models
interact with the load demands for optimized results [66].
4.3 System Controls
Two different types of control strategies are modelled by HOMER [67]. With the load flow
strategy , whenever the generator is required it only produces enough power to meet the
load demand at a given time. In contrast to this , in the cycle charging strategy which is
used in this work , the generator is allowed to operate up to maximum power to charge the
batteries and serve the load at the same time. HOMER uses dispatch strategy to simulate
how the input components will work together in hybrid system. Operating reserve is defined
as a safety margin that helps a reliable electricity supply despite of any renewable input
resource. Every micro power system must provide with some amount of operating reserve
, else the electric load can fluctuate above the operating capacity which will result in an
outage. Every hour HOMER determines whether the non-dispatchable renewable resources
33
are capable of supplying the electric load and the required operating reserve. If not , then
HOMER determines how to best dispatch the system components to save the loads and
operating reserve. The fundamental principle that HOMER follows when dispatching the
system in the minimization of the cost [66].
4.4 Analysis
HOMER’s aim is to minimize the net present cost (NPC) both in finding the optimal system
configuration and in operating the system , economics play a crucial role in the simulation.
The indicator chosen to compare the different configuration’s economics is the life-cycle
costs (LCC) , and the total NPC is taken as the economic figure of merit. The advantages
of these indicators are described in this section [68]. HOMER performs the simulation
for a number of prospectively designed configurations. After examining every design , it
selects the one that meets the load with the system constraints at the least LCC. HOMER
performs its optimization and sensitivity analysis across all mentioned components and their
resources , technical and cost parameters and system constraints and sensitivity data over
a range of variables. The main difference between renewable and non-renewable resources
regarding costs is that nonrenewable resources usually have low capital and high operating
costs. After a considerable investment , in the beginning , the system can be operated at
a comparatively low-cost [69]. To be able to compare the economics of numerous different
system configurations with a varying share of renewable and non-renewable energy sources
, HOMER has to take into account both the operating and capital costs. Since the LCC
comprises of all costs incurred during the system’s lifespan , it considers these factors and
therefore is the appropriate parameter to compare the different configuration economics.
This LCC is determined with the help of the NPC , which expresses all costs and proceeds
occurring during a system’s lifespan in one total sum (in dollars). Future earnings are
discounted back to the present using the discount rate , which is just as the system’s
lifespan set by the system designer. The different items making up the NPC are the costs
of construction , maintenance including component replacements , buying power from the
grid and miscellaneous other costs. Furthermore , the NPC also considers salvage costs ,
that is the residual value of system components after the project ends. An alternative to
the NPC to compare the economics of various system configurations is the levelized COE ,
which is defined as the average cost for every kWh of electricity produced by the system.
Yet , HOMER has chosen NPC as the primary economic figure of merit.
34
4.5 Simulation Results
HOMER simulates configurations to get feasible results with the renewable resources and
the components specified as input. HOMER provides all possible results by simulating every
combination for a single model to get the best-optimized results in terms of Net Present
Cost (NPC). The strategy in simulations is to ensure the power generator provides enough
power to meet the load demand. The renewable energy resources in collaboration with
diesel generator were evaluated to get an optimized result based on NPC. In this work ,
different simulations were done by varying the size of the photovoltaic panel and to check
in this hybrid model how much production will be done by a diesel generator to fulfill the
load demands.
4.5.1 Optimization of Hybrid PV Wind Model
In the stand-alone system , if the demand is greater than the sum of generation and storage
, then the power must be supplied by the backup diesel generator. The objective function of
this research is to develop a stand-alone hybrid system and minimize the total life-cycle cost.
The total net present cost ($/year) includes initial cost , operational and maintenance cost
for each renewable resource. The salvage value of each equipment must be supplied. The
initial capital cost is defined as the capital cost of every component including the system
design cost and installation cost. The initial capital cost for every component is defined as
the product of the total capacity (kW) and its respective unit cost ($/kW ). Replacement
cost is when the system fails before its life expectancy due to any environmental effects ,
mishandling etc.
The total hybrid power generated at any time is given by
P =
NW∑WG=1
PWG +
NP∑PV=1
PPV +
ND∑DG=1
PDG (4.1)
where P is the total power generation , NW is the wind generator unit , PWG is the power
generated by the wind energy generator , NP is the number of PV cells unit , PPV is the
power generated by the photovoltaic unit , ND is the number of diesel generator unit , and
PDG is the power generated by the diesel energy generator ,
4.5.2 Constraints
The power generated should feed its load. The diesel generator always has the constraint to
operate between 80% to 100% of their kW rating. The generator minimum load ratio is the
minimum allowable load on the generator as a percentage of its rated capacity. According
to the selected site , the diesel generator has a minimum load ratio of 30% to avoid running
35
for a very low load. When this generated power exceeds the load demand then the surplus
energy will be stored in the battery bank. This energy will be used when a deficiency of
power is seen in order to meet the load demands. In this work , the sizes of PV generator
to be considered are 0 kW , 2 kW , 5 kW , 7 kW , 10 kW , 12 kW , and 15 kW. The PV
size has a site-specific restriction because of the area. According to the selected site , the
derating factor of PV is 80%. Hub height of the wind turbine according to the selected site
has to be 10m for optimal size. The battery has a restriction as well. The initial state of
charge is 100% and the minimum SOC is 20%. The charged quality of the battery bank
has the following limitation
SOCmin ≤ SOCt ≤ SOCmax (4.2)
4.5.3 Minimization of Cost
The main aim is to reduce the total life cycle cost of the hybrid system. The total capital
cost for the hybrid system is given by
Cc =
NW∑WT=1
CWT +
NPV∑PV=1
CPV +
ND∑DG=1
CDG +
NB∑B=1
CBat + CF (4.3)
where Cc is the capital cost , CPV , CWT , CDG , CBat are the cost for a single unit of the
photovoltaic , the wind turbine , the diesel generator and the battery respectively , CF is
the fixed cost including the cost of converter and other installation cost. NW is the wind
generator unit , PWG is the power generated by the wind generator and NP is the number of
PV cells unit. These numbers are fed in HOMER software to design the standalone hybrid
system for the simulation. The sizes of PV generator to be considered are 0 kW , 2 kW , 5
kW , 7 kW , 10 kW , 12 kW , and 15 kW. The number of units for input components are 1.
Total annualized life-cycle cost of the system comprises both the capital and the oper-
ating cost is
CAnnual = Cc × CRF + CO (4.4)
where CRF is the capital recovery factor for the system , CO is the annual operating cost.
The unit cost of electricity by hybrid energy system ,
COE =CAnnual
ET(4.5)
where ET is the total load served in kWh/year.
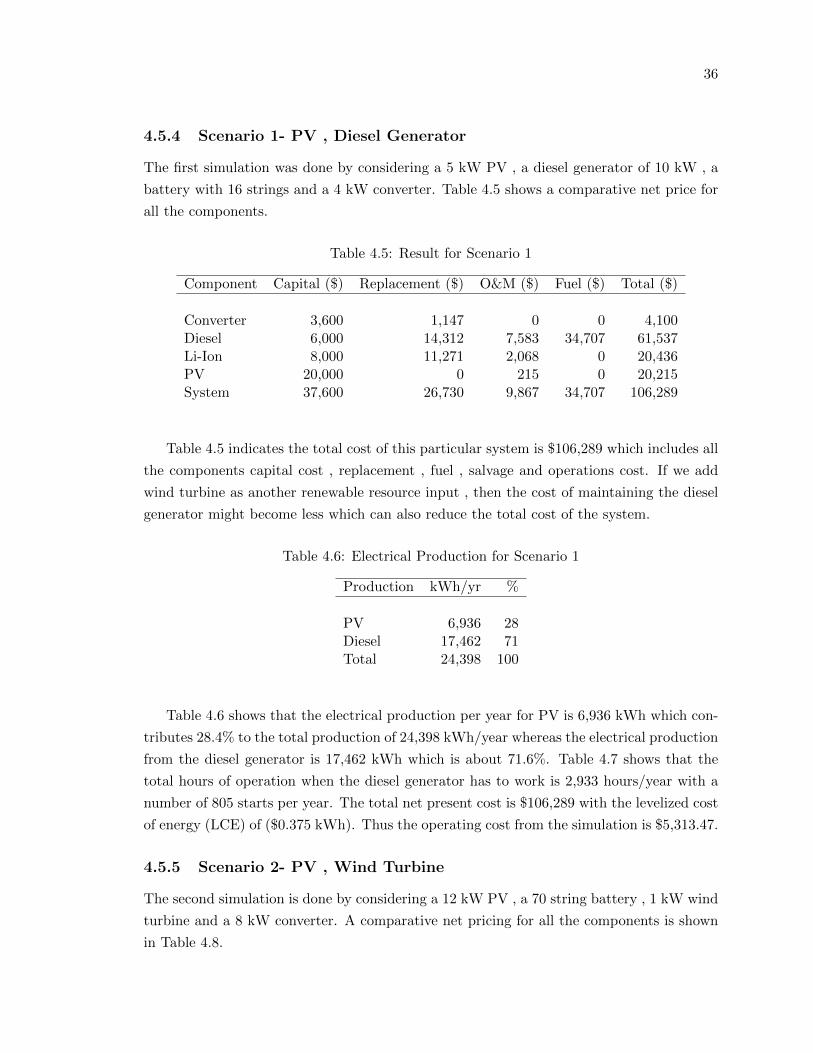
36
4.5.4 Scenario 1- PV , Diesel Generator
The first simulation was done by considering a 5 kW PV , a diesel generator of 10 kW , a
battery with 16 strings and a 4 kW converter. Table 4.5 shows a comparative net price for
all the components.
Table 4.5: Result for Scenario 1
Component Capital ($) Replacement ($) O&M ($) Fuel ($) Total ($)
Converter 3,600 1,147 0 0 4,100Diesel 6,000 14,312 7,583 34,707 61,537Li-Ion 8,000 11,271 2,068 0 20,436PV 20,000 0 215 0 20,215System 37,600 26,730 9,867 34,707 106,289
Table 4.5 indicates the total cost of this particular system is $106,289 which includes all
the components capital cost , replacement , fuel , salvage and operations cost. If we add
wind turbine as another renewable resource input , then the cost of maintaining the diesel
generator might become less which can also reduce the total cost of the system.
Table 4.6: Electrical Production for Scenario 1
Production kWh/yr %
PV 6,936 28Diesel 17,462 71Total 24,398 100
Table 4.6 shows that the electrical production per year for PV is 6,936 kWh which con-
tributes 28.4% to the total production of 24,398 kWh/year whereas the electrical production
from the diesel generator is 17,462 kWh which is about 71.6%. Table 4.7 shows that the
total hours of operation when the diesel generator has to work is 2,933 hours/year with a
number of 805 starts per year. The total net present cost is $106,289 with the levelized cost
of energy (LCE) of ($0.375 kWh). Thus the operating cost from the simulation is $5,313.47.
4.5.5 Scenario 2- PV , Wind Turbine
The second simulation is done by considering a 12 kW PV , a 70 string battery , 1 kW wind
turbine and a 8 kW converter. A comparative net pricing for all the components is shown
in Table 4.8.
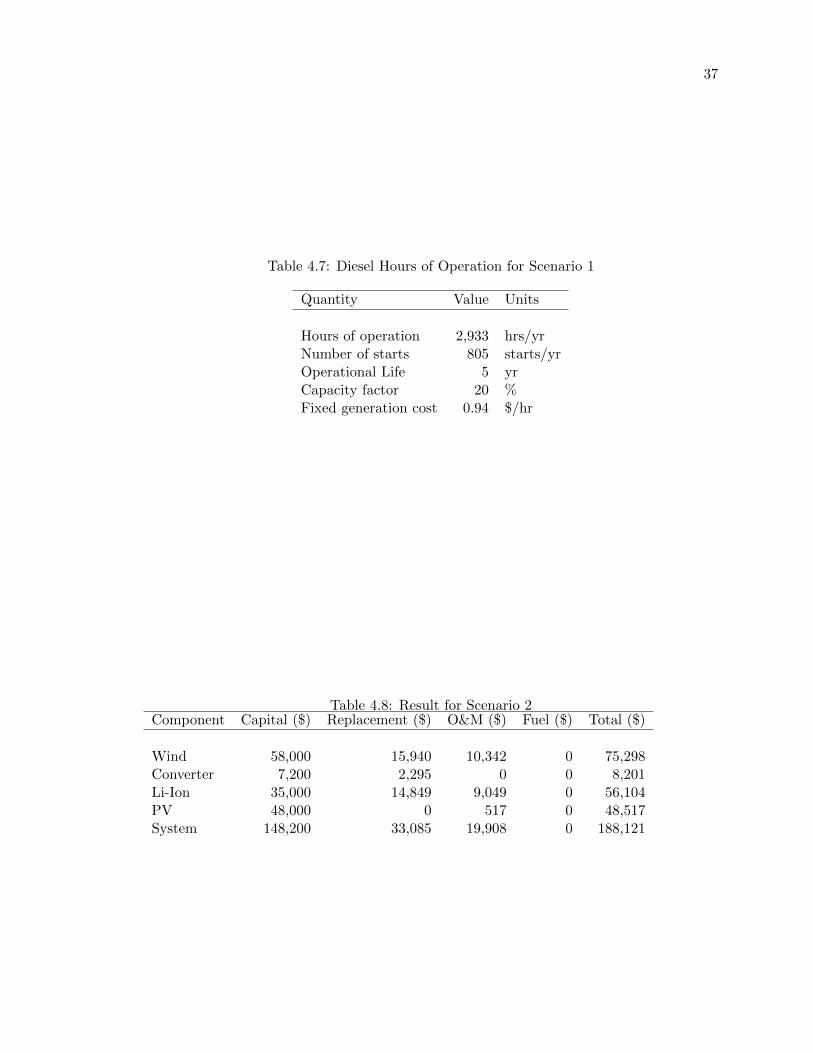
37
Table 4.7: Diesel Hours of Operation for Scenario 1
Quantity Value Units
Hours of operation 2,933 hrs/yrNumber of starts 805 starts/yrOperational Life 5 yrCapacity factor 20 %Fixed generation cost 0.94 $/hr
Table 4.8: Result for Scenario 2Component Capital ($) Replacement ($) O&M ($) Fuel ($) Total ($)
Wind 58,000 15,940 10,342 0 75,298Converter 7,200 2,295 0 0 8,201Li-Ion 35,000 14,849 9,049 0 56,104PV 48,000 0 517 0 48,517System 148,200 33,085 19,908 0 188,121
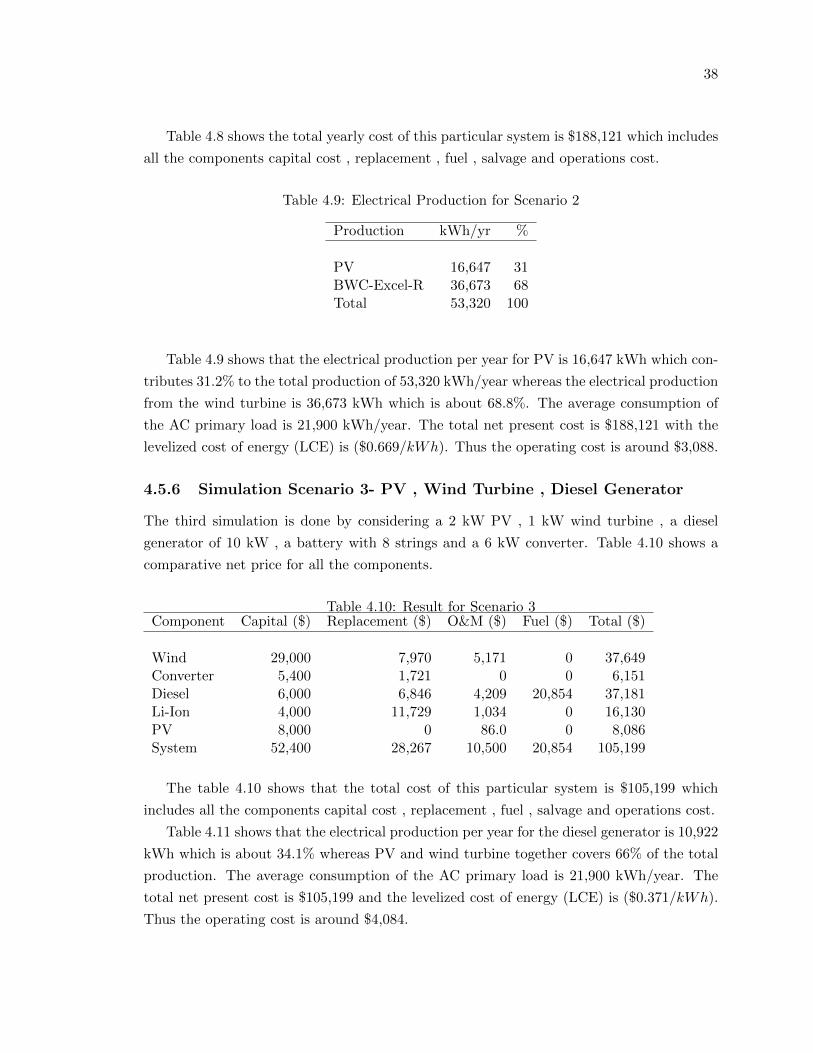
38
Table 4.8 shows the total yearly cost of this particular system is $188,121 which includes
all the components capital cost , replacement , fuel , salvage and operations cost.
Table 4.9: Electrical Production for Scenario 2
Production kWh/yr %
PV 16,647 31BWC-Excel-R 36,673 68Total 53,320 100
Table 4.9 shows that the electrical production per year for PV is 16,647 kWh which con-
tributes 31.2% to the total production of 53,320 kWh/year whereas the electrical production
from the wind turbine is 36,673 kWh which is about 68.8%. The average consumption of
the AC primary load is 21,900 kWh/year. The total net present cost is $188,121 with the
levelized cost of energy (LCE) is ($0.669/kWh). Thus the operating cost is around $3,088.
4.5.6 Simulation Scenario 3- PV , Wind Turbine , Diesel Generator
The third simulation is done by considering a 2 kW PV , 1 kW wind turbine , a diesel
generator of 10 kW , a battery with 8 strings and a 6 kW converter. Table 4.10 shows a
comparative net price for all the components.
Table 4.10: Result for Scenario 3Component Capital ($) Replacement ($) O&M ($) Fuel ($) Total ($)
Wind 29,000 7,970 5,171 0 37,649Converter 5,400 1,721 0 0 6,151Diesel 6,000 6,846 4,209 20,854 37,181Li-Ion 4,000 11,729 1,034 0 16,130PV 8,000 0 86.0 0 8,086System 52,400 28,267 10,500 20,854 105,199
The table 4.10 shows that the total cost of this particular system is $105,199 which
includes all the components capital cost , replacement , fuel , salvage and operations cost.
Table 4.11 shows that the electrical production per year for the diesel generator is 10,922
kWh which is about 34.1% whereas PV and wind turbine together covers 66% of the total
production. The average consumption of the AC primary load is 21,900 kWh/year. The
total net present cost is $105,199 and the levelized cost of energy (LCE) is ($0.371/kWh).
Thus the operating cost is around $4,084.
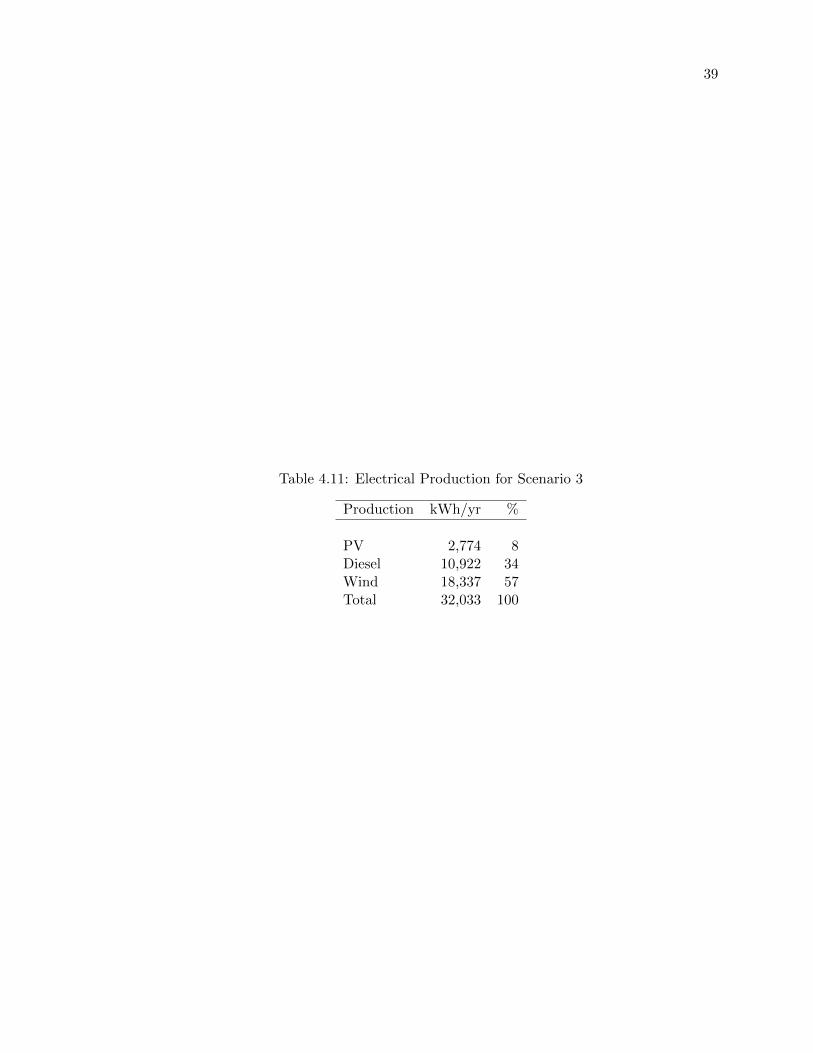
39
Table 4.11: Electrical Production for Scenario 3
Production kWh/yr %
PV 2,774 8Diesel 10,922 34Wind 18,337 57Total 32,033 100
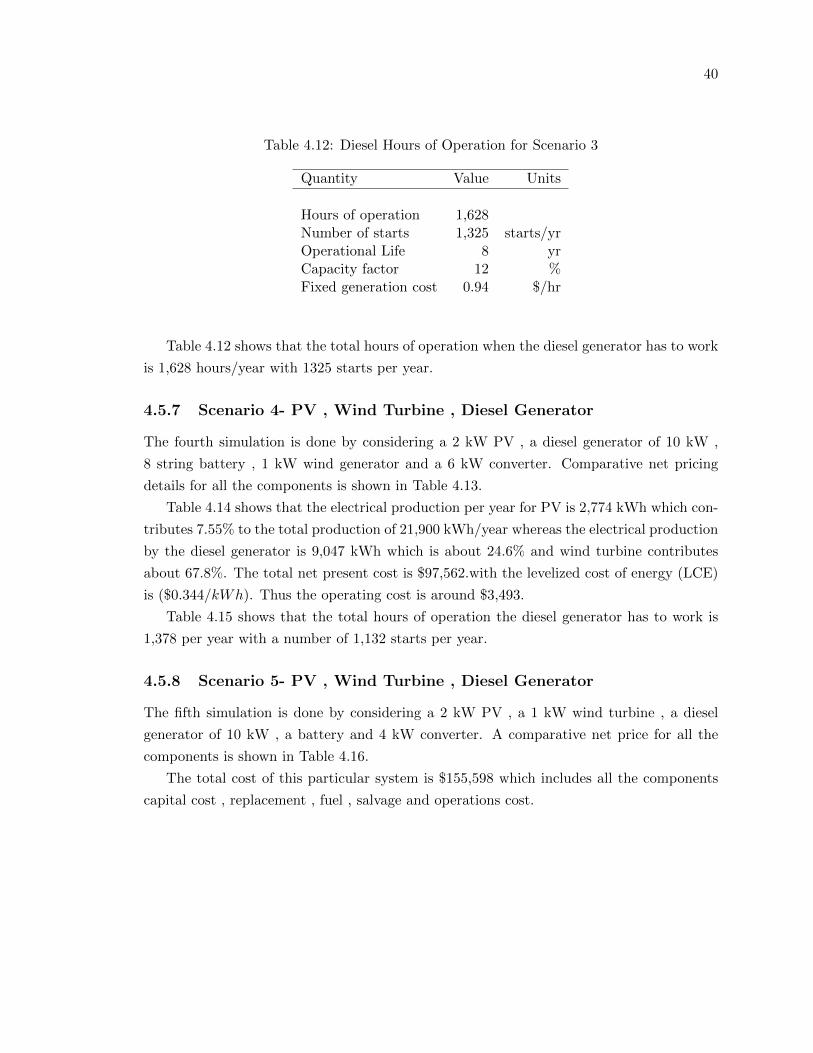
40
Table 4.12: Diesel Hours of Operation for Scenario 3
Quantity Value Units
Hours of operation 1,628Number of starts 1,325 starts/yrOperational Life 8 yrCapacity factor 12 %Fixed generation cost 0.94 $/hr
Table 4.12 shows that the total hours of operation when the diesel generator has to work
is 1,628 hours/year with 1325 starts per year.
4.5.7 Scenario 4- PV , Wind Turbine , Diesel Generator
The fourth simulation is done by considering a 2 kW PV , a diesel generator of 10 kW ,
8 string battery , 1 kW wind generator and a 6 kW converter. Comparative net pricing
details for all the components is shown in Table 4.13.
Table 4.14 shows that the electrical production per year for PV is 2,774 kWh which con-
tributes 7.55% to the total production of 21,900 kWh/year whereas the electrical production
by the diesel generator is 9,047 kWh which is about 24.6% and wind turbine contributes
about 67.8%. The total net present cost is $97,562.with the levelized cost of energy (LCE)
is ($0.344/kWh). Thus the operating cost is around $3,493.
Table 4.15 shows that the total hours of operation the diesel generator has to work is
1,378 per year with a number of 1,132 starts per year.
4.5.8 Scenario 5- PV , Wind Turbine , Diesel Generator
The fifth simulation is done by considering a 2 kW PV , a 1 kW wind turbine , a diesel
generator of 10 kW , a battery and 4 kW converter. A comparative net price for all the
components is shown in Table 4.16.
The total cost of this particular system is $155,598 which includes all the components
capital cost , replacement , fuel , salvage and operations cost.
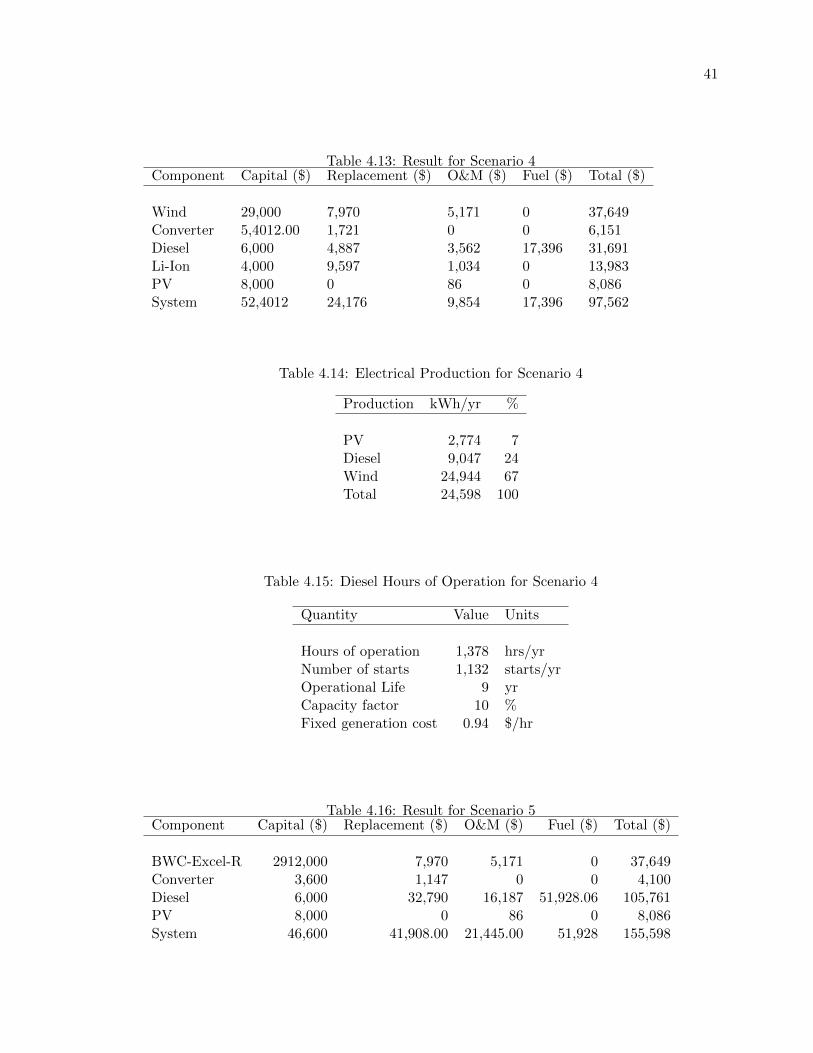
41
Table 4.13: Result for Scenario 4Component Capital ($) Replacement ($) O&M ($) Fuel ($) Total ($)
Wind 29,000 7,970 5,171 0 37,649Converter 5,4012.00 1,721 0 0 6,151Diesel 6,000 4,887 3,562 17,396 31,691Li-Ion 4,000 9,597 1,034 0 13,983PV 8,000 0 86 0 8,086System 52,4012 24,176 9,854 17,396 97,562
Table 4.14: Electrical Production for Scenario 4
Production kWh/yr %
PV 2,774 7Diesel 9,047 24Wind 24,944 67Total 24,598 100
Table 4.15: Diesel Hours of Operation for Scenario 4
Quantity Value Units
Hours of operation 1,378 hrs/yrNumber of starts 1,132 starts/yrOperational Life 9 yrCapacity factor 10 %Fixed generation cost 0.94 $/hr
Table 4.16: Result for Scenario 5Component Capital ($) Replacement ($) O&M ($) Fuel ($) Total ($)
BWC-Excel-R 2912,000 7,970 5,171 0 37,649Converter 3,600 1,147 0 0 4,100Diesel 6,000 32,790 16,187 51,928.06 105,761PV 8,000 0 86 0 8,086System 46,600 41,908.00 21,445.00 51,928 155,598
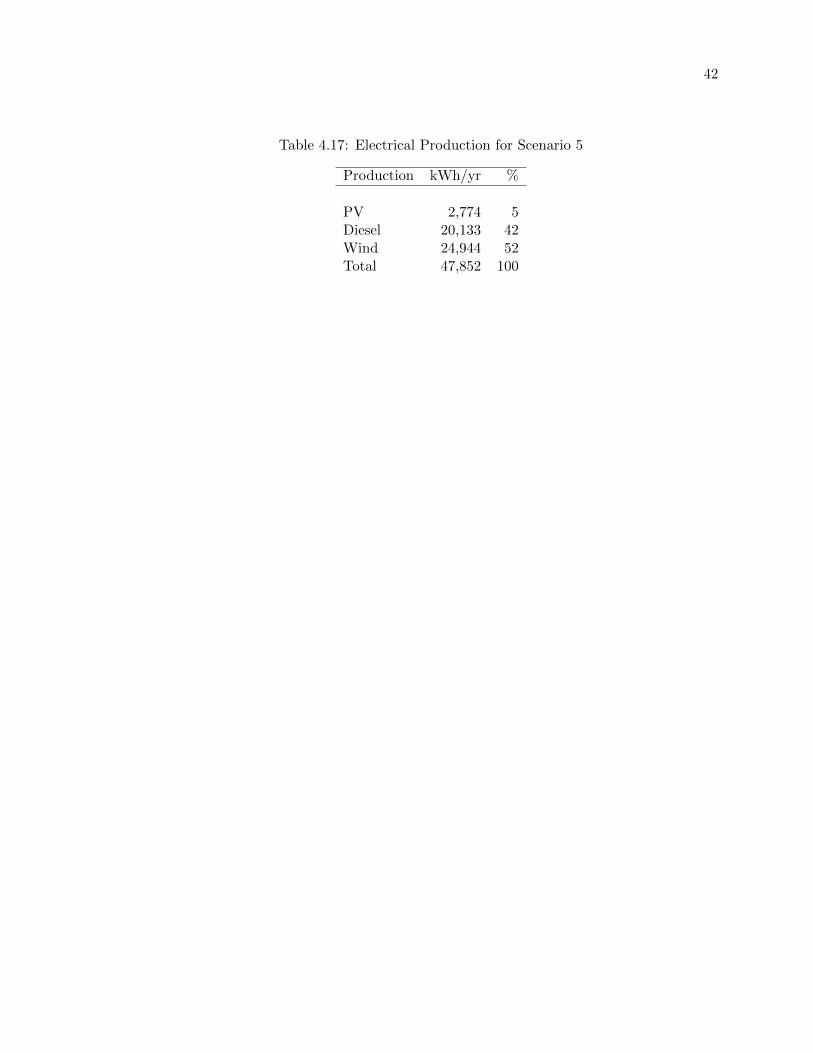
42
Table 4.17: Electrical Production for Scenario 5
Production kWh/yr %
PV 2,774 5Diesel 20,133 42Wind 24,944 52Total 47,852 100
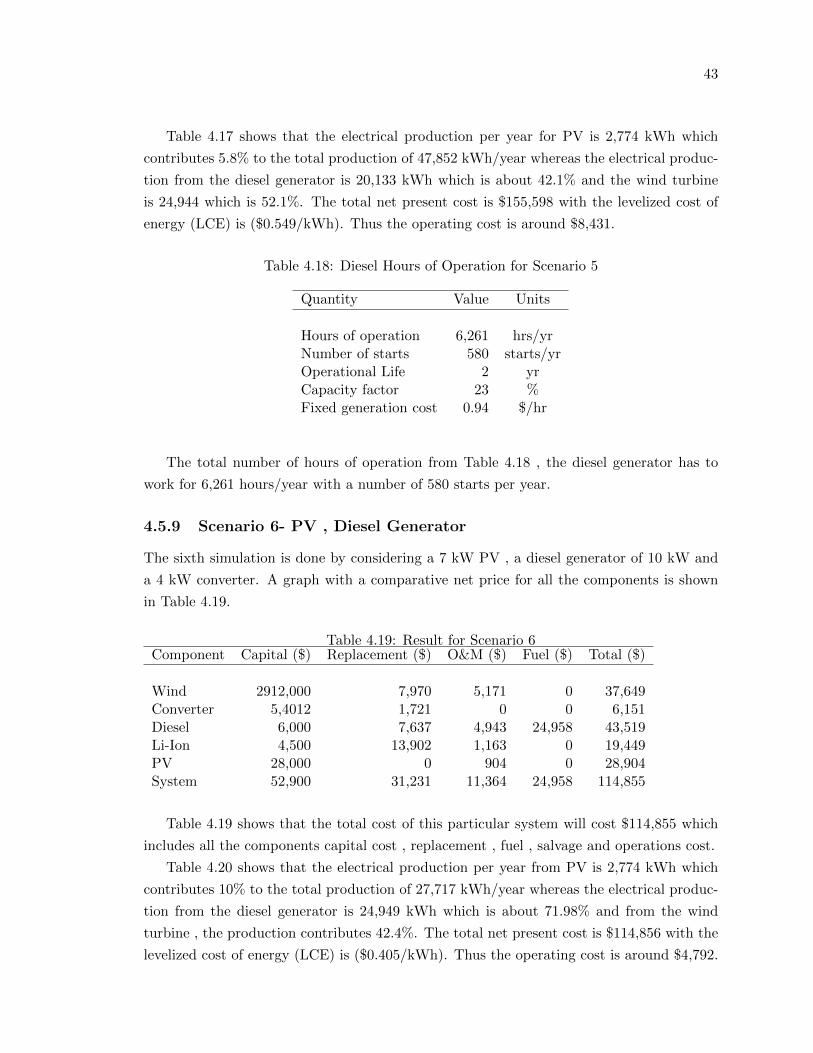
43
Table 4.17 shows that the electrical production per year for PV is 2,774 kWh which
contributes 5.8% to the total production of 47,852 kWh/year whereas the electrical produc-
tion from the diesel generator is 20,133 kWh which is about 42.1% and the wind turbine
is 24,944 which is 52.1%. The total net present cost is $155,598 with the levelized cost of
energy (LCE) is ($0.549/kWh). Thus the operating cost is around $8,431.
Table 4.18: Diesel Hours of Operation for Scenario 5
Quantity Value Units
Hours of operation 6,261 hrs/yrNumber of starts 580 starts/yrOperational Life 2 yrCapacity factor 23 %Fixed generation cost 0.94 $/hr
The total number of hours of operation from Table 4.18 , the diesel generator has to
work for 6,261 hours/year with a number of 580 starts per year.
4.5.9 Scenario 6- PV , Diesel Generator
The sixth simulation is done by considering a 7 kW PV , a diesel generator of 10 kW and
a 4 kW converter. A graph with a comparative net price for all the components is shown
in Table 4.19.
Table 4.19: Result for Scenario 6Component Capital ($) Replacement ($) O&M ($) Fuel ($) Total ($)
Wind 2912,000 7,970 5,171 0 37,649Converter 5,4012 1,721 0 0 6,151Diesel 6,000 7,637 4,943 24,958 43,519Li-Ion 4,500 13,902 1,163 0 19,449PV 28,000 0 904 0 28,904System 52,900 31,231 11,364 24,958 114,855
Table 4.19 shows that the total cost of this particular system will cost $114,855 which
includes all the components capital cost , replacement , fuel , salvage and operations cost.
Table 4.20 shows that the electrical production per year from PV is 2,774 kWh which
contributes 10% to the total production of 27,717 kWh/year whereas the electrical produc-
tion from the diesel generator is 24,949 kWh which is about 71.98% and from the wind
turbine , the production contributes 42.4%. The total net present cost is $114,856 with the
levelized cost of energy (LCE) is ($0.405/kWh). Thus the operating cost is around $4,792.
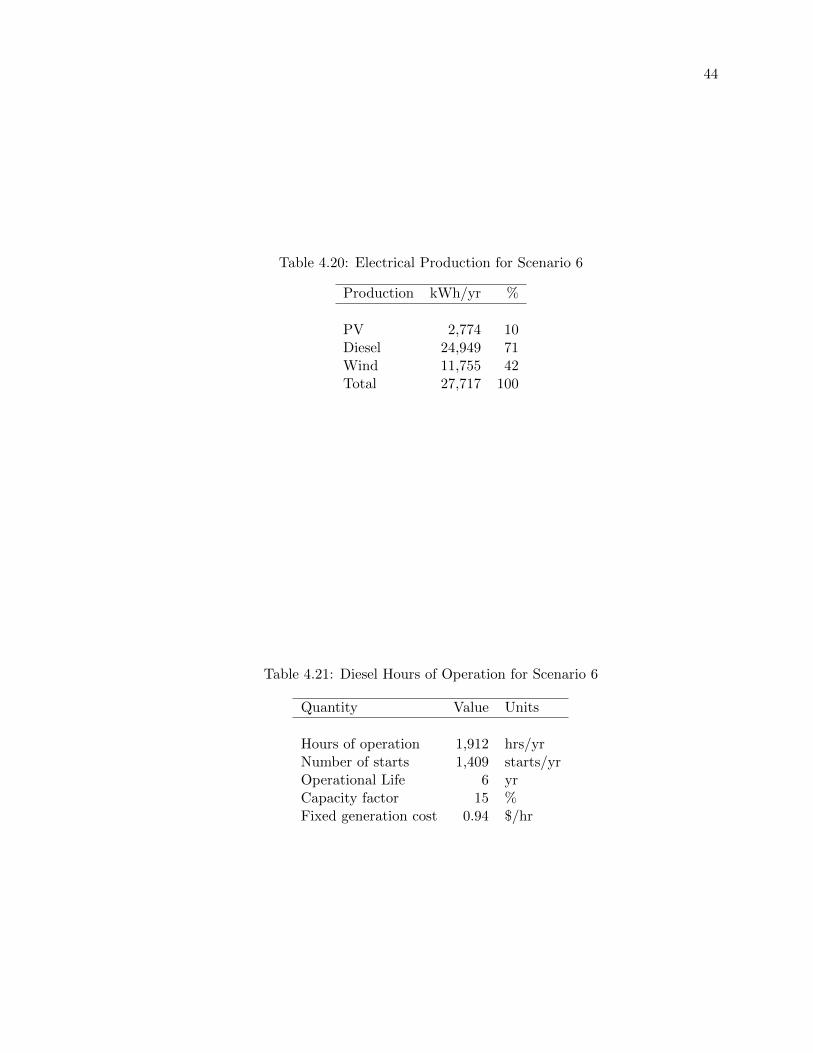
44
Table 4.20: Electrical Production for Scenario 6
Production kWh/yr %
PV 2,774 10Diesel 24,949 71Wind 11,755 42Total 27,717 100
Table 4.21: Diesel Hours of Operation for Scenario 6
Quantity Value Units
Hours of operation 1,912 hrs/yrNumber of starts 1,409 starts/yrOperational Life 6 yrCapacity factor 15 %Fixed generation cost 0.94 $/hr
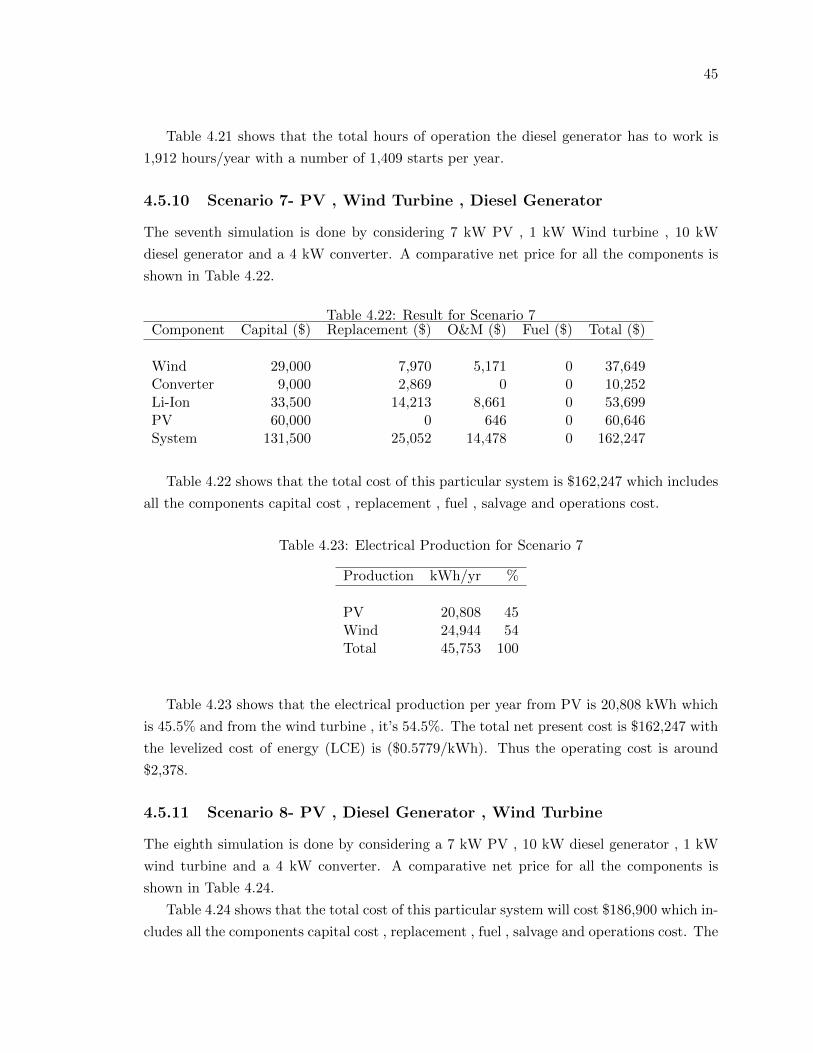
45
Table 4.21 shows that the total hours of operation the diesel generator has to work is
1,912 hours/year with a number of 1,409 starts per year.
4.5.10 Scenario 7- PV , Wind Turbine , Diesel Generator
The seventh simulation is done by considering 7 kW PV , 1 kW Wind turbine , 10 kW
diesel generator and a 4 kW converter. A comparative net price for all the components is
shown in Table 4.22.
Table 4.22: Result for Scenario 7Component Capital ($) Replacement ($) O&M ($) Fuel ($) Total ($)
Wind 29,000 7,970 5,171 0 37,649Converter 9,000 2,869 0 0 10,252Li-Ion 33,500 14,213 8,661 0 53,699PV 60,000 0 646 0 60,646System 131,500 25,052 14,478 0 162,247
Table 4.22 shows that the total cost of this particular system is $162,247 which includes
all the components capital cost , replacement , fuel , salvage and operations cost.
Table 4.23: Electrical Production for Scenario 7
Production kWh/yr %
PV 20,808 45Wind 24,944 54Total 45,753 100
Table 4.23 shows that the electrical production per year from PV is 20,808 kWh which
is 45.5% and from the wind turbine , it’s 54.5%. The total net present cost is $162,247 with
the levelized cost of energy (LCE) is ($0.5779/kWh). Thus the operating cost is around
$2,378.
4.5.11 Scenario 8- PV , Diesel Generator , Wind Turbine
The eighth simulation is done by considering a 7 kW PV , 10 kW diesel generator , 1 kW
wind turbine and a 4 kW converter. A comparative net price for all the components is
shown in Table 4.24.
Table 4.24 shows that the total cost of this particular system will cost $186,900 which in-
cludes all the components capital cost , replacement , fuel , salvage and operations cost. The
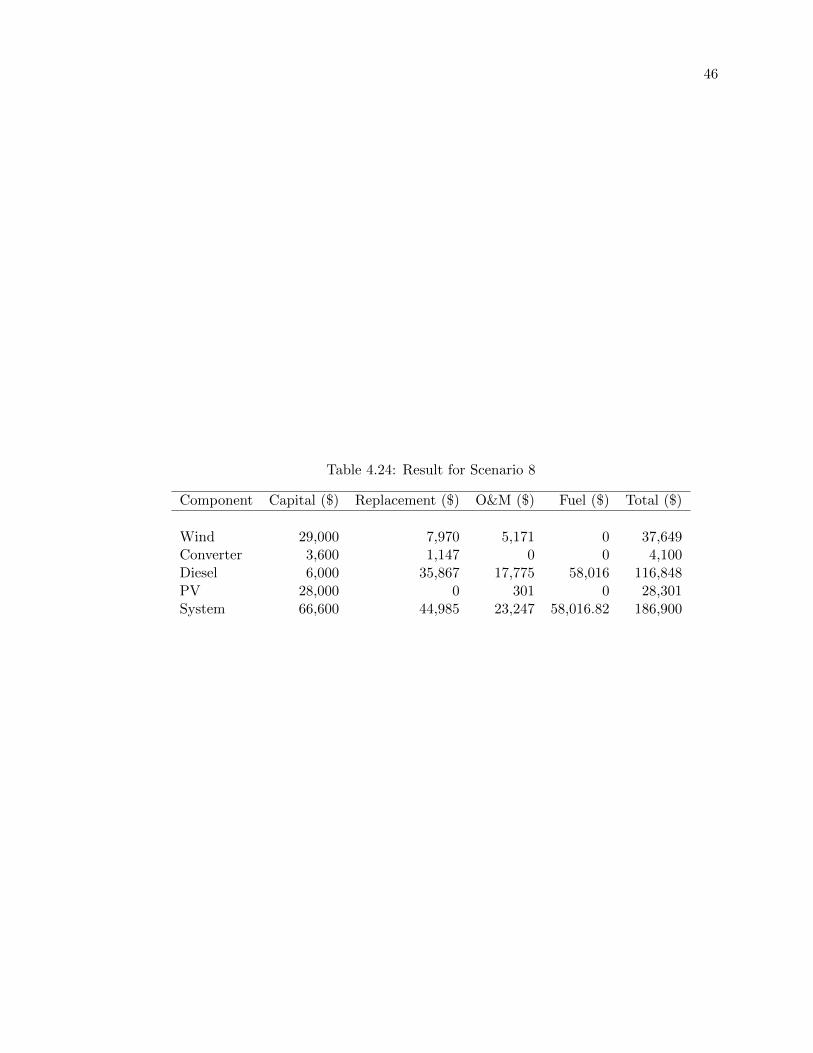
46
Table 4.24: Result for Scenario 8
Component Capital ($) Replacement ($) O&M ($) Fuel ($) Total ($)
Wind 29,000 7,970 5,171 0 37,649Converter 3,600 1,147 0 0 4,100Diesel 6,000 35,867 17,775 58,016 116,848PV 28,000 0 301 0 28,301System 66,600 44,985 23,247 58,016.82 186,900
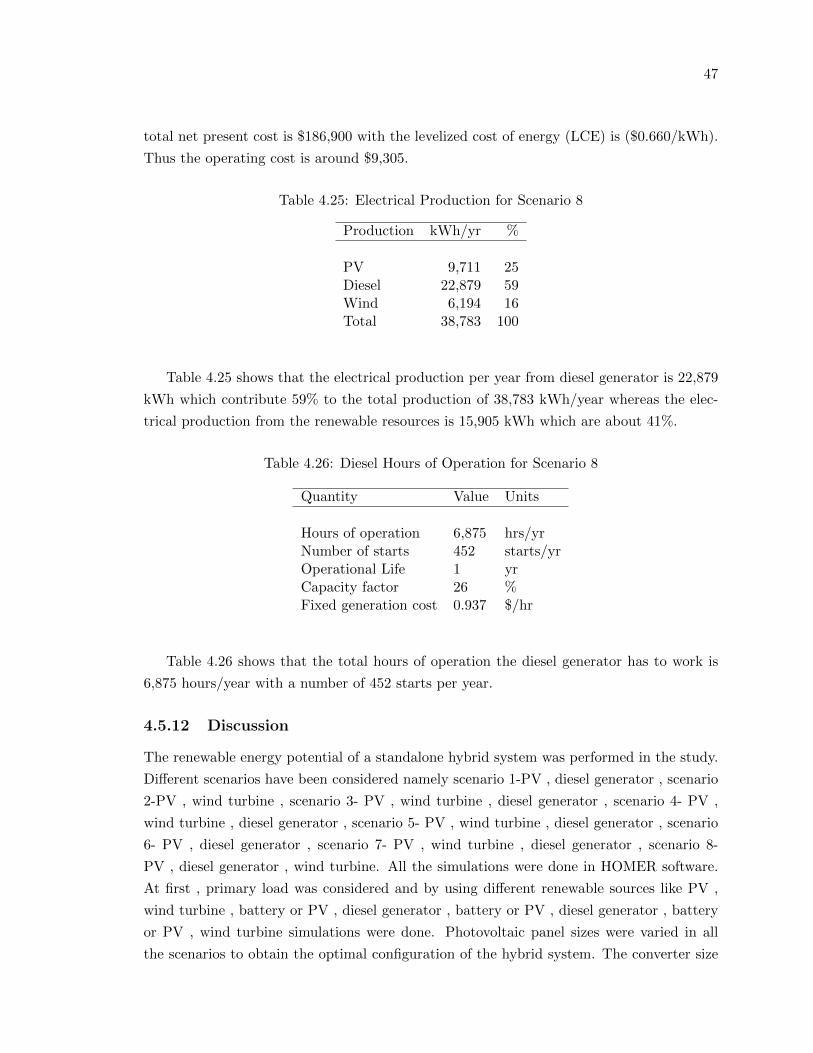
47
total net present cost is $186,900 with the levelized cost of energy (LCE) is ($0.660/kWh).
Thus the operating cost is around $9,305.
Table 4.25: Electrical Production for Scenario 8
Production kWh/yr %
PV 9,711 25Diesel 22,879 59Wind 6,194 16Total 38,783 100
Table 4.25 shows that the electrical production per year from diesel generator is 22,879
kWh which contribute 59% to the total production of 38,783 kWh/year whereas the elec-
trical production from the renewable resources is 15,905 kWh which are about 41%.
Table 4.26: Diesel Hours of Operation for Scenario 8
Quantity Value Units
Hours of operation 6,875 hrs/yrNumber of starts 452 starts/yrOperational Life 1 yrCapacity factor 26 %Fixed generation cost 0.937 $/hr
Table 4.26 shows that the total hours of operation the diesel generator has to work is
6,875 hours/year with a number of 452 starts per year.
4.5.12 Discussion
The renewable energy potential of a standalone hybrid system was performed in the study.
Different scenarios have been considered namely scenario 1-PV , diesel generator , scenario
2-PV , wind turbine , scenario 3- PV , wind turbine , diesel generator , scenario 4- PV ,
wind turbine , diesel generator , scenario 5- PV , wind turbine , diesel generator , scenario
6- PV , diesel generator , scenario 7- PV , wind turbine , diesel generator , scenario 8-
PV , diesel generator , wind turbine. All the simulations were done in HOMER software.
At first , primary load was considered and by using different renewable sources like PV ,
wind turbine , battery or PV , diesel generator , battery or PV , diesel generator , battery
or PV , wind turbine simulations were done. Photovoltaic panel sizes were varied in all
the scenarios to obtain the optimal configuration of the hybrid system. The converter size
48
was also changed according to respective PV sizes. The simulation results in scenario 7
shows that after increasing the size of PV panel and keeping rest of the input quantities
unchanged , the diesel generator wasn’t even required to fulfil the load demands. PV and
wind turbine together were able to supply the load. Also by keeping the value of PV to
its smallest size and just by changing the size of the converter , diesel usage was reduced
as shown in scenario 3. In this thesis , simulations with different scenarios were done in
order to obtain the optimal configuration with the least annual cost. It is concluded that
the least annual cost was obtained in scenario 5 , which was $15,598 with optimized sized
components of 2 kW PV , 1 kW wind turbine , 10 kW diesel generator and 4 kW converter
size. The electrical production from renewable resources is approximately 58%. It means
that scenario 5 results in the optimized design to fulfil the load demands.
49
Chapter 5
Conclusion
HOMER software was used to design a hybrid system consisting of PV , wind turbine re-
newable energy sources and a lithium-ion battery for storage with a backup diesel generator.
Simulations with different combination of resources were implemented to find the most op-
timal configuration of the hybrid model. The simulation results show that after increasing
the size of PV panel and keeping rest of the input quantities unchanged , diesel generator
wasn’t even required to fulfil the load demands. PV and wind together were able to supply
the load. The renewable energy potential of a standalone hybrid system was performed in
the study. Different scenarios have been considered namely scenario 1-PV , diesel generator
, scenario 2-PV , wind turbine , scenario 3- PV , wind turbine , diesel generator, scenario
4- PV , wind turbine , diesel generator , scenario 5- PV , wind turbine , diesel generator ,
scenario 6- PV , diesel generator , scenario 7- PV , wind turbine , diesel generator , scenario
8- PV , diesel generator , wind turbine. In this thesis , simulations with different scenarios
were done in order to obtain the optimal configuration with the least annual cost. It is
concluded that the least annual cost was obtained in scenario 5 , which was $15,598 with
optimized sized components of 2 kW PV , 1 kW wind turbine , 10 kW diesel generator and
4 kW converter size. The electrical production from renewable resources is approximately
58%. It means that scenario 5 results in the optimized design to fulfil the load demands.
5.1 Contribution
This thesis contributes to the area of power systems. Portugal and Canada are part of the
International Energy Agency (IEA) photovoltaic power systems programme. Specifically in
this work , Portugal is selected as the research area as oppose to Canada because of lack of
data during winter seasons. The primary contributions from this thesis are the following:
1. The selected area has abundant renewable resources like PV , wind and hydro energy.
Therefore to increase the energy utilization , hybrid system is designed accordingly ,
50
2. The life cycle cost of the system is minimized ,
3. The combination of renewable input resources worked in order to decrease the elec-
trical production from diesel generator.
Key factor is to reduce the life cycle cost of the system for optimized results. We choose
solar and wind as input to HOMER software and diesel generator as a back up. Simulations
were done by keeping all the same parameters and changing the size of the photovoltaic
array for comparative results. From the simulated results , we can conclude that by using a
smaller size of photovoltaic array and wind turbine with a moderate size diesel generator ,
the life cycle cost can be decreased and more electrical production than the diesel generator.
This system constitutes the optimized size of the hybrid system for obtaining the minimized
life cycle cost.
51
Bibliography
[1] P. Lilienthal, “Homer Pro.” https://www.homerenergy.com/homer-pro.html, Au-
gust 2016. Microgrid Software for Designing Optimized Hybrid model.
[2] F.Gebali, “Private correspondence,” 2017.
[3] K. K.Kumar, R.Bhaskar, and H.Koti, “Implementation of MPPT Algorithm for Solar
Photovoltaic Cell by Comparing Short-circuit Method and Incremental Conductance
Method,” Procedia Technology, vol. 12, pp. 705–715, January 2014.
[4] V. Phan, “Wind Energy Conversion Systems.” https://tungvp.wordpress.com/
2010/04/19/wind-energy-conversion-systems/, April 2010.
[5] Y. Hirata, D. P. Mandic, H. Suzuki, and K. Aihara, “Wind Direction Modelling using
Multiple Observation Points,” The Royal Society, vol. 366, pp. 591–607, February 2008.
[6] Caterpillar, “Diesel Generator Sets.” https://www.cat.com/en_US/products/
new/power-systems/electric-power-generation/diesel-generator-sets.html,
2017.
[7] G. Liu, M. Rasul, M. Amanullah, and M. Khan, “Techno-Economic Simulation and
Optimization of Residential Grid-Connected PV System for the Queensland Climate,”
Renewable Energy, vol. 45, pp. 146–155, 2012.
[8] Z. A. Elhassan, M. F. Zain, K. Sopian, and A. Abass, “Design and Performance of Pho-
tovoltaic Power System as a Renewable Energy Source for Residential in Khartoum,”
International Journal of the Physical Sciences, vol. 7, pp. 4036–4042, 2012.
[9] G. Bekele and B. Palm, “Feasibility Study for a Standalone Solar-Wind-based Hybrid
Energy System for Application in Ethiopia,” Applied Energy, vol. 87, pp. 487–495,
2010.
[10] N. A. Razak, M. M. bin Othman, and I. Musirin, “Optimal Sizing and Operational
Strategy of Hybrid Renewable Energy System Using HOMER,” in International Power
Engineering and Optimization Conf. (PEOCO2010), vol. 4, pp. 23–24, June 2010.
52
[11] D. A. Karim and I. Mahmoud, “Design of Isolated Hybrid Systems Minimizing Costs
and Pollutant Emissions,” Renewable Energy, vol. 44, pp. 215–224, 2012.
[12] K. Kusakana, J. Munda, and A. Jimoh, “Feasibility Study of a Hybrid PV-Micro
Hybrid system for Rural Electrification,” in IEEE AFRICON, pp. 1–5, September
2009.
[13] P. Lim, C. Nayar, and S. Rajakaruna, “Simulation and Components Sizing of a Stand-
alone Hybrid Power System with Variable Speed Generator,” in 9th International Con-
ference on Environment and Electrical Engineering (EEEIC), pp. 465–468, May 2010.
[14] A. Demiroren and U. Yilmaz, “Analysis of change in Electric Energy Cost with using
Renewable Energy Sources in Gokceada, Turkey: An island example,” Renewable and
Sustainable Energy, vol. 14, pp. 323–333, 2010.
[15] M. Iqbal, “A feasibility Study of a Zero Energy Home in Newfoundland,” Renewable
Energy, vol. 29, pp. 277–289, 2004.
[16] G. Dalton, D. Lockington, and T. Baldock, “Feasibility Analysis of Stand-alone Renew-
able Energy Supply Options for a Large Hotel,” Renewable Energy, vol. 33, pp. 1475–
1490, 2008.
[17] P. Lilienthal, “The HOMER Micropower Optimization Model.” https://www.nrel.
gov/docs/fy04osti/35406.pdf, October 2004.
[18] N. Baharudin, T. Mansur, R. Ali, Y. Yatim, and A. Wahab, “Optimization Design
and Economic Analysis of Solar Power System with Sea Water Desalination for Re-
mote Areas,” in ICIEA 2007: Second IEEE Conference on Industrial Electronics and
Applications, pp. 1594–1599, June 2007.
[19] N. Johnson, P. Lilienthal, and T. Schoechle, “Modelling Distributed Premises-based
Renewables Integration using HOMER,” Research Gate, pp. 5–8, December 2011.
[20] P. Lim and C. Nayar, “Solar Irradiance and Load Demand Forecasts in the Supervi-
sory Control for Off-grid Hybrid Energy System,” IACSIT International Journal of
Engineering and Technology, vol. 4, no. 4, pp. 451–455, August 2012.
[21] G. Bekele and G. Tadesse, “Feasibility Study of Small Hydro PV Wind Hybrid System
for Off-grid Rural Electrification in Ethiopia,” Applied Energy, vol. 97, pp. 5–15, 2012.
[22] S. Rehman, I. Amin, F. Ahmad, S. Shaahid, and A. M. Shehri, “Feasibility study of
hybrid retrofits to an isolated off-grid diesel power plant,” Renewable and Sustainable
Energy Reviews, vol. 11, no. 4, pp. 635–653, 2007.
53
[23] S. K. Khadem, “Feasibility study of Wind Home System in Coastal Region of
Bangladesh,” Journal of Science, vol. 55, no. 2, pp. 263–268, 2007.
[24] B. Alexandre, de Souza Paulo Hroeff, and K. Arno, “A method to evaluate the effect of
complementarity in time between hydro and solar energy on the performance of hybrid
hydro PV generating plants,” Renewable Energy Science Direct, vol. 45, pp. 24–30,
2012.
[25] M. Alam and D. Gao, “Modeling and Analysis of a Wind PV Fuel Cell Hybrid Power
System in HOMER,” tech. rep.
[26] B. E. Turkay and A. Y. Telli, “Economic Analysis of Stand-alone and Grid Connected
Hybrid Energy Systems,” Renewable Energy Science Direct, vol. 36, pp. 1931–1943,
2011.
[27] P. Bajpai, N. Prakshan, and N. Kishore, “Renewable Hybrid Stand-alone Telecom
Power System Modelling and Analysis,” in TENCON 2009-2009 IEEE Region 10 Con-
ference, pp. 1–6, January 2009.
[28] A. Rajoriya and E. Fernandez, “Sustainable Energy Generation using Hybrid Energy
System for Remote Hilly Rural Area in India,” International Journal of Sustainable
Engineering, vol. 3, pp. 219–227, September 2010.
[29] M. E. Badawe, T. Iqbal, and G. K. Mann, “Optimization and a Comparison Between
Renewable Energy Systems for a Telecommunication Site,” in 2012 25th IEEE Cana-
dian Conference on Electrical and Computer Engineering (CCECE), pp. 1–5, April
2012.
[30] N. Barsoum, W. Y. Yiin, T. K. Ling, and W. Goh, “Modelling and Cost Simulation of
Stand-Alone Solar and Biomass Energy,” in Second Asia International Conference on
Modelling and Simulation, pp. 1–6, 2008.
[31] I. Mitra and S. G. Chaudhuri, “Remote Village Electrification Plan through Renew-
able Energy in the Islands of Indian Sundarbans.” https://www.homerenergy.com/
webcast-downloads/ises-remic2-v2.pdf, 2016.
[32] T. Lambert, P. Gilman, and P. Lilienthal, “Micro-power System
Modelling with HOMER.” https://www.homerenergy.com/documents/
MicropowerSystemModelingWithHOMER.pdf, 2017.
[33] O. Hafez and K. Bhattacharya, “Optimal Planning and Design of a Renewable Energy
based Supply System for Microgrids,” Renewable Energy, vol. 45, pp. 7–15, 2012.
54
[34] D. K. Lal, B. B. Dash, and A. Akella, “Optimization of PV-Wind-Hydro-Diesel Hy-
brid Power System in HOMER for study area,” International Journal on Electrical
Engineering and Informatics, vol. 6, no. 1, pp. 157–163, 2016.
[35] I. Mougharbel, Z. Shehab, and S. Georges, “Simulation of a hybrid renewable energy
system in rural regions,” IECON 2012 - 38th Annual Conference on IEEE Industrial
Electronics Society, vol. 3, no. 13, pp. 1150–1155, 2013.
[36] J. Weniger, T. Tjaden, and V. Quaschning, “Sizing of Residential PV Battery Sys-
tems,” Energy Procedia, vol. 46, pp. 78–87, December 2014.
[37] Z. Chen, H. Li, and S. Gao, “The research about PV/wind hybrid energy considering
grid security constraints - Semantic Scholar,” in ISGT, 2013.
[38] A. Gupta, R. Saini, and M. P. Sharma, “Steady State Modeling of hybrid energy
system for off-grid electrification of cluster of villages,” Renewable Energy, vol. 35,
no. 2, pp. 520–535, 2010.
[39] J. L. Bernal-Agustın, R. Dufo-Lopez, and D. M. Rivas-Ascaso., “Design of isolated
hybrid systems minimizing costs and pollutant emissions,” Renewable Energy, vol. 31,
no. 14, pp. 2227–2244, 2006.
[40] Dufo-Lopez, R. J. L. Bernal-Agustn, and J. Contreras, “Optimization of control strate-
gies for stand-alone renewable energy systems with hydrogen storage,” Renewable En-
ergy, vol. 32, no. 7, pp. 1102–1126, 2007.
[41] D.Yang, “Performance Analysis of a Grid Connected Hybrid Photovoltaic and Wind
Electricity Generation System in Cold Climate,” Master’s thesis, University of Jy-
vaskyla, 2007.
[42] A. Hoke, “Maximum Photovoltaic Penetration Levels on Typical Distribution Feeders,”
2012.
[43] H. Bounechba, A. Bouzid, K. Nabti, and H. Benalla, “Comparative study of pertur-
b/observe and fuzzy logic control based MPPT algorithm,” Energy Procedia, vol. 50,
pp. 677–684, July 2015.
[44] C. Silva, “DC-DC Interleaved Converter MPPT Algorithms.” https://paginas.fe.
up.pt/~ee07308/pages/conversor.html, April 2011.
[45] P. Tchakoua, G. Ekemb, and M. Ouhrouche, “Wind Turbine Condition Monitoring:
State-of-the-Art Review, New Trends, and Future Challenges,” Energies, vol. 7, no. 4,
pp. 2595–2630, 2014.
55
[46] S. Ramasamy, P. A., and S. U., “Review of Coupled Two and Three Phase Inter-
leaved Boost Converter (IBC) and Investigation of Four Phase IBC for Renewable
Application,” International Journal of Renewable Energy Research (IJRER), vol. 6,
pp. 421–434, 2016.
[47] S. Sinha and S. Chandel, “Review of recent trends in optimization techniques for solar
photovoltaic wind based hybrid energy systems,” Renewable and Sustainable Energy
Reviews, vol. 50, pp. 755–769, October 2015.
[48] B. Singh, “Control Strategies for DFIG Based Grid Connected Wind Energy Conver-
sion System,” International Journal of Grid Distribution Computing, vol. 7, pp. 49–60,
2014.
[49] I. R. Machado, D. de S.O.Jr, and H. M. de O. Filho, “Analysis of permanent magnet
generator for wind power battery charging,” in ICREPQ, pp. 403–406, 2007.
[50] J. M. Gonalez and O. Barambones, “Object oriented simulation of Hybrid Renewable
Energy systems focused on Supervisor Control,” in 2009 IEEE Conference on Emerging
Technologies Factory Automation, pp. 1–8, September 2009.
[51] B., C. Pink, R. DeBlasio, H. Thomas, M. Simoes, and P. K. Sen, “Benefits of power
electronic interfaces for distributed energy systems,” IEEE Transactions on Energy
Conversion, vol. 25, pp. 901–908, September 2010.
[52] R. D. Prasad, “A Case Study for Energy Output using a Single Wind Turbine and a
Hybrid System for Vadravadra Site in Fiji Islands,” The Online Journal on Power and
Energy Engineering (OJPEE), vol. 24, no. 3, pp. 750–757, 2009.
[53] M. Haque, M. Negnevitsky, and K. Muttaqi, “A Novel Control Strategy for a Variable
Speed Wind Turbine with a Permanent Magnet Synchronous Generator,” in IEEE
Industry Applications Society Annual Meeting, pp. 1–8, October 2008.
[54] D. L. R, Design and control of hybrid systems using evolutionary algorithms. PhD
thesis, University of Saragossa, 2007.
[55] W. Li, G. Joos, and J. Belanger, “Real-Time Simulation of a Wind Turbine Generator
Coupled With a Battery Super capacitor Energy Storage System,” IEEE Transactions
on Industrial Electronics, vol. 57, pp. 1137–1145, April 2010.
[56] V. Ani, Energy Optimization at GSM Base Station. PhD thesis, University of Nigeria,
2015.
56
[57] A. A.K., S. M.P., and S. R.P., “Optimum utilization of renewable energy sources in a
remote area,” Renewable and Sustainable Energy Reviews, vol. 11, no. 1, pp. 894–908,
2007.
[58] J. A. Razak, K. Sopian, Y. Ali, M. A. Alghoul, A. Zaharim, and I. Ahmad, “Opti-
mization of PV-Wind-Hydro-Diesel Hybrid System by Minimizing Excess Capacity,”
European Journal of Scientific Research, vol. 25, no. 4, pp. 663–671, 2009.
[59] A. Elserougi and A. Massoud, “Studying the effect of over-modulation on the output
voltage of three-phase single-stage grid-connected boost inverter,” Alexandria Engi-
neering Journal, vol. 52, no. 2013, pp. 347–358, 2013.
[60] A. Neslem, “Portugal runs for four days straight on renewable en-
ergy alone.” https://www.theguardian.com/environment/2016/may/18/
portugal-runs-for-four-days-straight-on-renewable-energy-alone, May
2016.
[61] L. Almeida and A. C. Oliveira, “Study of a Hybrid PV Thermal Solar System to
Provide Electricity and Heat in Portugal,” International Journal of Ambient Energy,
vol. 29, no. 3, pp. 153–161, 2008.
[62] “Photovoltaic System Study, url=http://files.pvsyst.com/help/, year=2016,.”
[63] J. Diebel, J. Norda, and O. Kretchmer, “Average Weather in Portugal.” https://
weatherspark.com/y/32022/Average-Weather-in-Lisbon-Portugal-Year-Round,
2017.
[64] K. Bergey, “Bergey Wind Power.” http://bergey.com, 2017.
[65] A. M. Dastgheib and K. Mehranzamir, “Optimization of PV/Wind/-Diesel Hybrid
Energy System with HOMER,” 3rd International Graduate Conference on Engineering,
vol. 1, pp. 752–757, January 2010.
[66] H. Energy, HOMER Pro User Manual, August 2016.
[67] A. Rohani, K. Mazlumi, and H. Kord, “Modelling of a Hybrid Power System for Eco-
nomic Analysis and Environmental Impact in HOMER,” in I18th Iranian Conference
on Electrical Engineering, pp. 219–823, May 2010.
[68] T. Lambert, G. Paul, and P. Lilienthal, Micropower System Modeling with HOMER,
pp. 379–418. John Willey & Sons, Inc., 2006.
[69] R. Saini, M. Sharma, and A. Patil, “Integrated Renewable Energy Systems for Off Grid
Rural Electrification of Remote Area,” Renewable Energy, vol. 35, no. 6, pp. 1342–1349,
2010.

57
[70] “”PV Derating Factor”,” 2017.