Embed Size (px)
DESCRIPTION
Stanbic Bank Uganda Annual_Report 2015 - Delievered April 14, 2016
Citation preview
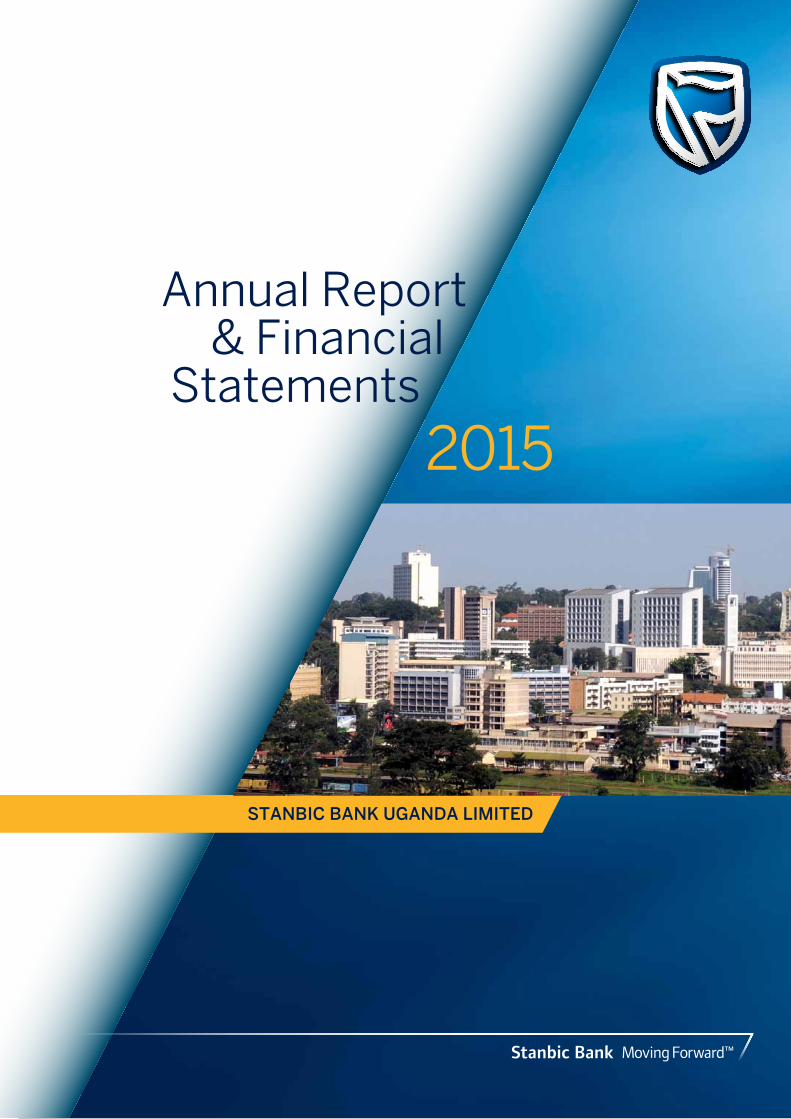
1Stanbic Bank Uganda Limited Annual Report and Financial Statements for the year ended 31 December, 2015
2015
STANBIC BANK UGANDA LIMITED
Annual Report & Financial
Statements
Stanbic Bank

2 Stanbic Bank Uganda Limited Annual Report and Financial Statements for the year ended 31 December, 2015
www.stanbicbank.co.ug
Stanbic Bank
“How do we grow in this dynamic
market?”“By choosing
a partner whoknows it.”
Corporate and Investment Banking
To realise your ambitions, you need the right partner by your side, with the end-to-end business solutions to see things through. Whatever your opportunities or challenges, we have the local insight and on-the-ground expertise to meet them with you. Isn’t that what partnership is about?
3Stanbic Bank Uganda Limited Annual Report and Financial Statements for the year ended 31 December, 2015
Sets out the full audited annual financial statements for Stanbic Uganda Ltd
Who we are 04
Our vision and values 06
How we create value 08
Our products and services 09
Our locations 10
Financial definition 11
2015 Highlights 12
Chairman’s statement 14
Chief executive’s statement 16
Operating and financial review 21
Our KPIs and strategy roadmap 23
Business unit review 26
RISK REVIEW
Risk management and control 31
SUSTAINABILITy
Citizenship & sustainability report 36
CoRpoRATE GoVERNANCE
Board of directors 50
Executive committee 51
Corporate governance statement 52
Remuneration report 56
Report of the audit committee 59
Directors’ report 61Statement of directors’ responsibilities 62Independent auditor’s report 63
FINANCIAL STATEMENTS & NoTES
Income statement 64
Statement of comprehensive income 65
Statement of financial position 66
Statement of changes in equity 67
Statement of cash flows 69
Notes to the financial statements 70
SUppLEMENTARy INFoRMATIoN
Shareholders analysis 118
Shared holder information 119
Contact details 121
U.S.E dematerialisation process 127
ABoUT STANBIC BANK UGANDA LIMITED
Contents
page 36
Presents a balanced and comprehensive analysis of the bank’s sustainability
performance in relation to issues material to the bank and stakeholders
page 11
page 64
BUSINESS REVIEWProvides a financials review of the
bank and its environment
Our success and growth over the long term is built on making a difference in the communities in which we operate. We are committed to moving Namibia forward.
Our Report
This report is the Stanbic Bank Uganda Limited (SBUL) annual report and includes financial and non-financial information.
The financial results and commentary describe the results of Stanbic Bank Uganda Limited (SBUL).SBUL is a majority owned subsidiary of Standard Bank Group and is locally incorporated in Uganda.
4 Stanbic Bank Uganda Limited Annual Report and Financial Statements for the year ended 31 December, 2015
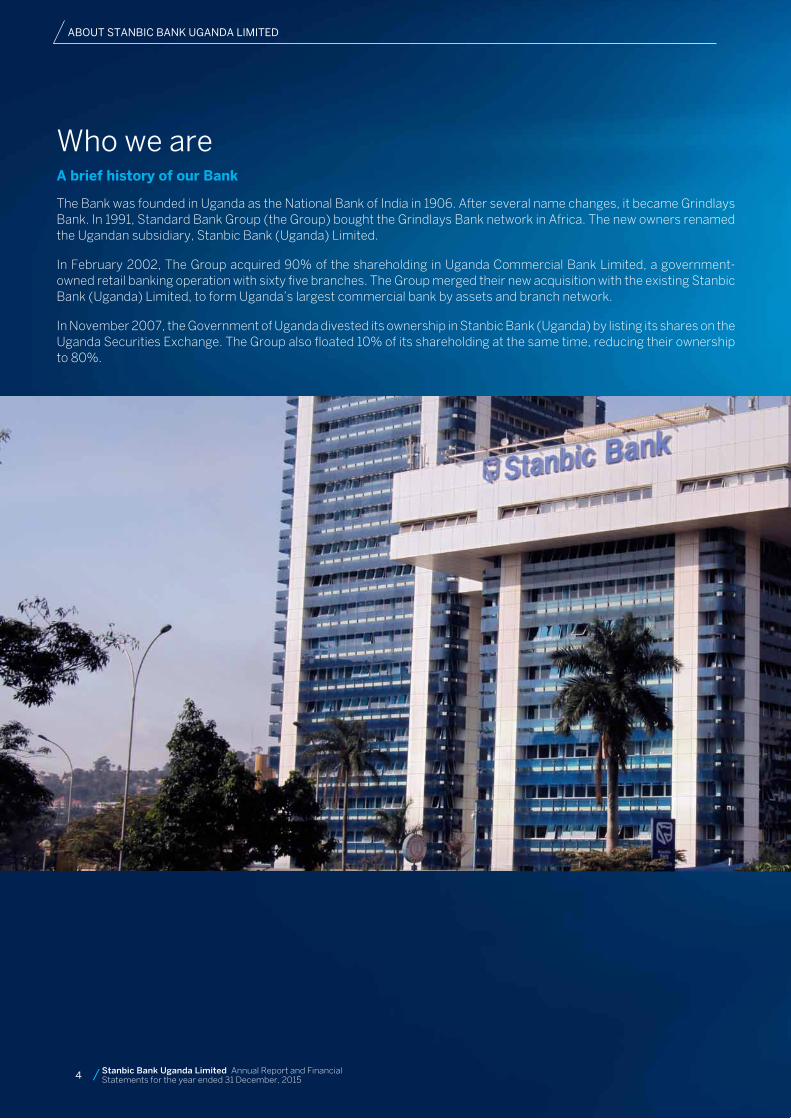
Who we areA brief history of our Bank
The Bank was founded in Uganda as the National Bank of India in 1906. After several name changes, it became Grindlays Bank. In 1991, Standard Bank Group (the Group) bought the Grindlays Bank network in Africa. The new owners renamed the Ugandan subsidiary, Stanbic Bank (Uganda) Limited.
In February 2002, The Group acquired 90% of the shareholding in Uganda Commercial Bank Limited, a government-owned retail banking operation with sixty five branches. The Group merged their new acquisition with the existing Stanbic Bank (Uganda) Limited, to form Uganda’s largest commercial bank by assets and branch network.
In November 2007, the Government of Uganda divested its ownership in Stanbic Bank (Uganda) by listing its shares on the Uganda Securities Exchange. The Group also floated 10% of its shareholding at the same time, reducing their ownership to 80%.
ABOUT STANBIC BANK UGANDA LIMITED
4 Stanbic Bank Uganda Limited Annual Report and Financial Statements for the year ended 31 December, 2015
5Stanbic Bank Uganda Limited Annual Report and Financial Statements for the year ended 31 December, 2015
NUMBER OF CUSTOMERS
SERvED By
ThROUGh OUR MAIN BUSINESS
UNITS
LISTED
MARKET CApITALISATION
ShAREhOLDERS
hEADqUARTERS
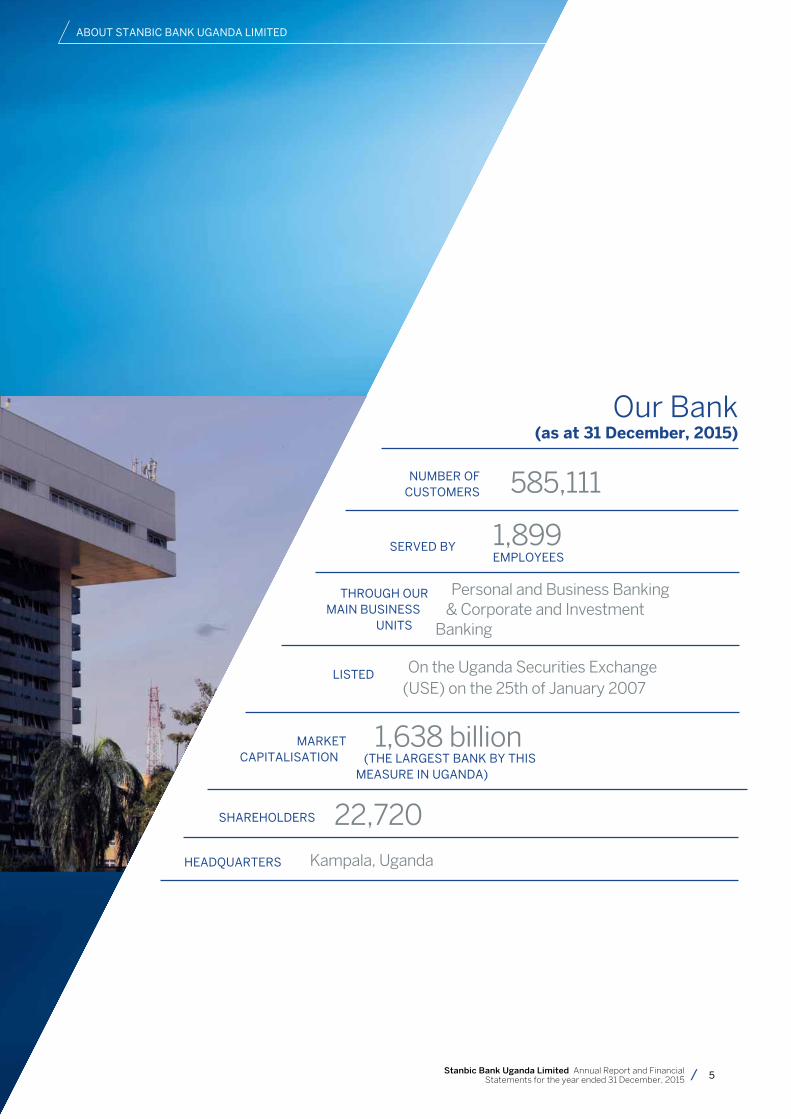
Our Bank(as at 31 December, 2015)
585,111
1,899EMpLOyEES
Personal and Business Banking & Corporate and Investment
Banking
On the Uganda Securities Exchange (USE) on the 25th of January 2007
1,638 billion(ThE LARGEST BANK By ThIS
MEASURE IN UGANDA)
22,720Kampala, Uganda
ABOUT STANBIC BANK UGANDA LIMITED
6 Stanbic Bank Uganda Limited Annual Report and Financial Statements for the year ended 31 December, 2015
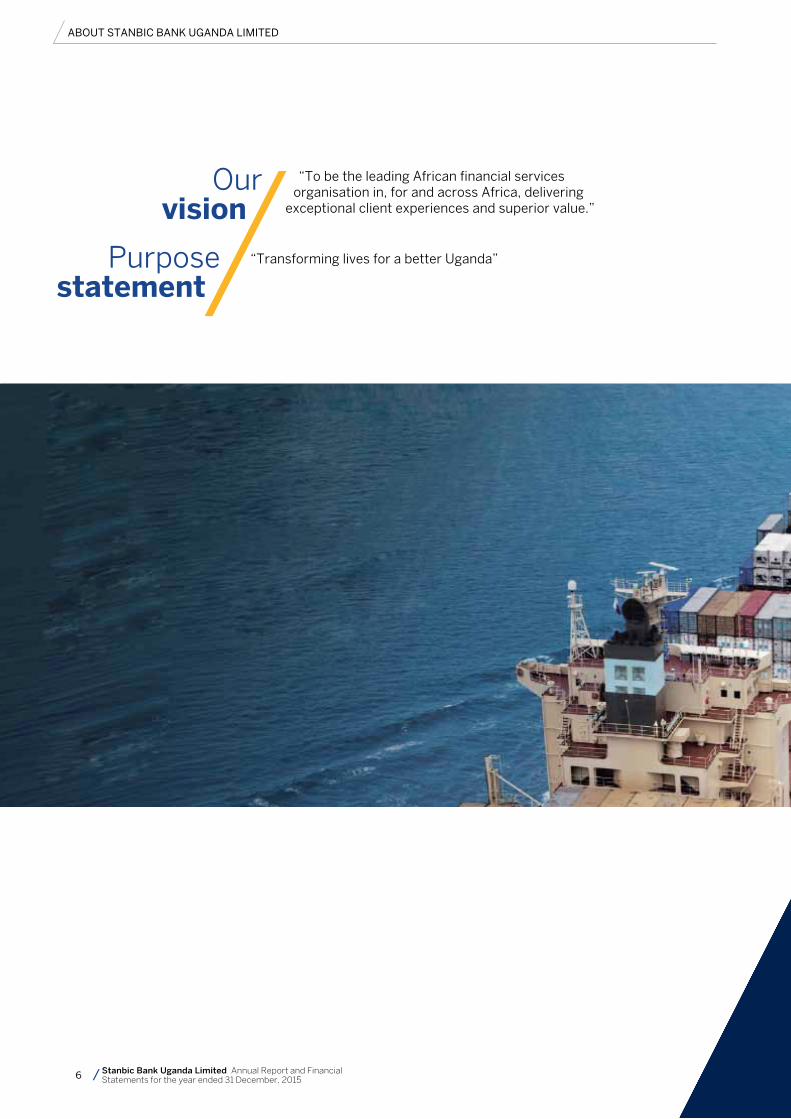
“To be the leading African financial services organisation in, for and across Africa, delivering
exceptional client experiences and superior value.”
“Transforming lives for a better Uganda”
Our vision
Purpose statement
ABOUT STANBIC BANK UGANDA LIMITED
Serving our customersWe do everything in our power to ensure that we provide our customers
with the products, services and solutions to suit their needs, provided that everything we do for them is based on sound business principles.
Growing our peopleWe encourage and help our people to develop to their full potential and
measure our leaders on how well they grow and challenge the people they lead.
Delivering to our shareholdersWe understand that we earn the right to exist by providing appropriate
long-term returns to our shareholders. We try extremely hard to meet our various targets and deliver on our commitments.
Being proactiveWe strive to stay ahead by anticipating rather than reacting, but our actions
are always carefully considered.
Working in teamsWe, and all aspects of our work, are interdependent. We appreciate that, as
teams, we can achieve much greater things than as individuals. We value teams within and across business units, divisions and countries.
Constantly raising the bar We have confidence in our ability to achieve ambitious goals and we celebrate
success, but we must never allow ourselves to become arrogant.
Respecting each otherWe have the highest regard for the dignity of all people. We respect each
other and what Stanbic Bank stands for. We recognize that there are corresponding obligations associated with our individual rights.
Upholding the highest levels of integrityOur entire business model is based on trust and integrity as perceived by our
stakeholders, especially our customers.
7Stanbic Bank Uganda Limited Annual Report and Financial Statements for the year ended 31 December, 2015
ABOUT STANBIC BANK UGANDA LIMITED
Our values
Serving our customersWe do everything in our power to ensure that we provide our customers
with the products, services and solutions to suit their needs, provided that everything we do for them is based on sound business principles.
Growing our peopleWe encourage and help our people to develop to their full potential and
measure our leaders on how well they grow and challenge the people they lead.
Delivering to our shareholdersWe understand that we earn the right to exist by providing appropriate
long-term returns to our shareholders. We try extremely hard to meet our various targets and deliver on our commitments.
Being proactiveWe strive to stay ahead by anticipating rather than reacting, but our actions
are always carefully considered.
Working in teamsWe, and all aspects of our work, are interdependent. We appreciate that, as
teams, we can achieve much greater things than as individuals. We value teams within and across business units, divisions and countries.
Constantly raising the bar We have confidence in our ability to achieve ambitious goals and we celebrate
success, but we must never allow ourselves to become arrogant.
Respecting each otherWe have the highest regard for the dignity of all people. We respect each
other and what Stanbic Bank stands for. We recognize that there are corresponding obligations associated with our individual rights.
Upholding the highest levels of integrityOur entire business model is based on trust and integrity as perceived by our
stakeholders, especially our customers.
8 Stanbic Bank Uganda Limited Annual Report and Financial Statements for the year ended 31 December, 2015
Savings and Investments
Lending (Personal)
Trade Finance
Lending (Business)
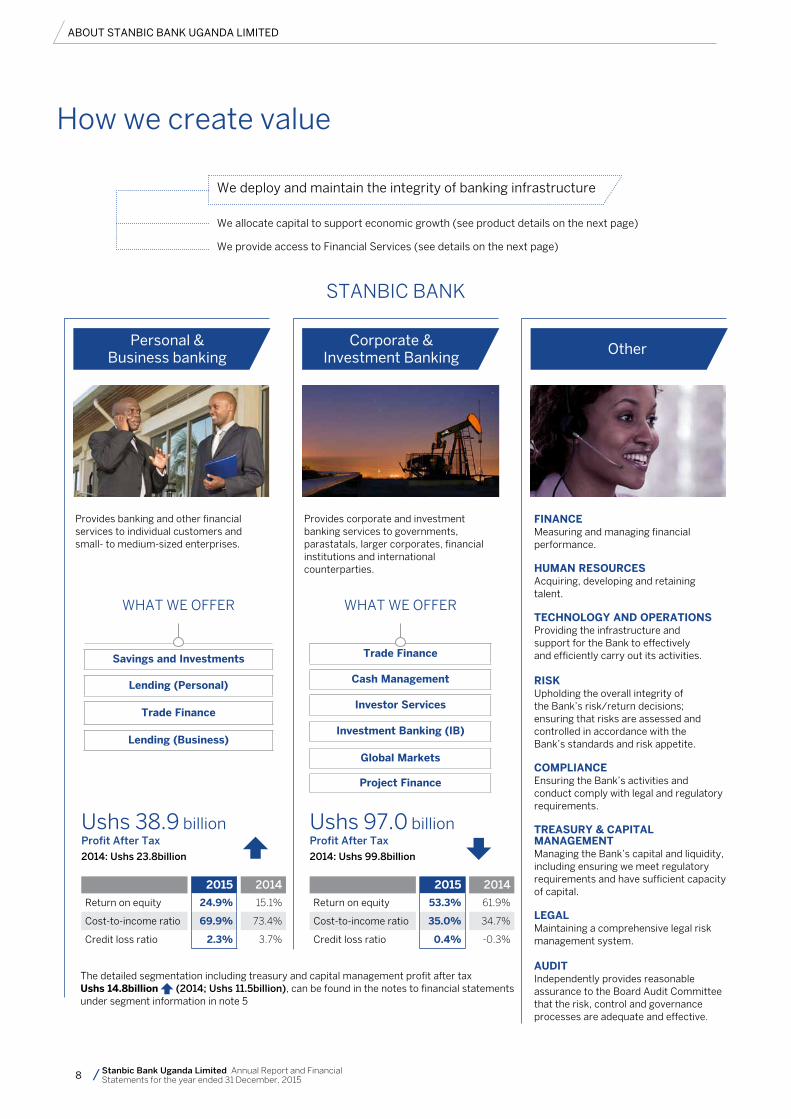
How we create value
Provides banking and other financial services to individual customers and small- to medium-sized enterprises.
Provides corporate and investment banking services to governments, parastatals, larger corporates, financial institutions and international counterparties.
FInAnceMeasuring and managing financialperformance.
HumAn ReSouRceSAcquiring, developing and retainingtalent.
TecHnoLogy AnD oPeRATIonSProviding the infrastructure andsupport for the Bank to effectivelyand efficiently carry out its activities.
RISkUpholding the overall integrity ofthe Bank’s risk/return decisions;ensuring that risks are assessed andcontrolled in accordance with theBank’s standards and risk appetite.
comPLIAnceEnsuring the Bank’s activities and conduct comply with legal and regulatory requirements.
TReASuRy & cAPITAL mAnAgemenTManaging the Bank’s capital and liquidity, including ensuring we meet regulatory requirements and have sufficient capacity of capital.
LegALMaintaining a comprehensive legal risk management system.
AuDITIndependently provides reasonable assurance to the Board Audit Committee that the risk, control and governance processes are adequate and effective.
WHAT WE OFFER
Trade Finance
cash management
Investor Services
Investment Banking (IB)
global markets
Project Finance
WHAT WE OFFER
personal & Business banking
Corporate & Investment Banking
Other
STANBIC BANK
ABOUT STANBIC BANK UGANDA LIMITED
We deploy and maintain the integrity of banking infrastructure
We allocate capital to support economic growth (see product details on the next page)
We provide access to Financial Services (see details on the next page)
2015 2014
Return on equity 24.9% 15.1%
Cost-to-income ratio 69.9% 73.4%
Credit loss ratio 2.3% 3.7%
Ushs 38.9 billionprofit After Tax
2014: Ushs 23.8billion
2015 2014
Return on equity 53.3% 61.9%
Cost-to-income ratio 35.0% 34.7%
Credit loss ratio 0.4% -0.3%
Ushs 97.0 billionprofit After Tax
2014: Ushs 99.8billion
The detailed segmentation including treasury and capital management profit after tax ushs 14.8billion (2014; Ushs 11.5billion), can be found in the notes to financial statements under segment information in note 5
9Stanbic Bank Uganda Limited Annual Report and Financial Statements for the year ended 31 December, 2015
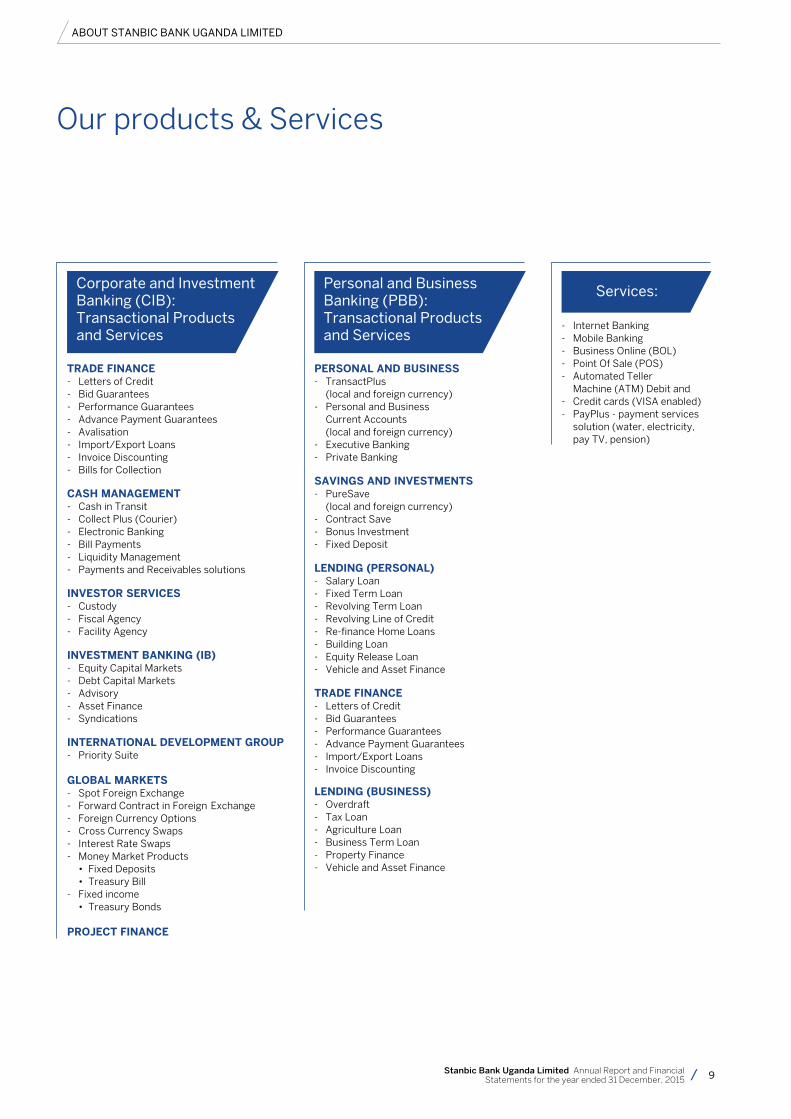
Our products & Services
Corporate and Investment Banking (CIB): Transactional products and Services
personal and Business Banking (pBB): Transactional products and Services
Services:
TRADe FInAnce - Letters of Credit - Bid Guarantees - Performance Guarantees - Advance Payment Guarantees - Avalisation - Import/Export Loans - Invoice Discounting - Bills for Collection
cASH mAnAgemenT - Cash in Transit - Collect Plus (Courier) - Electronic Banking - Bill Payments - Liquidity Management - Payments and Receivables solutions
InveSToR SeRvIceS - Custody - Fiscal Agency - Facility Agency
InveSTmenT BAnkIng (IB) - Equity Capital Markets - Debt Capital Markets - Advisory - Asset Finance - Syndications
InTeRnATIonAL DeveLoPmenT gRouP - Priority Suite
gLoBAL mARkeTS - Spot Foreign Exchange - Forward Contract in Foreign Exchange - Foreign Currency Options - Cross Currency Swaps - Interest Rate Swaps - Money Market Products
• FixedDeposits• TreasuryBill
- Fixed income • TreasuryBonds
PRojecT FInAnce
PeRSonAL AnD BuSIneSS - TransactPlus (local and foreign currency) - Personal and Business Current Accounts (local and foreign currency) - Executive Banking - Private Banking SAvIngS AnD InveSTmenTS - PureSave (local and foreign currency) - Contract Save - Bonus Investment - Fixed Deposit
LenDIng (PeRSonAL) - Salary Loan - Fixed Term Loan - Revolving Term Loan - Revolving Line of Credit - Re-finance Home Loans - Building Loan - Equity Release Loan - Vehicle and Asset Finance TRADe FInAnce- Letters of Credit - Bid Guarantees - Performance Guarantees - Advance Payment Guarantees - Import/Export Loans - Invoice Discounting
LenDIng (BuSIneSS)- Overdraft - Tax Loan - Agriculture Loan - Business Term Loan - Property Finance - Vehicle and Asset Finance
- Internet Banking - Mobile Banking - Business Online (BOL) - Point Of Sale (POS)- Automated Teller Machine (ATM) Debit and - Credit cards (VISA enabled) - PayPlus - payment services solution (water, electricity, pay TV, pension)
ABOUT STANBIC BANK UGANDA LIMITED
10 Stanbic Bank Uganda Limited Annual Report and Financial Statements for the year ended 31 December, 2015
Buliisa
Kinyara
0414 340 788 or 0417 154 910
0800 150150 or 0800 250250
Toll free:
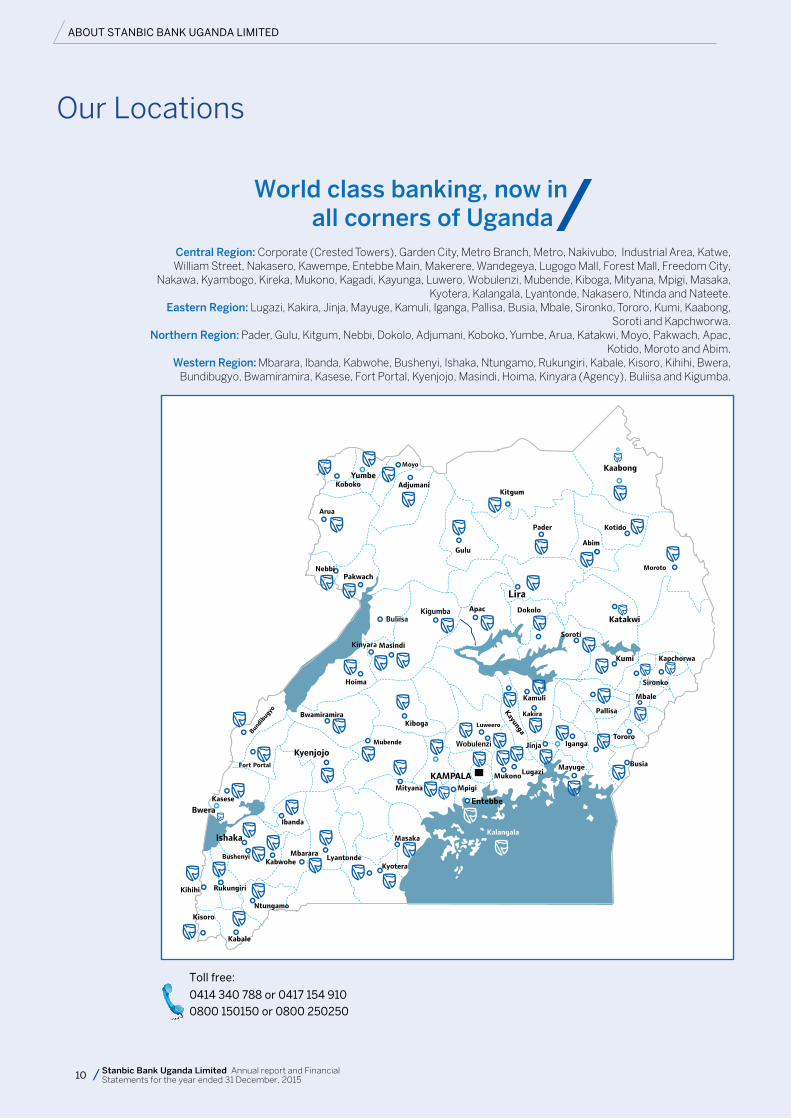
Central Region: Corporate (Crested Towers), Garden City, Metro Branch, Metro, Nakivubo, Industrial Area, Katwe, William Street, Nakasero, Kawempe, Entebbe Main, Makerere, Wandegeya, Lugogo Mall, Forest Mall, Freedom City,
Nakawa, Kyambogo, Kireka, Mukono, Kagadi, Kayunga, Luwero, Wobulenzi, Mubende, Kiboga, Mityana, Mpigi, Masaka, Kyotera, Kalangala, Lyantonde, Nakasero, Ntinda and Nateete.
Eastern Region: Lugazi, Kakira, Jinja, Mayuge, Kamuli, Iganga, Pallisa, Busia, Mbale, Sironko, Tororo, Kumi, Kaabong, Soroti and Kapchworwa.
Northern Region: Pader, Gulu, Kitgum, Nebbi, Dokolo, Adjumani, Koboko, Yumbe, Arua, Katakwi, Moyo, Pakwach, Apac, Kotido, Moroto and Abim.
Western Region: Mbarara, Ibanda, Kabwohe, Bushenyi, Ishaka, Ntungamo, Rukungiri, Kabale, Kisoro, Kihihi, Bwera, Bundibugyo, Bwamiramira, Kasese, Fort Portal, Kyenjojo, Masindi, Hoima, Kinyara (Agency), Buliisa and Kigumba.
Kigumba
Wobulenzi
World class banking, now in all corners of Uganda
Our Locations
ABOUT STANBIC BANK UGANDA LIMITED
10 Stanbic Bank Uganda Limited Annual report and Financial Statements for the year ended 31 December, 2015
11Stanbic Bank Uganda Limited Annual Report and Financial Statements for the year ended 31 December, 2015
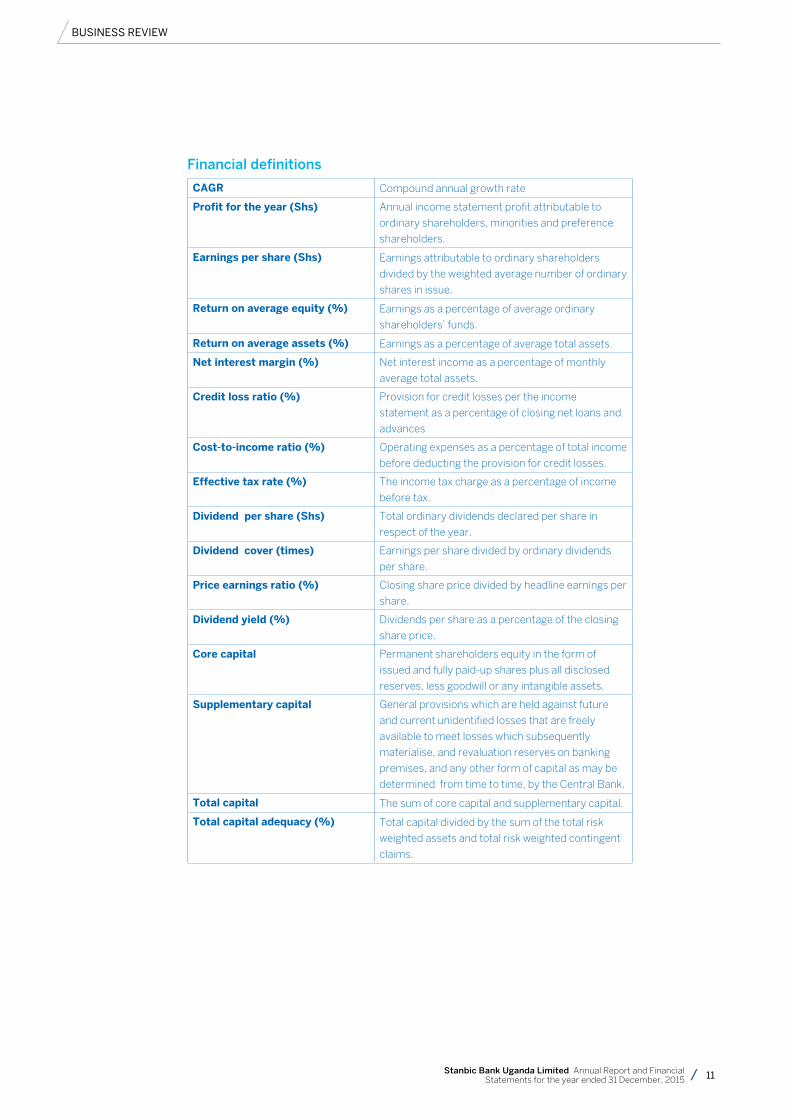
Financial definitions
cAgR Compound annual growth rate
Profit for the year (Shs) Annual income statement profit attributable to
ordinary shareholders, minorities and preference
shareholders.
earnings per share (Shs) Earnings attributable to ordinary shareholders
divided by the weighted average number of ordinary
shares in issue.
Return on average equity (%) Earnings as a percentage of average ordinary
shareholders’ funds.
Return on average assets (%) Earnings as a percentage of average total assets.
net interest margin (%) Net interest income as a percentage of monthly
average total assets.
credit loss ratio (%) Provision for credit losses per the income
statement as a percentage of closing net loans and
advances
cost-to-income ratio (%) Operating expenses as a percentage of total income
before deducting the provision for credit losses.
effective tax rate (%) The income tax charge as a percentage of income
before tax.
Dividend per share (Shs) Total ordinary dividends declared per share in
respect of the year.
Dividend cover (times) Earnings per share divided by ordinary dividends
per share.
Price earnings ratio (%) Closing share price divided by headline earnings per
share.
Dividend yield (%) Dividends per share as a percentage of the closing
share price.
core capital Permanent shareholders equity in the form of
issued and fully paid-up shares plus all disclosed
reserves, less goodwill or any intangible assets.
Supplementary capital General provisions which are held against future
and current unidentified losses that are freely
available to meet losses which subsequently
materialise, and revaluation reserves on banking
premises, and any other form of capital as may be
determined from time to time, by the Central Bank.
Total capital The sum of core capital and supplementary capital.
Total capital adequacy (%) Total capital divided by the sum of the total risk
weighted assets and total risk weighted contingent
claims.
BUSINESS REvIEW
12 Stanbic Bank Uganda Limited Annual Report and Financial Statements for the year ended 31 December, 2015
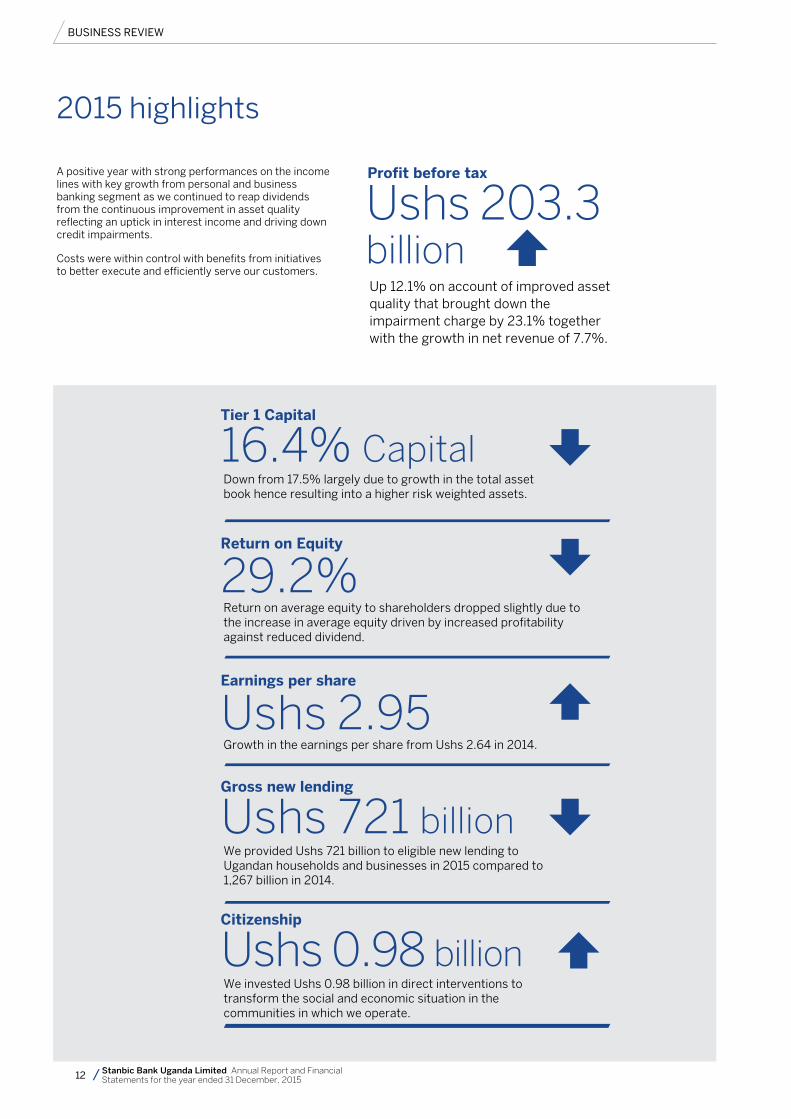
2015 highlights
BUSINESS REvIEW
16.4% CapitalDown from 17.5% largely due to growth in the total asset book hence resulting into a higher risk weighted assets.
29.2%Return on average equity to shareholders dropped slightly due to the increase in average equity driven by increased profitability against reduced dividend.
Ushs 2.95Growth in the earnings per share from Ushs 2.64 in 2014.
Ushs 721 billionWe provided Ushs 721 billion to eligible new lending to Ugandan households and businesses in 2015 compared to 1,267 billion in 2014.
Ushs 0.98 billionWe invested Ushs 0.98 billion in direct interventions to transform the social and economic situation in the communities in which we operate.
A positive year with strong performances on the income lines with key growth from personal and business banking segment as we continued to reap dividends from the continuous improvement in asset quality reflecting an uptick in interest income and driving down credit impairments.
Costs were within control with benefits from initiatives to better execute and efficiently serve our customers.
Ushs 203.3 billionUp 12.1% on account of improved asset quality that brought down the impairment charge by 23.1% together with the growth in net revenue of 7.7%.
Profit before tax
Tier 1 capital
Return on equity
earnings per share
gross new lending
citizenship
13Stanbic Bank Uganda Limited Annual Report and Financial Statements for the year ended 31 December, 2015
BUSINESS REvIEW
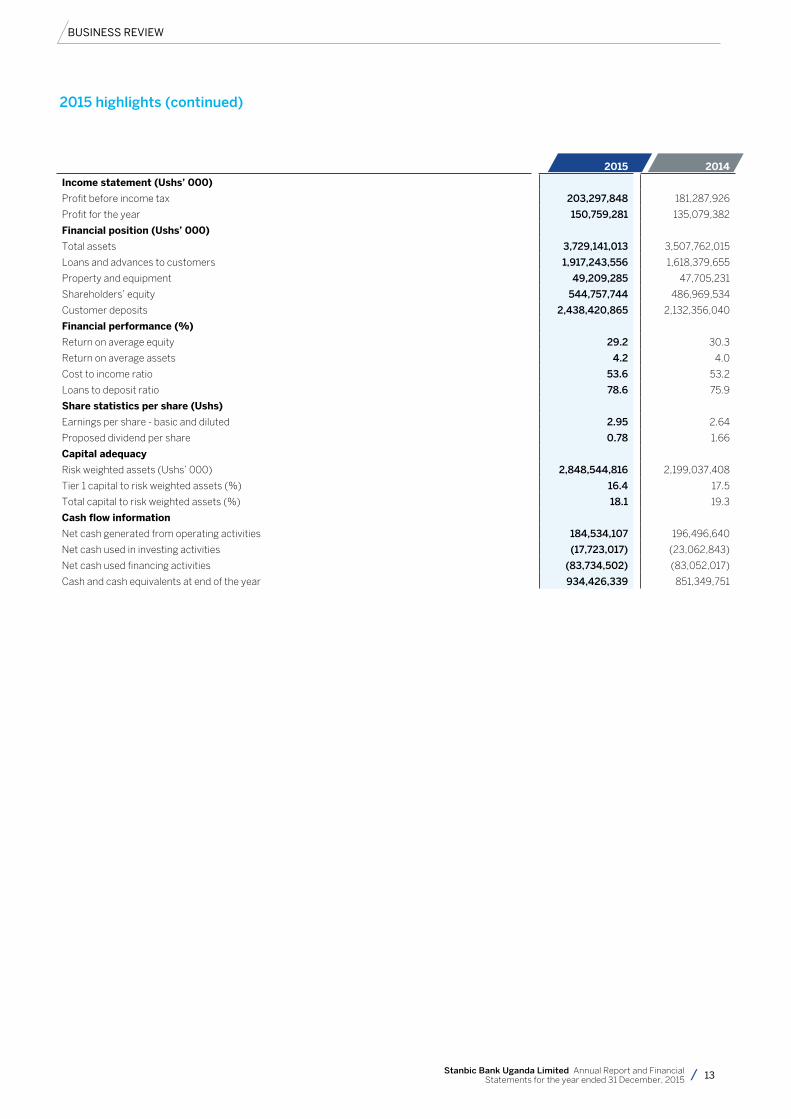
2015 2014
Income statement (ushs’ 000)
Profit before income tax 203,297,848 181,287,926
Profit for the year 150,759,281 135,079,382
Financial position (ushs’ 000)
Total assets 3,729,141,013 3,507,762,015
Loans and advances to customers 1,917,243,556 1,618,379,655
Property and equipment 49,209,285 47,705,231
Shareholders’ equity 544,757,744 486,969,534
Customer deposits 2,438,420,865 2,132,356,040
Financial performance (%)
Return on average equity 29.2 30.3
Return on average assets 4.2 4.0
Cost to income ratio 53.6 53.2
Loans to deposit ratio 78.6 75.9
Share statistics per share (ushs)
Earnings per share - basic and diluted 2.95 2.64
Proposed dividend per share 0.78 1.66
capital adequacy
Risk weighted assets (Ushs’ 000) 2,848,544,816 2,199,037,408
Tier 1 capital to risk weighted assets (%) 16.4 17.5
Total capital to risk weighted assets (%) 18.1 19.3
cash flow information
Net cash generated from operating activities 184,534,107 196,496,640
Net cash used in investing activities (17,723,017) (23,062,843)
Net cash used financing activities (83,734,502) (83,052,017)
Cash and cash equivalents at end of the year 934,426,339 851,349,751
2015 highlights (continued)
14 Stanbic Bank Uganda Limited Annual Report and Financial Statements for the year ended 31 December, 2015
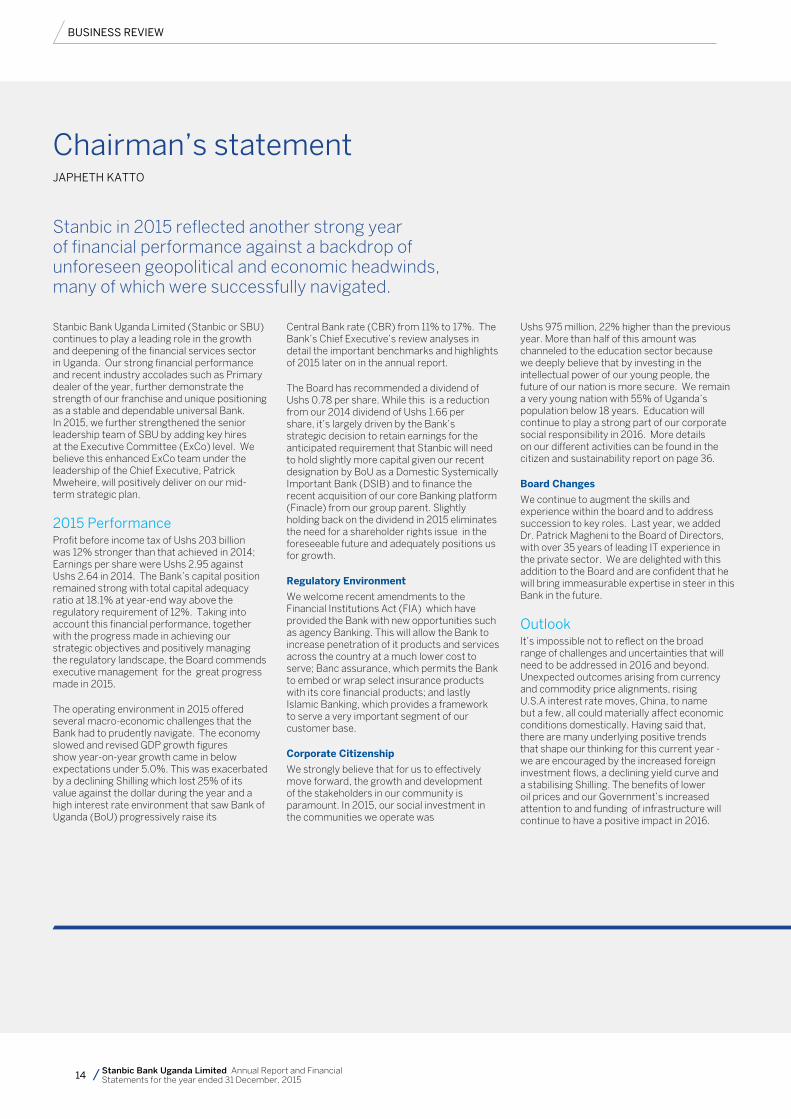
Chairman’s statementJAPHETH KATTO
Stanbic Bank Uganda Limited (Stanbic or SBU) continues to play a leading role in the growth and deepening of the financial services sector in Uganda. Our strong financial performance and recent industry accolades such as Primary dealer of the year, further demonstrate the strength of our franchise and unique positioning as a stable and dependable universal Bank. In 2015, we further strengthened the senior leadership team of SBU by adding key hires at the Executive Committee (ExCo) level. We believe this enhanced ExCo team under the leadership of the Chief Executive, Patrick Mweheire, will positively deliver on our mid-term strategic plan.
2015 Performance Profit before income tax of Ushs 203 billion was 12% stronger than that achieved in 2014; Earnings per share were Ushs 2.95 against Ushs 2.64 in 2014. The Bank’s capital position remained strong with total capital adequacy ratio at 18.1% at year-end way above the regulatory requirement of 12%. Taking into account this financial performance, together with the progress made in achieving our strategic objectives and positively managing the regulatory landscape, the Board commends executive management for the great progress made in 2015.
The operating environment in 2015 offered several macro-economic challenges that the Bank had to prudently navigate. The economy slowed and revised GDP growth figures show year-on-year growth came in below expectations under 5.0%. This was exacerbated by a declining Shilling which lost 25% of its value against the dollar during the year and a high interest rate environment that saw Bank of Uganda (BoU) progressively raise its
Central Bank rate (CBR) from 11% to 17%. The Bank’s Chief Executive’s review analyses in detail the important benchmarks and highlights of 2015 later on in the annual report.
The Board has recommended a dividend of Ushs 0.78 per share. While this is a reduction from our 2014 dividend of Ushs 1.66 per share, it’s largely driven by the Bank’s strategic decision to retain earnings for the anticipated requirement that Stanbic will need to hold slightly more capital given our recent designation by BoU as a Domestic Systemically Important Bank (DSIB) and to finance the recent acquisition of our core Banking platform (Finacle) from our group parent. Slightly holding back on the dividend in 2015 eliminates the need for a shareholder rights issue in the foreseeable future and adequately positions us for growth.
Regulatory environment
We welcome recent amendments to the Financial Institutions Act (FIA) which have provided the Bank with new opportunities such as agency Banking. This will allow the Bank to increase penetration of it products and services across the country at a much lower cost to serve; Banc assurance, which permits the Bank to embed or wrap select insurance products with its core financial products; and lastly Islamic Banking, which provides a framework to serve a very important segment of our customer base.
corporate citizenship
We strongly believe that for us to effectively move forward, the growth and development of the stakeholders in our community is paramount. In 2015, our social investment in the communities we operate was
Ushs 975 million, 22% higher than the previous year. More than half of this amount was channeled to the education sector because we deeply believe that by investing in the intellectual power of our young people, the future of our nation is more secure. We remain a very young nation with 55% of Uganda’s population below 18 years. Education will continue to play a strong part of our corporate social responsibility in 2016. More details on our different activities can be found in the citizen and sustainability report on page 36.
Board changes
We continue to augment the skills and experience within the board and to address succession to key roles. Last year, we added Dr. Patrick Magheni to the Board of Directors, with over 35 years of leading IT experience in the private sector. We are delighted with this addition to the Board and are confident that he will bring immeasurable expertise in steer in this Bank in the future.
OutlookIt’s impossible not to reflect on the broad range of challenges and uncertainties that will need to be addressed in 2016 and beyond. Unexpected outcomes arising from currency and commodity price alignments, rising U.S.A interest rate moves, China, to name but a few, all could materially affect economic conditions domestically. Having said that, there are many underlying positive trends that shape our thinking for this current year - we are encouraged by the increased foreign investment flows, a declining yield curve and a stabilising Shilling. The benefits of lower oil prices and our Government’s increased attention to and funding of infrastructure will continue to have a positive impact in 2016.
BUSINESS REvIEW
Stanbic in 2015 reflected another strong year of financial performance against a backdrop of unforeseen geopolitical and economic headwinds, many of which were successfully navigated.
15Stanbic Bank Uganda Limited Annual Report and Financial Statements for the year ended 31 December, 2015
BUSINESS REvIEW
More information on our material issues and determination process can be found in our sustainability report, starting on page 36.
AppreciationOn behalf of the Board, I would like to extend my gratitude to Mr. Kitili Mbathi, who resigned from the board early this year. Mr. Mbathi significantly contributed to the Bank in a dual capacity both as a Chief Executive and then as a Director over a 15 year period. It was indeed a great pleasure working with him. I wish him the best in his future endeavours.
To my fellow Board members, I would like to say thank you for your continued support and insight during the year and I look forward to an even better year of working together in 2016.
Lastly, I would like to extend our appreciation to the senior management and staff for sailing through a demanding and unpredictable 2015. Your pro-activeness and resilience rose to the challenge and has added tremendous value to our business.
To our customers, regulators, shareholders, and other stakeholders, we would like to express our sincere gratitude for your continued support to our business in Uganda. I wish you all a fruitful 2016.
GDP growth figures show year-on-year growth came in
below expectations under 5.0%. This was exacerbated
by a declining Shilling which lost 25% of its value against
the dollar during the year and a high interest rate
environment that saw Bank of Uganda (“BoU”) raise its
Central Bank Rate (CBR) from 11% to 17%.
Chairman’s statement (continued)
16 Stanbic Bank Uganda Limited Annual Report and Financial Statements for the year ended 31 December, 2015
Chief Executive’s statementPATRICK MWEHEIRE
In 2015, we generated record earnings for a second year in a row, remaining the most profitable bank in uganda. We successfully continued to deliver on the key initiatives that we had set for ourselves at the beginning of 2015. The key priorities were getting service right, reducing our cost to serve and building employee capability across all levels.
Our 2015 profit after tax was Ushs 150.8 billion, achieving a strong 12% year-on-year growth in a relatively challenging market environment. Our 2015 revenue of Ushs 532.5 billion was a balanced mix of net interest income and non-interest revenue, reflecting the strength of our diversified business model. Our focus on customers paid off as more of them entrusted us with their deposits and opportunities to serve more of their financial needs. Our total deposits averaged a record Ushs 3.1 trillion for 2015, up 12% from the prior year. Total loans completed the year at Ushs 2.2 trillion up Ushs 377 billion or 20% from 2014. We also achieved a lot of progress in strengthening the quality of our loan book. Credit losses fell to Ushs 28.8 billion, a 23% improvement from Ushs 37.4 billion in 2014 with our credit loss ratio falling to a record low of 1.5% despite a robust 20% year-on-year growth in the loan book.
Our accomplishments in 2015 were a direct result of:
• Having the right people; an effective team of 1,899 members that worked together to fulfil our diverse customer needs;
• Doing business in the right segments; both from an institutional and retail segment;
• Effectively managing risk; and
• Operating a diversified business model; businesses diversified by size, client mix, transactional versus lending that can perform well across a variety of economic and interest rate environments
From a macroeconomic perspective, we witnessed weaker GDP forecast growth which dropped from the 6-6.5% area in 2014 to slightly lower than 5.0% in 2015. Given its inflation targeting policy, we saw Bank of Uganda (BoU) raise the Central Bank Rate (CBR) 5 times in 2015 from a low of 11% in January 2015 to close the year at 17%. This
had a direct impact on prime rates across the industry which stood at 25% by the end of 2015. We expect that both the CBR and the prime rate will begin to fall at the end of the first half of 2016 given the improving inflation environment.
From an industry perspective, we saw robust growth in both deposits and loans growing at 12% and 15% respectively on a nominal basis. It is worth noting though that if you stripped out foreign currency impact from the loan book growth, the real growth was less than 6% and deposit growth at 4%.
We did, however, see a continued recovery in asset quality with the non-performing loan ratio across the industry dropping below 4.0% in 2015 despite decent growth in assets. Banking industry profitability also improved, growing at 11% year-on year. We retained our number one position with an approximately 28% market share of industry profits.
Progress on our key Priorities
From the Bank’s perspective, we continued to deliver on the key initiatives that we had set for ourselves at the beginning of 2015. The key priorities were getting service right; reducing our cost to serve; and building employee capability across all levels of the Bank.
Getting Service Right Our passion for serving customers motivates all 1,899 of our employees and we are proud of the massive strides we made in 2015 in improving the customer service experience across our banking network. We relentlessly tracked and measured the impact of everything we did both internally and externally in terms of its impact to customer service and it has been gratifying to hear how our banking and financial services have markedly improved and continue to transform lives.
We launched several key service initiatives in the year that will continue to enhance our service experience. For example, we invested in a new state of the art Customer Relationship Management (CRM) tool that allows for a 360 degree view of all our customers. It provides real-time data of that specific customer’s queries or requests allowing for a much more streamlined tracking and delivery of products and services. We have also held several
customer engagement forums across the branch network to hear the issues from the customers directly. These and many other initiatives are designed to make the Bank more service-centric and position us to be the leading service-oriented Bank in the country.
We are happy to note that a number of gains have already been made and service should soon become a key differentiator for us in the market in 2016.
Reducing our Cost-to-Serve In order for us to retain our leadership position in the banking industry, we must constantly innovate and improve our productivity. In 2015, we focused on operating efficiently by thoughtfully managing our resources and exercising discipline to invest in the areas that matter the most to our customers and stakeholders. In fact in 2015, our cost to income ratio (how much expense we incur for every Shilling of revenue we earn) was 54%, way below the Uganda banking sector average of 61%. Throughout the year, we launched several digital initiatives such as smart deposit taking ATMs; mobile money school fees solution; account to mobile wallet; and a more enhanced internet banking platform. All these initiatives have broadened the choice for our customers while also bringing down our cost to serve. We expect to see a more accelerated move of lower value and less complex transactions away from the branch to these more convenient digital platforms in 2016. We will continue to leverage technology to simplify our processes and reduce expenses. We continue to make substantial progress in eliminating paper transaction processing in our Bank locations and currently have most loan applications digitally uploaded and processed. We will spend 2016 looking at ways to further digitise the processing of deposits, withdrawals, payments and other teller transactions.
We also continued to invest and upgrade our core banking platform to address interface gaps with other peripheral Bank systems and broaden functionality. We are convinced that all these interventions will ultimately improve our efficiency and ability to more cost effectively serve our customers. They have also improved the control environment and lowered the risk levels across the Bank.
BUSINESS REvIEW
17Stanbic Bank Uganda Limited Annual Report and Financial Statements for the year ended 31 December, 2015
BUSINESS REvIEW
You can read more about our risk profile and approach to risk management in our risk review on page 31.
Building Employee Capability Across all Levels Our greatest competitive advantage is our people. We believe that all 1,899 of our employees are assets to be invested in and not expenses to be managed. In 2015, we continued to massively invest in our people by training and developing talent. Our employee’s completed more than 4,665 training courses last year.
We carry out internal surveys with our team members to understand what engages them at work. We believe the more engaged our employees are, the more connected they are to our vision and values. In the last survey, overall team member engagement measured 4.4 out of 5. We aspire to be the leading financial services employer of choice in the country offering all our employees an unmatched Employee Value Proposition.
2015 Performance ReviewOur 2015 results registered an after tax profit of Ushs 150.8 billion, an increase of Ushs 15.7 billion or a 12% year-on-year growth from the results of the preceding year of Ushs 135.1 billion.
The key performance drivers in 2015, compared to 2014 were as follows:
Total income exceeded a record Ushs 532 billion growing by Ushs 38.3billion (7.7% year-on-year). The biggest contribution to this growth came from Net Interest Income (NII), which recorded a growth of 11%, equivalent to Ushs 31.3 billion on account of strong year-on-year loan growth. Non Interest Revenue (NIR) had muted growth of 3.0% over 2014 but still represented a sizeable 42% of Total Income. Our aspiration is to have a 50%/50% NII to NIR revenue mix.
• Operating costs remained under tight control with real expenditure remaining modest year-on-year (inflationary growth of 9%, equivalent to (Ushs 22.5 billion). We continue to drive efficiency through investment in technology and improved productivity.
• Asset quality markedly improved with our credit loss ratio falling to 1.5% from 2.3% in the previous year. Credit
provisions dropped to Ushs 28.8 billion from Ushs 37.4 billion in 2014 and Ushs 45 billion in 2013, a trend that we are pleased with.
• Our cost-efficiency ratio remained relatively flat at 53.6% from 53.2% in the prior year as a result of a rebound in our revenue lines and a tightly managed cost base. We achieved this even after making significant investments in the business.
• Return on equity was approximately 29.2% not significantly different from 30.3% in 2014 reflecting the improvement in profitability of the business in 2015 as we carried significantly more capital.
The above results were achieved in a highly competitive market place within a sluggish macro-economic backdrop, particularly in the second half of 2015. You can find further details on the 2015 operating environment and the financial performance in the operating and financial review section of this report on page 21.
Capital and Liquidity baseDuring 2015, our core capital ratio remained strong at 16.4% against a regulatory minimum ratio of 8% while the total capital ratio was 18.1% against a regulatory minimum of 12%. Our liquid asset holding ratio was also very strong an average of over 50% against a regulatory minimum of 20%. This strong capital position provides the Bank with a significant buffer to meet both regulatory requirements and customers’ needs for the foreseeable future.
Risk Management and ControlsWe have clear risk management objectives and an established strategy to deliver them through core risk management processes. This enables us to fully understand and minimize the impact of uncertainty in the business. Responsibility for risk management is cascaded through all levels of the Bank, from the Board and the Executive Committee down through the organization to each business manager and risk specialist. This ensures that risk/return decisions are taken at the most appropriate level and as close as possible to
the business. Independent risk teams are in place to support close working relationships with the business teams taking on the risk. These risk teams ultimately report to the Head of Risk.
During the year, we made significant progress in rolling out our robust compliance framework and a range of policies addressing various compliance risks such as Anti-Money Laundering, Know Your Customer (KYC), Bribery and Corruption, as well as Consumer Protection. We also maintained a strong relationship with our regulators both local and international and remain committed to conducting our business in a fair, transparent and compliant manner. You can read more about our risk profile and approach to risk management in our risk review on page 31.
corporate Social Responsibility (cSR)
In 2015, we continued to demonstrate our commitment to transform lives in our communities. In doing this, we reached over 52,000 people across the country and committed Ushs 975m, of which 52% was directed to the education sector. As our national demographics suggest, Uganda has the youngest population in the world (70% below 30years of which 55% are below 18 years). We therefore believe that to foster true sustainable economic growth, it is imperative that we appropriately invest in the quality of education for our youth. This is why as Stanbic Bank we deliberately reinforced our transformational efforts in the education sector with an emphasis on providing support to the under-privileged to access required scholastic support and supporting the development of critical thinking and practical skills in our secondary schools. In addition, as part of our broader agenda of empowering our communities with the right knowledge to transform their lives, we conducted financial literacy seminars to vulnerable households and providing a platform that sponsors business mentorship to SMEs. We intend to further broaden our contribution to the development in this sector to include entrepreneurial skills development. For further insights on our CSR activities, these can be found in the sustainability report on page 36.
Chief Executive’s statement (continued)
18 Stanbic Bank Uganda Limited Annual Report and Financial Statements for the year ended 31 December, 2015
2016 Priorities
Our priorities in 2016 will focus on three relatively simple but critical objectives;
• PlacingtheCustomerattheCentreofEverything we do;
• ExecutingFlawlessly;and
• Buildingemployeecapabilityacrossalllevels;
At the end of the day, our business is built around a relentless focus on customers. We provide products and services to meet our customers’ needs through multiple channels bolstered by high quality, caring relationships and service. 2016 will refocus on the customer and ensuring all that we do internally and externally is centered on the customer. We aspire to be the first provider the public think of when they need a financial product or service.
In order for us to retain our leadership position in the Ugandan banking industry we must flawlessly and ruthlessly execute on our plans -not once a month or every quarter but every single hour of each day. Getting this right will require that we operate as teams rather than individuals. Our culture is about plural pronouns – we, us, ours – instead of I, me or mine. We would like to create an environment where every employee is empowered to speak up and contribute. A lot of work and thought has gone into identifying the market opportunity and where we would like to invest our efforts and resources. It’s time to execute.
Lastly, we will continue to invest in our people’s capability to lead and contribute to their fullest potential. Capability building is more than just training to complete day-to-day tasks; we will be focusing on a broader set of skills that increase each employee’s value to the organization and better position us in the market place.
2016 Outlook2015 was an outstanding year for Stanbic Uganda and we are very pleased with our performance. 2016 started out slow in the first quarter primarily due to the late February election but we are very clear on what we have to do for the rest of 2016. We have a solid balance sheet, a remarkable brand, loyal clients and fantastic people to deliver our objectives.
AppreciationI would like to thank all our stakeholders - board members, staff members, customers, regulators, communities and shareholders- for making 2015 an outstanding year. As we look forward, we are confident in our abilities to serve the changing customer needs and contribute to the growth of our beloved country. Special thanks go to the dedication of our 1, 899 employees working together towards our shared vision. To transform lives by satisfying all our customers’ financial needs. Moving forward™.
Chief Executive’s statement (continued)
BUSINESS REvIEW

19Stanbic Bank Uganda Limited Annual Report and Financial Statements for the year ended 31 December, 2015
Primary Dealer of the year Award
Your belief and trust has earned
us this award again.A big thank you from the
management and staff of Stanbic Bank to our esteemed customers,
inter -bank counter parties and all other stakeholders for yet another win.
20 Stanbic Bank Uganda Limited Annual Report and Financial Statements for the year ended 31 December, 201520 Stanbic Bank Uganda Limited Annual report and Financial Statements for the year ended 31 December, 2015
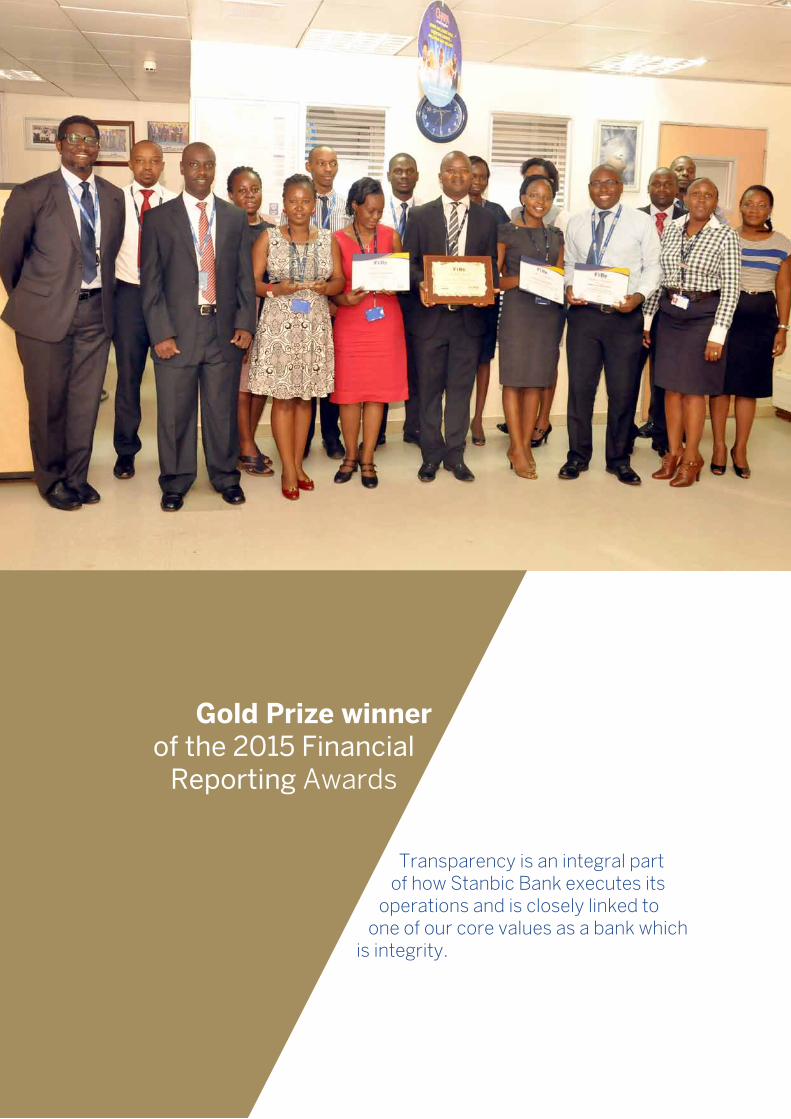
gold Prize winnerof the 2015 Financial
Reporting Awards
Transparency is an integral part of how Stanbic Bank executes its
operations and is closely linked to one of our core values as a bank which
is integrity.
21Stanbic Bank Uganda Limited Annual Report and Financial Statements for the year ended 31 December, 2015
Operating environment
The macroeconomic environment was generally under some strain through most of 2015 as characterized by the slowdown in GDP growth estimated at 5% in 2014/2015.
The strain on the economy was further evidenced by the pressure on the Shilling, which depreciated by approximately 25% as at the close of the year and also the upward trend on inflation from the lower levels of 1.3% at the start of the year to close the year at 8.4%. In response to these negative trends, the Bank of Uganda (BoU) raised the Central Bank Rate (CBR) 5 times during the year to close the year at 17%, which was a move of 6 percentage points from the 11% rate at the start of the year. This trend in the economic factors mentioned above resulted in a general upward movement in both the Bank’s lending rates and also rates of the government securities.
There were no significant regulatory changes in 2015. However in January of 2016, the Amendment Bill to the Financial Institutions Act (FIA) 2004 was enacted by the Parliament of Uganda and approved by the President. The changes that arose from this Bill include the provision of the mandate to BoU to implement changes to the capital requirements. The key changes expected from this introduction will be on the upward revision of capital requirements by 2.5% as a capital conservation buffer and an additional capital surcharge of between 1-3.5% for designated systemically important domestic Banks. These changes are aligned to the Basel III framework and are intended to strengthen the resilience of the Uganda Banking sector. The Bank has taken appropriate measures to ensure we remain well capitalized to meet the additional requirements.
Other changes that arose from this amendment include introductions under Agency banking, Islamic banking, and Banc assurance. These Amendments to the FIA provide the Bank with revenue and service diversification opportunities for which the Bank has also taken measures to ensure readiness for.
The Bank continued to leverage off the benefits of the investment undertaken in technology over the past few years to appropriately position the Bank as the “digital Bank of choice”. The efficiencies continue to be mined as the stability of the systems improve and more notably, the Bank has also been able to roll out customer- friendlyand digital-based solutions to our clients to make their Banking more cost-efficient, quicker and less cumbersome. We expect that these solutions will be central to feature to the continued growth in profitability of the Bank for many years to come.
In regards to our financial perfomance, 2015 was yet again another successful year for the Bank despite operating in a more challenging environment. Profits after income tax were up 11.6 % resulting in a record Ushs 150.8 billion up from Ushs 135.1billion in 2014. The Bank’s revenue growth was supported by good management of net interest margins, stable transactional non-interest revenues and very sound credit and cost management.
Highlights underpinning our results for the year include;
• Goodgrowthundercustomerloansanddeposits
• Drivingoptimizationofthemarginsonthe balance sheet
• Continualemphasisonstrengtheningcredit management resulting in improved asset quality.
• Costmanagementwithinreasonabletarget growth levels.
Financial Performance Review
A brief review of the major assets and liabilities of the Bank, how they affected the performance of the Bank and the drivers behind the variances year on year are reviewed as follows;
cash and Balances with Banks
These are made up mainly of the cash we hold in our network, statutory cash reserves with Bank of Uganda, balances with other commercial Banks and repos held with the Bank of Uganda for short periods awaiting suitable investment opportunities.
The growth in the cash and balances with other Banks was mainly supported by the growth in customer deposits year on year together with the impact of the depreciation of the Uganda Shilling against other major currencies.
Investment securities
Government securities reduced year on year by 12%. The uncertainty in the interest rate outlook coupled with good growth under customer loans and advances resulted in a more cautious short-term re-investment strategy in the government securities.
Loans and advances to customers
Loans and advances reported a very strong growth year on year of Ushs 299 billion, representing a growth rate of 18%. The primary drivers for this growth were from good growth under corporate lending primarily under working capital financing and also the impact of the Shilling depreciation on foreign currency denominated loans.
Notably, more subdued lending was noted under the Personal and Business Banking space as the impact of increasing interest rates depressed demand.
customer deposits
Customer deposits registered good growth year on year of Ushs 306billion, representing a growth rate of 14%. The Bank continued to register good gains under corporate deposits and also the retail deposits. The retail deposit base was in particular supported by an internal sales campaign dubbed “Chapa” which resulted in strong deposit growth. Key to also note was the impact of the Shilling depreciation on the foreign currency denominated deposit base.
Brief reviews of other key factors impacting the performance of the Bank are reflected below:
margins
This represents the profit margin between interest rate earned on earning assets and interest rate paid on deposits and other sources of funding. The key drivers of this ratio are the CBR and the credit quality of assets on the book.
The CBR continued to rise throughout the year increasing by 6 percentage points to close at 17% as BoU responded to curb the rising inflationary pressure and impact of Shilling depreciation. This resulted in higher yields on the assets but also led to an increase in cost of deposits.
credit loss
The credit-loss ratio is the impairment charge expressed as a percentage of the closing loans and advances book. It repre-sents the loss the Bank incurs as a result of delinquencies from customers and also general credit provisioning for un-identified credit losses.
The Bank continued to strengthen its credit process by improving the underwriting process and efficient management of the recoveries process with an enhanced collections framework instituted. This resulted in a further improvement in the Bank’s credit-loss ratio from 2.3% in 2014 to 1.5% in 2015.
Inflation
Inflation represents the general increases in prices for goods and services in the economy. An increase in inflation would generally impact the cost of operations of the Bank.
Annual inflation continued to rise from 1.3% at the beginning of the year and closing at 8.4% for December, 2015 (There was a change in the base year used for calculating the Consumer Price Index from 2005/06 to 2009/10. This resulted in the restatement of the December, 2015 Headline inflation results from 9.3% to 8.4%).
Operating and financial review
BUSINESS REvIEW
22 Stanbic Bank Uganda Limited Annual Report and Financial Statements for the year ended 31 December, 2015
operating and financial review (continued)
BUSINESS REvIEW
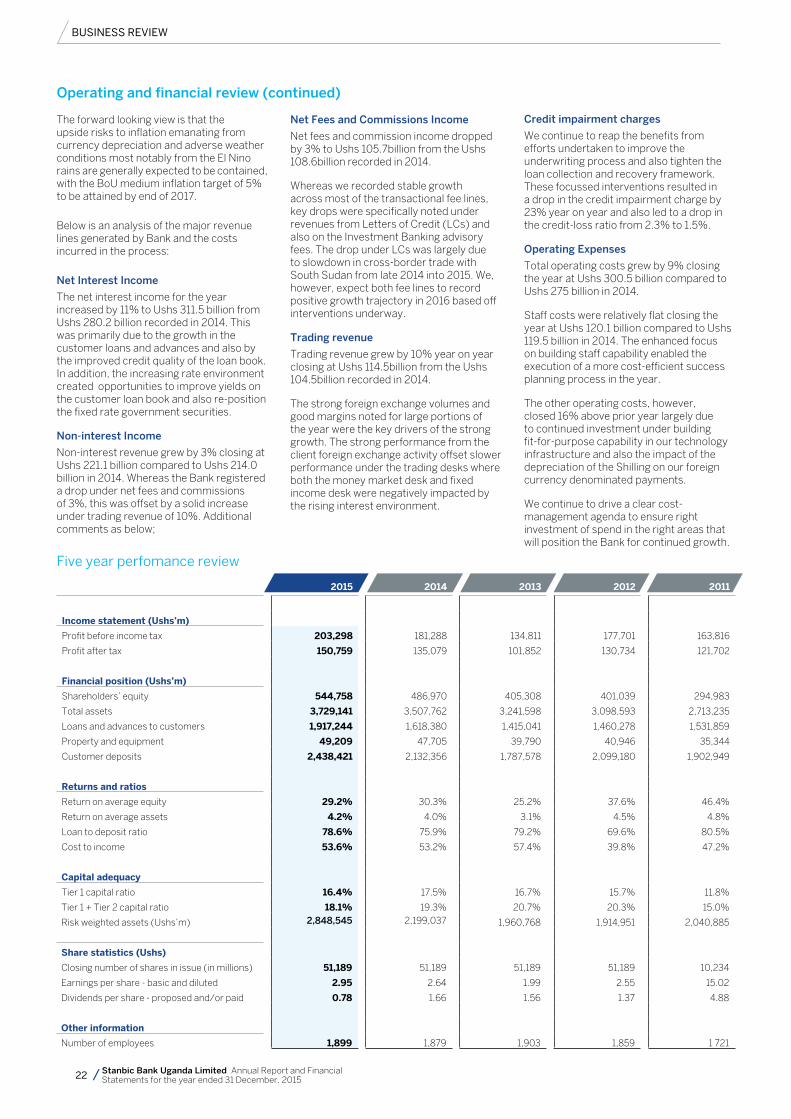
2015 2014 2013 2012 2011
Income statement (ushs’m)
Profit before income tax 203,298 181,288 134,811 177,701 163,816
Profit after tax 150,759 135,079 101,852 130,734 121,702
Financial position (ushs’m)
Shareholders’ equity 544,758 486,970 405,308 401,039 294,983
Total assets 3,729,141 3,507,762 3,241,598 3,098,593 2,713,235
Loans and advances to customers 1,917,244 1,618,380 1,415,041 1,460,278 1,531,859
Property and equipment 49,209 47,705 39,790 40,946 35,344
Customer deposits 2,438,421 2,132,356 1,787,578 2,099,180 1,902,949
Returns and ratios
Return on average equity 29.2% 30.3% 25.2% 37.6% 46.4%
Return on average assets 4.2% 4.0% 3.1% 4.5% 4.8%
Loan to deposit ratio 78.6% 75.9% 79.2% 69.6% 80.5%
Cost to income 53.6% 53.2% 57.4% 39.8% 47.2%
capital adequacy
Tier 1 capital ratio 16.4% 17.5% 16.7% 15.7% 11.8%
Tier 1 + Tier 2 capital ratio 18.1% 19.3% 20.7% 20.3% 15.0%
Risk weighted assets (Ushs’m) 2,848,545 2,199,037 1,960,768 1,914,951 2,040,885
Share statistics (ushs)
Closing number of shares in issue (in millions) 51,189 51,189 51,189 51,189 10,234
Earnings per share - basic and diluted 2.95 2.64 1.99 2.55 15.02
Dividends per share - proposed and/or paid 0.78 1.66 1.56 1.37 4.88
other information
Number of employees 1,899 1,879 1,903 1,859 1 721
Five year perfomance review
The forward looking view is that the upside risks to inflation emanating from currency depreciation and adverse weather conditions most notably from the El Nino rains are generally expected to be contained, with the BoU medium inflation target of 5% to be attained by end of 2017.
Below is an analysis of the major revenue lines generated by Bank and the costs incurred in the process:
Net Interest Income
The net interest income for the year increased by 11% to Ushs 311.5 billion from Ushs 280.2 billion recorded in 2014. This was primarily due to the growth in the customer loans and advances and also by the improved credit quality of the loan book. In addition, the increasing rate environment created opportunities to improve yields on the customer loan book and also re-position the fixed rate government securities.
Non-interest Income
Non-interest revenue grew by 3% closing at Ushs 221.1 billion compared to Ushs 214.0 billion in 2014. Whereas the Bank registered a drop under net fees and commissions of 3%, this was offset by a solid increase under trading revenue of 10%. Additional comments as below;
Net Fees and Commissions Income
Net fees and commission income dropped by 3% to Ushs 105.7billion from the Ushs 108.6billion recorded in 2014.
Whereas we recorded stable growth across most of the transactional fee lines, key drops were specifically noted under revenues from Letters of Credit (LCs) and also on the Investment Banking advisory fees. The drop under LCs was largely due to slowdown in cross-border trade with South Sudan from late 2014 into 2015. We, however, expect both fee lines to record positive growth trajectory in 2016 based off interventions underway.
Trading revenue
Trading revenue grew by 10% year on year closing at Ushs 114.5billion from the Ushs 104.5billion recorded in 2014.
The strong foreign exchange volumes and good margins noted for large portions of the year were the key drivers of the strong growth. The strong performance from the client foreign exchange activity offset slower performance under the trading desks where both the money market desk and fixed income desk were negatively impacted by the rising interest environment.
Credit impairment charges
We continue to reap the benefits from efforts undertaken to improve the underwriting process and also tighten the loan collection and recovery framework. These focussed interventions resulted in a drop in the credit impairment charge by 23% year on year and also led to a drop in the credit-loss ratio from 2.3% to 1.5%.
operating Expenses
Total operating costs grew by 9% closing the year at Ushs 300.5 billion compared to Ushs 275 billion in 2014.
Staff costs were relatively flat closing the year at Ushs 120.1 billion compared to Ushs 119.5 billion in 2014. The enhanced focus on building staff capability enabled the execution of a more cost-efficient success planning process in the year.
The other operating costs, however, closed 16% above prior year largely due to continued investment under building fit-for-purpose capability in our technology infrastructure and also the impact of the depreciation of the Shilling on our foreign currency denominated payments.
We continue to drive a clear cost-management agenda to ensure right investment of spend in the right areas that will position the Bank for continued growth.
23Stanbic Bank Uganda Limited Annual Report and Financial Statements for the year ended 31 December, 2015
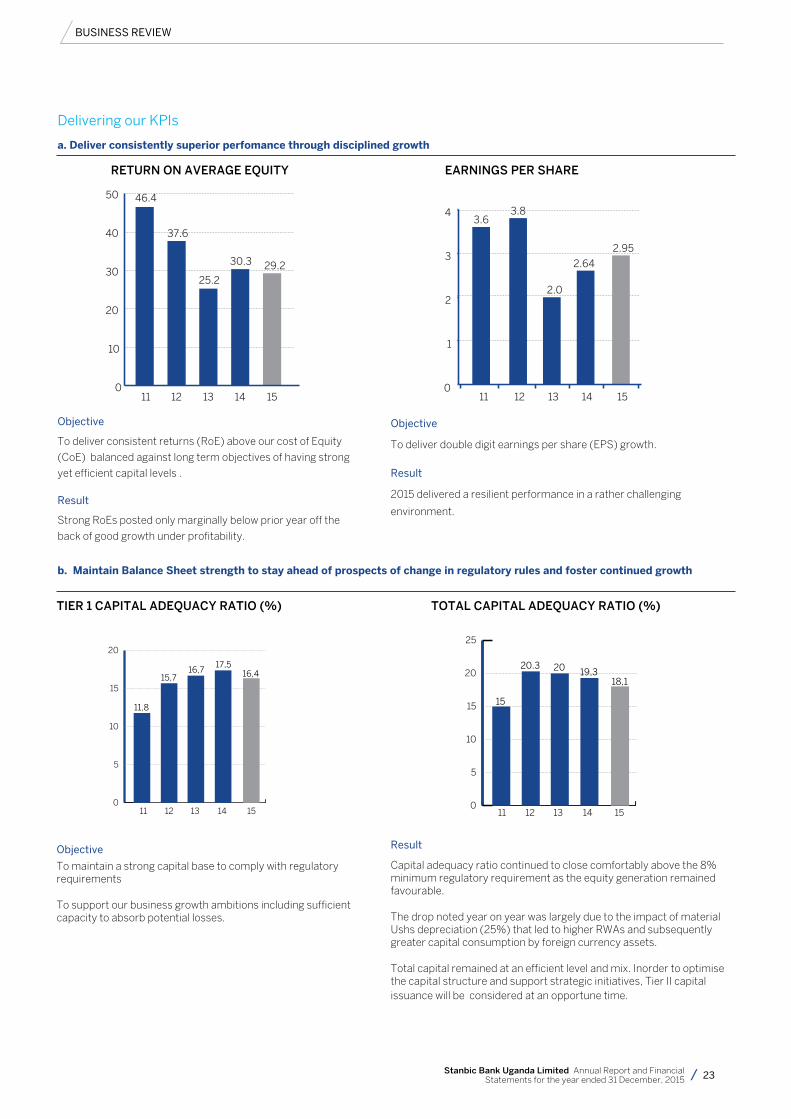
Delivering our KPIs
a. Deliver consistently superior perfomance through disciplined growth
0
5
10
15
20
0
5
10
15
20
25
11,8
15,716,7
17,516,4
19,318,1
15
20.3 20
11 12 13 14 15
11 12 13 14 15
TIER 1 CApITAL ADEqUACy RATIo (%)
0
5
10
15
20
0
5
10
15
20
25
11,8
15,716,7
17,516,4
19,318,1
15
20.3 20
11 12 13 14 15
11 12 13 14 15
ToTAL CApITAL ADEqUACy RATIo (%)
Objective
To maintain a strong capital base to comply with regulatory requirements
To support our business growth ambitions including sufficient capacity to absorb potential losses.
Result
Capital adequacy ratio continued to close comfortably above the 8% minimum regulatory requirement as the equity generation remained favourable.
The drop noted year on year was largely due to the impact of material Ushs depreciation (25%) that led to higher RWAs and subsequently greater capital consumption by foreign currency assets.
Total capital remained at an efficient level and mix. Inorder to optimise the capital structure and support strategic initiatives, Tier II capital issuance will be considered at an opportune time.
b. maintain Balance Sheet strength to stay ahead of prospects of change in regulatory rules and foster continued growth
46.4
37.6
25.2
30.3 29.2
3.6 3.8
2.0
2.64
2.95
0
1
2
3
4
11 12 13 14 15
0
10
20
30
40
50
11 12 13 14 15
46.4
37.6
25.2
30.3 29.2
3.6 3.8
2.0
2.64
2.95
0
1
2
3
4
11 12 13 14 15
0
10
20
30
40
50
11 12 13 14 15
Objective
To deliver consistent returns (RoE) above our cost of Equity
(CoE) balanced against long term objectives of having strong
yet efficient capital levels .
Result
Strong RoEs posted only marginally below prior year off the
back of good growth under profitability.
Objective
To deliver double digit earnings per share (EPS) growth.
Result
2015 delivered a resilient performance in a rather challenging
environment.
BUSINESS REvIEW
RETURN oN AVERAGE EqUITy EARNINGS pER ShARE
24 Stanbic Bank Uganda Limited Annual Report and Financial Statements for the year ended 31 December, 2015
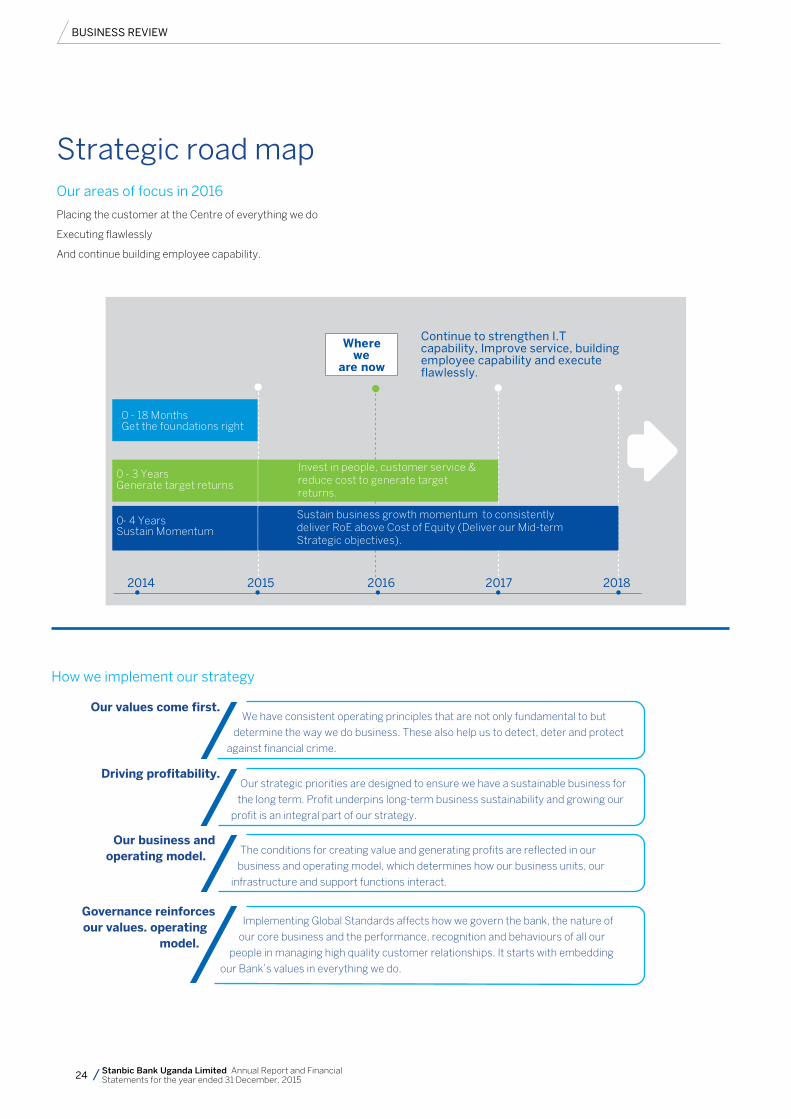
0 - 3 YearsGenerate target returns
0 - 18 Months Get the foundations right
Continue to strengthen I.T capability, Improve service, building employee capability and execute flawlessly.
Where we
are now
0- 4 Years
Sustain Momentum
2014 2015 2016 2017 2018
Sustain business growth momentum to consistently deliver RoE above Cost of Equity (Deliver our Mid-term Strategic objectives).
Invest in people, customer service & reduce cost to generate target returns.
Our areas of focus in 2016
We have consistent operating principles that are not only fundamental to but
determine the way we do business. These also help us to detect, deter and protect
against financial crime.
Our strategic priorities are designed to ensure we have a sustainable business for
the long term. Profit underpins long-term business sustainability and growing our
profit is an integral part of our strategy.
The conditions for creating value and generating profits are reflected in our
business and operating model, which determines how our business units, our
infrastructure and support functions interact.
Implementing Global Standards affects how we govern the bank, the nature of
our core business and the performance, recognition and behaviours of all our
people in managing high quality customer relationships. It starts with embedding
our Bank’s values in everything we do.
our values come first.
Driving profitability.
our business and operating model.
governance reinforces our values. operating
model.
How we implement our strategy
BUSINESS REvIEW
Placing the customer at the Centre of everything we do
Executing flawlessly
And continue building employee capability.
Strategic road map

25Stanbic Bank Uganda Limited Annual Report and Financial Statements for the year ended 31 December, 2015
Stanbic Bank Uganda Limited. A financial institution regulated by Bank of Uganda. License Number A1. 0
13
Stanbic Bank
Achieve a relaxed state-of-mind with our
new Chip and PINVISA debit card.
Relax and transact at over 500 VISA outlets in Uganda.
Stanbic Bank’s new Chip and PIN VISA debit card introduces you to a more secure and worry-free world.
The Chip and PIN feature means that a PIN needs to be entered each time you use your card, giving you more control.
Pick up your free upgraded VISA debit card today from your nearest Stanbic Bank branch.
Tel: 0800 150 150 or 0800 250 250
26 Stanbic Bank Uganda Limited Annual Report and Financial Statements for the year ended 31 December, 2015
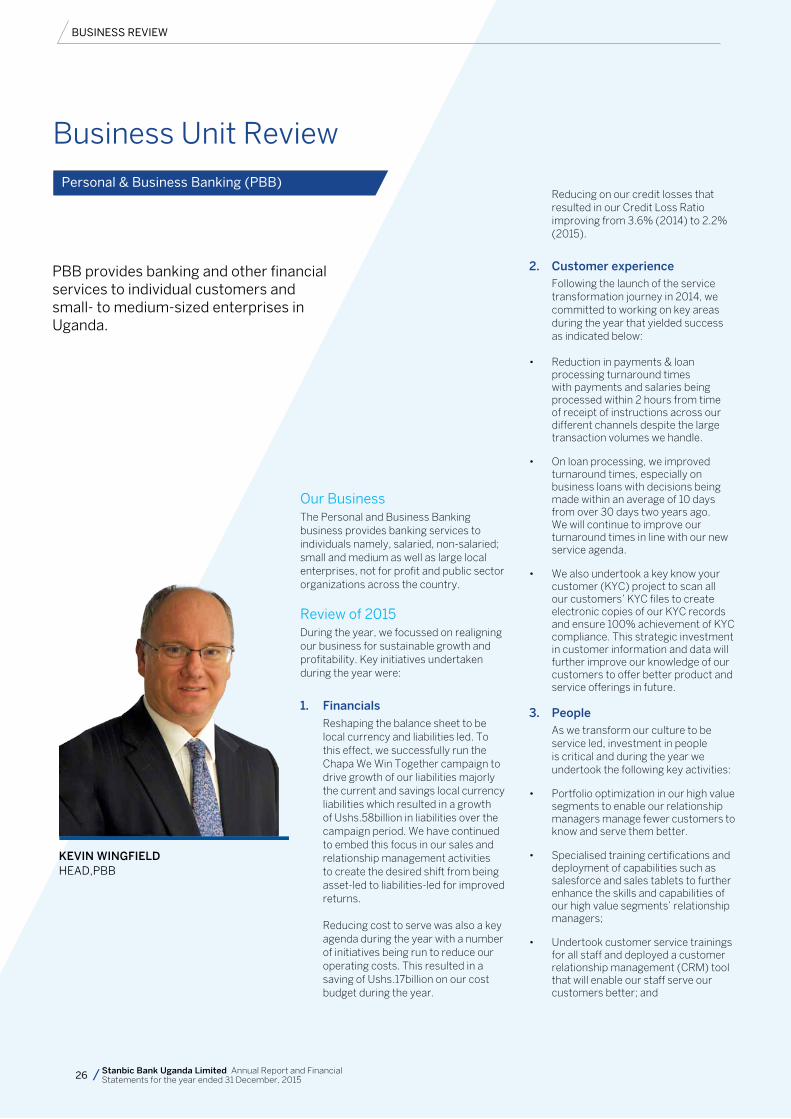
personal & Business Banking (pBB)
PBB provides banking and other financial services to individual customers and small- to medium-sized enterprises in Uganda.
Our BusinessThe Personal and Business Banking business provides banking services to individuals namely, salaried, non-salaried; small and medium as well as large local enterprises, not for profit and public sector organizations across the country.
Review of 2015During the year, we focussed on realigning our business for sustainable growth and profitability. Key initiatives undertaken during the year were:
1. Financials Reshaping the balance sheet to be local currency and liabilities led. To this effect, we successfully run the Chapa We Win Together campaign to drive growth of our liabilities majorly the current and savings local currency liabilities which resulted in a growth of Ushs.58billion in liabilities over the campaign period. We have continued to embed this focus in our sales and relationship management activities to create the desired shift from being asset-led to liabilities-led for improved returns.
Reducing cost to serve was also a key agenda during the year with a number of initiatives being run to reduce our operating costs. This resulted in a saving of Ushs.17billion on our cost budget during the year.
Reducing on our credit losses that resulted in our Credit Loss Ratio improving from 3.6% (2014) to 2.2% (2015).
2. Customer experienceFollowing the launch of the service transformation journey in 2014, we committed to working on key areas during the year that yielded success as indicated below:
• Reduction in payments & loan processing turnaround times with payments and salaries being processed within 2 hours from time of receipt of instructions across our different channels despite the large transaction volumes we handle.
• On loan processing, we improved turnaround times, especially on business loans with decisions being made within an average of 10 days from over 30 days two years ago. We will continue to improve our turnaround times in line with our new service agenda.
• We also undertook a key know your customer (KYC) project to scan all our customers’ KYC files to create electronic copies of our KYC records and ensure 100% achievement of KYC compliance. This strategic investment in customer information and data will further improve our knowledge of our customers to offer better product and service offerings in future.
3. peopleAs we transform our culture to be service led, investment in people is critical and during the year we undertook the following key activities:
• Portfoliooptimizationinourhighvaluesegments to enable our relationship managers manage fewer customers to know and serve them better.
• Specialisedtrainingcertificationsanddeployment of capabilities such as salesforce and sales tablets to further enhance the skills and capabilities of our high value segments’ relationship managers;
• Undertookcustomerservicetrainingsfor all staff and deployed a customer relationship management (CRM) tool that will enable our staff serve our customers better; and
KEVIN WINGFIELDHEAD,PBB
BUSINESS REvIEW
Business Unit Review
26 Stanbic Bank Uganda Limited Annual Report and Financial Statements for the year ended 31 December, 2015
27Stanbic Bank Uganda Limited Annual Report and Financial Statements for the year ended 31 December, 2015
• To drive the culture of ownership and accountability and improve our leadership capability, we embarked on the deployment of Connect, a leader-led team engagement approach to high performance that also drives ownership and accountability. In addition to Connect, we undertook a number of leadership development programmes. We will continue with our focus to develop our leadership capability to improve our organisation culture.
4. Technology• Wecontinuedtoinvestintechnology
as we aspire to be the digital bank of choice. During the year, we launched the following new digital solutions for our customers.
• Instantmoney-afunctionalityonourATMs that enables anyone to withdraw money off our ATMs using a voucher sent to their mobile phones by our customers using internet banking.
• Cardlesscashout-afunctionalitythatenables both Stanbic and non-Stanbic customers; to withdraw their mobile money off our ATMs.
• AccounttoWallet-afunctionalitythatenables both MTN & Airtel customers move money from their bank account to their mobile money wallet; and
• WallettoAccount-afunctionalitythat enables MTN & Airtel customers move money from their mobile money wallets to their bank accounts with Stanbic.
• Internally,wecontinuetodeploycapabilities to improve efficiency in both our systems and processes that will result in better service delivery and operational efficiency.
Outlook for 2016 & BeyondBased on the foundation laid in 2015, we took time to define the 3-year strategic direction for our business and also developed the respective segments, products, channels and sales business plans to support our strategy. This was informed by current and projected market trends as well as a review of our business over the last couple of years. In our new journey, we aspire to lead with business banking with our key focus areas being customer experience, building a culture of execution and optimisation with digital technology being our key enabler given the current industry and economic challenges.
BUSINESS REvIEW
Send money from your Stanbic Bank account through Internet and Mobile Banking.The recipient does not need a bank account and can withdraw money at any of our ATMs countrywide.For more information call 0800 250250or email us at [email protected]
InstantMoney.
The simple and fast way to send money.
Standard Bank group securities is regulated by the Capital Markets Authority
Stanbic Bank
Business Unit Review (continued)
28 Stanbic Bank Uganda Limited Annual Report and Financial Statements for the year ended 31 December, 2015
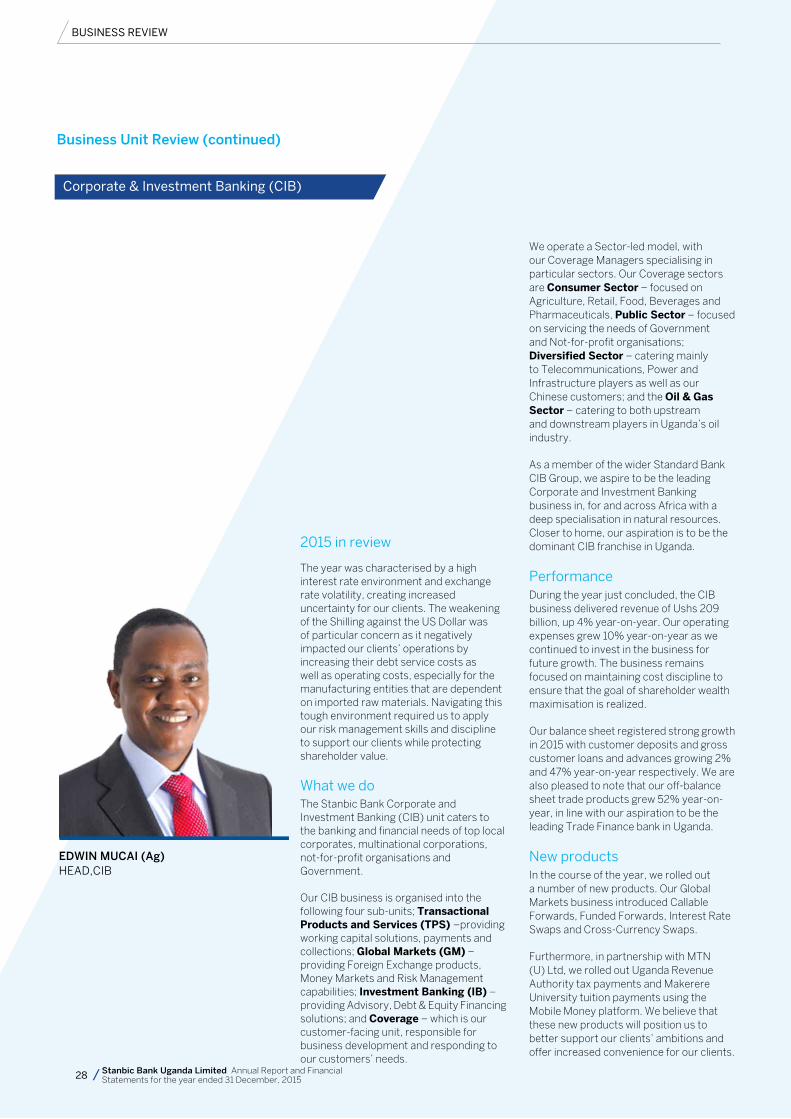
Corporate & Investment Banking (CIB)
2015 in review
The year was characterised by a high interest rate environment and exchange rate volatility, creating increased uncertainty for our clients. The weakening of the Shilling against the US Dollar was of particular concern as it negatively impacted our clients’ operations by increasing their debt service costs as well as operating costs, especially for the manufacturing entities that are dependent on imported raw materials. Navigating this tough environment required us to apply our risk management skills and discipline to support our clients while protecting shareholder value.
What we doThe Stanbic Bank Corporate and Investment Banking (CIB) unit caters to the banking and financial needs of top local corporates, multinational corporations, not-for-profit organisations and Government.
Our CIB business is organised into the following four sub-units; Transactional Products and Services (TPS) –providing working capital solutions, payments and collections; global markets (gm) – providing Foreign Exchange products, Money Markets and Risk Management capabilities; Investment Banking (IB) – providing Advisory, Debt & Equity Financing solutions; and coverage – which is our customer-facing unit, responsible for business development and responding to our customers’ needs.
We operate a Sector-led model, with our Coverage Managers specialising in particular sectors. Our Coverage sectors are consumer Sector – focused on Agriculture, Retail, Food, Beverages and Pharmaceuticals, Public Sector – focused on servicing the needs of Government and Not-for-profit organisations; Diversified Sector – catering mainly to Telecommunications, Power and Infrastructure players as well as our Chinese customers; and the oil & gas Sector – catering to both upstream and downstream players in Uganda’s oil industry.
As a member of the wider Standard Bank CIB Group, we aspire to be the leading Corporate and Investment Banking business in, for and across Africa with a deep specialisation in natural resources. Closer to home, our aspiration is to be the dominant CIB franchise in Uganda.
PerformanceDuring the year just concluded, the CIB business delivered revenue of Ushs 209 billion, up 4% year-on-year. Our operating expenses grew 10% year-on-year as we continued to invest in the business for future growth. The business remains focused on maintaining cost discipline to ensure that the goal of shareholder wealth maximisation is realized.
Our balance sheet registered strong growth in 2015 with customer deposits and gross customer loans and advances growing 2% and 47% year-on-year respectively. We are also pleased to note that our off-balance sheet trade products grew 52% year-on-year, in line with our aspiration to be the leading Trade Finance bank in Uganda.
New productsIn the course of the year, we rolled out a number of new products. Our Global Markets business introduced Callable Forwards, Funded Forwards, Interest Rate Swaps and Cross-Currency Swaps.
Furthermore, in partnership with MTN (U) Ltd, we rolled out Uganda Revenue Authority tax payments and Makerere University tuition payments using the Mobile Money platform. We believe that these new products will position us to better support our clients’ ambitions and offer increased convenience for our clients.
EDWIN MUCAI (Ag)HEAD,CIB
BUSINESS REvIEW
Business Unit Review (continued)
28 Stanbic Bank Uganda Limited Annual Report and Financial Statements for the year ended 31 December, 2015
29Stanbic Bank Uganda Limited Annual Report and Financial Statements for the year ended 31 December, 2015
“Planning for growth in a hotly
contested market?”
Corporate and Investment Banking
“Go wherethe growth is”
Ushs 75bn Corporate Bond
Lead Arranger
Stanbic Bank Uganda was the Lead Arranger for the Ushs 75 billion Corporate Bond for Kakira Sugar Limited. We yet again demonstrated our investment banking capability across Uganda and the continent.
Stanbic Bank
www.stanbicbankuganda.co.ug/cib

30 Stanbic Bank Uganda Limited Annual Report and Financial Statements for the year ended 31 December, 2015
MTN AD
“Are you a contractor, supplier or trader?”
“Stanbic Bank Trade Finance has
made bidding easy.”
Stanbic Bank offers unsecured Bid and Tender Bonds which offers accessibility for supply contracts from various private and public entities for your business. Same day processing, together with no requirement for collateral builds our partnership for your growth. For more information, please visit your nearest branch or contactStanbic Bank Trade Finance, Business Banking on 0417 155831/2/3, 0417 155824 E-mail: [email protected]
Stanbic BankTerms and Conditions apply
31Stanbic Bank Uganda Limited Annual Report and Financial Statements for the year ended 31 December, 2015
Risk overviewStanbic Bank Uganda Limited has a defined risk appetite, approved by the Board, which establishes a direct link between its strategy, financial performance, risk management and available financial resources. The Bank’s risk appetite framework operationalises the concept of risk appetite and sets out the structures for the cascading, monitoring and management of risk appetite throughout the organisation.
Risk management frameworkThe management of risk lies at the heart of our business. One of the main risks we incur arises from extending credit to customers through our trading and lending operations. Beyond credit risk, we are also exposed to a range of other risk types such as market, liquidity, operational, reputational and other risks that are inherent to our strategy, product range and geographical coverage.
Effective risk management is fundamental to being able to generate profits consistently and sustainably and is thus an integral part of the financial and operational management of the Bank.
Risk governanceUltimate responsibility for setting our risk appetite and for the effective management of risk rests with the Board. Acting within an authority delegated by the Board, the Board Risk Management Committee (BRMC), whose membership is represented in executive and non-executive directors of the Bank, has responsibility for oversight and review of prudential risks including but not limited to credit, market, capital, liquidity and operational. It reviews the Bank’s overall risk appetite and makes recommendations thereon to the Board. Its responsibilities also include reviewing the appropriateness and effectiveness of the Bank’s risk management systems and controls, considering the implications of material regulatory change proposals, ensuring effective due diligence on material transactions. The BRMC receives regular reports on risk management, including our portfolio trends, policies and standards, stress testing, liquidity and capital adequacy, and is authorised to investigate or seek any information relating to an activity within its terms of reference.
The Asset and Liability Committee (ALCO) is responsible for the management of capital and the establishment of, and compliance with, policies relating to balance sheet management, including management of our liquidity, capital adequacy and structural foreign exchange and interest rate risk.
The Board Credit Committee is responsible for ensuring that effective credit governance is in place in order to provide for the adequate management, measurement, monitoring and control of credit risk including country risk.
Risk management cultureWe are cognisant of the fact that people are our most valuable asset and are core to the establishment of a positive and responsible risk management culture.
To that end, we continue to invest in the capability of our people through carefully designed initiatives and programmes towards embedding a positive risk management culture in the Bank.
A description of Stanbic Bank Uganda Limited’s approach to risk management covering a summary of the overall methodology and the management of individual types of risks is as expounded below.
Roles and ResponsibilitiesRoles and responsibilities for risk management are defined under a Three lines of Defence model. Each line of defence describes a specific set of responsibilities for risk management and control:
• First line of defence: all employees are required to ensure the effective management of risks within the scope of their direct organisational responsibilities. Business, function and geographic heads are accountable for risk management in their respective businesses and functions, and for locations where they have governance responsibilities.
• Second line of defence: this comprises the risk control owners, supported by their respective control functions. Risk control owners are responsible for ensuring that the risks within the scope of their responsibilities remain within appetite. The scope of a risk control owner’s responsibilities is defined by a given risk type and the risk management processes that relate to that risk type. These responsibilities cut across the Bank and are not constrained by functional, business and regional boundaries. The major risk types are described individually in the following sections.
• Third line of defence: the independent assurance provided by the Internal Audit function (IA). Its role is defined and overseen by the Audit Committee.
The findings from the IA’s audits are reported to all relevant management and governance bodies – accountable line managers, relevant oversight function and committee or committees of the Board.
IA provides independent assurance of the effectiveness of management’s control of its own business activities (the first line) and of the processes maintained by the Risk and Control Functions (the second line). As a result, the IA provides assurance that the overall system of control effectiveness is working as required within the Risk Management Framework.
The Bank’s risk management framework is based on a well-established governance process, with different lines of defence and relies both on individual responsibility and collective oversight, supported by a comprehensive reporting and escalation process. This approach balances stringent corporate oversight with independent risk management structures within the business units.
Risk management in Banking activitiesThe management of all significant risks to Stanbic Bank Uganda Limited and the general Banking industry in Uganda are discussed below.
credit riskThe Bank has set in place comprehensive resources, expertise and controls to ensure efficient and effective management of credit risk, specifically in the Banking activities described below.
• In lending transactions; credit risk arises through non-performance by a counter party for credit facilities utilised. Such facilities are typically loans and advances, including the advancement of securities and contracts to support customer obligations (such as letters of credit and performance guarantees).
• In trading activities; credit risk arises due to non-performance by a counter party for payments linked to trading related financial obligations.
Approach to managing credit riskCredit risk is managed by means of a governance structure with clearly defined mandates and delegated authorities and also the use of relevant credit assessment tools in evaluation of new and outstanding facilities for the customers under the respective business units discussed below.
Corporate & Investment Banking (CIB)The use of risk rating models combined with an in-depth knowledge and understanding of each customer is essential in assessing the credit risk of each CIB counter party. A consistent credit rating framework is in place to assist the Bank in making credit decisions on new commitments and in managing the portfolio of existing exposures. The probabilities of default under these models are an important component of the formal credit assessment process of new and existing business. The validation and ongoing enhancement of these models is a continuous focus area to ensure that the tools used in these credit assessments remain relevant and adequate.
Risk management and control
RISK REvIEW
32 Stanbic Bank Uganda Limited Annual Report and Financial Statements for the year ended 31 December, 2015
personal and Business Banking (pBB) The nature of the products and strength of historical data is a fundamental dependence under credit risk management for the personal and business Banking customers. A diverse range of performance analysis techniques are applied across product sets and potential credits in recognition of the differing asset, maturity and individual or business profiles.
Rehabilitation & recovery forms a key component of the credit cycle. All credit portfolios are closely monitored on a regular basis to evaluate the level of risk assumed against expected risk levels. This role is competently executed by a fully-fledged business support & recovery unit within the credit function.
Liquidity riskLiquidity risk is the risk that we either do not have sufficient financial resources available to meet our obligations as they fall due, or can only access these financial resources at excessive cost. It is our policy to maintain adequate liquidity at all times and for all currencies, and hence to be in a position to meet obligations as they fall due. We manage liquidity risk both on a short-term and structural basis. In the short term, our focus is on ensuring that the cash flow demands can be met where required. In the medium term, the focus is on ensuring that the balance sheet remains structurally sound and is aligned to our strategy.
The nature of Banking and trading activities results in a continuous exposure to liquidity risk. The Bank’s liquidity risk management framework, however, is designed to measure and manage the liquidity position at various levels to ensure that all payment obligations can be met under both normal and stressed conditions without incurring unbearable costs.
Approach to managing liquidity riskThe Board is the responsible governing body that approves our liquidity management policies. The Asset and Liability Committee (ALCO) that receives delegated authority from the board, is responsible for managing Liquidity within pre-defined liquidity limits and in compliance with liquidity policies and practices, as well as regulatory requirements.
The principal uncertainties for liquidity risk are that customers withdraw their deposits at a substantially faster rate than expected, or that asset repayments are not received on the expected maturity date. To mitigate these uncertainties, we have structured our funding base to be diverse and largely customer- driven. While customer deposits are of short tenor (mainly current accounts), the behaviour is that they tend to be very stable.
In addition, we have contingency funding plans including a portfolio of liquid assets that can be realised if a liquidity stress occurs, as well as ready access to wholesale funds under normal market conditions.
Liquidity contingency plans are supplemented by an extensive early warning indicators methodology supported by a clear and decisive crisis response strategy. These plans are reviewed periodically for relevance and reliability.
The following elements are incorporated as part of a cohesive liquidity management process.
• Liquidity management at currency level
• Rolling forecast for demand and supply of overnight and term liquidity
• Undertaking regular liquidity scenario/stress testing;
The cumulative impact of the above elements is monitored on a monthly basis by the Bank’s Asset and Liability Committee (ALCO) and the process is underpinned by a system of extensive internal and external controls. The latter includes the application of purpose- built techniques, documented processes and procedures, independent oversight by risk management and regular independent reviews and evaluations of the effectiveness of the system.
Active liquidity and funding management is an integrated effort across a number of functional areas. Short-term cash flow projections are used to plan for and meet the day-to-day requirements of the business, including adherence to prudential and ALCO requirements. Long-term funding needs are derived from the projected balance sheet structures and positions are regularly updated to ensure the Bank’s adherence to all funding regulations.
market riskWe recognise market risk as the potential for loss of earnings or economic value due to adverse changes in financial market rates or prices. Our exposure to market risk arises principally from customer-driven transactions. The objective of our market risk policies and processes is to obtain the best balance of risk and return while meeting customers’ requirements.
Market risk exposures as a result of trading activities are contained within the Bank’s Corporate & Investment Banking trading operations. The board grants authority to take on market risk exposure to the ALCO. The Bank manages market risk through a range of market risk limits and triggers. It uses a suite of risk measurement methodologies and tools to establish limits, including Value at Risk (VaR), Securities revaluation models (Mark to Market), PV01 (Present value of the nominal at the adverse shock of interest rates by one basis point), stress testing, loss triggers and other basic risk management measures and internal controls.
A clear segregation of duties as well as independent reporting lines exists between the Bank’s Global Markets, Global Markets Operations and Market risk functions.
Approach to managing market riskMarket risk exposure principally involves the management of the potential adverse effect of interest/ Foreign Exchange rate movements the economic value of equity. This structural interest rate risk is caused by the differing re-pricing characteristics of Banking assets and liabilities. The governance framework adopted for the management of structural interest rate risk and Foreign Exchange volatility mirrors that of liquidity risk management in terms of committee structures and the setting of standards, policies and limits. This is also true for the monitoring process and internal controls.
non-trading interest rate riskInterest rate risk from non-trading book portfolios is managed by the Treasury desk under the supervision of the Asset and Liability Committees (ALCO). Treasury deals in the market in approved financial instruments in order to manage the net interest rate risk, subject to approved risk limits.
operational riskOperational risk is the potential for loss resulting from the inadequacy of, or a failure in internal processes, people, systems or external events.
The Bank recognises the significance of operational risk, and the fact that it is inherent in all business units and activities. The Bank’s operational risk governance standard codifies the core governing principles for operational risk management and defines a common framework with the basic components for the identification, assessment, management, monitoring and reporting of operational risk.
This common framework defines the minimum requirements whilst ensuring an element of flexibility for each business unit’s particular operating environments. This framework is further supported by a set of comprehensive operational risk management policies.
Approach to managing operational riskThe Bank’s approach to managing operational risk has been the adoption of practices that are fit for increasing the efficiency and effectiveness of the Bank’s resources, minimising losses and effectively utilising opportunities. This approach is aligned to the Bank’s enterprise-wide risk management framework and adopts sound risk management practices recommended by the Basel II Accord’s sound practices for the management and supervision of operational risk and the Bank of Uganda risk management guidelines, among others.
The Bank’s independent operational risk management function performs control and oversight roles, over the implementation of a set of appropriate policies, governance standards and tools. The tools include:
RISK REvIEW
Risk management and control (continued)
33Stanbic Bank Uganda Limited Annual Report and Financial Statements for the year ended 31 December, 2015
RISK REvIEW
• A centralized operational incidents database providing management reports used to identify improvements to processes and controls arising from incident trends.
• Risk and control self-assessments through which existing and potential future risks and their related controls are identified and assessed.
• Key risk indicators which measure specific factors to provide an early warning to proactively address potential exposures.
• An escalation matrix that supports the identification, assessment, quantification and timely escalation of risk incidents to management for appropriate decision making.
• A robust business resilience framework, with disaster recovery plans to ensure that the Bank appropriately manages the adverse impact from unforeseeable disasters to the business.
• A formal information risk management framework is in place to facilitate the management of information risk in the Bank is in accordance with best practice, applicable laws and regulations. The Bank is committed to creating and maintaining an environment that protects the Bank’s information resources, including third-party information.
• A fully fledged financial crime control unit charged with forensic investigations, fraud prevention and physical security. The Unit is mandated by the board risk management committee, and is responsible for supporting the implementation of the Bank’s fraud risk management framework.
• An independent operational risk function, tasked with the effective implementation of the Bank’s operational risk management framework. Mandated by the Board Risk Management Committee, the strategic approach focuses on operational risk identification, assessment, quantification and control.
The Bank further maintains a comprehensive insurance programme to cover residual risk as a result of losses from fraud, theft, professional liability claims, and damage to physical assets while additionally operating comprehensive internal audit and risk assurance reviews on all operational aspects of the Bank.
Financial crime controlAn independent Financial Crime Control unit within the risk management function is charged with forensic investigations and fraud prevention. This function ensures the effective implementation of the Bank’s risk management framework through the appropriate management of fraud risk.
Business ResilienceThe Bank’s ability to ensure the resilience and continuity of its critical business functions despite serious disruptive incidents or disasters and to ensure the recovery of such critical functions to an operational state within acceptable time frames is crucial to its financial success.
Within the Bank, Business Resilience is a specialist operational risk discipline enabled by three capabilities, which are integrated in a single framework to provide an agile, cohesive and coordinated suite of point-in-time response and recovery interventions to counter the financial and reputational impacts of worst case operational disruptions. The three business resilience capabilities within the Bank are Emergency Response, Crisis Management and Business Continuity Management (BCM) which includes IT Service Continuity.
The Bank periodically and as appropriate tests its business resilience plans, IT disaster recovery plan, conducts evacuation drills and simulation exercises across all its points of representation with a view of validating the adequacy, relevance, reliability and resilience of its business resilience framework.
Information Risk managementInformation Risk is defined as the risk of accidental or intentional unauthorized use, modification, disclosure or destruction of information resources, which would compromise the confidentiality, integrity and availability of information and which would potentially harm the business.
The approach to the management of information risk in the Bank is in accordance with best practice, applicable laws and regulations. The Bank is committed to creating and maintaining an environment that protects the Bank’s information resources, including third-party information.
We recognise that Banking is fast evolving from traditional delivery, into more sophisticated digital service channels that do not require direct interaction with clients. As expected, this has placed more emphasis on the importance of safeguarding Bank and customer information, electronic communications, mobile devices and computing and IT operations security to ensure that appropriate security controls are incorporated into business applications.
compliance riskCompliance is an independent core risk management function, with unrestricted access to the Board Risk Management Committee, the Chief Executive and the Chairman of the Board. The Bank is subject to extensive supervisory and regulatory regimes. Executive management implements the Bank’s compliance risk framework, by ensuring that the Bank conducts its business within the set legal and regulatory requirements and guidelines.
The Bank operates a centralized compliance risk management structure run by a fully equipped specialised unit that grants oversight on all compliance related matters. The Compliance unit provides leadership and guidance on compliance with Anti-money laundering, terrorist financing, occupational health and safety and any other emerging legislative developments. The unit also, provides training and awareness on regulatory developments.
money laundering control and Anti-Terrorism FinancingThe issue of Anti-Money Laundering and Anti-Terrorism Regulations in December, 2015 emphasizes the importance of having an effective compliance culture. Legislation pertaining to money laundering and terrorist financing control imposes significant record keeping and customer identification requirements on financial institutions, as well as obligations to detect, prevent and report money laundering and terrorist financing incidents to Financial Intelligence Authority. The Bank continues to strengthen its anti-money laundering and terrorist financing measures as the regulatory environment becomes more dynamic.
occupational health and safety The health and safety of employees, clients and other stakeholders continues to be a priority. The Bank seeks to effectively identify, reduce or control accidents or injuries to employees, contractors and clients. The Bank continues to focus on ensuring compliance with current legal and regulatory framework and ensuring that occupational health and safety procedures are closely linked to the operational needs of the business.
Taxation riskTaxation risk is the possibility of suffering loss, financial or otherwise, as a result of the misapplication of tax systems (whether in legislative systems, rulings or practices) applicable to the entire spectrum of taxes and other fiscal obligations to which the Bank is subject.
The Bank fulfills its responsibilities under tax law in relation to compliance, planning or client service matters. Tax law includes all responsibilities which the Bank may have in relation to company taxes, personal taxes, capital gains taxes, indirect taxes and tax administration.
The identification and management of tax risk is the primary objective of the Bank tax and regulatory function, and this objective is achieved through the application of a tax- risk matrix approach, which measures the fulfillment of tax responsibilities against the specific requirements of each category of tax to which the Bank is exposed, in the context of the various types of activity the Bank conducts.
Risk management and control (continued)
•
34 Stanbic Bank Uganda Limited Annual Report and Financial Statements for the year ended 31 December, 2015
Reputational riskSafeguarding the Bank’s reputation is of paramount importance to its continued operations and is the responsibility of every member of staff. Reputational risks can arise from social, ethical or environmental issues, or as a consequence of operational risk events. The Bank’s strong reputation is dependent on the way it conducts its business, but it can also be affected by the way in which its clients, to whom it provides financial services, conduct themselves.
Effective management of all operating activities is emphasised to establish a strong internal control framework to minimise the risk of operational and financial failure and to ensure that a full assessment of reputational implications is made before strategic decisions are taken. The Bank sets clear standards and policies on all major aspects of the business and these standards and policies are integral to the Bank’s system of internal controls and are communicated through procedures, manuals and appropriate staff training.
Business/ Strategic riskStrategic risk is the risk of adverse outcomes resulting from a weak competitive position or from a choice of strategy, markets, products, activities or structures. Major potential sources of strategic risk include revenue volatility due to factors such as macroeconomic conditions, inflexible cost structures, uncompetitive products or pricing, and structural inefficiencies.
It is not cost effective to attempt to eliminate all business or strategic risk and it would not, in any event, be possible to do so. Events of immaterial significance are expected to occur and are accepted as inevitable; events of material significance are rare and the Bank seeks to reduce the risk from these in a framework consistent with its expected risk profile and appetite.
Independent AssuranceThe Bank’s internal audit function operates under a mandate from the Board Audit Committee. The Internal audit’s primary objective is to provide assurance to the audit committee on the quality of controls in the Bank’s operational activities. It assists the executive management teams in meeting their business objectives by examining the Bank’s activities, assessing the risks involved and evaluating the adequacy and effectiveness of processes, systems and controls to manage these risks. A risk based audit approach has been adopted. Material or significant control weaknesses and planned management remedial actions are reported to management and Board Audit Committee. These issues are tracked to ensure that agreed remedial actions have been implemented. Overdue issues are also reported to the Board Audit Committee on a quarterly basis.
capital adequacy Minimum requirementsThe capital adequacy ratio reflects the capital strength of an entity compared to the minimum requirement set out by the regulator.
Stanbic Bank Uganda Limited is required to meet the Central Bank capital requirements, set at a minimum capital adequacy ratio of 8% (based on core capital) and 12% (based on total capital). These regulations are based on guidelines developed by the Bank for International Settlements.
Our approach to managing capitalOur approach to capital management is to maintain a strong capital base to support the development of our business, to meet regulatory capital requirements at all times.
Strategic, business and capital plans are drawn up annually covering a three-year horizon and are approved by the Board. The capital plan ensures that adequate levels of capital and an optimum mix of the different components of capital are maintained to support our strategy.
The ALCO is responsible for the ongoing assessment of the demand for capital and the updating of the Bank’s capital plan. The capital plan takes the following into account:
• Current regulatory capital requirements and our assessment of future standards
• Demand for capital due to business growth forecasts, loan impairment outlook and market shocks or stresses
• Available supply of capital and capital raising options. The Bank formulates a capital plan with the help of internal models and other quantitative techniques.
The Bank uses a capital model to assess the capital demand for material risks, and supports this with our internal capital adequacy assessment. Other internal models help to estimate potential future losses arising from credit, market and other risks, and, using regulatory formulae, the amount of capital required to support them.
In addition, the models enable the Bank to gain an enhanced understanding of its risk profile, for example, by identifying potential concentrations and assessing the impact of portfolio management actions. Stress testing and scenario analysis are an integral part of capital planning, and are used to ensure that the Bank’s internal capital adequacy assessment considers the impact of extreme but plausible scenarios on its risk profile and capital position. They provide an insight into the potential impact of significant adverse events and how these could be mitigated through appropriate management actions. The
capital modelling process is a key part of our management discipline. A strong governance and process framework is embedded in our capital planning and assessment methodology. The key capital management committee is the Asset and Liability Committee (ALCO).
Stress Testing FrameworkStress testing is a management tool and is used to assess the vulnerability of the Banks key resources, namely; profitability, capital, liquidity, and reputation, to a range of adverse events. Stress testing provides a forward looking assessment of risk. It assists in the proactive detection of vulnerabilities, so that mitigating actions can be assessed and implemented timely.
The stress testing process supports a number of business processes that include but are not limited to strategic planning and financial budgeting, liquidity planning, and risk appetite definition.
The Bank’s stress testing programme uses one or a combination of the following sensitivity or scenario analysis methods to address various stress testing requirements.
macroeconomic stress testingMacroeconomic stress testing is conducted across major risk types, on an integrated basis, for a range of economic scenarios. The analysis is based on severe but plausible macroeconomic shocks that may affect a number of different risk factors simultaneously, and the resulting impact, after consideration of mitigating actions, on the income statement, balance sheet and regulatory and economic capital demand and supply of the Bank.
management judgement and expert AnalysisThis form of analysis focuses on entity-specific vulnerabilities. The sensitivities are based on management’s understanding of the business model and vulnerabilities in the business.
Book DowngradeThis is a form of sensitivity analysis approach built on a conservative assumption that most credit counterparties are likely to be downgraded in a stress scenario and or environment.
2016 Risk outlookWe are in the business of taking calculated risks to generate shareholder value, and we seek to contain and mitigate these risks to ensure they remain within our risk appetite and are adequately compensated.
The key uncertainties we face in the coming year are set out below. This should not be regarded as a complete and comprehensive statement of all potential risks and uncertainties that we may experience.
RISK REvIEW
Risk management and control (continued)
35Stanbic Bank Uganda Limited Annual Report and Financial Statements for the year ended 31 December, 2015
RISK REvIEW
Stressed macroeconomic environmentMacroeconomic conditions have an impact on personal expenditure and consumption, demand for business products and services, the debt service burden of consumers and businesses, the general availability of credit for retail and corporate borrowers and the availability of capital and liquidity funding for our business. All these factors have the capacity to impact our performance.
Continued recovery in the US economy and the recent increase of the United States Federal Reserve interest rates will further strengthen the dollar against global currencies. Oil prices also continue to remain low. The resulting impact of these events would affect foreign direct investment to the country and impact the value of the Shilling.
We balance risk and return, taking account of changing conditions through the economic cycle, and monitor economic trends very closely. We conduct stress tests and scenario analysis to assess the effects of extreme but plausible trading conditions on our portfolio and also continuously review the suitability of our risk policies and controls. We manage credit exposures following the principle of
diversification across products, client and customer segments. This provides for strong resilience against economic shocks in one or more of our portfolios.
Regulatory changesOur business continues to be subject to an evolving and complex regulatory framework comprising legislation, regulation and codes of practice. The nature, impact and timing of such future changes are not always predictable and could adversely impact or present opportunities our strategic interests. The passing of the FIA amendment bill in January of 2016 offers us Bancassurance and Agency Banking as key opportunities whilst we continually assess the impact of mobile money regulation.
Briefly;
• Agent Banking and Islamic Banking; will provide Banks with the platform to further simplify and diversify service to our broad portfolio of customers whilst facilitating penetration of financial services.
• Bancassurance;willenableustoprovideinsurance services to our own clients with the extended knowledge of their financial needs.
Risk of Fraud and other criminal actsThe Banking industry will always be a target for third parties seeking to defraud, to disrupt legitimate economic activity, or to facilitate other illegal activities. The risk posed by such criminal activity is growing as criminals become more sophisticated and as they take advantage of the increasing use of technology and the internet. Cyber-crime is increasingly becoming a global threat and becoming more co-ordinated. We continue to exercise vigilance in the management of fraud risk in our people, processes, and systems and in our dealings with customers and other stakeholders. We have a broad range of measures in place to monitor and mitigate this risk. Controls are embedded in our policies and procedures across a wide range of our activities, such as origination, recruitment, physical and information security. We have a set of techniques, tools and activities to detect and respond to crime, in its many forms. We will increase collaboration with our peers, regulators and other stakeholders to consolidate our efforts.
Risk management and control (continued)
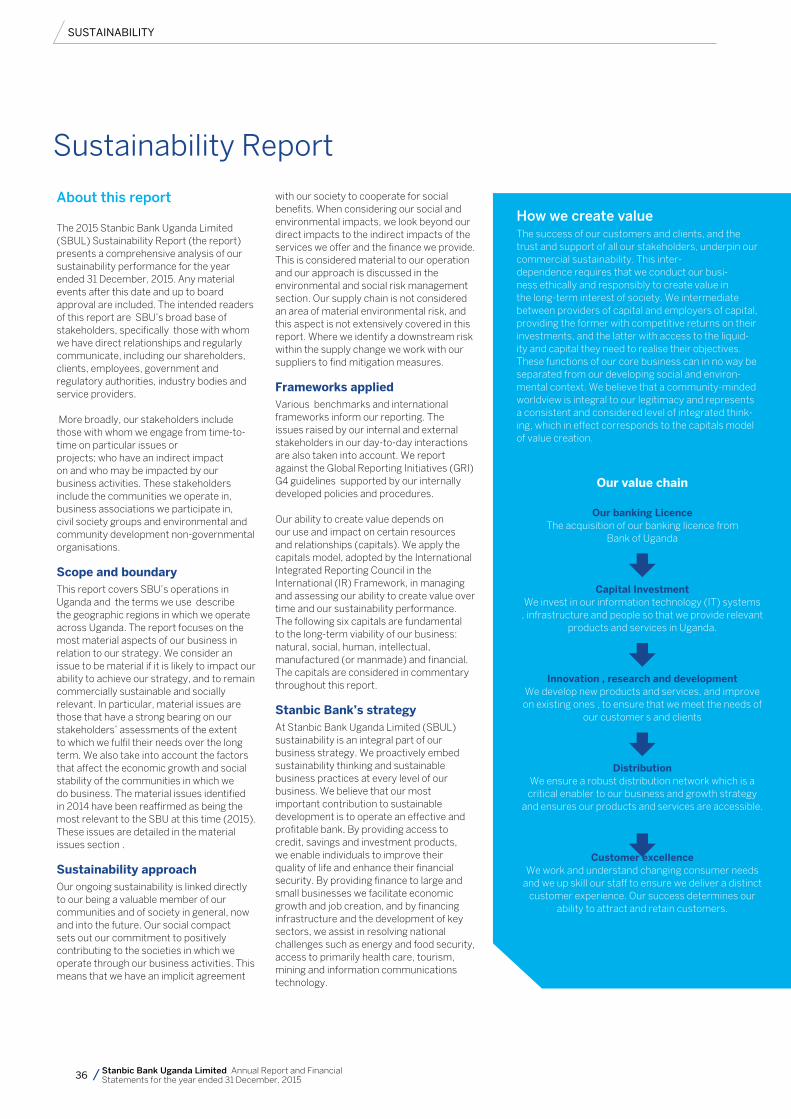
36 Stanbic Bank Uganda Limited Annual Report and Financial Statements for the year ended 31 December, 2015
Sustainability Report
About this report
The 2015 Stanbic Bank Uganda Limited (SBUL) Sustainability Report (the report) presents a comprehensive analysis of our sustainability performance for the year ended 31 December, 2015. Any material events after this date and up to board approval are included. The intended readers of this report are SBU’s broad base of stakeholders, specifically those with whom we have direct relationships and regularly communicate, including our shareholders, clients, employees, government and regulatory authorities, industry bodies and service providers.
More broadly, our stakeholders include those with whom we engage from time-to-time on particular issues orprojects; who have an indirect impact on and who may be impacted by our business activities. These stakeholders include the communities we operate in, business associations we participate in, civil society groups and environmental and community development non-governmental organisations.
Scope and boundaryThis report covers SBU’s operations in Uganda and the terms we use describe the geographic regions in which we operate across Uganda. The report focuses on the most material aspects of our business in relation to our strategy. We consider an issue to be material if it is likely to impact our ability to achieve our strategy, and to remain commercially sustainable and socially relevant. In particular, material issues are those that have a strong bearing on our stakeholders’ assessments of the extent to which we fulfil their needs over the long term. We also take into account the factors that affect the economic growth and social stability of the communities in which we do business. The material issues identified in 2014 have been reaffirmed as being the most relevant to the SBU at this time (2015). These issues are detailed in the material issues section .
Sustainability approachOur ongoing sustainability is linked directly to our being a valuable member of our communities and of society in general, now and into the future. Our social compact sets out our commitment to positively contributing to the societies in which we operate through our business activities. This means that we have an implicit agreement
with our society to cooperate for social benefits. When considering our social and environmental impacts, we look beyond our direct impacts to the indirect impacts of the services we offer and the finance we provide. This is considered material to our operation and our approach is discussed in the environmental and social risk management section. Our supply chain is not considered an area of material environmental risk, and this aspect is not extensively covered in this report. Where we identify a downstream risk within the supply change we work with our suppliers to find mitigation measures.
Frameworks appliedVarious benchmarks and international frameworks inform our reporting. The issues raised by our internal and external stakeholders in our day-to-day interactions are also taken into account. We report against the Global Reporting Initiatives (GRI) G4 guidelines supported by our internally developed policies and procedures. Our ability to create value depends on our use and impact on certain resources and relationships (capitals). We apply the capitals model, adopted by the International Integrated Reporting Council in the International (IR) Framework, in managing and assessing our ability to create value over time and our sustainability performance. The following six capitals are fundamental to the long-term viability of our business: natural, social, human, intellectual, manufactured (or manmade) and financial. The capitals are considered in commentary throughout this report.
Stanbic Bank’s strategyAt Stanbic Bank Uganda Limited (SBUL) sustainability is an integral part of our business strategy. We proactively embed sustainability thinking and sustainable business practices at every level of our business. We believe that our most important contribution to sustainable development is to operate an effective and profitable bank. By providing access to credit, savings and investment products, we enable individuals to improve their quality of life and enhance their financial security. By providing finance to large and small businesses we facilitate economic growth and job creation, and by financing infrastructure and the development of key sectors, we assist in resolving national challenges such as energy and food security, access to primarily health care, tourism, mining and information communications technology.
how we create valueThe success of our customers and clients, and the trust and support of all our stakeholders, underpin our commercial sustainability. This inter- dependence requires that we conduct our busi-ness ethically and responsibly to create value in the long-term interest of society. We intermediate between providers of capital and employers of capital, providing the former with competitive returns on their investments, and the latter with access to the liquid-ity and capital they need to realise their objectives. These functions of our core business can in no way be separated from our developing social and environ-mental context. We believe that a community-minded worldview is integral to our legitimacy and represents a consistent and considered level of integrated think-ing, which in effect corresponds to the capitals model of value creation.
our value chain
our banking LicenceThe acquisition of our banking licence from
Bank of Uganda
capital InvestmentWe invest in our information technology (IT) systems
, infrastructure and people so that we provide relevant products and services in Uganda.
Innovation , research and developmentWe develop new products and services, and improve on existing ones , to ensure that we meet the needs of
our customer s and clients
DistributionWe ensure a robust distribution network which is a
critical enabler to our business and growth strategy and ensures our products and services are accessible.
customer excellenceWe work and understand changing consumer needs
and we up skill our staff to ensure we deliver a distinct customer experience. Our success determines our
ability to attract and retain customers.
SUSTAINABILITy

37Stanbic Bank Uganda Limited Annual Report and Financial Statements for the year ended 31 December, 2015
Twice as quick.Twice as easy.
Transfer money from your Stanbic Bank account
to your mobile money account.
This service is accessible by MTN and Airtel subscribers.For more information call 0800 250250or email us at [email protected]
Standard Bank group securities is regulated by the Capital Markets Authority
Stanbic Bank
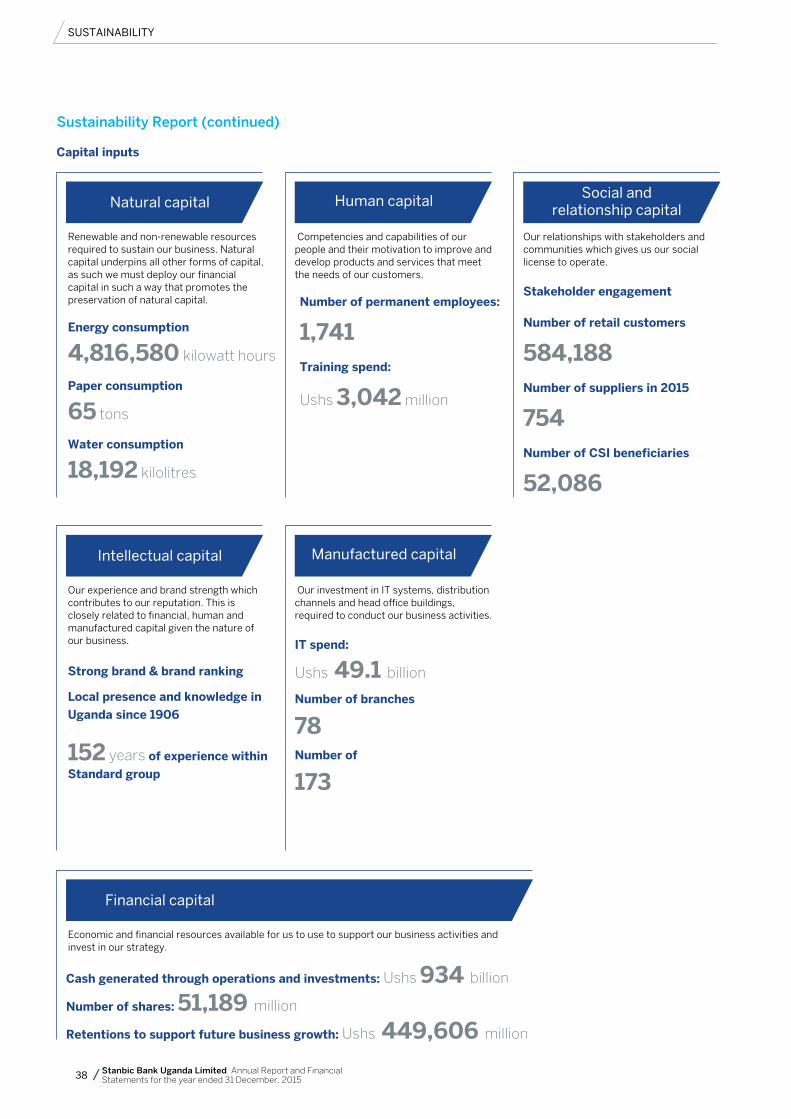
38 Stanbic Bank Uganda Limited Annual Report and Financial Statements for the year ended 31 December, 2015
Renewable and non-renewable resources required to sustain our business. Natural capital underpins all other forms of capital, as such we must deploy our financial capital in such a way that promotes the preservation of natural capital.
Our experience and brand strength which contributes to our reputation. This is closely related to financial, human and manufactured capital given the nature of our business.
Competencies and capabilities of our people and their motivation to improve and develop products and services that meet the needs of our customers.
Our investment in IT systems, distribution channels and head office buildings, required to conduct our business activities.
Our relationships with stakeholders and communities which gives us our social license to operate.
Natural capital
Intellectual capital
human capital
Manufactured capital
Social and relationship capital
capital inputs
energy consumption
4,816,580 kilowatt hours
Paper consumption
65 tons
Water consumption
18,192 kilolitres
Strong brand & brand ranking
Local presence and knowledge in
uganda since 1906
152 years of experience within
Standard group
Economic and financial resources available for us to use to support our business activities and invest in our strategy.
Financial capital
cash generated through operations and investments: Ushs 934 billion
number of shares: 51,189 million
Retentions to support future business growth: Ushs 449,606 million
Stakeholder engagement
number of retail customers
584,188number of suppliers in 2015
754number of cSI beneficiaries
52,086
number of permanent employees:
1,741Training spend:
Ushs 3,042 million
IT spend:
Ushs 49.1 billion
number of branches
78number of
173
SUSTAINABILITy
Sustainability Report (continued)
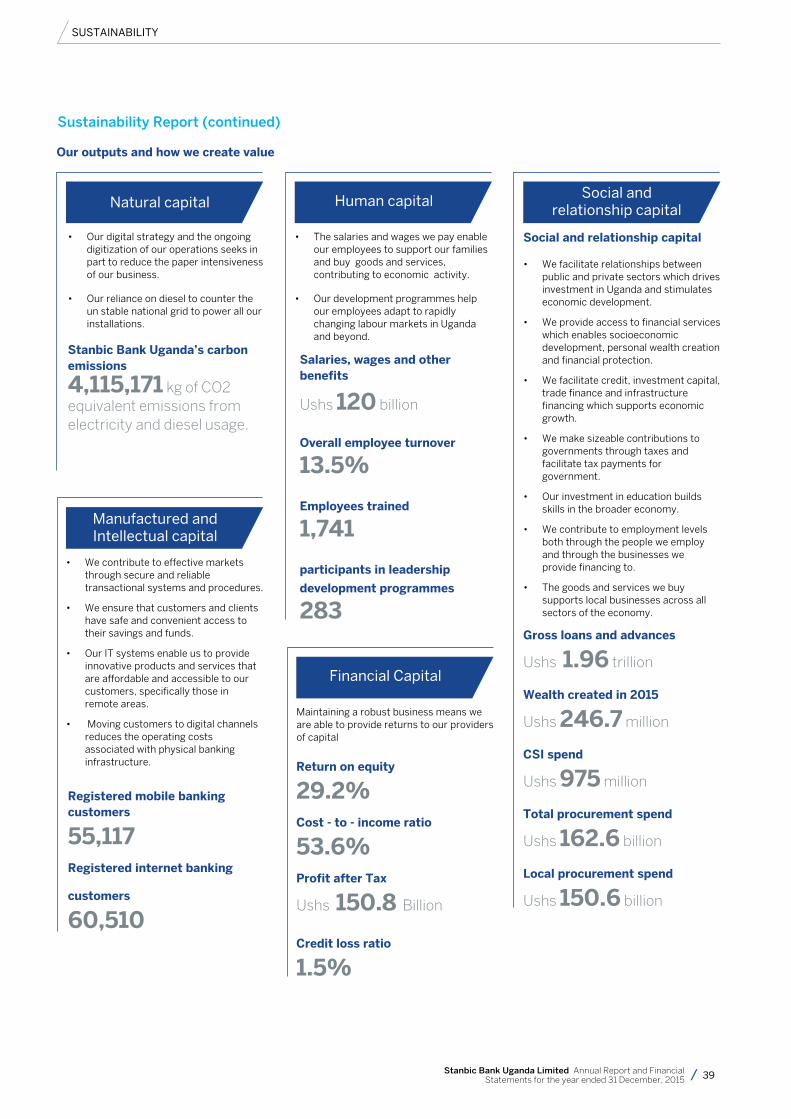
39Stanbic Bank Uganda Limited Annual Report and Financial Statements for the year ended 31 December, 2015
• Ourdigitalstrategyandtheongoingdigitization of our operations seeks in part to reduce the paper intensiveness of our business.
• Ourrelianceondieseltocountertheun stable national grid to power all our installations.
• Thesalariesandwageswepayenableour employees to support our families and buy goods and services, contributing to economic activity.
• Ourdevelopmentprogrammeshelpour employees adapt to rapidly changing labour markets in Uganda and beyond.
• Wecontributetoeffectivemarketsthrough secure and reliable transactional systems and procedures.
• Weensurethatcustomersandclientshave safe and convenient access to their savings and funds.
• OurITsystemsenableustoprovideinnovative products and services that are affordable and accessible to our customers, specifically those in remote areas.
• Movingcustomerstodigitalchannelsreduces the operating costs associated with physical banking infrastructure.
Maintaining a robust business means we are able to provide returns to our providers of capital
Social and relationship capital
• Wefacilitaterelationshipsbetweenpublic and private sectors which drives investment in Uganda and stimulates economic development.
• Weprovideaccesstofinancialserviceswhich enables socioeconomic development, personal wealth creation and financial protection.
• Wefacilitatecredit,investmentcapital,trade finance and infrastructure financing which supports economic growth.
• Wemakesizeablecontributionstogovernments through taxes and facilitate tax payments for government.
• Ourinvestmentineducationbuildsskills in the broader economy.
• Wecontributetoemploymentlevelsboth through the people we employ and through the businesses we provide financing to.
• Thegoodsandserviceswebuysupports local businesses across all sectors of the economy.
Natural capital human capital
Manufactured and Intellectual capital
Financial Capital
Social and relationship capital
our outputs and how we create value
Stanbic Bank uganda’s carbon emissions
4,115,171 kg of CO2 equivalent emissions from electricity and diesel usage.
gross loans and advances
Ushs 1.96 trillion
Wealth created in 2015
Ushs 246.7 million
cSI spend
Ushs 975 million
Total procurement spend
Ushs 162.6 billion
Local procurement spend
Ushs 150.6 billion
Salaries, wages and other benefits
Ushs 120 billion
overall employee turnover
13.5%
employees trained
1,741
participants in leadership
development programmes
283
Registered mobile banking customers
55,117Registered internet banking
customers
60,510
Return on equity
29.2%cost - to - income ratio
53.6%Profit after Tax
Ushs 150.8 Billion
credit loss ratio
1.5%
SUSTAINABILITy
Sustainability Report (continued)
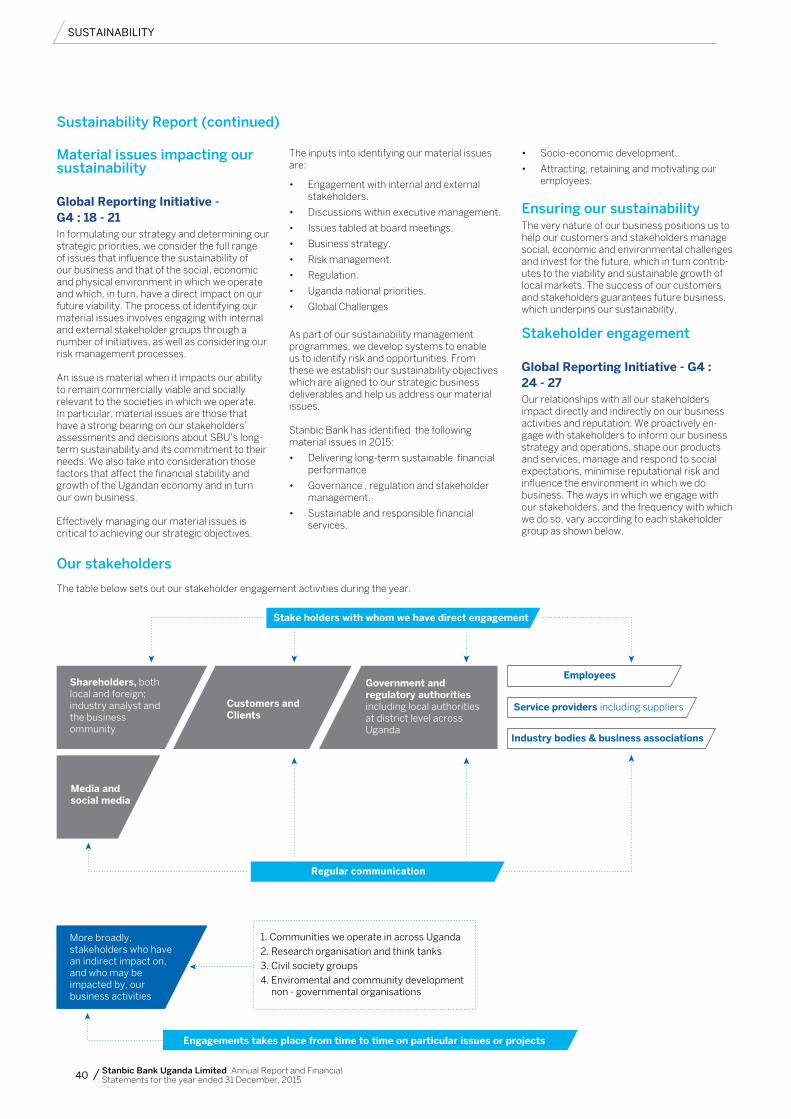
40 Stanbic Bank Uganda Limited Annual Report and Financial Statements for the year ended 31 December, 2015
Material issues impacting our sustainability
global Reporting Initiative - g4 : 18 - 21In formulating our strategy and determining our strategic priorities, we consider the full range of issues that influence the sustainability of our business and that of the social, economic and physical environment in which we operate and which, in turn, have a direct impact on our future viability. The process of identifying our material issues involves engaging with internal and external stakeholder groups through a number of initiatives, as well as considering our risk management processes.
An issue is material when it impacts our ability to remain commercially viable and socially relevant to the societies in which we operate. In particular, material issues are those that have a strong bearing on our stakeholders’ assessments and decisions about SBU’s long-term sustainability and its commitment to their needs. We also take into consideration those factors that affect the financial stability and growth of the Ugandan economy and in turn our own business.
Effectively managing our material issues is critical to achieving our strategic objectives.
The inputs into identifying our material issues are:
• Engagementwithinternalandexternalstakeholders.
• Discussionswithinexecutivemanagement.
• Issuestabledatboardmeetings.
• Businessstrategy.
• Riskmanagement.
• Regulation.
• Ugandanationalpriorities.
• GlobalChallenges
As part of our sustainability management programmes, we develop systems to enable us to identify risk and opportunities. From these we establish our sustainability objectives which are aligned to our strategic business deliverables and help us address our material issues.
Stanbic Bank has identified the following material issues in 2015:
• Deliveringlong-termsustainablefinancialperformance
• Governance,regulationandstakeholdermanagement.
• Sustainableandresponsiblefinancialservices.
• Socio-economicdevelopment.
• Attracting,retainingandmotivatingouremployees.
Ensuring our sustainability The very nature of our business positions us to help our customers and stakeholders manage social, economic and environmental challenges and invest for the future, which in turn contrib-utes to the viability and sustainable growth of local markets. The success of our customers and stakeholders guarantees future business, which underpins our sustainability.
Stakeholder engagement
global Reporting Initiative - g4 : 24 - 27Our relationships with all our stakeholders impact directly and indirectly on our business activities and reputation. We proactively en-gage with stakeholders to inform our business strategy and operations, shape our products and services, manage and respond to social expectations, minimise reputational risk and influence the environment in which we do business. The ways in which we engage with our stakeholders, and the frequency with which we do so, vary according to each stakeholder group as shown below.
SUSTAINABILITy
Stake holders with whom we have direct engagement
Shareholders, both local and foreign; industry analyst and the business ommunity
More broadly, stakeholders who have an indirect impact on, and who may be impacted by, our business activities
Media andsocial media
Government and regulatory authorities including local authorities at district level across Uganda
Customers and Clients
Employees
Service providers including suppliers
Industry bodies & business associations
Regular communication
Engagements takes place from time to time on particular issues or projects
1. Communities we operate in across Uganda
2. Research organisation and think tanks
3. Civil society groups
4. Enviromental and community development non - governmental organisations
our stakeholders
Sustainability Report (continued)
The table below sets out our stakeholder engagement activities during the year.
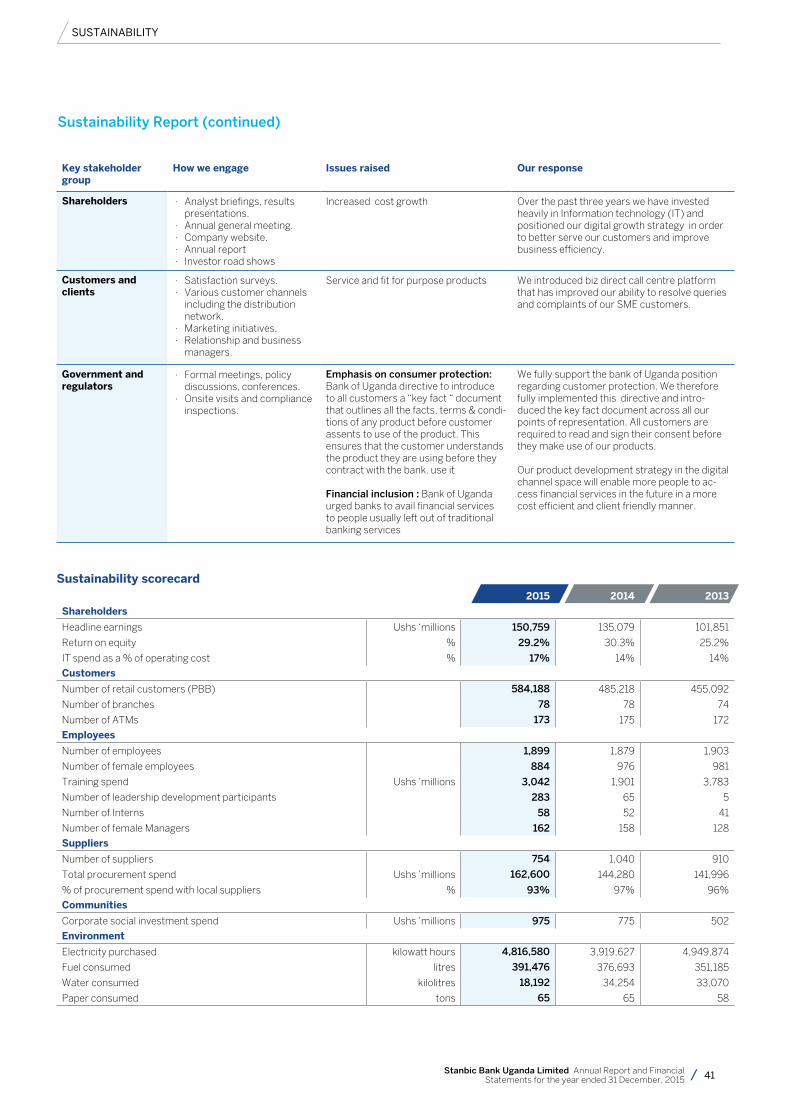
41Stanbic Bank Uganda Limited Annual Report and Financial Statements for the year ended 31 December, 2015
SUSTAINABILITy
Sustainability Report (continued)
key stakeholder group
How we engage Issues raised our response
Shareholders · Analyst briefings, resultspresentations.
· Annual general meeting.· Company website.· Annual report· Investor road shows
Increased cost growth Over the past three years we have invested heavily in Information technology (IT) and positioned our digital growth strategy in order to better serve our customers and improve business efficiency.
customers and clients
· Satisfaction surveys.· Various customer channels
including the distribution network.
· Marketing initiatives.· Relationship and business
managers.
Service and fit for purpose products We introduced biz direct call centre platform that has improved our ability to resolve queries and complaints of our SME customers.
government and regulators
· Formal meetings, policydiscussions, conferences.
· Onsite visits and complianceinspections.
Emphasis on consumer protection: Bank of Uganda directive to introduce to all customers a “key fact “ document that outlines all the facts, terms & condi-tions of any product before customer assents to use of the product. This ensures that the customer understands the product they are using before they contract with the bank. use it
Financial inclusion : Bank of Uganda urged banks to avail financial services to people usually left out of traditional banking services
We fully support the bank of Uganda position regarding customer protection. We therefore fully implemented this directive and intro-duced the key fact document across all our points of representation. All customers are required to read and sign their consent before they make use of our products.
Our product development strategy in the digital channel space will enable more people to ac-cess financial services in the future in a more cost efficient and client friendly manner.
Sustainability scorecard2015 2014 2013
Shareholders
Headline earnings Ushs ‘millions 150,759 135,079 101,851
Return on equity % 29.2% 30.3% 25.2%
IT spend as a % of operating cost % 17% 14% 14%
customers
Number of retail customers (PBB) 584,188 485,218 455,092
Number of branches 78 78 74
Number of ATMs 173 175 172
employees
Number of employees 1,899 1,879 1,903
Number of female employees 884 976 981
Training spend Ushs ’millions 3,042 1,901 3,783
Number of leadership development participants 283 65 5
Number of Interns 58 52 41
Number of female Managers 162 158 128
Suppliers
Number of suppliers 754 1,040 910
Total procurement spend Ushs ’millions 162,600 144,280 141,996
% of procurement spend with local suppliers % 93% 97% 96%
communities
Corporate social investment spend Ushs ’millions 975 775 502
environment
Electricity purchased kilowatt hours 4,816,580 3,919,627 4,949,874
Fuel consumed litres 391,476 376,693 351,185
Water consumed kilolitres 18,192 34,254 33,070
Paper consumed tons 65 65 58

42 Stanbic Bank Uganda Limited Annual Report and Financial Statements for the year ended 31 December, 2015
“We excel at both.”
“Should I be speaking to a bank with local or
regional capabilities?”
stanbicbank.co.ug
Corporate and Investment Banking
200306_Project Electron – Eskom Eurobond Deal.indd 1 2016/02/19 9:22 AM
Stanbic Bank
To realise your investment ambitions, you need to partner with a leading financial services partner. So, whatever your opportunities or challenges, we’ll be right there to move you forward.
AFRICAN BANKING AWARDS 2015
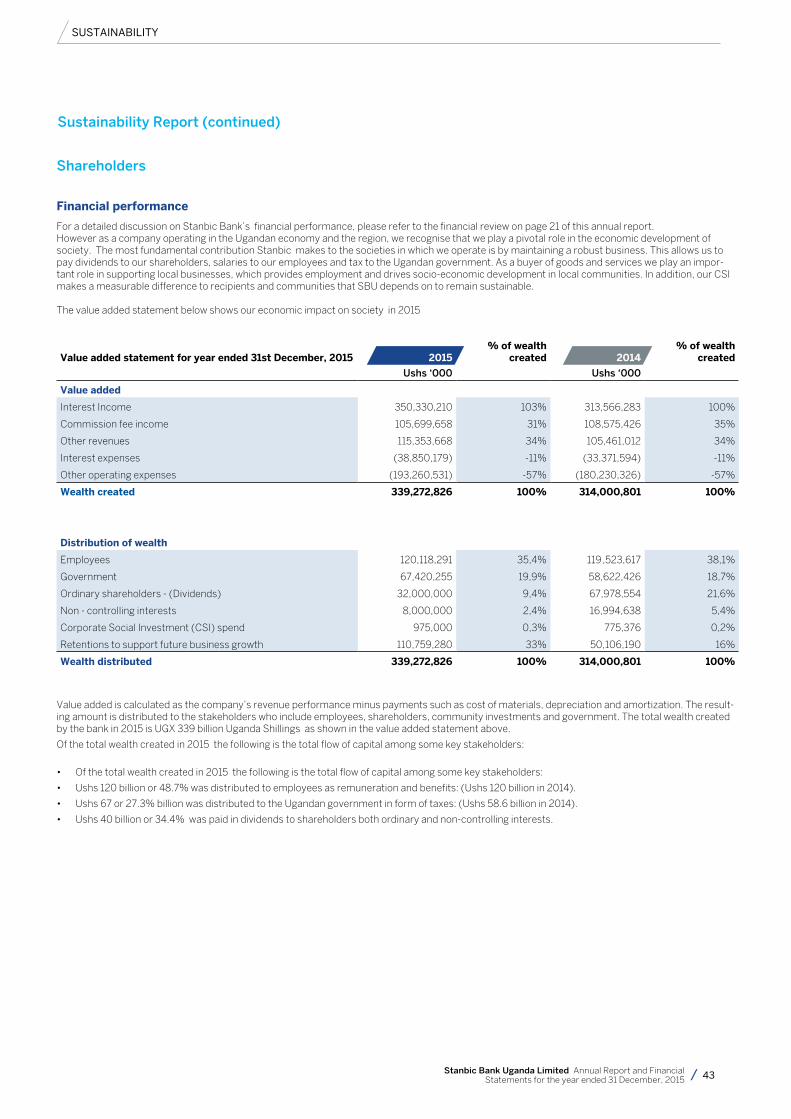
43Stanbic Bank Uganda Limited Annual Report and Financial Statements for the year ended 31 December, 2015
SUSTAINABILITy
Shareholders
Financial performance
For a detailed discussion on Stanbic Bank’s financial performance, please refer to the financial review on page 21 of this annual report. However as a company operating in the Ugandan economy and the region, we recognise that we play a pivotal role in the economic development of society. The most fundamental contribution Stanbic makes to the societies in which we operate is by maintaining a robust business. This allows us to pay dividends to our shareholders, salaries to our employees and tax to the Ugandan government. As a buyer of goods and services we play an impor-tant role in supporting local businesses, which provides employment and drives socio-economic development in local communities. In addition, our CSI makes a measurable difference to recipients and communities that SBU depends on to remain sustainable.
The value added statement below shows our economic impact on society in 2015
value added statement for year ended 31st December, 2015 2015% of wealth
created 2014% of wealth
created
Ushs ‘000 Ushs ‘000
value added
Interest Income 350,330,210 103% 313,566,283 100%
Commission fee income 105,699,658 31% 108,575,426 35%
Other revenues 115,353,668 34% 105,461,012 34%
Interest expenses (38,850,179) -11% (33,371,594) -11%
Other operating expenses (193,260,531) -57% (180,230,326) -57%
Wealth created 339,272,826 100% 314,000,801 100%
Distribution of wealth
Employees 120,118,291 35,4% 119 ,523,617 38,1%
Government 67,420,255 19,9% 58,622,426 18,7%
Ordinary shareholders - (Dividends) 32,000,000 9,4% 67,978,554 21,6%
Non - controlling interests 8,000,000 2,4% 16,994,638 5,4%
Corporate Social Investment (CSI) spend 975,000 0,3% 775,376 0,2%
Retentions to support future business growth 110,759,280 33% 50,106,190 16%
Wealth distributed 339,272,826 100% 314,000,801 100%
Value added is calculated as the company’s revenue performance minus payments such as cost of materials, depreciation and amortization. The result-ing amount is distributed to the stakeholders who include employees, shareholders, community investments and government. The total wealth created by the bank in 2015 is UGX 339 billion Uganda Shillings as shown in the value added statement above.
Of the total wealth created in 2015 the following is the total flow of capital among some key stakeholders:
• Ofthetotalwealthcreatedin2015thefollowingisthetotalflowofcapitalamongsomekeystakeholders:
• Ushs120billionor48.7%wasdistributedtoemployeesasremunerationandbenefits:(Ushs120billionin2014).
• Ushs67or27.3%billionwasdistributedtotheUgandangovernmentinformoftaxes:(Ushs58.6billionin2014).
• Ushs40billionor34.4%waspaidindividendstoshareholdersbothordinaryandnon-controllinginterests.
Sustainability Report (continued)
44 Stanbic Bank Uganda Limited Annual Report and Financial Statements for the year ended 31 December, 2015
Customers
customer experience
The main measure of customer satisfaction within Stanbic Bank is the NPS (Net Promoter Score). It is question that asks customers whether or not they would recommend the Bank to a family member, a friend or a col-league. The response tells us the satisfaction level of the customer as a positive response means the customer is happy with the Bank and a negative response is an indication that the customer is dissatisfied with the services of the Bank.
In addition to the NPS, there were other cus-tomer satisfaction and experience surveys that included the Client Insight Survey- for the CIB customers called Qualtrics, on boarding survey for new customers and branch experience survey for customers transacting in the branch. Customer forum groups and Customers led meetings are also held in the branches. All these surveys and interactions saw us reach out to about 26,800 customers. There was mixed feedback from customers who both appreciated the Bank’s efforts of improving the customer experience but also expected a lot more from the Bank. The general consensus was that the Bank was putting the customer at the forefront of everything they do but the impact was not yet at the desired levels.
The Customer Relationship Management (CRM) Tool was developed and adopted to deal with both customer complaints and queries. The tool sits within the Customer Care Centre and is directly managed by this team. Each and every staff member has access to this tool and is able to log in a complaint or query from his/her desk. The complaint is then assigned to a specific unit and only after successful resolution is the query or complaint closed in the system. A daily report is circulated to all the branches and business units showing the complaints that are still outstanding. This ef-fectively drives turnaround times and at every time the Customer Care Centre is able to have a view of what has been resolved and what is still outstanding. Through the reports that are provided on a weekly basis, we are able to deal with the root cause of the complaint and this in turn helps in the reduction of recurring issues. The CRM Tool provides the Bank with a central view of what is not going well within the busi-ness and provides an opportunity for resolution of complaints.
managing complaints
Our aim is to develop a consistent approach to complaints management aligned to regulatory requirements and ensures that customer com-plaints are handled in an accessible, transpar-ent and efficient manner in line with the Bank’s commitment to treating its customers fairly.
The diversity of our client base by age, location, Banking needs, nationality, business lines and gender means that every interaction with the Bank is an opportunity for us to make a memorable contribution to their lives but also means we can jeopardize this valuable relation-ship by being unresponsive to complaints from
our customers. We therefore strengthened our complaints framework in 2015 to include all operations across the Stanbic Bank.
A query or complaint starts when it is initiated by the customer, and ends when the customer has received a full and satisfactory resolution. In order to adequately address all customer complaints or queries we do have a formal compliant s handling framework in all our areas of representation that covers walk in custom-ers in our branches, telephonic, email or postal correspondence, dedicated customer care centres , our website, individual staff members, media & social networks, Bank of Uganda, senior management and the Office of the Chief Executive. These avenues ensure that custom-ers are treated fairly and transparently in all we that we do.
Inclusive customer value proposi-
tions
We are of the view that financial services can positively impact the growth of the Ugandan economy and transform previously un Banked members of the society. We understand that each of our customers is unique and we contin-uously position our business to impact as many Ugandans as possible. In 2014 we launched EZ dimes - a product targeted to the youth between the ages of 18 & 25 . The product has been well embraced in 2015 growing to 22,000 customers from 16,000 at the close of 2014.
The digital revolution is profoundly affecting the way financial services organizations operate. Most notable are the opportunities to improve customer engagement and develop custom-ized products and services, and distribution channels that are more efficient, cost effective and deliver better outcomes for customers. Whereas financial services businesses used to compete on the strength of their branch networks and products, now the competitive arena is defined by customer engagement, underpinned by a single view of each customer, the use of data and analytics to gain deeper insight into customers’ needs, and employing processes and systems to treat customers fairly.
Our investments in digital channels now offer important gateways for customer inclusion that partner with the growth of mobile money in the Ugandan economy. The latter we believe offers a unique opportunity and we intend to launch a mobile savings and loan product that will reach the unBanked population through their cell phones.
managing financial crime
Ensuring the safety of our people and assets, and the security of our systems and processes, enables us to enhance the customer experience and instil trust in the Bank. We have no toler-ance for all forms of financial crime, including fraud, bribery and corruption, terrorist financ-ing or money laundering. We maintain and firmly implement the Anti-Financial Crime, Anti Bribery and Corruption and the Whistle blowing policies duly approved by the Board. These policies seek to advance a
culture across the Bank, which raises aware-ness of the risks and consequences of any form of financial crime and provide a strong frame-work for prevention, detection and response to financial crimes. The policies are applicable to all staff, contractors, public and suppliers of services to the Bank.
We maintain reward schemes to reward em-ployees who stop fraud.. The Bank also has a number of robust systems, processes, human capital detection and prevention capabili-ties that assist in detection and prevention of financial crime. To this end we have a whistle blowing framework through which employees and customers are encouraged to report any financial crime, bribery , corruption incident and misconduct through our toll free hotline 0800160200.
This platform is independently and externally managed to maintain anonymity of the whistle-blowers. No whistle-blower is disadvantaged when reporting legitimate concerns in any form. The Bank undertakes to protect employees/customers who in good faith make a report in accordance with procedure set out in the whis-tle blowing policy, but will not protect employ-ees who maliciously make false reports. In such instances appropriate disciplinary action will be taken. In addition The Bank has implemented a robust physical security and logical access framework to guarantee the safety of its cus-tomers and branches.
Employees
Talent management
The talent identification process is a proactive and simple approach that links the capabili-ties that drive Business performance, to the demand and supply of talent. It is Clear, robust and replicable and fosters leadership and ma-trix collaboration and engagement to support effective talent development and engagement. It is an ongoing practise that happens through-out the year integrated in every performance, behaviour and development.
The Bank approximately spends nearly 3 billion Uganda Shillings annually on formal learning and development propositions. Development blends formal programmes (education) with on-the-job experience and exposure opportuni-ties to ensure optimal impact. It is driven by clearly established individual, team, and busi-ness needs. This combines with ever present on demand e learning propositions on a robust platform called “NetworkNext.” The Bank has provided licenses for all staff for leadership with a leading learner site the Havard Management Mentor. In 2015 our e learning channel reached 97% of the staff population.
Performance and reward
We view performance management as a critical business management process in which we en-trust our competitive advantage to our people. We believe it is something teams do together, and not something managers do for their employees. Ownership in formulation and ex-
customers
employees
SUSTAINABILITy
Sustainability Report (continued)
45Stanbic Bank Uganda Limited Annual Report and Financial Statements for the year ended 31 December, 2015
ecution of goals is for the entire team led by the leader. Strategy execution relies on cascaded strategy-aligned team and individual goals. We believe strategy execution and performance management should always be used in the same sentence. The Enduring Performance Management (EPM) process aims to ensure that the link between contracted performance and pay is clear, that delivery, is strictly through the expected values-aligned leadership behav-iors (the “what” and ‘how’ of performance) and that goal setting and performance review that considers future capability requirements of the Bank, and personal development needs and aspirations. This can only happen through high performance contracting based on fewer, focused and impactful goals delivering the business strategic priorities, supported by regular performance monitoring conversations on capability to deliver.
The performance management cycle involves goal setting, regular performance monitoring conversations and performance reviews for the teams and all individuals. The performance re-view is purposefully based on 4 rating descrip-tors and includes a performance moderation to ensure fair application. The review process takes into consideration the “what” and “how” of performance giving emphasis on not only results but the upholding of values in delivery of results. It’s an inclusive, two-way process that creates and ensures honest, direct conver-sations on performance feedback and also consider future capability requirements of the Bank, and personal development needs and aspirations.
To drive a high performance culture, the Bank pays competitive fixed remuneration for delivery of the core job functions emphasising superior customer experience and value. We continuously raise the bar and offer variable pay linked to meeting and exceeding that impactful stretch goals that deliver strategic priorities for our business.
Whereas there is no minimum wage set in Uganda, our reward philosophy is based on 9 principles. Our reward aims at transparency, based on sustainable performance business results. We aim to pay competitive market based remuneration and internal relative remu-neration. We aim to have appropriate balance of fixed and variable remuneration short and long term incentives. Pay is based on perfor-mance and individual rewards based on group, business unit individual performance outputs. In this process we aim to differentiate individual reward based on performance.
employee wellness
At Stanbic Bank Uganda, we believe that em-ployee wellness and quality of work life impact employee productivity. Our Employee Wellness program aims to provide staff with an integrat-ed range of health and wellness offerings, which addresses their physical health, mental wellbe-ing and social wellbeing. Through our partner-ship with ICAS (The International Counselling & Advisory Services), and our Medical Insurance service provider Liberty Health, we educate and sensitize our staff with relevant health and wellness information. Liberty Health boasts of
over 75 service providers spread out in different areas in the country, making accessibility to health solutions convenient for our staff. We have also joined nation-wide health campaigns to raise awareness on Marburg fever, Ebola, Polio and HIV/AIDS.
ICAS provides telephonic and face-to-face counselling services to our employees and their immediate household members. ICAS affiliates have also been instrumental in handling trauma cases. The introduction of onsite counselling clinics in 2014 was a big step towards improv-ing the utilisation of the Employee Wellness program. The Bank takes a special interest in the life threatening disease policy. Through the Chronic conditions benefit under our Liberty Health Medical cover, employees and their dependants that require medication and treat-ment for more than three continuous months are sufficiently cared for. We also have the Liberty health website for health information http://www.libertyhealthblue.com/ available to all staff.
Every year we conduct health weeks during which we offer a range of screenings and as-sessments to employees, e.g. blood cholester-ol, blood pressure, individual stress assess-ment, and HIV counselling and testing. The aim of these assessments is to assist employees in the early identification and treatment of health risks. The E-Care program has reinforced the Employee Wellness program through the provision of self-management tools to our em-ployees e.g. Ask the Doctor, Ask the Personal Trainer. Employees have also been encouraged to keep fit through initiatives like the Get Active Challenge where they are encouraged to track their health. We also have informal Walking groups. The Bank also provides gym member-ship as a benefit to its employees at managerial level not only for networking purposes but also for health purposes. We currently have 219 employees on the gym membership benefit.
The Bank as an employer has legal responsibil-ity to provide a healthy and safe workplace. We ensure that the premises in which the Bank’s business is conducted are of sound construc-tion and are kept in a good working condition, and that the building plans were approved by the relevant authorities. Maintenance of the work place in a condition that is clean, safe and without risk to health, and the provisions and maintenance of means of access to and exit from the workplace that are safe and without risks.
We have trained first aiders and fire marshals in every point of representation whose responsi-bility is to prevent unsafe conditions; prevent ill health, occupational injuries and diseases; and control or remove hazards. We have a health and safety Manager and all incidents are reported and recorded.
Regulators & government
new regulations
Regulations continue to impact the Bank as regulators release new and continue to amend exiting regulations to ensure a sound financial system in Uganda. This affects the manner in
which the Bank conducts its day to day busi-ness.
The Compliance function of the Bank proactive-ly supports senior management and business through effective compliance risk manage-ment practices, to ensure that all business is conducted within statutory, supervisory and regulatory requirements, thereby mitigating regulatory sanctions and reputational risk.
New regulations were passed including The Registration of Persons Act 2015 which will help enhance Know Your Customer ( KY as persons shall be issued National IDs upon registration, The Public Finance Management Act 2015 which provides for accountability of public funds by government entities and the Bank will require all government accounts go through enhanced due diligence at on-boarding and during annual KYC review.
Others include The Business Licensing (Mis-cellaneous repeals) Act, 2015 which aims at simplifying Business Registration procedures, The Financial Institutions (Amendment) bill 2015 an Act to amend the Financial Institutions Act, 2004 which will introduce Islamic Banking; provide for banc assurance, agent banking agency; special access to the Credit Reference Bureau by other accredited credit provid-ers and service providers and will reform the Deposit Protection Fund.
Two existing regulatory requirements were amended which directly affect Money Launder-ing control surveillance within the Bank. The Anti-Terrorism Act 2002 was amended and it aimed to extend the definition of what amounts to a being a terrorist by also including indirect involvements in various acts classified as ter-rorist and classifying this as an offence. In ad-dition, the Anti-Money Laundering Regulations 2015 were availed to allow effective implemen-tation of the law. The Bank continues to report suspicious transactions to the Financial Intel-ligence Authority as flagged by the automated system that monitors client transactions.
In line with Consumer Protection guidelines, a fully-fledged Service Department was es-tablished to enhance customer experience. A customer relationship management tool (CRM tool) where complaints can be logged is in place and every department and branch has a Service matrix in place to ensure accountability for customer complaints across the Bank.
As part of our strategy to change the Com-pliance image from business inhibitors to enablers, we continue to conduct awareness through face-to-face trainings as well as online trainings which are mandatory for all staff.
Communities
Strategic partnerships and trans-
formation
We with work with international organisations that facilitate the achievement of the Millen-nium Development Goals in Uganda.
SBU’s social investment strategy aims at making an optimal impact by partnering with
SUSTAINABILITy
Sustainability Report (continued)

46 Stanbic Bank Uganda Limited Annual Report and Financial Statements for the year ended 31 December, 2015
Board Chairman vaccinating a baby during the health
Awareness week sponsored by Stanbic Bank to provide free
medical care and awareness.
Staff building session
47Stanbic Bank Uganda Limited Annual Report and Financial Statements for the year ended 31 December, 2015
local and international organisations to offer appropriate interventions and empower people to transform their lives. Below are some of 2015 key partnerships that were able to make a significant improvement in beneficiaries’ livelihoods.
Last year, we took a number of steps to strengthen our efforts within our communities and further integrate our CSI initiatives into one major theme of education. The bank committed over Ushs 975M of which 52% was invested in the education sector.
Going forward, we will intensify our focus on education which will now include entrepre-neurial skills development. We believe that the performance of our future economy depends on the quality of education provided to young people today.
As in previous years, we are keen on the impact that our programmes can make. In 2015, we were able to reach 52,086 people across the country whose lives were transformed for bet-ter. More details in section below. Monitoring and evaluating our CSI programmes helps us to achieve our purpose of not only transforming lives, but doing it responsibly and sustainably.
a.) Stanbic Bank-GEMS Charity Run
The challenge: A number of children drop out of school due to lack of scholastic materials and other support resources such as food. Most of them take to the street which increases their vulnerability.
our Involvement: Stanbic Bank partnered with GEMS Cambridge International School to organize the 2015 charity run which is aimed at supporting vulnerable children to access education.
By sponsoring a limited number of staff together with their family members on a first come – first serve basis encourages staff to participate.
Impact/outcome
• 332participantsregisteredfortheevent.
• Ushs20,205,000wasraisedtowardsthe cause that is expected to benefit 427 students and 500 teachers in accessing education and contemporary teaching methodologies respectively. The funds will be distributed as follows;
a) Ushs 8,082,000 will go towards Ggaba market ECD that takes care of 20 vulnerable children.
b) Ushs 8,082,000 will go towards sup-porting 407 indigent children at Mis-sionaries of the poor to access basic education, health and food.
c) The remaining Ushs 4,041,000 will go to Varkey Foundation’s Teacher train-ing programme which impacts almost 3,000 underprivileged children.
b.) Financial Literacy Training in partnership with AVSI
The challenge: Many people have lost their property/savings due to poor financial deci-sions resulting from lack of financial knowledge.
According to the Finscope report-2010, almost half of the adult Ugandans are currently bor-rowing (45%), of which 20% have ever saved but stopped and 35% have never saved. Far too many Ugandans – about 72% – don’t use banks at all, despite the financial advantages they provide.
our Involvement: In partnership with AVSI, Stanbic Bank organised 25 financial literacy trainings for 750 vulnerable households across the country to teach them important aspects about personal saving, debt management, budgeting, and financial services among others. The objective is to improve the socio-economic status of targeted vulnerable households by 39% for 2015.
Impact/outcome
• 794householdstrainedinFinancialKnowl-edge of which 393 are vulnerable children’s households.
• 4,764individualshavebeenreachedthrough the financial literacy trainings.
• Averagehouseholdincomesmorethandoubled from Ushs 46,542 to Ushs 136,780 – a growth of 194%
• Overallaveragesocio-economicvulnerabil-ity score improved by of 45%.
c.) Stanbic Bank National Schools Cham-pionship
The challenge: 70% of Uganda’s population is below the age of 24 yet statistics in Uganda suggest that 83% of people under 24 years are unemployed majorly because most fresh graduates lack employable skills.
our Involvement: Stanbic Bank in partner-ship with the Ministry of Education and Sports introduced a national quiz competition for secondary schools across Uganda to stimulate secondary school students to sharpen their critical thinking, while creating problem-solving skills.
The objective was to nurture young people to develop positive attitudes, values and coping skills which subsequently prepares them for greater responsibilities in the future
Impact/outcome
• 34secondaryschoolsandover3,000students participated in the competition in which they were trained on the following skills among others;
d.) Stanbic Bank Business Mentorship programme
The challenge: Uganda has been ranked as the world’s number one entrepreneurial
country by Approved Index in the UK (2015) however 70% of the businesses started in Uganda collapse within the first 3 years accord-ing to statistics from Global Entrepreneurship Monitor (GEM). SMEs in Uganda generally lack proven business management habits and skills, which are evident among the more successful business people elsewhere, leading to their collapse.
our Involvement: Stanbic Bank is currently providing 200 SMEs with tailored business trainings that are aimed at helping them im-prove the way they run their businesses, make them more efficient and formalize them. This is aimed at driving economic and social transfor-mation that will secure the future of our SME sector. Both customers and non-customers are eligible for the programme.
Impact/outcome
• 200SMEshavebeenenrolledontheprogramme and are being mentored and trained in the following among others to improve their survival rates;
• BookKeeping• Marketingandselling• Taxation• Businessregistration• Creditmanagement• Cashflowmanagement
e.) Stanbic Bank primary Education Campaign to promote universal pri-mary education amongst vulnerable children
The challenge: Over the years results show that although pupils generally pass PLE exams, there are very few that actually obtain first grade which is essential for them to access quality secondary education. 2014 and 2013 for instance had only 10.4% and 9.04% of the total pupils who completed PLE with first grades, respectively.
our Involvement: Stanbic Bank in partnership with the Ministry of Education, Science, Tech-nology and Sports provided 11,000 PLE past paper pamphlets to over 4,000 schools across the country which is expected to benefit an es-timated 50,000 pupils to improve performance of P.7 candidates.
Impact/outcome
More than 50,000 pupils received revising materials that are expected to improve their PLE results for them to access better quality education.
f.) Entrepreneurial skills training for youth out of school in partnership with In Movement.
The challenge: Statistics in Uganda indicate that 90% of UPE pupils cannot read and only one out of every ten children assessed in Prima-ry Three is able to correctly solve a Primary Two level numeracy questions up to division level.
our Involvement: Stanbic Bank in partner-ship with In-Movement trained a group of over 30 youth to realize their full potential in various
SUSTAINABILITy
Sustainability Report (continued)
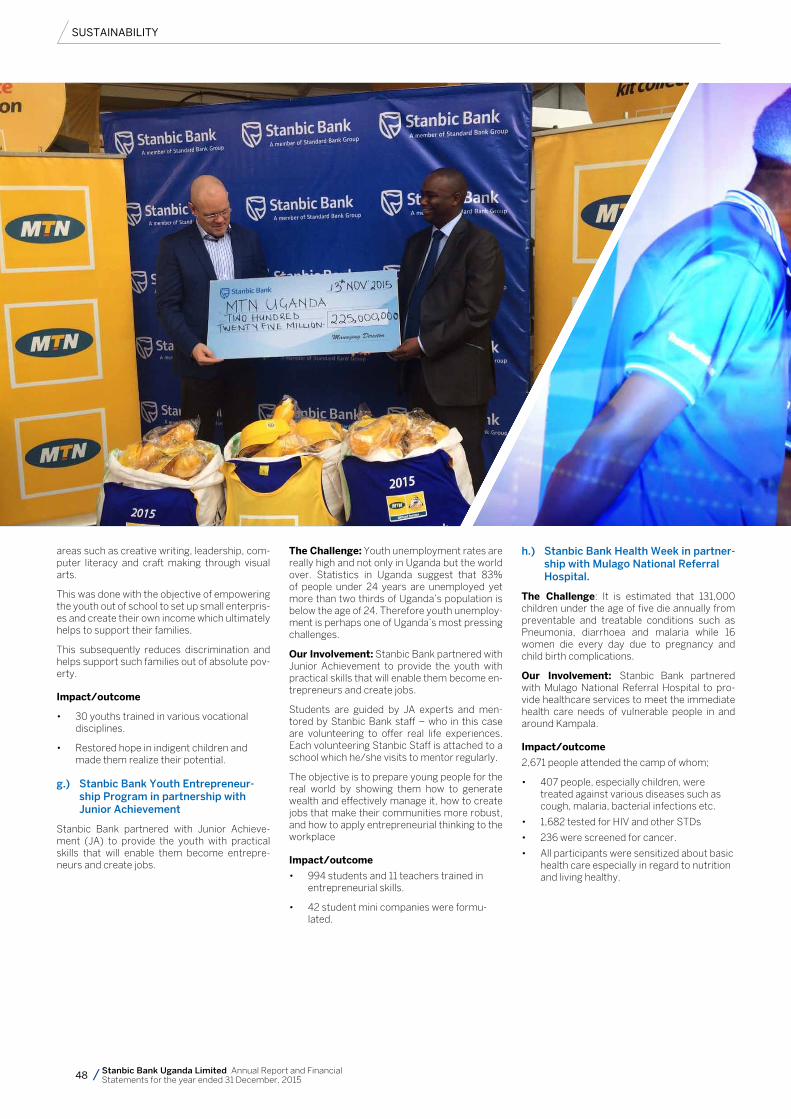
48 Stanbic Bank Uganda Limited Annual Report and Financial Statements for the year ended 31 December, 2015
areas such as creative writing, leadership, com-puter literacy and craft making through visual arts.
This was done with the objective of empowering the youth out of school to set up small enterpris-es and create their own income which ultimately helps to support their families.
This subsequently reduces discrimination and helps support such families out of absolute pov-erty.
Impact/outcome
• 30youthstrainedinvariousvocationaldisciplines.
• Restoredhopeinindigentchildrenandmade them realize their potential.
g.) Stanbic Bank youth Entrepreneur-ship program in partnership with Junior Achievement
Stanbic Bank partnered with Junior Achieve-ment (JA) to provide the youth with practical skills that will enable them become entrepre-neurs and create jobs.
The challenge: Youth unemployment rates are really high and not only in Uganda but the world over. Statistics in Uganda suggest that 83% of people under 24 years are unemployed yet more than two thirds of Uganda’s population is below the age of 24. Therefore youth unemploy-ment is perhaps one of Uganda’s most pressing challenges.
our Involvement: Stanbic Bank partnered with Junior Achievement to provide the youth with practical skills that will enable them become en-trepreneurs and create jobs.
Students are guided by JA experts and men-tored by Stanbic Bank staff – who in this case are volunteering to offer real life experiences. Each volunteering Stanbic Staff is attached to a school which he/she visits to mentor regularly.
The objective is to prepare young people for the real world by showing them how to generate wealth and effectively manage it, how to create jobs that make their communities more robust, and how to apply entrepreneurial thinking to the workplace
Impact/outcome
• 994studentsand11teacherstrainedinentrepreneurial skills.
• 42studentminicompanieswereformu-lated.
h.) Stanbic Bank health Week in partner-ship with Mulago National Referral hospital.
The challenge: It is estimated that 131,000 children under the age of five die annually from preventable and treatable conditions such as Pneumonia, diarrhoea and malaria while 16 women die every day due to pregnancy and child birth complications.
our Involvement: Stanbic Bank partnered with Mulago National Referral Hospital to pro-vide healthcare services to meet the immediate health care needs of vulnerable people in and around Kampala.
Impact/outcome
2,671 people attended the camp of whom;
• 407people,especiallychildren,weretreated against various diseases such as cough, malaria, bacterial infections etc.
• 1,682testedforHIVandotherSTDs
• 236werescreenedforcancer.
• Allparticipantsweresensitizedaboutbasichealth care especially in regard to nutrition and living healthy.
SUSTAINABILITy

49Stanbic Bank Uganda Limited Annual Report and Financial Statements for the year ended 31 December, 2015
Stanbic Bank-GEMS Charity Run
ushs 20,205,000 was raised towards the
cause that is expected to benefit 427 students
and 500 teachers in accessing education and contemporary
teaching methodologies respectively.
SUSTAINABILITy
Stanbic Bank National Schools ChampionshipThe objective was to nurture young people to
develop positive attitudes, values and coping skills which subsequently prepares them for
greater responsibilities in the future.

50 Stanbic Bank Uganda Limited Annual Report and Financial Statements for the year ended 31 December, 2015
CORpORATE GOvERNANCE
Board of Directors1. MR. JAphETh KATTO /64ChairmanB.Com Honours ACCAAppointed 2014
2. pATRICK MWEhEIRE /45Chief Executive
BSc (Econ, Daemen)MBA (harvard)Appointed 2014
3. KITILI MBAThI /56Non-Executive Director (Resigned on 31 January 2016)BA (Economics and political Science, Michigan),Master of Banking and Finance for Development (Instituto Finafrica-Milan)Appointed 2001
4. RUTh EMUNU /67Non-Executive Director BA. (Minnesota),
pGD (public Administration, Makerere)Appointed 2009
5. BARBARA MULWANA /51Non-Executive Director BSc (Electrical Engineering and Computer
Science, Northwestern),Appointed 2009
6. SAMUEL SEJJAAKA /52Non-Executive Director BCom (Makerere),MSc (Financial Studies, Strathclyde),phD (Accounting and Finance, Makerere)Appointed 2007
7. JOSEphINE AyUGI OKOT /49Non-Executive Director BCom (Makerere University Business School),Marketing Diploma (helsinki School of Economics and Business Administration),MBA (Washington International University)Appointed 2011
8. pATRICK JAMES MANGhENI /64Non-Executive DirectorBSc (Mathematics – Makerere Univ.),B.A (pure Mathematics – oxford Univ.)MSc (Analysis & Topology) – oxford Univ.)Director of philosophy (Functional Analysis – oxford Univ.)Appointed: 7 July 2015
1 2
3 4
5 6
7 8

51Stanbic Bank Uganda Limited Annual Report and Financial Statements for the year ended 31 December, 2015
CORpORATE GOvERNANCE
Executive Committee
1. pATRICK MWEhEIRE /45Chief Executive
2. KEvIN WINGFIELD /48head, personal & Business Banking
note:Elias Kagumya (previous Head, Risk) resigned in July 2015
Brendah Nabatanzi Mpanga (previous Head, Legal) resigned in October 2015
3. SAMUEL FREDRICK MWOGEzA/35Chief Finance 0fficer
4. EDWIN MUCAI (Ag) /42head, Corporate & Investment Banking
5. GEORGE MUKASA(Ag) /39 Chief Risk officerAppointed 2016.03.15
6. CANDy OKOBOI (Ag) /45head, Legal / Company SecretaryAppointed February, 2016
7. RITA BALAKA /55head, Compliance
8. MIRIAM NAIGEMBE /41head, operations
9.MOSES MBUBI WITTA /38head, human Capital
10. hERBERT OLOWO /44Chief Information officer
1 2
4
5 6
7
9
8
10
3
52 Stanbic Bank Uganda Limited Annual Report and Financial Statements for the year ended 31 December, 2015
Introduction This corporate governance statement sets out the governance framework adopted by the Board of Stanbic Bank Uganda Limited (the Bank) and highlights the key activities during the year.
In its approach to governance, the Board embraces best practice principles based on the understanding that sound governance practices are fundamental to earning the trust of the Bank’s stakeholders. This is critical to sustaining the Bank’s performance and preserving shareholder value. The Bank’s broad corporate governance approach is detailed in a policy for that purpose.
The Board strives to embrace relevant local and international best practice and is committed to upholding the fundamental tenets of governance which include independence, social responsibility, discipline, transparency, accountability and fairness to all stakeholders. Owing to the Bank’s relationship with the Standard Bank Group and where appropriate, the principles of the King Code inform a significant portion of the governance framework and practices of the Bank.
In the year under review, the Bank complied with all applicable laws, rules, regulations
and guidelines on corporate governance.
The Bank’s governance framework enables the Board to fulfil its role of providing oversight and strategic counsel in balance with its responsibility to ensure conformance with regulatory requirements and risk tolerance. It also provides the parameters for delegating its authority.
Codes and regulationsAs a licensed commercial bank and listed Bank, the Bank operates in a highly regulated environment and is committed to complying with legislation, regulations, and codes of best practice.
Complying with all applicable legislation, regulations, standards and codes is integral to the Bank’s culture. The Board delegates responsibility for compliance to management and monitors this through the compliance function. Oversight of compliance risk management is delegated to the Audit Committee, which annually reviews and approves the compliance plan. On a quarterly basis, the Audit Committee receives reports from the Compliance function on, among other things, the status of compliance risk management in the Bank and significant areas of non-compliance. On a quarterly basis, the Audit Committee also reviews the significant interactions and correspondences with the Regulator.
The compliance function and governance standards are subject to review by internal audit.
The impact of new and proposed legislation and regulations is assessed by management and material regulatory issues and legislative developments are escalated to the Risk Management and Audit Committees. Following the passing of the Ugandan Companies Act, the Board implemented most of the changes in the course of 2013 and continues to adhere to these statutes.
Whilst the Bank continues to nurture a strong culture of governance and responsible risk management in line with Standard Bank Group’s risk appetite and governance framework, it is constantly monitoring its practices to ensure that they are best fit for it and serve to enhance business and community objectives.
The Bank is committed to social responsibility and sound environmental management in its lending and other activities
Board of directorsBoard structure and composition, including independence classification The Board of Directors is the Bank’s highest decision-making body and is ultimately responsible for governance. Directors are elected by the shareholders. The Bank has a unitary board structure and the roles of Chairman and Chief Executive are separate and distinct.
The Chairman is an independent non-executive director, as are the majority of directors on the Board. The balance of executive, non-executive and independent directors ensures a balance of power on the Board, so that no individual or group can dominate board processes or decision making and ensures the appropriate level of challenge. The number and calibre of independent non-executive directors on the Board ensures that board decision-making is sufficiently informed by independent perspectives.
Succession planningSuccession planning is a key focus of the Board which, on an ongoing basis, considers the composition of the Board and its committees to ensure continued effectiveness. The retention of board members with considerable experience is sought to ensure that appropriate levels of management are maintained.
As part of the Board’s responsibility to ensure that effective management is in place to implement Bank strategy, management
succession planning is an ongoing consideration.In 2015, we significantly strengthened the senior leadership team of the bank and made several key hires at the Executive Committee (ExCo) level.
Skills, knowledge, experience and attributes of directors The Board ensures that directors possess the skills, knowledge and experience necessary to fulfil their duties. The directors bring a balanced mix of attributes to the Board, including:
• Domestic and international experience;
• Operational experience;
• Knowledge and understanding of both macroeconomic and microeconomic factors affecting the Bank;
• Regulatory experience;
• Expertise in risk management and internal financial control; and Financial, entrepreneurial and banking skills.
The directors’ qualifications and brief curricula vitae are provided on page 50.
Access to information and resources
Executive management and the Board interact regularly. This is encouraged and Executive Committee members are invited to attend board meetings where necessary. In addition, non-executive directors meet without the executive directors in closed sessions, where necessary.
Directors have unrestricted access to management and Bank information, as well as the resources required to carry out their roles and responsibilities. This includes external legal and other professional advice at the Bank’s expense where necessary. A policy to regulate this process was adopted by the Board in 2012. It also includes unlimited access to the advice and services of the Bank Secretary, who assists in providing any information or documentation they may require to facilitate the discharge of their duties and responsibilities.
AppointmentsThe appointment of directors is governed by the Bank’s articles of association and is subject to regulatory approval in line with the applicable legislation and regulations. Directors are appointed by shareholders at the AGM and interim board appointments are allowed between AGMs. These appointments are then confirmed at the AGM.
There is a formal process for the appointment of directors. Information is
Corporate governance statement
CORpORATE GOvERNANCE
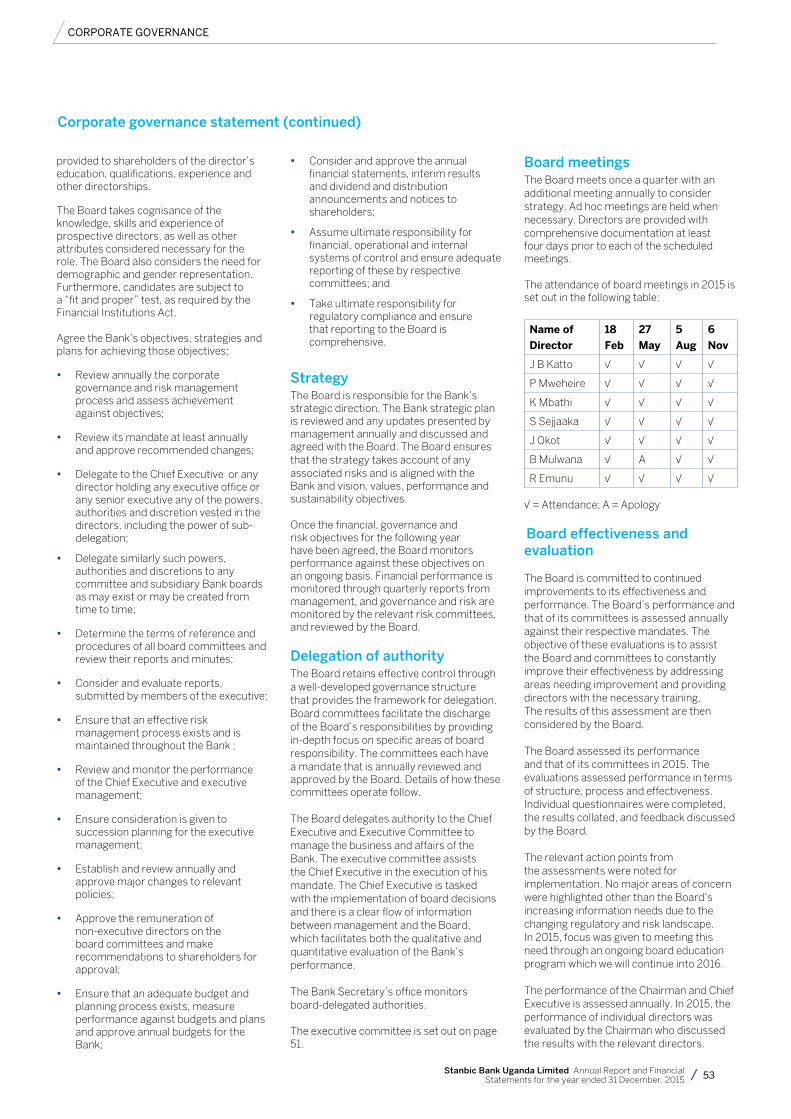
53Stanbic Bank Uganda Limited Annual Report and Financial Statements for the year ended 31 December, 2015
provided to shareholders of the director’s education, qualifications, experience and other directorships.
The Board takes cognisance of the knowledge, skills and experience of prospective directors, as well as other attributes considered necessary for the role. The Board also considers the need for demographic and gender representation. Furthermore, candidates are subject to a “fit and proper” test, as required by the Financial Institutions Act.
Agree the Bank’s objectives, strategies and plans for achieving those objectives;
• Review annually the corporate governance and risk management process and assess achievement against objectives;
• Review its mandate at least annually and approve recommended changes;
• Delegate to the Chief Executive or any director holding any executive office or any senior executive any of the powers, authorities and discretion vested in the directors, including the power of sub-delegation;
• Delegate similarly such powers, authorities and discretions to any committee and subsidiary Bank boards as may exist or may be created from time to time;
• Determine the terms of reference and procedures of all board committees and review their reports and minutes;
• Consider and evaluate reports, submitted by members of the executive;
• Ensure that an effective risk management process exists and is maintained throughout the Bank ;
• Review and monitor the performance of the Chief Executive and executive management;
• Ensure consideration is given to succession planning for the executive management;
• Establish and review annually and approve major changes to relevant policies;
• Approve the remuneration of non-executive directors on the board committees and make recommendations to shareholders for approval;
• Ensure that an adequate budget and planning process exists, measure performance against budgets and plans and approve annual budgets for the Bank;
• Consider and approve the annual financial statements, interim results and dividend and distribution announcements and notices to shareholders;
• Assume ultimate responsibility for financial, operational and internal systems of control and ensure adequate reporting of these by respective committees; and
• Take ultimate responsibility for regulatory compliance and ensure that reporting to the Board is comprehensive.
StrategyThe Board is responsible for the Bank’s strategic direction. The Bank strategic plan is reviewed and any updates presented by management annually and discussed and agreed with the Board. The Board ensures that the strategy takes account of any associated risks and is aligned with the Bank and vision, values, performance and sustainability objectives.
Once the financial, governance and risk objectives for the following year have been agreed, the Board monitors performance against these objectives on an ongoing basis. Financial performance is monitored through quarterly reports from management, and governance and risk are monitored by the relevant risk committees, and reviewed by the Board.
Delegation of authorityThe Board retains effective control through a well-developed governance structure that provides the framework for delegation. Board committees facilitate the discharge of the Board’s responsibilities by providing in-depth focus on specific areas of board responsibility. The committees each have a mandate that is annually reviewed and approved by the Board. Details of how these committees operate follow.
The Board delegates authority to the Chief Executive and Executive Committee to manage the business and affairs of the Bank. The executive committee assists the Chief Executive in the execution of his mandate. The Chief Executive is tasked with the implementation of board decisions and there is a clear flow of information between management and the Board, which facilitates both the qualitative and quantitative evaluation of the Bank’s performance.
The Bank Secretary’s office monitors board-delegated authorities.
The executive committee is set out on page 51.
Board meetingsThe Board meets once a quarter with an additional meeting annually to consider strategy. Ad hoc meetings are held when necessary. Directors are provided with comprehensive documentation at least four days prior to each of the scheduled meetings.
The attendance of board meetings in 2015 is set out in the following table:
name of
Director
18
Feb
27
may
5
Aug
6
nov
J B Katto √ √ √ √
P Mweheire √ √ √ √
K Mbathi √ √ √ √
S Sejjaaka √ √ √ √
J Okot √ √ √ √
B Mulwana √ A √ √
R Emunu √ √ √ √
√ = Attendance; A = Apology
Board effectiveness and evaluation
The Board is committed to continued improvements to its effectiveness and performance. The Board’s performance and that of its committees is assessed annually against their respective mandates. The objective of these evaluations is to assist the Board and committees to constantly improve their effectiveness by addressing areas needing improvement and providing directors with the necessary training. The results of this assessment are then considered by the Board.
The Board assessed its performance and that of its committees in 2015. The evaluations assessed performance in terms of structure, process and effectiveness. Individual questionnaires were completed, the results collated, and feedback discussed by the Board.
The relevant action points from the assessments were noted for implementation. No major areas of concern were highlighted other than the Board’s increasing information needs due to the changing regulatory and risk landscape. In 2015, focus was given to meeting this need through an ongoing board education program which we will continue into 2016.
The performance of the Chairman and Chief Executive is assessed annually. In 2015, the performance of individual directors was evaluated by the Chairman who discussed the results with the relevant directors.
CORpORATE GOvERNANCE
Corporate governance statement (continued)
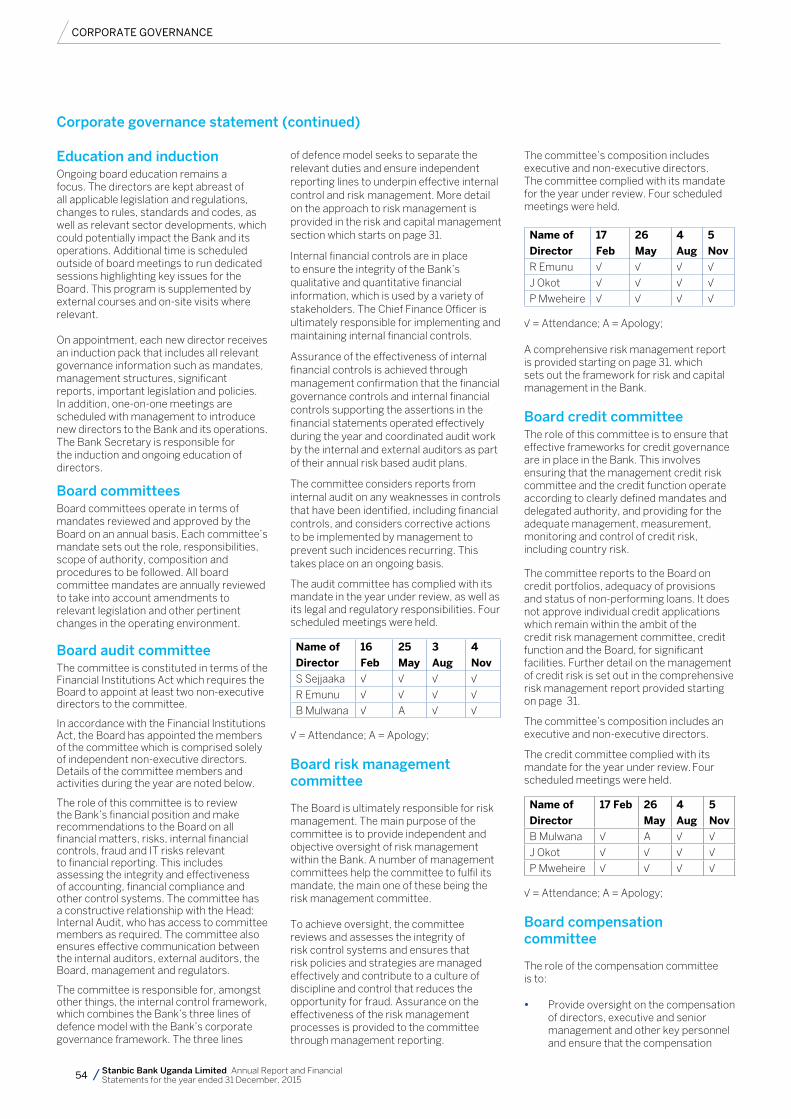
54 Stanbic Bank Uganda Limited Annual Report and Financial Statements for the year ended 31 December, 2015
Education and inductionOngoing board education remains a focus. The directors are kept abreast of all applicable legislation and regulations, changes to rules, standards and codes, as well as relevant sector developments, which could potentially impact the Bank and its operations. Additional time is scheduled outside of board meetings to run dedicated sessions highlighting key issues for the Board. This program is supplemented by external courses and on-site visits where relevant. On appointment, each new director receives an induction pack that includes all relevant governance information such as mandates, management structures, significant reports, important legislation and policies. In addition, one-on-one meetings are scheduled with management to introduce new directors to the Bank and its operations. The Bank Secretary is responsible for the induction and ongoing education of directors.
Board committeesBoard committees operate in terms of mandates reviewed and approved by the Board on an annual basis. Each committee’s mandate sets out the role, responsibilities, scope of authority, composition and procedures to be followed. All board committee mandates are annually reviewed to take into account amendments to relevant legislation and other pertinent changes in the operating environment.
Board audit committeeThe committee is constituted in terms of the Financial Institutions Act which requires the Board to appoint at least two non-executive directors to the committee.
In accordance with the Financial Institutions Act, the Board has appointed the members of the committee which is comprised solely of independent non-executive directors. Details of the committee members and activities during the year are noted below.
The role of this committee is to review the Bank’s financial position and make recommendations to the Board on all financial matters, risks, internal financial controls, fraud and IT risks relevant to financial reporting. This includes assessing the integrity and effectiveness of accounting, financial compliance and other control systems. The committee has a constructive relationship with the Head: Internal Audit, who has access to committee members as required. The committee also ensures effective communication between the internal auditors, external auditors, the Board, management and regulators.
The committee is responsible for, amongst other things, the internal control framework, which combines the Bank’s three lines of defence model with the Bank’s corporate governance framework. The three lines
of defence model seeks to separate the relevant duties and ensure independent reporting lines to underpin effective internal control and risk management. More detail on the approach to risk management is provided in the risk and capital management section which starts on page 31.
Internal financial controls are in place to ensure the integrity of the Bank’s qualitative and quantitative financial information, which is used by a variety of stakeholders. The Chief Finance 0fficer is ultimately responsible for implementing and maintaining internal financial controls.
Assurance of the effectiveness of internal financial controls is achieved through management confirmation that the financial governance controls and internal financial controls supporting the assertions in the financial statements operated effectively during the year and coordinated audit work by the internal and external auditors as part of their annual risk based audit plans.
The committee considers reports from internal audit on any weaknesses in controls that have been identified, including financial controls, and considers corrective actions to be implemented by management to prevent such incidences recurring. This takes place on an ongoing basis.
The audit committee has complied with its mandate in the year under review, as well as its legal and regulatory responsibilities. Four scheduled meetings were held.
name of
Director
16
Feb
25
may
3
Aug
4
nov
S Sejjaaka √ √ √ √
R Emunu √ √ √ √
B Mulwana √ A √ √
√ = Attendance; A = Apology;
Board risk management committee
The Board is ultimately responsible for risk management. The main purpose of the committee is to provide independent and objective oversight of risk management within the Bank. A number of management committees help the committee to fulfil its mandate, the main one of these being the risk management committee. To achieve oversight, the committee reviews and assesses the integrity of risk control systems and ensures that risk policies and strategies are managed effectively and contribute to a culture of discipline and control that reduces the opportunity for fraud. Assurance on the effectiveness of the risk management processes is provided to the committee through management reporting.
The committee’s composition includes executive and non-executive directors. The committee complied with its mandate for the year under review. Four scheduled meetings were held.
name of
Director
17
Feb
26
may
4
Aug
5
nov
R Emunu √ √ √ √
J Okot √ √ √ √
P Mweheire √ √ √ √
√ = Attendance; A = Apology;
A comprehensive risk management report is provided starting on page 31. which sets out the framework for risk and capital management in the Bank.
Board credit committeeThe role of this committee is to ensure that effective frameworks for credit governance are in place in the Bank. This involves ensuring that the management credit risk committee and the credit function operate according to clearly defined mandates and delegated authority, and providing for the adequate management, measurement, monitoring and control of credit risk, including country risk.
The committee reports to the Board on credit portfolios, adequacy of provisions and status of non-performing loans. It does not approve individual credit applications which remain within the ambit of the credit risk management committee, credit function and the Board, for significant facilities. Further detail on the management of credit risk is set out in the comprehensive risk management report provided starting on page 31.
The committee’s composition includes an executive and non-executive directors.
The credit committee complied with its mandate for the year under review. Four scheduled meetings were held.
name of
Director
17 Feb 26
may
4
Aug
5
nov
B Mulwana √ A √ √
J Okot √ √ √ √
P Mweheire √ √ √ √
√ = Attendance; A = Apology;
Board compensation committee
The role of the compensation committee is to:
• Provide oversight on the compensation of directors, executive and senior management and other key personnel and ensure that the compensation
CORpORATE GOvERNANCE
Corporate governance statement (continued)
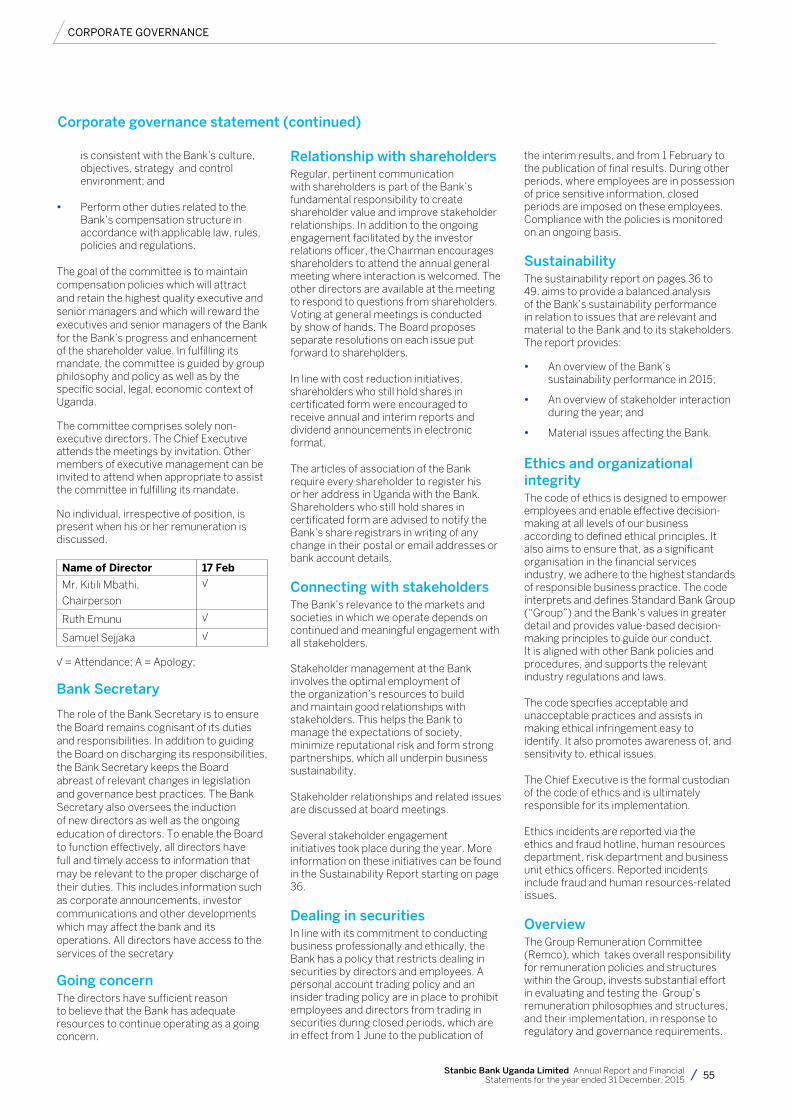
55Stanbic Bank Uganda Limited Annual Report and Financial Statements for the year ended 31 December, 2015
is consistent with the Bank’s culture, objectives, strategy and control environment; and
• Perform other duties related to the Bank’s compensation structure in accordance with applicable law, rules, policies and regulations.
The goal of the committee is to maintain compensation policies which will attract and retain the highest quality executive and senior managers and which will reward the executives and senior managers of the Bank for the Bank’s progress and enhancement of the shareholder value. In fulfilling its mandate, the committee is guided by group philosophy and policy as well as by the specific social, legal, economic context of Uganda.
The committee comprises solely non-executive directors. The Chief Executive attends the meetings by invitation. Other members of executive management can be invited to attend when appropriate to assist the committee in fulfilling its mandate.
No individual, irrespective of position, is present when his or her remuneration is discussed.
name of Director 17 Feb
Mr. Kitili Mbathi,
Chairperson
√
Ruth Emunu √
Samuel Sejjaka √
√ = Attendance; A = Apology;
Bank Secretary
The role of the Bank Secretary is to ensure the Board remains cognisant of its duties and responsibilities. In addition to guiding the Board on discharging its responsibilities, the Bank Secretary keeps the Board abreast of relevant changes in legislation and governance best practices. The Bank Secretary also oversees the induction of new directors as well as the ongoing education of directors. To enable the Board to function effectively, all directors have full and timely access to information that may be relevant to the proper discharge of their duties. This includes information such as corporate announcements, investor communications and other developments which may affect the bank and its operations. All directors have access to the services of the secretary
Going concernThe directors have sufficient reason to believe that the Bank has adequate resources to continue operating as a going concern.
Relationship with shareholdersRegular, pertinent communication with shareholders is part of the Bank’s fundamental responsibility to create shareholder value and improve stakeholder relationships. In addition to the ongoing engagement facilitated by the investor relations officer, the Chairman encourages shareholders to attend the annual general meeting where interaction is welcomed. The other directors are available at the meeting to respond to questions from shareholders. Voting at general meetings is conducted by show of hands. The Board proposes separate resolutions on each issue put forward to shareholders.
In line with cost reduction initiatives, shareholders who still hold shares in certificated form were encouraged to receive annual and interim reports and dividend announcements in electronic format.
The articles of association of the Bank require every shareholder to register his or her address in Uganda with the Bank. Shareholders who still hold shares in certificated form are advised to notify the Bank’s share registrars in writing of any change in their postal or email addresses or bank account details.
Connecting with stakeholdersThe Bank’s relevance to the markets and societies in which we operate depends on continued and meaningful engagement with all stakeholders. Stakeholder management at the Bank involves the optimal employment of the organization’s resources to build and maintain good relationships with stakeholders. This helps the Bank to manage the expectations of society, minimize reputational risk and form strong partnerships, which all underpin business sustainability.
Stakeholder relationships and related issues are discussed at board meetings.
Several stakeholder engagement initiatives took place during the year. More information on these initiatives can be found in the Sustainability Report starting on page 36.
Dealing in securitiesIn line with its commitment to conducting business professionally and ethically, the Bank has a policy that restricts dealing in securities by directors and employees. A personal account trading policy and an insider trading policy are in place to prohibit employees and directors from trading in securities during closed periods, which are in effect from 1 June to the publication of
the interim results, and from 1 February to the publication of final results. During other periods, where employees are in possession of price sensitive information, closed periods are imposed on these employees. Compliance with the policies is monitored on an ongoing basis.
SustainabilityThe sustainability report on pages 36 to 49. aims to provide a balanced analysis of the Bank’s sustainability performance in relation to issues that are relevant and material to the Bank and to its stakeholders. The report provides:
• An overview of the Bank’s sustainability performance in 2015;
• An overview of stakeholder interaction during the year; and
• Material issues affecting the Bank.
Ethics and organizational integrityThe code of ethics is designed to empower employees and enable effective decision-making at all levels of our business according to defined ethical principles. It also aims to ensure that, as a significant organisation in the financial services industry, we adhere to the highest standards of responsible business practice. The code interprets and defines Standard Bank Group (“Group”) and the Bank’s values in greater detail and provides value-based decision-making principles to guide our conduct. It is aligned with other Bank policies and procedures, and supports the relevant industry regulations and laws.
The code specifies acceptable and unacceptable practices and assists in making ethical infringement easy to identify. It also promotes awareness of, and sensitivity to, ethical issues.
The Chief Executive is the formal custodian of the code of ethics and is ultimately responsible for its implementation.
Ethics incidents are reported via the ethics and fraud hotline, human resources department, risk department and business unit ethics officers. Reported incidents include fraud and human resources-related issues.
overviewThe Group Remuneration Committee (Remco), which takes overall responsibility for remuneration policies and structures within the Group, invests substantial effort in evaluating and testing the Group’s remuneration philosophies and structures, and their implementation, in response to regulatory and governance requirements.
CORpORATE GOvERNANCE
Corporate governance statement (continued)
56 Stanbic Bank Uganda Limited Annual Report and Financial Statements for the year ended 31 December, 2015
All Compensation Committee decisions are guided by the Bank and Group philosophy and policy, as well as by the specific social, legal and economic context of the country.
Where considered appropriate, Remco and the Compensation Committee of the Bank initiate modifications to remuneration designs to ensure that regulatory requirements are met and our remuneration policies are consistent with, and promote effective risk management.
Remuneration philosophy and policy
The Bank is committed to building a leading emerging markets bank that attracts and retains world-class people. Consequently, we work to develop a depth and calibre of human resource that is capable of delivering sustainable growth across multiple geographies, products and regulatory regimes, and always within our agreed risk tolerance. At the heart of this commitment lies the value we place on our people. Therefore, effective management and remuneration of our talent must be a core competency in our Bank.
As an integral part of growing and fortifying our resource of human skills, the Compensation Committee continually reviews the Bank’s remuneration philosophies, structures and practices.
To determine the remuneration of employees of the Bank, the Compensation Committee reviews market and competitive data, and considers the Bank’s performance against financial objectives and individual performance. In 2011, Remco and management sought benchmarking guidance from Hay Group and Global Remuneration Services (GRS).
Certain specialist departments, for example, human resources and finance, provide supporting information and documentation relating to matters considered by the Compensation Committee.
Structure of remuneration for managerial and general employees
Terms of service
The terms and conditions of employment of all managers and general employees are guided by local legislation and are aligned to Group practice. Notice periods are stipulated by legislation and can go up to
three months
Structure of remuneration
Fixed pay
Fixed pay is intended to attract and retain employees by ensuring competitive positioning in the local market and in certain cases, globally.
Fixed pay is normally reviewed annually, typically in March and market data is used for benchmarking.
The longer term aim of Remco is to move from a fixed salary and benefits to a ‘cost-to-Bank’ philosophy whereby a cash sum is delivered from which all benefits are deducted.
Benefits
Benefits are provided in line with market practise and regulatory requirements. The Bank provides medical cover and death benefits for staff and dependents. In addition, retirement benefits are provided on a deferred contribution basis linked to fixed pay.
Variable pay
Annual incentiveAnnual incentives are provided to ensure appropriate reward for performance. Incentive pools are allocated to teams shaped by a combination of overall bank and team performance within the set risk tolerance levels.
Individual awards are based on personal performance, both financial and non-financial. In some cases, a portion of the annual incentive above a certain threshold is deferred.
Deferral schemes
Deferred bonus scheme (DBS)The bank has implemented a DBS to compulsorily defer a portion of incentives over a minimum threshold for some senior managers and executives. This improves alignment of shareholder and management interests and enables claw back under certain conditions, supporting risk management. All employees who are awarded an incentive over a certain threshold are subject to a mandatory deferral of a certain percentage of their bonus into the DBS for up to 42 months.
To enhance the retention component of the scheme, additional increments of the
deferred bonus become payable at vesting and one year thereafter.
Claw back provision
A claw back provision was introduced on the deferred remuneration plan. A key provision in the plans is that unvested awards may be reduced or forfeited, in full or in part, at Remco’s discretion subject to certain conditions and support by the Compensation Committee in Uganda.
Long term incentives
Share incentive schemesThe Standard Bank Group runs a Standard Bank equity growth scheme (EGS) and group share incentive scheme (GSIS) to which certain employees of Stanbic Bank Uganda are eligible to participate in. Participation rights under the EGS and share options under the GSIS are granted to qualifying employees. Grants of rights or options are typically made annually as part of the annual reward review; however grants are also made to new employees on appointment or as ad hoc awards for retention purposes. EGS and GSIS long term incentives are awarded to key talent and are motivated by an individual’s current performance and future potential. No awards are made to non-executive directors.
No participation rights or options are issued at a pricing discount, nor can they be re-priced, except as provided for in terms of the scheme in relation to a reduction or re-organisation of the issued share capital of Standard Bank Group.
The table below sets out the general vesting conditions of the various options or participating rights issued. The Standard Bank Group directors have the discretion to vary the vesting categories but not the expiry periods.
vesting
category year
cumulative
vesting % expiry
A 3, 4, 5 50, 75, 100 10 years
B 5, 6, 7 50, 75, 100 10 years
C 2, 3, 4 50, 75, 100 10 years
Terms of employment
Retention agreements
Retention agreements are only entered into in exceptional circumstances and retention payments have to be repaid should the individual concerned leave within a stipulated period.
Severance payments
Remuneration report
CORpORATE GOvERNANCE
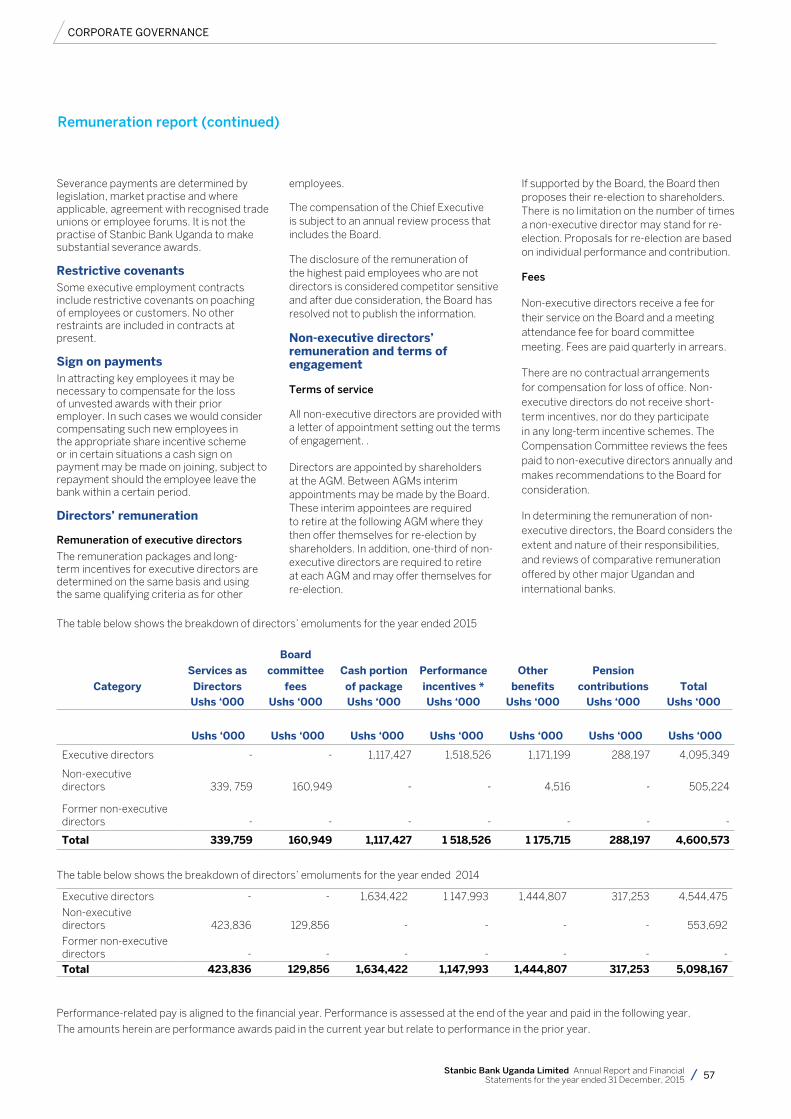
57Stanbic Bank Uganda Limited Annual Report and Financial Statements for the year ended 31 December, 2015
Severance payments are determined by legislation, market practise and where applicable, agreement with recognised trade unions or employee forums. It is not the practise of Stanbic Bank Uganda to make substantial severance awards.
Restrictive covenantsSome executive employment contracts include restrictive covenants on poaching of employees or customers. No other restraints are included in contracts at present.
Sign on paymentsIn attracting key employees it may be necessary to compensate for the loss of unvested awards with their prior employer. In such cases we would consider compensating such new employees in the appropriate share incentive scheme or in certain situations a cash sign on payment may be made on joining, subject to repayment should the employee leave the bank within a certain period.
Directors’ remuneration
Remuneration of executive directors
The remuneration packages and long-term incentives for executive directors are determined on the same basis and using the same qualifying criteria as for other
employees.
The compensation of the Chief Executive is subject to an annual review process that includes the Board.
The disclosure of the remuneration of the highest paid employees who are not directors is considered competitor sensitive and after due consideration, the Board has resolved not to publish the information.
non-executive directors’ remuneration and terms of engagement
Terms of service
All non-executive directors are provided with a letter of appointment setting out the terms of engagement. . Directors are appointed by shareholders at the AGM. Between AGMs interim appointments may be made by the Board. These interim appointees are required to retire at the following AGM where they then offer themselves for re-election by shareholders. In addition, one-third of non-executive directors are required to retire at each AGM and may offer themselves for re-election.
If supported by the Board, the Board then proposes their re-election to shareholders. There is no limitation on the number of times a non-executive director may stand for re-election. Proposals for re-election are based on individual performance and contribution.
Fees
Non-executive directors receive a fee for their service on the Board and a meeting attendance fee for board committee meeting. Fees are paid quarterly in arrears.
There are no contractual arrangements for compensation for loss of office. Non-executive directors do not receive short-term incentives, nor do they participate in any long-term incentive schemes. The Compensation Committee reviews the fees paid to non-executive directors annually and makes recommendations to the Board for consideration.
In determining the remuneration of non-executive directors, the Board considers the extent and nature of their responsibilities, and reviews of comparative remuneration offered by other major Ugandan and international banks.
The table below shows the breakdown of directors’ emoluments for the year ended 2015
category
Services as
Directors
Board
committee
fees
cash portion
of package
Performance
incentives *
other
benefits
Pension
contributions Total ushs ‘000 ushs ‘000 ushs ‘000 ushs ‘000 ushs ‘000 ushs ‘000 ushs ‘000
ushs ‘000 ushs ‘000 ushs ‘000 ushs ‘000 ushs ‘000 ushs ‘000 ushs ‘000
Executive directors - - 1,117,427 1,518,526 1,171,199 288,197 4,095,349
Non-executive directors 339, 759 160,949 - - 4,516 - 505,224
Former non-executive directors - - - - - - -
Total 339,759 160,949 1,117,427 1 518,526 1 175,715 288,197 4,600,573
The table below shows the breakdown of directors’ emoluments for the year ended 2014
Executive directors - - 1,634,422 1 147,993 1,444,807 317,253 4,544,475
Non-executive directors 423,836 129,856 - - - - 553,692
Former non-executive directors -
- - - - - -
Total 423,836 129,856 1,634,422 1,147,993 1,444,807 317,253 5,098,167
Performance-related pay is aligned to the financial year. Performance is assessed at the end of the year and paid in the following year.
The amounts herein are performance awards paid in the current year but relate to performance in the prior year.
CORpORATE GOvERNANCE
Remuneration report (continued)

58 Stanbic Bank Uganda Limited Annual Report and Financial Statements for the year ended 31 December, 2015
CORpORATE GOvERNANCE
Sow your seedswith our business
solutionsand reap the
rewards
Make use of our expertise for structured Agribusiness financing solutions. Whether you are a commercial Agriculture producer, post-harvest handler and warehousing supplier, you need to talk to us. We can assist you with supply, infrastructure, value addition and processing. If you need advise on handling production costs, structured trade or streamlining your cash flow, Stanbic Bank’s experienced and dedicated Agribusiness Relationship team will help you plant the seeds of success for growth in your business. Talk to us today.
Stanbic Bank - Agribusiness Financing 2th Floor, Short Tower, 17 Hannington Road, Crested Towers, P.O Box 7131, Kampala. Tel +256 417 154 600/210/654/886/446/449
Stanbic Bank
59Stanbic Bank Uganda Limited Annual Report and Financial Statements for the year ended 31 December, 2015
This report is provided by the audit committee in respect of the 2015 financial year of Stanbic Bank Uganda Limited. The committee’s operation is guided by a detailed mandate that is informed by the Companies Act, The Financial institutions Act and is approved by the board.
The committee is appointed by the board annually. Information on the membership and composition of the audit committee, its terms of reference and its activities is provided in greater detail in the corporate governance statement.
Execution of functionsThe audit committee has executed its duties and responsibilities during the financial year in accordance with its mandate as it relates to the Stanbic Bank accounting, internal auditing, internal control and financial reporting practices.
During the year under review, the committee, among other matters, considered the following:
In respect of the external auditors and the external audit:
• approvedthereappointmentofPricewaterhouseCoopers Certified Public Accountants Uganda. as external auditors for the financial year ended 31 December, 2015, in accordance with all applicable legal requirements
• approvedtheexternalauditors’termsof engagement, the audit plan and budgeted audit fees payable
• reviewedtheauditprocessandevaluated the effectiveness of the audit
• obtainedassurancefromtheexternalauditors that their independence was not impaired
• consideredthenatureandextentofall non-audit services provided by the external auditors
• throughthechairman,approvedproposed contracts with the external auditors for the provision of non-audit services and pre-approved proposed contracts with the external auditors for the provision of non-audit services above an agreed threshold amount
• confirmedthatnoreportableirregularities were identified and reported by the external auditors
In respect of the financial statements:
• confirmedthegoingconcernprincipleas the basis of preparation of the annual financial statements
• examinedandreviewedtheinterimandannual financial statements prior to submission and approval by the board
• reviewedreportsontheadequacyofthe provisions for performing and non-performing loans and impairment of
other assets, and the formulae applied by the Bank in determining charges for and levels of impairment of performing loans
• ensuredthattheannualfinancialstatements fairly present the financial position of the bank as at the end of the financial year and the results of operations and cash flows for the financial year and considered the basis on which the bank determined to be a going concern
• ensuredthattheannualfinancialstatements conform with IFRS
• consideredaccountingtreatments,significant unusual transactions and accounting judgements
• consideredtheappropriatenessofthe accounting policies adopted and changes thereto
• reviewedanddiscussedtheexternalauditors’ audit report
• consideredandmaderecommendationsto the board on the interim and final dividend payments to the shareholder
• notedthattherewerenomaterialreports or complaints received concerning accounting practices, internal audit, internal financial controls, content of the annual financial statements, internal controls and related matters.
In respect of the annual report:
• recommendedtheannualreporttotheboard for approval
• evaluatedmanagement’sjudgmentsand reporting decisions in relation to the annual report and ensured that all material disclosures are included
• reviewedforward-lookingstatements,financial and sustainability information
In respect of internal control, internal audit and financial crime control:
• reviewedandapprovedtheannualinternal audit charter and audit plan and evaluated the independence, effectiveness and performance of the internal audit department and compliance with its charter
• consideredreportsoftheinternalandexternal auditors on the group’s systems of internal control, including internal financial controls and maintenance of effective internal control systems
• reviewedsignificantissuesraisedby the internal audit processes and the adequacy of corrective action in response to such findings
• notedthattherewerenosignificantdifferences of opinion between the internal audit function and management
• assessedtheadequacyofthe
performance of the internal audit function and adequacy of the available internal audit resources and found them to be satisfactory
• receivedassurancethatproperandadequate accounting records were maintained and that the systems safeguarded the assets against unauthorised use or disposal thereof
• basedontheabove,thecommitteeformed the opinion that, at the date of this report, there were no material breakdowns in internal control, including internal financial controls, resulting in any material loss to the group
• reviewedandapprovedthemandateoffinancial crime as an independent risk function
• discussedsignificantfinancialcrimematters and control weaknesses identified
• reviewedanysignificantlegalandtaxmatters that could have a material impact on the financial statements
• consideredquarterlyreportsfromthegroup and company’s internal financial controls committee
• consideredtheindependentassessmentof the effectiveness of the internal audit function
• In respect of legal, regulatory and compliance requirements:
• reviewed,withmanagement,mattersthat could have a material impact on the Bank
• monitoredcompliancewiththeUgandanCompanies Act, the Financial Institutions Act, all other applicable legislation and governance codes and reviewed reports from internal audit, external auditors and compliance detailing the extent of this
• notedthatnocomplaintswerereceivedthrough the Banks’s ethics and fraud hotline concerning accounting matters, internal audit, internal financial controls, contents of financial statements, potential violations of the law and questionable accounting or auditing matters
• reviewedandapprovedtheannualcompliance mandate and compliance plan.
In respect of risk management and IT:
• consideredandreviewedreportsfrommanagement on risk management, including fraud and IT risks as they pertain to financial reporting and the going concern assessment
• thechairman is a member of and attended the risk and capital management committee and the Banks IT committee meetings held during the year under review.
Report of the audit committee
CORpORATE GOvERNANCE
60 Stanbic Bank Uganda Limited Annual Report and Financial Statements for the year ended 31 December, 2015
In respect of the coordination of assurance activities, the committee:
• reviewedtheplansandworkoutputsof the external and internal auditors as well as compliance and financial crime control, and concluded that these were adequate to address all significant financial risks facing the business
• consideredtheexpertise,resourcesandexperience of the finance function and the senior members of management responsible for this function and concluded that these were appropriate
• consideredtheappropriatenessoftheexperience and expertise of the group financial director and concluded that these were appropriate.
Independence of the external auditors The audit committee is satisfied that PricewaterhouseCoopers Certified Public Accountants. are independent of the bank. This conclusion was arrived at, inter alia, after taking into account the following factors:
• the representations made by PricewaterhouseCoopers Certified Public Accountants Uganda to the audit committee
• the auditors do not, except as external auditors or in rendering permitted non-audit services, receive any remuneration or other benefits from the bank
• the auditors’ independence was not impaired by any consultancy, advisory or other work undertaken by the auditors
• the auditors’ independence was not prejudiced as a result of any previous appointment as auditor
• the criteria specified for independence by the Independent Regulatory Board for Auditors and international regulatory bodies were met.
In conclusion, the audit committee has complied with its legal, regulatory and governance responsibilities as set out in its mandate.
On behalf of the audit committee
chairman, audit committee
23 March 2016
CORpORATE GOvERNANCE
Report of the audit committee (continued)
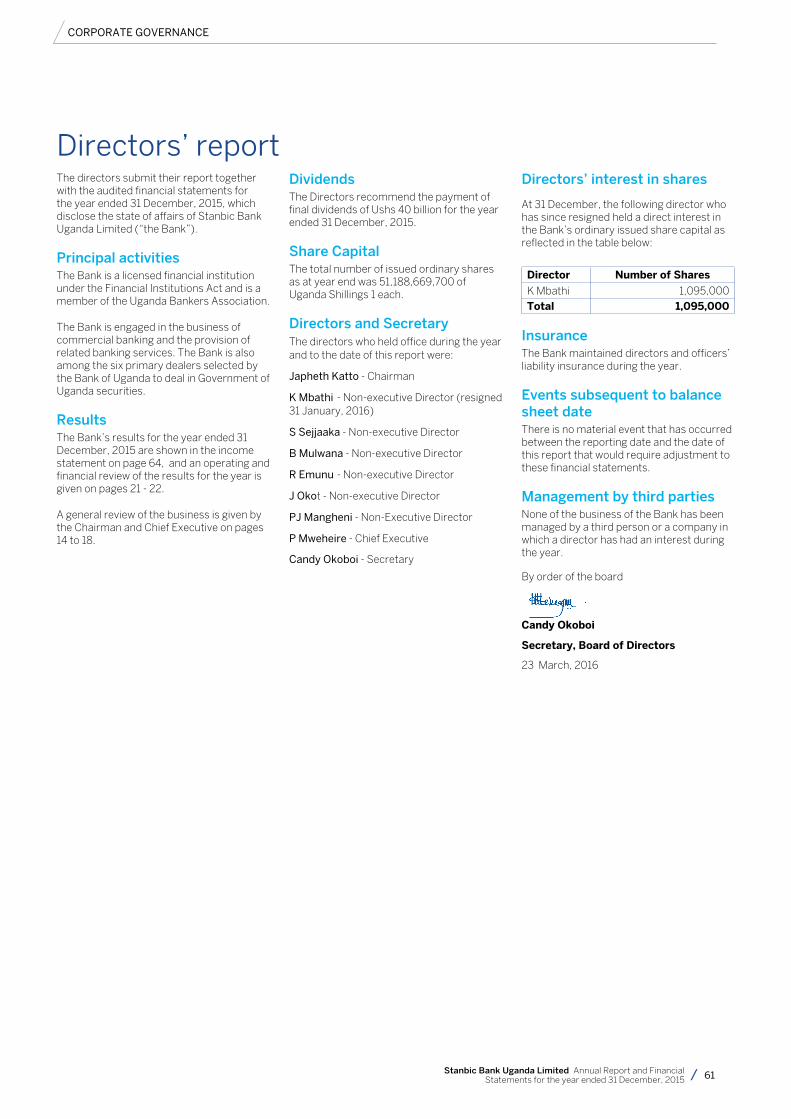
61Stanbic Bank Uganda Limited Annual Report and Financial Statements for the year ended 31 December, 2015
The directors submit their report together with the audited financial statements for the year ended 31 December, 2015, which disclose the state of affairs of Stanbic Bank Uganda Limited (“the Bank”).
principal activitiesThe Bank is a licensed financial institution under the Financial Institutions Act and is a member of the Uganda Bankers Association.
The Bank is engaged in the business of commercial banking and the provision of related banking services. The Bank is also among the six primary dealers selected by the Bank of Uganda to deal in Government of Uganda securities.
Results The Bank’s results for the year ended 31 December, 2015 are shown in the income statement on page 64, and an operating and financial review of the results for the year is given on pages 21 - 22.
A general review of the business is given by the Chairman and Chief Executive on pages 14 to 18.
DividendsThe Directors recommend the payment of final dividends of Ushs 40 billion for the year ended 31 December, 2015.
Share CapitalThe total number of issued ordinary shares as at year end was 51,188,669,700 of Uganda Shillings 1 each.
Directors and SecretaryThe directors who held office during the year and to the date of this report were:
Japheth Katto - Chairman
K Mbathi - Non-executive Director (resigned 31 January, 2016)
S Sejjaaka - Non-executive Director
B Mulwana - Non-executive Director
R Emunu - Non-executive Director
J Okot - Non-executive Director
pJ Mangheni - Non-Executive Director
p Mweheire - Chief Executive
Candy Okoboi - Secretary
Directors’ interest in shares
At 31 December, the following director who has since resigned held a direct interest in the Bank’s ordinary issued share capital as reflected in the table below:
Director number of Shares
K Mbathi 1,095,000
Total 1,095,000
InsuranceThe Bank maintained directors and officers’ liability insurance during the year.
Events subsequent to balance sheet dateThere is no material event that has occurred between the reporting date and the date of this report that would require adjustment to these financial statements.
Management by third partiesNone of the business of the Bank has been managed by a third person or a company in which a director has had an interest during the year.
By order of the board
candy okoboi
Secretary, Board of Directors
23 March, 2016
CORpORATE GOvERNANCE
Directors’ report
62 Stanbic Bank Uganda Limited Annual Report and Financial Statements for the year ended 31 December, 2015
The Ugandan Companies Act requires the directors to prepare financial statements for each financial year that give a true and fair view of the state of affairs of the Bank as at the end of the financial year and of its profit or loss. It also requires the directors to ensure that the Bank keeps proper accounting records that disclose, with reasonable accuracy, the financial position of the Bank. They are also responsible for safeguarding the assets of the Bank.
The directors accept responsibility for the financial statements, which have been prepared using appropriate accounting policies supported by reasonable estimates, in conformity with International Financial Reporting Standards and in the manner required by the Ugandan Companies Act and the Financial Institutions Act. The directors are of the opinion that the financial statements give a true and fair view of the state of the financial affairs of the Bank and of its profit in accordance with International Financial Reporting Standards. The directors further accept responsibility for the maintenance of accounting records that may be relied upon in the preparation of financial statements and of such internal control as the directors determine is necessary to enable the preparation of financial statements that are free from material misstatements, whether due to fraud or error.
Nothing has come to the attention of the directors to indicate that the Bank will not remain a going concern for at least twelve months from the date of this statement.
……………………………………... …………………………………….
chairman chief executive
23 March, 2016 23 March, 2016
Report on the financial statements
CORpORATE GOvERNANCE
Statement of directors’ responsibility
63Stanbic Bank Uganda Limited Annual Report and Financial Statements for the year ended 31 December, 2015
Report on the financial statements We have audited the accompanying financial statements of Stanbic Bank Uganda Limited (the Bank), set out on pages 64 to 117. These financial statements comprise the statement of financial position as at 31 December 2015, the income statement and the statement of comprehensive income, statement of changes in equity and statement of cash flows for the year then ended, and a summary of significant accounting policies and other explanatory notes.
Directors’ responsibility for the financial statementsThe directors are responsible for the preparation of financial statements that give a true and fair view in accordance with International Financial Reporting Standards and in the manner required by the Financial Institutions Act and the Ugandan Companies Act, and for such internal control as the directors determine is necessary to enable the preparation of financial statements that are free from material misstatement, whether due to fraud or error.
Auditor’s responsibilityOur responsibility is to express an independent opinion on the financial statements based on our audit. We conducted our audit in accordance with International Standards on Auditing. Those standards require that we comply with ethical requirements and plan and perform our audit to obtain reasonable assurance about whether the financial statements are free from material misstatement.
An audit involves performing procedures to obtain audit evidence about the amounts and disclosures in the financial statements. The procedures selected depend on the auditor’s judgement, including the assessment of the risks of material misstatement of financial statements, whether due to fraud or error. In making those risk assessments, the auditor considers internal controls relevant to the entity’s preparation of financial statements that give a true and fair view in order to design audit procedures that are appropriate in the circumstances, but not for the purpose of expressing an opinion on the effectiveness of the Bank’s internal controls. An audit also involves evaluating the appropriateness of accounting policies used and the reasonableness of accounting estimates made by the directors, as well as evaluating the overall presentation of the financial statements.
We believe that the audit evidence we have obtained is sufficient and appropriate to provide a basis for our opinion.
opinionIn our opinion the financial statements give a true and fair view of the state of the financial affairs of the Bank as at 31 December 2015 and of its profit and cash flows for the year then ended in accordance with International Financial Reporting Standards, the Ugandan Companies Act and the Financial Institutions Act.
Report on other legal and regulatory requirementsThe Ugandan Companies Act requires that in carrying out our audit we consider and report to you on the following matters. We confirm that:
i) we have obtained all the information and explanations which to the best of our knowledge and belief were necessary for the purposes of our audit;
ii) in our opinion proper books of account have been kept by the Bank, so far as appears from our examination of those books; and
iii) the Bank’s statement of financial position and income statement are in agreement with the books of account.
Certified Public Accountants
Kampala, Uganda
14 April 2016
Report of the independent auditor to the Members of Stanbic Bank Uganda Limited
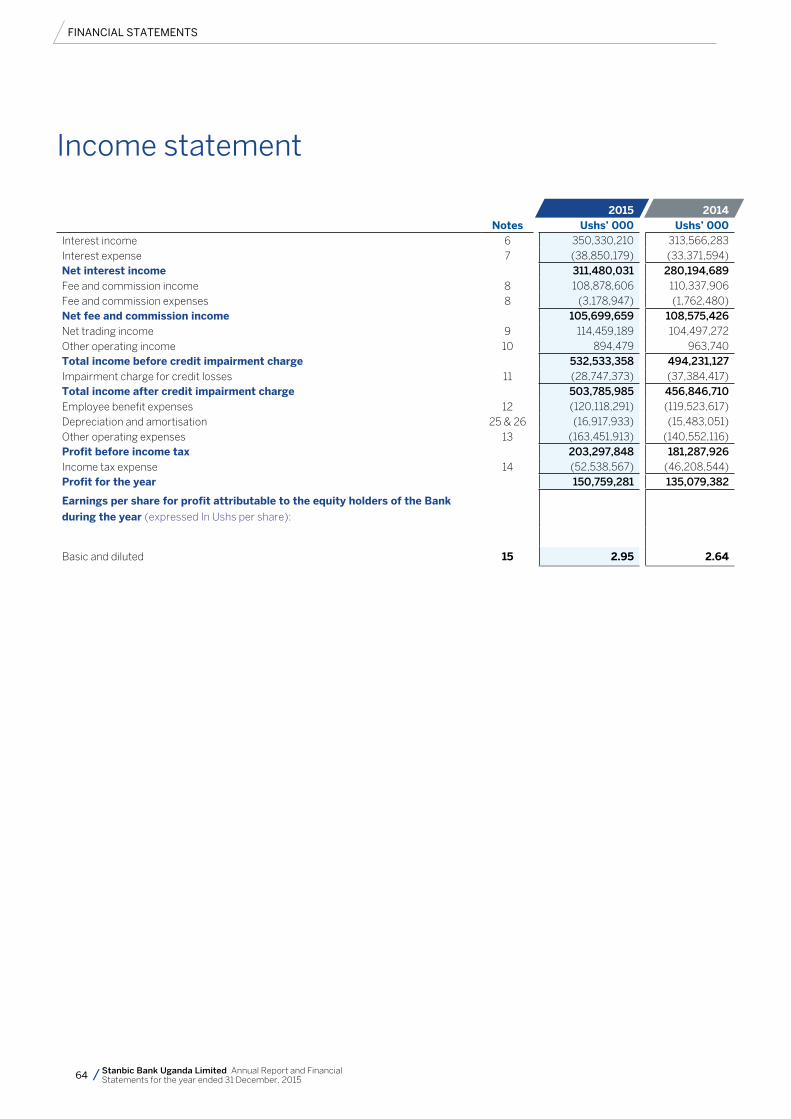
64 Stanbic Bank Uganda Limited Annual Report and Financial Statements for the year ended 31 December, 2015
2015 2014 notes ushs’ 000 ushs’ 000Interest income 6 350,330,210 313,566,283Interest expense 7 (38,850,179) (33,371,594)net interest income 311,480,031 280,194,689Fee and commission income 8 108,878,606 110,337,906Fee and commission expenses 8 (3,178,947) (1,762,480)net fee and commission income 105,699,659 108,575,426Net trading income 9 114,459,189 104,497,272Other operating income 10 894,479 963,740Total income before credit impairment charge 532,533,358 494,231,127Impairment charge for credit losses 11 (28,747,373) (37,384,417)Total income after credit impairment charge 503,785,985 456,846,710Employee benefit expenses 12 (120,118,291) (119,523,617)Depreciation and amortisation 25 & 26 (16,917,933) (15,483,051)Other operating expenses 13 (163,451,913) (140,552,116)Profit before income tax 203,297,848 181,287,926Income tax expense 14 (52,538,567) (46,208,544)Profit for the year 150,759,281 135,079,382
earnings per share for profit attributable to the equity holders of the Bank
during the year (expressed In Ushs per share):
Basic and diluted 15 2.95 2.64
Income statement
FINANCIAL STATEMENTS

65Stanbic Bank Uganda Limited Annual Report and Financial Statements for the year ended 31 December, 2015
Statement of comprehensive income
2015 2014
notes ushs’ 000 ushs’ 000
Profit for the year
other comprehensive income for the year after tax: 150,759,281 135,079,382
Loss on available for sale financial assets net of tax 28 (8,829,581) (3,757,585)
Total comprehensive income for the year 141,929,700 131,321,797
FINANCIAL STATEMENTS
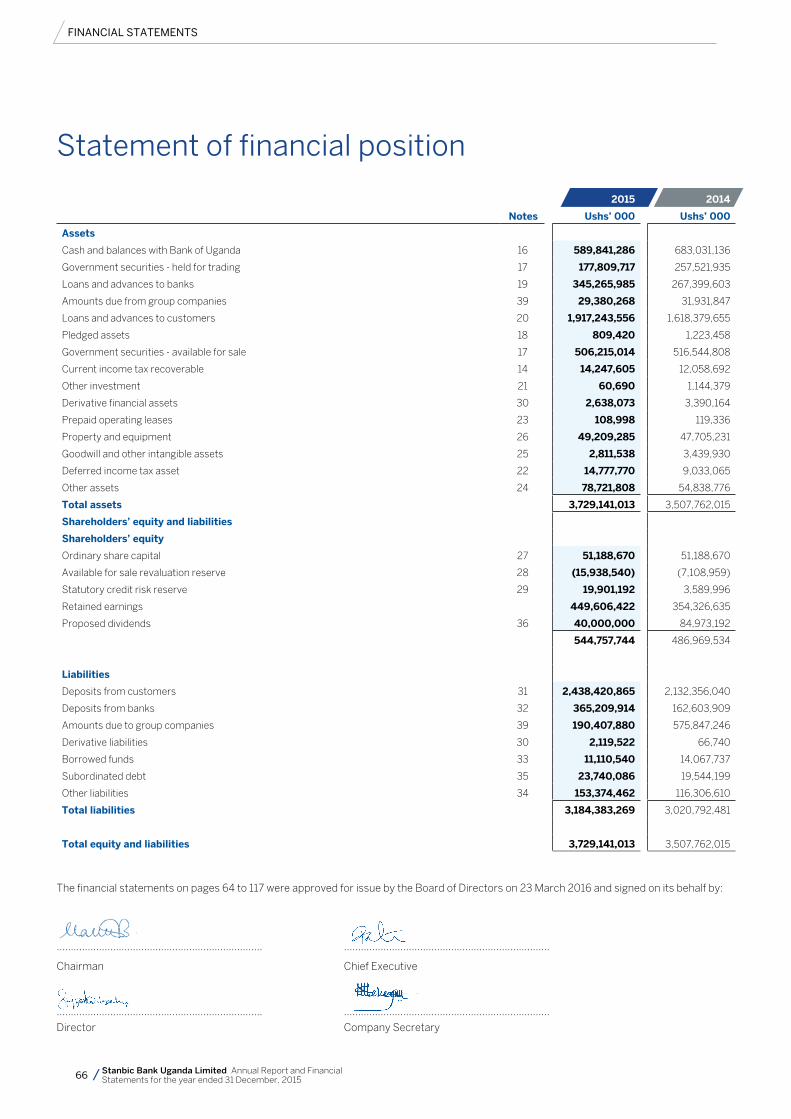
66 Stanbic Bank Uganda Limited Annual Report and Financial Statements for the year ended 31 December, 2015
2015 2014
notes ushs’ 000 ushs’ 000
Assets
Cash and balances with Bank of Uganda 16 589,841,286 683,031,136
Government securities - held for trading 17 177,809,717 257,521,935
Loans and advances to banks 19 345,265,985 267,399,603
Amounts due from group companies 39 29,380,268 31,931,847
Loans and advances to customers 20 1,917,243,556 1,618,379,655
Pledged assets 18 809,420 1,223,458
Government securities - available for sale 17 506,215,014 516,544,808
Current income tax recoverable 14 14,247,605 12,058,692
Other investment 21 60,690 1,144,379
Derivative financial assets 30 2,638,073 3,390,164
Prepaid operating leases 23 108,998 119,336
Property and equipment 26 49,209,285 47,705,231
Goodwill and other intangible assets 25 2,811,538 3,439,930
Deferred income tax asset 22 14,777,770 9,033,065
Other assets 24 78,721,808 54,838,776
Total assets 3,729,141,013 3,507,762,015
Shareholders’ equity and liabilities
Shareholders’ equity
Ordinary share capital 27 51,188,670 51,188,670
Available for sale revaluation reserve 28 (15,938,540) (7,108,959)
Statutory credit risk reserve 29 19,901,192 3,589,996
Retained earnings 449,606,422 354,326,635
Proposed dividends 36 40,000,000 84,973,192
544,757,744 486,969,534
Liabilities
Deposits from customers 31 2,438,420,865 2,132,356,040
Deposits from banks 32 365,209,914 162,603,909
Amounts due to group companies 39 190,407,880 575,847,246
Derivative liabilities 30 2,119,522 66,740
Borrowed funds 33 11,110,540 14,067,737
Subordinated debt 35 23,740,086 19,544,199
Other liabilities 34 153,374,462 116,306,610
Total liabilities 3,184,383,269 3,020,792,481
Total equity and liabilities 3,729,141,013 3,507,762,015
The financial statements on pages 64 to 117 were approved for issue by the Board of Directors on 23 March 2016 and signed on its behalf by:
………………………………………………………………. ……………………………………………………………….
Chairman Chief Executive
………………………………………………………………. ……………………………………………………………….
Director Company Secretary
Statement of financial position
FINANCIAL STATEMENTS
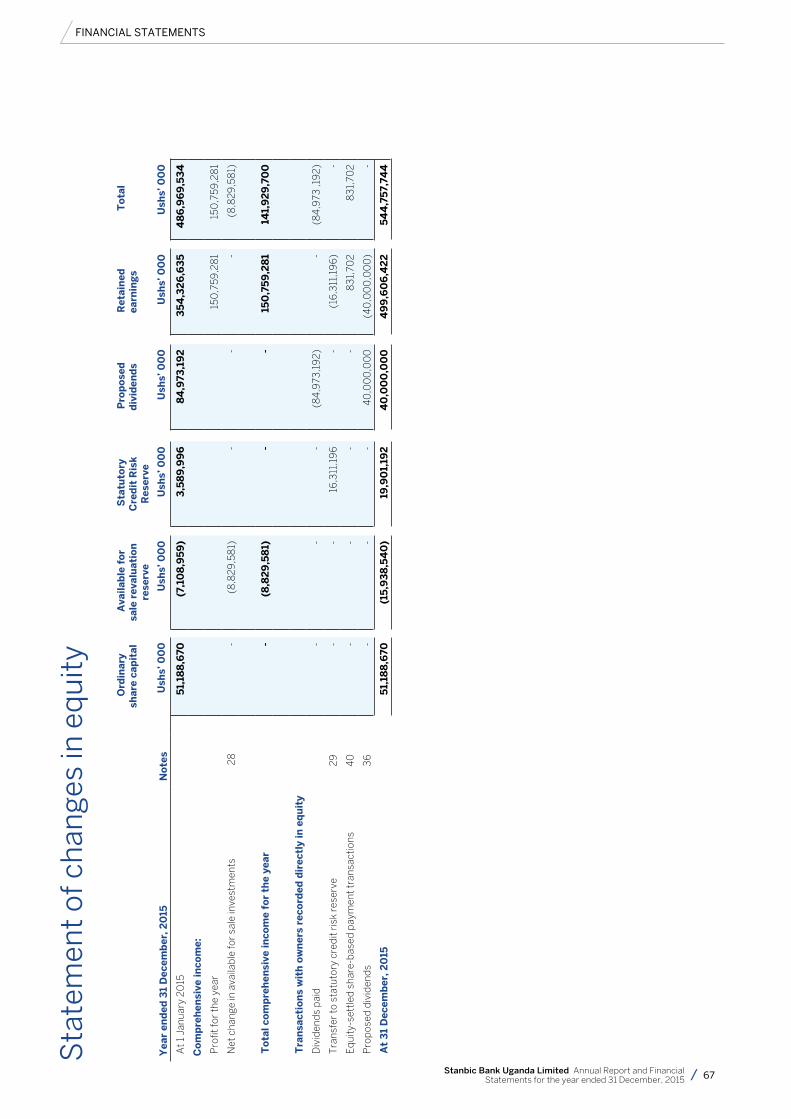
67Stanbic Bank Uganda Limited Annual Report and Financial Statements for the year ended 31 December, 2015
Sta
tem
ent
of c
han
ges
in e
qu
ity
ord
inar
y sh
are
cap
ital
A
vail
able
fo
r sa
le r
eval
uat
ion
re
serv
e
Sta
tuto
ry
cre
dit
Ris
k
Res
erve
Pro
po
sed
d
ivid
end
s R
etai
ned
ea
rnin
gs
To
tal
yea
r en
ded
31
Dec
emb
er, 2
015
no
tes
ush
s’ 0
00
u
shs’
00
0
ush
s’ 0
00
u
shs’
00
0
ush
s’ 0
00
u
shs’
00
0
At 1
Jan
uary
20
15
51,
188
,670
(7,1
08
,95
9)
3,5
89
,99
68
4,9
73,1
92
35
4,3
26
,63
54
86
,96
9,5
34
co
mp
reh
ensi
ve in
com
e:
Pro
fit fo
r th
e ye
ar
150
,759
,28
115
0,7
59,2
81
Net
cha
nge
in a
vaila
ble
for
sale
inve
stm
ents
2
8
- (8
,82
9,5
81)
-
-
-
(8
,82
9,5
81)
To
tal c
om
pre
hen
sive
inco
me
for
the
year
-
(
8,8
29
,58
1)
-
-
15
0,7
59
,28
114
1,9
29
,70
0
Tra
nsa
ctio
ns
wit
h o
wn
ers
reco
rded
dir
ectl
y in
eq
uit
y
Div
iden
ds
pai
d
-
-
-
(84
,973
,19
2)
-
(8
4,9
73 ,1
92
)
Tra
nsfe
r to
sta
tuto
ry c
red
it ri
sk r
eser
ve
29
-
-
16,3
11,1
96
-
(1
6,3
11,1
96
)
-
Eq
uity
-set
tled
sha
re-b
ased
pay
men
t tra
nsac
tions
4
0
-
-
-
-
83
1,70
2
83
1,70
2
Pro
pos
ed d
ivid
end
s3
6
-
-
-
4
0,0
00
,00
0
(40
,00
0,0
00
)
-
At
31
Dec
emb
er, 2
015
5
1,18
8,6
70
(
15,9
38
,54
0)
19
,90
1,19
2
4
0,0
00
,00
0
4
99
,60
6,4
22
5
44
,75
7,74
4
FINANCIAL STATEMENTS
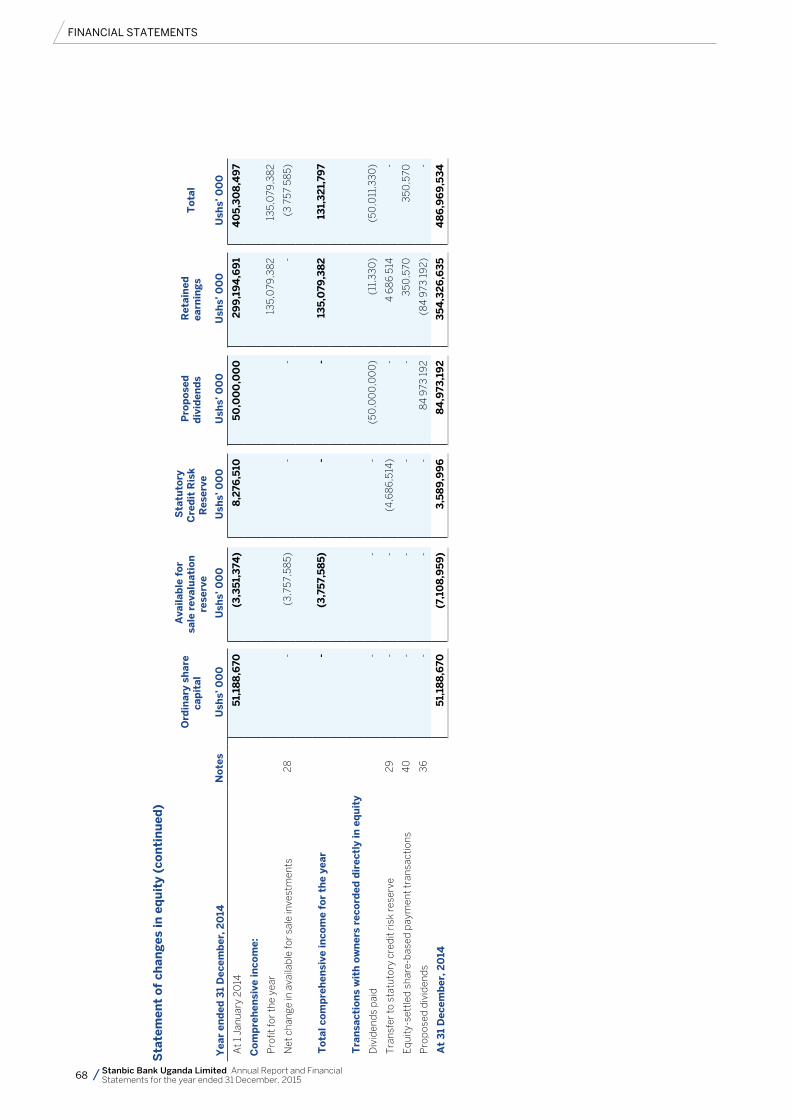
68 Stanbic Bank Uganda Limited Annual Report and Financial Statements for the year ended 31 December, 2015
Sta
tem
ent
of
chan
ges
in e
qu
ity
(co
nti
nu
ed)
ord
inar
y sh
are
cap
ital
Ava
ilab
le f
or
sale
rev
alu
atio
n
rese
rve
Sta
tuto
ry
cre
dit
Ris
k
Res
erve
Pro
po
sed
d
ivid
end
s R
etai
ned
ea
rnin
gs
To
tal
yea
r en
ded
31
Dec
emb
er, 2
014
no
tes
ush
s’ 0
00
u
shs’
00
0
ush
s’ 0
00
u
shs’
00
0
ush
s’ 0
00
u
shs’
00
0
At 1
Jan
uary
20
14
51,
188
,670
(3
,35
1,3
74)
8
,276
,510
50
,00
0,0
00
2
99
,19
4,6
91
4
05
,30
8,4
97
co
mp
reh
ensi
ve in
com
e:
Pro
fit fo
r th
e ye
ar
13
5,0
79,3
82
135,
079
,38
2
Net
cha
nge
in a
vaila
ble
for
sale
inve
stm
ents
2
8
-
(3
,757
,58
5)
-
-
-
(3
757
58
5)
To
tal c
om
pre
hen
sive
inco
me
for
the
year
-
(3
,75
7,5
85
)
-
-
1
35
,079
,38
2
13
1,3
21,
797
Tra
nsa
ctio
ns
wit
h o
wn
ers
reco
rded
dir
ectl
y in
eq
uit
y
Div
iden
ds
pai
d
-
-
-
(5
0,0
00
,00
0)
(1
1,3
30
)
(50
,011
,33
0)
Tra
nsfe
r to
sta
tuto
ry c
red
it ri
sk r
eser
ve
29
-
-
(4
,68
6,5
14)
-
4
68
6 5
14
-
Eq
uity
-set
tled
sha
re-b
ased
pay
men
t tra
nsac
tions
4
0
-
-
-
-
3
50,5
70
350
,570
Pro
pos
ed d
ivid
end
s3
6
-
-
-
8
4 9
73 1
92
(84
973
19
2)
-
At
31
Dec
emb
er, 2
014
5
1,18
8,6
70
(7,
108
,95
9)
3,5
89
,99
6
84
,973
,19
2
3
54
,32
6,6
35
4
86
,96
9,5
34
FINANCIAL STATEMENTS
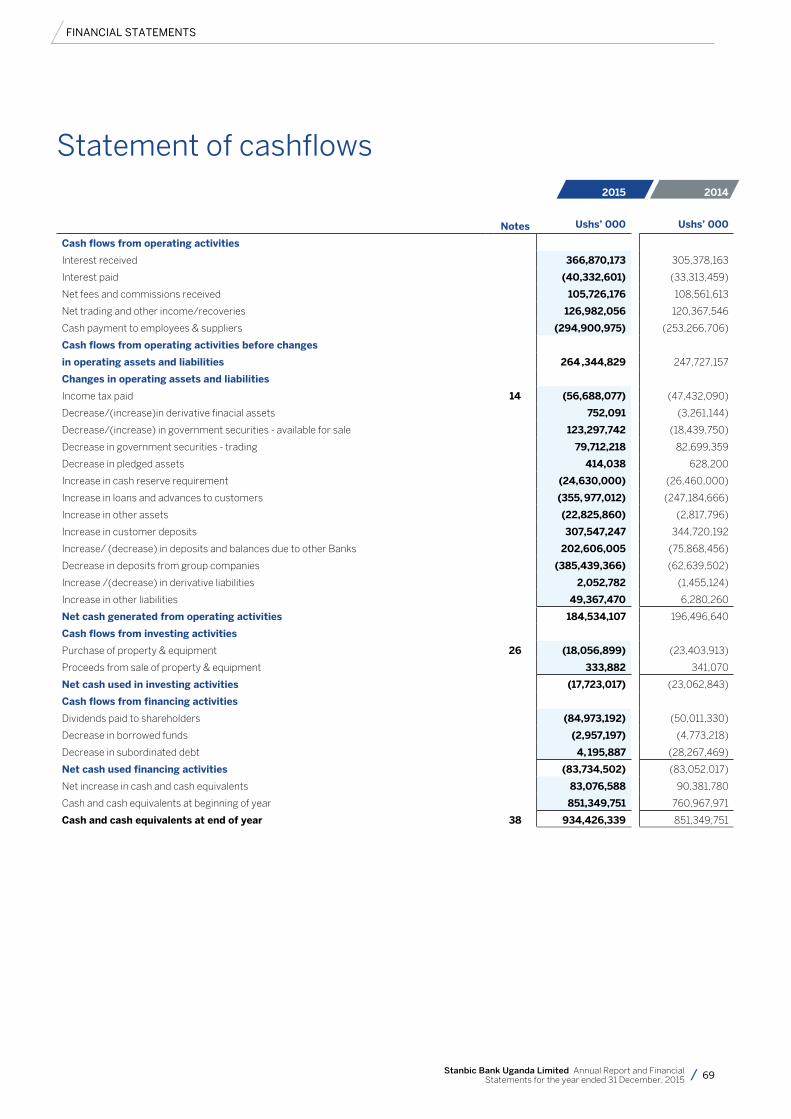
69Stanbic Bank Uganda Limited Annual Report and Financial Statements for the year ended 31 December, 2015
2015 2014
2015 2014
notes ushs’ 000 ushs’ 000
cash flows from operating activities
Interest received 366,870,173 305,378,163
Interest paid (40,332,601) (33,313,459)
Net fees and commissions received 105,726,176 108,561,613
Net trading and other income/recoveries 126,982,056 120,367,546
Cash payment to employees & suppliers (294,900,975) (253,266,706)
cash flows from operating activities before changes
in operating assets and liabilities 264 ,344,829 247,727,157
changes in operating assets and liabilities
Income tax paid 14 (56,688,077) (47,432,090)
Decrease/(increase)in derivative finacial assets 752,091 (3,261,144)
Decrease/(increase) in government securities - available for sale 123,297,742 (18,439,750)
Decrease in government securities - trading 79,712,218 82,699,359
Decrease in pledged assets 414,038 628,200
Increase in cash reserve requirement (24,630,000) (26,460,000)
Increase in loans and advances to customers (355, 977,012) (247,184,666)
Increase in other assets (22,825,860) (2,817,796)
Increase in customer deposits 307,547,247 344,720,192
Increase/ (decrease) in deposits and balances due to other Banks 202,606,005 (75,868,456)
Decrease in deposits from group companies (385,439,366) (62,639,502)
Increase /(decrease) in derivative liabilities 2,052,782 (1,455,124)
Increase in other liabilities 49,367,470 6,280,260
net cash generated from operating activities 184,534,107 196,496,640
cash flows from investing activities
Purchase of property & equipment 26 (18,056,899) (23,403,913)
Proceeds from sale of property & equipment 333,882 341,070
net cash used in investing activities (17,723,017) (23,062,843)
cash flows from financing activities
Dividends paid to shareholders (84,973,192) (50,011,330)
Decrease in borrowed funds (2,957,197) (4,773,218)
Decrease in subordinated debt 4, 195,887 (28,267,469)
net cash used financing activities (83,734,502) (83,052,017)
Net increase in cash and cash equivalents 83,076,588 90,381,780
Cash and cash equivalents at beginning of year 851,349,751 760,967,971
cash and cash equivalents at end of year 38 934,426,339 851,349,751
Statement of cashflows
FINANCIAL STATEMENTS
70 Stanbic Bank Uganda Limited Annual Report and Financial Statements for the year ended 31 December, 2015
1 General informationStanbic Bank Uganda Limited provides personal, business, corporate and investment Banking services in Uganda. The Bank is a limited liability company and is incorporated and domiciled in Uganda. The address of its registered office is:
Plot 17 Hannington RoadShort Tower - Crested TowersP O Box 7131 Kampala
The Bank’s shares are listed on the Uganda Securities Exchange (USE).
For Ugandan Companies Act reporting purposes, the balance sheet is represented by the statement of financial position and the profit and loss account by the income statement in these financial statements.
2 Summary of significant accounting policies
The principal accounting policies adopted in the preparation of these financial statements are set out below. These policies have been consistently applied to all years presented, unless otherwise stated.
a) Basis of preparationThe annual financial statements are prepared in compliance with International Financial Reporting Standards (IFRS) as issued by the International Accounting Standards Board (IASB) and in the manner required by the Companies Act 2012. and the Financial Institutions Act. The financial statements are presented in the functional currency, Uganda Shillings (Ushs), rounded to the nearest thousand, and prepared under the historical cost convention except for assets and liabilities held for trading, financial instruments designated at fair value through profit or loss; liabilities for cash-settled share-based payment arrangements and available-for-sale financial assets that are measured at fair value.
The preparation of the financial statements in conformity with IFRS requires management to make judgements, estimates and assumptions that affect the application of accounting policies and the reported amounts of assets, liabilities, income and expenses. Actual results may differ from these estimates.
The following principle accounting policy elections in terms of IFRS have been made, with reference to the detailed accounting policies shown in brackets:
• purchases and sales of financial assets under a contract whose terms require delivery of the asset within the time frame established generally by regulation or convention in the
marketplace concerned are recognised and derecognised using trade date accounting (accounting policy (i));
• The portfolio exception to measure the fair value of certain groups of financial assets and financial liabilities on a net basis (accounting policy (i)).
• intangible assets and property and equipment are accounted for using the cost model (accounting policy K and U)
Estimates and underlying assumptions are reviewed on an ongoing basis. Revisions to accounting estimates are recognised in the period in which the estimate is revised and in any future periods affected.
Information about significant areas of estimation uncertainty and critical judgements in applying accounting policies that have the most significant effect on the amounts recognised in the consolidated financial statements are described in notes 4.
new and amended standards adopted by the Bank
IAS 16 property, plant and Equipment (IAS 16) and IAS 38 Intangible Assets (IAS 38) – Clarification of Acceptable Methods of Depreciation and Amortisation (2014 amendment)
The amendments to IAS 16 and IAS 38 remove perceived inconsistencies in the accounting for accumulated depreciation/amortization when an item of property, plant and equipment or an intangible asset is revalued. The amended standards clarify that the gross carrying amount is adjusted in a manner consistent with the revaluation of the carrying amount of the asset and that accumulated depreciation / amortization is the difference between the gross carrying amount and the carrying amount after taking into account accumulated impairment losses.
This amendment has no impact on the Bank’s financial statements.
IFRS 10 and IAS 28 Sale or Contribution of Assets between an investor and its associate or joint venture (Annual periods beginning on or after 1 January 2016) The Bank has early adopted this standard.
The amendments address an inconsistency between the requirements in IFRS 10 and those in IAS 28, in dealing with the sale or contribution of assets between an investor and its associate or joint venture.
The main consequence of the amendments is that a full gain or loss is recognized when a transaction involves a business (whether
it is housed in a subsidiary or not). A partial gain or loss is recognized when a transaction involves assets that do not constitute a business, even if these assets are housed in a subsidiary.
The amendments will be applied prospectively and have no impact on the Bank’s financial statements.
IAS 1 presentation of Financial Amendments (effective annual periods beginning on or after 1 January 2016)
The amendments clarifies that materiality applies to the financial statements as a whole and that the inclusion of immaterial information can inhibit the usefulness of the financial disclosures. The amendment further states that professional judgement should be used in determining where and in what order information is presented in the financial disclosures.
The amendment will be applied retrospectively. The revised standards and interpretations did not have any effect on the Banks reported earnings or financial statement position and had no material impact on the accounting policies.
IFRS 7, ‘Financial instruments: Disclosures - Servicing Contracts
The standard relates to when an entity transfers a financial asset, and may retain the right to a servicing contract for a fee. The entity assesses the servicing contract in accordance with the guidance provided to decide whether the entity has continuing involvement as a result of the servicing contract for the purposes of the disclosure requirements.
The amendment will be applied retrospectively and has no impact on the Banks financial statements.
Standards and interpretations issued but not yet effective
IFRS 16 Leases(effective for Annual periods beginning on or after 1 January
2019)
This standard will replace the existing standard IAS 17 Leases as well as the related interpretations and sets out the principles for the recognition, measurement, presentation and disclosure of leases for both parties to a contract, being the lessee (customer) and the lessor (supplier).
The core principle of this standard is that the lessee and lessor should recognise all rights and obligations arising from leasing arrangements on balance sheet.
Notes
FINANCIAL STATEMENTS NOTES
71Stanbic Bank Uganda Limited Annual Report and Financial Statements for the year ended 31 December, 2015
The most significant change pertaining to the accounting treatment of operating leases is from the lessees’ perspective. IFRS 16 eliminates the classification of leases as either operating leases or finance leases as is required by IAS 17 and introduces a single lessee accounting model, where a right of use (ROU) asset together with a liability for the future payments is to be recognised for all leases with a term of more than 12 months, unless the underlying asset is of low value.
The lessor accounting requirements in IAS 17 has not changed substantially in terms of this standard as a result a lessor continues to classify its leases as operating leases or finance leases and accounts for these as it currently done in terms of IAS 17.
In addition, the standard requires lessor to provide enhanced disclosures about its leasing activities and in particular about its exposure to residual value risk and how it is managed.
The standard will be applied retrospectively. The impact on the annual financial statements has not yet been fully determined.
IFRS 9, ‘Financial instruments’ (applicable beginning on or after 1 January 2018)
IFRS 9 issued in July 2014 as a complete standard and replaces IAS 39 Financial instruments; recognition and measurement of financial instruments and all previous versions of IFRS9. The standard introduces new requirements for the classification and measurement, impairment and hedged accounting. Key features are as follows:
• Financial assets are required to be classified into two measurement categories: those to be measured subsequently at fair value, and those to be measured subsequently at amortised cost. The decision is to be made at initial recognition. The classification depends on the entity’s business model for managing its financial instruments and the contractual cash flow characteristics of the instrument.
• An instrument is subsequently measured at amortised cost only if it is a debt instrument and both the objective of the entity’s business model is to hold the asset to collect the
Contractual cash flows, and the asset’s contractual cash flows represent only payments of principal and interest (that is, it has only ‘basic loan features’).
All other debt instruments are to be measured at fair value through the income statement.
• Allequityinstrumentsaretobemeasured subsequently at fair value. Equity instruments that are held for trading will be measured at fair value through profit or loss. For all other equity investments, an irrevocable election can be made at initial recognition, to recognise unrealised and realised fair value gains and losses through other comprehensive income rather than profit or loss. There is to be no recycling of fair value gains and losses to profit or loss. This election may be made on an instrument-by-instrument basis. Dividends are to be presented in profit or loss, as long as they represent a return on investment.
Under the new standard, entities with financial liabilities at fair value through profit or loss recognise changes in the liability’s credit risk directly in other comprehensive income. There is no subsequent recycling of the amounts in other comprehensive income to profit or loss, but accumulated gains or losses may be transferred within equity.
The standard introduces a new expected-loss impairment model that will require more timely recognition of expected credit losses. This new model will apply to financial assets measured at either amortised cost or fair value through other comprehensive income, as well as loan commitments when there is present commitment to extend credit unless these are measured at fair value through profit or loss.
With the exception of purchased or originated credit impaired financial assets, expected credit losses are required to be measured through a loss allowance at an amount equal to either 12-month expected credit losses or full lifetime expected credit losses.
A loss allowance for full lifetime expected credit losses is required for a financial instrument if the credit risk of that financial instrument has increased significantly since initial recognition as well as for certain contract assets or trade receivables. For all other financial instruments, expected credit losses are measured at an amount equal to 12-month expected credit losses.
The revised general hedge accounting requirements are better aligned with an entity’s risk management activities and provide additional opportunities to apply hedge accounting and various simplifications in achieving hedge accounting.
While adoption of IFRS 9 is mandatory from 1 January 2018, earlier adoption is permitted. The Bank is considering the implications of the Standard, the impact on the Bank and the timing of its adoption.
IFRS 15, ‘Revenue from Contracts with Customers’ (applicable beginning on or
after 1 January 2018
This standard will replace the existing revenue standards and their related interpretations. The standard sets out the requirements for recognising revenue that applies to all contracts with customers except for contracts that are within the scope of the standards on leases, insurance contracts or financial instruments.
The core principle of the standard is that revenue recognised reflects the consideration to which the company expects to be entitled in exchange for the transfer of promised goods or services to the customer.
The standard incorporates a five step analysis to determine the amount and timing of revenue recognition which include.
• Identifythecontract(s)withacustomer
• Identifytheperformanceobligationsinthe contract
• Determinethetransactionprice
• Allocatethetransactionpricetotheperformance obligations in the contract
• Recogniserevenuewhen(oras)theentity satisfies a performance obligation
The standard will be applied retrospectively. The impact on the Banks financial statements has yet been fully determined
There are no other IFRSs or IFRIC interpretations that are not yet effective that would have a material impact on the financial statements of the Bank.
(b) Interest income and expense Interest income and expense are recognised in the income statement using the effective interest method for all interest bearing financial instruments, except for those classified at fair value through profit or loss using the effective interest method.The effective interest method is a method of calculating the amortised cost of a financial asset or a financial liability and of allocating the interest income or interest expense over the relevant period. The effective interest rate is the rate that exactly discounts estimated future cash payments or receipts through the expected life of the financial instrument or, when appropriate, a shorter period to the net carrying amount of the financial asset or financial liability. The calculation includes all fees paid or received between parties to the contract that are an integral part of the effective interest rate,
FINANCIAL STATEMENTS NOTES
2 Summary of significant accounting policies (continued)
72 Stanbic Bank Uganda Limited Annual Report and Financial Statements for the year ended 31 December, 2015
transaction costs and all other premiums or discounts.
Interest income and expense presented in the income statement include interest on financial assets and financial liabilities measured at amortised cost.
When loans and advances become doubtful of collection, they are written down to their recoverable amounts and interest income is thereafter recognised based on the original effective interest rate that is used to discount future cash flows for the purpose of measuring the recoverable amount.
Fair value gains and losses on realised debt financial instruments, including amounts reclassified from OCI in respect of available-for-sale debt financial assets, and excluding those classified as held-for-trading, are included in net interest income
(c) Fees and commissionFees and commission income and expense that are integral to the effective interest rate on a financial asset or liability are included in the measurement of the effective interest rate. Loan commitment fees for loans that are likely to be drawn down are deferred (together with related direct costs) and recognised over the life of the loan.
Fees and commissions are generally recognised on an accrual basis when the service has been provided.
(d) net trading revenueNet trading revenue comprises gains or losses related to trading assets and liabilities, and include all realised and unrealised fair value changes, interest and foreign exchange differences.
(e) net income from other financial instruments at fair value through income statement
Net income from other financial instruments at fair value through income statement relates to non-trading derivatives held for risk management purposes that do not form part of a qualifying hedge relationship and financial assets and liabilities designated at fair value through the income statement, and include all realised and unrealised fair value changes, interest and foreign exchange differences.
(f) DividendsDividend income is recognised when the right to receive income is established. Usually this is the ex-dividend date for equity securities. Dividends are reflected as a component of other operating income based on the underlying classification of the equity investment.
(g) Segment reportingAn operating segment is a distinguishable component of the Bank engaged in providing products or services that are subject to risks and returns that are different from those of other business segments and whose operating results are reviewed to assess its performance and for which discrete financial information is available. The Bank’s primary business segmentation is based on the Bank’s internal reporting about components of the Bank as regularly reviewed by the board and executive management committees. Segments results include items directly attributable to a segment as well as those that are allocated on a reasonable basis. Business segments are the only segments presented since the Bank operates in a single geographical segment, Uganda.
In accordance with IFRS 8, the Bank has the following business segments: Personal and Business Banking, Corporate and Investment Banking and Treasury and Capital Management . The Transactions between segments are priced at market related rates
(h) Foreign currency translation
(i) Functional and presentation currency
Items included in the Bank’s financial statements are measured using the currency of the primary economic environment in which the entity operates Uganda Shillings (“the functional currency”). The financial statements are presented in Uganda Shillings (Ushs) and figures are stated in thousands of Ushs unless otherwise stated.
(ii) Transactions and balances
Foreign currency transactions are translated into the functional currency using the exchange rates prevailing at the dates of the transactions.
Monetary items denominated in foreign currency are translated with the closing rate as at the reporting date. If several exchange rates are available, the forward rate is used at which the future cash flows represented by the transaction or balance could have been settled if those cash flows had occurred. Non-monetary items measured at historical cost denominated in a foreign currency are translated with the exchange rate as at the date of initial recognition; non-monetary items in a foreign currency that are measured at fair value are translated using the exchange rates at the date when the fair value was determined.
Foreign exchange gains and losses resulting from the settlement of foreign currency transactions and from the translation at year-end exchange rates of monetary assets and liabilities denominated in foreign currencies are recognised in profit or loss.
Changes in the fair value of monetary assets denominated in foreign currency classified as available-for-sale are analyzed between translation differences resulting from changes in the amortized cost of the security and other changes in the carrying amount of the security. Translation differences related to changes in the amortized cost are recognised in profit or loss, and other changes in the carrying amount, are recognised in other comprehensive income.
Translation differences on non-monetary financial instruments, such as equities held at fair value through profit or loss, are reported as part of the fair value gain or loss. Translation differences on non-monetary financial instruments, such as equities classified as available-for-sale financial assets, are included in other comprehensive income.
(i) Financial assets
The Bank classifies its financial assets into the following categories: financial assets at fair value through profit or loss; loans, advances and receivables; held-to-maturity investments; and available-for-sale financial assets and liabilities. Management determines the appropriate classification of its investments at initial recognition.
(i) Financial assets at fair value through profit or loss This category has two sub-categories: financial assets held for trading, and those designated at fair value through profit or loss at inception. A financial asset is classified in this category if acquired principally for the purpose of selling in the short term or if so classifying eliminates or significantly reduces a measurement inconsistency. Derivatives are also categorised as held for trading or designated at fair value through profit or loss at inception.
(ii) Loans, advances and receivables
Loans and receivables are non-derivative financial assets with fixed or determinable payments that are not quoted in an active market, other than:
(a) those that the entity intends to sell immediately or in the short term, which are classified as held for trading, and those that the entity upon initial recognition designates as at fair value through profit or loss;
FINANCIAL STATEMENTS NOTES
2 Summary of significant accounting policies (continued)
73Stanbic Bank Uganda Limited Annual Report and Financial Statements for the year ended 31 December, 2015
(b) those that the entity upon initial recognition designates as available for sale; or
(c) those for which the holder may not recover substantially all of its initial investment, other than because of credit deterioration.
Loans and receivables are initially recognised at fair value – which is the cash consideration to originate or purchase the loan including any transaction costs – and measured subsequently at amortised cost using the effective interest method. Loans and receivables are reported in the statement of financial position as loans and advances to Banks or customers or as investment securities. Interest on loans is included in the income statement and is reported as ‘Interest income’.
In the case of impairment, the impairment loss is reported as a deduction from the carrying value of the loan and recognised in the income statement as ‘Impairment charge for credit losses’.
(iii) held-to maturity
Held-to-maturity investments are non-derivative financial assets with fixed or determinable payments and fixed maturities that management has the positive intention and ability to hold to maturity. Were the Bank to sell more than an insignificant amount of held-to-maturity assets, the entire category would have to be reclassified as available for sale.
(iv) Available-for-sale
Available-for-sale financial assets are financial assets that are intended to be held for an indefinite period of time, which may be sold in response to needs for liquidity or changes in interest rates, exchange rates or equity prices or those that are non-derivative financial assets that are not classified under any of the categories (i) to (iii) above.
Purchases and sales of financial assets at fair value through profit or loss, held-to-maturity and available-for-sale are recognised on trade-date – the date on which the Bank commits to purchase or sell the asset. Financial assets are initially recognised at fair value plus, for all financial assets except those carried at fair value through profit or loss, transaction costs.
Financial assets are derecognised when the rights to receive cash flows from the financial assets have expired or where the Bank has transferred substantially all risks and rewards of ownership.
Loans, advances and receivables and held-to-maturity investments are carried at
amortised cost using the effective interest method. Available-for-sale financial assets and financial assets at fair value through profit or loss are carried at fair value. Gains and losses arising from changes in the fair value of ‘financial assets at fair value through profit or loss’ are included in the income statement in the period in which they arise. Gains and losses arising from changes in the fair value of available-for-sale financial assets are recognised directly in equity until the financial asset is derecognised or impaired, at which time the cumulative gain or loss previously recognised in equity is recognised in the income statement. However, interest calculated using the effective interest method is recognised in the income statement. Dividends on available-for-sale equity instruments are recognised in the income statement when the Bank’s right to receive payment is established.
Fair value measurement
Fair value is the amount for which an asset could be exchanged, or a liability settled, between knowledgeable, willing parties in an arm’s length transaction on the measurement date.
When available, the Bank measures the fair value of an instrument using quoted prices in an active market for that instrument. A market is regarded as active if quoted prices are readily and regularly available and represent actual and regularly occurring market transactions on an arm’s length basis.
If a market for financial instrument is not active, the Bank establishes fair value using a valuation technique. Valuation techniques include using recent arm’s length transactions between knowledgeable, willing parties (if available), reference to the current fair value of other instruments that are substantially the same, discounted cash flow analyses and option pricing models.
Financial assets that are transferable to a third party but do not qualify for de-recognition are presented in the statement of financial position as ‘Pledged assets’.
Amortised cost measurement
The amortised cost of a financial asset or liability is the amount at which the financial asset or liability is measured at initial recognition, minus principal repayments, plus or minus the cumulative amortisation using the effective interest method of any difference between the initial amount recognised and the maturity amount, minus any reduction for impairment.
(v) De-recognition
The Bank derecognises a financial asset when the contractual rights to the cash
flows from the financial asset expire, or when it transfers the financial asset in a transaction in which substantially all the risks and rewards of ownership of the financial asset are transferred or in which the Bank neither transfers nor retains substantially all the risks and rewards of ownership and it does not retain control of the financial asset.
Any interest in transferred financial assets that qualify for de-recognition that is created or retained by the Bank is recognised as a separate asset or liability in the statement of financial position. On de-recognition of a financial asset, the difference between the carrying amount of the asset (or the carrying amount allocated to the portion of the asset transferred), and consideration received (including any new asset obtained less any new liability assumed) is recognised in profit or loss.
(vi) offsetting
Financial assets and liabilities are offset and the net amount presented in the statement of financial position when, and only when, the Bank has a legal right to set off the recognised amounts and it intends either to settle on a net basis or to realise the asset and settle the liability simultaneously.
Income and expenses are presented on a net basis only when permitted under IFRSs, or for gains and losses arising from a group of similar transactions such as in the Bank’s trading activity.
(j) Impairment of financial asset
(i) Assets carried at amortised cost
The Bank assesses at each statement of financial position date whether there is objective evidence that a financial asset or a group of financial assets is impaired. A financial asset or a group of financial assets is impaired and impairment losses are incurred if, and only if, there is objective evidence of impairment as a result of one or more events that occurred after initial recognition of the asset (a “loss event”) and that loss event (or events) has an impact on the estimated future cash flows of the financial asset or group of financial assets that can be reliably estimated. Objective evidence that a financial asset or group of assets is impaired includes observable data that comes to the attention of the Bank about the following loss events:
• significantfinancialdifficultyoftheissuer or obligor;
• abreachofcontract,suchasdefaultor delinquency in interest or principal repayments;
FINANCIAL STATEMENTS NOTES
2 Summary of significant accounting policies (continued)
74 Stanbic Bank Uganda Limited Annual Report and Financial Statements for the year ended 31 December, 2015
• theBankgrantingtotheborrower,foreconomic or legal reasons relating to the borrower’s financial difficulty, a concession that the lender would not otherwise consider;
• itbecomingprobablethattheborrowerwill enter Bankruptcy or other financial reorganisation;
• thedisappearanceofanactivemarketfor that financial asset because of financial difficulties; or
• observabledataindicatingthatthereis a measurable decrease in the estimated future cash flows from a group of financial assets since the initial recognition of those assets, although the decrease cannot yet be identified with the individual financial assets in the group, including:
- adverse changes in the payment status of borrowers in the group; or
- National or local economic conditions that correlate with defaults on the assets in the group.
The Bank first assesses whether objective evidence of impairment exists individually for financial assets that are individually significant, and individually or collectively for financial assets that are not individually significant. If the Bank determines no objective evidence of impairment exists for an individually assessed financial asset, whether significant or not, it includes the asset in a group of financial assets with similar credit risk characteristics and collectively assesses them for impairment. Assets that are individually assessed for impairment and for which an impairment loss is or continues to be recognised are not included in a collective assessment of impairment.
If there is objective evidence that an impairment loss on loans or held-to-maturity investments carried at amortised cost has been incurred, the amount of the loss is measured as the difference between the asset’s carrying amount and the present value of estimated future cash flows (excluding future credit losses that have not been incurred) discounted at the financial instrument’s original effective interest rate. The carrying amount of the asset is reduced through the use of an allowance account and the amount of the loss is recognised in the income statement. If a loan or held-to-maturity investment has a variable interest rate, the discount rate for measuring any impairment loss is the current effective interest rate determined under the contract. As a practical expedient, the Bank may measure impairment on the basis of an instrument’s fair value using an observable market price.
The calculation of the present value of the estimated future cash flows of a collateralised financial asset reflects the cash flows that may result from foreclosure less costs for obtaining and selling the collateral, whether or not foreclosure is probable.
When a loan is uncollectible, it is written off against the related provision for loan impairment. Such loans are written off after all the necessary procedures have been completed and the amount of the loss has been determined. Subsequent recoveries of amounts previously written off decrease the amount of the provision for loan impairment in the income statement.
If, in a subsequent period, the amount of the impairment loss decreases and the decrease can be related objectively to an event occurring after the impairment was recognised (such as an improvement in the debtor’s credit rating), the previously recognised impairment loss is reversed by adjusting the allowance account. The amount of the reversal is recognised in the income statements.
In addition to the measurement of impairment losses on loans and advances in accordance with the International Financial Reporting Standards as set out above, the Bank is also required by the Financial Institutions Act (FIA) 2004 to establish minimum provisions for losses on loans and advances as follows
i) A specific provision for those loans and advances considered to be non-performing based on criteria and classification of such loans and advances established by the Bank of Uganda, as;
a) substandard assets being facilities in arrears between 91 and 180 days – 20%;
b) doubtful assets being facilities in arrears between 181 days and 360 days – 50%;
c) loss assets being facilities in arrears between over 360 days – 100%; and
ii) A general provision of at least 1% of their total outstanding credit facilities net of specific provisions and interest in suspense.
Where provisions for impairment of loans and advances determined in accordance with the Financial Institutions Act 2004 exceed amounts determined in accordance with International Financial Reporting Standards, the excess is taken to the statutory credit risk reserve as an appropriation of retained earnings. Otherwise no further accounting entries are made.
Renegotiated loans
Loans that would otherwise be past due
or impaired and whose terms have been renegotiated and exhibit the characteristics of a performing loan are reset to performing loan status. Loans whose terms have been renegotiated are subject to ongoing review to determine whether they are considered to be impaired or past due.
The effective interest rate of renegotiated loans that have not been derecognised is redetermined based on the loan’s renegotiated terms.
(ii) Assets carried at fair value
Available-for-sale financial assets are impaired if there is objective evidence of impairment, resulting from one or more loss events that occurred after initial recognition but before the statement of financial position date, that have an impact on the future cash flows of the asset. In addition, an available-for-sale equity instrument is generally considered impaired if a significant or prolonged decline in the fair value of the instrument below its cost has occurred. Where an available-for-sale asset, which has been re-measured to fair value directly through equity, is impaired, the impairment loss is recognised in the income statement. If any loss on the financial asset was previously recognised directly in equity as a reduction in fair value, the cumulative net loss that had been recognised in equity is transferred to the income statement and is recognised as part of the impairment loss. The amount of the loss recognised in the income statement is the difference between the acquisition cost and the current fair value, less any previously recognized impairment loss.
If, in a subsequent period, the amount relating to impairment loss decreases and the decrease can be linked objectively to an event occurring after the write-down, the write-down is reversed through the income statement.
Financial liabilities
The Bank’s holding in financial liabilities represents mainly deposits from Banks and customers and other liabilities. Such financial liabilities are initially recognized at fair value and subsequently measured at amortized cost.
(k) Property and equipment Recognition and measurement
Items of property and equipment are measured at cost less accumulated depreciation and accumulated impairment losses.
FINANCIAL STATEMENTS NOTES
2 Summary of significant accounting policies (continued)
75Stanbic Bank Uganda Limited Annual Report and Financial Statements for the year ended 31 December, 2015
Cost includes expenditures that are directly attributable to the acquisition of the asset. The cost of self-constructed assets includes the cost of materials and direct labour, any other costs directly attributable to bringing the assets to a working condition for their intended use, the costs of dismantling and removing the items and restoring the site on which they are located and capitalised borrowing costs. Purchased software that is integral to the functionality of the related equipment is capitalised as part of that equipment.
When parts of an item of property or equipment have different useful lives, they are accounted for as separate items (major components) of property and equipment.
Items of property and equipment are derecognised on disposal or when no future economic benefits are expected from their use or disposal. The gain or loss on disposal of an item of property and equipment is determined by comparing the proceeds from disposal with the carrying amount of the item of property and equipment, and are recognised net within other income in profit or loss.
Subsequent costs
The cost of replacing a part of an item of property or equipment is recognised in the carrying amount of the item if it is probable that the future economic benefits embodied within the part will flow to the Bank and its cost can be measured reliably.
The carrying amount of the replaced part is derecognised. The costs of the day-to-day servicing of property and equipment are recognised in profit or loss as incurred.
Depreciation
Depreciation is recognised in profit or loss on a straight-line basis over the estimated useful lives of each part of an item of property and equipment since this most closely reflects the expected pattern of consumption of the future economic benefits embodied in the asset. Leased assets under finance leases are depreciated over the shorter of the lease term and their useful lives. Land is not depreciated.
The estimated useful lives for the current and comparative periods are as follows:
Leasehold buildings over the shorter period of lease or 50 years
Furniture & fittings 5 years
Motor vehicles 5 years
Other computer equipment 5 years
Laptops and personal 4 years computers
Office equipment 8 years
Depreciation methods, useful lives and residual values are reassessed at each financial year-end and adjusted if appropriate.
(l) Impairment of non-financial
assetsIntangible assets that have an indefinite useful life or intangible assets not ready to use are not subject to amortization and are tested annually for impairment. Assets that are subject to amortization are reviewed for impairment whenever events or changes in circumstances indicate that the carrying amount may not be recoverable. An impairment loss is recognized for the amount by which the asset’s carrying amount exceeds its recoverable amount. The recoverable amount is the higher of an asset’s fair value less costs of disposal and value in use. For purposes of assessing impairment, assets are grouped at the lowest levels for which there are largely independent cash inflows (Cash – generating units). Prior impairments of non- financial assets (other than goodwill) are reviewed for possible reversal at each reporting date.
(m) Income tax Income tax expense is the aggregate of the charge to the income statement in respect of current income tax and deferred income tax. Current tax is determined for current period transactions and events and deferred tax is determined for future tax consequences.
Current income tax is the amount of income tax payable on the taxable profit for the year determined in accordance with the Ugandan Income Tax Act. The rates used are based on laws inacted or substantially inacted at the reporting date.
Deferred income tax is provided in full, using the liability method, for all temporary differences arising between the tax bases of assets and liabilities and their carrying values for financial reporting purposes. However, if the deferred income tax arises from the initial recognition of an asset or liability in a transaction other than a business combination that at the time of the transaction affects neither accounting nor taxable profit nor loss, it is not accounted for.
Deferred income tax is determined using tax rates that have been enacted or substantively enacted at the statement of financial position date and are expected to apply when the related deferred income tax asset is realised or the deferred income tax liability is settled.
Deferred income tax assets are recognised only to the extent that it is probable that future taxable profits will be available against which temporary differences can be utilised.
Deferred tax related to fair value re-measurement of available –for-sale investments are credited or charged directly to equity.
(n) cash and cash equivalentsFor the purposes of the statement of cash flows, cash and cash equivalents comprise balances with less than three months’ maturity from the date of acquisition, including cash and non-restricted balances with central Banks, treasury bills and other eligible bills, loans and advances to Banks, amounts due from other Banks and government securities.
(o) Accounting for leases Leases in which a significant portion of the risks and rewards of ownership are retained by the lessor are classified as operating leases. Leases where the lessee assumes substantially all the risks and rewards incidental to ownership are classified as finance leases.
(i) With the Bank as lessee
To date, all leases entered into by the Bank are operating leases. Payments made under operating leases are charged to the income statement on a straight-line basis over the period of the lease. Lease incentives received are recognised as an integral part of the total lease expense, over the term of the lease.
(ii) With the Bank as lessor When assets are leased out under a finance lease, the present value of the lease payments is recognised under loans and advances to customers. The difference between the gross receivable and the present value of the receivable is recognised as unearned finance income. Lease income is recognised over the term of the lease using the net investment method (before income tax), which reflects a constant periodic rate of return.
(p) employee benefits
(i) Retirement benefit obligations
The Bank operates a defined contribution pension scheme for its employees. The defined contribution plan is a pension plan under which the Bank pays fixed contributions into a fund managed by a board of trustees and will have no legal or constructive obligations to pay further contributions if the fund does not hold sufficient assets to pay all employees benefits relating to employee service in the current and prior periods.
In addition all employees are obliged to be members of the National Social Security Fund, a state managed defined contribution pension scheme. The Bank contributes to the scheme in line with the requirements of the National Social Security Fund Act.
FINANCIAL STATEMENTS NOTES
2 Summary of significant accounting policies (continued)
76 Stanbic Bank Uganda Limited Annual Report and Financial Statements for the year ended 31 December, 2015
The regular contributions by the Bank and employees constitute net periodic costs for the year in which they are due and as such are included in employee benefit expenses. The Bank’s contributions to the defined contribution schemes are charged to the income statement in the year to which they relate.
(ii) Short term benefits
Short term benefits consist of salaries, accumulated leave payments, bonuses and any non-monetary benefits such as medical aid contributions. Short-term employee benefit obligations are measured on an undiscounted basis and are expenses as the related service is provided. A liability is recognised for the amount expected to be paid under short term cash bonus plans or accumulated leave if the Bank has a present legal or constructive obligation to pay this amount as a result of past service provided by the employee and the obligation can be estimated reliably.
(iii) Termination benefits
Termination benefits are recognised as an expense when the Bank is committed without realistic possibility of withdrawal, to a formal detailed plan to terminate employment before the normal retirement date, or to provide termination benefits as a result of an offer made to encourage voluntary redundancy. Termination benefits for voluntary redundancies are recognised if the Bank has made an offer encouraging voluntary redundancy, it is probable that the offer will be accepted, and the number of acceptances can be reliably estimated.
(iv) Share based payment transactions
The grant date fair value of equity-settled share-based payment awards (i.e. stock options) granted to employees is recognised as an employee expense, with a corresponding increase in equity, over the period in which the employees unconditionally become entitled to the awards. The amount recognised as an expense is adjusted to reflect the number of share awards for which the related service and non-market performance vesting conditions are expected to be met such that the amount ultimately recognised as an expense is based on the number of share awards that do meet the related service and non-market performance conditions at the vesting date. For share-based payment awards with non-vesting conditions, the grant-date fair value of the share-based payment is measured to reflect such conditions and there is no true-up for differences between expected and actual outcomes. The estimate of the number of options/shares expected to vest is reassess
and adjusted against p/l and equity over the remaining vesting period. Also include the accounting treatment upon vesting and settlement of shares/options.
(v) other entitlements The estimated monetary liability for employees’ accrued annual leave entitlement at the reporting date is recognised as an expense accrual. (q) Derivative financial instruments
Derivatives, which comprise forward foreign exchange contracts and swaps, are initially recognised at fair value on the date the derivative contract is entered into and are subsequently measured at fair value. The fair value is determined using forward exchange market rates at the statement of financial position date or appropriate pricing models. The derivatives do not qualify for hedge accounting. Changes in the fair value of derivatives are recognised immediately in the income statement.
(r) BorrowingsBorrowings are recognised initially at fair value, being their issue proceeds (fair value of consideration received) net of transaction costs incurred. Borrowings are subsequently stated at amortised cost; any difference between proceeds net of transaction costs and the redemption value is recognised in the income statement over the period of the borrowings using the effective interest method.
(s) Sale and repurchase agreements Securities sold subject to repurchase agreements (‘repos’) are classified in the financial statements as pledged assets when the transferee has the right by contract or custom to sell or re-pledge the collateral; the counterparty liability is included in amounts due to other Banks, deposits from Banks, other deposits or deposits due to customers, as appropriate.
Securities purchased under agreements to resell (‘reverse repos’) are recorded as loans and advances to other Banks or customers, as appropriate.
The difference between sale and repurchase price is treated as interest and accrued over the life of the agreements using the effective interest method. Securities lent to counterparties are also retained in the financials.
(t) Acceptances and letters of credit
Acceptances and letters of credit are accounted for as off-balance sheet transactions and disclosed as contingent liabilities.
(u) Intangible assets
Goodwill
Goodwill arises on business combinations and represents the excess of the consideration transferred over the net fair value of the net identifiable assets, liabilities and contingent liabilities of the acquiree and the fair value of the non – controlling interest in the acquiree.
Goodwill on acquisitions is reported in the statement of financial position as an intangible asset.
At each statement of financial position date the Bank assesses whether there is any indication of impairment. If such indications exist, an analysis is performed to assess whether the carrying amount of goodwill is fully recoverable.
A write down is made if the carrying amount exceeds the recoverable amount. Impairment losses are allocated first to reduce the carrying amount of any goodwill allocated to a CGU and then to reduce the carrying amount of other assets in the CGU on a pro rata basis.
Computer software development costs
Costs associated with maintaining computer software programmes are recognized as an expense as incurred. Development costs that are directly attributable to the design and testing of identifiable and unique software products controlled by the Bank are recognized as intangible assets when the following criteria are met:
• It is technically feasible to complete the software product so that it will be available for use;
• management intends to complete the software product and use or sell it;
• there is an ability to use or sell the software product;
• it can be demonstrated how the software product will generate probable future economic benefits;
• adequate technical, financial and other resources to complete the development and to use or sell the software product are available; and
• the expenditure attributable to the software product during its development can be reliably measured.
Directly attributable costs that are capitalized as part of the software product include the software development employee costs and an appropriate portion of relevant overheads.
Other development expenditures that do not meet these criteria are recognized as an expense as incurred. Development costs previously recognized as an expense are not recognized as an asset in a subsequent period.
FINANCIAL STATEMENTS NOTES
2 Summary of significant accounting policies (continued)
77Stanbic Bank Uganda Limited Annual Report and Financial Statements for the year ended 31 December, 2015
Computer software development costs recognized as assets are amortized over their estimated useful lives, which does not exceed three years.
Acquired computer software licenses are capitalized on the basis of the costs incurred to acquire and bring to use the specific software.
These costs are amortized on the basis of the expected useful lives. Software has a maximum expected useful life of 5 years.
(v) Provisions
Provisions are recognised when the Bank has a present legal or constructive obligation as a result of past events, where it is probable that an outflow of resources embodying economic benefits will be required to settle the obligation, and a reliable estimate of the amount of the obligation can be made.
Employee entitlements to annual leave and long service leave are recognised when they accrue to employees.
A provision is made for the estimated liability for annual leave and long-service leave as a result of services rendered by employees up to the statement of financial position date. (w) Share capital The Bank classifies capital instruments as financial liabilities or equity instruments in accordance with the substance of the contractual terms of the instruments. Ordinary shares are classified as equity.
Dividends on ordinary sharesDividends on ordinary shares are charged to equity in the period in which they are declared. Dividends declared after the statement of financial position date are disclosed in the dividend note. This is transfered from retained earnings to a separate item of equity.
Earnings per share
The Bank presents basic and diluted earnings per share (EPS) data for its ordinary shares. Basic EPS is calculated by dividing the profit or loss attributable to ordinary shareholders of the Bank by the weighted average number of ordinary shares outstanding during the period.
Diluted EPS is determined by adjusting the profit or loss attributable to ordinary shareholders and the weighted average number of ordinary shares outstanding for the effects of all dilutive potential ordinary shares.
(x) Financial guarantee contractsFinancial guarantee contracts are contracts that require the issuer to make specified payments to reimburse the holder for a loss it incurs because a specified debtor fails to make payment when due, in accordance with
the terms of a debt instrument.
Such financial guarantees are given to other Banks, financial institutions and other bodies on behalf of customers to secure loans, overdrafts and other facilities.
Financial guarantees are initially recognised in the financial statements at fair value on the date the guarantee was given. Subsequent to initial recognition, the Bank’s liabilities under such guarantees are measured at the higher of the initial investment, less amortisation calculated to recognise in the income statement the fee income earned on a straight line basis over the life of the guarantee and the best estimate of the expenditure required to settle any financial obligation arising at the statement of financial position date.
(y) equity compensation plansThe parent company operates two equity settled share based compensation plans through which certain key management staffs of the Bank are compensated. The fair value of equity settled share options is determined on the grant date and accounted for as an employee service expense over the vesting period of the share options. At each Statement of financial position date the estimate of the number of options expected to vest is reassessed and adjusted against income over the remaining vesting period.
(z) comparatives Where necessary, the comparative figures have been adjusted to conform to changes in presentation in the current year.
3 Financial risk management (a) Strategy in using financial instrumentsBy their nature, the Bank’s activities are principally related to the use of financial instruments including derivatives. The Bank accepts deposits from customers at both fixed and floating rates, and for various periods, and seeks to earn above-average interest margins by investing these funds in high-quality assets. The Bank seeks to increase these margins by consolidating short-term funds and lending for longer periods at higher rates, while maintaining sufficient liquidity to meet all claims that might fall due.
The Bank’s risk management policies are designed to identify and analyse these risks, to set appropriate risk limits and controls, and to monitor the risks and adherence to limits by means of reliable and up-to-date information systems. The Bank regularly reviews its risk management policies and systems to reflect changes in markets, products and emerging best practice. Risk
management is carried out centrally under policies approved by the Board of Directors. The Global Markets team identifies, evaluates and hedges financial risks in close co-operation with the Bank’s operating units.
The Board provides written principles for overall risk management, as well as written policies covering specific areas, such as foreign exchange risk, interest rate risk, credit risk, use of derivative financial instruments and non-derivative financial instruments. In addition, internal audit is responsible for the independent review of risk management and the control environment. The most important types of risk are credit risk, liquidity risk, market risk and other operational risk. Market risk includes currency risk, interest rate and other price risk.
The Bank also seeks to raise its interest margins by obtaining above-average margins, net of allowances, through lending to commercial and retail borrowers with a range of credit standing. Such exposures involve not just on-statement of financial position loans and advances; the Bank also enters into guarantees and other commitments such as letters of credit and performance, and other bonds.
The Bank also trades in financial instruments where it takes positions in traded and over-the-counter instruments to take advantage of short-term market movements in bonds, currency and interest rate. The Board places trading limits on the level of exposure that can be taken in relation to both overnight and intra-day market positions.
Foreign exchange and interest rate exposures associated derivatives are normally offset by entering into counterbalancing positions, thereby controlling the variability in the net cash amounts required to liquidate market positions.
(b) capital managementThe Bank’s objectives when managing capital, which is a broader concept than the equity on the face of the statement of financial position, are:
• To comply with the capital requirements of the regulator, Bank of Uganda, that are enshrined in the Financial Institutions Act and accompanying Financial Institutions (Capital Adequacy) Regulations, 2005.
• To safeguard the Bank’s ability to continue as a going concern so that it can continue to provide returns for shareholders and benefits for other stakeholders; and
• To maintain a strong capital base to support the development of its business.
FINANCIAL STATEMENTS NOTES
2 Summary of significant accounting policies (continued)
78 Stanbic Bank Uganda Limited Annual Report and Financial Statements for the year ended 31 December, 2015
The Bank monitors the adequacy of its capital using capital adequacy ratios established under the Financial Institutions Act, which ratios are broadly in line with those for the Bank for International Settlements (BIS). In addition under the same law, the Bank is required to maintain minimum paid up capital of Ushs 25 billion. The Bank is compliant with this requirement with a holding of Ushs 51 billion. These ratios measure capital adequacy by comparing the Bank’s eligible capital with its statement of financial position assets, off-balance-sheet commitments and market and other risk positions at weighted amounts to reflect their relative risk.
The market risk approach covers the general market risk and the risk of open positions in currencies and debt and equity
securities. Assets are weighted according to broad categories of notional credit risk, being assigned a risk weighting according to the amount of capital deemed to be necessary to support them. Four categories of risk weights (0%, 20%, 50%, and 100%) are applied. Certain asset categories have intermediate weightings. .
The Bank is required at all times to maintain a core capital (tier 1) of not less than 8% of total risk adjusted assets plus risk adjusted off statement of financial position items and a total capital (tier 1 + tier 2) of not less than 12% of its total risk adjusted assets plus risk adjusted off statement of financial position items.
Off-balance-sheet credit related commitments and forwards are taken into
account by applying different categories of credit conversion factors, designed to convert these items into statement of financial position equivalents. The resulting credit equivalent amounts are then weighted for credit risk using the same percentages as for statement of financial position assets.
Tier 1 capital consists of shareholders’ equity comprising paid up share capital, share premium and retained earnings less intangible assets, deferred income tax asset and investments in financial companies, not consolidated. Tier 2 capital includes the Bank’s eligible long-term loans, and general provisions. Tier 2 capital is limited to 50% of Tier 1 capital.
FINANCIAL STATEMENTS NOTES
2 Summary of significant accounting policies (continued)
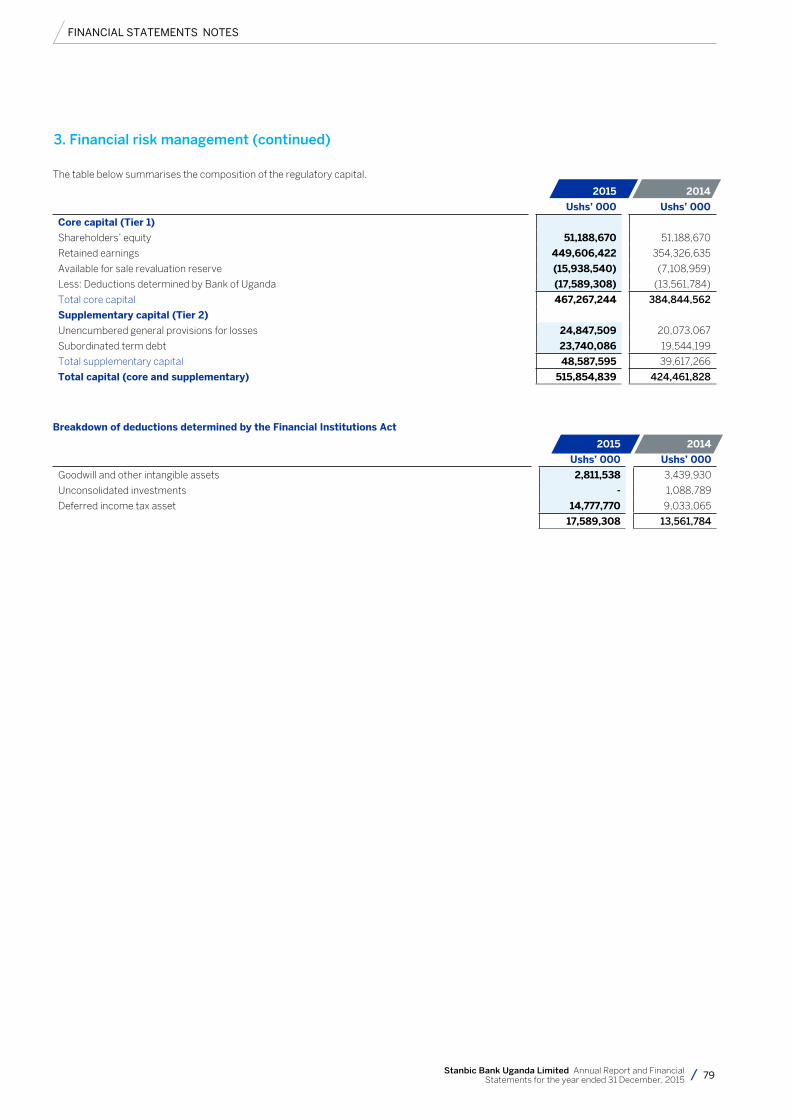
FINANCIAL STATEMENTS NOTES
79Stanbic Bank Uganda Limited Annual Report and Financial Statements for the year ended 31 December, 2015
The table below summarises the composition of the regulatory capital.
2015 2014
Ushs’ 000 Ushs’ 000
Core capital (Tier 1)
Shareholders’ equity 51,188,670 51,188,670
Retained earnings 449,606,422 354,326,635
Available for sale revaluation reserve (15,938,540) (7,108,959)
Less: Deductions determined by Bank of Uganda (17,589,308) (13,561,784)
Total core capital 467,267,244 384,844,562
Supplementary capital (Tier 2)
Unencumbered general provisions for losses 24,847,509 20,073,067
Subordinated term debt 23,740,086 19,544,199
Total supplementary capital 48,587,595 39,617,266
Total capital (core and supplementary) 515,854,839 424,461,828
Breakdown of deductions determined by the Financial Institutions Act
2015 2014
Ushs’ 000 Ushs’ 000
Goodwill and other intangible assets 2,811,538 3,439,930
Unconsolidated investments - 1,088,789
Deferred income tax asset 14,777,770 9,033,065
17,589,308 13,561,784
3. Financial risk management (continued)
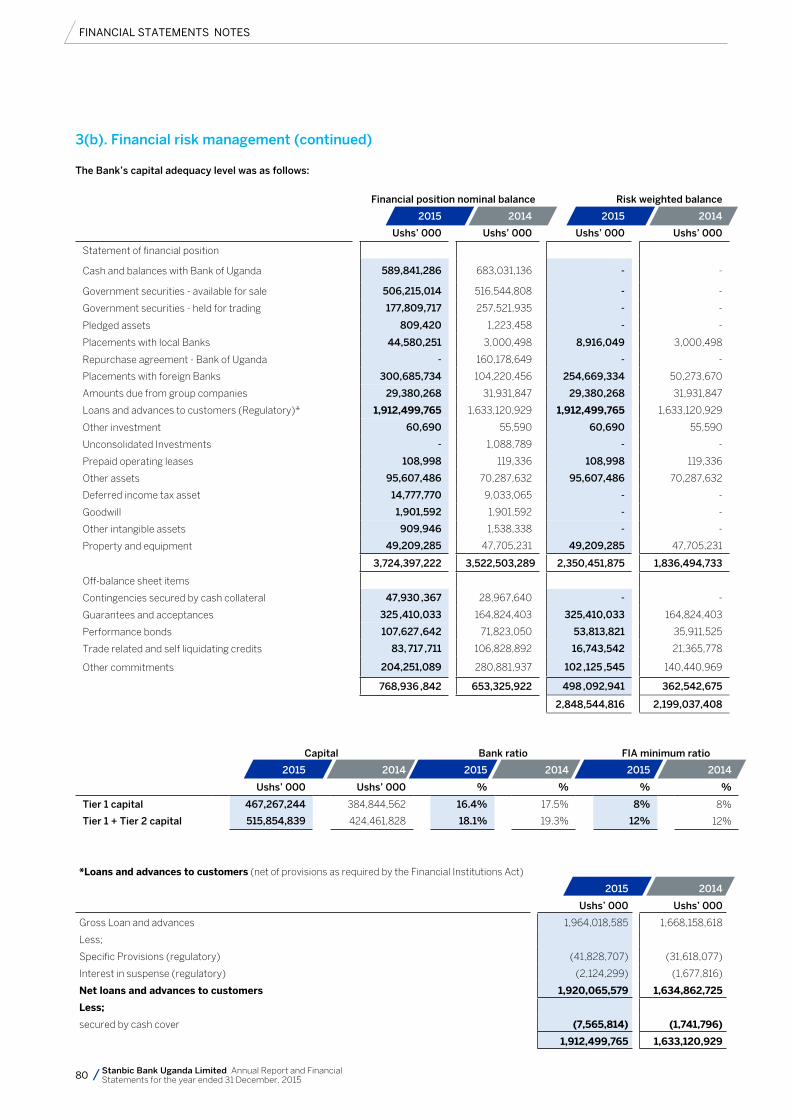
FINANCIAL STATEMENTS NOTES
80 Stanbic Bank Uganda Limited Annual Report and Financial Statements for the year ended 31 December, 2015
The Bank’s capital adequacy level was as follows:
Financial position nominal balance Risk weighted balance
2015 2014 2015 2014
Ushs’ 000 Ushs’ 000 Ushs’ 000 Ushs’ 000
Statement of financial position
Cash and balances with Bank of Uganda 589,841,286 683,031,136 - -
Government securities - available for sale 506,215,014 516,544,808 - -
Government securities - held for trading 177,809,717 257,521,935 - -
Pledged assets 809,420 1,223,458 - -
Placements with local Banks 44,580,251 3,000,498 8,916,049 3,000,498
Repurchase agreement - Bank of Uganda - 160,178,649 - -
Placements with foreign Banks 300,685,734 104,220,456 254,669,334 50,273,670
Amounts due from group companies 29,380,268 31,931,847 29,380,268 31,931,847
Loans and advances to customers (Regulatory)* 1,912,499,765 1,633,120,929 1,912,499,765 1,633,120,929
Other investment 60,690 55,590 60,690 55,590
Unconsolidated Investments - 1,088,789 - -
Prepaid operating leases 108,998 119,336 108,998 119,336
Other assets 95,607,486 70,287,632 95,607,486 70,287,632
Deferred income tax asset 14,777,770 9,033,065 - -
Goodwill 1,901,592 1,901,592 - -
Other intangible assets 909,946 1,538,338 - -
Property and equipment 49,209,285 47,705,231 49,209,285 47,705,231
3,724,397,222 3,522,503,289 2,350,451,875 1,836,494,733
Off-balance sheet items
Contingencies secured by cash collateral 47,930 ,367 28,967,640 - -
Guarantees and acceptances 325 ,410,033 164,824,403 325,410,033 164,824,403
Performance bonds 107,627 ,642 71,823,050 53,813,821 35,911,525
Trade related and self liquidating credits 83, 717 ,711 106,828,892 16,743,542 21,365,778
Other commitments 204,251,089 280,881,937 102 ,125 ,545 140,440,969
768,936 ,842 653,325,922 498 ,092,941 362,542,675
2,848,544,816 2,199,037,408
Capital Bank ratio FIA minimum ratio
2015 2014 2015 2014 2015 2014
Ushs’ 000 Ushs’ 000 % % % %
Tier 1 capital 467,267,244 384,844,562 16.4% 17.5% 8% 8%
Tier 1 + Tier 2 capital 515,854,839 424,461,828 18.1% 19.3% 12% 12%
*Loans and advances to customers (net of provisions as required by the Financial Institutions Act)
2015 2014
Ushs’ 000 Ushs’ 000
Gross Loan and advances 1,964,018,585 1,668,158,618
Less;
Specific Provisions (regulatory) (41,828,707) (31,618,077)
Interest in suspense (regulatory) (2,124,299) (1,677,816)
Net loans and advances to customers 1,920,065,579 1,634,862,725
Less;
secured by cash cover (7,565,814) (1,741,796)
1,912,499,765 1,633,120,929
3(b). Financial risk management (continued)
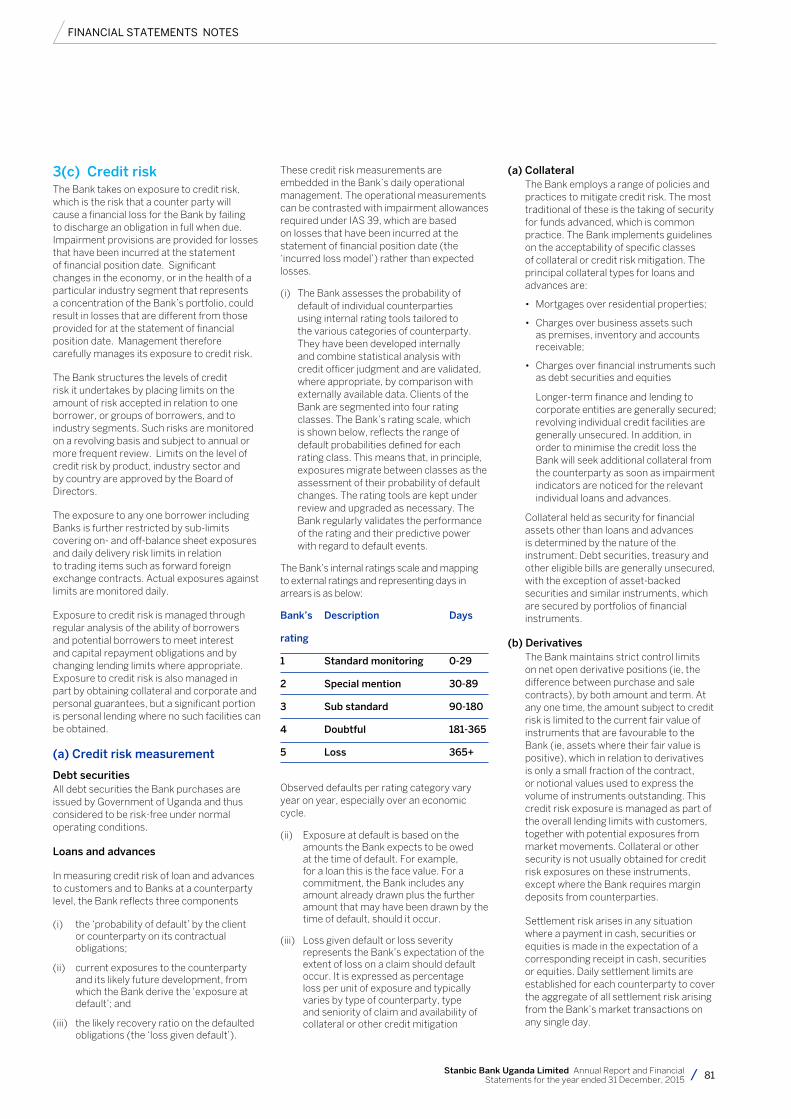
FINANCIAL STATEMENTS NOTES
81Stanbic Bank Uganda Limited Annual Report and Financial Statements for the year ended 31 December, 2015
3(c) Credit riskThe Bank takes on exposure to credit risk, which is the risk that a counter party will cause a financial loss for the Bank by failing to discharge an obligation in full when due. Impairment provisions are provided for losses that have been incurred at the statement of financial position date. Significant changes in the economy, or in the health of a particular industry segment that represents a concentration of the Bank’s portfolio, could result in losses that are different from those provided for at the statement of financial position date. Management therefore carefully manages its exposure to credit risk.
The Bank structures the levels of credit risk it undertakes by placing limits on the amount of risk accepted in relation to one borrower, or groups of borrowers, and to industry segments. Such risks are monitored on a revolving basis and subject to annual or more frequent review. Limits on the level of credit risk by product, industry sector and by country are approved by the Board of Directors.
The exposure to any one borrower including Banks is further restricted by sub-limits covering on- and off-balance sheet exposures and daily delivery risk limits in relation to trading items such as forward foreign exchange contracts. Actual exposures against limits are monitored daily.
Exposure to credit risk is managed through regular analysis of the ability of borrowers and potential borrowers to meet interest and capital repayment obligations and by changing lending limits where appropriate. Exposure to credit risk is also managed in part by obtaining collateral and corporate and personal guarantees, but a significant portion is personal lending where no such facilities can be obtained.
(a) Credit risk measurement
Debt securitiesAll debt securities the Bank purchases are issued by Government of Uganda and thus considered to be risk-free under normal operating conditions.
Loans and advances
In measuring credit risk of loan and advances to customers and to Banks at a counterparty level, the Bank reflects three components
(i) the ‘probability of default’ by the client or counterparty on its contractual obligations;
(ii) current exposures to the counterparty and its likely future development, from which the Bank derive the ‘exposure at default’; and
(iii) the likely recovery ratio on the defaulted obligations (the ‘loss given default’).
These credit risk measurements are embedded in the Bank’s daily operational management. The operational measurements can be contrasted with impairment allowances required under IAS 39, which are based on losses that have been incurred at the statement of financial position date (the ‘incurred loss model’) rather than expected losses.
(i) The Bank assesses the probability of default of individual counterparties using internal rating tools tailored to the various categories of counterparty. They have been developed internally and combine statistical analysis with credit officer judgment and are validated, where appropriate, by comparison with externally available data. Clients of the Bank are segmented into four rating classes. The Bank’s rating scale, which is shown below, reflects the range of default probabilities defined for each rating class. This means that, in principle, exposures migrate between classes as the assessment of their probability of default changes. The rating tools are kept under review and upgraded as necessary. The Bank regularly validates the performance of the rating and their predictive power with regard to default events.
The Bank’s internal ratings scale and mapping to external ratings and representing days in arrears is as below:
Bank’s Description Days
rating
1 Standard monitoring 0-29
2 Special mention 30-89
3 Sub standard 90-180
4 Doubtful 181-365
5 Loss 365+
Observed defaults per rating category vary year on year, especially over an economic cycle.
(ii) Exposure at default is based on the amounts the Bank expects to be owed at the time of default. For example, for a loan this is the face value. For a commitment, the Bank includes any amount already drawn plus the further amount that may have been drawn by the time of default, should it occur.
(iii) Loss given default or loss severity represents the Bank’s expectation of the extent of loss on a claim should default occur. It is expressed as percentage loss per unit of exposure and typically varies by type of counterparty, type and seniority of claim and availability of collateral or other credit mitigation
(a) Collateral The Bank employs a range of policies and
practices to mitigate credit risk. The most traditional of these is the taking of security for funds advanced, which is common practice. The Bank implements guidelines on the acceptability of specific classes of collateral or credit risk mitigation. The principal collateral types for loans and advances are:
• Mortgagesoverresidentialproperties;
• Chargesoverbusinessassetssuchas premises, inventory and accounts receivable;
• Chargesoverfinancialinstrumentssuchas debt securities and equities
Longer-term finance and lending to corporate entities are generally secured; revolving individual credit facilities are generally unsecured. In addition, in order to minimise the credit loss the Bank will seek additional collateral from the counterparty as soon as impairment indicators are noticed for the relevant individual loans and advances.
Collateral held as security for financial assets other than loans and advances is determined by the nature of the instrument. Debt securities, treasury and other eligible bills are generally unsecured, with the exception of asset-backed securities and similar instruments, which are secured by portfolios of financial instruments.
(b) Derivatives The Bank maintains strict control limits
on net open derivative positions (ie, the difference between purchase and sale contracts), by both amount and term. At any one time, the amount subject to credit risk is limited to the current fair value of instruments that are favourable to the Bank (ie, assets where their fair value is positive), which in relation to derivatives is only a small fraction of the contract, or notional values used to express the volume of instruments outstanding. This credit risk exposure is managed as part of the overall lending limits with customers, together with potential exposures from market movements. Collateral or other security is not usually obtained for credit risk exposures on these instruments, except where the Bank requires margin deposits from counterparties.
Settlement risk arises in any situation where a payment in cash, securities or equities is made in the expectation of a corresponding receipt in cash, securities or equities. Daily settlement limits are established for each counterparty to cover the aggregate of all settlement risk arising from the Bank’s market transactions on any single day.
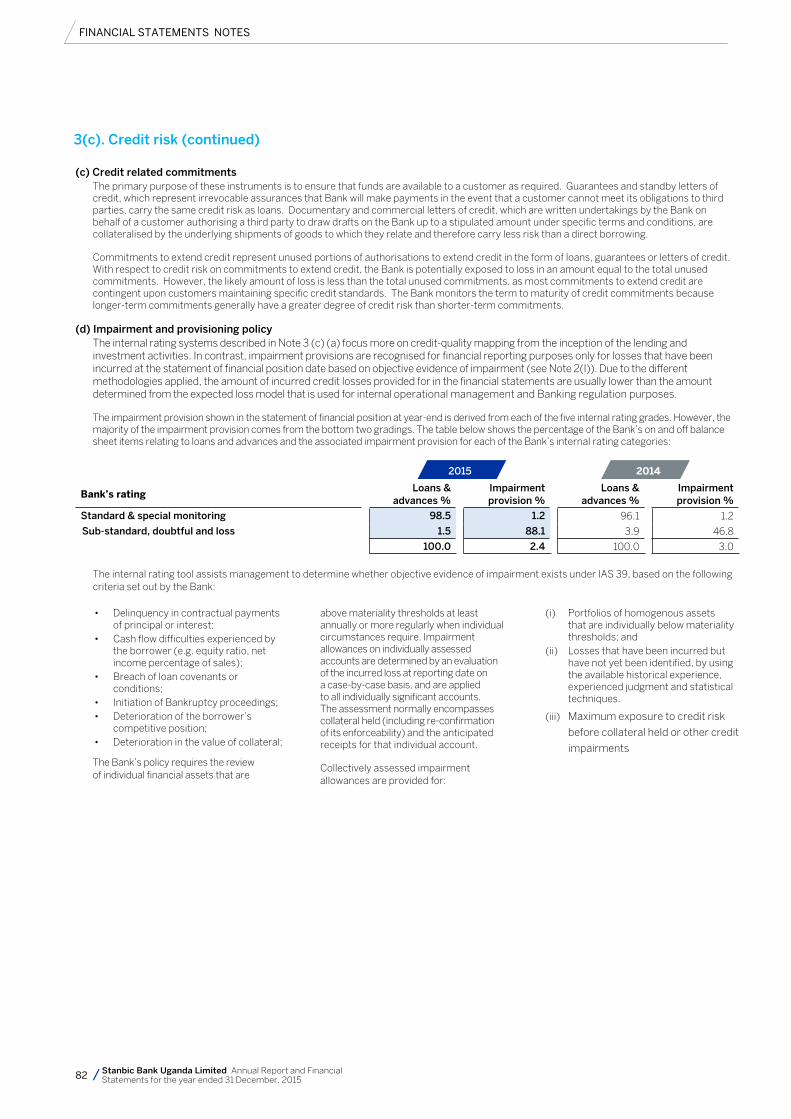
FINANCIAL STATEMENTS NOTES
82 Stanbic Bank Uganda Limited Annual Report and Financial Statements for the year ended 31 December, 2015
(c) Credit related commitments The primary purpose of these instruments is to ensure that funds are available to a customer as required. Guarantees and standby letters of
credit, which represent irrevocable assurances that Bank will make payments in the event that a customer cannot meet its obligations to third parties, carry the same credit risk as loans. Documentary and commercial letters of credit, which are written undertakings by the Bank on behalf of a customer authorising a third party to draw drafts on the Bank up to a stipulated amount under specific terms and conditions, are collateralised by the underlying shipments of goods to which they relate and therefore carry less risk than a direct borrowing.
Commitments to extend credit represent unused portions of authorisations to extend credit in the form of loans, guarantees or letters of credit. With respect to credit risk on commitments to extend credit, the Bank is potentially exposed to loss in an amount equal to the total unused commitments. However, the likely amount of loss is less than the total unused commitments, as most commitments to extend credit are contingent upon customers maintaining specific credit standards. The Bank monitors the term to maturity of credit commitments because longer-term commitments generally have a greater degree of credit risk than shorter-term commitments.
(d) Impairment and provisioning policy The internal rating systems described in Note 3 (c) (a) focus more on credit-quality mapping from the inception of the lending and
investment activities. In contrast, impairment provisions are recognised for financial reporting purposes only for losses that have been incurred at the statement of financial position date based on objective evidence of impairment (see Note 2(I)). Due to the different methodologies applied, the amount of incurred credit losses provided for in the financial statements are usually lower than the amount determined from the expected loss model that is used for internal operational management and Banking regulation purposes.
The impairment provision shown in the statement of financial position at year-end is derived from each of the five internal rating grades. However, the majority of the impairment provision comes from the bottom two gradings. The table below shows the percentage of the Bank’s on and off balance sheet items relating to loans and advances and the associated impairment provision for each of the Bank’s internal rating categories:
2015 2014
Bank’s ratingLoans &
advances %Impairment provision %
Loans & advances %
Impairment provision %
Standard & special monitoring 98.5 1.2 96.1 1.2
Sub-standard, doubtful and loss 1.5 88.1 3.9 46.8
100.0 2.4 100.0 3.0
The internal rating tool assists management to determine whether objective evidence of impairment exists under IAS 39, based on the following criteria set out by the Bank:
3(c). Credit risk (continued)
• Delinquencyincontractualpaymentsof principal or interest;
• Cashflowdifficultiesexperiencedbythe borrower (e.g. equity ratio, net income percentage of sales);
• Breachofloancovenantsorconditions;
• InitiationofBankruptcyproceedings;• Deteriorationoftheborrower’s
competitive position;• Deteriorationinthevalueofcollateral;
The Bank’s policy requires the review of individual financial assets that are
above materiality thresholds at least annually or more regularly when individual circumstances require. Impairment allowances on individually assessed accounts are determined by an evaluation of the incurred loss at reporting date on a case-by-case basis, and are applied to all individually significant accounts. The assessment normally encompasses collateral held (including re-confirmation of its enforceability) and the anticipated receipts for that individual account.
Collectively assessed impairment allowances are provided for:
(i) Portfolios of homogenous assets that are individually below materiality thresholds; and
(ii) Losses that have been incurred but have not yet been identified, by using the available historical experience, experienced judgment and statistical techniques.
(iii) Maximum exposure to credit risk
before collateral held or other credit
impairments
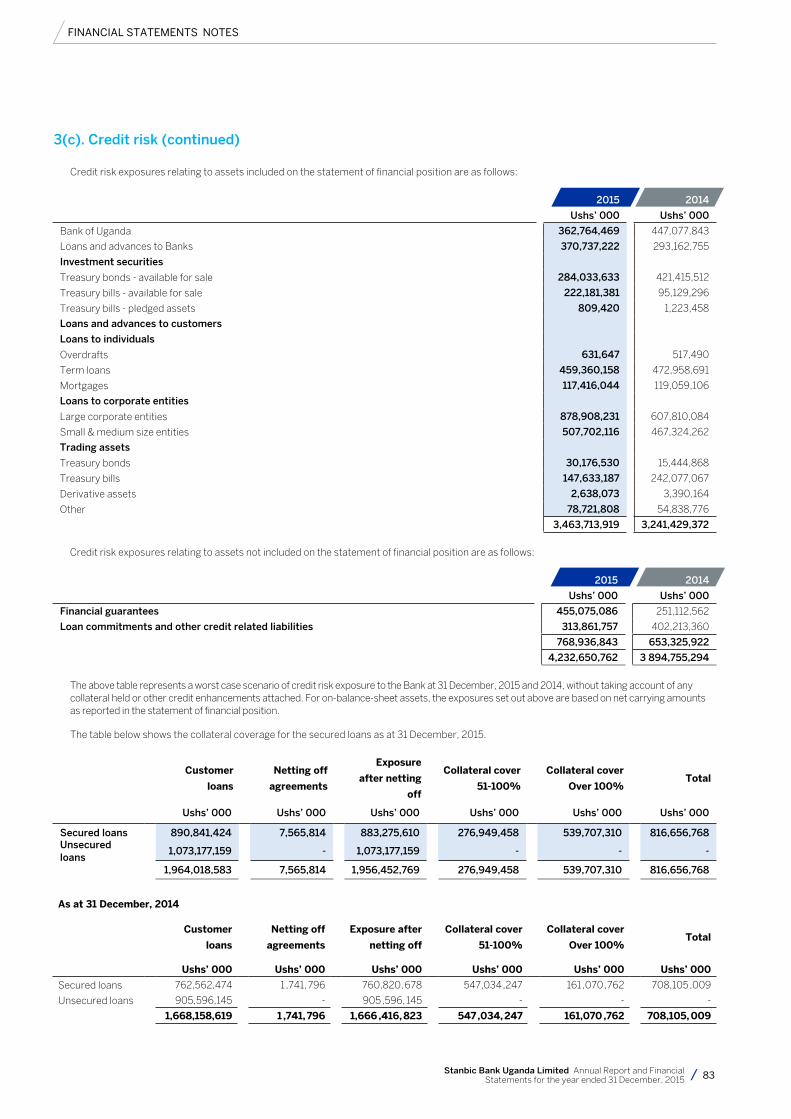
FINANCIAL STATEMENTS NOTES
83Stanbic Bank Uganda Limited Annual Report and Financial Statements for the year ended 31 December, 2015
Credit risk exposures relating to assets included on the statement of financial position are as follows:
2015 2014
Ushs’ 000 Ushs’ 000
Bank of Uganda 362,764,469 447,077,843
Loans and advances to Banks 370,737,222 293,162,755
Investment securities
Treasury bonds - available for sale 284,033,633 421,415,512
Treasury bills - available for sale 222,181,381 95,129,296
Treasury bills - pledged assets 809,420 1,223,458
Loans and advances to customers
Loans to individuals
Overdrafts 631,647 517,490
Term loans 459,360,158 472,958,691
Mortgages 117,416,044 119,059,106
Loans to corporate entities
Large corporate entities 878,908,231 607,810,084
Small & medium size entities 507,702,116 467,324,262
Trading assets
Treasury bonds 30,176,530 15,444,868
Treasury bills 147,633,187 242,077,067
Derivative assets 2,638,073 3,390,164
Other 78,721,808 54,838,776
3,463,713,919 3,241,429,372
Credit risk exposures relating to assets not included on the statement of financial position are as follows:
2015 2014
Ushs’ 000 Ushs’ 000
Financial guarantees 455,075,086 251,112,562
Loan commitments and other credit related liabilities 313,861,757 402,213,360
768,936,843 653,325,922
4,232,650,762 3 894,755,294
The above table represents a worst case scenario of credit risk exposure to the Bank at 31 December, 2015 and 2014, without taking account of any collateral held or other credit enhancements attached. For on-balance-sheet assets, the exposures set out above are based on net carrying amounts as reported in the statement of financial position.
The table below shows the collateral coverage for the secured loans as at 31 December, 2015.
Customer
loans
Netting off
agreements
Exposure
after netting
off
Collateral cover
51-100%
Collateral cover
Over 100% Total
Ushs’ 000 Ushs’ 000 Ushs’ 000 Ushs’ 000 Ushs’ 000 Ushs’ 000
Secured loans 890,841,424 7,565,814 883,275,610 276,949,458 539,707,310 816,656,768Unsecured loans
1,073,177,159 - 1,073,177,159 - - -
1,964,018,583 7,565,814 1,956,452,769 276,949,458 539,707,310 816,656,768
As at 31 December, 2014
Customer
loans
Netting off
agreements
Exposure after
netting off
Collateral cover
51-100%
Collateral cover
Over 100% Total
Ushs’ 000 Ushs’ 000 Ushs’ 000 Ushs’ 000 Ushs’ 000 Ushs’ 000
Secured loans 762,562,474 1 ,741, 796 760,820, 678 547,034 ,247 161 ,070 ,762 708,105 ,009
Unsecured loans 905,596,145 - 905 ,596, 145 - - -
1,668,158,619 1 ,741, 796 1,666 ,416, 823 547 ,034, 247 161,070 ,762 708,105, 009
3(c). Credit risk (continued)
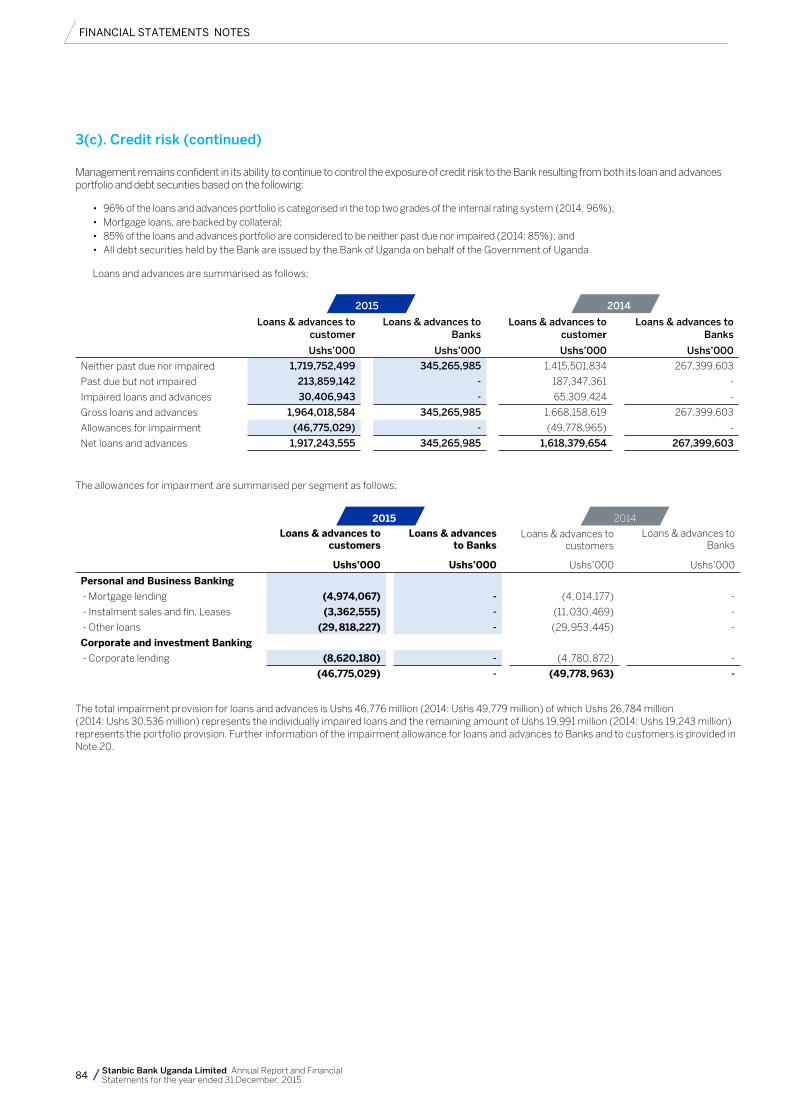
FINANCIAL STATEMENTS NOTES
84 Stanbic Bank Uganda Limited Annual Report and Financial Statements for the year ended 31 December, 2015
Management remains confident in its ability to continue to control the exposure of credit risk to the Bank resulting from both its loan and advances portfolio and debt securities based on the following:
• 96%oftheloansandadvancesportfolioiscategorisedinthetoptwogradesoftheinternalratingsystem(2014:96%);• Mortgageloans,arebackedbycollateral;• 85%oftheloansandadvancesportfolioareconsideredtobeneitherpastduenorimpaired(2014:85%);and• AlldebtsecuritiesheldbytheBankareissuedbytheBankofUgandaonbehalfoftheGovernmentofUganda.
Loans and advances are summarised as follows;
2015 2014
Loans & advances to customer
Loans & advances to Banks
Loans & advances to customer
Loans & advances to Banks
Ushs’000 Ushs’000 Ushs’000 Ushs’000
Neither past due nor impaired 1,719,752,499 345,265,985 1,415,501,834 267,399,603
Past due but not impaired 213,859,142 - 187,347,361 -
Impaired loans and advances 30,406,943 - 65,309,424 -
Gross loans and advances 1,964,018,584 345,265,985 1,668,158,619 267,399,603
Allowances for impairment (46,775,029) - (49,778,965) -
Net loans and advances 1,917,243,555 345,265,985 1,618,379,654 267,399,603
The allowances for impairment are summarised per segment as follows;
2015 2014
Loans & advances to customers
Loans & advances to Banks
Loans & advances to customers
Loans & advances to Banks
Ushs’000 Ushs’000 Ushs’000 Ushs’000
Personal and Business Banking
- Mortgage lending (4,974,067) - (4, 014,177) -
- Instalment sales and fin. Leases (3,362,555) - (11, 030 ,469) -
- Other loans (29, 818,227) - (29, 953 ,445) -
Corporate and investment Banking
- Corporate lending (8,620,180) - (4 ,780, 872) -
(46,775,029) - (49,778, 963) -
The total impairment provision for loans and advances is Ushs 46,776 million (2014: Ushs 49,779 million) of which Ushs 26,784 million (2014: Ushs 30,536 million) represents the individually impaired loans and the remaining amount of Ushs 19,991 million (2014: Ushs 19,243 million) represents the portfolio provision. Further information of the impairment allowance for loans and advances to Banks and to customers is provided in Note 20.
3(c). Credit risk (continued)
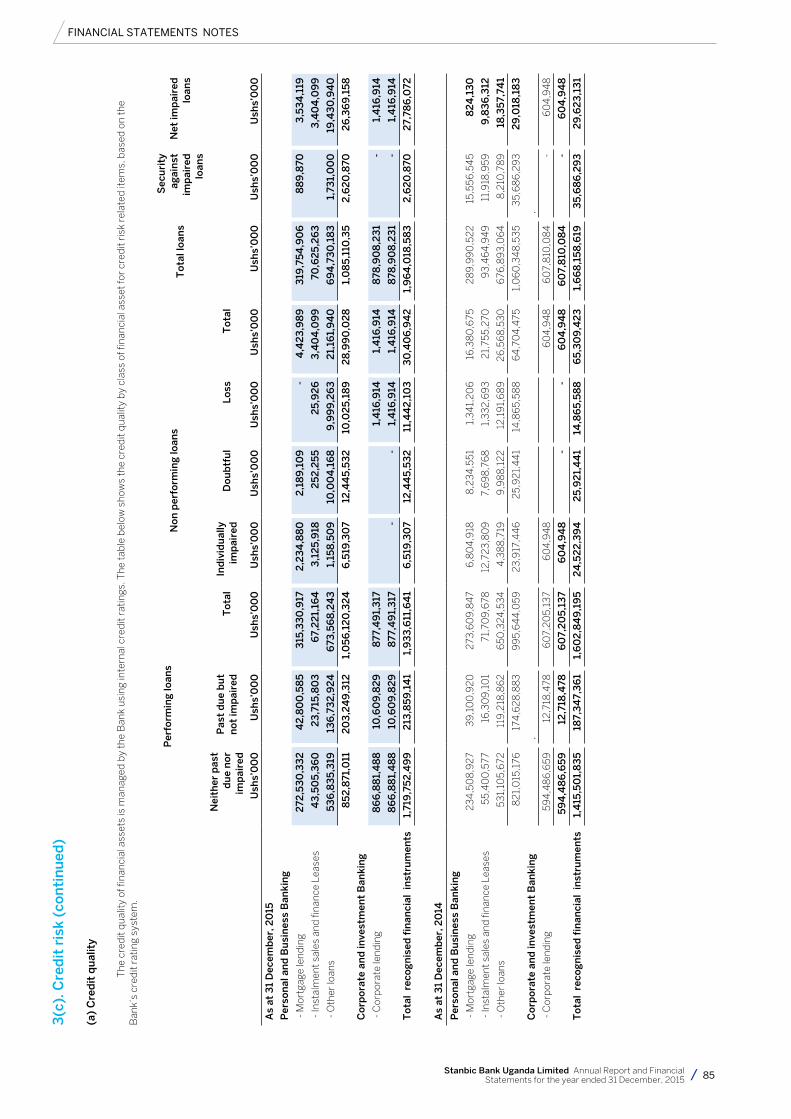
FINANCIAL STATEMENTS NOTES
85Stanbic Bank Uganda Limited Annual Report and Financial Statements for the year ended 31 December, 2015
3(c
). C
red
it r
isk
(co
nti
nu
ed)
(a)
Cre
dit
qu
alit
y
T
he c
red
it q
ualit
y of
fina
ncia
l ass
ets
is m
anag
ed b
y th
e B
ank
usin
g in
tern
al c
red
it ra
tings
. The
tab
le b
elow
sho
ws
the
cred
it q
ualit
y b
y cl
ass
of fi
nanc
ial a
sset
for
cred
it ri
sk r
elat
ed it
ems,
bas
ed o
n th
e B
ank’
s cr
edit
ratin
g sy
stem
.
Per
form
ing
loan
s
No
n p
erfo
rmin
g lo
ans
T
ota
l lo
ans
Sec
uri
ty
agai
nst
im
pai
red
lo
ans
Net
imp
aire
d
loan
s
N
eith
er p
ast
du
e n
or
imp
aire
d
Pas
t d
ue
bu
t n
ot
imp
aire
dT
ota
lIn
div
idu
ally
im
pai
red
Do
ub
tfu
lLo
ssT
ota
l
U
shs’
00
0U
shs’
00
0U
shs’
00
0U
shs’
00
0U
shs’
00
0U
shs’
00
0U
shs’
00
0 U
shs’
00
0
Ush
s’0
00
Ush
s’0
00
As
at 3
1 D
ecem
ber
, 20
15
Per
son
al a
nd
Bu
sin
ess
Ban
kin
g
- M
ortg
age
lend
ing
272
,53
0,3
32
42
,80
0,5
85
315
,33
0,9
172
,23
4,8
80
2,1
89
,10
9-
4,4
23
,98
93
19,7
54
,90
68
89
,870
3,5
34
,119
- In
stal
men
t sal
es a
nd fi
nanc
e Le
ases
43
,50
5,3
60
23
,715
,80
36
7,2
21,
164
3,1
25
,918
25
2,2
55
25
,92
63
,40
4,0
99
70,6
25
,26
33
,40
4,0
99
- O
ther
loan
s5
36
,83
5,3
1913
6,7
32
,92
46
73,5
68
,24
31,
158
,50
910
,00
4,1
68
9,9
99
,26
32
1,16
1,9
40
69
4,7
30
,18
31,
731,
00
019
,43
0,9
40
8
52
,871
,011
20
3,2
49
,312
1,0
56
,12
0,3
24
6,5
19,3
07
12,4
45
,53
210
,02
5,1
89
28
,99
0,0
28
1,0
85
,110
,35
2,6
20
,870
26
,36
9,1
58
Co
rpo
rate
an
d in
vest
men
t B
anki
ng
- C
orp
orat
e le
ndin
g8
66
,88
1,4
88
10,6
09
,82
98
77,4
91,
317
1,4
16,9
141,
416
,914
878
,90
8,2
31
-1,
416
,914
8
66
,88
1,4
88
10,6
09
,82
98
77,4
91,
317
--
1,4
16,9
141,
416
,914
878
,90
8,2
31
-1,
416
,914
To
tal
reco
gn
ised
fin
anci
al i
nst
rum
ents
1,71
9,7
52
,49
92
13,8
59
,14
11,
93
3,6
11,6
41
6,5
19,3
07
12,4
45
,53
211
,44
2,1
03
30
,40
6,9
42
1,9
64
,018
,58
32
,62
0,8
702
7,78
6,0
72
As
at 3
1 D
ecem
ber
, 20
14
Per
son
al a
nd
Bu
sin
ess
Ban
kin
g
- M
ortg
age
lend
ing
23
4,5
08
,92
73
9,1
00
,92
02
73,6
09
,84
76
,80
4,9
188
,23
4,5
511,
34
1,2
06
16,3
80
,675
28
9,9
90
,52
215
,556
,54
58
24
,13
0
- In
stal
men
t sal
es a
nd fi
nanc
e Le
ases
55,4
00
,577
16,3
09
,10
171
,70
9,6
7812
,72
3,8
09
7,6
98
,76
81,
33
2,6
93
21,
755,
270
93
,46
4,9
49
11,9
18,9
599
,83
6,3
12
- O
ther
loan
s53
1,10
5,6
7211
9,2
18,8
62
650
,32
4,5
34
4,3
88
,719
9,9
88
,12
212
,19
1,6
89
26
,56
8,5
30
676
,89
3,0
64
8,2
10,7
89
18,3
57,
741
8
21,
015
,176
174
,62
8,8
83
99
5,6
44
,059
23
,917
,44
62
5,9
21,
44
114
,86
5,58
86
4,7
04
,475
1,0
60
,34
8,5
35
35,
68
6,2
93
29
,018
,18
3
Co
rpo
rate
an
d in
vest
men
t B
anki
ng
,,
- C
orp
orat
e le
ndin
g59
4,4
86
,659
12,7
18,4
786
07,
20
5,13
76
04
,94
86
04
,94
86
07,
810
,08
4-
60
4,9
48
5
94
,48
6,6
59
12,7
18,4
786
07,
20
5,1
37
60
4,9
48
--
60
4,9
48
60
7,8
10,0
84
-6
04
,94
8
To
tal
reco
gn
ised
fin
anci
al i
nst
rum
ents
1,4
15,5
01,
83
518
7,3
47,
36
11,
60
2,8
49
,19
52
4,5
22
,39
42
5,9
21,
44
114
,86
5,5
88
65
,30
9,4
23
1,6
68
,15
8,6
193
5,6
86
,29
32
9,6
23
,13
1
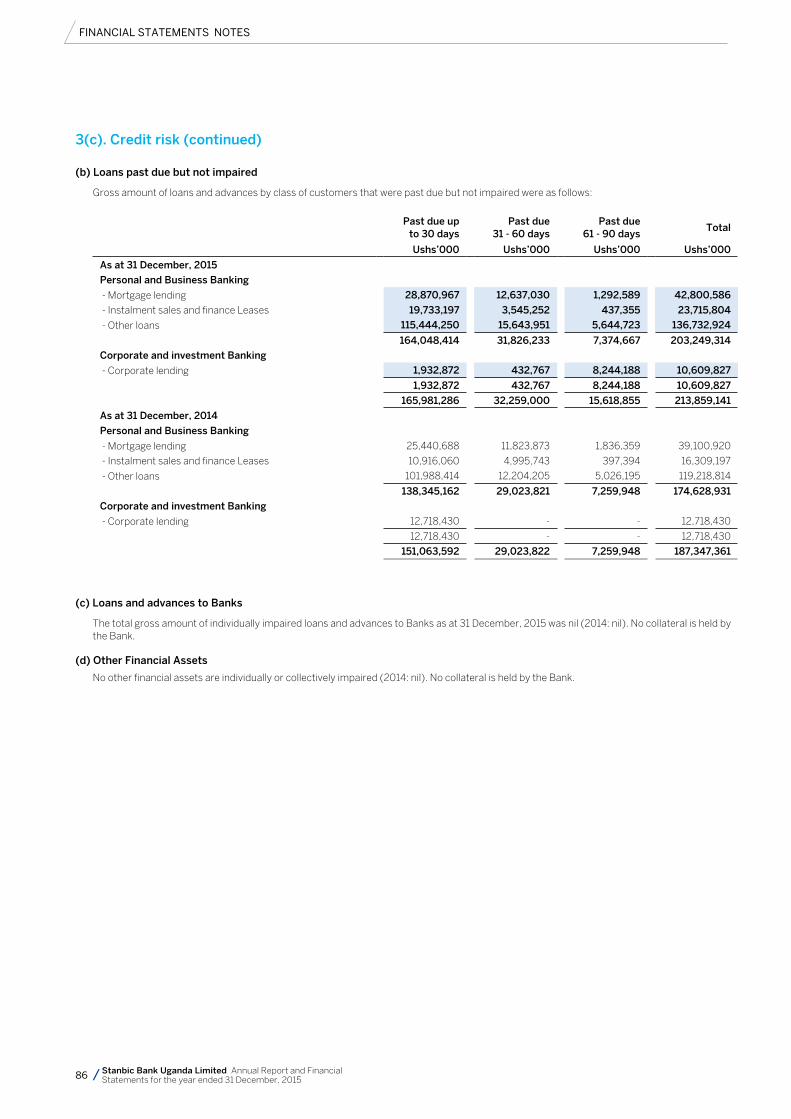
FINANCIAL STATEMENTS NOTES
86 Stanbic Bank Uganda Limited Annual Report and Financial Statements for the year ended 31 December, 2015
(b) Loans past due but not impaired
Gross amount of loans and advances by class of customers that were past due but not impaired were as follows:
Past due up
to 30 days
Past due 31 - 60 days
Past due
61 - 90 days Total
Ushs’000 Ushs’000 Ushs’000 Ushs’000
As at 31 December, 2015
Personal and Business Banking
- Mortgage lending 28,870,967 12,637,030 1,292,589 42,800,586
- Instalment sales and finance Leases 19,733,197 3,545,252 437,355 23,715,804
- Other loans 115,444,250 15,643,951 5,644,723 136,732,924
164,048,414 31,826,233 7,374,667 203,249,314
Corporate and investment Banking
- Corporate lending 1,932,872 432,767 8,244,188 10,609,827
1,932,872 432,767 8,244,188 10,609,827
165,981,286 32,259,000 15,618,855 213,859,141
As at 31 December, 2014
Personal and Business Banking
- Mortgage lending 25,440,688 11,823,873 1,836,359 39,100,920
- Instalment sales and finance Leases 10,916,060 4,995,743 397,394 16,309,197
- Other loans 101,988,414 12,204,205 5,026,195 119,218,814
138,345,162 29,023,821 7,259,948 174,628,931
Corporate and investment Banking
- Corporate lending 12,718,430 - - 12,718,430
12,718,430 - - 12,718,430
151,063,592 29,023,822 7,259,948 187,347,361
(c) Loans and advances to Banks
The total gross amount of individually impaired loans and advances to Banks as at 31 December, 2015 was nil (2014: nil). No collateral is held by the Bank.
(d) Other Financial Assets
No other financial assets are individually or collectively impaired (2014: nil). No collateral is held by the Bank.
3(c). Credit risk (continued)
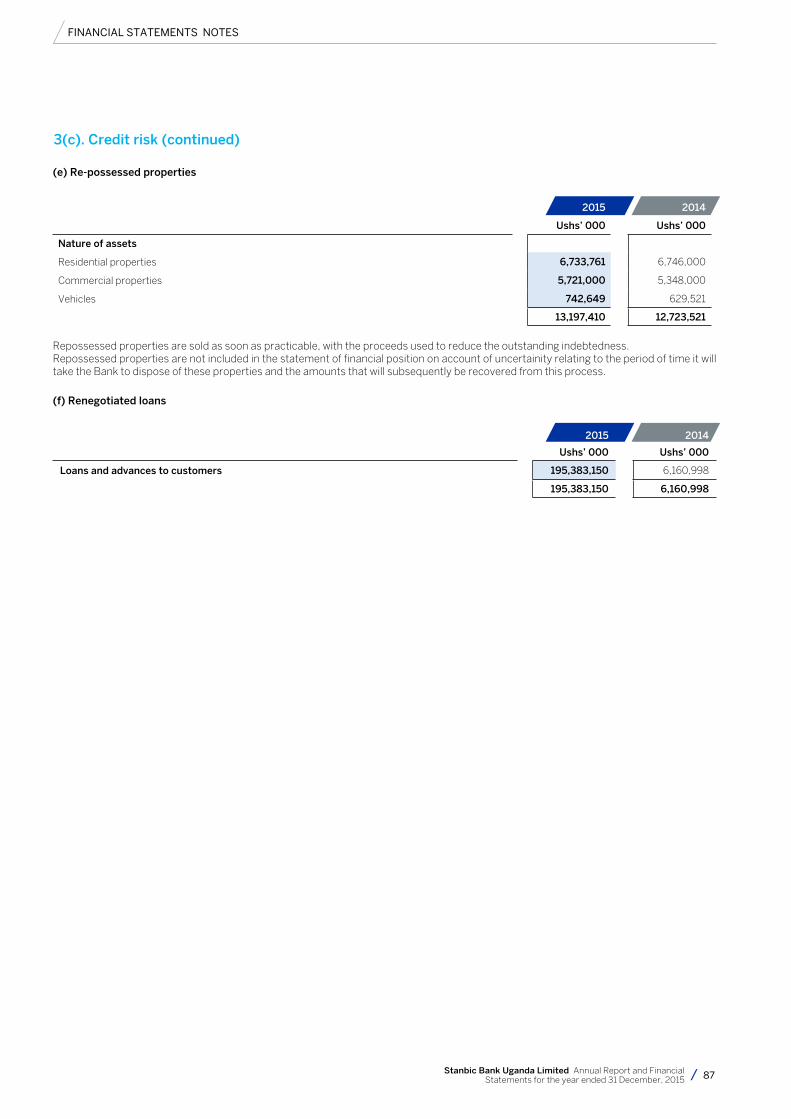
FINANCIAL STATEMENTS NOTES
87Stanbic Bank Uganda Limited Annual Report and Financial Statements for the year ended 31 December, 2015
(e) Re-possessed properties
2015 2014
Ushs’ 000 Ushs’ 000
Nature of assets
Residential properties 6,733,761 6,746,000
Commercial properties 5,721,000 5,348,000
Vehicles 742,649 629,521
13,197,410 12,723,521
Repossessed properties are sold as soon as practicable, with the proceeds used to reduce the outstanding indebtedness. Repossessed properties are not included in the statement of financial position on account of uncertainity relating to the period of time it will take the Bank to dispose of these properties and the amounts that will subsequently be recovered from this process.
(f) Renegotiated loans
2015 2014
Ushs’ 000 Ushs’ 000
Loans and advances to customers 195,383,150 6,160,998
195,383,150 6,160,998
3(c). Credit risk (continued)
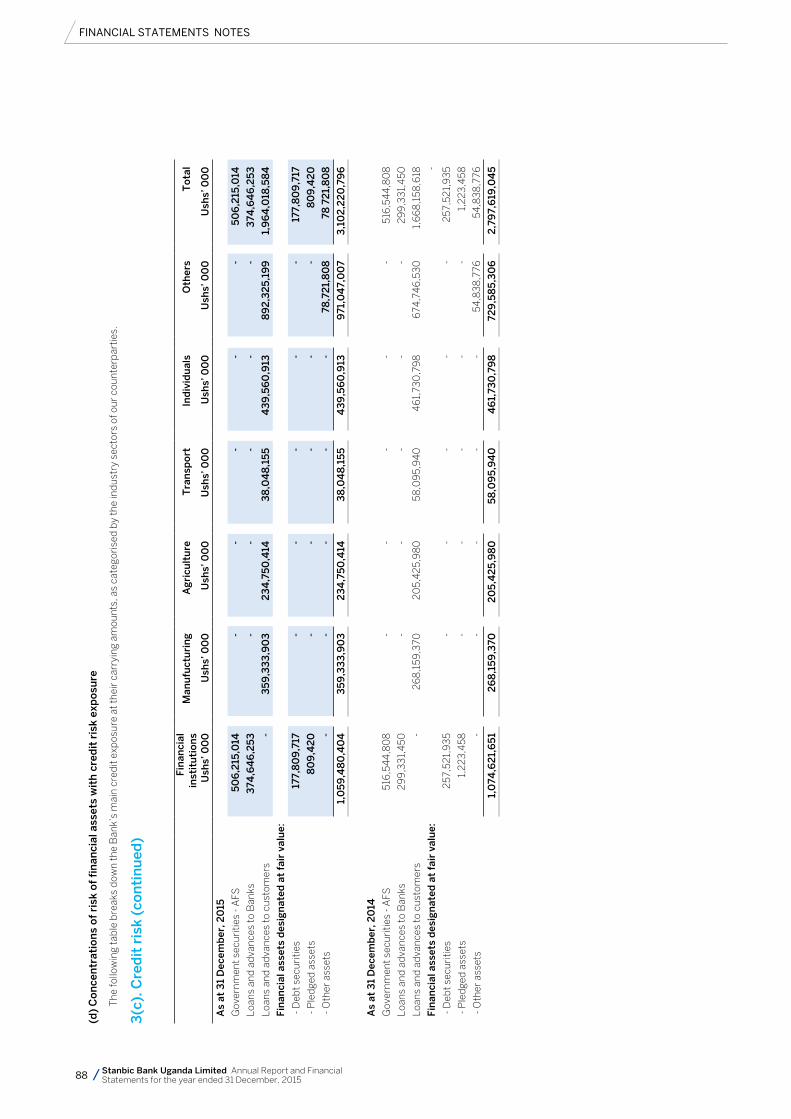
FINANCIAL STATEMENTS NOTES
88 Stanbic Bank Uganda Limited Annual Report and Financial Statements for the year ended 31 December, 2015
(d)
Co
nce
ntr
atio
ns
of
risk
of
fin
anci
al a
sset
s w
ith
cre
dit
ris
k ex
po
sure
T
he fo
llow
ing
tab
le b
reak
s d
own
the
Ban
k’s
mai
n cr
edit
exp
osur
e at
thei
r ca
rryi
ng a
mou
nts,
as
cate
gori
sed
by
the
ind
ustr
y se
ctor
s of
our
cou
nter
par
ties.
3(c
). C
red
it r
isk
(co
nti
nu
ed)
Fin
anci
al
inst
itu
tio
ns
M
anu
fuct
uri
ng
Ag
ricu
ltu
re
T
ran
spo
rt
In
div
idu
als
O
ther
s
To
tal
Ush
s’ 0
00
U
shs’
00
0
Ush
s’ 0
00
U
shs’
00
0
Ush
s’ 0
00
U
shs’
00
0
Ush
s’ 0
00
As
at 3
1 D
ecem
ber
, 20
15
Gov
ernm
ent s
ecur
ities
- A
FS
50
6,2
15,0
14
-
-
-
-
-
5
06
,215
,014
Loan
s an
d a
dva
nces
to B
anks
3
74,6
46
,25
3
-
-
-
-
-
3
74,6
46
,25
3
Loan
s an
d a
dva
nces
to c
usto
mer
s
-
35
9,3
33
,90
3
2
34
,75
0,4
14
3
8,0
48
,15
5
4
39
,56
0,9
13
8
92
,32
5,1
99
1,9
64
,018
,58
4
Fin
anci
al a
sset
s d
esig
nat
ed a
t fa
ir v
alu
e:
- D
ebt s
ecur
ities
17
7,8
09
,717
-
-
-
-
-
177,
80
9,7
17
- P
led
ged
ass
ets
8
09
,42
0
-
-
-
-
-
8
09
,42
0
- O
ther
ass
ets
-
-
-
-
-
78,7
21,
80
8
78
72
1,8
08
1,0
59
,48
0,4
04
35
9,3
33
,90
3
2
34
,75
0,4
14
3
8,0
48
,15
5
4
39
,56
0,9
13
9
71,0
47,
00
7
3,1
02
,22
0,7
96
As
at 3
1 D
ecem
ber
, 20
14
Gov
ernm
ent s
ecur
ities
- A
FS
516
,54
4,8
08
-
-
-
-
-
51
6,5
44
,80
8
Loan
s an
d a
dva
nces
to B
anks
2
99
,33
1,4
50
-
-
-
-
-
29
9,3
31,
450
Loan
s an
d a
dva
nces
to c
usto
mer
s
-
26
8,1
59,3
702
05,
42
5,9
80
58,0
95,
94
0
46
1,73
0,7
98
674
,74
6,5
30
1,
66
8,1
58,6
18
Fin
anci
al a
sset
s d
esig
nat
ed a
t fa
ir v
alu
e:
-
- D
ebt s
ecur
ities
2
57,5
21,
93
5
-
-
-
-
-
257
,52
1,9
35
- P
led
ged
ass
ets
1,
22
3,4
58
-
-
-
-
-
1,2
23
,458
- O
ther
ass
ets
-
-
-
-
-
54
,83
8,7
76
54,8
38
,776
1,0
74,6
21,
65
1
26
8,1
59
,370
2
05
,42
5,9
80
5
8,0
95
,94
0
46
1,73
0,7
98
72
9,5
85
,30
6
2,7
97,
619
,04
5
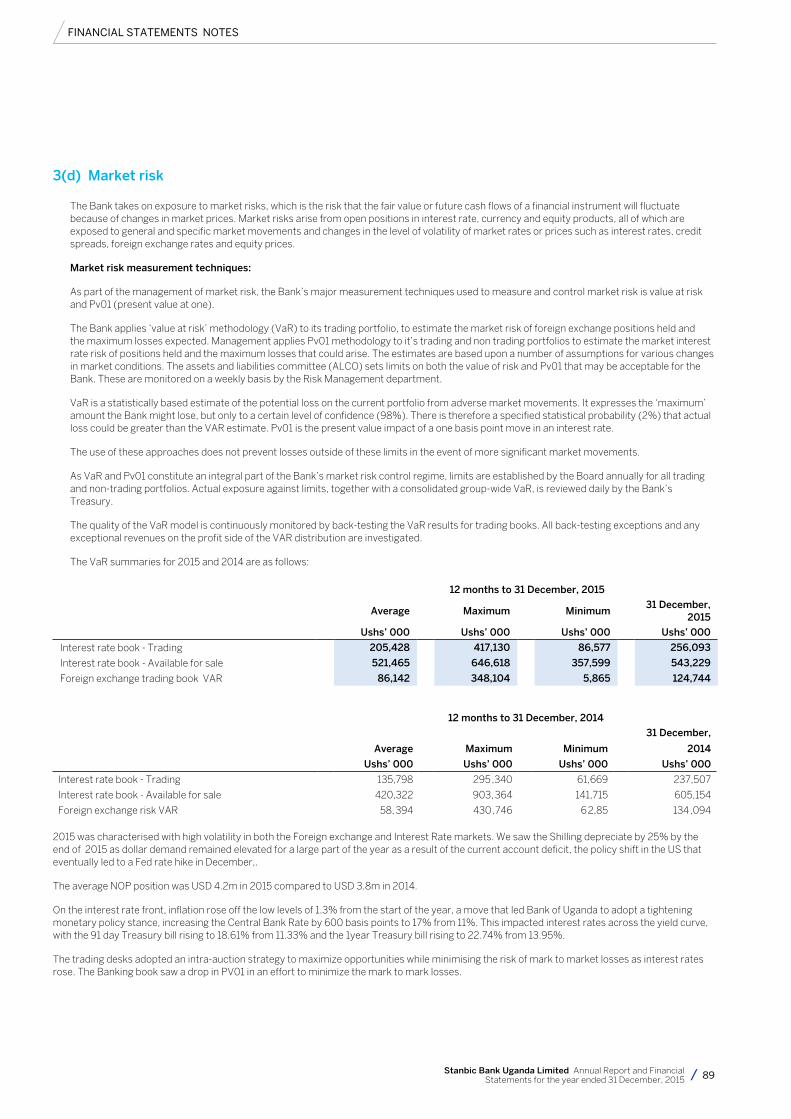
FINANCIAL STATEMENTS NOTES
89Stanbic Bank Uganda Limited Annual Report and Financial Statements for the year ended 31 December, 2015
3(d) Market risk The Bank takes on exposure to market risks, which is the risk that the fair value or future cash flows of a financial instrument will fluctuate
because of changes in market prices. Market risks arise from open positions in interest rate, currency and equity products, all of which are exposed to general and specific market movements and changes in the level of volatility of market rates or prices such as interest rates, credit spreads, foreign exchange rates and equity prices.
Market risk measurement techniques:
As part of the management of market risk, the Bank’s major measurement techniques used to measure and control market risk is value at risk and Pv01 (present value at one).
The Bank applies ‘value at risk’ methodology (VaR) to its trading portfolio, to estimate the market risk of foreign exchange positions held and the maximum losses expected. Management applies Pv01 methodology to it’s trading and non trading portfolios to estimate the market interest rate risk of positions held and the maximum losses that could arise. The estimates are based upon a number of assumptions for various changes in market conditions. The assets and liabilities committee (ALCO) sets limits on both the value of risk and Pv01 that may be acceptable for the Bank. These are monitored on a weekly basis by the Risk Management department.
VaR is a statistically based estimate of the potential loss on the current portfolio from adverse market movements. It expresses the ‘maximum’ amount the Bank might lose, but only to a certain level of confidence (98%). There is therefore a specified statistical probability (2%) that actual loss could be greater than the VAR estimate. Pv01 is the present value impact of a one basis point move in an interest rate.
The use of these approaches does not prevent losses outside of these limits in the event of more significant market movements.
As VaR and Pv01 constitute an integral part of the Bank’s market risk control regime, limits are established by the Board annually for all trading and non-trading portfolios. Actual exposure against limits, together with a consolidated group-wide VaR, is reviewed daily by the Bank’s Treasury.
The quality of the VaR model is continuously monitored by back-testing the VaR results for trading books. All back-testing exceptions and any exceptional revenues on the profit side of the VAR distribution are investigated.
The VaR summaries for 2015 and 2014 are as follows:
12 months to 31 December, 2015
Average Maximum Minimum 31 December,
2015
Ushs’ 000 Ushs’ 000 Ushs’ 000 Ushs’ 000
Interest rate book - Trading 205,428 417,130 86,577 256,093
Interest rate book - Available for sale 521,465 646,618 357,599 543,229
Foreign exchange trading book VAR 86,142 348,104 5,865 124,744
12 months to 31 December, 2014
Average Maximum Minimum
31 December,
2014
Ushs’ 000 Ushs’ 000 Ushs’ 000 Ushs’ 000
Interest rate book - Trading 135,798 295 ,340 61,669 237,507
Interest rate book - Available for sale 420,322 903, 364 141,715 605,154
Foreign exchange risk VAR 58, 394 430 ,746 6 2,85 134 ,094
2015 was characterised with high volatility in both the Foreign exchange and Interest Rate markets. We saw the Shilling depreciate by 25% by the end of 2015 as dollar demand remained elevated for a large part of the year as a result of the current account deficit, the policy shift in the US that eventually led to a Fed rate hike in December,.
The average NOP position was USD 4.2m in 2015 compared to USD 3.8m in 2014.
On the interest rate front, inflation rose off the low levels of 1.3% from the start of the year, a move that led Bank of Uganda to adopt a tightening monetary policy stance, increasing the Central Bank Rate by 600 basis points to 17% from 11%. This impacted interest rates across the yield curve, with the 91 day Treasury bill rising to 18.61% from 11.33% and the 1year Treasury bill rising to 22.74% from 13.95%.
The trading desks adopted an intra-auction strategy to maximize opportunities while minimising the risk of mark to market losses as interest rates rose. The Banking book saw a drop in PV01 in an effort to minimize the mark to mark losses.
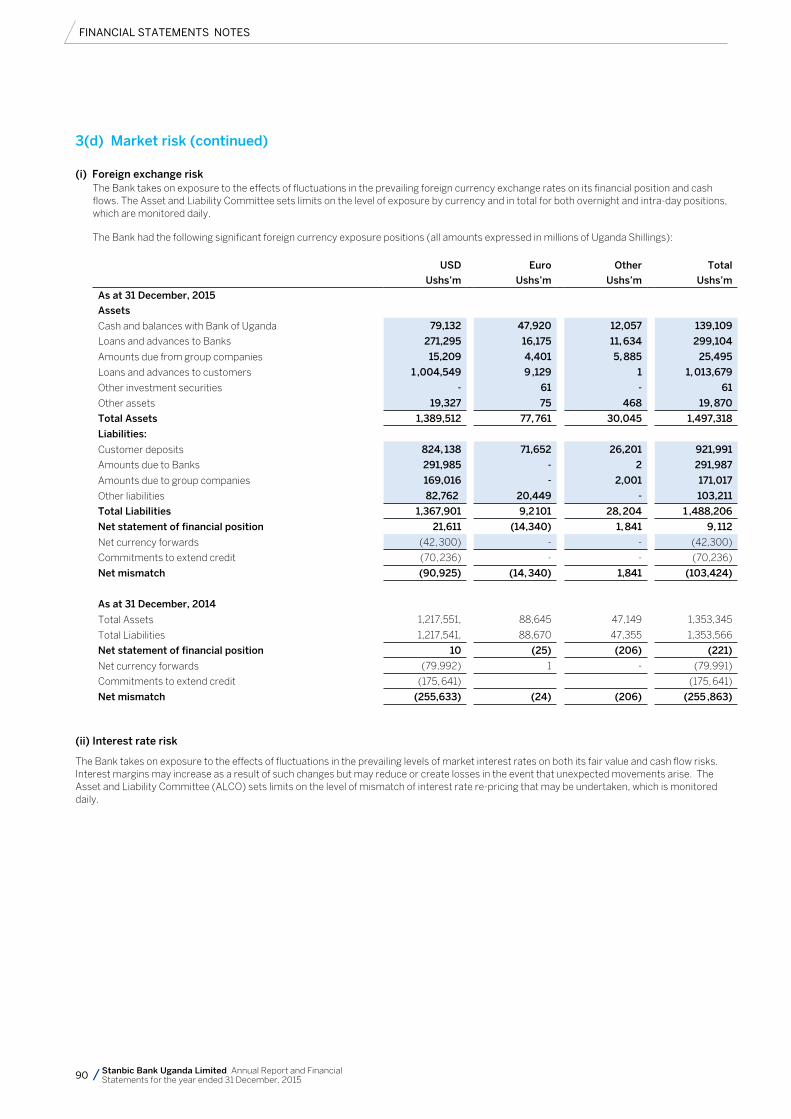
FINANCIAL STATEMENTS NOTES
90 Stanbic Bank Uganda Limited Annual Report and Financial Statements for the year ended 31 December, 2015
(i) Foreign exchange risk The Bank takes on exposure to the effects of fluctuations in the prevailing foreign currency exchange rates on its financial position and cash
flows. The Asset and Liability Committee sets limits on the level of exposure by currency and in total for both overnight and intra-day positions, which are monitored daily.
The Bank had the following significant foreign currency exposure positions (all amounts expressed in millions of Uganda Shillings):
USD Euro Other Total
Ushs’m Ushs’m Ushs’m Ushs’m
As at 31 December, 2015
Assets
Cash and balances with Bank of Uganda 79,132 47,920 12,057 139,109
Loans and advances to Banks 271,295 16,175 11, 634 299,104
Amounts due from group companies 15,209 4,401 5, 885 25,495
Loans and advances to customers 1 ,004,549 9 ,129 1 1, 013,679
Other investment securities - 61 - 61
Other assets 19,327 75 468 19, 870
Total Assets 1,389,512 77, 761 30,045 1,497,318
Liabilities:
Customer deposits 824, 138 71,652 26,201 921,991
Amounts due to Banks 291,985 - 2 291,987
Amounts due to group companies 169,016 - 2,001 171,017
Other liabilities 82,762, 20,449 - 103,211
Total Liabilities 1,367,901 9,2 101 28, 204 1 ,488,206
Net statement of financial position 21,611 (14,340) 1, 841 9, 112
Net currency forwards (42, 300) - - (42,300)
Commitments to extend credit (70, 236) - - (70,236)
Net mismatch (90,925) (14, 340) 1,841 (103,424)
As at 31 December, 2014
Total Assets 1,217,551, 88,645 47,149 1,353,345
Total Liabilities 1,217,541, 88,670 47,355 1,353,566
Net statement of financial position 10 (25) (206) (221)
Net currency forwards (79,992) 1 - (79,991)
Commitments to extend credit (175, 641) (175, 641)
Net mismatch (255,633) (24) (206) (255 ,863)
(ii) Interest rate risk
The Bank takes on exposure to the effects of fluctuations in the prevailing levels of market interest rates on both its fair value and cash flow risks. Interest margins may increase as a result of such changes but may reduce or create losses in the event that unexpected movements arise. The Asset and Liability Committee (ALCO) sets limits on the level of mismatch of interest rate re-pricing that may be undertaken, which is monitored daily.
3(d) Market risk (continued)
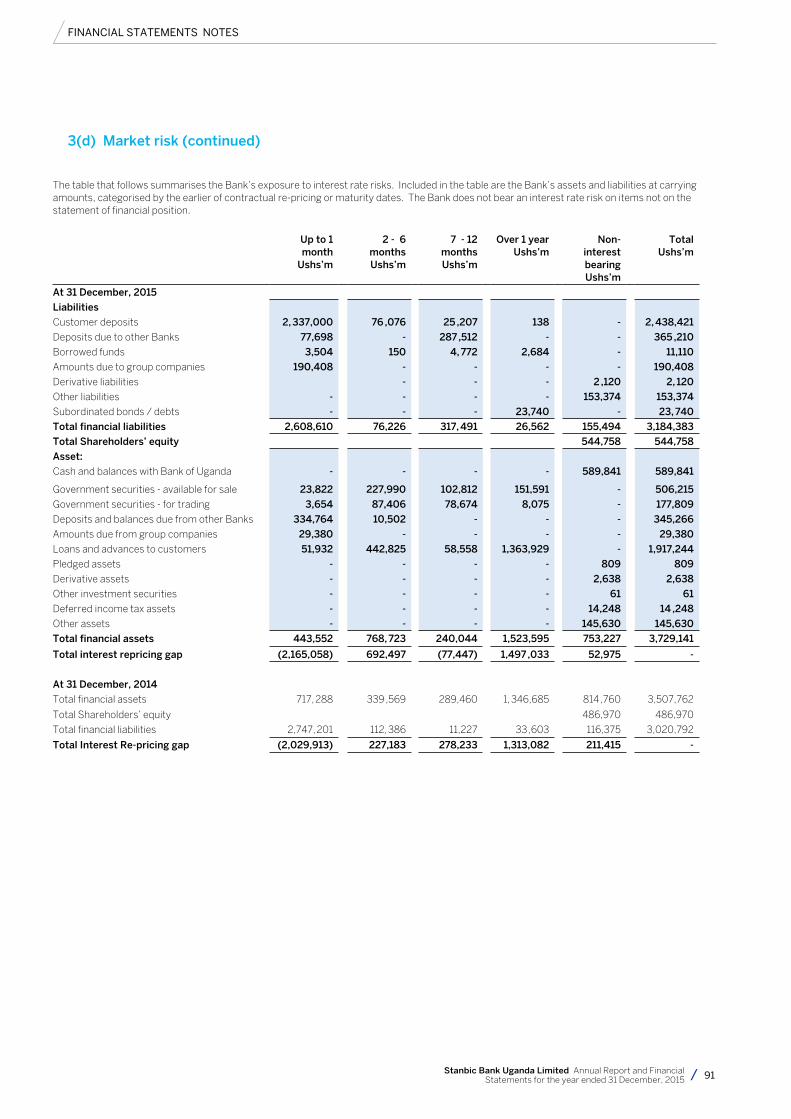
FINANCIAL STATEMENTS NOTES
91Stanbic Bank Uganda Limited Annual Report and Financial Statements for the year ended 31 December, 2015
The table that follows summarises the Bank’s exposure to interest rate risks. Included in the table are the Bank’s assets and liabilities at carrying amounts, categorised by the earlier of contractual re-pricing or maturity dates. The Bank does not bear an interest rate risk on items not on the statement of financial position.
Up to 1 month
Ushs’m
2 - 6 months Ushs’m
7 - 12 months Ushs’m
Over 1 year Ushs’m
Non-interest bearing Ushs’m
Total Ushs’m
At 31 December, 2015
Liabilities
Customer deposits 2, 337,000 76 ,076 25 ,207 138 - 2, 438,421
Deposits due to other Banks 77,698 - 287 ,512 - - 365 ,210
Borrowed funds 3,504 150 4, 772 2,684 - 11,110
Amounts due to group companies 190,408 - - - - 190,408
Derivative liabilities - - - 2 ,120 2, 120
Other liabilities - - - - 153,374 153,374
Subordinated bonds / debts - - - 23,740 - 23, 740
Total financial liabilities 2,608,610 76,226 317, 491 26,562 155,494 3,184,383
Total Shareholders’ equity 544,758 544,758
Asset:
Cash and balances with Bank of Uganda - - - - 589,841 589,841
Government securities - available for sale 23,822 227,990 102,812 151,591 - 506,215
Government securities - for trading 3,654 87,406 78,674 8,075 - 177,809
Deposits and balances due from other Banks 334,764 10,502 - - - 345,266
Amounts due from group companies 29,380 - - - - 29,380
Loans and advances to customers 51,932 442,825 58,558 1,363,929 - 1,917,244
Pledged assets - - - - 809 809
Derivative assets - - - - 2,638 2,638
Other investment securities - - - - 61 61
Deferred income tax assets - - - - 14,248 14 ,248
Other assets - - - - 145,630 145,630
Total financial assets 443,552 768, 723 240,044 1,523,595 753,227 3,729,141
Total interest repricing gap (2,165,058) 692,497 (77,447) 1,497 ,033 52,975 -
At 31 December, 2014
Total financial assets 717, 288 339 ,569 289,460 1, 346,685 814 ,760 3,507,762
Total Shareholders’ equity 486,970 486,970
Total financial liabilities 2,747, 201 112, 386 11,227 33 ,603 116,375 3,020,792
Total Interest Re-pricing gap (2,029,913) 227,183 278,233 1,313,082 211,415 -
3(d) Market risk (continued)
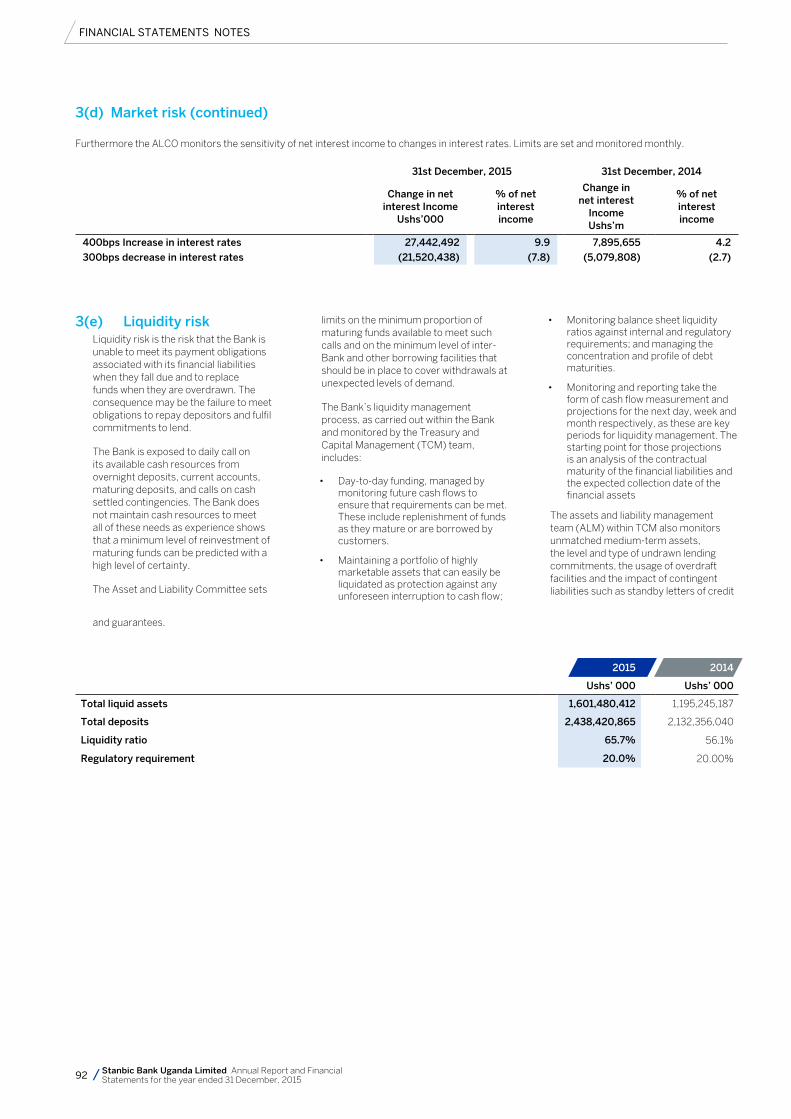
FINANCIAL STATEMENTS NOTES
92 Stanbic Bank Uganda Limited Annual Report and Financial Statements for the year ended 31 December, 2015
Furthermore the ALCO monitors the sensitivity of net interest income to changes in interest rates. Limits are set and monitored monthly.
31st December, 2015 31st December, 2014
Change in net
interest Income Ushs’000
% of net interest income
Change in net interest
Income Ushs’m
% of net interest income
400bps Increase in interest rates 27,442,492 9.9 7,895,655 4.2
300bps decrease in interest rates (21,520,438) (7.8) (5,079,808) (2.7)
3(e) Liquidity risk Liquidity risk is the risk that the Bank is
unable to meet its payment obligations associated with its financial liabilities when they fall due and to replace funds when they are overdrawn. The consequence may be the failure to meet obligations to repay depositors and fulfil commitments to lend.
The Bank is exposed to daily call on its available cash resources from overnight deposits, current accounts, maturing deposits, and calls on cash settled contingencies. The Bank does not maintain cash resources to meet all of these needs as experience shows that a minimum level of reinvestment of maturing funds can be predicted with a high level of certainty.
The Asset and Liability Committee sets
limits on the minimum proportion of maturing funds available to meet such calls and on the minimum level of inter-Bank and other borrowing facilities that should be in place to cover withdrawals at unexpected levels of demand.
The Bank’s liquidity management process, as carried out within the Bank and monitored by the Treasury and Capital Management (TCM) team, includes:
• Day-to-dayfunding,managedbymonitoring future cash flows to ensure that requirements can be met. These include replenishment of funds as they mature or are borrowed by customers.
• Maintainingaportfolioofhighlymarketable assets that can easily be liquidated as protection against any unforeseen interruption to cash flow;
• Monitoringbalancesheetliquidityratios against internal and regulatory requirements; and managing the concentration and profile of debt maturities.
• Monitoringandreportingtaketheform of cash flow measurement and projections for the next day, week and month respectively, as these are key periods for liquidity management. The starting point for those projections is an analysis of the contractual maturity of the financial liabilities and the expected collection date of the financial assets
The assets and liability management team (ALM) within TCM also monitors unmatched medium-term assets, the level and type of undrawn lending commitments, the usage of overdraft facilities and the impact of contingent liabilities such as standby letters of credit
3(d) Market risk (continued)
and guarantees.
2015 2014
Ushs’ 000 Ushs’ 000
Total liquid assets 1,601,480,412 1,195,245,187
Total deposits 2,438,420,865 2,132,356,040
Liquidity ratio 65.7% 56.1%
Regulatory requirement 20.0% 20.00%
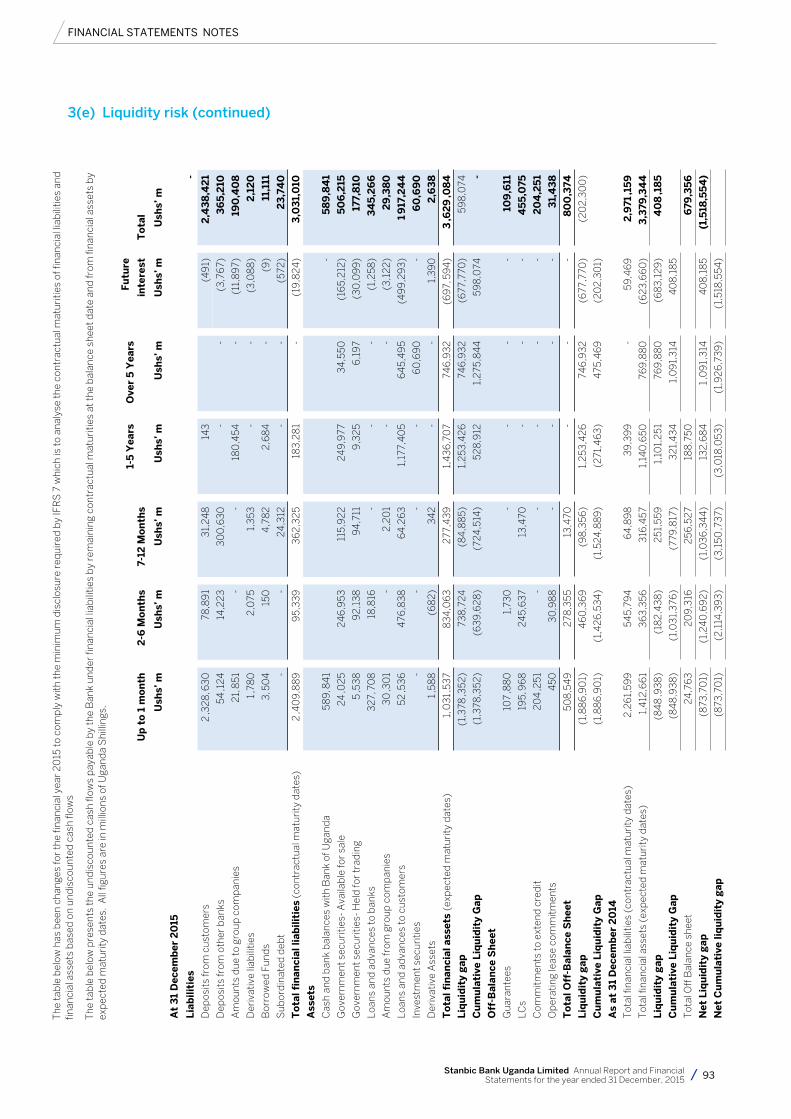
FINANCIAL STATEMENTS NOTES
93Stanbic Bank Uganda Limited Annual Report and Financial Statements for the year ended 31 December, 2015
U
p t
o 1
mo
nth
2
-6 M
on
ths
7-
12 M
on
ths
1-
5 Y
ears
O
ver
5 Y
ears
F
utu
re
inte
rest
T
ota
l
U
shs’
m
Ush
s’ m
U
shs’
m
Ush
s’ m
U
shs’
m
Ush
s’ m
U
shs’
m
At
31
Dec
emb
er 2
015
Lia
bil
itie
s
-
Dep
osits
from
cus
tom
ers
2 ,3
28
, 63
0
7
8,8
91
3
1,2
48
14
3
(
49
1)
2,4
38
,42
1
Dep
osits
from
oth
er b
anks
54 ,1
24
14
,22
3
3
00
,63
0
-
-
(
3,7
67)
3
65
,210
Am
ount
s d
ue to
gro
up c
omp
anie
s2
1, 8
51
-
-
1
80
,454
-
(11
,89
7)
19
0,4
08
Der
ivat
ive
liab
ilitie
s1 ,
780
2,0
75
1
,353
-
-
(3
,08
8)
2
,12
0
Bor
row
ed F
und
s3
, 50
4
1
50
4
,78
2
2
,68
4
-
(
9)
1
1,11
1
Sub
ord
inat
ed d
ebt
-
-
24
,312
-
-
(57
2)
2
3,7
40
To
tal f
inan
cial
liab
ilit
ies
(con
trac
tual
mat
urity
dat
es)
2 ,4
09
,88
9
9
5,3
39
36
2,3
25
1
83
,28
1
-
(19
,82
4)
3
,03
1,0
10
Ass
ets
Cas
h an
d b
ank
bal
ance
s w
ith B
ank
of U
gand
a 5
89
, 84
1
-
58
9,8
41
Gov
ernm
ent s
ecur
ities
- Ava
ilab
le fo
r sa
le 2
4 ,0
25
2
46
,953
115
,92
2
2
49
,977
34
,550
(16
5,2
12)
5
06
,215
Gov
ernm
ent s
ecur
ities
- Hel
d fo
r tr
adin
g 5
,53
8
9
2,1
38
94
,711
9,3
25
6
,19
7
(3
0,0
99
)
177
,810
Loan
s an
d a
dva
nces
to b
anks
32
7, 7
08
18
,816
-
-
-
(1,
258
)
34
5,2
66
Am
ount
s d
ue fr
om g
roup
com
pan
ies
30
,30
1
-
2,2
01
-
-
(
3,1
22
)
29
,38
0
Loan
s an
d a
dva
nces
to c
usto
mer
s 5
2 ,5
36
476
,83
8
6
4,2
63
1,1
77,4
05
6
45,
49
5
(4
99
,29
3)
1
917
,24
4
Inve
stm
ent s
ecur
ities
-
-
-
-
60
,69
0
-
6
0,6
90
Der
ivat
ive
Ass
ets
1 ,5
88
(6
82
)
34
2
-
-
1
,39
0
2
,63
8
To
tal f
inan
cial
ass
ets
(exp
ecte
d m
atur
ity d
ates
) 1
, 03
1 ,53
7
83
4,0
63
277
,43
9
1
,43
6,7
07
7
46
,93
2
(
69
7, 5
94
)
3 ,6
29
,08
4
Liq
uid
ity
gap
(1,
378
,352
)
73
8,7
24
(8
4,8
85)
1
,253
,42
6
7
46
,93
2
(
677
,770
)
59
8,0
74
Cu
mu
lati
ve L
iqu
idit
y G
ap (
1,3
78,3
52)
(
63
9,6
28
)
(72
4,5
14)
5
28
,912
1,2
75,8
44
59
8,0
74
-
Off
-Bal
ance
Sh
eet
Gua
rant
ees
10
7 ,8
80
1,7
30
-
-
-
-
10
9,6
11
LCs
19
5, 9
68
24
5,6
37
1
3,4
70
-
-
-
4
55
,075
Com
mitm
ents
to e
xten
d c
red
it 2
04
,251
-
-
-
-
-
20
4,2
51
Op
erat
ing
leas
e co
mm
itmen
ts 4
50
3
0,9
88
-
-
-
-
31,
43
8
To
tal O
ff-B
alan
ce S
hee
t 5
08
,54
9
2
78,3
55
1
3,4
70
-
-
-
8
00
,374
Liq
uid
ity
gap
(1,
88
6,9
01)
4
60
,36
9
(
98
,356
)
1,2
53,4
26
74
6,9
32
(6
77,7
70)
(
20
2,3
00
)
Cu
mu
lati
ve L
iqu
idit
y G
ap (
1,8
86
,90
1)
(1,
42
6,5
34
)
(1,
524
,88
9)
(
271
,46
3)
4
75,4
69
(2
02
,30
1)
As
at 3
1 D
ecem
ber
20
14
Tot
al fi
nanc
ial l
iab
ilitie
s (c
ontr
actu
al m
atur
ity d
ates
) 2
,26
1,59
9
5
45,
794
64
,89
8
3
9,3
99
-
59
,46
9
2
,971
,15
9
Tot
al fi
nanc
ial a
sset
s (e
xpec
ted
mat
urity
dat
es)
1,4
12,6
61
3
63
,356
316
,457
1,1
40
,650
76
9,8
80
(6
23
,66
0)
3
,379
,34
4
Liq
uid
ity
gap
(8
48
,93
8)
(
182
,43
8)
2
51,5
59
1
,10
1,2
51
7
69
,88
0
(
68
3,1
29
)
40
8 ,1
85
Cu
mu
lati
ve L
iqu
idit
y G
ap (
84
8,9
38
)
(1,
03
1,3
76)
(
779
,817
)
32
1,4
34
1,0
91,
314
40
8,1
85
Tot
al O
ff B
alan
ce s
heet
24
,76
3
2
09
,316
256
,52
7
18
8,7
50
6
79,3
56
Net
Liq
uid
ity
gap
(8
73,7
01)
(
1,2
40
,69
2)
(
1,0
36
,34
4)
1
32
,68
4
1
,09
1 ,3
14
4
08
,18
5
(1,
518
,55
4)
Net
Cu
mu
lati
ve li
qu
idit
y g
ap (
873
,70
1)
(2
,114
,39
3)
(
3,1
50 ,7
37)
(
3,0
18,0
53)
(
1,9
26
,73
9)
(
1,51
8,5
54)
3(e) Liquidity risk (continued)
The
tab
le b
elow
has
bee
n ch
ange
s fo
r th
e fin
anci
al y
ear
20
15 to
com
ply
with
the
min
imum
dis
clos
ure
req
uire
d b
y IF
RS
7 w
hich
is to
ana
lyse
the
cont
ract
ual m
atur
ities
of f
inan
cial
liab
ilitie
s an
d
finan
cial
ass
ets
bas
ed o
n un
dis
coun
ted
cas
h flo
ws
The
tab
le b
elow
pre
sent
s th
e un
dis
coun
ted
cas
h flo
ws
pay
able
by
the
Ban
k un
der
fina
ncia
l lia
bili
ties
by
rem
aini
ng c
ontr
actu
al m
atur
ities
at t
he b
alan
ce s
heet
dat
e an
d fr
om fi
nanc
ial a
sset
s b
y ex
pec
ted
mat
urity
dat
es.
All
figur
es a
re in
mill
ions
of U
gand
a S
hilli
ngs.
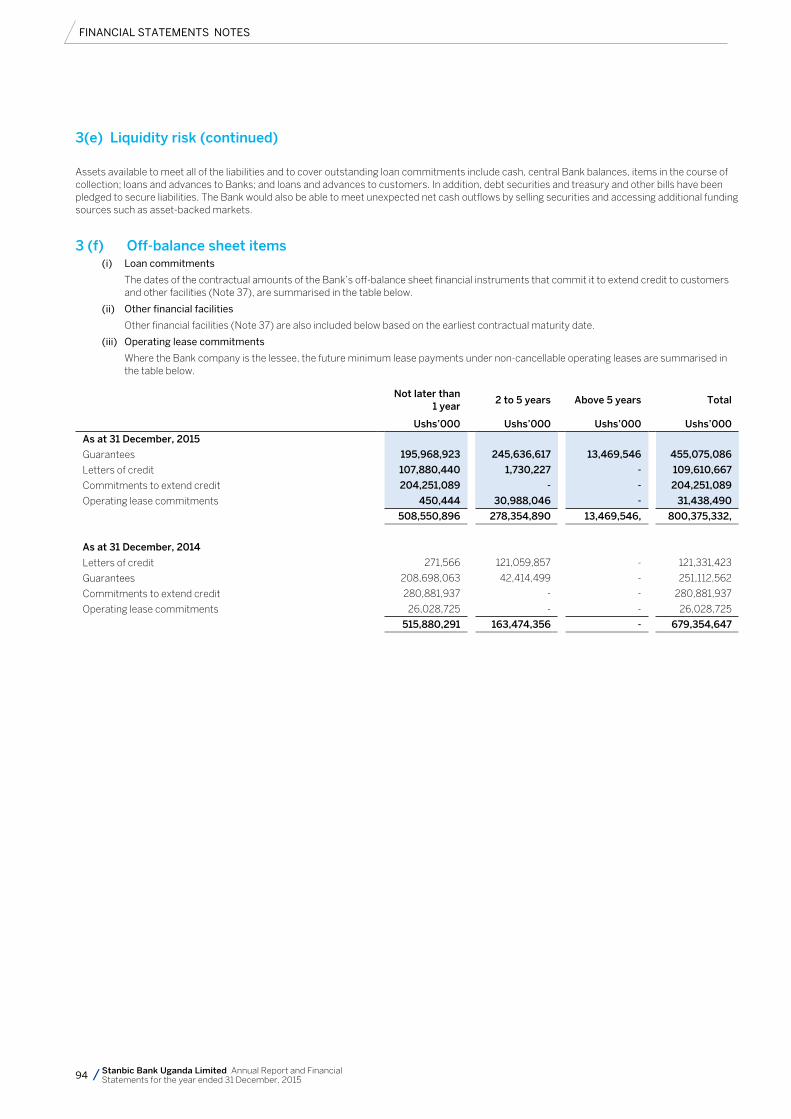
FINANCIAL STATEMENTS NOTES
94 Stanbic Bank Uganda Limited Annual Report and Financial Statements for the year ended 31 December, 2015
Assets available to meet all of the liabilities and to cover outstanding loan commitments include cash, central Bank balances, items in the course of collection; loans and advances to Banks; and loans and advances to customers. In addition, debt securities and treasury and other bills have been pledged to secure liabilities. The Bank would also be able to meet unexpected net cash outflows by selling securities and accessing additional funding sources such as asset-backed markets.
3 (f) Off-balance sheet items(i) Loan commitments
The dates of the contractual amounts of the Bank’s off-balance sheet financial instruments that commit it to extend credit to customers and other facilities (Note 37), are summarised in the table below.
(ii) Other financial facilities
Other financial facilities (Note 37) are also included below based on the earliest contractual maturity date.
(iii) Operating lease commitments
Where the Bank company is the lessee, the future minimum lease payments under non-cancellable operating leases are summarised in the table below.
Not later than
1 year 2 to 5 years Above 5 years Total
Ushs’000 Ushs’000 Ushs’000 Ushs’000
As at 31 December, 2015
Guarantees 195,968,923 245,636,617 13,469,546 455,075,086
Letters of credit 107,880,440 1,730,227 - 109,610,667
Commitments to extend credit 204,251,089 - - 204,251,089
Operating lease commitments 450,444 30,988,046 - 31,438,490
508,550,896 278,354,890 13,469,546, 800,375,332,
As at 31 December, 2014
Letters of credit 271,566 121,059,857 - 121,331,423
Guarantees 208,698,063 42,414,499 - 251,112,562
Commitments to extend credit 280,881,937 - - 280,881,937
Operating lease commitments 26,028,725 - - 26,028,725
515,880,291 163,474,356 - 679,354,647
3(e) Liquidity risk (continued)
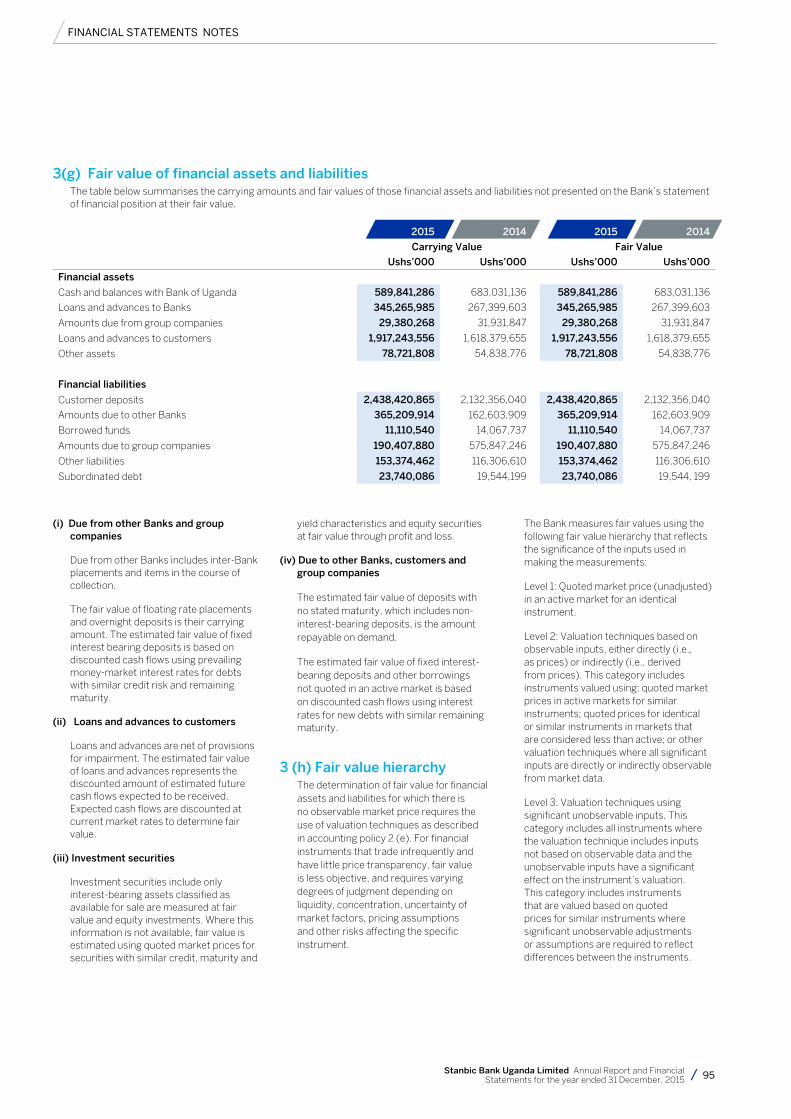
FINANCIAL STATEMENTS NOTES
95Stanbic Bank Uganda Limited Annual Report and Financial Statements for the year ended 31 December, 2015
3(g) Fair value of financial assets and liabilities The table below summarises the carrying amounts and fair values of those financial assets and liabilities not presented on the Bank’s statement
of financial position at their fair value.
2015 2014 2015 2014
Carrying Value Fair Value
Ushs’000 Ushs’000 Ushs’000 Ushs’000
Financial assets
Cash and balances with Bank of Uganda 589,841,286 683,031,136 589,841,286 683,031,136
Loans and advances to Banks 345,265,985 267,399,603 345,265,985 267,399,603
Amounts due from group companies 29,380,268 31,931,847 29,380,268 31,931,847
Loans and advances to customers 1,917,243,556 1,618,379,655 1,917,243,556 1,618,379,655
Other assets 78,721,808 54,838,776 78,721,808 54,838,776
Financial liabilities
Customer deposits 2,438,420,865 2,132,356,040 2,438,420,865 2,132,356,040
Amounts due to other Banks 365,209,914 162,603,909 365,209,914 162,603,909
Borrowed funds 11,110,540 14,067,737 11,110,540 14,067,737
Amounts due to group companies 190,407,880 575,847,246 190,407,880 575,847,246
Other liabilities 153,374,462 116,306,610 153,374,462 116,306,610
Subordinated debt 23,740,086 19,544,199 23,740,086 19,544, 199
(i) Due from other Banks and group companies
Due from other Banks includes inter-Bank placements and items in the course of collection.
The fair value of floating rate placements and overnight deposits is their carrying amount. The estimated fair value of fixed interest bearing deposits is based on discounted cash flows using prevailing money-market interest rates for debts with similar credit risk and remaining maturity.
(ii) Loans and advances to customers
Loans and advances are net of provisions for impairment. The estimated fair value of loans and advances represents the discounted amount of estimated future cash flows expected to be received. Expected cash flows are discounted at current market rates to determine fair value.
(iii) Investment securities
Investment securities include only interest-bearing assets classified as available for sale are measured at fair value and equity investments. Where this information is not available, fair value is estimated using quoted market prices for securities with similar credit, maturity and
yield characteristics and equity securities at fair value through profit and loss.
(iv) Due to other Banks, customers and group companies
The estimated fair value of deposits with no stated maturity, which includes non-interest-bearing deposits, is the amount repayable on demand.
The estimated fair value of fixed interest-bearing deposits and other borrowings not quoted in an active market is based on discounted cash flows using interest rates for new debts with similar remaining maturity.
3 (h) Fair value hierarchy The determination of fair value for financial
assets and liabilities for which there is no observable market price requires the use of valuation techniques as described in accounting policy 2 (e). For financial instruments that trade infrequently and have little price transparency, fair value is less objective, and requires varying degrees of judgment depending on liquidity, concentration, uncertainty of market factors, pricing assumptions and other risks affecting the specific instrument.
The Bank measures fair values using the following fair value hierarchy that reflects the significance of the inputs used in making the measurements:
Level 1: Quoted market price (unadjusted) in an active market for an identical instrument.
Level 2: Valuation techniques based on observable inputs, either directly (i.e., as prices) or indirectly (i.e., derived from prices). This category includes instruments valued using: quoted market prices in active markets for similar instruments; quoted prices for identical or similar instruments in markets that are considered less than active; or other valuation techniques where all significant inputs are directly or indirectly observable from market data.
Level 3: Valuation techniques using significant unobservable inputs. This category includes all instruments where the valuation technique includes inputs not based on observable data and the unobservable inputs have a significant effect on the instrument’s valuation. This category includes instruments that are valued based on quoted prices for similar instruments where significant unobservable adjustments or assumptions are required to reflect differences between the instruments.
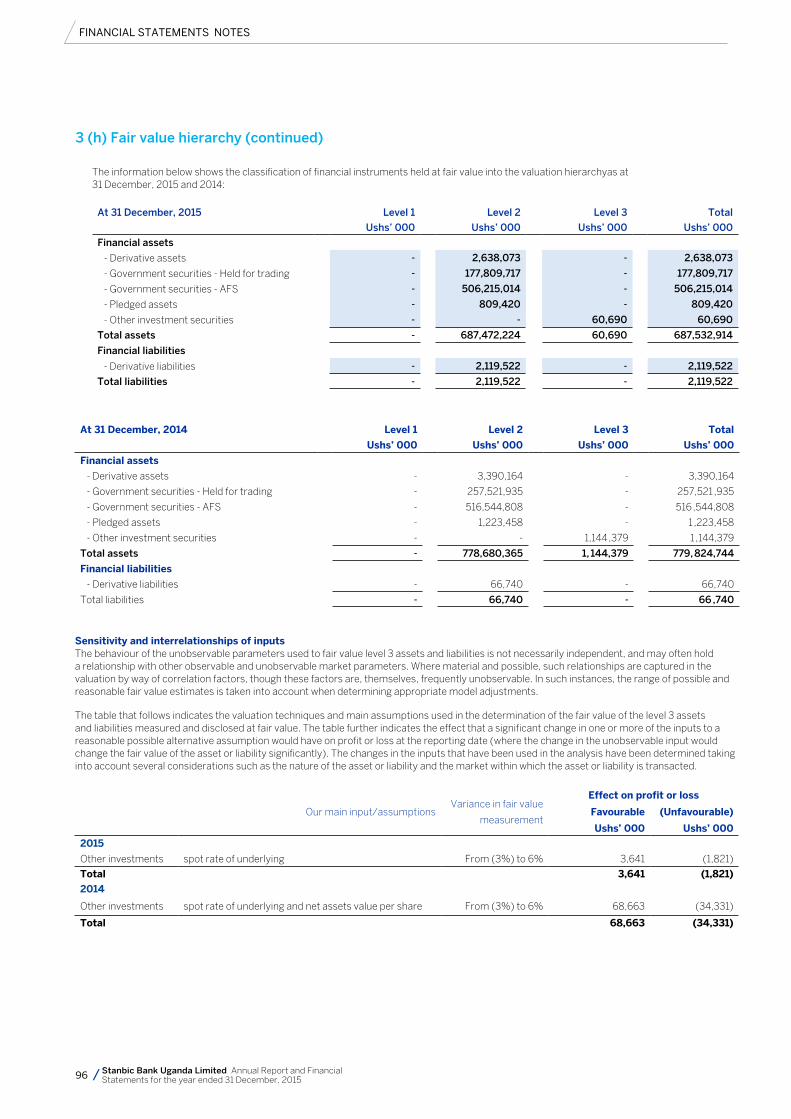
FINANCIAL STATEMENTS NOTES
96 Stanbic Bank Uganda Limited Annual Report and Financial Statements for the year ended 31 December, 2015
The information below shows the classification of financial instruments held at fair value into the valuation hierarchyas at 31 December, 2015 and 2014:
At 31 December, 2015 Level 1 Level 2 Level 3 Total
Ushs’ 000 Ushs’ 000 Ushs’ 000 Ushs’ 000
Financial assets
- Derivative assets - 2,638,073 - 2,638,073
- Government securities - Held for trading - 177,809,717 - 177,809,717
- Government securities - AFS - 506,215,014 - 506,215,014
- Pledged assets - 809,420 - 809,420
- Other investment securities - - 60,690 60,690
Total assets - 687,472,224 60,690 687,532,914
Financial liabilities
- Derivative liabilities - 2,119,522 - 2,119,522
Total liabilities - 2,119,522 - 2,119,522
At 31 December, 2014 Level 1 Level 2 Level 3 Total
Ushs’ 000 Ushs’ 000 Ushs’ 000 Ushs’ 000
Financial assets
- Derivative assets - 3,390,164 - 3,390,164
- Government securities - Held for trading - 257,521,935 - 257,521 ,935
- Government securities - AFS - 516,544,808 - 516 ,544,808
- Pledged assets - 1,223,458 - 1 ,223,458
- Other investment securities - - 1,144 ,379 1 ,144,379
Total assets - 778,680,365 1, 144,379 779, 824,744
Financial liabilities
- Derivative liabilities - 66,740 - 66,740
Total liabilities - 66,740 - 66 ,740
Sensitivity and interrelationships of inputsThe behaviour of the unobservable parameters used to fair value level 3 assets and liabilities is not necessarily independent, and may often hold a relationship with other observable and unobservable market parameters. Where material and possible, such relationships are captured in the valuation by way of correlation factors, though these factors are, themselves, frequently unobservable. In such instances, the range of possible and reasonable fair value estimates is taken into account when determining appropriate model adjustments.
The table that follows indicates the valuation techniques and main assumptions used in the determination of the fair value of the level 3 assets and liabilities measured and disclosed at fair value. The table further indicates the effect that a significant change in one or more of the inputs to a reasonable possible alternative assumption would have on profit or loss at the reporting date (where the change in the unobservable input would change the fair value of the asset or liability significantly). The changes in the inputs that have been used in the analysis have been determined taking into account several considerations such as the nature of the asset or liability and the market within which the asset or liability is transacted.
Our main input/assumptionsVariance in fair value
measurement
Effect on profit or loss
Favourable (Unfavourable)
Ushs’ 000 Ushs’ 000
2015
Other investments spot rate of underlying From (3%) to 6% 3,641 (1,821)
Total 3,641 (1,821)
2014
Other investments spot rate of underlying and net assets value per share From (3%) to 6% 68,663 (34,331)
Total 68,663 (34,331)
3 (h) Fair value hierarchy (continued)
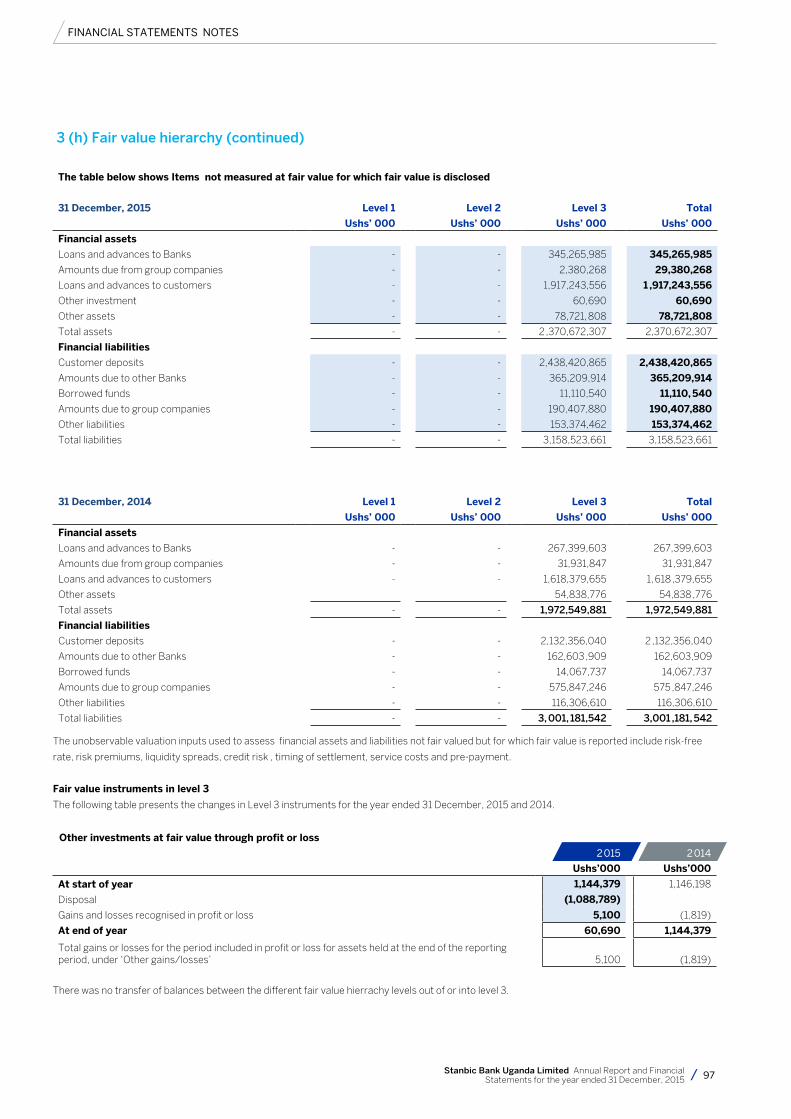
FINANCIAL STATEMENTS NOTES
97Stanbic Bank Uganda Limited Annual Report and Financial Statements for the year ended 31 December, 2015
3 (h) Fair value hierarchy (continued)
The table below shows Items not measured at fair value for which fair value is disclosed
31 December, 2015 Level 1 Level 2 Level 3 Total
Ushs’ 000 Ushs’ 000 Ushs’ 000 Ushs’ 000
Financial assets
Loans and advances to Banks - - 345,265,985 345,265,985
Amounts due from group companies - - 2,380,268 29,380,268
Loans and advances to customers - - 1,917,243,556 1 ,917,243,556
Other investment - - 60,690 60,690
Other assets - - 78,721, 808 78,721,808
Total assets - - 2 ,370,672,307 2,370,672,307
Financial liabilities
Customer deposits - - 2,438,420,865 2,438,420,865
Amounts due to other Banks - - 365,209,914 365,209,914
Borrowed funds - - 11,110,540 11,110, 540
Amounts due to group companies - - 190,407,880 190,407,880
Other liabilities - - 153,374,462 153,374,462
Total liabilities - - 3,158,523,661 3,158,523,661
31 December, 2014 Level 1 Level 2 Level 3 Total
Ushs’ 000 Ushs’ 000 Ushs’ 000 Ushs’ 000
Financial assets
Loans and advances to Banks - - 267,399,603 267,399,603
Amounts due from group companies - - 31,931,847 31 ,931,847
Loans and advances to customers - - 1,618,379,655 1, 618 ,379,655
Other assets 54,838,776 54,838 ,776
Total assets - - 1,972,549,881 1,972,549,881
Financial liabilities
Customer deposits - - 2,132,356,040 2 ,132,356,040
Amounts due to other Banks - - 162,603 ,909 162,603,909
Borrowed funds - - 14,067,737 14,067,737
Amounts due to group companies - - 575,847,246 575 ,847,246
Other liabilities - - 116,306,610 116,306,610
Total liabilities - - 3, 001, 181,542 3,001 ,181, 542
The unobservable valuation inputs used to assess financial assets and liabilities not fair valued but for which fair value is reported include risk-free
rate, risk premiums, liquidity spreads, credit risk , timing of settlement, service costs and pre-payment.
Fair value instruments in level 3
The following table presents the changes in Level 3 instruments for the year ended 31 December, 2015 and 2014.
Other investments at fair value through profit or loss
2 015 2 014
Ushs’000 Ushs’000
At start of year 1,144,379 1,146,198
Disposal (1,088,789)
Gains and losses recognised in profit or loss 5,100 (1,819)
At end of year 60,690 1,144,379
Total gains or losses for the period included in profit or loss for assets held at the end of the reporting period, under ‘Other gains/losses’ 5,100 (1,819)
There was no transfer of balances between the different fair value hierrachy levels out of or into level 3.
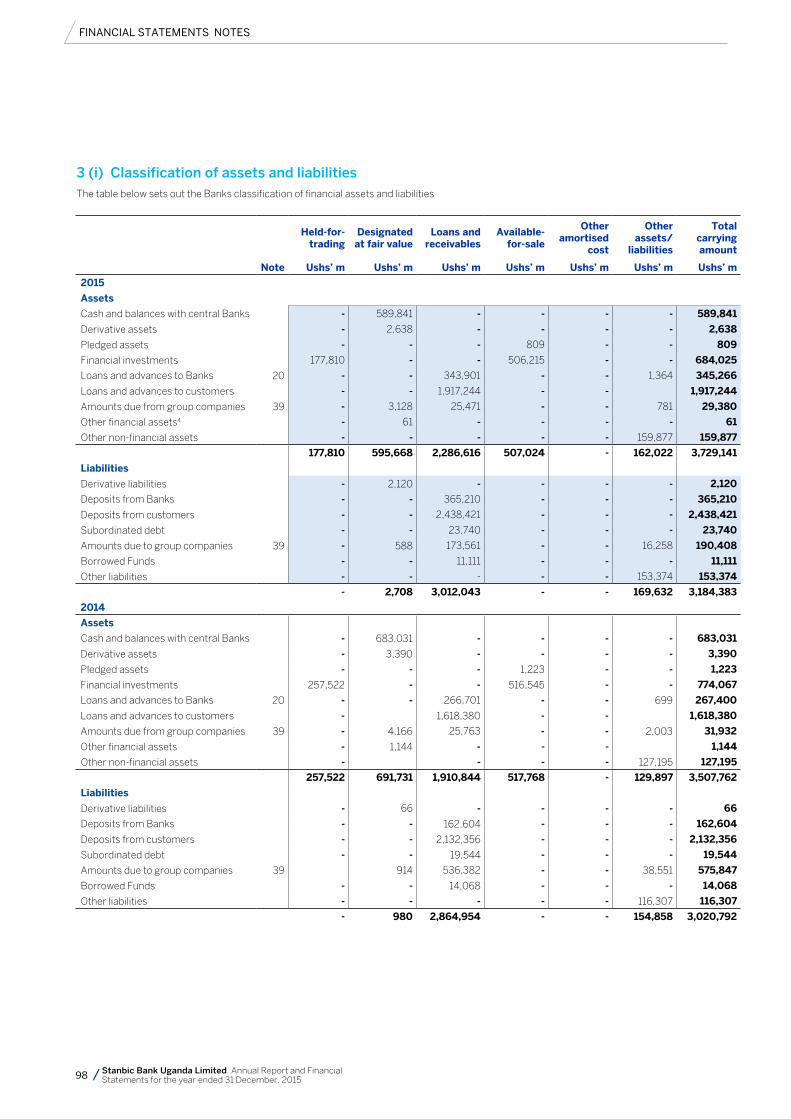
FINANCIAL STATEMENTS NOTES
98 Stanbic Bank Uganda Limited Annual Report and Financial Statements for the year ended 31 December, 2015
Held-for-
tradingDesignated at fair value
Loans and receivables
Available-for-sale
Other amortised
cost
Other assets/
liabilities
Total carrying amount
Note Ushs’ m Ushs’ m Ushs’ m Ushs’ m Ushs’ m Ushs’ m Ushs’ m
2015
Assets
Cash and balances with central Banks - 589,841 - - - - 589,841
Derivative assets - 2,638 - - - - 2,638
Pledged assets - - - 809 - - 809
Financial investments 177,810 - - 506,215 - - 684,025
Loans and advances to Banks 20 - - 343,901 - - 1,364 345,266
Loans and advances to customers - - 1,917,244 - - 1,917,244
Amounts due from group companies 39 - 3,128 25,471 - - 781 29,380
Other financial assets4 - 61 - - - - 61
Other non-financial assets - - - - - 159,877 159,877
177,810 595,668 2,286,616 507,024 - 162,022 3,729,141
Liabilities
Derivative liabilities - 2,120 - - - - 2,120
Deposits from Banks - - 365,210 - - - 365,210
Deposits from customers - - 2,438,421 - - - 2,438,421
Subordinated debt - - 23,740 - - - 23,740
Amounts due to group companies 39 - 588 173,561 - - 16,258 190,408
Borrowed Funds - - 11,111 - - - 11,111
Other liabilities - - - - - 153,374 153,374
- 2,708 3,012,043 - - 169,632 3,184,383
2014
Assets
Cash and balances with central Banks - 683,031 - - - - 683,031
Derivative assets - 3,390 - - - - 3,390
Pledged assets - - - 1,223 - - 1,223
Financial investments 257,522 - - 516,545 - - 774,067
Loans and advances to Banks 20 - - 266,701 - - 699 267,400
Loans and advances to customers - 1,618,380 - - 1,618,380
Amounts due from group companies 39 - 4,166 25,763 - - 2,003 31,932
Other financial assets - 1,144 - - - 1,144
Other non-financial assets - - - - 127,195 127,195
257,522 691,731 1,910,844 517,768 - 129,897 3,507,762
Liabilities
Derivative liabilities - 66 - - - - 66
Deposits from Banks - - 162,604 - - - 162,604
Deposits from customers - - 2,132,356 - - - 2,132,356
Subordinated debt - - 19,544 - - - 19,544
Amounts due to group companies 39 914 536,382 - - 38,551 575,847
Borrowed Funds - - 14,068 - - - 14,068
Other liabilities - - - - - 116,307 116,307
- 980 2,864,954 - - 154,858 3,020,792
3 (i) Classification of assets and liabilitiesThe table below sets out the Banks classification of financial assets and liabilities
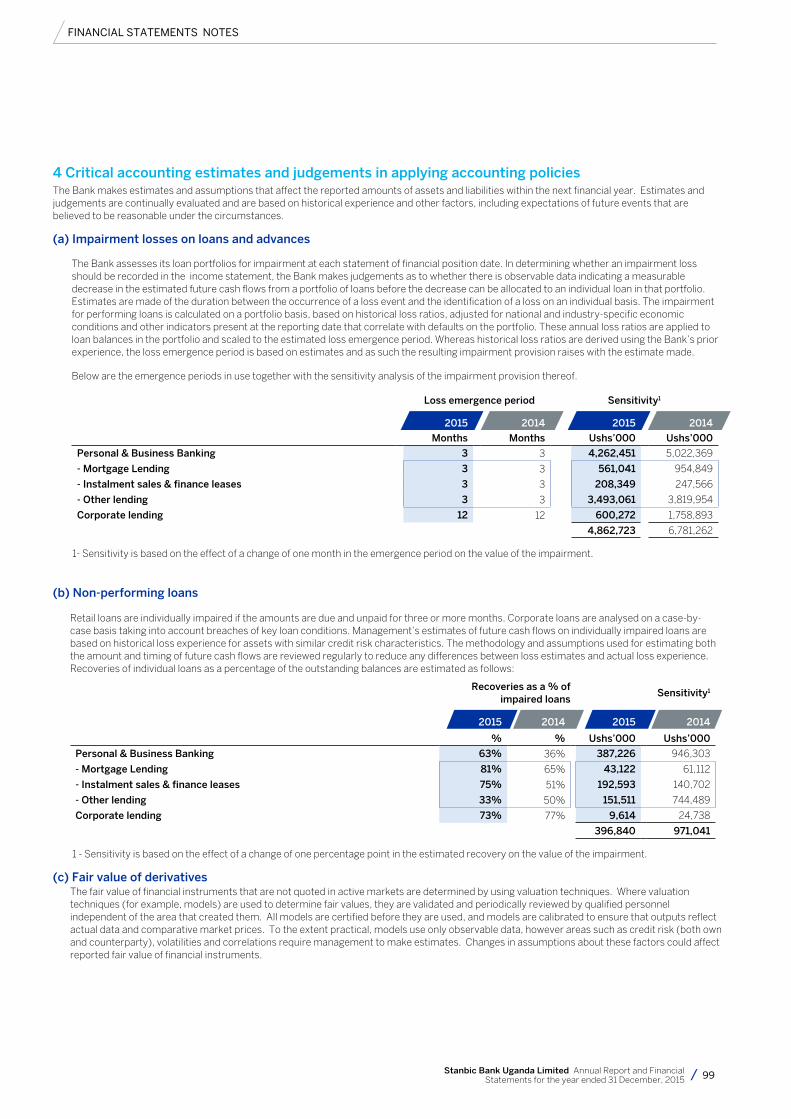
FINANCIAL STATEMENTS NOTES
99Stanbic Bank Uganda Limited Annual Report and Financial Statements for the year ended 31 December, 2015
4 Critical accounting estimates and judgements in applying accounting policies The Bank makes estimates and assumptions that affect the reported amounts of assets and liabilities within the next financial year. Estimates and judgements are continually evaluated and are based on historical experience and other factors, including expectations of future events that are believed to be reasonable under the circumstances.
(a) Impairment losses on loans and advances
The Bank assesses its loan portfolios for impairment at each statement of financial position date. In determining whether an impairment loss should be recorded in the income statement, the Bank makes judgements as to whether there is observable data indicating a measurable decrease in the estimated future cash flows from a portfolio of loans before the decrease can be allocated to an individual loan in that portfolio. Estimates are made of the duration between the occurrence of a loss event and the identification of a loss on an individual basis. The impairment for performing loans is calculated on a portfolio basis, based on historical loss ratios, adjusted for national and industry-specific economic conditions and other indicators present at the reporting date that correlate with defaults on the portfolio. These annual loss ratios are applied to loan balances in the portfolio and scaled to the estimated loss emergence period. Whereas historical loss ratios are derived using the Bank’s prior experience, the loss emergence period is based on estimates and as such the resulting impairment provision raises with the estimate made.
Below are the emergence periods in use together with the sensitivity analysis of the impairment provision thereof.
Loss emergence period Sensitivity1
2015 2014 2015 2014
Months Months Ushs’000 Ushs’000
Personal & Business Banking 3 3 4,262,451 5,022,369
- Mortgage Lending 3 3 561,041 954,849
- Instalment sales & finance leases 3 3 208,349 247,566
- Other lending 3 3 3,493,061 3,819,954
Corporate lending 12 12 600,272 1,758,893
4,862,723 6,781,262
1- Sensitivity is based on the effect of a change of one month in the emergence period on the value of the impairment.
(b) Non-performing loans
Retail loans are individually impaired if the amounts are due and unpaid for three or more months. Corporate loans are analysed on a case-by-case basis taking into account breaches of key loan conditions. Management’s estimates of future cash flows on individually impaired loans are based on historical loss experience for assets with similar credit risk characteristics. The methodology and assumptions used for estimating both the amount and timing of future cash flows are reviewed regularly to reduce any differences between loss estimates and actual loss experience. Recoveries of individual loans as a percentage of the outstanding balances are estimated as follows:
Recoveries as a % of
impaired loansSensitivity1
2015
%
2014
%
2015
Ushs’000
2014
Ushs’000
Personal & Business Banking 63% 36% 387,226 946,303
- Mortgage Lending 81% 65% 43,122 61,112
- Instalment sales & finance leases 75% 51% 192,593 140,702
- Other lending 33% 50% 151,511 744,489
Corporate lending 73% 77% 9,614 24,738
396,840 971,041
1 - Sensitivity is based on the effect of a change of one percentage point in the estimated recovery on the value of the impairment.
(c) Fair value of derivatives The fair value of financial instruments that are not quoted in active markets are determined by using valuation techniques. Where valuation
techniques (for example, models) are used to determine fair values, they are validated and periodically reviewed by qualified personnel independent of the area that created them. All models are certified before they are used, and models are calibrated to ensure that outputs reflect actual data and comparative market prices. To the extent practical, models use only observable data, however areas such as credit risk (both own and counterparty), volatilities and correlations require management to make estimates. Changes in assumptions about these factors could affect reported fair value of financial instruments.
FINANCIAL STATEMENTS NOTES
100 Stanbic Bank Uganda Limited Annual Report and Financial Statements for the year ended 31 December, 2015
(d) Impairment of available for-sale equity investments
The Bank determines that available-for-sale equity investments are impaired when there has been a significant or prolonged decline in the fair value below its cost. This determination of what is significant or prolonged requires judgement. In making this judgement, the Bank evaluates among other factors, the normal volatility in price. In addition, impairment may be appropriate when there is evidence of deterioration in the financial health of the investee, industry and sector performance, changes in technology, and operational and financing cash flows.
Had the declines of financial instruments with fair values below cost been considered significant or prolonged, the Bank would suffer an additional loss after tax of Ushs 15,939 million (2014: Ushs 7,109 million) in its financial statements, being the transfer of the negative revaluations within available-for-sale reserve to the income statement.
5 Segment information
The principal business units in the Bank are as follows:
Personal and Business Banking (PBB): Banking and other financial services to individual customers and small to medium sized enterprises throughout Uganda.
PBB incorporates• Mortgagelending-providesresidentialaccommodationloanstoindividualcustomers.
Instalment sales and finance leases: comprises two main areas - instalment finance in the consumer market mainly vehicles and secondly, finance of vehicles and equipment in the business market.
• Transactionalandlendingproducts-TransactionsinproductsassociatedwiththevariouspointsofcontactchannelssuchasATMs,internet,and branches. This includes deposit taking activities, electronic Banking, cheque accounts and other lending products.
Corporate and Investment Banking (CIB): Commercial and Investment Banking services to larger corporates, financial institutions, and international counterparties in Uganda.
CIB incorporates • Globalmarkets-includesforeignexchange,fixedincome,derivatives,andmoneymarketfundingunits.
• InvestmentBankingandtradefinance-includescorporatelendingandtransactionalBankingbusinesses,tradefinancebusinessandpropertyrelated lending to corporates.
Treasury and Capital Management (TCM): Oversees the management of liquidity, interest rate risk and surplus capital for the Bank.
4 Critical accounting estimates and judgements in applying accounting policies (continued)
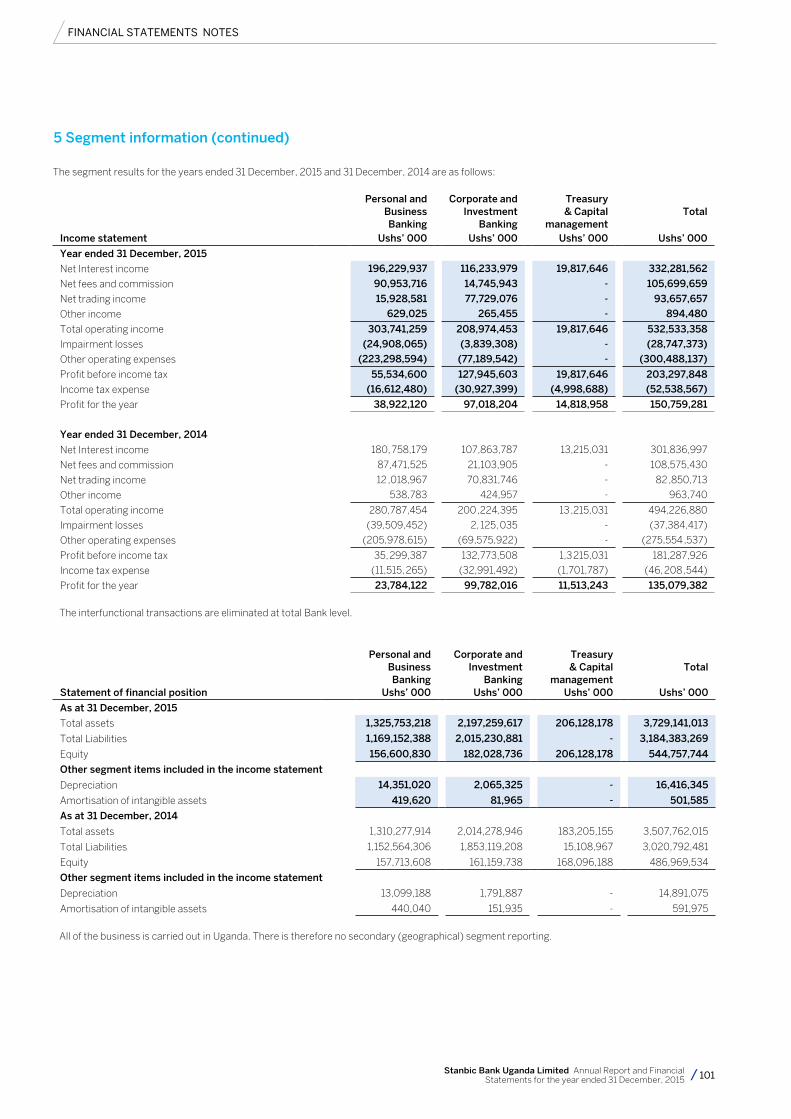
FINANCIAL STATEMENTS NOTES
101Stanbic Bank Uganda Limited Annual Report and Financial Statements for the year ended 31 December, 2015
The segment results for the years ended 31 December, 2015 and 31 December, 2014 are as follows:
Personal and
Business Banking
Corporate and
Investment Banking
Treasury & Capital
management Total
Income statement Ushs’ 000 Ushs’ 000 Ushs’ 000 Ushs’ 000
Year ended 31 December, 2015
Net Interest income 196,229,937 116,233,979 19,817,646 332,281,562
Net fees and commission 90,953,716 14,745,943 - 105,699,659
Net trading income 15,928,581 77,729,076 - 93,657,657
Other income 629,025 265,455 - 894,480
Total operating income 303,741,259 208,974,453 19,817,646 532,533,358
Impairment losses (24,908,065) (3,839,308) - (28,747,373)
Other operating expenses (223,298,594) (77,189,542) - (300,488,137)
Profit before income tax 55,534,600 127,945,603 19,817,646 203,297,848
Income tax expense (16,612,480) (30,927,399) (4,998,688) (52,538,567)
Profit for the year 38,922,120 97,018,204 14,818,958 150,759,281
Year ended 31 December, 2014
Net Interest income 180, 758,179 107,863,787 13,215,031 301,836,997
Net fees and commission 87,471,525 21,103,905 - 108,575,430
Net trading income 12 ,018,967 70,831,746 - 82 ,850,713
Other income 538,783 424,957 - 963,740
Total operating income 280,787,454 200 ,224,395 13 ,215,031 494,226,880
Impairment losses (39,509,452) 2, 125, 035 - (37,384,417)
Other operating expenses (205,978,615) (69,575,922) - (275,554 ,537)
Profit before income tax 35, 299,387 132,773,508 1,3 215,031 181,287,926
Income tax expense (11,515, 265) (32,991,492) (1,701,787) (46, 208 ,544)
Profit for the year 23,784,122 99,782,016 11,513,243 135,079,382
The interfunctional transactions are eliminated at total Bank level.
Personal and
Business Banking
Corporate and
Investment Banking
Treasury & Capital
management Total
Statement of financial position Ushs’ 000 Ushs’ 000 Ushs’ 000 Ushs’ 000
As at 31 December, 2015
Total assets 1,325,753,218 2,197,259,617 206,128,178 3,729,141,013
Total Liabilities 1,169,152,388 2,015,230,881 - 3,184,383,269
Equity 156,600,830 182,028,736 206,128,178 544,757,744
Other segment items included in the income statement
Depreciation 14,351,020 2,065,325 - 16,416,345
Amortisation of intangible assets 419,620 81,965 - 501,585
As at 31 December, 2014
Total assets 1,310,277,914 2,014,278,946 183,205,155 3,507,762,015
Total Liabilities 1,152,564,306 1,853,119,208 15,108,967 3,020,792,481
Equity 157,713,608 161,159,738 168,096,188 486,969,534
Other segment items included in the income statement
Depreciation 13,099,188 1,791,887 - 14,891,075
Amortisation of intangible assets 440,040 151,935 - 591,975
All of the business is carried out in Uganda. There is therefore no secondary (geographical) segment reporting.
5 Segment information (continued)
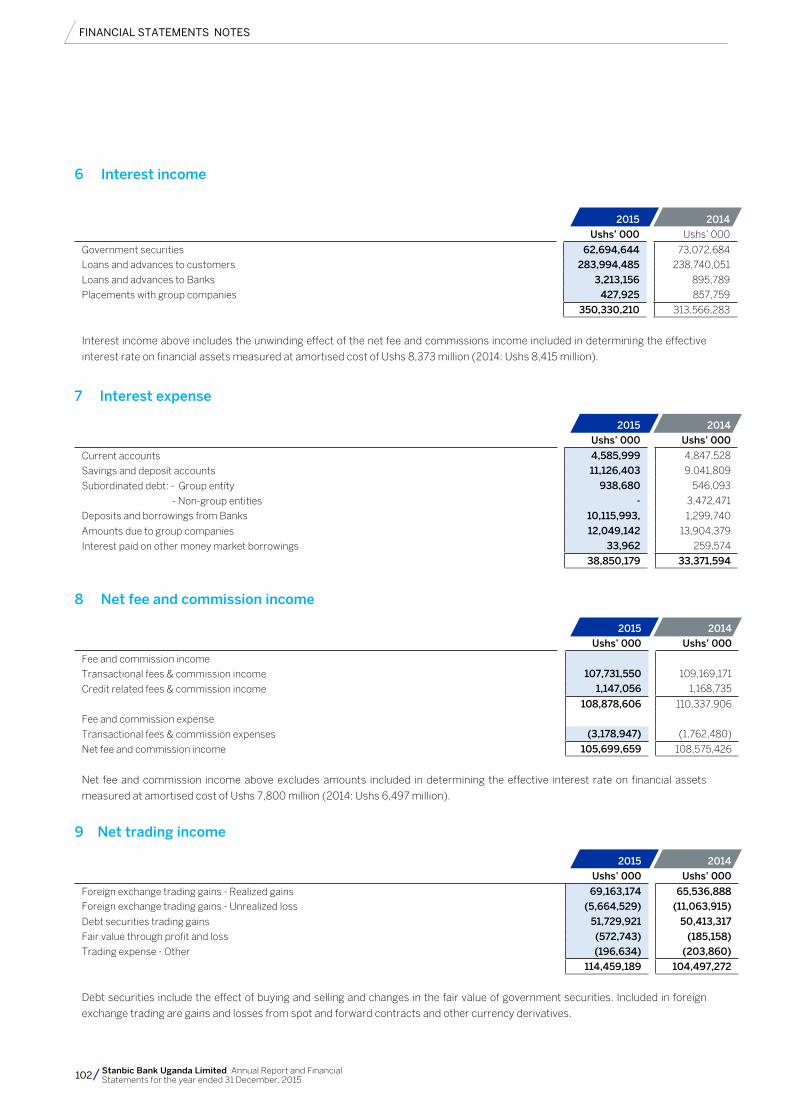
FINANCIAL STATEMENTS NOTES
102 Stanbic Bank Uganda Limited Annual Report and Financial Statements for the year ended 31 December, 2015
6 Interest income
2015 2014
Ushs’ 000 Ushs’ 000
Government securities 62,694,644 73,072,684
Loans and advances to customers 283,994,485 238,740,051
Loans and advances to Banks 3,213,156 895,789
Placements with group companies 427,925 857,759
350,330,210 313,566,283
Interest income above includes the unwinding effect of the net fee and commissions income included in determining the effective
interest rate on financial assets measured at amortised cost of Ushs 8,373 million (2014: Ushs 8,415 million).
7 Interest expense
2015 2014
Ushs’ 000 Ushs’ 000
Current accounts 4,585,999 4,847,528
Savings and deposit accounts 11,126,403 9,041,809
Subordinated debt: - Group entity 938,680 546,093
- Non-group entities - 3,472,471
Deposits and borrowings from Banks 10,115,993, 1,299,740
Amounts due to group companies 12,049,142 13,904,379
Interest paid on other money market borrowings 33,962 259,574
38,850,179 33,371,594
8 Net fee and commission income
2015 2014
Ushs’ 000 Ushs’ 000
Fee and commission income
Transactional fees & commission income 107,731,550 109,169,171
Credit related fees & commission income 1,147,056 1,168,735
108,878,606 110,337,906
Fee and commission expense
Transactional fees & commission expenses (3,178,947) (1,762,480)
Net fee and commission income 105,699,659 108,575,426
Net fee and commission income above excludes amounts included in determining the effective interest rate on financial assets
measured at amortised cost of Ushs 7,800 million (2014: Ushs 6,497 million).
9 Net trading income
2015 2014
Ushs’ 000 Ushs’ 000
Foreign exchange trading gains - Realized gains 69,163,174 65,536,888
Foreign exchange trading gains - Unrealized loss (5,664,529) (11,063,915)
Debt securities trading gains 51,729,921 50,413,317
Fair value through profit and loss (572,743) (185,158)
Trading expense - Other (196,634) (203,860)
114,459,189 104,497,272
Debt securities include the effect of buying and selling and changes in the fair value of government securities. Included in foreign
exchange trading are gains and losses from spot and forward contracts and other currency derivatives.
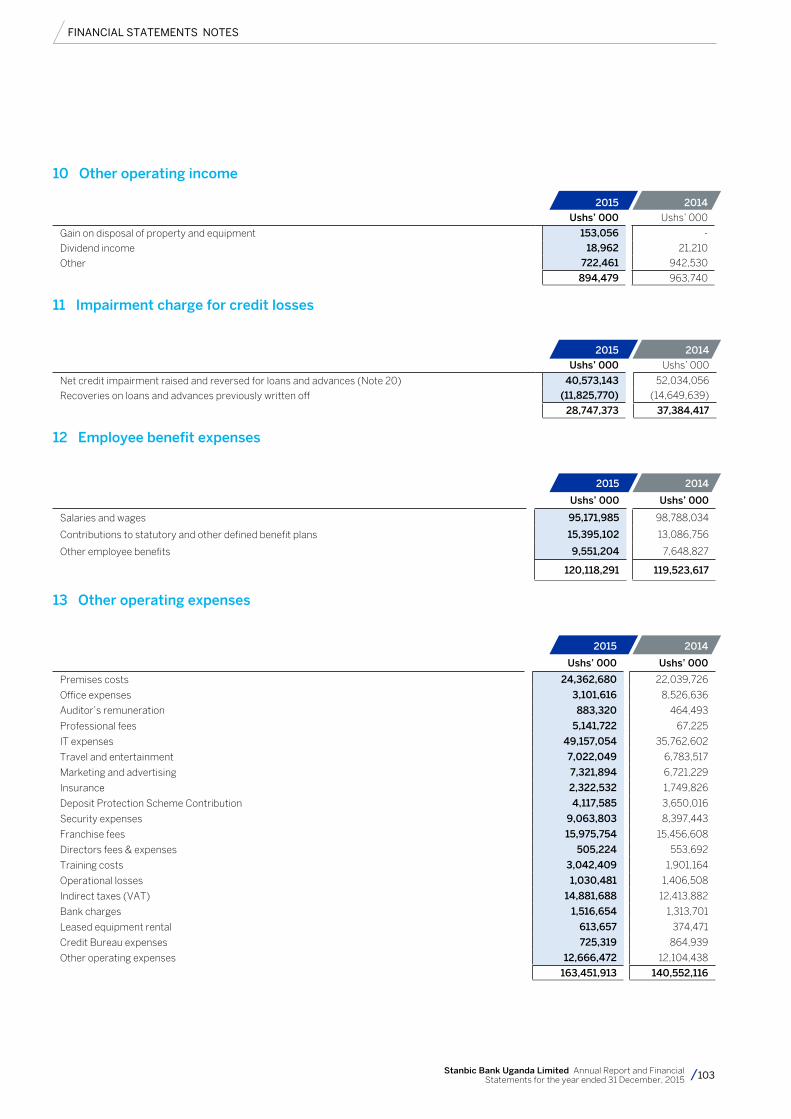
FINANCIAL STATEMENTS NOTES
103Stanbic Bank Uganda Limited Annual Report and Financial Statements for the year ended 31 December, 2015
10 Other operating income
2015 2014
Ushs’ 000 Ushs’ 000
Gain on disposal of property and equipment 153,056 -
Dividend income 18,962 21,210
Other 722,461 942,530
894,479 963,740
11 Impairment charge for credit losses
2015 2014
Ushs’ 000 Ushs’ 000
Net credit impairment raised and reversed for loans and advances (Note 20) 40,573,143 52,034,056
Recoveries on loans and advances previously written off (11,825,770) (14,649,639)
28,747,373 37,384,417
12 Employee benefit expenses
2015 2014
Ushs’ 000 Ushs’ 000
Salaries and wages 95,171,985 98,788,034
Contributions to statutory and other defined benefit plans 15,395,102 13,086,756
Other employee benefits 9,551,204 7,648,827
120,118,291 119,523,617
13 Other operating expenses
2015 2014
Ushs’ 000 Ushs’ 000
Premises costs 24,362,680 22,039,726
Office expenses 3,101,616 8,526,636
Auditor’s remuneration 883,320 464,493
Professional fees 5,141,722 67,225
IT expenses 49,157,054 35,762,602
Travel and entertainment 7,022,049 6,783,517
Marketing and advertising 7,321,894 6,721,229
Insurance 2,322,532 1,749,826
Deposit Protection Scheme Contribution 4,117,585 3,650,016
Security expenses 9,063,803 8,397,443
Franchise fees 15,975,754 15,456,608
Directors fees & expenses 505,224 553,692
Training costs 3,042,409 1,901,164
Operational losses 1,030,481 1,406,508
Indirect taxes (VAT) 14,881,688 12,413,882
Bank charges 1,516,654 1,313,701
Leased equipment rental 613,657 374,471
Credit Bureau expenses 725,319 864,939
Other operating expenses 12,666,472 12,104,438
163,451,913 140,552,116
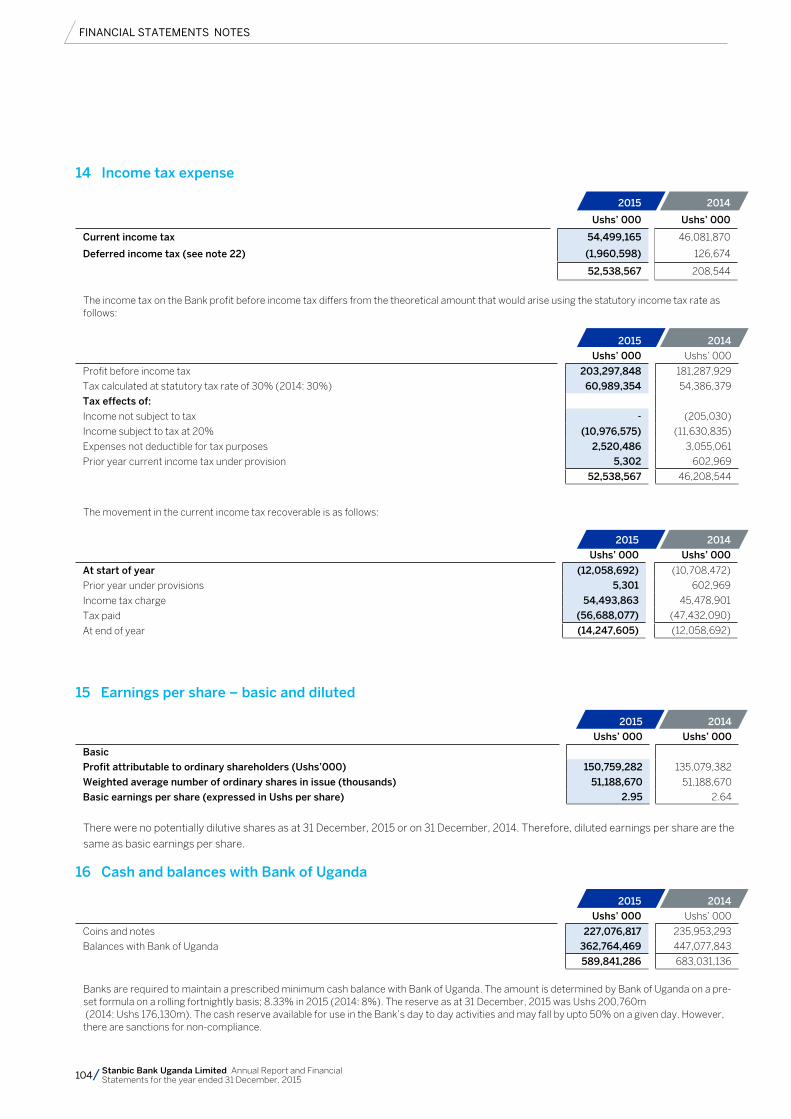
FINANCIAL STATEMENTS NOTES
104 Stanbic Bank Uganda Limited Annual Report and Financial Statements for the year ended 31 December, 2015
14 Income tax expense
2015 2014
Ushs’ 000 Ushs’ 000
Current income tax 54,499,165 46,081,870
Deferred income tax (see note 22) (1,960,598) 126,674
52,538,567 208,544
The income tax on the Bank profit before income tax differs from the theoretical amount that would arise using the statutory income tax rate as follows:
2015 2014
Ushs’ 000 Ushs’ 000
Profit before income tax 203,297,848 181,287,929
Tax calculated at statutory tax rate of 30% (2014: 30%) 60,989,354 54,386,379
Tax effects of:
Income not subject to tax - (205,030)
Income subject to tax at 20% (10,976,575) (11,630,835)
Expenses not deductible for tax purposes 2,520,486 3,055,061
Prior year current income tax under provision 5,302 602,969
52,538,567 46,208,544
The movement in the current income tax recoverable is as follows:
2015 2014
Ushs’ 000 Ushs’ 000
At start of year (12,058,692) (10,708,472)
Prior year under provisions 5,301 602,969
Income tax charge 54,493,863 45,478,901
Tax paid (56,688,077) (47,432,090)
At end of year (14,247,605) (12,058,692)
15 Earnings per share – basic and diluted
2015 2014
Ushs’ 000 Ushs’ 000
Basic
Profit attributable to ordinary shareholders (Ushs’000) 150,759,282 135,079,382
Weighted average number of ordinary shares in issue (thousands) 51,188,670 51,188,670
Basic earnings per share (expressed in Ushs per share) 2.95 2.64
There were no potentially dilutive shares as at 31 December, 2015 or on 31 December, 2014. Therefore, diluted earnings per share are the
same as basic earnings per share.
16 Cash and balances with Bank of Uganda
2015 2014
Ushs’ 000 Ushs’ 000
Coins and notes 227,076,817 235,953,293
Balances with Bank of Uganda 362,764,469 447,077,843
589,841,286 683,031,136
Banks are required to maintain a prescribed minimum cash balance with Bank of Uganda. The amount is determined by Bank of Uganda on a pre-set formula on a rolling fortnightly basis; 8.33% in 2015 (2014: 8%). The reserve as at 31 December, 2015 was Ushs 200,760m (2014: Ushs 176,130m). The cash reserve available for use in the Bank’s day to day activities and may fall by upto 50% on a given day. However, there are sanctions for non-compliance.
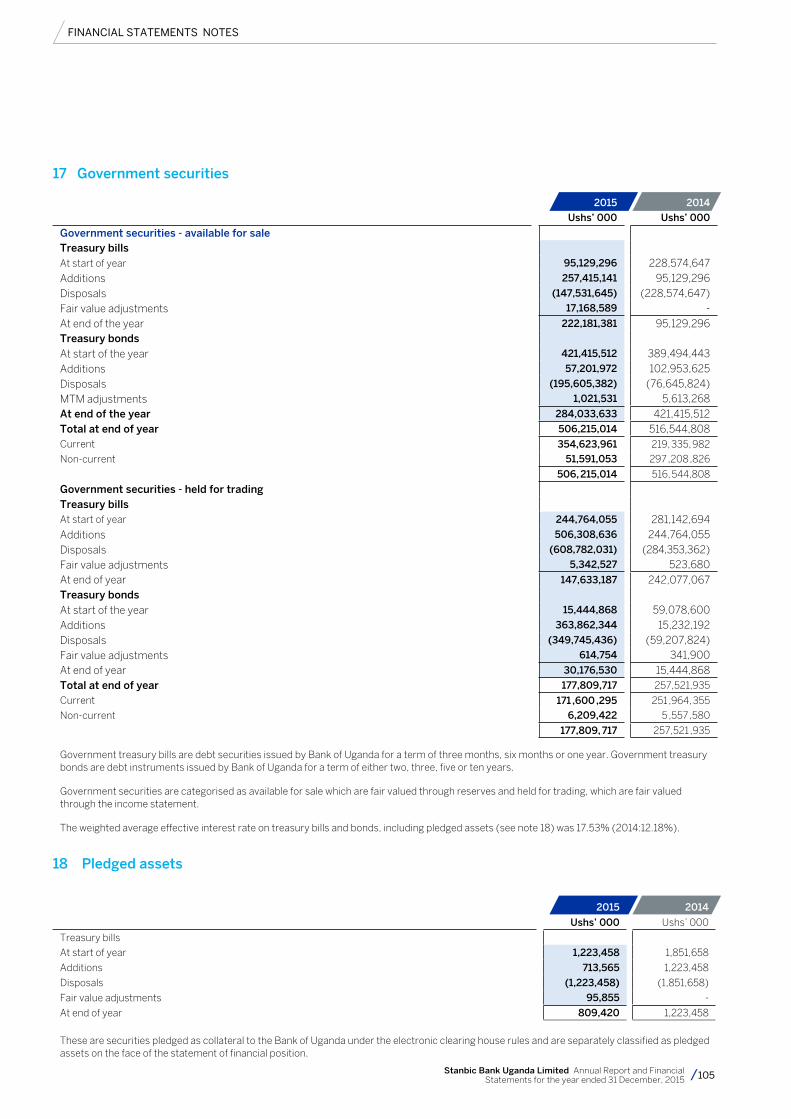
FINANCIAL STATEMENTS NOTES
105Stanbic Bank Uganda Limited Annual Report and Financial Statements for the year ended 31 December, 2015
17 Government securities
2015 2014
Ushs’ 000 Ushs’ 000
Government securities - available for sale Treasury billsAt start of year 95,129,296 228,574,647Additions 257,415,141 95,129,296Disposals (147,531,645) (228,574,647)Fair value adjustments 17,168,589 -
At end of the year 222,181,381 95,129,296Treasury bonds At start of the year 421,415,512 389,494,443Additions 57,201,972 102,953,625Disposals (195,605,382) (76,645,824)MTM adjustments 1,021,531 5,613,268At end of the year 284,033,633 421,415,512Total at end of year 506,215,014 516,544,808Current 354,623,961 219, 335, 982
Non-current 51,591,053 297 ,208 ,826
506, 215,014 516, 544,808
Government securities - held for tradingTreasury billsAt start of year 244,764,055 281,142,694Additions 506,308,636 244,764,055Disposals (608,782,031) (284,353,362)Fair value adjustments 5,342,527 523,680At end of year 147,633,187 242,077,067Treasury bonds At start of the year 15,444,868 59,078,600Additions 363,862,344 15,232,192Disposals (349,745,436) (59,207,824)Fair value adjustments 614,754 341,900At end of year 30,176,530 15,444,868Total at end of year 177,809,717 257,521,935
Current 171 ,600 ,295 251 ,964, 355
Non-current 6,209,422 5 ,557 ,580
177,809, 717 257,521 ,935
Government treasury bills are debt securities issued by Bank of Uganda for a term of three months, six months or one year. Government treasury bonds are debt instruments issued by Bank of Uganda for a term of either two, three, five or ten years.
Government securities are categorised as available for sale which are fair valued through reserves and held for trading, which are fair valued through the income statement.
The weighted average effective interest rate on treasury bills and bonds, including pledged assets (see note 18) was 17.53% (2014:12.18%).
18 Pledged assets
2015 2014
Ushs’ 000 Ushs’ 000
Treasury bills
At start of year 1,223,458 1,851,658
Additions 713,565 1,223,458
Disposals (1,223,458) (1,851,658)
Fair value adjustments 95,855 -
At end of year 809,420 1,223,458
These are securities pledged as collateral to the Bank of Uganda under the electronic clearing house rules and are separately classified as pledged assets on the face of the statement of financial position.
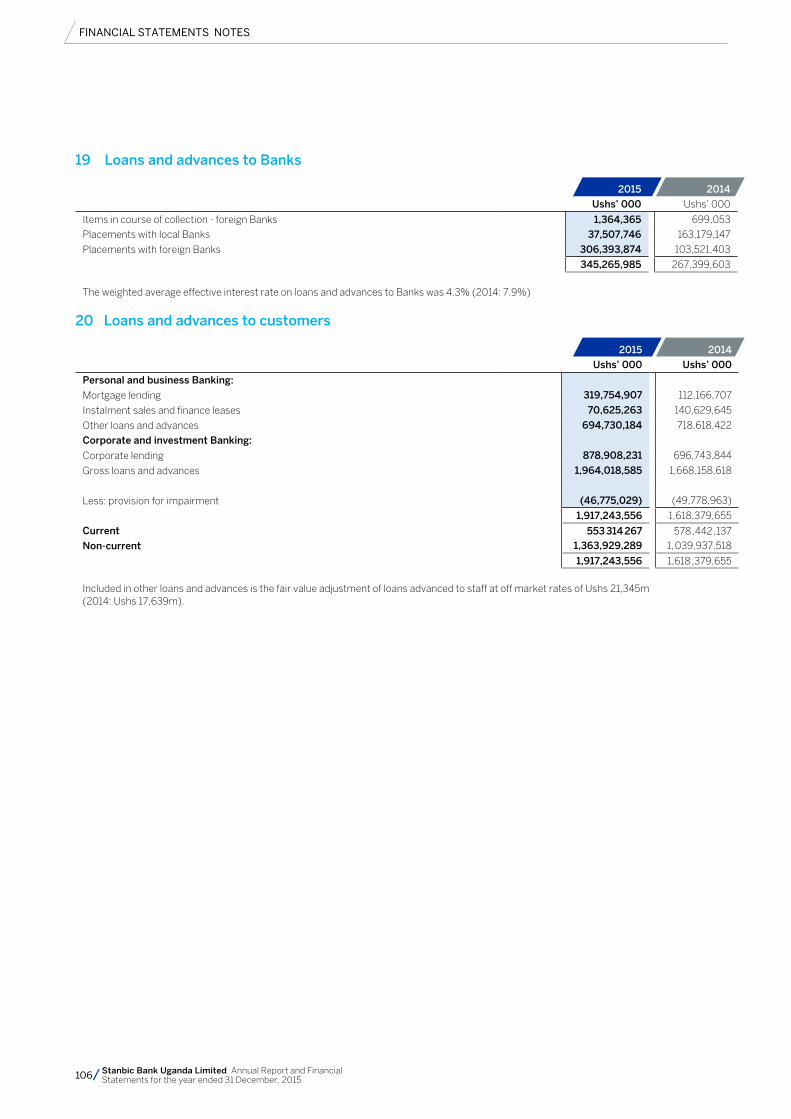
FINANCIAL STATEMENTS NOTES
106 Stanbic Bank Uganda Limited Annual Report and Financial Statements for the year ended 31 December, 2015
19 Loans and advances to Banks
2015 2014
Ushs’ 000 Ushs’ 000
Items in course of collection - foreign Banks 1,364,365 699,053
Placements with local Banks 37,507,746 163,179,147
Placements with foreign Banks 306,393,874 103,521,403
345,265,985 267,399,603
The weighted average effective interest rate on loans and advances to Banks was 4.3% (2014: 7.9%)
20 Loans and advances to customers
2015 2014
Ushs’ 000 Ushs’ 000
Personal and business Banking:
Mortgage lending 319,754,907 112,166,707
Instalment sales and finance leases 70,625,263 140,629,645
Other loans and advances 694,730,184 718,618,422
Corporate and investment Banking:
Corporate lending 878,908,231 696,743,844
Gross loans and advances 1,964,018,585 1,668,158,618
Less: provision for impairment (46,775,029) (49,778,963)
1,917,243,556 1,618,379,655
Current 553 314 267 578 ,442 ,137
Non-current 1,363,929,289 1, 039,937,518
1,917,243,556 1,618 ,379,655
Included in other loans and advances is the fair value adjustment of loans advanced to staff at off market rates of Ushs 21,345m (2014: Ushs 17,639m).
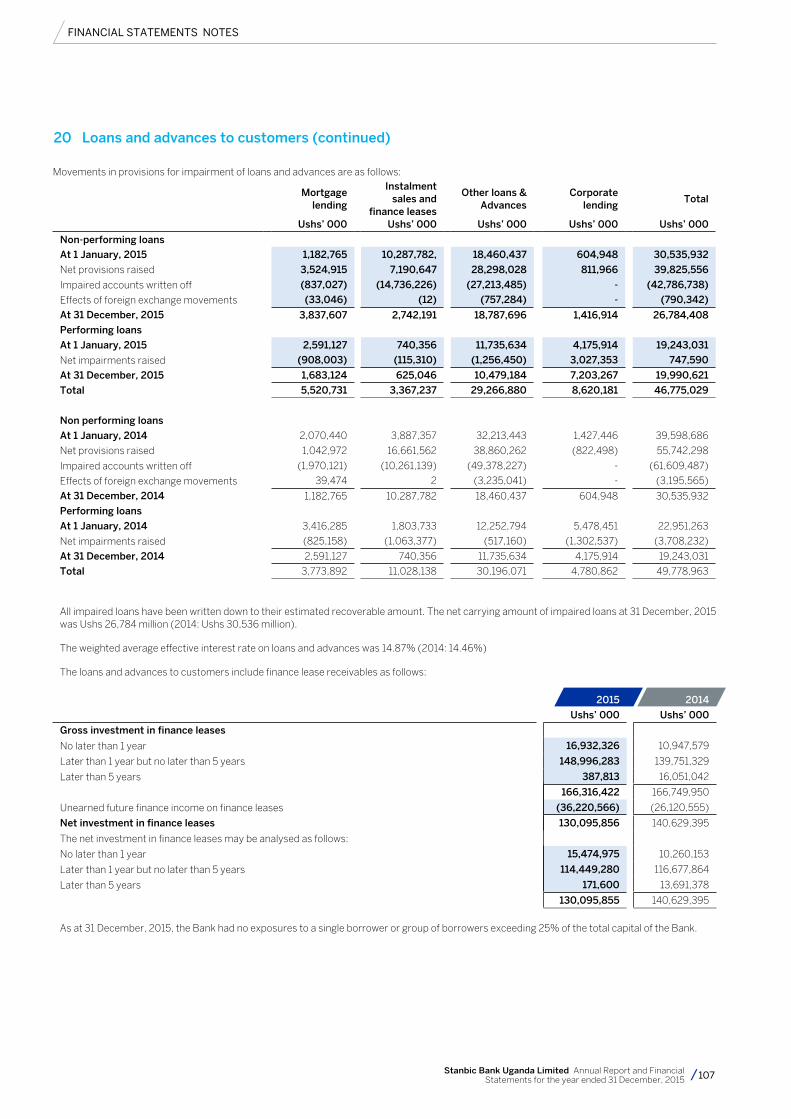
FINANCIAL STATEMENTS NOTES
107Stanbic Bank Uganda Limited Annual Report and Financial Statements for the year ended 31 December, 2015
Movements in provisions for impairment of loans and advances are as follows:
Mortgage
lending
Instalment sales and
finance leases
Other loans & Advances
Corporate
lending Total
Ushs’ 000 Ushs’ 000 Ushs’ 000 Ushs’ 000 Ushs’ 000
Non-performing loans
At 1 January, 2015 1,182,765 10,287,782, 18,460,437 604,948 30,535,932
Net provisions raised 3,524,915 7,190,647 28,298,028 811,966 39,825,556
Impaired accounts written off (837,027) (14,736,226) (27,213,485) - (42,786,738)
Effects of foreign exchange movements (33,046) (12) (757,284) - (790,342)
At 31 December, 2015 3,837,607 2,742,191 18,787,696 1,416,914 26,784,408
Performing loans
At 1 January, 2015 2,591,127 740,356 11,735,634 4,175,914 19,243,031
Net impairments raised (908,003) (115,310) (1,256,450) 3,027,353 747,590
At 31 December, 2015 1,683,124 625,046 10,479,184 7,203,267 19,990,621
Total 5,520,731 3,367,237 29,266,880 8,620,181 46,775,029
Non performing loans
At 1 January, 2014 2,070,440 3,887,357 32,213,443 1,427,446 39,598,686
Net provisions raised 1,042,972 16,661,562 38,860,262 (822,498) 55,742,298
Impaired accounts written off (1,970,121) (10,261,139) (49,378,227) - (61,609,487)
Effects of foreign exchange movements 39,474 2 (3,235,041) - (3,195,565)
At 31 December, 2014 1,182,765 10,287,782 18,460,437 604,948 30,535,932
Performing loans
At 1 January, 2014 3,416,285 1,803,733 12,252,794 5,478,451 22,951,263
Net impairments raised (825,158) (1,063,377) (517,160) (1,302,537) (3,708,232)
At 31 December, 2014 2,591,127 740,356 11,735,634 4,175,914 19,243,031
Total 3,773,892 11,028,138 30,196,071 4,780,862 49,778,963
All impaired loans have been written down to their estimated recoverable amount. The net carrying amount of impaired loans at 31 December, 2015 was Ushs 26,784 million (2014: Ushs 30,536 million).
The weighted average effective interest rate on loans and advances was 14.87% (2014: 14.46%)
The loans and advances to customers include finance lease receivables as follows:
2015 2014
Ushs’ 000 Ushs’ 000
Gross investment in finance leases
No later than 1 year 16,932,326 10,947,579
Later than 1 year but no later than 5 years 148,996,283 139,751,329
Later than 5 years 387,813 16,051,042
166,316,422 166,749,950
Unearned future finance income on finance leases (36,220,566) (26,120,555)
Net investment in finance leases 130,095,856 140,629,395
The net investment in finance leases may be analysed as follows:
No later than 1 year 15,474,975 10,260,153
Later than 1 year but no later than 5 years 114,449,280 116,677,864
Later than 5 years 171,600 13,691,378
130,095,855 140,629,395
As at 31 December, 2015, the Bank had no exposures to a single borrower or group of borrowers exceeding 25% of the total capital of the Bank.
20 Loans and advances to customers (continued)
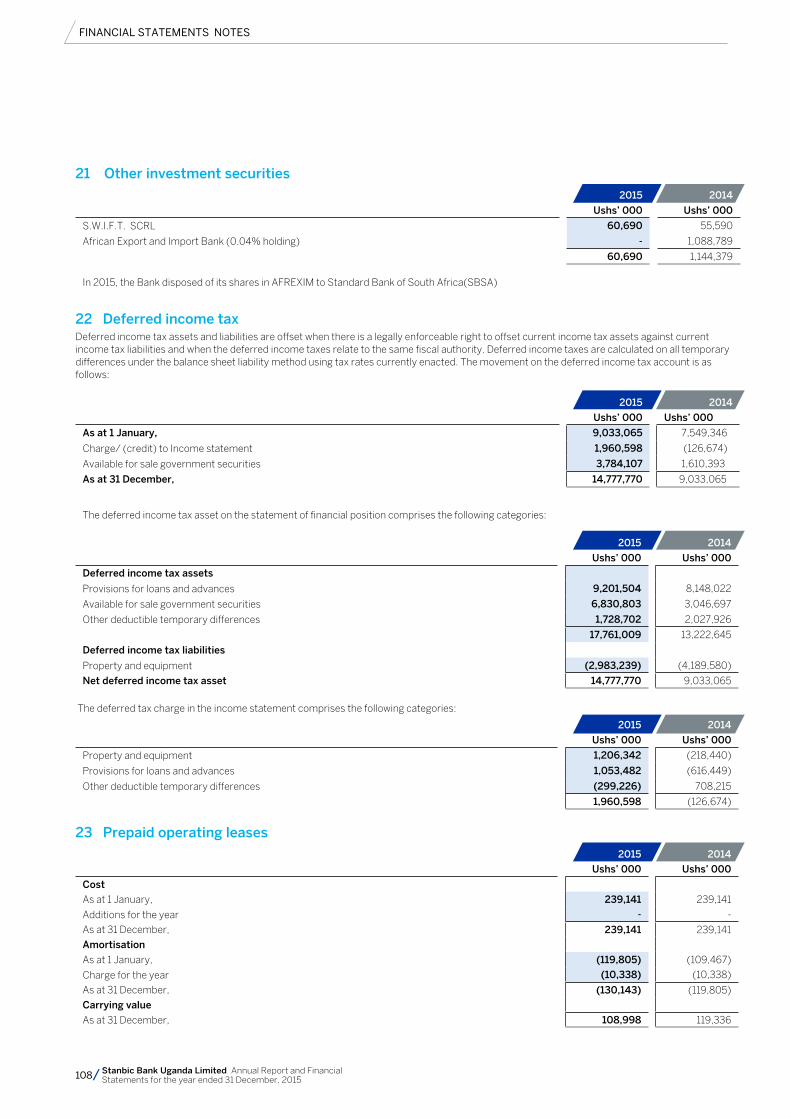
FINANCIAL STATEMENTS NOTES
108 Stanbic Bank Uganda Limited Annual Report and Financial Statements for the year ended 31 December, 2015
21 Other investment securities
2015 2014
Ushs’ 000 Ushs’ 000
S.W.I.F.T. SCRL 60,690 55,590
African Export and Import Bank (0.04% holding) - 1,088,789
60,690 1,144,379
In 2015, the Bank disposed of its shares in AFREXIM to Standard Bank of South Africa(SBSA)
22 Deferred income taxDeferred income tax assets and liabilities are offset when there is a legally enforceable right to offset current income tax assets against current income tax liabilities and when the deferred income taxes relate to the same fiscal authority. Deferred income taxes are calculated on all temporary differences under the balance sheet liability method using tax rates currently enacted. The movement on the deferred income tax account is as follows:
2015 2014
Ushs’ 000 Ushs’ 000
As at 1 January, 9,033,065 7,549,346
Charge/ (credit) to Income statement 1,960,598 (126,674)
Available for sale government securities 3,784,107 1,610,393
As at 31 December, 14,777,770 9,033,065
The deferred income tax asset on the statement of financial position comprises the following categories:
2015 2014
Ushs’ 000 Ushs’ 000
Deferred income tax assets
Provisions for loans and advances 9,201,504 8,148,022
Available for sale government securities 6,830,803 3,046,697
Other deductible temporary differences 1,728,702 2,027,926
17,761,009 13,222,645
Deferred income tax liabilities
Property and equipment (2,983,239) (4,189,580)
Net deferred income tax asset 14,777,770 9,033,065
The deferred tax charge in the income statement comprises the following categories:
2015 2014
Ushs’ 000 Ushs’ 000
Property and equipment 1,206,342 (218,440)
Provisions for loans and advances 1,053,482 (616,449)
Other deductible temporary differences (299,226) 708,215
1,960,598 (126,674)
23 Prepaid operating leases 2015 2014
Ushs’ 000 Ushs’ 000
Cost
As at 1 January, 239,141 239,141
Additions for the year - -
As at 31 December, 239,141 239,141
Amortisation
As at 1 January, (119,805) (109,467)
Charge for the year (10,338) (10,338)
As at 31 December, (130,143) (119,805)
Carrying value
As at 31 December, 108,998 119,336
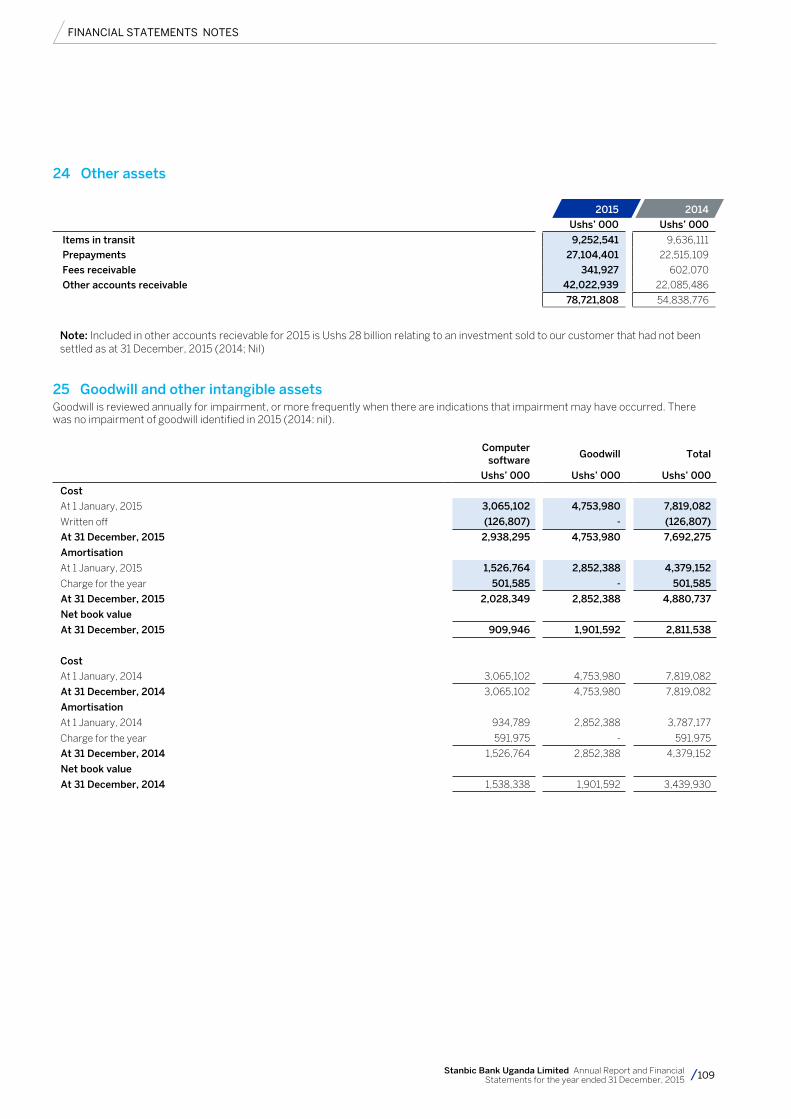
FINANCIAL STATEMENTS NOTES
109Stanbic Bank Uganda Limited Annual Report and Financial Statements for the year ended 31 December, 2015
24 Other assets
2015 2014
Ushs’ 000 Ushs’ 000
Items in transit 9,252,541 9,636,111
Prepayments 27,104,401 22,515,109
Fees receivable 341,927 602,070
Other accounts receivable 42,022,939 22,085,486
78,721,808 54,838,776
Note: Included in other accounts recievable for 2015 is Ushs 28 billion relating to an investment sold to our customer that had not been settled as at 31 December, 2015 (2014; Nil)
25 Goodwill and other intangible assetsGoodwill is reviewed annually for impairment, or more frequently when there are indications that impairment may have occurred. There was no impairment of goodwill identified in 2015 (2014: nil).
Computer
software Goodwill Total
Ushs’ 000 Ushs’ 000 Ushs’ 000
Cost
At 1 January, 2015 3,065,102 4,753,980 7,819,082
Written off (126,807) - (126,807)
At 31 December, 2015 2,938,295 4,753,980 7,692,275
Amortisation
At 1 January, 2015 1,526,764 2,852,388 4,379,152
Charge for the year 501,585 - 501,585
At 31 December, 2015 2,028,349 2,852,388 4,880,737
Net book value
At 31 December, 2015 909,946 1,901,592 2,811,538
Cost
At 1 January, 2014 3,065,102 4,753,980 7,819,082
At 31 December, 2014 3,065,102 4,753,980 7,819,082
Amortisation
At 1 January, 2014 934,789 2,852,388 3,787,177
Charge for the year 591,975 - 591,975
At 31 December, 2014 1,526,764 2,852,388 4,379,152
Net book value
At 31 December, 2014 1,538,338 1,901,592 3,439,930
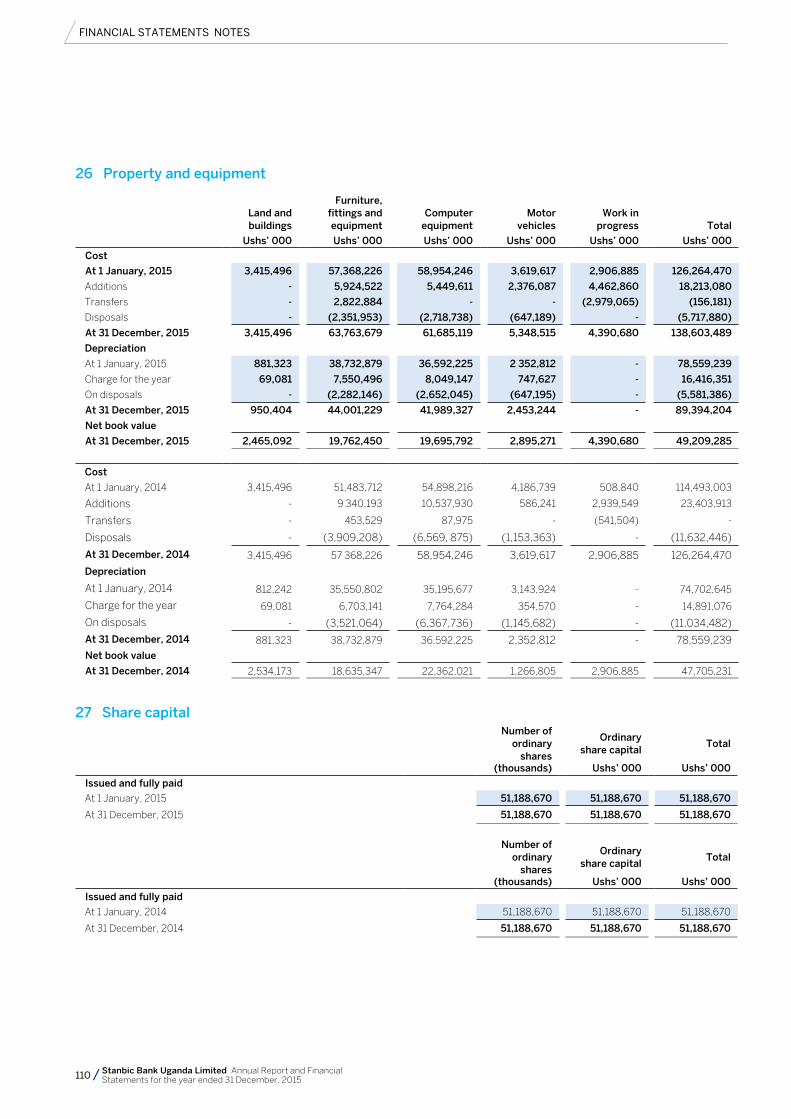
FINANCIAL STATEMENTS NOTES
110 Stanbic Bank Uganda Limited Annual Report and Financial Statements for the year ended 31 December, 2015
26 Property and equipment
Land and buildings
Furniture, fittings and equipment
Computer equipment
Motor vehicles
Work in progress Total
Ushs’ 000 Ushs’ 000 Ushs’ 000 Ushs’ 000 Ushs’ 000 Ushs’ 000
Cost
At 1 January, 2015 3,415,496 57,368,226 58,954,246 3,619,617 2,906,885 126,264,470
Additions - 5,924,522 5,449,611 2,376,087 4,462,860 18,213,080
Transfers - 2,822,884 - - (2,979,065) (156,181)
Disposals - (2,351,953) (2,718,738) (647,189) - (5,717,880)
At 31 December, 2015 3,415,496 63,763,679 61,685,119 5,348,515 4,390,680 138,603,489
Depreciation
At 1 January, 2015 881,323 38,732,879 36,592,225 2 352,812 - 78,559,239
Charge for the year 69,081 7,550,496 8,049,147 747,627 - 16,416,351
On disposals - (2,282,146) (2,652,045) (647,195) - (5,581,386)
At 31 December, 2015 950,404 44,001,229 41,989,327 2,453,244 - 89,394,204
Net book value
At 31 December, 2015 2,465,092 19,762,450 19,695,792 2,895,271 4,390,680 49,209,285
Cost
At 1 January, 2014 3,415,496 51,483,712 54,898,216 4,186,739 508,840 114,493,003
Additions - 9 340,193 10,537,930 586,241 2,939,549 23,403,913
Transfers - 453,529 87,975 - (541,504) -
Disposals - (3,909,208) (6,569, 875) (1,153,363) - (11,632,446)
At 31 December, 2014 3,415,496 57 368,226 58,954,246 3,619,617 2,906,885 126,264,470
Depreciation
At 1 January, 2014 812,242 35,550,802 35,195,677 3,143,924 - 74,702,645
Charge for the year 69,081 6,703,141 7,764,284 354,570 - 14,891,076
On disposals - (3,521,064) (6,367,736) (1,145,682) - (11,034,482)
At 31 December, 2014 881,323 38,732,879 36,592,225 2,352,812 - 78,559,239 Net book value
At 31 December, 2014 2,534,173 18,635,347 22,362,021 1,266,805 2,906,885 47,705,231
27 Share capital
Number of
ordinary shares
Ordinary
share capital Total
(thousands) Ushs’ 000 Ushs’ 000
Issued and fully paid
At 1 January, 2015 51,188,670 51,188,670 51,188,670
At 31 December, 2015 51,188,670 51,188,670 51,188,670
Number of
ordinary shares
Ordinary
share capital Total
(thousands) Ushs’ 000 Ushs’ 000
Issued and fully paid
At 1 January, 2014 51,188,670 51,188,670 51,188,670
At 31 December, 2014 51,188,670 51,188,670 51,188,670
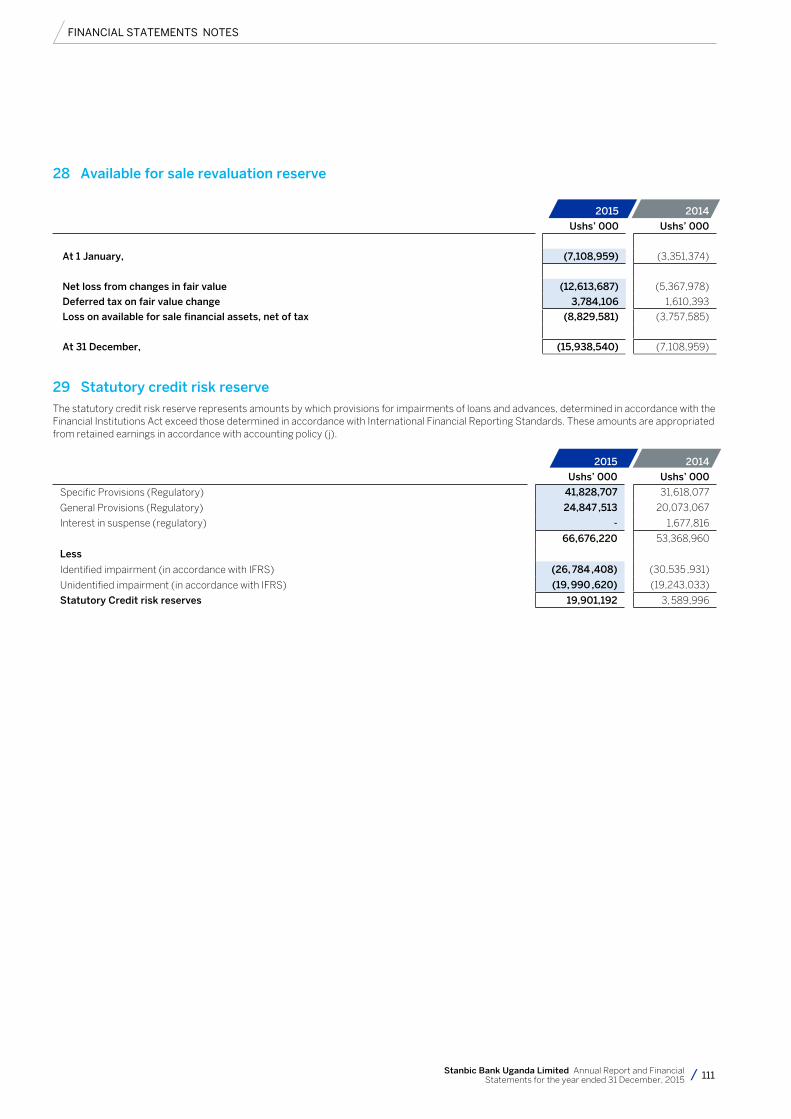
FINANCIAL STATEMENTS NOTES
111Stanbic Bank Uganda Limited Annual Report and Financial Statements for the year ended 31 December, 2015
28 Available for sale revaluation reserve
2015 2014
Ushs’ 000 Ushs’ 000
At 1 January, (7,108,959) (3,351,374)
Net loss from changes in fair value (12,613,687) (5,367,978)
Deferred tax on fair value change 3,784,106 1,610,393
Loss on available for sale financial assets, net of tax (8,829,581) (3,757,585)
At 31 December, (15,938,540) (7,108,959)
29 Statutory credit risk reserveThe statutory credit risk reserve represents amounts by which provisions for impairments of loans and advances, determined in accordance with the Financial Institutions Act exceed those determined in accordance with International Financial Reporting Standards. These amounts are appropriated from retained earnings in accordance with accounting policy (j).
2015 2014
Ushs’ 000 Ushs’ 000
Specific Provisions (Regulatory) 41,828,707 31,618,077
General Provisions (Regulatory) 24,847 ,513 20,073,067
Interest in suspense (regulatory) - 1,677,816
66,676,220 53,368,960
Less
Identified impairment (in accordance with IFRS) (26, 784 ,408) (30,535 ,931)
Unidentified impairment (in accordance with IFRS) (19, 990 ,620) (19,243,033)
Statutory Credit risk reserves 19,901,192 3, 589,996
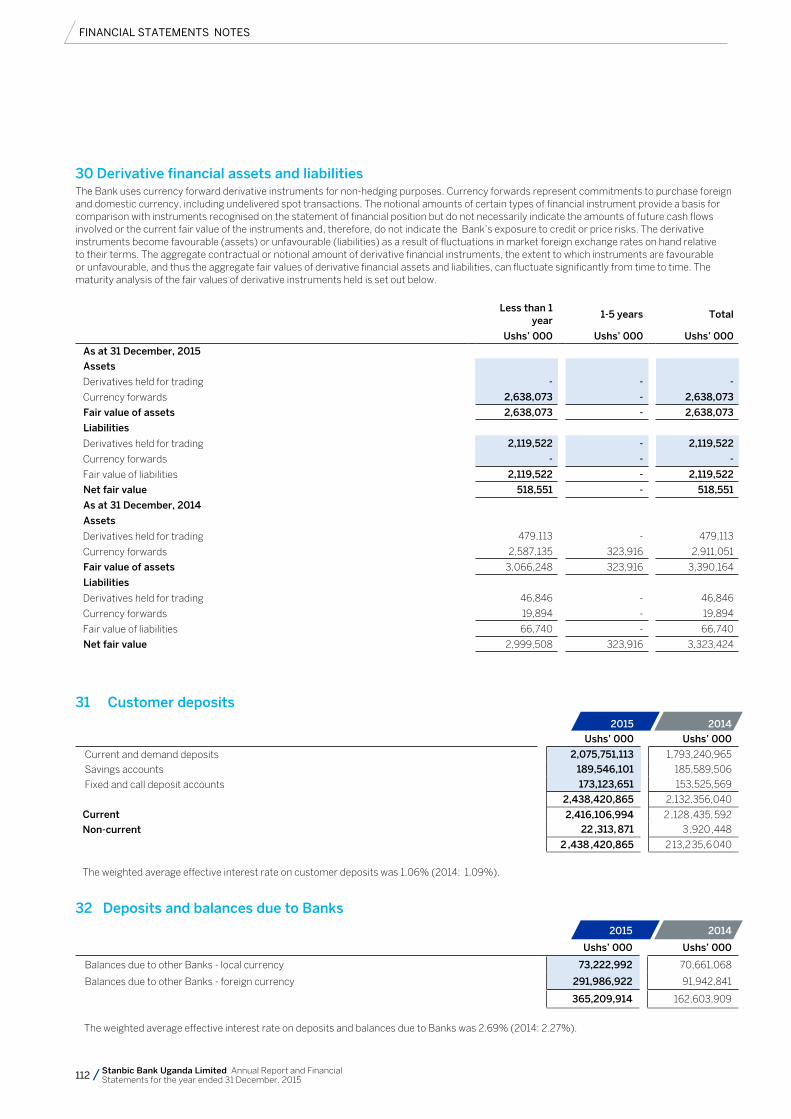
FINANCIAL STATEMENTS NOTES
112 Stanbic Bank Uganda Limited Annual Report and Financial Statements for the year ended 31 December, 2015
30 Derivative financial assets and liabilitiesThe Bank uses currency forward derivative instruments for non-hedging purposes. Currency forwards represent commitments to purchase foreign and domestic currency, including undelivered spot transactions. The notional amounts of certain types of financial instrument provide a basis for comparison with instruments recognised on the statement of financial position but do not necessarily indicate the amounts of future cash flows involved or the current fair value of the instruments and, therefore, do not indicate the Bank’s exposure to credit or price risks. The derivative instruments become favourable (assets) or unfavourable (liabilities) as a result of fluctuations in market foreign exchange rates on hand relative to their terms. The aggregate contractual or notional amount of derivative financial instruments, the extent to which instruments are favourable or unfavourable, and thus the aggregate fair values of derivative financial assets and liabilities, can fluctuate significantly from time to time. The maturity analysis of the fair values of derivative instruments held is set out below.
Less than 1
year 1-5 years Total
Ushs’ 000 Ushs’ 000 Ushs’ 000
As at 31 December, 2015
Assets
Derivatives held for trading - - -
Currency forwards 2,638,073 - 2,638,073
Fair value of assets 2,638,073 - 2,638,073
Liabilities
Derivatives held for trading 2,119,522 - 2,119,522
Currency forwards - - -
Fair value of liabilities 2,119,522 - 2,119,522
Net fair value 518,551 - 518,551
As at 31 December, 2014
Assets
Derivatives held for trading 479,113 - 479,113
Currency forwards 2,587,135 323,916 2,911,051
Fair value of assets 3,066,248 323,916 3,390,164
Liabilities
Derivatives held for trading 46,846 - 46,846
Currency forwards 19,894 - 19,894
Fair value of liabilities 66,740 - 66,740
Net fair value 2,999,508 323,916 3,323,424
31 Customer deposits 2015 2014
Ushs’ 000 Ushs’ 000
Current and demand deposits 2,075,751,113 1,793,240,965
Savings accounts 189,546,101 185,589,506
Fixed and call deposit accounts 173,123,651 153,525,569
2,438,420,865 2,132,356,040
Current 2,416,106,994 2 ,128 ,435, 592
Non-current 22 ,313, 871 3 ,920 ,448
2 ,438 ,420,865 2 13,2 35,6 040
The weighted average effective interest rate on customer deposits was 1.06% (2014: 1.09%).
32 Deposits and balances due to Banks
2015 2014
Ushs’ 000 Ushs’ 000
Balances due to other Banks - local currency 73,222,992 70,661,068
Balances due to other Banks - foreign currency 291,986,922 91,942,841
365,209,914 162,603,909
The weighted average effective interest rate on deposits and balances due to Banks was 2.69% (2014: 2.27%).
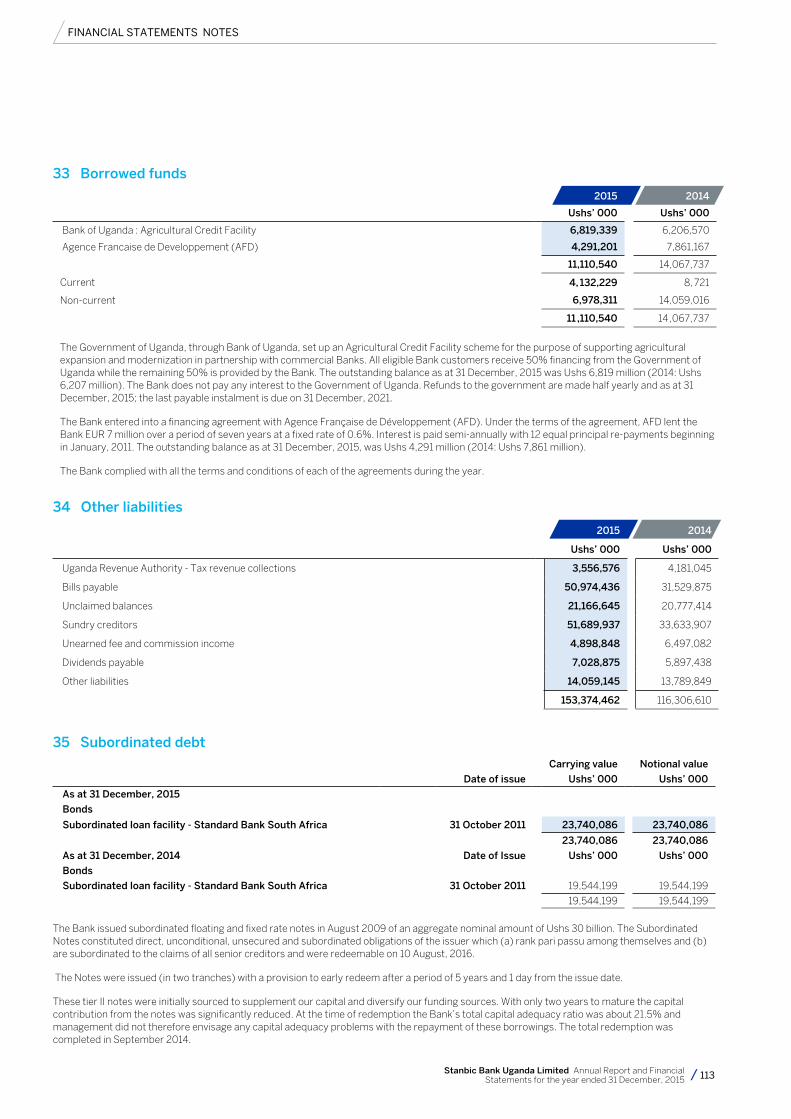
FINANCIAL STATEMENTS NOTES
113Stanbic Bank Uganda Limited Annual Report and Financial Statements for the year ended 31 December, 2015
33 Borrowed funds
2015 2014
Ushs’ 000 Ushs’ 000
Bank of Uganda : Agricultural Credit Facility 6,819,339 6,206,570
Agence Francaise de Developpement (AFD) 4,291,201 7,861,167
11,110,540 14,067,737
Current 4, 132,229 8, 721
Non-current 6,978,311 14,059,016
11 ,110,540 14 ,067,737
The Government of Uganda, through Bank of Uganda, set up an Agricultural Credit Facility scheme for the purpose of supporting agricultural expansion and modernization in partnership with commercial Banks. All eligible Bank customers receive 50% financing from the Government of Uganda while the remaining 50% is provided by the Bank. The outstanding balance as at 31 December, 2015 was Ushs 6,819 million (2014: Ushs 6,207 million). The Bank does not pay any interest to the Government of Uganda. Refunds to the government are made half yearly and as at 31 December, 2015; the last payable instalment is due on 31 December, 2021.
The Bank entered into a financing agreement with Agence Française de Développement (AFD). Under the terms of the agreement, AFD lent the Bank EUR 7 million over a period of seven years at a fixed rate of 0.6%. Interest is paid semi-annually with 12 equal principal re-payments beginning in January, 2011. The outstanding balance as at 31 December, 2015, was Ushs 4,291 million (2014: Ushs 7,861 million).
The Bank complied with all the terms and conditions of each of the agreements during the year.
34 Other liabilities
2015 2014
Ushs’ 000 Ushs’ 000
Uganda Revenue Authority - Tax revenue collections 3,556,576 4,181,045
Bills payable 50,974,436 31,529,875
Unclaimed balances 21,166,645 20,777,414
Sundry creditors 51,689,937 33,633,907
Unearned fee and commission income 4,898,848 6,497,082
Dividends payable 7,028,875 5,897,438
Other liabilities 14,059,145 13,789,849
153,374,462 116,306,610
35 Subordinated debt Carrying value Notional value
Date of issue Ushs’ 000 Ushs’ 000
As at 31 December, 2015
Bonds
Subordinated loan facility - Standard Bank South Africa 31 October 2011 23,740,086 23,740,086
23,740,086 23,740,086
As at 31 December, 2014 Date of Issue Ushs’ 000 Ushs’ 000
Bonds
Subordinated loan facility - Standard Bank South Africa 31 October 2011 19,544,199 19,544,199
19,544,199 19,544,199
The Bank issued subordinated floating and fixed rate notes in August 2009 of an aggregate nominal amount of Ushs 30 billion. The Subordinated Notes constituted direct, unconditional, unsecured and subordinated obligations of the issuer which (a) rank pari passu among themselves and (b) are subordinated to the claims of all senior creditors and were redeemable on 10 August, 2016.
The Notes were issued (in two tranches) with a provision to early redeem after a period of 5 years and 1 day from the issue date.
These tier II notes were initially sourced to supplement our capital and diversify our funding sources. With only two years to mature the capital contribution from the notes was significantly reduced. At the time of redemption the Bank’s total capital adequacy ratio was about 21.5% and management did not therefore envisage any capital adequacy problems with the repayment of these borrowings. The total redemption was completed in September 2014.
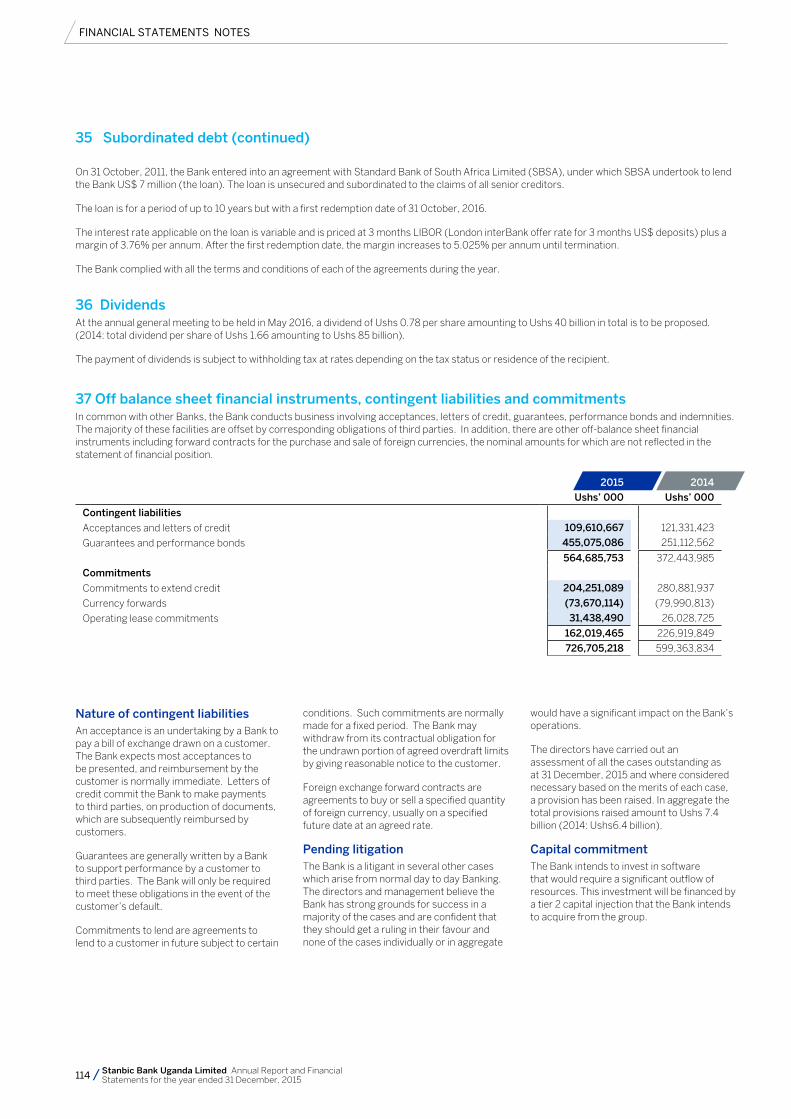
FINANCIAL STATEMENTS NOTES
114 Stanbic Bank Uganda Limited Annual Report and Financial Statements for the year ended 31 December, 2015
On 31 October, 2011, the Bank entered into an agreement with Standard Bank of South Africa Limited (SBSA), under which SBSA undertook to lend the Bank US$ 7 million (the loan). The loan is unsecured and subordinated to the claims of all senior creditors.
The loan is for a period of up to 10 years but with a first redemption date of 31 October, 2016.
The interest rate applicable on the loan is variable and is priced at 3 months LIBOR (London interBank offer rate for 3 months US$ deposits) plus a margin of 3.76% per annum. After the first redemption date, the margin increases to 5.025% per annum until termination.
The Bank complied with all the terms and conditions of each of the agreements during the year.
36 Dividends At the annual general meeting to be held in May 2016, a dividend of Ushs 0.78 per share amounting to Ushs 40 billion in total is to be proposed. (2014: total dividend per share of Ushs 1.66 amounting to Ushs 85 billion).
The payment of dividends is subject to withholding tax at rates depending on the tax status or residence of the recipient.
37 Off balance sheet financial instruments, contingent liabilities and commitmentsIn common with other Banks, the Bank conducts business involving acceptances, letters of credit, guarantees, performance bonds and indemnities. The majority of these facilities are offset by corresponding obligations of third parties. In addition, there are other off-balance sheet financial instruments including forward contracts for the purchase and sale of foreign currencies, the nominal amounts for which are not reflected in the statement of financial position.
2015 2014
Ushs’ 000 Ushs’ 000
Contingent liabilities
Acceptances and letters of credit 109,610,667 121,331,423
Guarantees and performance bonds 455,075,086 251,112,562
564,685,753 372,443,985
Commitments
Commitments to extend credit 204,251,089 280,881,937
Currency forwards (73,670,114) (79,990,813)
Operating lease commitments 31,438,490 26,028,725
162,019,465 226,919,849
726,705,218 599,363,834
35 Subordinated debt (continued)
Nature of contingent liabilitiesAn acceptance is an undertaking by a Bank to pay a bill of exchange drawn on a customer. The Bank expects most acceptances to be presented, and reimbursement by the customer is normally immediate. Letters of credit commit the Bank to make payments to third parties, on production of documents, which are subsequently reimbursed by customers.
Guarantees are generally written by a Bank to support performance by a customer to third parties. The Bank will only be required to meet these obligations in the event of the customer’s default.
Commitments to lend are agreements to lend to a customer in future subject to certain
conditions. Such commitments are normally made for a fixed period. The Bank may withdraw from its contractual obligation for the undrawn portion of agreed overdraft limits by giving reasonable notice to the customer.
Foreign exchange forward contracts are agreements to buy or sell a specified quantity of foreign currency, usually on a specified future date at an agreed rate.
Pending litigationThe Bank is a litigant in several other cases which arise from normal day to day Banking. The directors and management believe the Bank has strong grounds for success in a majority of the cases and are confident that they should get a ruling in their favour and none of the cases individually or in aggregate
would have a significant impact on the Bank’s operations.
The directors have carried out an assessment of all the cases outstanding as at 31 December, 2015 and where considered necessary based on the merits of each case, a provision has been raised. In aggregate the total provisions raised amount to Ushs 7.4 billion (2014: Ushs6.4 billion).
Capital commitmentThe Bank intends to invest in software that would require a significant outflow of resources. This investment will be financed by a tier 2 capital injection that the Bank intends to acquire from the group.
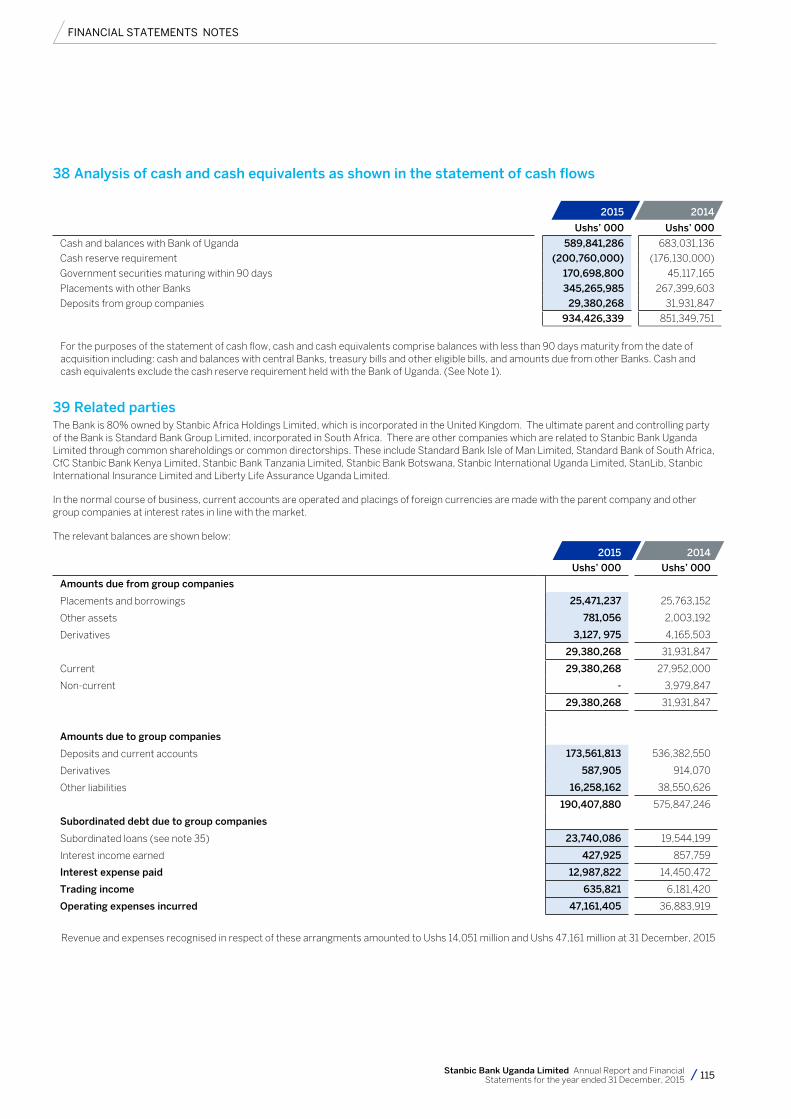
FINANCIAL STATEMENTS NOTES
115Stanbic Bank Uganda Limited Annual Report and Financial Statements for the year ended 31 December, 2015
38 Analysis of cash and cash equivalents as shown in the statement of cash flows
2015 2014
Ushs’ 000 Ushs’ 000
Cash and balances with Bank of Uganda 589,841,286 683,031,136
Cash reserve requirement (200,760,000) (176,130,000)
Government securities maturing within 90 days 170,698,800 45,117,165
Placements with other Banks 345,265,985 267,399,603
Deposits from group companies 29,380,268 31,931,847
934,426,339 851,349,751
For the purposes of the statement of cash flow, cash and cash equivalents comprise balances with less than 90 days maturity from the date of acquisition including: cash and balances with central Banks, treasury bills and other eligible bills, and amounts due from other Banks. Cash and cash equivalents exclude the cash reserve requirement held with the Bank of Uganda. (See Note 1).
39 Related partiesThe Bank is 80% owned by Stanbic Africa Holdings Limited, which is incorporated in the United Kingdom. The ultimate parent and controlling party of the Bank is Standard Bank Group Limited, incorporated in South Africa. There are other companies which are related to Stanbic Bank Uganda Limited through common shareholdings or common directorships. These include Standard Bank Isle of Man Limited, Standard Bank of South Africa, CfC Stanbic Bank Kenya Limited, Stanbic Bank Tanzania Limited, Stanbic Bank Botswana, Stanbic International Uganda Limited, StanLib, Stanbic International Insurance Limited and Liberty Life Assurance Uganda Limited.
In the normal course of business, current accounts are operated and placings of foreign currencies are made with the parent company and other group companies at interest rates in line with the market.
The relevant balances are shown below:
2015 2014
Ushs’ 000 Ushs’ 000
Amounts due from group companies
Placements and borrowings 25,471,237 25,763,152
Other assets 781,056 2,003,192
Derivatives 3,127, 975 4,165,503
29,380,268 31,931,847
Current 29,380,268 27,952,000
Non-current - 3,979,847
29,380,268 31,931,847
Amounts due to group companies
Deposits and current accounts 173,561,813 536,382,550
Derivatives 587,905 914,070
Other liabilities 16,258,162 38,550,626
190,407,880 575,847,246
Subordinated debt due to group companies
Subordinated loans (see note 35) 23,740,086 19,544,199
Interest income earned 427,925 857,759
Interest expense paid 12,987,822 14,450,472
Trading income 635,821 6,181,420
Operating expenses incurred 47,161,405 36,883,919
Revenue and expenses recognised in respect of these arrangments amounted to Ushs 14,051 million and Ushs 47,161 million at 31 December, 2015
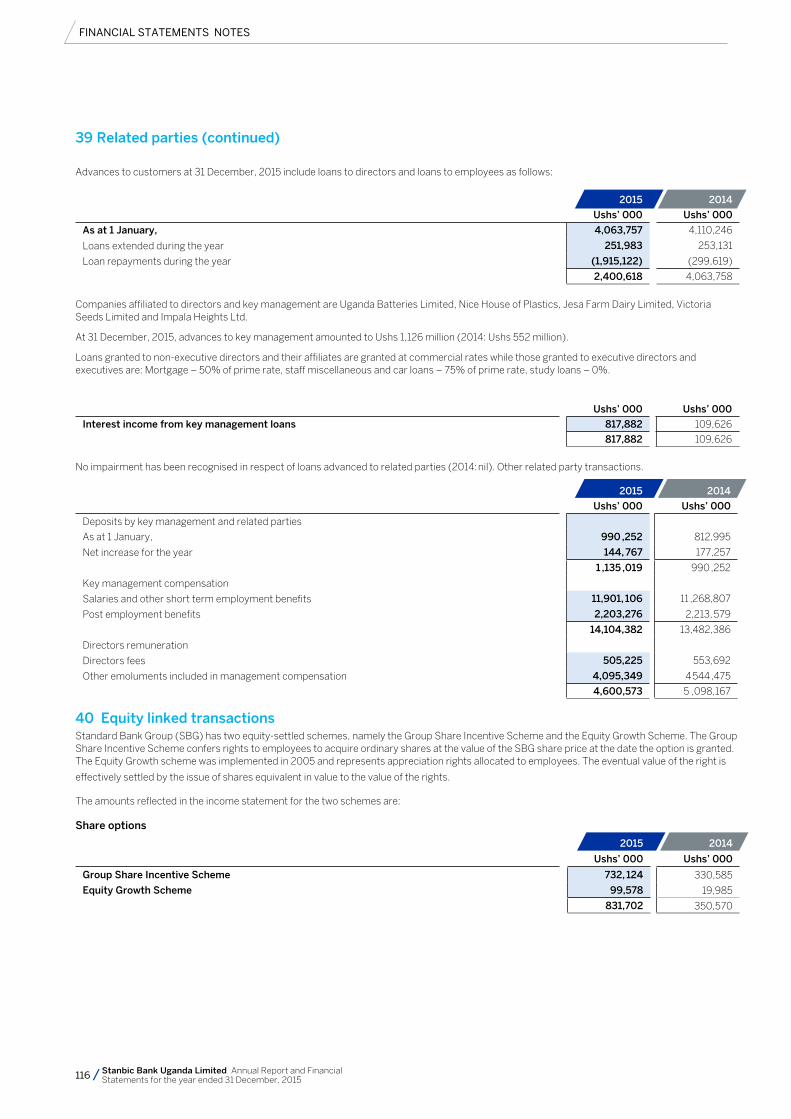
FINANCIAL STATEMENTS NOTES
116 Stanbic Bank Uganda Limited Annual Report and Financial Statements for the year ended 31 December, 2015
Advances to customers at 31 December, 2015 include loans to directors and loans to employees as follows:
2015 2014
Ushs’ 000 Ushs’ 000
As at 1 January, 4,063,757 4,110,246
Loans extended during the year 251,983 253,131
Loan repayments during the year (1,915,122) (299,619)
2,400,618 4,063,758
Companies affiliated to directors and key management are Uganda Batteries Limited, Nice House of Plastics, Jesa Farm Dairy Limited, Victoria Seeds Limited and Impala Heights Ltd.
At 31 December, 2015, advances to key management amounted to Ushs 1,126 million (2014: Ushs 552 million).
Loans granted to non-executive directors and their affiliates are granted at commercial rates while those granted to executive directors and executives are: Mortgage – 50% of prime rate, staff miscellaneous and car loans – 75% of prime rate, study loans – 0%.
2015 2014
Ushs’ 000 Ushs’ 000
Interest income from key management loans 817,882 109,626
817,882 109,626
No impairment has been recognised in respect of loans advanced to related parties (2014: nil). Other related party transactions.
2015 2014
Ushs’ 000 Ushs’ 000
Deposits by key management and related parties
As at 1 January, 990 ,252 812,995
Net increase for the year 144, 767 177,257
1 ,135 ,019 990 ,252
Key management compensation
Salaries and other short term employment benefits 11,901, 106 11 ,268,807
Post employment benefits 2,203,276 2,213, 579
14,104,382 13,482,386
Directors remuneration
Directors fees 505,225 553,692
Other emoluments included in management compensation 4,095,349 4 544 ,475
4,600,573 5 ,098,167
40 Equity linked transactionsStandard Bank Group (SBG) has two equity-settled schemes, namely the Group Share Incentive Scheme and the Equity Growth Scheme. The Group Share Incentive Scheme confers rights to employees to acquire ordinary shares at the value of the SBG share price at the date the option is granted. The Equity Growth scheme was implemented in 2005 and represents appreciation rights allocated to employees. The eventual value of the right is
effectively settled by the issue of shares equivalent in value to the value of the rights.
The amounts reflected in the income statement for the two schemes are:
Share options
2015 2014
Ushs’ 000 Ushs’ 000
Group Share Incentive Scheme 732, 124 330,585
Equity Growth Scheme 99,578 19,985
831,702 350,570
39 Related parties (continued)
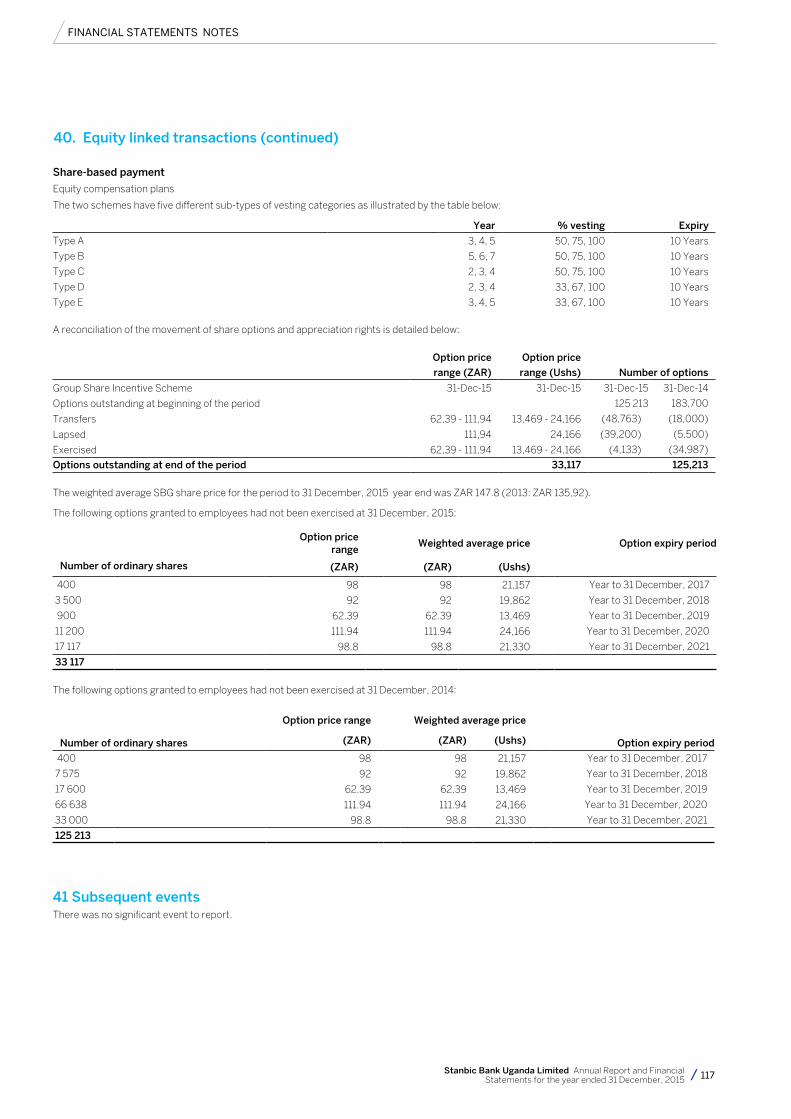
FINANCIAL STATEMENTS NOTES
117Stanbic Bank Uganda Limited Annual Report and Financial Statements for the year ended 31 December, 2015
Share-based payment
Equity compensation plans
The two schemes have five different sub-types of vesting categories as illustrated by the table below:
Year % vesting Expiry
Type A 3, 4, 5 50, 75, 100 10 Years
Type B 5, 6, 7 50, 75, 100 10 Years
Type C 2, 3, 4 50, 75, 100 10 Years
Type D 2, 3, 4 33, 67, 100 10 Years
Type E 3, 4, 5 33, 67, 100 10 Years
A reconciliation of the movement of share options and appreciation rights is detailed below:
Option price Option price
range (ZAR) range (Ushs) Number of options
Group Share Incentive Scheme 31-Dec-15 31-Dec-15 31-Dec-15 31-Dec-14
Options outstanding at beginning of the period 125 213 183,700
Transfers 62,39 - 111,94 13,469 - 24,166 (48,763) (18,000)
Lapsed 111,94 24,166 (39,200) (5,500)
Exercised 62,39 - 111,94 13,469 - 24,166 (4,133) (34,987)
Options outstanding at end of the period 33,117 125,213
The weighted average SBG share price for the period to 31 December, 2015 year end was ZAR 147.8 (2013: ZAR 135,92).
The following options granted to employees had not been exercised at 31 December, 2015:
Number of ordinary shares
Option price range
Weighted average price Option expiry period
(ZAR) (ZAR) (Ushs)
400 98 98 21,157 Year to 31 December, 2017
3 500 92 92 19,862 Year to 31 December, 2018
900 62.39 62.39 13,469 Year to 31 December, 2019
11 200 111.94 111.94 24,166 Year to 31 December, 2020
17 117 98.8 98.8 21,330 Year to 31 December, 2021
33 117
The following options granted to employees had not been exercised at 31 December, 2014:
Number of ordinary shares
Option price range Weighted average price
Option expiry period(ZAR) (ZAR) (Ushs)
400 98 98 21,157 Year to 31 December, 2017
7 575 92 92 19,862 Year to 31 December, 2018
17 600 62.39 62.39 13,469 Year to 31 December, 2019
66 638 111.94 111.94 24,166 Year to 31 December, 2020
33 000 98.8 98.8 21,330 Year to 31 December, 2021
125 213
41 Subsequent eventsThere was no significant event to report.
40. Equity linked transactions (continued)
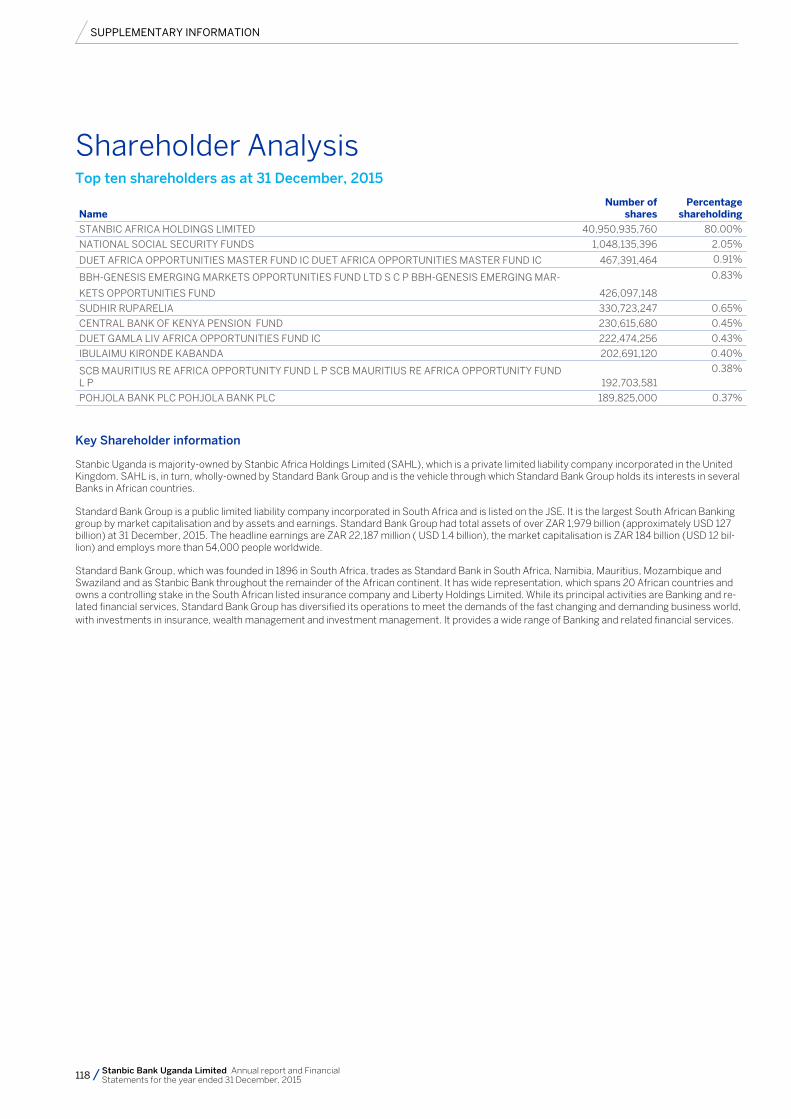
118 Stanbic Bank Uganda Limited Annual report and Financial Statements for the year ended 31 December, 2015
SUPPLEMENTARY INFORMATION
Key Shareholder information
Stanbic Uganda is majority-owned by Stanbic Africa Holdings Limited (SAHL), which is a private limited liability company incorporated in the United Kingdom. SAHL is, in turn, wholly-owned by Standard Bank Group and is the vehicle through which Standard Bank Group holds its interests in several Banks in African countries.
Standard Bank Group is a public limited liability company incorporated in South Africa and is listed on the JSE. It is the largest South African Banking group by market capitalisation and by assets and earnings. Standard Bank Group had total assets of over ZAR 1,979 billion (approximately USD 127 billion) at 31 December, 2015. The headline earnings are ZAR 22,187 million ( USD 1.4 billion), the market capitalisation is ZAR 184 billion (USD 12 bil-lion) and employs more than 54,000 people worldwide.
Standard Bank Group, which was founded in 1896 in South Africa, trades as Standard Bank in South Africa, Namibia, Mauritius, Mozambique and Swaziland and as Stanbic Bank throughout the remainder of the African continent. It has wide representation, which spans 20 African countries and owns a controlling stake in the South African listed insurance company and Liberty Holdings Limited. While its principal activities are Banking and re-lated financial services, Standard Bank Group has diversified its operations to meet the demands of the fast changing and demanding business world, with investments in insurance, wealth management and investment management. It provides a wide range of Banking and related financial services.
Shareholder Analysis
Name Number of
shares Percentage
shareholding
STANBIC AFRICA HOLDINGS LIMITED 40,950,935,760 80.00%
NATIONAL SOCIAL SECURITY FUNDS 1,048,135,396 2.05%
DUET AFRICA OPPORTUNITIES MASTER FUND IC DUET AFRICA OPPORTUNITIES MASTER FUND IC 467,391,464 0.91%
BBH-GENESIS EMERGING MARKETS OPPORTUNITIES FUND LTD S C P BBH-GENESIS EMERGING MAR-
KETS OPPORTUNITIES FUND 426,097,148
0.83%
SUDHIR RUPARELIA 330,723,247 0.65%
CENTRAL BANK OF KENYA PENSION FUND 230,615,680 0.45%
DUET GAMLA LIV AFRICA OPPORTUNITIES FUND IC 222,474,256 0.43%
IBULAIMU KIRONDE KABANDA 202,691,120 0.40%
SCB MAURITIUS RE AFRICA OPPORTUNITY FUND L P SCB MAURITIUS RE AFRICA OPPORTUNITY FUND L P 192,703,581
0.38%
POHJOLA BANK PLC POHJOLA BANK PLC 189,825,000 0.37%
Top ten shareholders as at 31 December, 2015
119Stanbic Bank Uganda Limited Annual report and Financial Statements for the year ended 31 December, 2015
SUPPLEMENTARY INFORMATION
Shareholder InformationChairman’s letter to shareholders,
Dear shareholder
I extend an invitation to you to attend the annual general meeting (AGM) of Stanbic Bank Uganda Limited to be held at the Rwenzori Ballroom, Sheraton Hotel, Kampala on 4th May 2016 at 10h00.
This is your opportunity to meet and question members of the Stanbic Bank Uganda Limited board regarding the company’s performance for the year ended 31 December, 2015.
If you are not able to attend the AGM, I would urge you to complete and submit the proxy form in accordance with the instructions and return it to the address indicated.
Explanatory note on resolutions to be tabled at the AGM
The AGM will deal with the ordinary business as detailed in the notice 120:
I look forward to meeting you at the AGM.
___________________________________
Japheth Katto
Chairman,
Board of Directors
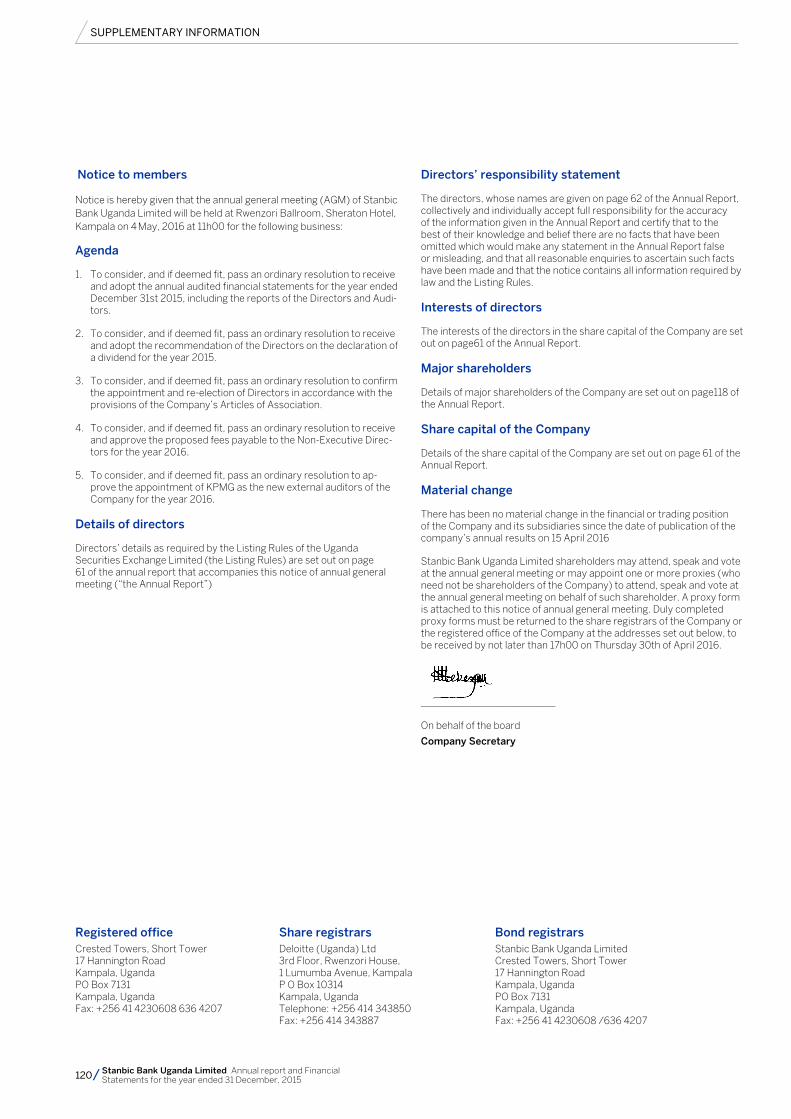
120 Stanbic Bank Uganda Limited Annual report and Financial Statements for the year ended 31 December, 2015
SUPPLEMENTARY INFORMATION
Notice to members
Notice is hereby given that the annual general meeting (AGM) of Stanbic Bank Uganda Limited will be held at Rwenzori Ballroom, Sheraton Hotel, Kampala on 4 May, 2016 at 11h00 for the following business:
Agenda
1. To consider, and if deemed fit, pass an ordinary resolution to receive and adopt the annual audited financial statements for the year ended December 31st 2015, including the reports of the Directors and Audi-tors.
2. To consider, and if deemed fit, pass an ordinary resolution to receive and adopt the recommendation of the Directors on the declaration of a dividend for the year 2015.
3. To consider, and if deemed fit, pass an ordinary resolution to confirm the appointment and re-election of Directors in accordance with the provisions of the Company’s Articles of Association.
4. To consider, and if deemed fit, pass an ordinary resolution to receive and approve the proposed fees payable to the Non-Executive Direc-tors for the year 2016.
5. To consider, and if deemed fit, pass an ordinary resolution to ap-prove the appointment of KPMG as the new external auditors of the Company for the year 2016.
Details of directors
Directors’ details as required by the Listing Rules of the Uganda Securities Exchange Limited (the Listing Rules) are set out on page 61 of the annual report that accompanies this notice of annual general meeting (“the Annual Report”)
Directors’ responsibility statement
The directors, whose names are given on page 62 of the Annual Report, collectively and individually accept full responsibility for the accuracy of the information given in the Annual Report and certify that to the best of their knowledge and belief there are no facts that have been omitted which would make any statement in the Annual Report false or misleading, and that all reasonable enquiries to ascertain such facts have been made and that the notice contains all information required by law and the Listing Rules.
Interests of directors
The interests of the directors in the share capital of the Company are set out on page61 of the Annual Report.
Major shareholders
Details of major shareholders of the Company are set out on page118 of the Annual Report.
Share capital of the Company
Details of the share capital of the Company are set out on page 61 of the Annual Report.
Material change
There has been no material change in the financial or trading position of the Company and its subsidiaries since the date of publication of the company’s annual results on 15 April 2016
Stanbic Bank Uganda Limited shareholders may attend, speak and vote at the annual general meeting or may appoint one or more proxies (who need not be shareholders of the Company) to attend, speak and vote at the annual general meeting on behalf of such shareholder. A proxy form is attached to this notice of annual general meeting. Duly completed proxy forms must be returned to the share registrars of the Company or the registered office of the Company at the addresses set out below, to be received by not later than 17h00 on Thursday 30th of April 2016.
___________________________
On behalf of the board
Company Secretary
Registered officeCrested Towers, Short Tower17 Hannington RoadKampala, UgandaPO Box 7131Kampala, UgandaFax: +256 41 4230608 636 4207
Share registrarsDeloitte (Uganda) Ltd3rd Floor, Rwenzori House,1 Lumumba Avenue, KampalaP O Box 10314Kampala, UgandaTelephone: +256 414 343850Fax: +256 414 343887
Bond registrarsStanbic Bank Uganda LimitedCrested Towers, Short Tower17 Hannington RoadKampala, UgandaPO Box 7131Kampala, UgandaFax: +256 41 4230608 /636 4207
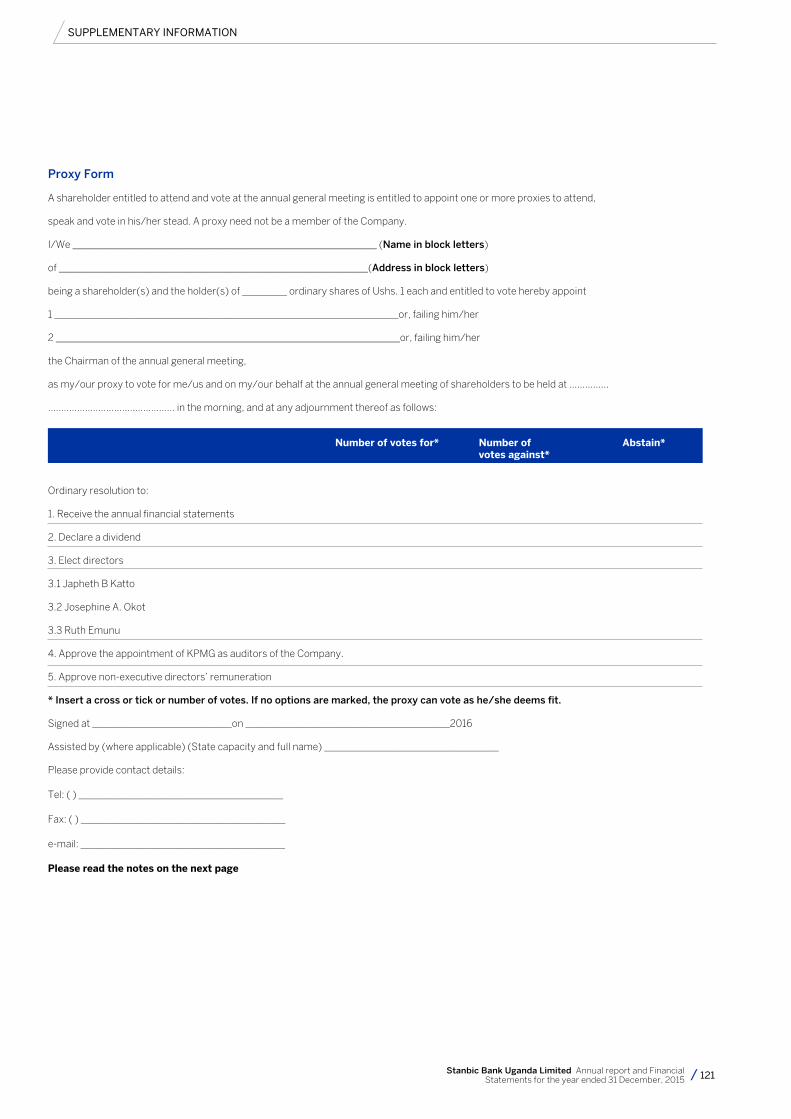
121Stanbic Bank Uganda Limited Annual report and Financial Statements for the year ended 31 December, 2015
SUPPLEMENTARY INFORMATION
Proxy Form
A shareholder entitled to attend and vote at the annual general meeting is entitled to appoint one or more proxies to attend,
speak and vote in his/her stead. A proxy need not be a member of the Company.
I/We _____________________________________________________________ (Name in block letters)
of ______________________________________________________________(Address in block letters)
being a shareholder(s) and the holder(s) of _________ ordinary shares of Ushs. 1 each and entitled to vote hereby appoint
1 _____________________________________________________________________or, failing him/her
2 _____________________________________________________________________or, failing him/her
the Chairman of the annual general meeting,
as my/our proxy to vote for me/us and on my/our behalf at the annual general meeting of shareholders to be held at ...............
................................................ in the morning, and at any adjournment thereof as follows:
Number of votes for* Number of Abstain* votes against*
Ordinary resolution to:
1. Receive the annual financial statements
2. Declare a dividend
3. Elect directors
3.1 Japheth B Katto
3.2 Josephine A. Okot
3.3 Ruth Emunu
4. Approve the appointment of KPMG as auditors of the Company.
5. Approve non-executive directors’ remuneration
* Insert a cross or tick or number of votes. If no options are marked, the proxy can vote as he/she deems fit.
Signed at ____________________________on _________________________________________2016
Assisted by (where applicable) (State capacity and full name) ___________________________________
Please provide contact details:
Tel: ( ) _________________________________________
Fax: ( ) _________________________________________
e-mail: _________________________________________
Please read the notes on the next page
122 Stanbic Bank Uganda Limited Annual report and Financial Statements for the year ended 31 December, 2015
SUPPLEMENTARY INFORMATION
Notes
1. A shareholder may insert the name of a proxy or the names of two alternative proxies of his/her choice in the space provided. The person whose name stands first on the proxy form and who is present at the annual general meeting will be entitled to act as proxy to the exclusion of those whose names follow.
2. To be effective, completed proxy forms must be lodged by not later than Friday, 2 May, with either the share registrars or the registered office:
Registered address
Crested Towers, Short Tower
17 Hannington Road
Kampala, Uganda
PO Box 7131
Kampala, Uganda
Fax: +256 41 4230608/ 636 4207
Share registrars
Deloitte (Uganda) Ltd
3rd Floor, Rwenzori House,
1 Lumumba Avenue, Kampala
P O Box 10314
Kampala, Uganda
Telephone: +256 414 343850
Fax: +256 414 343887
3. The completion and lodging of this form of proxy will not prevent the relevant shareholder from attending the annual general meeting and speak-ing and voting in person at the annual general meeting instead of the proxy.
4. The Chairman of the annual general meeting may accept or reject any proxy form which is completed and/or received other than in compliance with these notes.
5. The signatories must initial any alteration to this proxy form, other than the deletion of alternatives.
6. Documentary evidence establishing the authority of a person signing the proxy form in a representative capacity must be attached to this proxy form unless previously recorded by the Company. In the case of a corporation, a resolution of the board or equivalent body shall be required.
7. Where there are joint holders of ordinary shares:
a. any one holder may sign the proxy form; and
b. the vote of the senior shareholder (for that purpose seniority will be determined by the order in which the names of the shareholders who tender a vote (whether in person or by proxy) appear in the Company’s register) will be accepted as to the exclusion of the vote(s) of the other joint shareholders.

123Stanbic Bank Uganda Limited Annual report and Financial Statements for the year ended 31 December, 2015
SUPPLEMENTARY INFORMATION
Contact DetailsChief Finance OfficerSamuel Fredrick MwogezaTel: +256 41 7 154 396
Company SecretaryCandy OkoboiTel: +256 41 7 154 606
Investor relations enquiriesSophie Achak
Tel: +256 41 7 154 310
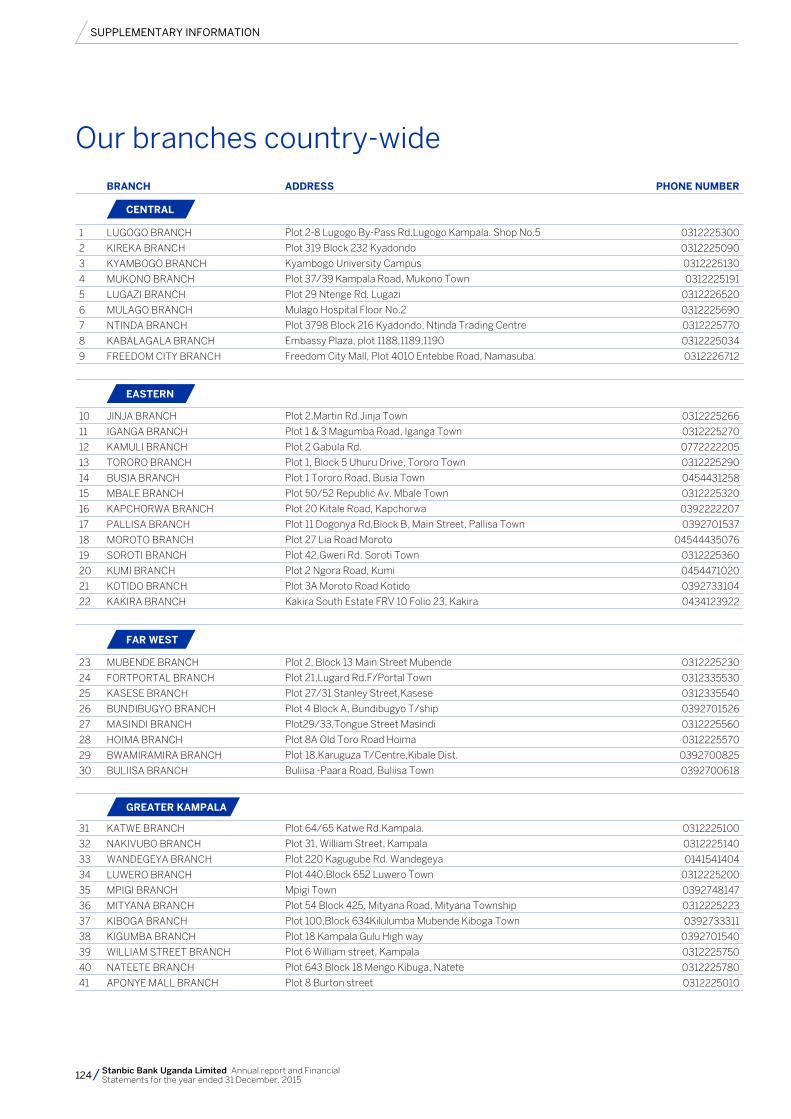
124 Stanbic Bank Uganda Limited Annual report and Financial Statements for the year ended 31 December, 2015
SUPPLEMENTARY INFORMATION
BRANCH ADDRESS PHONE NUMBER
CENTRAL
1 LUGOGO BRANCH Plot 2-8 Lugogo By-Pass Rd.Lugogo Kampala. Shop No.5 0312225300
2 KIREKA BRANCH Plot 319 Block 232 Kyadondo 0312225090
3 KYAMBOGO BRANCH Kyambogo University Campus 0312225130
4 MUKONO BRANCH Plot 37/39 Kampala Road, Mukono Town 0312225191
5 LUGAZI BRANCH Plot 29 Ntenge Rd. Lugazi 0312226520
6 MULAGO BRANCH Mulago Hospital Floor No.2 0312225690
7 NTINDA BRANCH Plot 3798 Block 216 Kyadondo, Ntinda Trading Centre 0312225770
8 KABALAGALA BRANCH Embassy Plaza, plot 1188,1189,1190 0312225034
9 FREEDOM CITY BRANCH Freedom City Mall, Plot 4010 Entebbe Road, Namasuba. 0312226712
EASTERN
10 JINJA BRANCH Plot 2,Martin Rd.Jinja Town 0312225266
11 IGANGA BRANCH Plot 1 & 3 Magumba Road, Iganga Town 0312225270
12 KAMULI BRANCH Plot 2 Gabula Rd. 0772222205
13 TORORO BRANCH Plot 1, Block 5 Uhuru Drive, Tororo Town 0312225290
14 BUSIA BRANCH Plot 1 Tororo Road, Busia Town 0454431258
15 MBALE BRANCH Plot 50/52 Republic Av. Mbale Town 0312225320
16 KAPCHORWA BRANCH Plot 20 Kitale Road, Kapchorwa 0392222207
17 PALLISA BRANCH Plot 11 Dogonya Rd,Block B, Main Street, Pallisa Town 0392701537
18 MOROTO BRANCH Plot 27 Lia Road Moroto 04544435076
19 SOROTI BRANCH Plot 42,Gweri Rd. Soroti Town 0312225360
20 KUMI BRANCH Plot 2 Ngora Road, Kumi 0454471020
21 KOTIDO BRANCH Plot 3A Moroto Road Kotido 0392733104
22 KAKIRA BRANCH Kakira South Estate FRV 10 Folio 23, Kakira 0434123922
FAR WEST
23 MUBENDE BRANCH Plot 2, Block 13 Main Street Mubende 0312225230
24 FORTPORTAL BRANCH Plot 21,Lugard Rd.F/Portal Town 0312335530
25 KASESE BRANCH Plot 27/31 Stanley Street,Kasese 0312335540
26 BUNDIBUGYO BRANCH Plot 4 Block A, Bundibugyo T/ship 0392701526
27 MASINDI BRANCH Plot29/33,Tongue Street Masindi 0312225560
28 HOIMA BRANCH Plot 8A Old Toro Road Hoima 0312225570
29 BWAMIRAMIRA BRANCH Plot 18,Karuguza T/Centre,Kibale Dist. 0392700825
30 BULIISA BRANCH Buliisa -Paara Road, Buliisa Town 0392700618
GREATER KAMPALA
31 KATWE BRANCH Plot 64/65 Katwe Rd.Kampala. 0312225100
32 NAKIVUBO BRANCH Plot 31, William Street, Kampala 0312225140
33 WANDEGEYA BRANCH Plot 220 Kagugube Rd. Wandegeya 0141541404
34 LUWERO BRANCH Plot 440,Block 652 Luwero Town 0312225200
35 MPIGI BRANCH Mpigi Town 0392748147
36 MITYANA BRANCH Plot 54 Block 425, Mityana Road, Mityana Township 0312225223
37 KIBOGA BRANCH Plot 100,Block 634Kilulumba Mubende Kiboga Town 0392733311
38 KIGUMBA BRANCH Plot 18 Kampala Gulu High way 0392701540
39 WILLIAM STREET BRANCH Plot 6 William street, Kampala 0312225750
40 NATEETE BRANCH Plot 643 Block 18 Mengo Kibuga, Natete 0312225780
41 APONYE MALL BRANCH Plot 8 Burton street 0312225010
Our branches country-wide
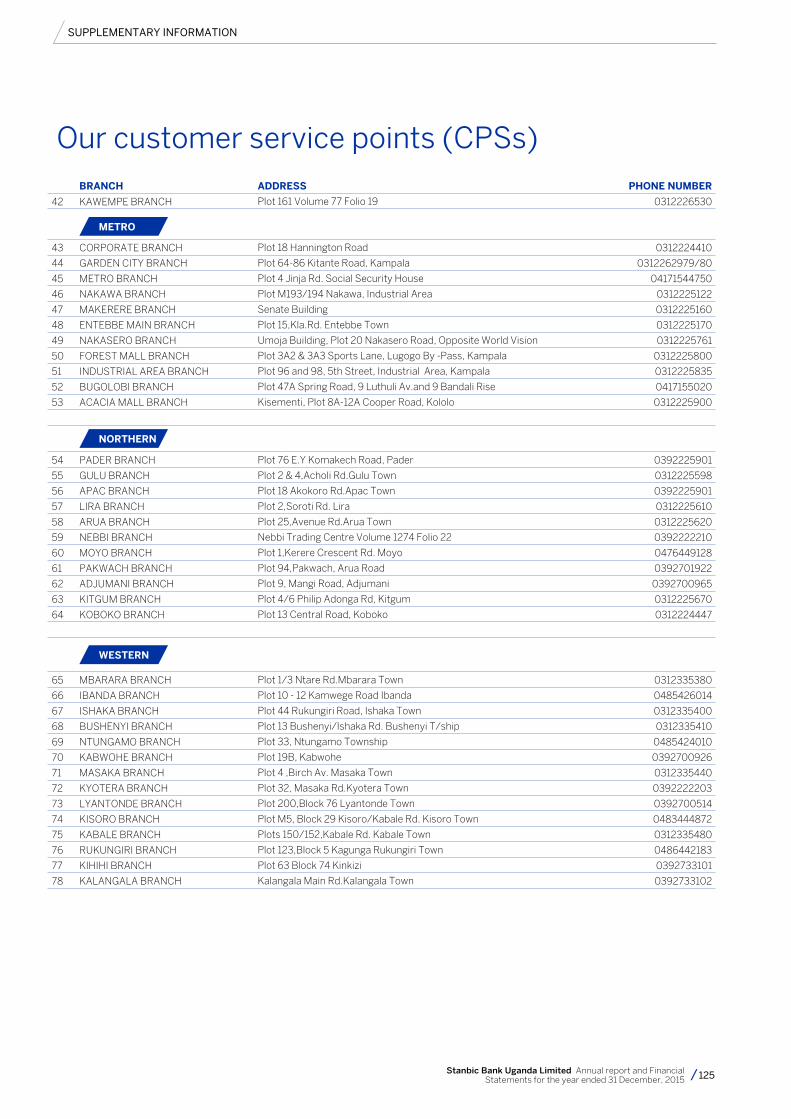
125Stanbic Bank Uganda Limited Annual report and Financial Statements for the year ended 31 December, 2015
SUPPLEMENTARY INFORMATION
BRANCH ADDRESS PHONE NUMBER
42 KAWEMPE BRANCH Plot 161 Volume 77 Folio 19 0312226530
METRO
43 CORPORATE BRANCH Plot 18 Hannington Road 0312224410
44 GARDEN CITY BRANCH Plot 64-86 Kitante Road, Kampala 0312262979/80
45 METRO BRANCH Plot 4 Jinja Rd. Social Security House 04171544750
46 NAKAWA BRANCH Plot M193/194 Nakawa, Industrial Area 0312225122
47 MAKERERE BRANCH Senate Building 0312225160
48 ENTEBBE MAIN BRANCH Plot 15,Kla.Rd. Entebbe Town 0312225170
49 NAKASERO BRANCH Umoja Building, Plot 20 Nakasero Road, Opposite World Vision 0312225761
50 FOREST MALL BRANCH Plot 3A2 & 3A3 Sports Lane, Lugogo By -Pass, Kampala 0312225800
51 INDUSTRIAL AREA BRANCH Plot 96 and 98, 5th Street, Industrial Area, Kampala 0312225835
52 BUGOLOBI BRANCH Plot 47A Spring Road, 9 Luthuli Av.and 9 Bandali Rise 0417155020
53 ACACIA MALL BRANCH Kisementi, Plot 8A-12A Cooper Road, Kololo 0312225900
NORTHERN
54 PADER BRANCH Plot 76 E.Y Komakech Road, Pader 0392225901
55 GULU BRANCH Plot 2 & 4,Acholi Rd.Gulu Town 0312225598
56 APAC BRANCH Plot 18 Akokoro Rd.Apac Town 0392225901
57 LIRA BRANCH Plot 2,Soroti Rd. Lira 0312225610
58 ARUA BRANCH Plot 25,Avenue Rd.Arua Town 0312225620
59 NEBBI BRANCH Nebbi Trading Centre Volume 1274 Folio 22 0392222210
60 MOYO BRANCH Plot 1,Kerere Crescent Rd. Moyo 0476449128
61 PAKWACH BRANCH Plot 94,Pakwach, Arua Road 0392701922
62 ADJUMANI BRANCH Plot 9, Mangi Road, Adjumani 0392700965
63 KITGUM BRANCH Plot 4/6 Philip Adonga Rd, Kitgum 0312225670
64 KOBOKO BRANCH Plot 13 Central Road, Koboko 0312224447
WESTERN
65 MBARARA BRANCH Plot 1/3 Ntare Rd.Mbarara Town 0312335380
66 IBANDA BRANCH Plot 10 - 12 Kamwege Road Ibanda 0485426014
67 ISHAKA BRANCH Plot 44 Rukungiri Road, Ishaka Town 0312335400
68 BUSHENYI BRANCH Plot 13 Bushenyi/Ishaka Rd. Bushenyi T/ship 0312335410
69 NTUNGAMO BRANCH Plot 33, Ntungamo Township 0485424010
70 KABWOHE BRANCH Plot 19B, Kabwohe 0392700926
71 MASAKA BRANCH Plot 4 ,Birch Av. Masaka Town 0312335440
72 KYOTERA BRANCH Plot 32, Masaka Rd.Kyotera Town 0392222203
73 LYANTONDE BRANCH Plot 200,Block 76 Lyantonde Town 0392700514
74 KISORO BRANCH Plot M5, Block 29 Kisoro/Kabale Rd. Kisoro Town 0483444872
75 KABALE BRANCH Plots 150/152,Kabale Rd. Kabale Town 0312335480
76 RUKUNGIRI BRANCH Plot 123,Block 5 Kagunga Rukungiri Town 0486442183
77 KIHIHI BRANCH Plot 63 Block 74 Kinkizi 0392733101
78 KALANGALA BRANCH Kalangala Main Rd.Kalangala Town 0392733102
Our customer service points (CPSs)

126 Stanbic Bank Uganda Limited Annual report and Financial Statements for the year ended 31 December, 2015
SUPPLEMENTARY INFORMATION
126 Stanbic Bank Uganda Annual integrated report 2015
CSP PLOT DETAILS STREET/ROAD
1 Abim CSP
2 Bwera CSP Saad Village, Mpondwe- Lubiriha, Bwera Town Mpondwe-Lubiriha Road
3 Dokolo CSP Lira Road, Dokolo Town Lira Road
4 Kaboong CSP Plot 20 Kaabong Central West, Kaabong Trading Centre Kaabong Central West Road
5 Kagadi CSP Kagadi Street, Kagadi on Mugenyi street Kagadi/Mugenyi Street
6 Katakwi CSP Plot 20, Block F, Katakwi Town Katakwi Road
7 Kayunga CSP Plot 472 Block 123, Kayunga Trading Centre Kayunga Road
8 Kyenjojo Plot 3 Fort Portal Road, Kyenjojo Fort Portal Road
9 Mayuge CSP Bukoba Road, Mayuge Town Bukoba Road
10 Sironko CSP Plot 20 Block D, Sironko Town Kapchorwa Road
11 Wobulenzi CSP Plot 59 Block 159 Bulemezi, Wobulenzi Trading Centre Kampala Gulu Highway
12 Yumbe CSP Plot 3 Abiriga Road, Yumbe Abiriga Road
Our customer service points (CSPs)
CustomerContact
Centre.Serving
your needs.
One call, one centre, one solution.For more information, call 0800 250250or email us at [email protected]

CustomerContact
Centre.Serving
your needs.
One call, one centre, one solution.For more information, call 0800 250250or email us at [email protected]
Safer, Faster, Reliable
Please Turn Over
UGANDA SECURITIES EXCHANGE DEMATERIALIZATION PROCESS
Building your investment portfolio
Introduction The Uganda Securities Exchange, has to-date, operated a system where share certificates are issued to investors as evidence of their investment in listed companies. The system of issuing share certificates has posed a myriad of problems such as delays in issuance and dispatch of certificates, delays in verification of share certificates, loss, theft and forgeries of certificates.
With a view to addressing the above problems, the Uganda Securities Exchange, in collaboration with the key stakeholders, resolved to implement the dematerialization of share certificates.
What is dematerialization? Dematerialization refers to the conversion of share certificates (physical paper- form/ certificates or documents of title representing ownership of securities) to an electronic form which is domiciled directly with the Securities Central Depository
What is Securities Central Depository. SCD System is one in which securities belonging to a particular investor are deposited in the custody of an
electronic central depository such that transactions or transfers concerning such securities are executed in book entry form With the growth of the Uganda Securities Exchange, it is necessary that all share certificates are dematerialized. This is to improve the customers experience within the capital market, improve the velocity of trading, improve security of shareholding (avoid loss of paper based certificates) and better turnaround timelines for settlement between the purchase and sale of securities.
Common issues affecting physical shares verification that will be avoided • Irregular signature by shareholder • Incomplete shareholder bank details • Incorrect/incomplete details on certificate Benefits of
Dematerialization: • Eradication of risk of loss of share certificate either by
misplacement, mutilation, theft, etc. • Reduction in the occurrence of forging of share certificates
which would lead to loss of investment. • Removal of delays and costs associated with dispatch of
share certificates. • Facilitation of increased trading in shares.

128 Stanbic Bank Uganda Limited Annual report and Financial Statements for the year ended 31 December, 2015
SUPPLEMENTARY INFORMATION
FOR MORE INFORMATION PLEASE CONTACT;
UGANDA SECURITIES EXCHANGE UAP NAKAWA BUSINESS PARK, PLOT 3 – 5, NEW PORT BELL ROAD, BLOCK A, 4TH FLOOR P. O. Box 23552, KAMPALA. Tel: +256 -312- 370-815, 370-817, 370-818 Email: [email protected]. Website: www.use.or.ug. Contact: [email protected] or [email protected].
Benefits of Dematerialization: • Eradication of risk of loss of share certificate either by
misplacement, mutilation, theft, etc. • Reduction in the occurrence of forging of share certificates
which would lead to loss of investment. • Removal of delays and costs associated with dispatch of
share certificates. • Facilitation of increased trading in shares.• It provides more acceptability and liquidity of securities
in the capital market there by building confidence in the capital market and attracting foreign investors.
• It provides a safe, convenient and efficient way to hold securities.
• Enables faster transfer of stocks from one account to another.
• Efficiency in the settlement of trades making the whole process of buying and selling more transparent.
• It ensures faster payment on sale of shares and allows for a shorter transaction cycle.
• Provides a foundation for the achievement of e-dividend and e-bonus.
• Positioning the Uganda Securities Exchange as internationally competitive and transparent.
How does a Shareholder dematerialize their shares?
The dematerialization process necessitates an investor to open an account in the depository through a stockbroker or custodian. This will be done after the shareholder has fulfilled the Know Your Client (KYC) requirements of the stockbroker/custodial firm. Thereafter, the shareholder can submit their share certificates to the stockbroker/custodian for dematerialization. 1. Typically, the shareholder will be required to submit a
verified/share transfer form which is then forwarded with the certificates alongside other operational documents to the Registrar for verification.
2. Upon certification that the details and signature provided by the share holder are correct, the share certificates are verified by the Registrar.
3. The share certificates verified by the Registrar are then sent to the depository for electronic capture.
4. The depository updates the shareholder’s account with the corresponding securities and is thus available for trading.
5. Shareholders can request for a statement of account detailing the shareholding position held although the depository provides statements every six months Regulation on dematerialization.
Regulation on dematerialization
Prescription of dematerialized securities under Section 26 of the Securities Central Depository Act 2009.
The following process is to be followed in prescribing a security listed on the Exchange as a dematerialized security. The SCD may after consultation with an issuer prescribe
an immobilized security, or class of securities, as a dematerialized security.
Upon being notified by the SCD of the prescription, an issuer of a dematerialized security shall give notice to the public that the security shall on the dematerialization date, become a dematerialized security
The notice shall identify the security to be dematerialized and shall specify a dematerialization date, not being less than one month after the date of publication of the notice, on or before which that security shall become dematerialized.
An issuer shall do all things necessary to amend its deed of establishment, trust deed, constitution or articles of association as the case may be, to give effect and comply with the Act and SCD Rules within one hundred and twenty days after the notice.
Issuers’ obligations post prescribed dematerialization date under Section 27 of the SCD Act 2009
After the dematerialization date, every issuer of a security prescribed as a dematerialized security shall surrender the physical register of members or debenture holders, as the case may be, to the depository.
The issuer will be required to provide information to the depository of any member or debenture holder who appears in the appropriate register as a holder of a certificate not already immobilized by the depository.
The official record should include the name and particulars of—
i) Every depositor with an immobilized security credited to a securities account held by that depositor; and
ii) Where the prescribed security is issued by a listed company, every member or holder whose name would, appear in the appropriate register of members of that company.
An issuer shall not, after the dematerialization date issue a certificate in respect of a dematerialized security.

129Stanbic Bank Uganda Limited Annual report and Financial Statements for the year ended 31 December, 2015
SUPPLEMENTARY INFORMATION
FOR MORE INFORMATION PLEASE CONTACT;
UGANDA SECURITIES EXCHANGE UAP NAKAWA BUSINESS PARK, PLOT 3 – 5, NEW PORT BELL ROAD, BLOCK A, 4TH FLOOR P. O. Box 23552, KAMPALA. Tel: +256 -312- 370-815, 370-817, 370-818 Email: [email protected]. Website: www.use.or.ug. Contact: [email protected] or [email protected].
Benefits of Dematerialization: • Eradication of risk of loss of share certificate either by
misplacement, mutilation, theft, etc. • Reduction in the occurrence of forging of share certificates
which would lead to loss of investment. • Removal of delays and costs associated with dispatch of
share certificates. • Facilitation of increased trading in shares.• It provides more acceptability and liquidity of securities
in the capital market there by building confidence in the capital market and attracting foreign investors.
• It provides a safe, convenient and efficient way to hold securities.
• Enables faster transfer of stocks from one account to another.
• Efficiency in the settlement of trades making the whole process of buying and selling more transparent.
• It ensures faster payment on sale of shares and allows for a shorter transaction cycle.
• Provides a foundation for the achievement of e-dividend and e-bonus.
• Positioning the Uganda Securities Exchange as internationally competitive and transparent.
How does a Shareholder dematerialize their shares?
The dematerialization process necessitates an investor to open an account in the depository through a stockbroker or custodian. This will be done after the shareholder has fulfilled the Know Your Client (KYC) requirements of the stockbroker/custodial firm. Thereafter, the shareholder can submit their share certificates to the stockbroker/custodian for dematerialization. 1. Typically, the shareholder will be required to submit a
verified/share transfer form which is then forwarded with the certificates alongside other operational documents to the Registrar for verification.
2. Upon certification that the details and signature provided by the share holder are correct, the share certificates are verified by the Registrar.
3. The share certificates verified by the Registrar are then sent to the depository for electronic capture.
4. The depository updates the shareholder’s account with the corresponding securities and is thus available for trading.
5. Shareholders can request for a statement of account detailing the shareholding position held although the depository provides statements every six months Regulation on dematerialization.
Regulation on dematerialization
Prescription of dematerialized securities under Section 26 of the Securities Central Depository Act 2009.
The following process is to be followed in prescribing a security listed on the Exchange as a dematerialized security. The SCD may after consultation with an issuer prescribe
an immobilized security, or class of securities, as a dematerialized security.
Upon being notified by the SCD of the prescription, an issuer of a dematerialized security shall give notice to the public that the security shall on the dematerialization date, become a dematerialized security
The notice shall identify the security to be dematerialized and shall specify a dematerialization date, not being less than one month after the date of publication of the notice, on or before which that security shall become dematerialized.
An issuer shall do all things necessary to amend its deed of establishment, trust deed, constitution or articles of association as the case may be, to give effect and comply with the Act and SCD Rules within one hundred and twenty days after the notice.
Issuers’ obligations post prescribed dematerialization date under Section 27 of the SCD Act 2009
After the dematerialization date, every issuer of a security prescribed as a dematerialized security shall surrender the physical register of members or debenture holders, as the case may be, to the depository.
The issuer will be required to provide information to the depository of any member or debenture holder who appears in the appropriate register as a holder of a certificate not already immobilized by the depository.
The official record should include the name and particulars of—
i) Every depositor with an immobilized security credited to a securities account held by that depositor; and
ii) Where the prescribed security is issued by a listed company, every member or holder whose name would, appear in the appropriate register of members of that company.
An issuer shall not, after the dematerialization date issue a certificate in respect of a dematerialized security.

130 Stanbic Bank Uganda Limited Annual report and Financial Statements for the year ended 31 December, 2015
SUPPLEMENTARY INFORMATION
Stanbic Bank Uganda Limited. A financial institution regulated by Bank of Uganda. License Number A1. 013
Community bankingYour partner in transforming lives for a better Uganda
With our dedicated relationship management team and deep understanding of your needs, we deliver tailored solutions to support the great work that you do. We offer discounted banking that allows you to transact conveniently through payments, receipts, savings and online. Together we will provide solutions for the many challenges that lie ahead.
We focus on simplifying your banking so that you focus on transforming lives. Let’s move forward together.
stanbicbank.co.ug/uganda
“Our Focus?”“Your Simplicity.”
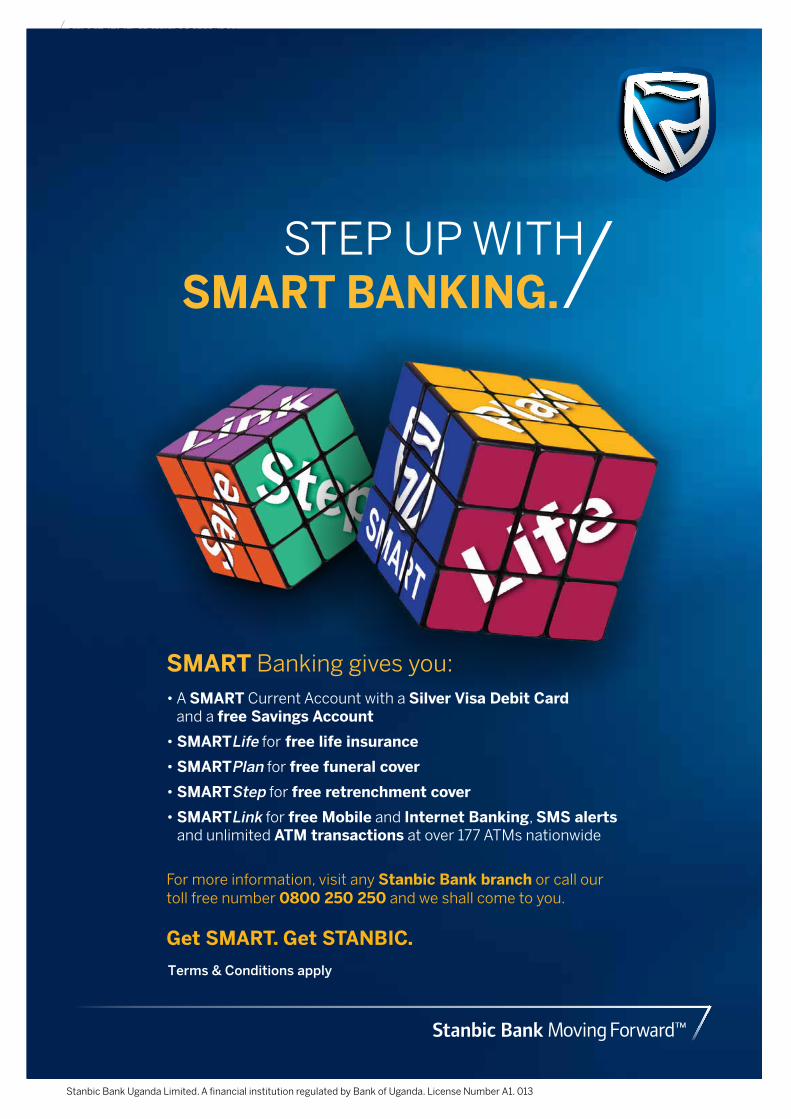
131Stanbic Bank Uganda Limited Annual report and Financial Statements for the year ended 31 December, 2015
SUPPLEMENTARY INFORMATION
Stanbic Bank Uganda Limited. A financial institution regulated by Bank of Uganda. License Number A1. 013
For more information, visit any Stanbic Bank branch or call our toll free number 0800 250 250 and we shall come to you.
Get SMART. Get STANBIC.
SMART Banking gives you:• A SMART Current Account with a Silver Visa Debit Card
and a free Savings Account
• SMARTLife for free life insurance
• SMARTPlan for free funeral cover
• SMARTStep for free retrenchment cover
• SMARTLink for free Mobile and Internet Banking, SMS alerts and unlimited ATM transactions at over 177 ATMs nationwide
STEP UP WITHSMART BANKING.
Terms & Conditions apply