Embed Size (px)
Citation preview
Stalker Traffic Statistics App Easy-to-use, full-featured traffic statistical analysis application
011‐0146‐00 Rev B

011‐0146‐00 Rev B ‐ Stalker Traffic Statistics App ............................................................................. 2
011‐0146‐00 Rev B ‐ Stalker Traffic Statistics App ............................................................................. 3
1 INTRODUCTION ......................................................................................................................................... 5
2 CONNECTING TO THE RADAR UNIT ............................................................................................................. 6
2.1 AUTO DETECT. ................................................................................................................................................. 7
2.2 MANUAL CONNECT. .......................................................................................................................................... 7
2.3 UPLOAD SENSOR DATA. ..................................................................................................................................... 7
2.4 CLEAR SENSOR MEMORY. ................................................................................................................................... 7
3 PROCESSING AND REVIEWING SURVEY DATA ............................................................................................. 7
4 EXTRACTING & PROCESSING RAW EXTERNAL SURVEY DATA ....................................................................... 8
5 SETTING UP A SURVEY ............................................................................................................................... 9
5.1 SURVEY NAME .................................................................................................................................................. 9
5.2 SURVEY ADDRESS .............................................................................................................................................. 9
5.3 ZONE .............................................................................................................................................................. 9
5.4 TRAFFIC DIRECTION ......................................................................................................................................... 10
5.5 UNIT OF SPEED ............................................................................................................................................... 10
5.6 SPEED LIMIT ................................................................................................................................................... 10
5.7 SURVEY DIRECTION .......................................................................................................................................... 10
5.8 INTERNAL/EXTERNAL MEMORY ......................................................................................................................... 10
5.9 SPEED RESOLUTION ......................................................................................................................................... 10
5.10 TIME RESOLUTION ........................................................................................................................................... 10
5.11 VEHICLE CLASSIFICATION .................................................................................................................................. 11
5.12 MINIMUM FOLLOWING TIME ............................................................................................................................ 11
5.13 MAXIMUM AND MINIMUM SPEEDS .................................................................................................................... 11
5.14 CALCULATED OPERATION TIME .......................................................................................................................... 11
5.15 DESCRIPTION .................................................................................................................................................. 12
5.16 SAVE BUTTON ................................................................................................................................................ 12
6 SETTING UP A SURVEY CALENDAR ............................................................................................................. 13
6.1 SURVEY MODE. .............................................................................................................................................. 13
6.1.1 Always On .............................................................................................................................................. 13
6.1.2 Continuous Period .................................................................................................................................. 13
6.1.3 Daily Schedule ........................................................................................................................................ 13
6.1.4 Selected Days ......................................................................................................................................... 13
6.2 CURRENT SENSOR TIME. ................................................................................................................................... 14
6.2.1 Read Sensor: .......................................................................................................................................... 14
6.2.2 Use Computer Time: .............................................................................................................................. 14
6.2.3 Save To Sensor: ...................................................................................................................................... 14
7 SURVEY ANALYSIS ..................................................................................................................................... 14
7.1 GRAPHING WINDOW ....................................................................................................................................... 15
7.2 SURVEY DESCRIPTION ...................................................................................................................................... 16
7.3 TRAFFIC STATISTICS ......................................................................................................................................... 16
7.3.1 Statistic Start/Statistics Stop.................................................................................................................. 16
8 DISPLAY CONTROLS .................................................................................................................................. 17
011‐0146‐00 Rev B ‐ Stalker Traffic Statistics App ............................................................................. 4
8.1 DATA DISPLAYED ............................................................................................................................................. 17
8.2 RESOLUTIONSETTINGS. ................................................................................................................................. 19 8.3 FILTERS ....................................................................................................................................................... 19 8.4 GRIDLINES ................................................................................................................................................... 20 8.5 THIRD PLOT DIMENSION ................................................................................................................................... 21
8.6 TABULARDATA ............................................................................................................................................ 22 8.7 CHART TYPE ................................................................................................................................................... 22
9 REVENUE CONTROLS ................................................................................................................................. 23
10 GENERATING A SURVEY REPORT ............................................................................................................... 23
10.1 REPORTWINDOW ......................................................................................................................................... 24
10.2 PRINT PREVIEW .............................................................................................................................................. 25
10.3 PRINTING ...................................................................................................................................................... 25
11 EXPORTING SURVEY DATA ........................................................................................................................ 26
011‐0146‐00 Rev B ‐ Stalker Traffic Statistics App ............................................................................. 5
1 IntroductionThis document provides resources for operating Applied Concepts, Inc., Stalker Traffic Statistics App,
radar sensor setup, and survey data extraction. This document also provides instructions for analyzing
the survey data and creating related reports.
Stalker Traffic Statistics App is a PC application designed to operate with 32‐ or 64‐bit Microsoft
Windows XP, Windows Vista, and Windows 7 Operating Systems.
The intended users are law enforcement, traffic engineers, traffic technicians, city maintenance
personnel, and other government safety officers. The application is designed to be easy to use and
provides graphic reports for survey data analysis.
011‐0146‐00 Rev B ‐ Stalker Traffic Statistics App ............................................................................. 6
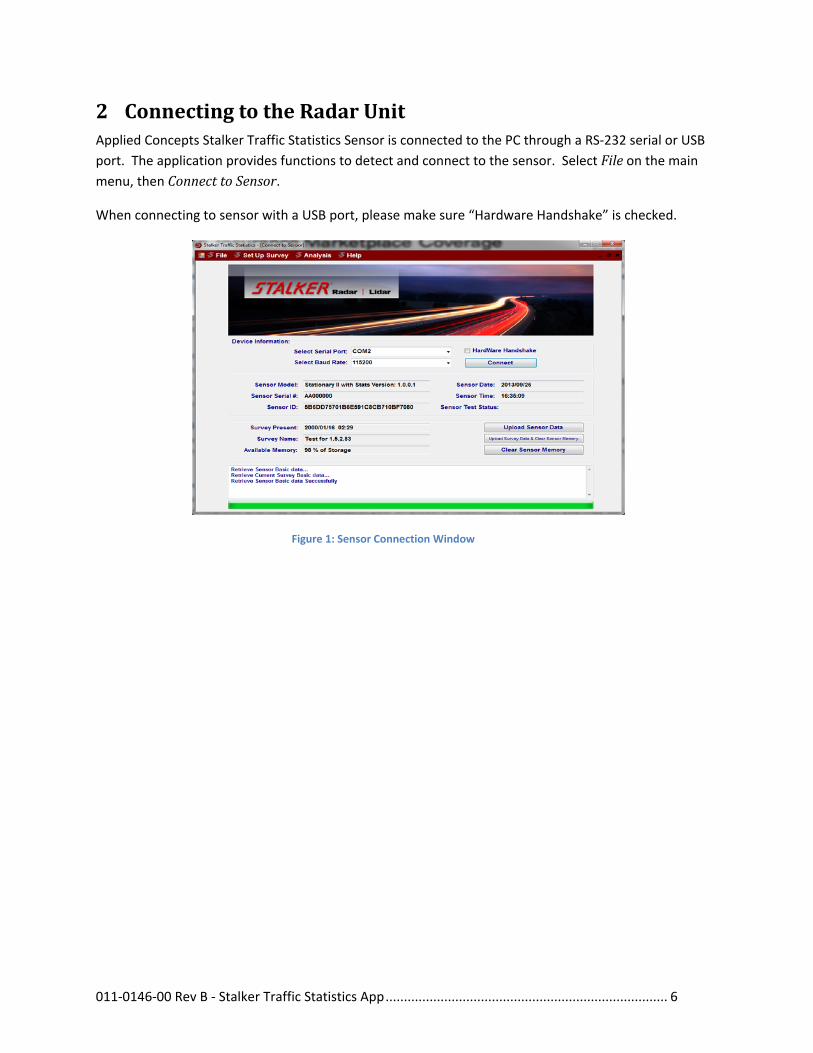
2 ConnectingtotheRadarUnitApplied Concepts Stalker Traffic Statistics Sensor is connected to the PC through a RS‐232 serial or USB
port. The application provides functions to detect and connect to the sensor. Select File on the main
menu, then ConnecttoSensor.
When connecting to sensor with a USB port, please make sure “Hardware Handshake” is checked.
Figure 1: Sensor Connection Window
011‐0146‐00 Rev B ‐ Stalker Traffic Statistics App ............................................................................. 7
2.1 AutoDetect.In the DeviceInformation: box, select AutoDetect... from the SelectSerialPort: dropdown list, then select the Connect button to start radar sensor auto detect. The application will scan all available ports (15) and Baud Rates (1200 – 115200) for the Radar sensor. As soon as the unit is detected, the
application extracts basic sensor information and enables other functional buttons. Information
windows shows procedure progress or error.
2.2 ManualConnect. If the correct port and baud rate are known, the user can select the serial port and choose the baud
rate, then select Connect to connect to the sensor.
2.3 UploadSensorData.If there is survey data stored in the sensor, the SurveyPresent field shows the survey data's date and time. Select UploadSensorData button to extract survey data. Survey data is stored in the folder created at installation, My Documents\StalkerStats in XML format.
2.4 ClearSensorMemory.The user has the option to UploadSurveyData&ClearSensorMemory or just ClearSensorMemory. If confirmed, the Radar survey data will be removed from the sensor.
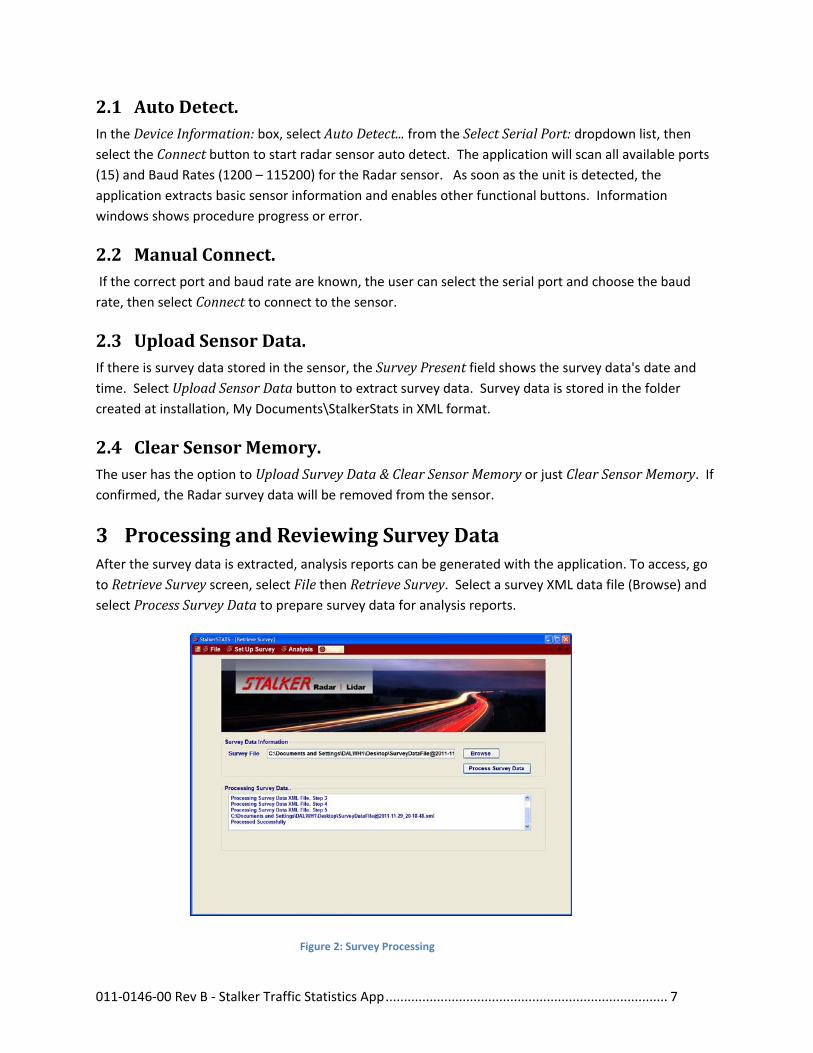
3 ProcessingandReviewingSurveyDataAfter the survey data is extracted, analysis reports can be generated with the application. To access, go
to RetrieveSurvey screen, select File then RetrieveSurvey. Select a survey XML data file (Browse) and
select ProcessSurveyData to prepare survey data for analysis reports.
Figure 2: Survey Processing
011‐0146‐00 Rev B ‐ Stalker Traffic Statistics App ............................................................................. 8
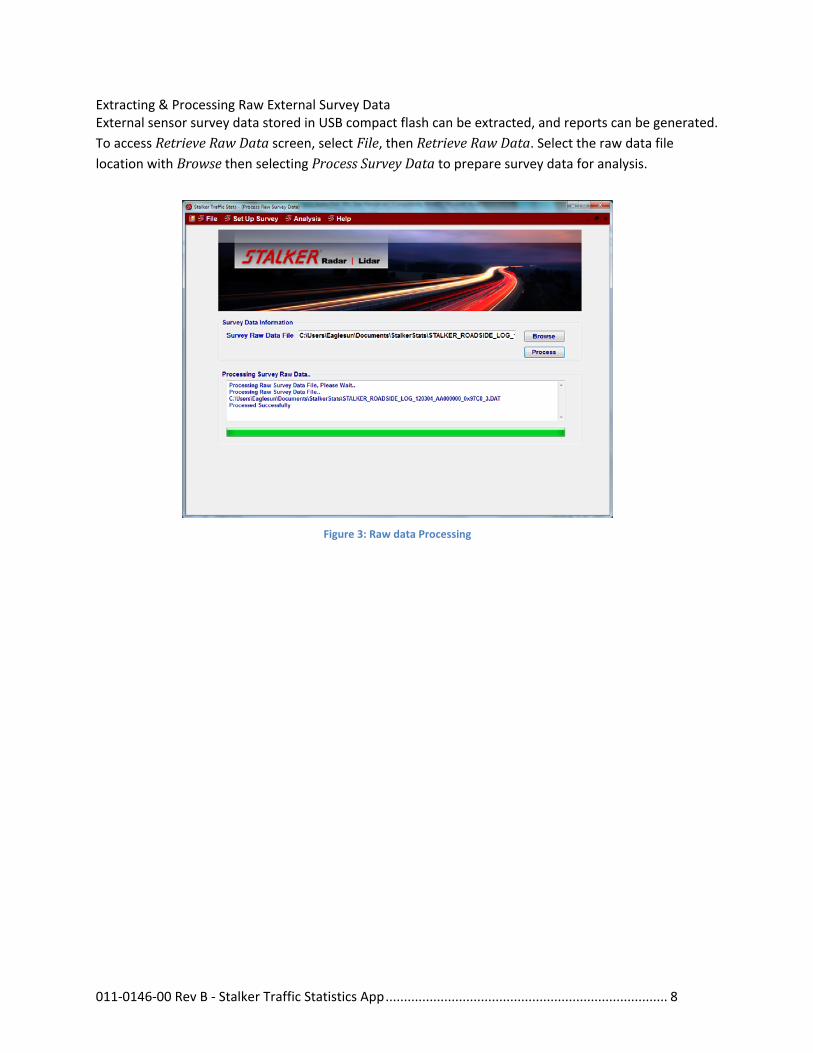
Extracting & Processing Raw External Survey Data External sensor survey data stored in USB compact flash can be extracted, and reports can be generated.
To access RetrieveRawData screen, select File, then RetrieveRawData. Select the raw data file location with Browse then selecting ProcessSurveyData to prepare survey data for analysis.
Figure 3: Raw data Processing
011‐0146‐00 Rev B ‐ Stalker Traffic Statistics App ............................................................................. 9
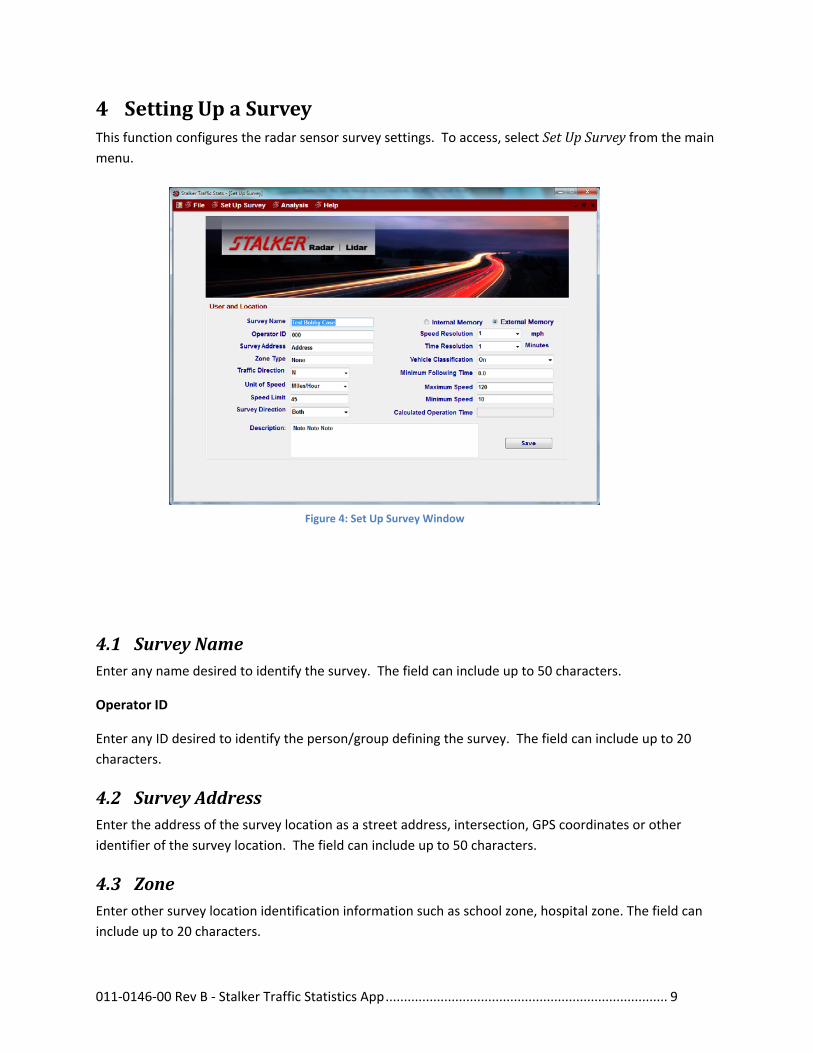
4 SettingUpaSurveyThis function configures the radar sensor survey settings. To access, select SetUpSurvey from the main
menu.
4.1 SurveyNameEnter any name desired to identify the survey. The field can include up to 50 characters.
Operator ID
Enter any ID desired to identify the person/group defining the survey. The field can include up to 20
characters.
4.2 SurveyAddressEnter the address of the survey location as a street address, intersection, GPS coordinates or other
identifier of the survey location. The field can include up to 50 characters.
4.3 ZoneEnter other survey location identification information such as school zone, hospital zone. The field can
include up to 20 characters.
Figure 4: Set Up Survey Window
011‐0146‐00 Rev B ‐ Stalker Traffic Statistics App ............................................................................. 10
4.4 TrafficDirectionEnter information relative to traffic direction in this field. NE above signifies traffic moving in a
northeast‐bound direction. A pull‐down with options is provided.
4.5 UnitofSpeedSelect between MPH, km/h, knots, meters/sec, or feet/sec. These choices correlate to the available
configuration settings of the sensor. When a stored survey in the sensor is activated, this setting will
override any other configuration setting which may have been made using the Dashboard configuration
app. This ensures that the desired survey setting is used when gathering statistics.
4.6 SpeedLimitEnter the speed limit of the survey location here.
4.7 SurveyDirectionSelect between Both, Closing and Away. As with the Unit of Speed above, these choices correlate to the
sensor’s configuration setting and will override a sensor setting when a survey is activated.
4.8 Internal/ExternalMemoryChoose Internal or External. Select Internal Memory to save all survey results inside the non‐volatile
memory of the sensor itself. After the survey has run, the sensor can be connected to a PC running this
app again to extract the survey data for analysis.
If External Memory is selected, the sensor does not retain the survey data internally. It can be
configured to stream the raw stats records out a serial port by enabling a COM port’s Statistics Record
Messages setting.
4.9 SpeedResolutionSelect 1, 2, 5, or 10 MPH from the pull‐down menu. (If the Unit of Speed is changed to km/h, for
example, the setting is understood as 1, 2, 5, or 10 km/h.) This is the size of “bucket” used to collect
statsitical information. Using a low setting like 1 causes the sensor to keep counts for each MPH and
uses up its available memory faster. Using a higher number like 10 causes the unit to keep counts for 1‐
10, 11‐20, 21‐30… MPH spans and reduces the amount of memory required for the counts. However,
using these larger spans of speeds reduces the level of analysis possible after the survey has been
completed.
4.10 TimeResolutionSelect 1, 2, 5, 10, 30, or 60 minutes from the pull‐down menu. As above for the Speed Resolution, this
setting affects how targets are counted and stored in stats memory. For a 1‐minute setting, speed
counts are stored each minute. This allows for the highest level of analysis detail but requires more
011‐0146‐00 Rev B ‐ Stalker Traffic Statistics App ............................................................................. 11
memory space. Conversely, storing data in 60‐minute periods allows many more periods of data to be
saved, but it reduces in‐depth analysis capabilities.
4.11 VehicleClassificationTurn classification on or off here. As with the Speed and Time Resolution settings, this one also has an
effect on internal sensor memory usage. If classification is turned on, target counts are bucketized and
saved for each of the five classification levels. If off, all classes of vehicles are included in a single set of
counts for each period.
4.12 MinimumFollowingTimeThis setting can be used to require a minimum inter‐car gap between vehicles to be counted. Any
number between 0 and 10.0 seconds (in tenths) can be entered to require that no target is counted
unless it has that much time between itself and the preceding target. This can be helpful to leave
vehicles out of a survey if there is another vehicle in front of them that might preclude them from
proceeding at their desired speed.
4.13 MaximumandMinimumSpeedsUse these settings to define a range of speeds of interest. Only vehicles within this range are counted in
the statistics. As with other settings above, when a survey starts these values will override values that
may have been configured in the sensor using Dashboard. They also have an effect on internal stats
memory usage. A smaller speed range requires less stats memory and can increase the time a survey
can run before filling all available memory.
4.14 CalculatedOperationTimeThe time displayed in this field is a worst‐case estimate of the length of time a survey can run before
filling the sensor’s internal memory. It is affected by the following settings and is updated as they are
changed to give an idea of how different combinations result in different survey lengths: Survey
Direction, Speed Resolution, Time Resolution, Vehicle Classification, Maximum Speed and Minimum
Speed. Keep in mind that this is a worst‐case estimate; actual surveys can run longer due to
compression of data that is accomplished depending on actual traffic conditions.
As a baseline example, statistics data can be saved for over 61 days of continuous operation with the
following settings:
Survey Direction = Closing
Time Resolution = 5 Minute
Vehicle Classification = Off
Speed Resolution = 5 MPH
Min/Max Speed Range = 0‐100
011‐0146‐00 Rev B ‐ Stalker Traffic Statistics App ............................................................................. 12
The following paragraphs discuss the effects of changing each of the settings.
There would be no difference in operation time if the Survey Direction was changed to Away since the
unit would still be saving data for only one direction of travel. But, if Survey Direction was changed to
Both, the total survey time would be cut in half since the sensor would save two full sets of data: one for
closing targets and one for away targets.
If the Time Resolution was changed from 5 minutes to 10 minutes, the total survey time would double
since records are saved only half as often. Conversely, a change from 5 minutes to 1 minute would
result in a total survey time of one‐fifth the duration.
Vehicle Classification is turned off in the baseline example above. There are 5 classification levels, so
total survey time would be divided by 5 if classification was turned on since the sensor saves a full set of
data for each classification level.
Speed Resolution and Min/Max Speed Range also affect the total operation time but not as cleanly as
the settings discussed above which are simple multipliers or dividers of the total survey time. This is
because these settings affect the length of the records saved, not the number of records or how often
they are saved. The data records contain of a number of “buckets” defined by the speed range divided
by the speed resolution. For example a speed range of 0‐100 divided by a speed resolution of 5 results
in 20 buckets – one for each 5 mile per hour span. That same range of 0‐100 divided by a speed
resolution of 10 results in 10 buckets – one for each 10 MPH span. You might think that changing speed
resolution from 5 to 10 would result in twice the total survey time since there are half as many buckets
to save. But since there is also overhead data stored with each full record, two 10 bucket records take
more memory than a single 20 bucket record since each of the 10 bucket records have the same amount
of overhead as the single 20 bucket record. So the improvement factor achieved by changing these
settings is not as clean as changing other settings above due to the record overhead.
Finally, after all of the above considerations have been taken into account and the Traffic Stats app
displays the Calculated Operation Time, the actual total survey time will be longer due to compression
of the records made possible by the actual vehicle speeds counted in each time span. Since the amount
of compression depends on actual traffic conditions during the survey period, it is not possible to
quantify the expected improvement.
4.15 DescriptionThis field is available for any other notes that the user desires to save with the survey. Any text can be
entered up to 248 characters.
4.16 SaveButtonClick the Save button near the bottom, right‐hand corner of the screen to save the field settings to the
sensor. This initiates a complete erase of all statistics data saved in the unit and saves the new “survey”
definition there. This “survey” definition includes the entries on this Set Up Survey screen as well as the
entries on the Survey Calendar screen described below.
011‐0146‐00 Rev B ‐ Stalker Traffic Statistics App ............................................................................. 13
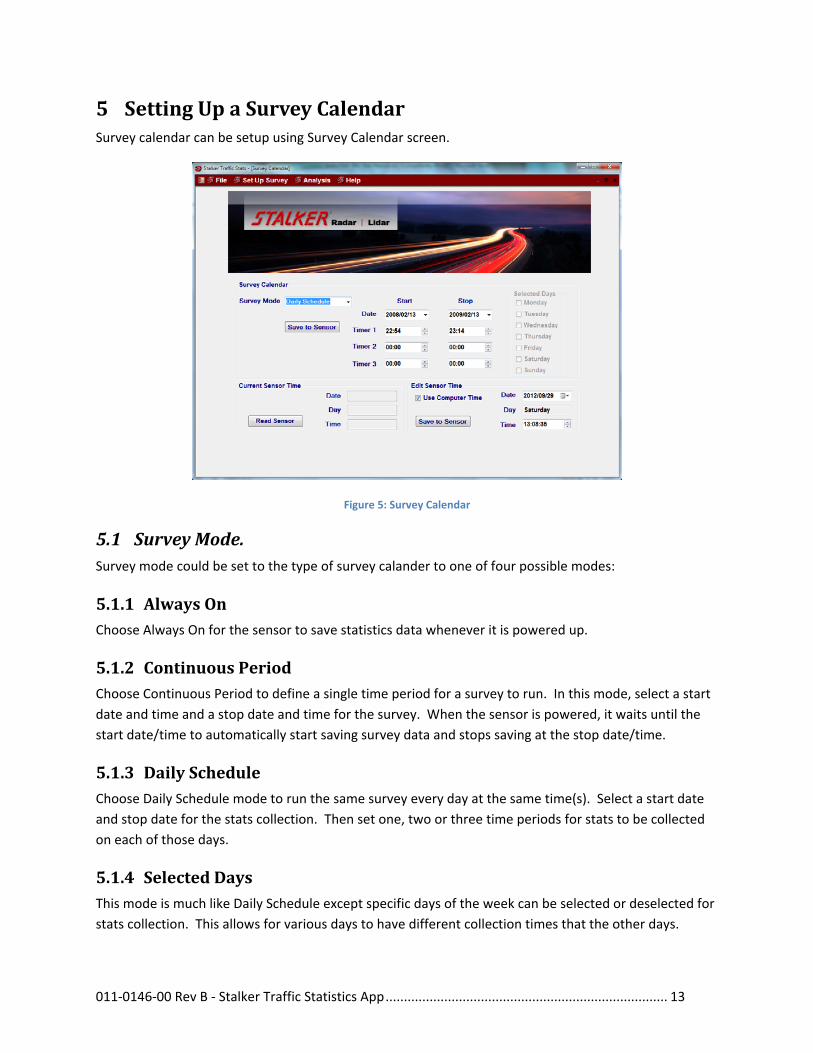
5 SettingUpaSurveyCalendarSurvey calendar can be setup using Survey Calendar screen.
Figure 5: Survey Calendar
5.1 SurveyMode.Survey mode could be set to the type of survey calander to one of four possible modes:
5.1.1 AlwaysOnChoose Always On for the sensor to save statistics data whenever it is powered up.
5.1.2 ContinuousPeriodChoose Continuous Period to define a single time period for a survey to run. In this mode, select a start
date and time and a stop date and time for the survey. When the sensor is powered, it waits until the
start date/time to automatically start saving survey data and stops saving at the stop date/time.
5.1.3 DailyScheduleChoose Daily Schedule mode to run the same survey every day at the same time(s). Select a start date
and stop date for the stats collection. Then set one, two or three time periods for stats to be collected
on each of those days.
5.1.4 SelectedDaysThis mode is much like Daily Schedule except specific days of the week can be selected or deselected for
stats collection. This allows for various days to have different collection times that the other days.
011‐0146‐00 Rev B ‐ Stalker Traffic Statistics App ............................................................................. 14
5.2 CurrentSensorTime.
5.2.1 ReadSensor:The user can read the current sensor’s time and date to verify it is correct.
5.2.2 UseComputerTime:Check this box to use the computers internal clock when setting the sensor's time. If the Box is not
checked the user can enter time and date directly into the time and date boxes.
5.2.3 SaveToSensor:This will send the current time and date shown in the time and date boxes to the sensor.
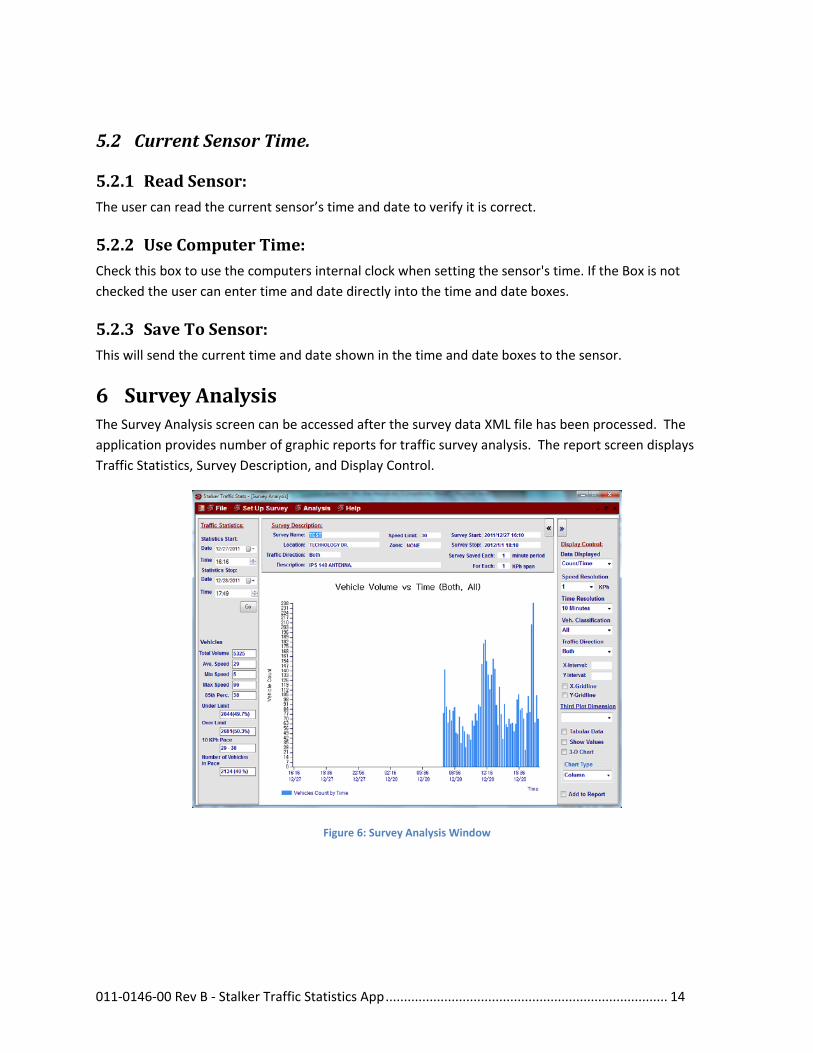
6 SurveyAnalysisThe Survey Analysis screen can be accessed after the survey data XML file has been processed. The
application provides number of graphic reports for traffic survey analysis. The report screen displays
Traffic Statistics, Survey Description, and Display Control.
Figure 6: Survey Analysis Window
011‐0146‐00 Rev B ‐ Stalker Traffic Statistics App ............................................................................. 15
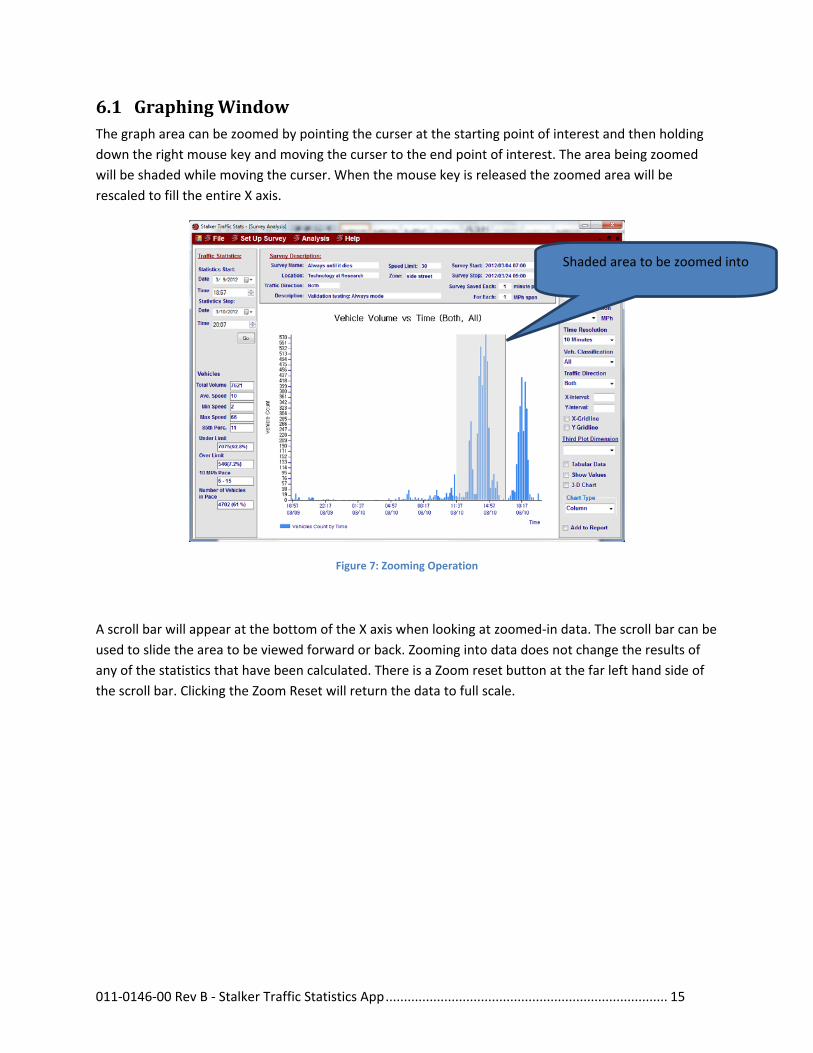
6.1 GraphingWindowThe graph area can be zoomed by pointing the curser at the starting point of interest and then holding
down the right mouse key and moving the curser to the end point of interest. The area being zoomed
will be shaded while moving the curser. When the mouse key is released the zoomed area will be
rescaled to fill the entire X axis.
Figure 7: Zooming Operation
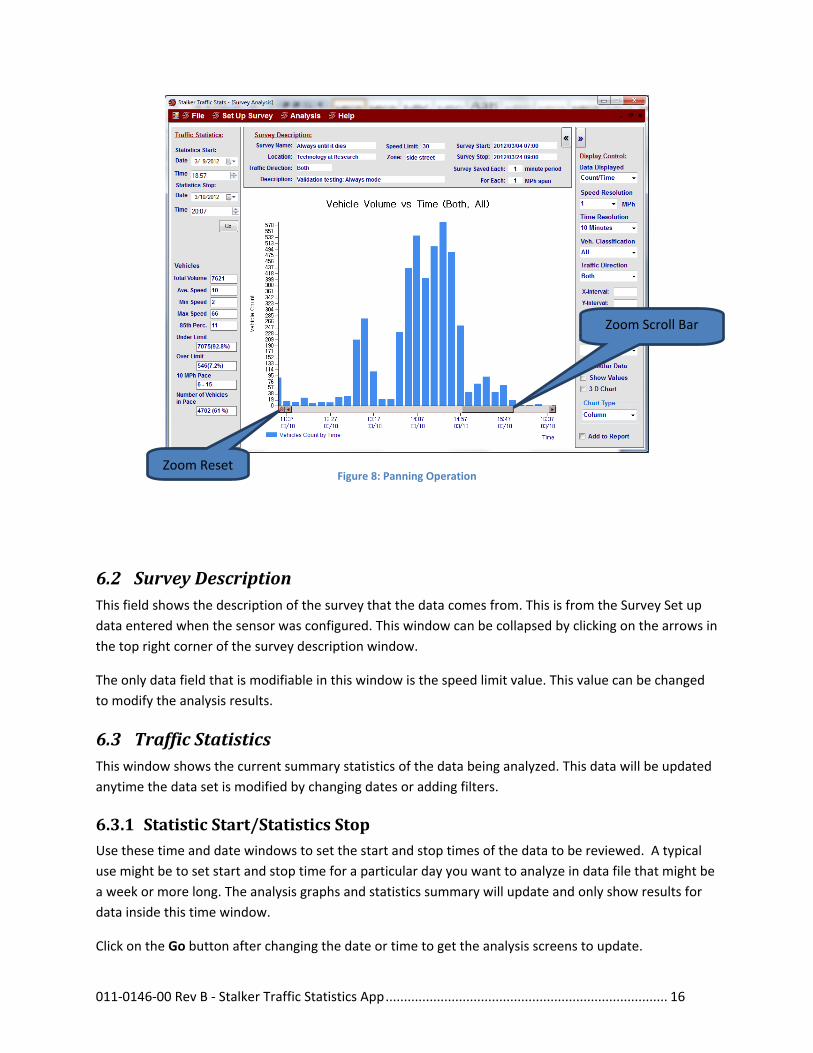
A scroll bar will appear at the bottom of the X axis when looking at zoomed‐in data. The scroll bar can be
used to slide the area to be viewed forward or back. Zooming into data does not change the results of
any of the statistics that have been calculated. There is a Zoom reset button at the far left hand side of
the scroll bar. Clicking the Zoom Reset will return the data to full scale.
Shaded area to be zoomed into
011‐0146‐00 Rev B ‐ Stalker Traffic Statistics App ............................................................................. 16
Figure 8: Panning Operation
6.2 SurveyDescriptionThis field shows the description of the survey that the data comes from. This is from the Survey Set up
data entered when the sensor was configured. This window can be collapsed by clicking on the arrows in
the top right corner of the survey description window.
The only data field that is modifiable in this window is the speed limit value. This value can be changed
to modify the analysis results.
6.3 TrafficStatisticsThis window shows the current summary statistics of the data being analyzed. This data will be updated
anytime the data set is modified by changing dates or adding filters.
6.3.1 StatisticStart/StatisticsStopUse these time and date windows to set the start and stop times of the data to be reviewed. A typical
use might be to set start and stop time for a particular day you want to analyze in data file that might be
a week or more long. The analysis graphs and statistics summary will update and only show results for
data inside this time window.
Click on the Go button after changing the date or time to get the analysis screens to update.
Zoom Scroll Bar
Zoom Reset
011‐0146‐00 Rev B ‐ Stalker Traffic Statistics App ............................................................................. 17
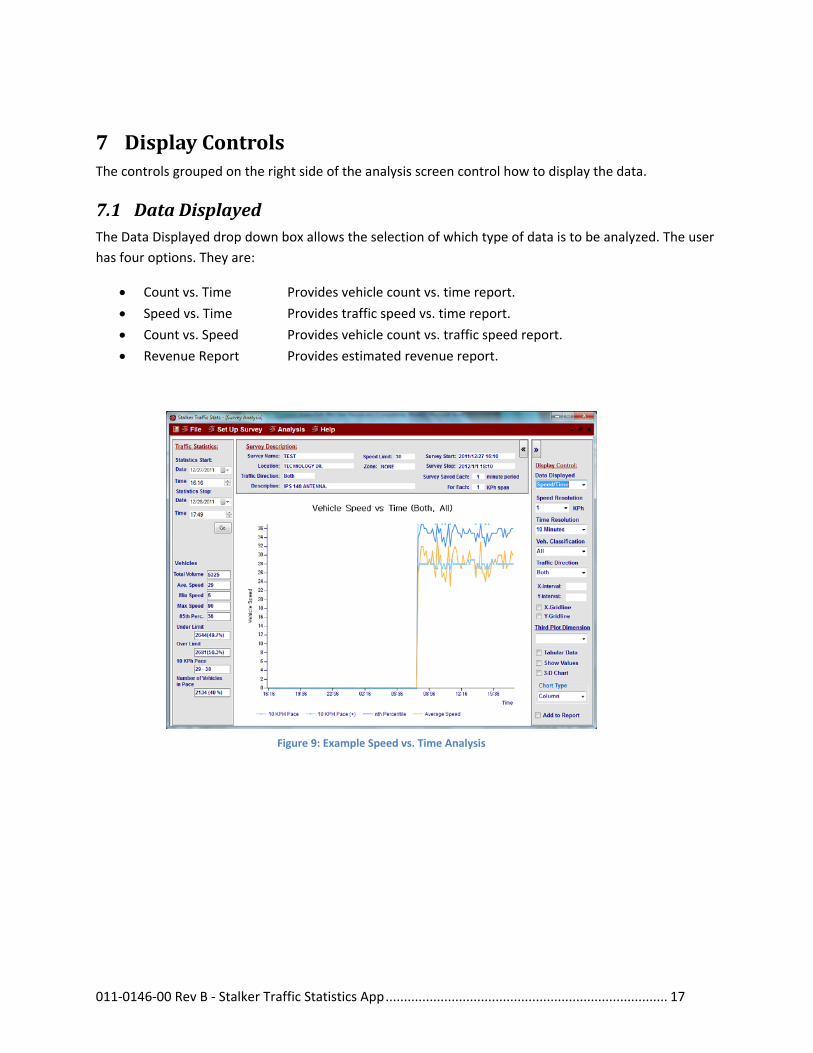
7 DisplayControlsThe controls grouped on the right side of the analysis screen control how to display the data.
7.1 DataDisplayedThe Data Displayed drop down box allows the selection of which type of data is to be analyzed. The user
has four options. They are:
Count vs. Time Provides vehicle count vs. time report.
Speed vs. Time Provides traffic speed vs. time report.
Count vs. Speed Provides vehicle count vs. traffic speed report.
Revenue Report Provides estimated revenue report.
Figure 9: Example Speed vs. Time Analysis
011‐0146‐00 Rev B ‐ Stalker Traffic Statistics App ............................................................................. 18
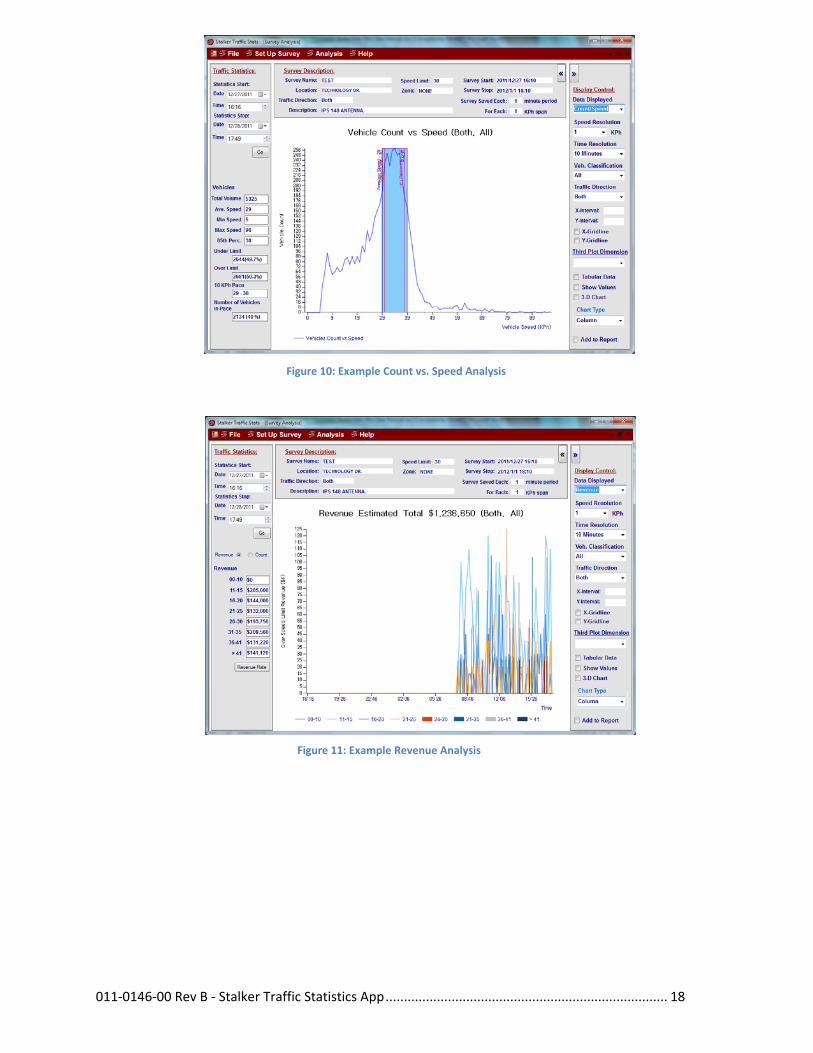
Figure 10: Example Count vs. Speed Analysis
Figure 11: Example Revenue Analysis
011‐0146‐00 Rev B ‐ Stalker Traffic Statistics App ............................................................................. 19
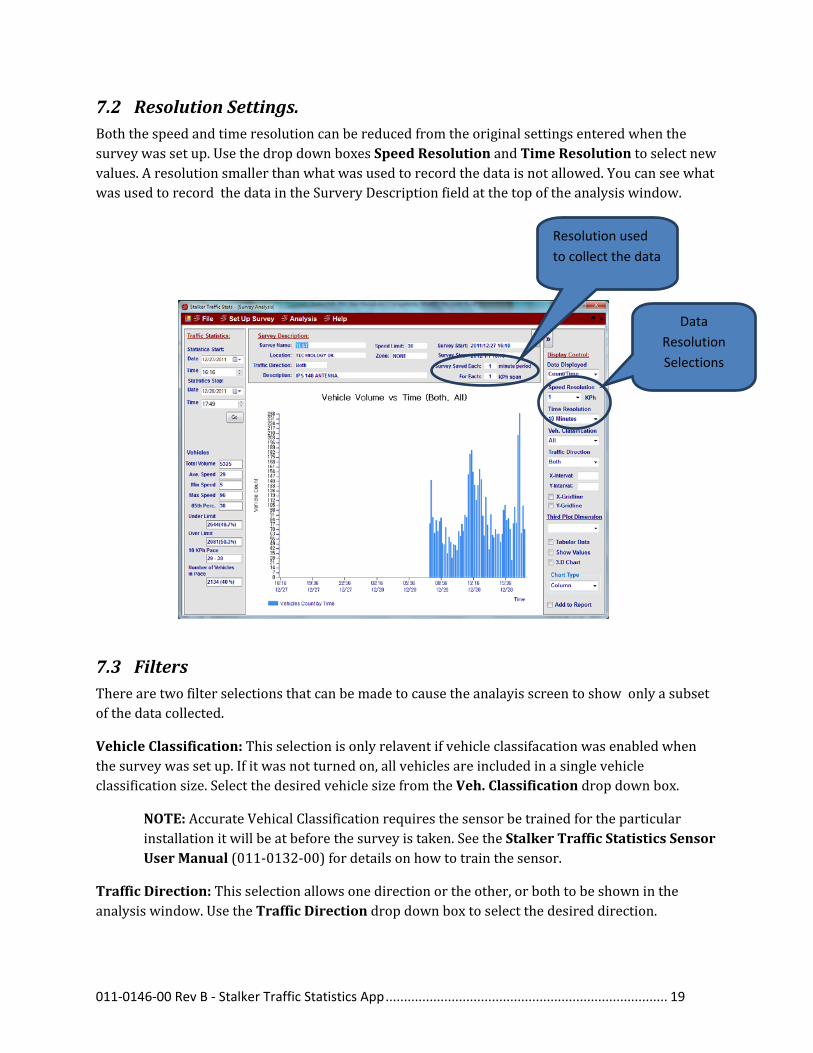
7.2 ResolutionSettings.Boththespeedandtimeresolutioncanbereducedfromtheoriginalsettingsenteredwhenthesurveywassetup.UsethedropdownboxesSpeedResolutionandTimeResolutiontoselectnewvalues.Aresolutionsmallerthanwhatwasusedtorecordthedataisnotallowed.YoucanseewhatwasusedtorecordthedataintheSurveryDescriptionfieldatthetopoftheanalysiswindow.
7.3 FiltersTherearetwofilterselectionsthatcanbemadetocausetheanalayisscreentoshowonlyasubsetofthedatacollected.
VehicleClassification:Thisselectionisonlyrelaventifvehicleclassifacationwasenabledwhenthesurveywassetup.Ifitwasnotturnedon,allvehiclesareincludedinasinglevehicleclassificationsize.SelectthedesiredvehiclesizefromtheVeh.Classificationdropdownbox.
NOTE:AccurateVehicalClassificationrequiresthesensorbetrainedfortheparticularinstallationitwillbeatbeforethesurveyistaken.SeetheStalkerTrafficStatisticsSensorUserManual(011‐0132‐00)fordetailsonhowtotrainthesensor.
TrafficDirection:Thisselectionallowsonedirectionortheother,orbothtobeshownintheanalysiswindow.UsetheTrafficDirectiondropdownboxtoselectthedesireddirection.
Data
Resolution
Selections
Resolution used
to collect the data
011‐0146‐00 Rev B ‐ Stalker Traffic Statistics App ............................................................................. 20
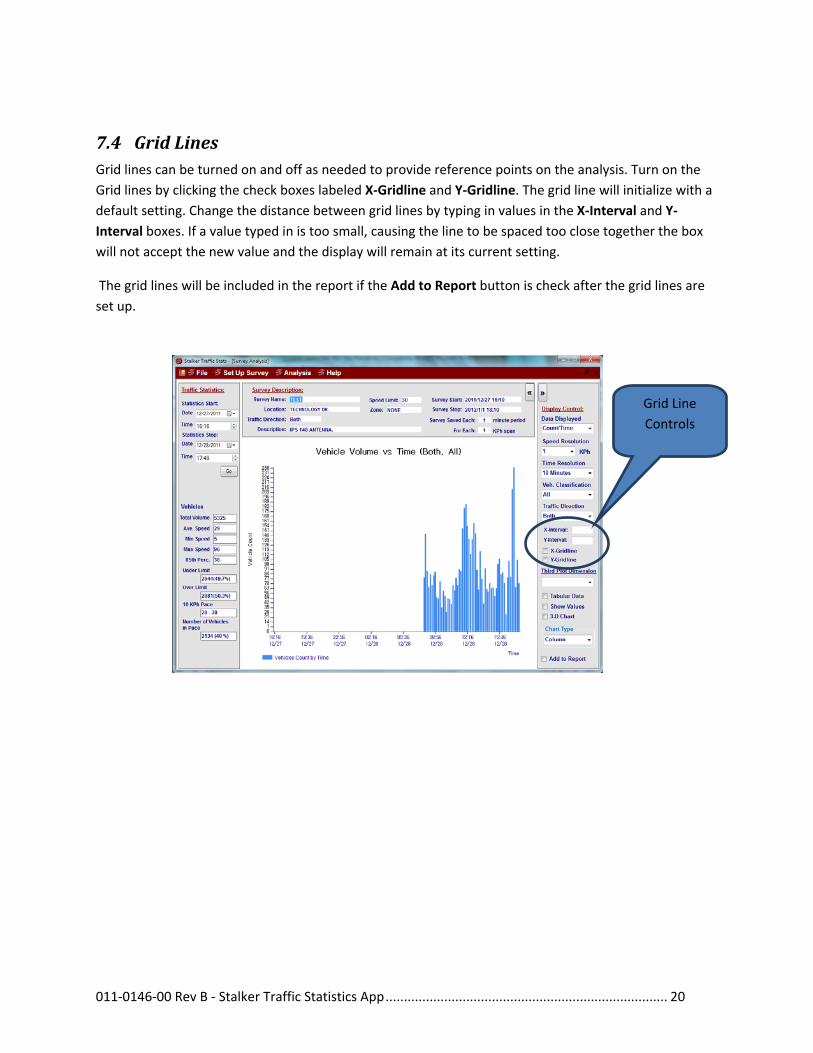
7.4 GridLinesGrid lines can be turned on and off as needed to provide reference points on the analysis. Turn on the
Grid lines by clicking the check boxes labeled X‐Gridline and Y‐Gridline. The grid line will initialize with a
default setting. Change the distance between grid lines by typing in values in the X‐Interval and Y‐
Interval boxes. If a value typed in is too small, causing the line to be spaced too close together the box
will not accept the new value and the display will remain at its current setting.
The grid lines will be included in the report if the Add to Report button is check after the grid lines are
set up.
Grid Line
Controls
011‐0146‐00 Rev B ‐ Stalker Traffic Statistics App ............................................................................. 21
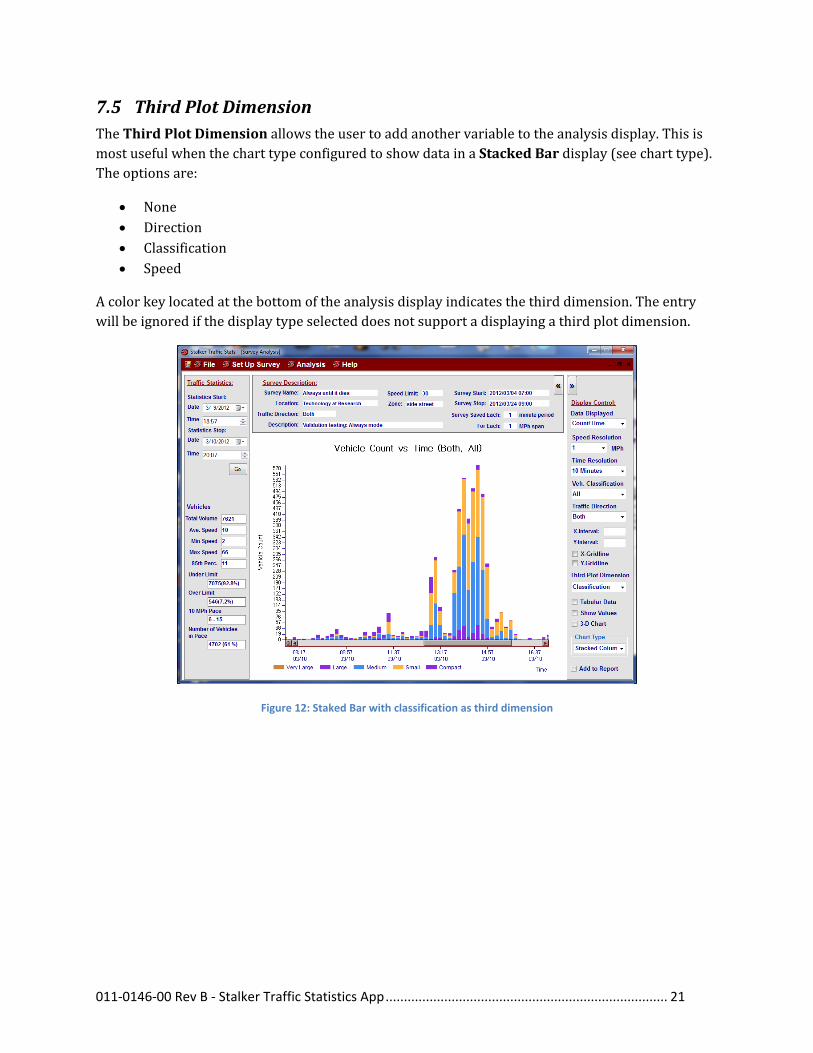
7.5 ThirdPlotDimensionTheThirdPlotDimensionallowstheusertoaddanothervariabletotheanalysisdisplay.ThisismostusefulwhenthecharttypeconfiguredtoshowdatainaStackedBardisplay(seecharttype).Theoptionsare:
None Direction Classification Speed
Acolorkeylocatedatthebottomoftheanalysisdisplayindicatesthethirddimension.Theentrywillbeignoredifthedisplaytypeselecteddoesnotsupportadisplayingathirdplotdimension.
Figure 12: Staked Bar with classification as third dimension
011‐0146‐00 Rev B ‐ Stalker Traffic Statistics App ............................................................................. 22
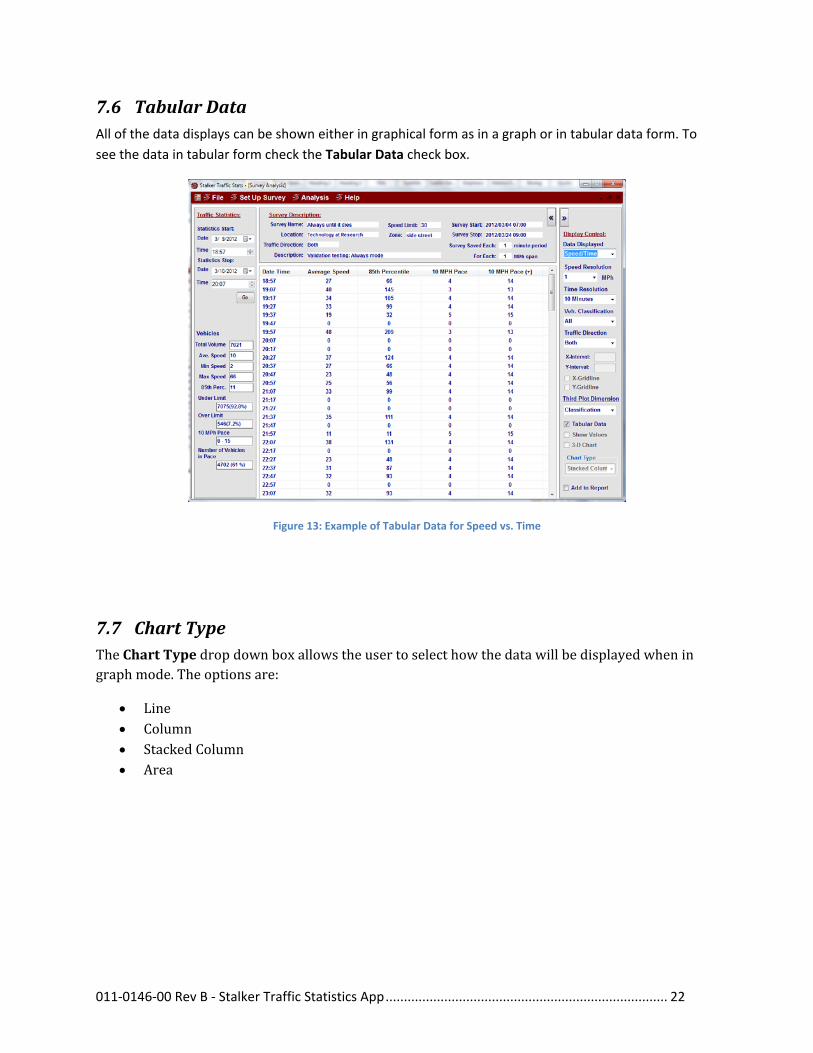
7.6 TabularDataAll of the data displays can be shown either in graphical form as in a graph or in tabular data form. To
see the data in tabular form check the Tabular Data check box.
Figure 13: Example of Tabular Data for Speed vs. Time
7.7 ChartTypeTheChartTypedropdownboxallowstheusertoselecthowthedatawillbedisplayedwheningraphmode.Theoptionsare:
Line Column StackedColumn Area
011‐0146‐00 Rev B ‐ Stalker Traffic Statistics App ............................................................................. 23
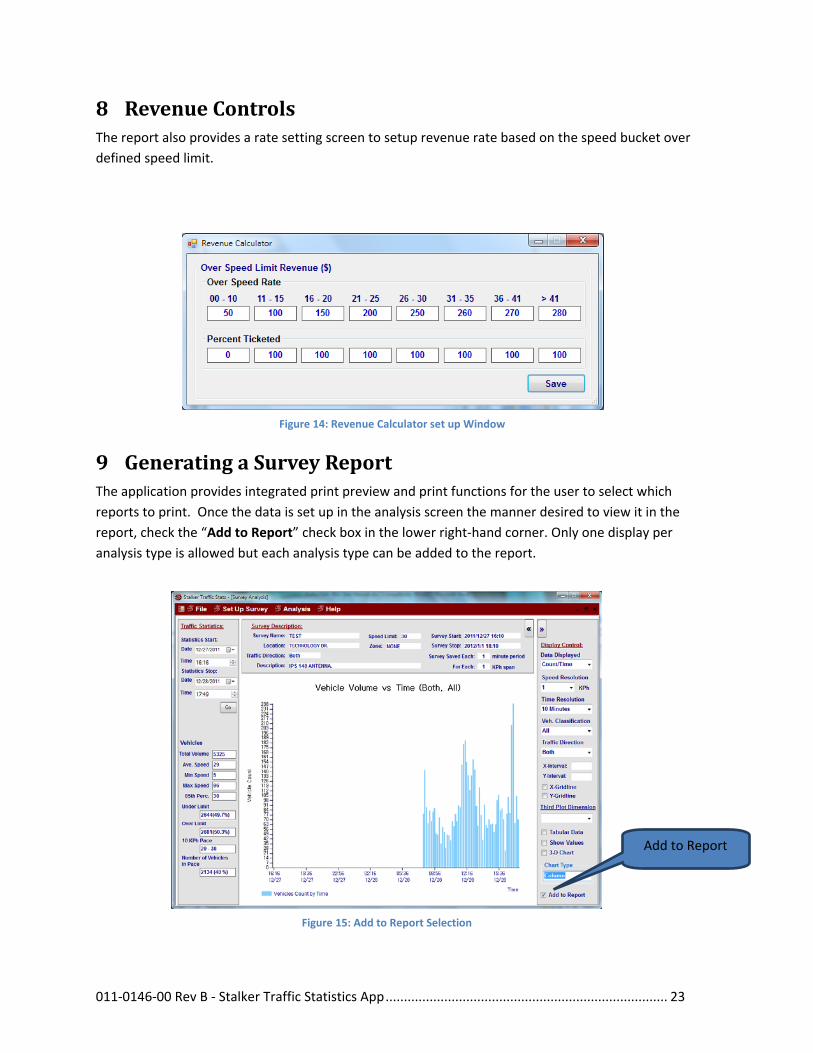
8 RevenueControlsThe report also provides a rate setting screen to setup revenue rate based on the speed bucket over
defined speed limit.
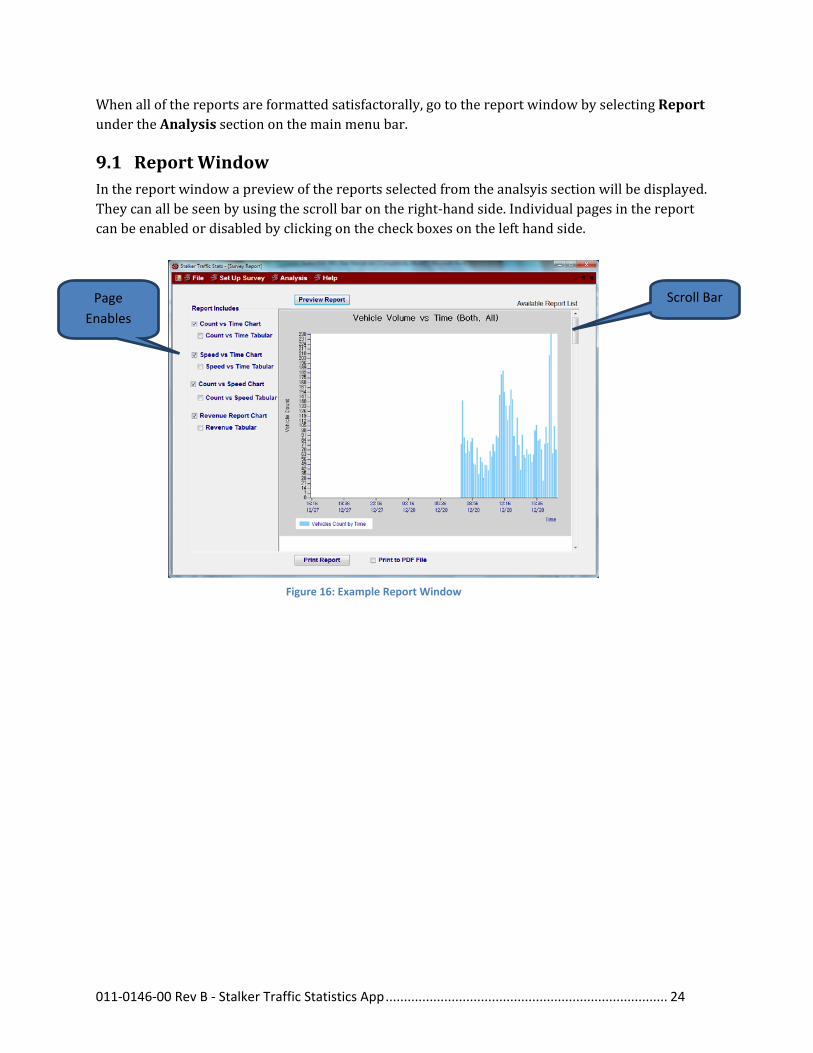
9 GeneratingaSurveyReportThe application provides integrated print preview and print functions for the user to select which
reports to print. Once the data is set up in the analysis screen the manner desired to view it in the
report, check the “Add to Report” check box in the lower right‐hand corner. Only one display per
analysis type is allowed but each analysis type can be added to the report.
Add to Report
Figure 15: Add to Report Selection
Figure 14: Revenue Calculator set up Window
011‐0146‐00 Rev B ‐ Stalker Traffic Statistics App ............................................................................. 24
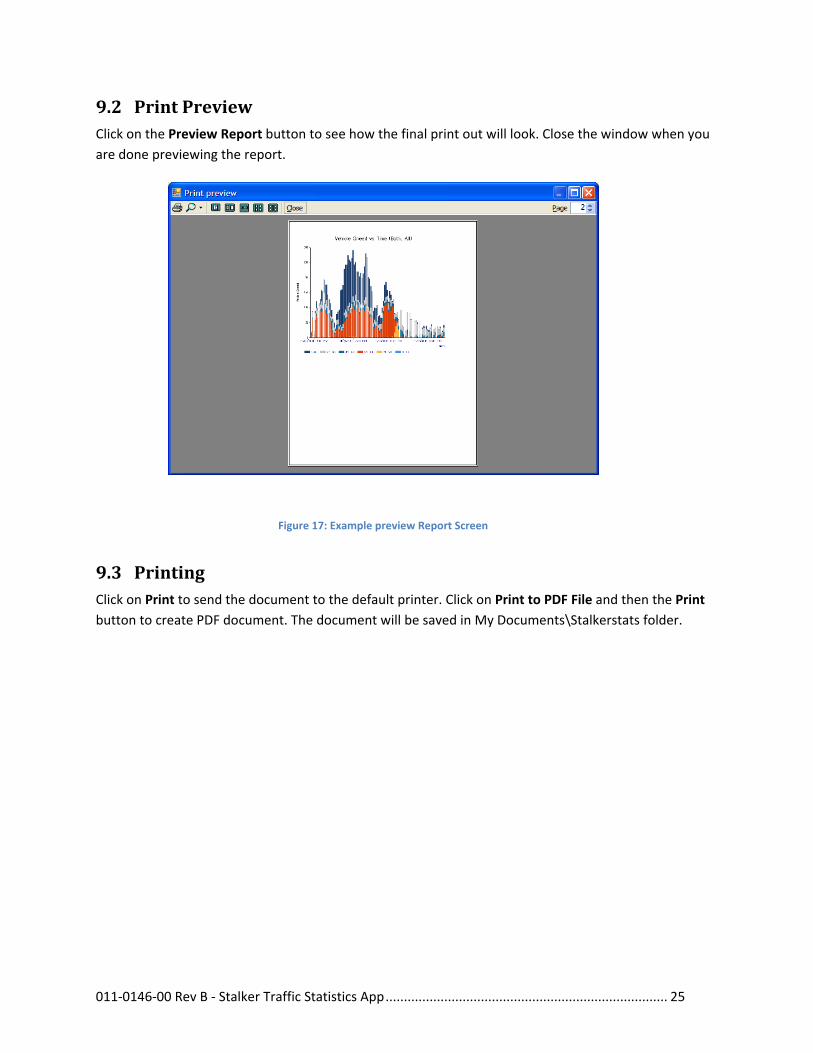
Whenallofthereportsareformattedsatisfactorally,gotothereportwindowbyselectingReportundertheAnalysissectiononthemainmenubar.
9.1 ReportWindowInthereportwindowapreviewofthereportsselectedfromtheanalsyissectionwillbedisplayed.Theycanallbeseenbyusingthescrollbarontheright‐handside.Individualpagesinthereportcanbeenabledordisabledbyclickingonthecheckboxesonthelefthandside.
Scroll Bar Page
Enables
Figure 16: Example Report Window
011‐0146‐00 Rev B ‐ Stalker Traffic Statistics App ............................................................................. 25
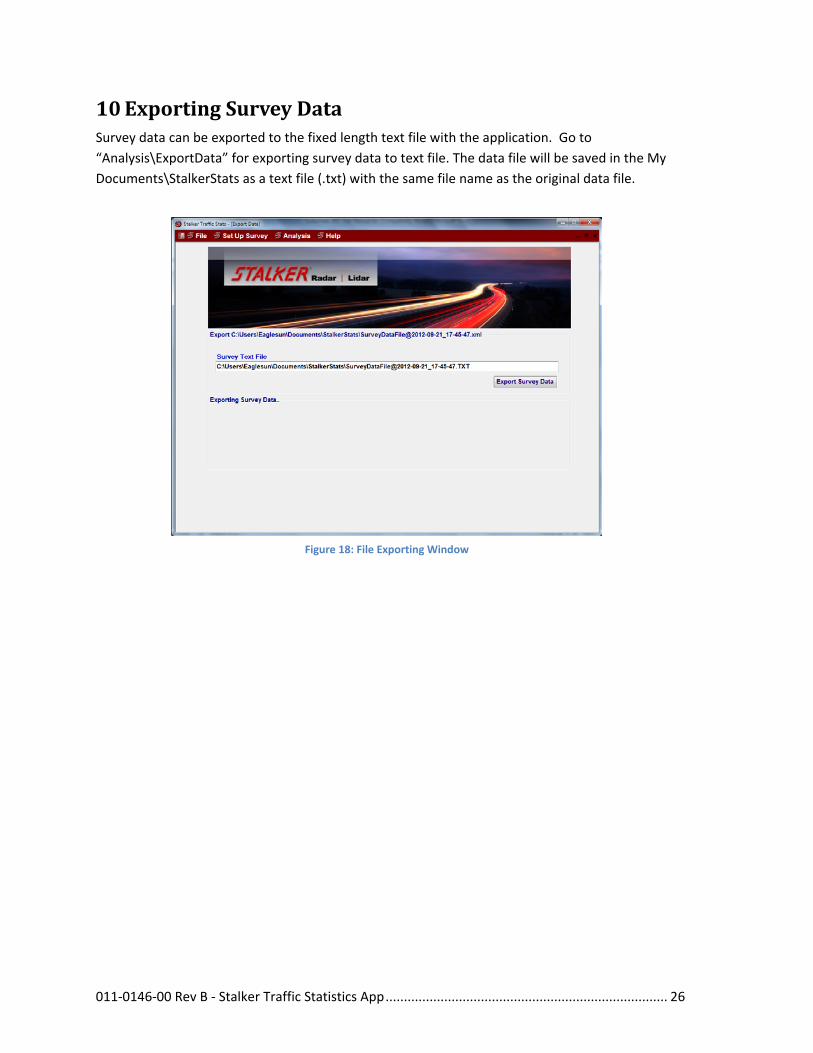
9.2 PrintPreviewClick on the Preview Report button to see how the final print out will look. Close the window when you
are done previewing the report.
9.3 PrintingClick on Print to send the document to the default printer. Click on Print to PDF File and then the Print
button to create PDF document. The document will be saved in My Documents\Stalkerstats folder.
Figure 17: Example preview Report Screen
011‐0146‐00 Rev B ‐ Stalker Traffic Statistics App ............................................................................. 26
10 ExportingSurveyDataSurvey data can be exported to the fixed length text file with the application. Go to
“Analysis\ExportData” for exporting survey data to text file. The data file will be saved in the My
Documents\StalkerStats as a text file (.txt) with the same file name as the original data file.
Figure 18: File Exporting Window
011‐0146‐00 Rev B ‐ Stalker Traffic Statistics App ............................................................................. 27
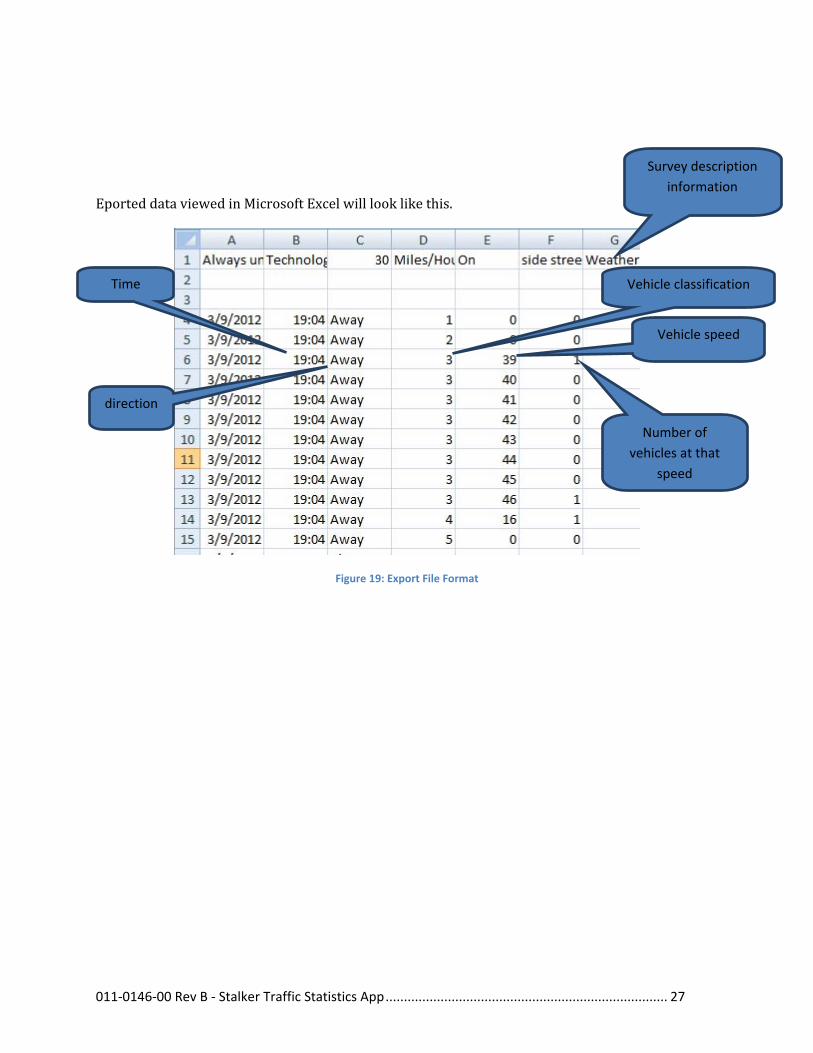
EporteddataviewedinMicrosoftExcelwilllooklikethis.
Figure 19: Export File Format
Survey description
information
Vehicle classification
Vehicle speed
Number of
vehicles at that
speed
Time
direction
011‐0146‐00 Rev B ‐ Stalker Traffic Statistics App ............................................................................. 28
11 ApplicationHelp&Update
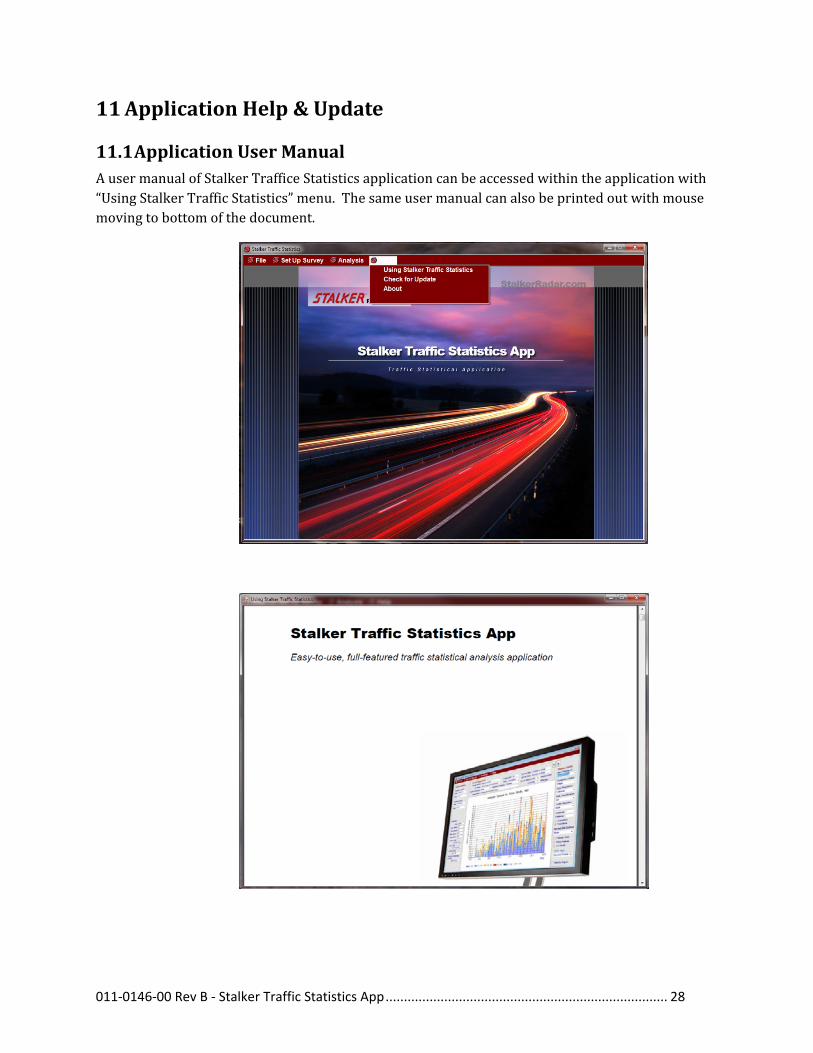
11.1 ApplicationUserManualAusermanualofStalkerTrafficeStatisticsapplicationcanbeaccessedwithintheapplicationwith“UsingStalkerTrafficStatistics”menu.Thesameusermanualcanalsobeprintedoutwithmousemovingtobottomofthedocument.
011‐0146‐00 Rev B ‐ Stalker Traffic Statistics App ............................................................................. 29
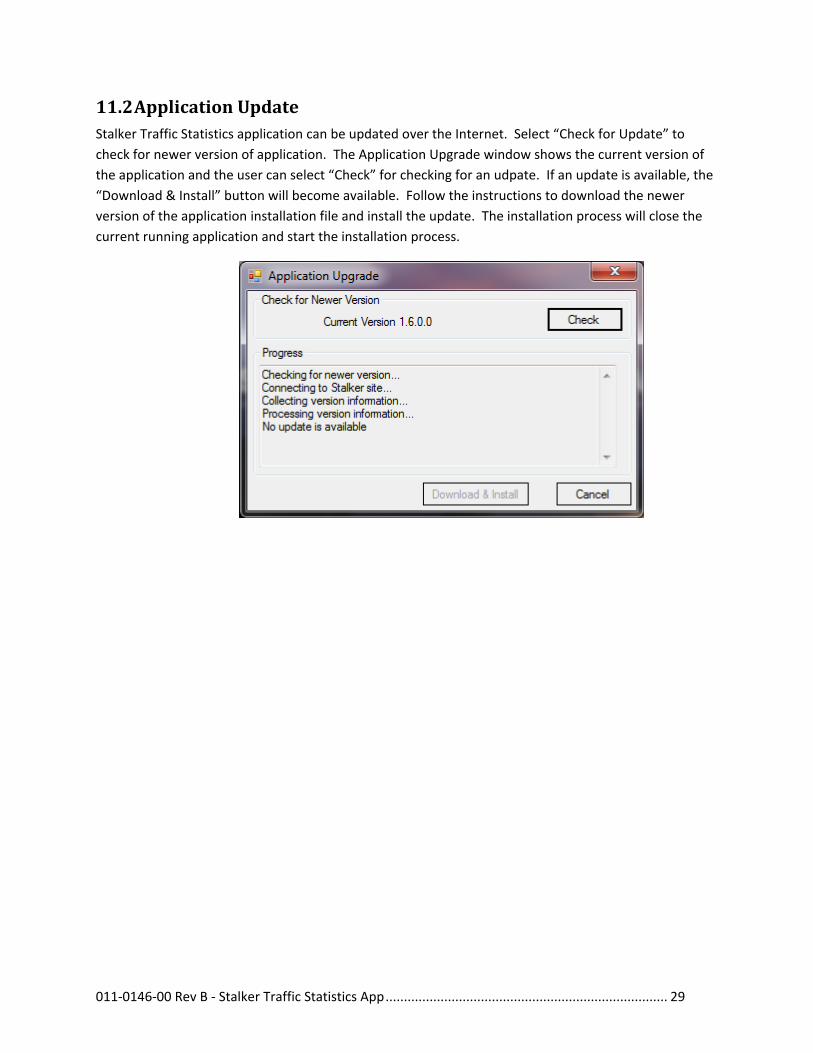
11.2 ApplicationUpdateStalker Traffic Statistics application can be updated over the Internet. Select “Check for Update” to
check for newer version of application. The Application Upgrade window shows the current version of
the application and the user can select “Check” for checking for an udpate. If an update is available, the
“Download & Install” button will become available. Follow the instructions to download the newer
version of the application installation file and install the update. The installation process will close the
current running application and start the installation process.