Embed Size (px)
Citation preview
Stakeholders’ Education | Corporate Governance Research | Corporate Governance Score | Proxy Advisory
STAKEHOLDERS EMPOWERMENT SERVICES
1 | P A G E
SECTOR: STEEL REPORTING DATE: 31ST MAY, 2016
S.A.L Steel Ltd www.salstel.co.in
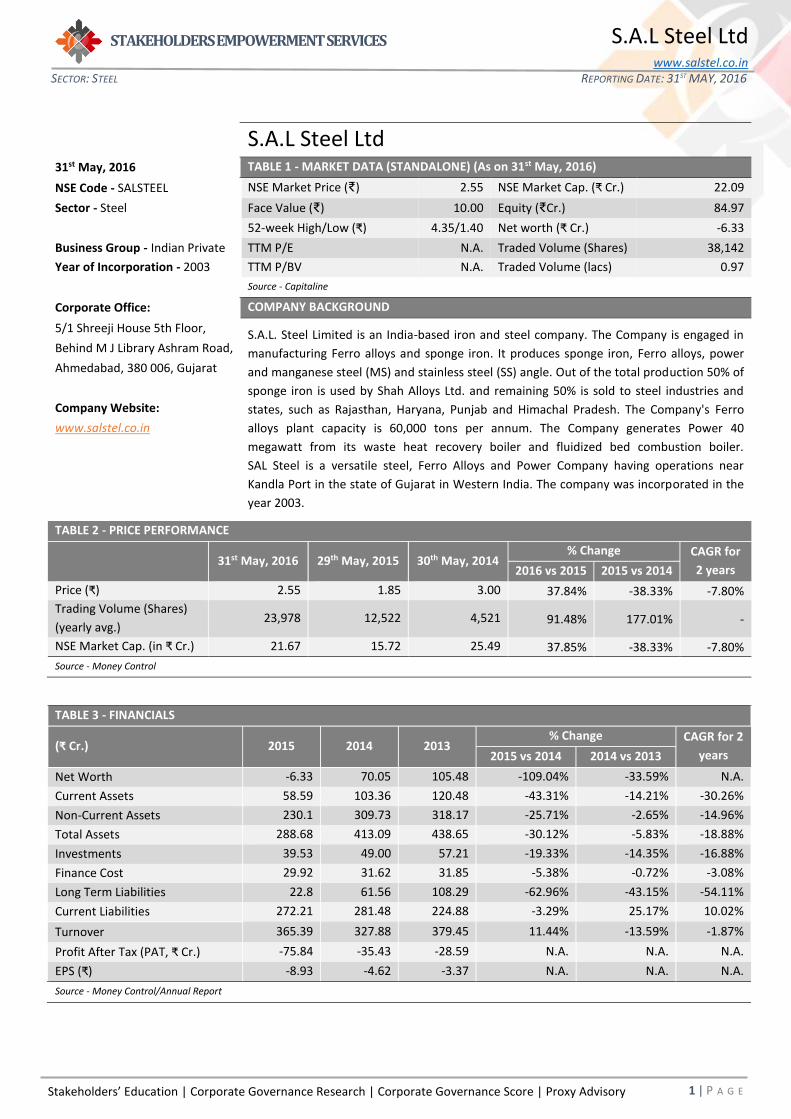
S.A.L Steel Ltd 31st May, 2016 TABLE 1 - MARKET DATA (STANDALONE) (As on 31st May, 2016)
NSE Code - SALSTEEL NSE Market Price (₹) 2.55 NSE Market Cap. (₹ Cr.) 22.09
Sector - Steel Face Value (₹) 10.00 Equity (₹Cr.) 84.97
52-week High/Low (₹) 4.35/1.40 Net worth (₹ Cr.) -6.33
Business Group - Indian Private TTM P/E N.A. Traded Volume (Shares) 38,142
Year of Incorporation - 2003 TTM P/BV N.A. Traded Volume (lacs) 0.97
Source - Capitaline
Corporate Office: COMPANY BACKGROUND
5/1 Shreeji House 5th Floor, S.A.L. Steel Limited is an India-based iron and steel company. The Company is engaged in
manufacturing Ferro alloys and sponge iron. It produces sponge iron, Ferro alloys, power
and manganese steel (MS) and stainless steel (SS) angle. Out of the total production 50% of
sponge iron is used by Shah Alloys Ltd. and remaining 50% is sold to steel industries and
states, such as Rajasthan, Haryana, Punjab and Himachal Pradesh. The Company's Ferro
alloys plant capacity is 60,000 tons per annum. The Company generates Power 40
megawatt from its waste heat recovery boiler and fluidized bed combustion boiler.
SAL Steel is a versatile steel, Ferro Alloys and Power Company having operations near
Kandla Port in the state of Gujarat in Western India. The company was incorporated in the
year 2003.
Behind M J Library Ashram Road,
Ahmedabad, 380 006, Gujarat
Company Website:
www.salstel.co.in
TABLE 2 - PRICE PERFORMANCE
31st May, 2016 29th May, 2015 30th May, 2014
% Change CAGR for
2 years 2016 vs 2015 2015 vs 2014
Price (₹) 2.55 1.85 3.00 37.84% -38.33% -7.80%
Trading Volume (Shares)
(yearly avg.) 23,978 12,522 4,521 91.48% 177.01% -
NSE Market Cap. (in ₹ Cr.) 21.67 15.72 25.49 37.85% -38.33% -7.80%
Source - Money Control
TABLE 3 - FINANCIALS
(₹ Cr.) 2015 2014 2013 % Change CAGR for 2
years 2015 vs 2014 2014 vs 2013
Net Worth -6.33 70.05 105.48 -109.04% -33.59% N.A.
Current Assets 58.59 103.36 120.48 -43.31% -14.21% -30.26%
Non-Current Assets 230.1 309.73 318.17 -25.71% -2.65% -14.96%
Total Assets 288.68 413.09 438.65 -30.12% -5.83% -18.88%
Investments 39.53 49.00 57.21 -19.33% -14.35% -16.88%
Finance Cost 29.92 31.62 31.85 -5.38% -0.72% -3.08%
Long Term Liabilities 22.8 61.56 108.29 -62.96% -43.15% -54.11%
Current Liabilities 272.21 281.48 224.88 -3.29% 25.17% 10.02%
Turnover 365.39 327.88 379.45 11.44% -13.59% -1.87%
Profit After Tax (PAT, ₹ Cr.) -75.84 -35.43 -28.59 N.A. N.A. N.A.
EPS (₹) -8.93 -4.62 -3.37 N.A. N.A. N.A.
Source - Money Control/Annual Report
Stakeholders’ Education | Corporate Governance Research | Corporate Governance Score | Proxy Advisory
STAKEHOLDERS EMPOWERMENT SERVICES
2 | P A G E
SECTOR: STEEL REPORTING DATE: 31ST MAY, 2016
S.A.L Steel Ltd www.salstel.co.in
AUDIT QUALIFICATIONS
Audit Qualifications in last 3 years: The Auditors have raised following qualifications in the Annual reports
As per Annual Report FY 2014-15
1. Management is of the view that they do not anticipate execution of its ongoing capital projects. However, due provision /
write off / impairment which must have been made in the books of accounts has not been made. Out of the total book value of
Capital work in progress of ₹ 103,89,20,943/- during the year, the management has charged back only expense of pre-
operative expense, trial run expense and borrowing cost element for ₹ 47,48,71,471/- to the statement of profit and loss during
the current year which was earlier capitalized. For the remaining balance, the company has not carried out any Techno-
economic assessment during the year ended 31 March 2015 for the valuations of its ongoing Capital Projects and hence
identification of impairment loss and provision thereof, if any, has not been made. The same is not in accordance with the
notified Accounting Standard 28 on Impairment of asset which states that impairment loss is recognized when the carrying
amount of an asset exceeds its recoverable amount. The consequential impact of adjustment, if any, on the financial statements
is currently not ascertainable. And hence we are unable to comment on its consequential impact, if any, on the financial
statements.
Apart from this, the Company has not made provision towards recovery of capital advances for the said project for the amount
of ₹ 25,26,09,551/- which are currently shown under Long term loans and advances. The consequential impact of adjustment, if
any, on the actual realization of said advances on the financial statements is currently not ascertainable. therefore, we are
unable to comment on its consequential financial impact, if any, on the financial statements.
Management Response:
Since last many years lenders keep on ensuring the sanction and disbursement of the term loan for our ongoing projects and
every year revised projections were submitted. The bankers even after the sanction of the term loan have not disbursed fully
and hence funds of ₹103,89,20,943/- is blocked in the such ongoing projects. Since there is no active development in the
ongoing project due to non sanction of funds by lenders as well as no accrual from the operations, as of now the Company does
not anticipate execution of such ongoing capital projects and hence have charged back expense of pre-operative expense, trial
run expense and borrowing cost element of ₹ 47,48,71,471/- to the statement of profit and loss during the current year which
was earlier capitalized and carried in Capital work In Progress of our ongoing projects. For the remaining balance carried as
Capital work In Progress, the company has not carried out any Techno-economic assessment during the year ended 31st March
2015 for the valuations of its ongoing Capital Projects and hence identification of impairment loss and provision thereof, if any,
has not been made. Considering the emphasis of the matter, company agreed to appoint an approved valuer to access the
impairment of the assets. Company is expecting a report from the valuer and decision will be taken with regard to impairment,
if any, on such assets. Apart from this, the Company has paid the capital advances for the amount of ₹ 25,26,09,551/- which are
currently shown under Long term loans and advances to the suppliers for the supply of customized equipments based of our
specific design and requirements.
As per Annual Report FY 2012-13 & 2013-14
1. On the basis of records produced before us and on the basis of information and explanation given to us and as per the
terms and condition of the schedule stipulated for repayment in respect of loans taken by the company, the repayment
of the principal portion of the loan from a company covered in the register maintained under section 301 of the
Companies Act, 1956 was due to the extent of ₹ 10,00,00,000/- during the year 2011-12, ₹ 20,00,00,000/- during the
year 2012-13 and ₹20,00,00,000/- during the year 2013-14 totaling to ₹ 50,00,00,000 as at March 31,2014, however
till date, the company has not made any payment towards this dues.
2. According to the records of the company, undisputed Statutory dues including Provident fund, Employees State
Insurance, Investor education & protection fund, Income-tax, Wealth-tax, Service Tax, Sales-tax, Customs duties, Excise
duty, cess and other Statutory dues have not been generally regularly deposited during the year with the appropriate
authorities.
3. On the basis of the information and explanation given to us and on the basis of records produced before us, the
company has defaulted in repayment of Principal portion of the Term Loan to the extent of ₹ 36,60,00,000/- as at the
year end. The company has also defaulted in payment of interest on term loan to the extent of ₹22,91,24,406/- as at
the year end. The period of default on repayment of principal and payment of interest is ranging for a period from 90
days to 547 days and 90 days to 455 days respectively. Moreover, the company has also defaulted in payment of
Stakeholders’ Education | Corporate Governance Research | Corporate Governance Score | Proxy Advisory
STAKEHOLDERS EMPOWERMENT SERVICES
3 | P A G E
SECTOR: STEEL REPORTING DATE: 31ST MAY, 2016
S.A.L Steel Ltd www.salstel.co.in
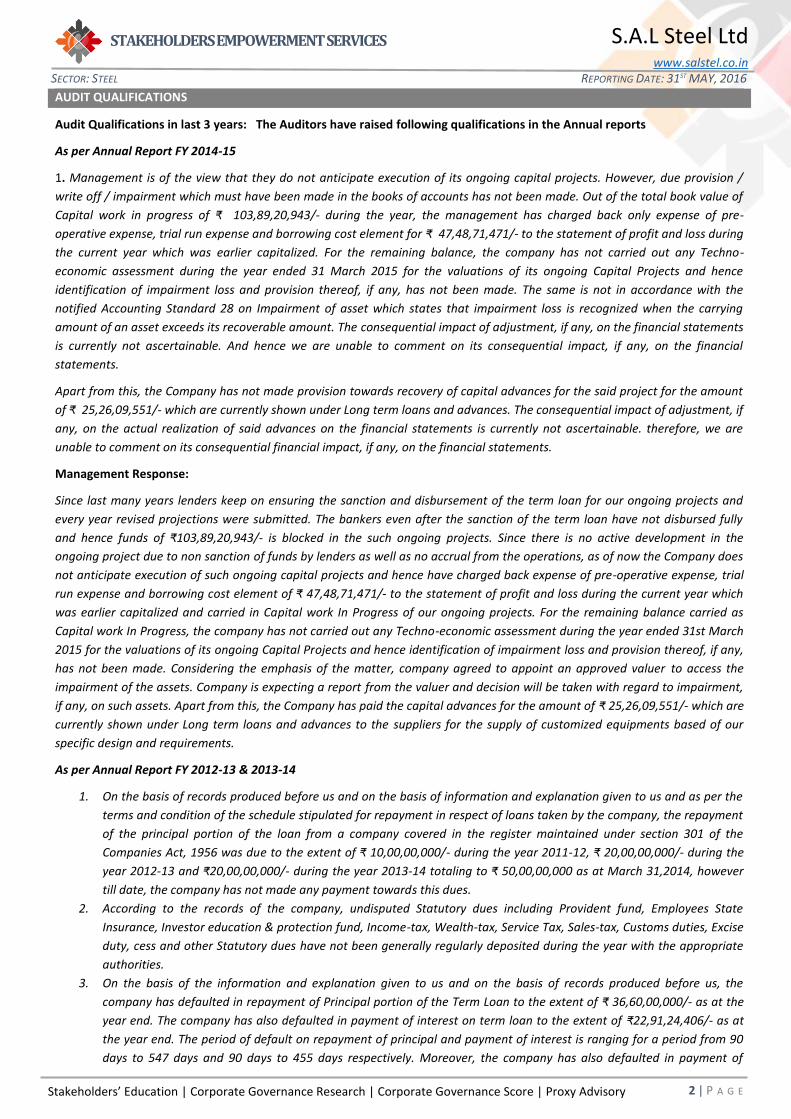
interest on working capital facilities to the extent of ₹ 11,71,25,768/- as at the year end. The period of default in
payment of interest is ranging for a period from 1 day to 516 days. Also the company has defaulted in honoring L/C
payments to the extent of ₹ 36,34,09,044 as at March 31,2014. The period of default in honoring L/C payments is
ranging for a period from 244 days to 418 days.
Management Response:
1. “Company was incorporated as backward integration project for Shah Alloys Limited (SAL). The finished product of our
company becomes Raw material for SAL. However, due to financial crisis, SAL is not functioning on its optimum
capacity and as such, company is not getting sufficient orders to optimize its production capacity. This has adversely
affected production of the Company. Thus accruals are not enough to pay back the amount to SAL after making
payment of interest and installments to its lenders. Due to low realization and low market demand, Company was
struggling with matching cash flow. Since Company is not able to make payment of interest and installments to
bankers, company approached to CDR cell for restructuring of debts. Side by side, Company is planning to develop
market for its products in nearby areas.
2. Payments of Statutory dues were marginally delayed on account of slow recovery/collection. However, the same have
been paid.
3. On account of underutilization of capacities, the cash flow was mismatch resulting delay in payment of interest. In the
CDR EG meeting flash report as submitted by the Company has been accepted and it is expected that once CDR
proposal is accepted, Company shall come out from financial crises resulting optimum capacity utilization.
Response Comment
Frequency of Qualifications Qualified since last 6 years
Have the auditors made any adverse remark
in last 3 years? No No
Are the material accounts audited by the
Principal Auditors? Yes -
Do the financial statements include material
unaudited financial statements? No -
TABLE 4: BOARD PROFILE (As on 31st March, 2015)
Regulatory Norms Company
% of Independent Directors on the Board 50% 55.55%
% of Promoter Directors on the Board - 11.11%
Number of Women Directors on the Board Atleast 1 0
Classification of Chairman of the Board - Non-Executive Promoter Director
Is the post of Chairman and MD/CEO held by the same person? - No
Average attendance of Directors in the Board meetings (%) - 97.22%
Source - Money Control/Annual Report
Composition of Board: As per Regulation 17(i)(b) of the Listing Regulations, 2015, the Company should have at least 50%
Independent Directors as the Chairman of the Board is a Non-Executive Promoter Director. The Company as on 31st March,
2015 has 55.55% of Independent Directors and hence, it meets the regulatory requirements.
Board Diversity: The Company has 9 directors which all 9 are male. The Company does not have a single woman Director on
the Board. The Company is non-compliant as per Clause 17 of the Listing Regulations, 2015 regarding the requirement of at
least one-woman director.
Stakeholders’ Education | Corporate Governance Research | Corporate Governance Score | Proxy Advisory
STAKEHOLDERS EMPOWERMENT SERVICES
4 | P A G E
SECTOR: STEEL REPORTING DATE: 31ST MAY, 2016
S.A.L Steel Ltd www.salstel.co.in
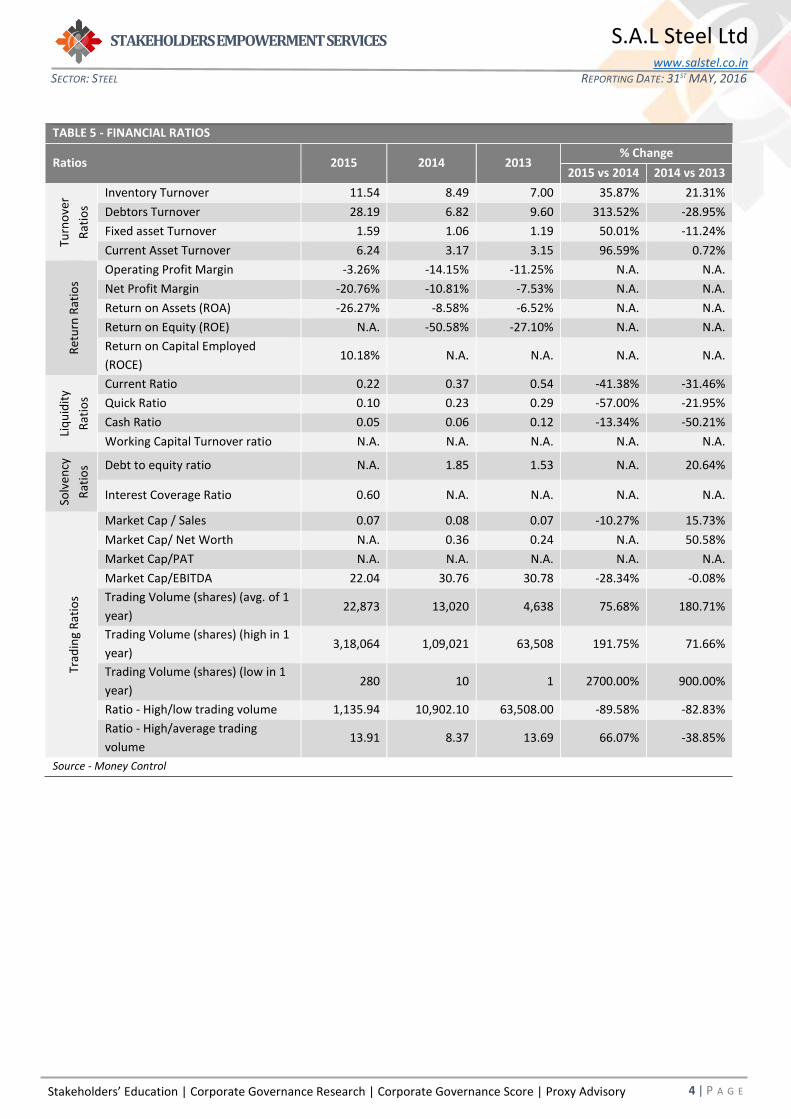
TABLE 5 - FINANCIAL RATIOS
Ratios 2015 2014 2013 % Change
2015 vs 2014 2014 vs 2013
Turn
ove
r
Rat
ios
Inventory Turnover 11.54 8.49 7.00 35.87% 21.31%
Debtors Turnover 28.19 6.82 9.60 313.52% -28.95%
Fixed asset Turnover 1.59 1.06 1.19 50.01% -11.24%
Current Asset Turnover 6.24 3.17 3.15 96.59% 0.72%
Ret
urn
Rat
ios
Operating Profit Margin -3.26% -14.15% -11.25% N.A. N.A.
Net Profit Margin -20.76% -10.81% -7.53% N.A. N.A.
Return on Assets (ROA) -26.27% -8.58% -6.52% N.A. N.A.
Return on Equity (ROE) N.A. -50.58% -27.10% N.A. N.A.
Return on Capital Employed
(ROCE) 10.18% N.A. N.A. N.A. N.A.
Liq
uid
ity
Rat
ios
Current Ratio 0.22 0.37 0.54 -41.38% -31.46%
Quick Ratio 0.10 0.23 0.29 -57.00% -21.95%
Cash Ratio 0.05 0.06 0.12 -13.34% -50.21%
Working Capital Turnover ratio N.A. N.A. N.A. N.A. N.A.
Solv
ency
Rat
ios Debt to equity ratio N.A. 1.85 1.53 N.A. 20.64%
Interest Coverage Ratio 0.60 N.A. N.A. N.A. N.A.
Trad
ing
Rat
ios
Market Cap / Sales 0.07 0.08 0.07 -10.27% 15.73%
Market Cap/ Net Worth N.A. 0.36 0.24 N.A. 50.58%
Market Cap/PAT N.A. N.A. N.A. N.A. N.A.
Market Cap/EBITDA 22.04 30.76 30.78 -28.34% -0.08%
Trading Volume (shares) (avg. of 1
year) 22,873 13,020 4,638 75.68% 180.71%
Trading Volume (shares) (high in 1
year) 3,18,064 1,09,021 63,508 191.75% 71.66%
Trading Volume (shares) (low in 1
year) 280 10 1 2700.00% 900.00%
Ratio - High/low trading volume 1,135.94 10,902.10 63,508.00 -89.58% -82.83%
Ratio - High/average trading
volume 13.91 8.37 13.69 66.07% -38.85%
Source - Money Control
Stakeholders’ Education | Corporate Governance Research | Corporate Governance Score | Proxy Advisory
STAKEHOLDERS EMPOWERMENT SERVICES
5 | P A G E
SECTOR: STEEL REPORTING DATE: 31ST MAY, 2016
S.A.L Steel Ltd www.salstel.co.in
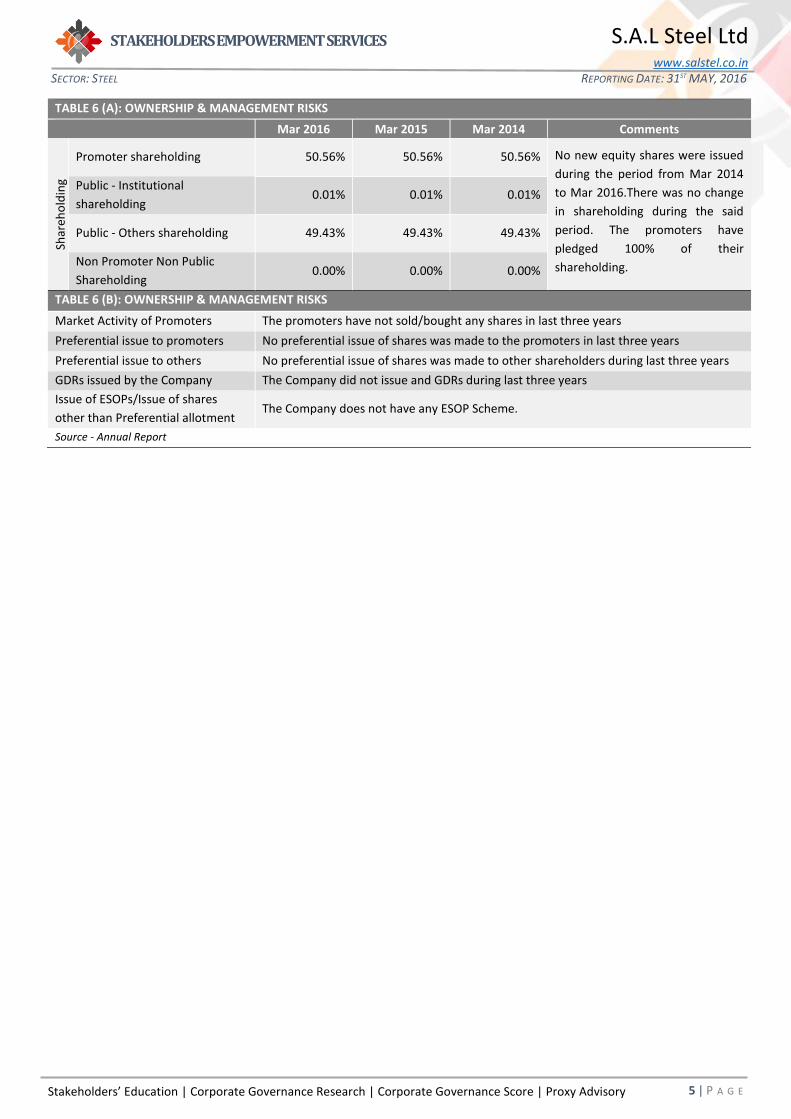
TABLE 6 (A): OWNERSHIP & MANAGEMENT RISKS
Mar 2016 Mar 2015 Mar 2014 Comments
Shar
eho
ldin
g
Promoter shareholding 50.56% 50.56% 50.56% No new equity shares were issued
during the period from Mar 2014
to Mar 2016.There was no change
in shareholding during the said
period. The promoters have
pledged 100% of their
shareholding.
Public - Institutional
shareholding 0.01% 0.01% 0.01%
Public - Others shareholding 49.43% 49.43% 49.43%
Non Promoter Non Public
Shareholding 0.00% 0.00% 0.00%
TABLE 6 (B): OWNERSHIP & MANAGEMENT RISKS
Market Activity of Promoters The promoters have not sold/bought any shares in last three years
Preferential issue to promoters No preferential issue of shares was made to the promoters in last three years
Preferential issue to others No preferential issue of shares was made to other shareholders during last three years
GDRs issued by the Company The Company did not issue and GDRs during last three years
Issue of ESOPs/Issue of shares
other than Preferential allotment The Company does not have any ESOP Scheme.
Source - Annual Report
Stakeholders’ Education | Corporate Governance Research | Corporate Governance Score | Proxy Advisory
STAKEHOLDERS EMPOWERMENT SERVICES
6 | P A G E
SECTOR: STEEL REPORTING DATE: 31ST MAY, 2016
S.A.L Steel Ltd www.salstel.co.in
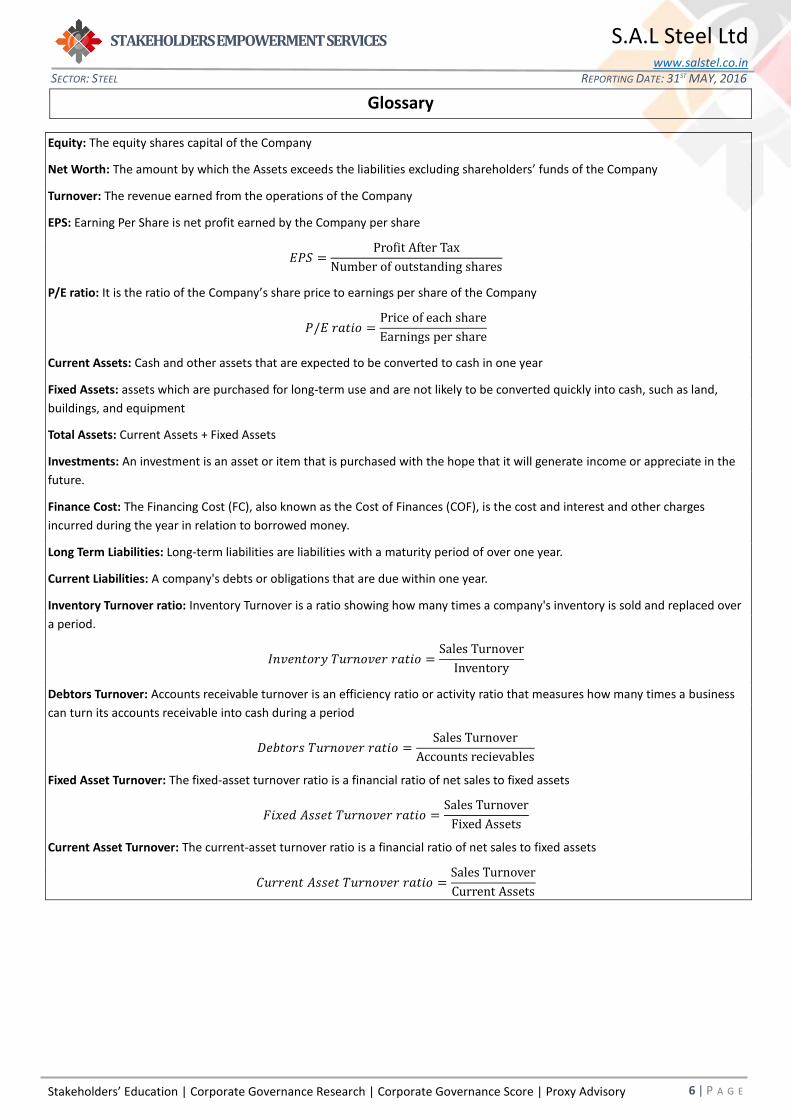
Glossary
Equity: The equity shares capital of the Company
Net Worth: The amount by which the Assets exceeds the liabilities excluding shareholders’ funds of the Company
Turnover: The revenue earned from the operations of the Company
EPS: Earning Per Share is net profit earned by the Company per share
𝐸𝑃𝑆 =Profit After Tax
Number of outstanding shares
P/E ratio: It is the ratio of the Company’s share price to earnings per share of the Company
𝑃/𝐸 𝑟𝑎𝑡𝑖𝑜 =Price of each share
Earnings per share
Current Assets: Cash and other assets that are expected to be converted to cash in one year
Fixed Assets: assets which are purchased for long-term use and are not likely to be converted quickly into cash, such as land,
buildings, and equipment
Total Assets: Current Assets + Fixed Assets
Investments: An investment is an asset or item that is purchased with the hope that it will generate income or appreciate in the
future.
Finance Cost: The Financing Cost (FC), also known as the Cost of Finances (COF), is the cost and interest and other charges
incurred during the year in relation to borrowed money.
Long Term Liabilities: Long-term liabilities are liabilities with a maturity period of over one year.
Current Liabilities: A company's debts or obligations that are due within one year.
Inventory Turnover ratio: Inventory Turnover is a ratio showing how many times a company's inventory is sold and replaced over
a period.
𝐼𝑛𝑣𝑒𝑛𝑡𝑜𝑟𝑦 𝑇𝑢𝑟𝑛𝑜𝑣𝑒𝑟 𝑟𝑎𝑡𝑖𝑜 =Sales Turnover
Inventory
Debtors Turnover: Accounts receivable turnover is an efficiency ratio or activity ratio that measures how many times a business
can turn its accounts receivable into cash during a period
𝐷𝑒𝑏𝑡𝑜𝑟𝑠 𝑇𝑢𝑟𝑛𝑜𝑣𝑒𝑟 𝑟𝑎𝑡𝑖𝑜 =Sales Turnover
Accounts recievables
Fixed Asset Turnover: The fixed-asset turnover ratio is a financial ratio of net sales to fixed assets
𝐹𝑖𝑥𝑒𝑑 𝐴𝑠𝑠𝑒𝑡 𝑇𝑢𝑟𝑛𝑜𝑣𝑒𝑟 𝑟𝑎𝑡𝑖𝑜 =Sales Turnover
Fixed Assets
Current Asset Turnover: The current-asset turnover ratio is a financial ratio of net sales to fixed assets
𝐶𝑢𝑟𝑟𝑒𝑛𝑡 𝐴𝑠𝑠𝑒𝑡 𝑇𝑢𝑟𝑛𝑜𝑣𝑒𝑟 𝑟𝑎𝑡𝑖𝑜 =Sales Turnover
Current Assets
Stakeholders’ Education | Corporate Governance Research | Corporate Governance Score | Proxy Advisory
STAKEHOLDERS EMPOWERMENT SERVICES
7 | P A G E
SECTOR: STEEL REPORTING DATE: 31ST MAY, 2016
S.A.L Steel Ltd www.salstel.co.in
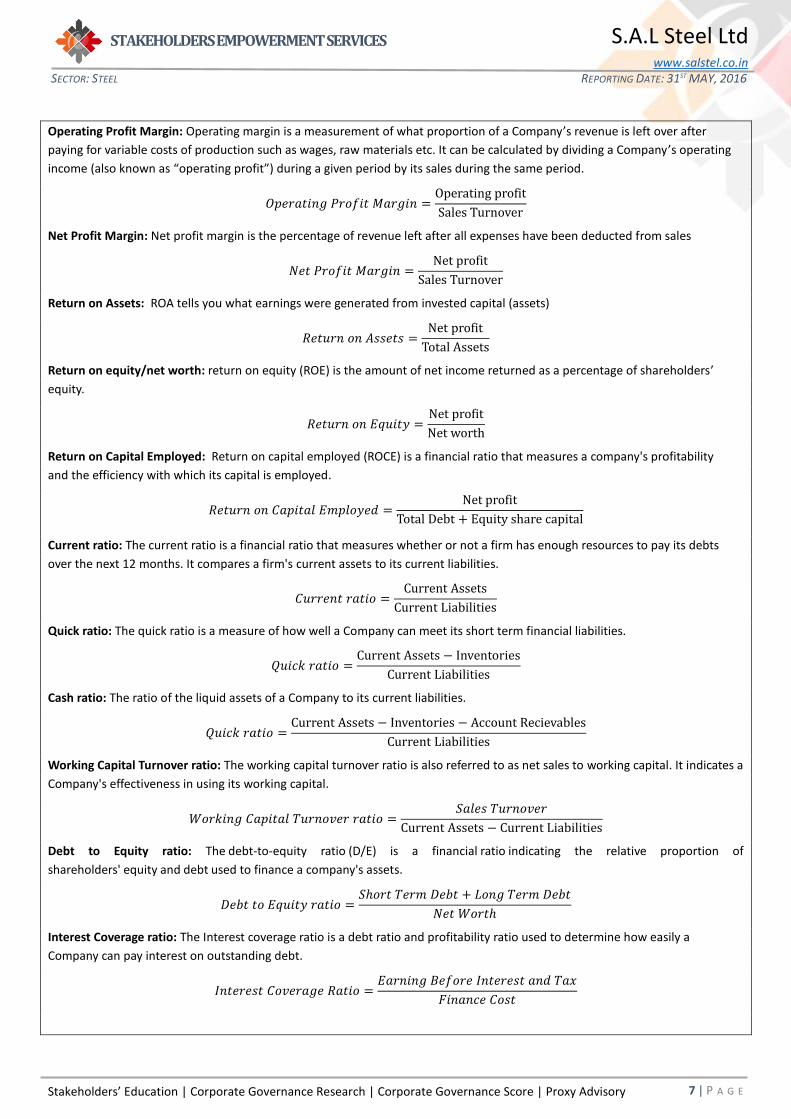
Operating Profit Margin: Operating margin is a measurement of what proportion of a Company’s revenue is left over after
paying for variable costs of production such as wages, raw materials etc. It can be calculated by dividing a Company’s operating
income (also known as “operating profit”) during a given period by its sales during the same period.
𝑂𝑝𝑒𝑟𝑎𝑡𝑖𝑛𝑔 𝑃𝑟𝑜𝑓𝑖𝑡 𝑀𝑎𝑟𝑔𝑖𝑛 =Operating profit
Sales Turnover
Net Profit Margin: Net profit margin is the percentage of revenue left after all expenses have been deducted from sales
𝑁𝑒𝑡 𝑃𝑟𝑜𝑓𝑖𝑡 𝑀𝑎𝑟𝑔𝑖𝑛 =Net profit
Sales Turnover
Return on Assets: ROA tells you what earnings were generated from invested capital (assets)
𝑅𝑒𝑡𝑢𝑟𝑛 𝑜𝑛 𝐴𝑠𝑠𝑒𝑡𝑠 =Net profit
Total Assets
Return on equity/net worth: return on equity (ROE) is the amount of net income returned as a percentage of shareholders’
equity.
𝑅𝑒𝑡𝑢𝑟𝑛 𝑜𝑛 𝐸𝑞𝑢𝑖𝑡𝑦 =Net profit
Net worth
Return on Capital Employed: Return on capital employed (ROCE) is a financial ratio that measures a company's profitability
and the efficiency with which its capital is employed.
𝑅𝑒𝑡𝑢𝑟𝑛 𝑜𝑛 𝐶𝑎𝑝𝑖𝑡𝑎𝑙 𝐸𝑚𝑝𝑙𝑜𝑦𝑒𝑑 =Net profit
Total Debt + Equity share capital
Current ratio: The current ratio is a financial ratio that measures whether or not a firm has enough resources to pay its debts
over the next 12 months. It compares a firm's current assets to its current liabilities.
𝐶𝑢𝑟𝑟𝑒𝑛𝑡 𝑟𝑎𝑡𝑖𝑜 =Current Assets
Current Liabilities
Quick ratio: The quick ratio is a measure of how well a Company can meet its short term financial liabilities.
𝑄𝑢𝑖𝑐𝑘 𝑟𝑎𝑡𝑖𝑜 =Current Assets − Inventories
Current Liabilities
Cash ratio: The ratio of the liquid assets of a Company to its current liabilities.
𝑄𝑢𝑖𝑐𝑘 𝑟𝑎𝑡𝑖𝑜 =Current Assets − Inventories − Account Recievables
Current Liabilities
Working Capital Turnover ratio: The working capital turnover ratio is also referred to as net sales to working capital. It indicates a
Company's effectiveness in using its working capital.
𝑊𝑜𝑟𝑘𝑖𝑛𝑔 𝐶𝑎𝑝𝑖𝑡𝑎𝑙 𝑇𝑢𝑟𝑛𝑜𝑣𝑒𝑟 𝑟𝑎𝑡𝑖𝑜 =𝑆𝑎𝑙𝑒𝑠 𝑇𝑢𝑟𝑛𝑜𝑣𝑒𝑟
Current Assets − Current Liabilities
Debt to Equity ratio: The debt-to-equity ratio (D/E) is a financial ratio indicating the relative proportion of
shareholders' equity and debt used to finance a company's assets.
𝐷𝑒𝑏𝑡 𝑡𝑜 𝐸𝑞𝑢𝑖𝑡𝑦 𝑟𝑎𝑡𝑖𝑜 =𝑆ℎ𝑜𝑟𝑡 𝑇𝑒𝑟𝑚 𝐷𝑒𝑏𝑡 + 𝐿𝑜𝑛𝑔 𝑇𝑒𝑟𝑚 𝐷𝑒𝑏𝑡
𝑁𝑒𝑡 𝑊𝑜𝑟𝑡ℎ
Interest Coverage ratio: The Interest coverage ratio is a debt ratio and profitability ratio used to determine how easily a
Company can pay interest on outstanding debt.
𝐼𝑛𝑡𝑒𝑟𝑒𝑠𝑡 𝐶𝑜𝑣𝑒𝑟𝑎𝑔𝑒 𝑅𝑎𝑡𝑖𝑜 =𝐸𝑎𝑟𝑛𝑖𝑛𝑔 𝐵𝑒𝑓𝑜𝑟𝑒 𝐼𝑛𝑡𝑒𝑟𝑒𝑠𝑡 𝑎𝑛𝑑 𝑇𝑎𝑥
𝐹𝑖𝑛𝑎𝑛𝑐𝑒 𝐶𝑜𝑠𝑡

Stakeholders’ Education | Corporate Governance Research | Corporate Governance Score | Proxy Advisory
STAKEHOLDERS EMPOWERMENT SERVICES
8 | P A G E
SECTOR: STEEL REPORTING DATE: 31ST MAY, 2016
S.A.L Steel Ltd www.salstel.co.in
Market Cap/Sales ratio: Market Cap/sales ratio, Price–sales ratio, P/S ratio, or PSR, is a valuation metric for stocks. It is calculated
by dividing the company's market cap by the revenue in the most recent year; or, equivalently, divide the per-share stock price by
the per-share revenue.
𝑀𝑎𝑟𝑘𝑒𝑡 𝐶𝑎𝑝/𝑆𝑎𝑙𝑒𝑠 𝑟𝑎𝑡𝑖𝑜 =𝑀𝑎𝑟𝑘𝑒𝑡 𝐶𝑎𝑝
𝑆𝑎𝑙𝑒𝑠 𝑇𝑢𝑟𝑛𝑜𝑣𝑒𝑟
Market Cap/ Net Worth ratio: It is a valuation ratio calculated by dividing Company’s market cap to net worth.
𝑀𝑎𝑟𝑘𝑒𝑡 𝐶𝑎𝑝/𝑁𝑒𝑡𝑤𝑜𝑟𝑡ℎ 𝑟𝑎𝑡𝑖𝑜 =𝑀𝑎𝑟𝑘𝑒𝑡 𝐶𝑎𝑝
𝑁𝑒𝑡𝑤𝑜𝑟𝑡ℎ
Market Cap/ PAT ratio: It is a valuation ratio calculated by dividing Company’s market cap to net profit.
𝑀𝑎𝑟𝑘𝑒𝑡 𝐶𝑎𝑝/𝑃𝐴𝑇 𝑟𝑎𝑡𝑖𝑜 =𝑀𝑎𝑟𝑘𝑒𝑡 𝐶𝑎𝑝
𝑛𝑒𝑡 𝑝𝑟𝑜𝑓𝑖𝑡
Market Cap/ EBITDA ratio: It is a valuation ratio calculated by dividing Company’s market cap to EBITDA.
𝑀𝑎𝑟𝑘𝑒𝑡 𝐶𝑎𝑝/𝐸𝐵𝐼𝑇𝐷𝐴 𝑟𝑎𝑡𝑖𝑜 =𝑀𝑎𝑟𝑘𝑒𝑡 𝐶𝑎𝑝
𝐸𝐵𝐼𝑇𝐷𝐴
Trading Volume (shares) (avg. of 1 year): Average number of shares/day traded in 1 year
Trading volume (shares) (high in 1 year): Highest number of shares/day traded in 1 year
Trading volume (shares) (minimum in 1 year): Lowest number of shares traded on any one day in 1 year
Stakeholders’ Education | Corporate Governance Research | Corporate Governance Score | Proxy Advisory
STAKEHOLDERS EMPOWERMENT SERVICES
9 | P A G E
SECTOR: STEEL REPORTING DATE: 31ST MAY, 2016
S.A.L Steel Ltd www.salstel.co.in
DISCLAIMER
Sources Company Information
Only publicly available data has been used while making the factsheet. Our
data sources include: BSE, NSE, SEBI, Capitaline, Moneycontrol, Businessweek,
Reuters, Annual Reports, IPO Documents and Company Website.
Analyst Certification
The analysts involved in development of this factsheet certify that no part of
any of the research analyst’s compensation was, is, or will be directly or
indirectly related to the contents of this factsheet.
Disclaimer
While SES has made every effort and has exercised due skill, care and diligence in compiling this factsheet based on publicly available information, it neither guarantees its accuracy, completeness or usefulness, nor assumes any liability whatsoever for any consequence from its use. This factsheet does not have any approval, express or implied, from any authority, nor is it required to have such approval. The users are strongly advised to exercise due diligence while using this factsheet.
This factsheet in no manner constitutes an offer, solicitation or advice to buy or sell securities, nor solicits votes or proxies on behalf of any party. SES, which is a not-for-profit Initiative or its staff, has no financial interest in the companies covered in this factsheet except what is disclosed on its website. The factsheet is released in India and SES has ensured that it is in accordance with Indian laws. Person resident outside India shall ensure that laws in their country are not violated while using this factsheet; SES shall not be responsible for any such violation.
All disputes subject to jurisdiction of High Court of Bombay, Mumbai.
SEBI Reg. No. INH000000016
This factsheet or any portion hereof may not
be reprinted, sold, reproduced or
redistributed without the written consent of
Stakeholders Empowerment Services
Contact Information
Stakeholders Empowerment Services
A 202, Muktangan,
Upper Govind Nagar,
Malad East,
Mumbai – 400 097
Tel +91 22 4022 0322
www.sesgovernance.com.
Research Analyst: Kirti Dhokiya