Embed Size (px)
Citation preview

3rd EUROPEAN ELECTROMOBILITY STAKEHOLDER FORUM
MAKING THE CONNECTION
#eMSF2015
@eMobilityForum

3rd E-MOBILITY STAKEHOLDER FORUM
Strategies for widespread uptake of heavy duty EV’s
(Zero Emission Urban bus Systems)
Gert Miedema, Sales Director, ABB, PG EVCI

Agenda
o Main market drivers for widespread uptake of EV’s o Clean(er) air o High energy efficiency (‘well-to-wheel’) solutions o EV Battery prices are falling o Standardization is a must o Strong incentives: Norway
o Strategies for widespread uptake of heavy duty EV’s o Follow the passenger EV’s: Standardization & Volumes o Governments should set ZE targets & challenge industry
Strategies for widespread uptake of heavy duty EV’s

See also the site: http://aqicn.org/
But also Paris,
March 17th, 2014
China has no choice, Zero Emission is needed….
Mega-Cities are turning into smog-centers

Well-to-wheel efficiency: ‘electric‘ transportation most efficient
Biofuel: 7km
Hydrogen: 160km
Electric: 380km
A solar panel delivers 105 kWh/m².
A solar panel delivers 105 kWh/m².
After distribution, charging and storage in the battery, 77kWh is available to the motor.
An EV drives 5km/kWh, so 77kWh gives 380km range.
After electrolysis, compression and distribution 63kWh goes into the tank.
The fuel cell generates 31.5kWh of electricity. The vehicle drives 5km/kWh, so 31.5kWh gives 160km range.
Most efficient energy crops (palm oil, sugar cane) deliver 0.5L/m² including sowing, fertilizing, harvesting, refinement and distribution.
A vehicle drives 15km/L, so 0.5L gives 7km range.
Original source: Auke Hoekstra, Eindhoven University of Technology. Data was modified due to improved performance of biofuel and hydrogen.
Range per year per m² of land for alternative fuels

As this graph below shows, EV battery prices have fallen 40% since 2010.
Regarding the future, BMW board member Ian Robertson says, “in the next three to four years there will be more progress in battery development than in the previous 100 years.”
Source: http://cleantechnica.com/2013/07/08/40-drop-in-ev-battery-prices-from-2010-to-2012/#EpKMkZKxlOlD52Y8.99
Steeply falling EV-Battery prices & increasing volumes
40% Drop in EV Battery Prices from 2010 To 2012

More than 40 000 fully electric cars on the road (Dec 2014) - PHEV: Approx. 2 300
New sales approx 1 600 – 1 800 per month for the last 8 months
Very favourable incentives for buying fully electric cars
Incentives to be reviewed when more than 50 000 cars
Incentives being planned for electric transportation (Ruter)
0
5,000
10,000
15,000
20,000
25,000
Jan Feb Mar Apr May Jun Jul Aug Sep Oct Nov Dec
Total 2014
Total 2012
Total 2013
Fast charging Stations Installed: 128 Planned: 54 (‘15)
Highest penetration EV market: Norway
Driven by targets & strong incentives
BEV sales / year 2012 - 2014

CHAdeMO / AC type 2/ CCS
EV car charging has 3 OEM Fast Charging standards in EU
Q4-2013 50 kW CCS
2010 50 kW CHAdeMO
Q4-2012 22-43 kW AC
& Tesla……
EU decision: after 31-12-’17 AC type 2 CCS

(Strategies for widespread uptake of heavy EV’s: follow the EV’s!
ZE bus/truck solution
Infra structure & maintenance cost
HD EV cost
Flexibility/ Roll-out speed
Reliability/maturity bus + infra
Range Energy Efficiency
(Passenger) capacity
(Initial) Impact on city traffic
Synergy ZE passenger cars
Fuel cells
(Only)
overnight
AC charging
Trolley/
Catenary
Inductive
Battery
swapping
Opportunity
DC Fast
Charging
Standard Fast DC charging: the solution towards ZE bus/truck
3/9/2015 | Slide 9 © ABB Group
= strongest option

Consumers/voters (should) ask for clean air & low noise (be willing to pay a small premium during the transition)
Governments should •Set (Zero) Emission & budget targets (2020/2030)
•Cities & Countries •Euro 7 norm definition (2018)
•Define & share (local) plans towards these targets •Challenge the industry to propose transition solutions
•Short term: City pilot projects •Medium/long term: volume roll-out projects
•Strongly encourage standardization •Help managing residential value of infrastructure
Governments should set ZE targets & challenge industry
E-bus & Fast Charging Industry should offer solutions: •Current requirements like bus timetables & routes •Standardized, •Cost effective (in volumes), • Implementable
3rd E-MOBILITY STAKEHOLDER FORUM
Moving forward with e-mobility integration into Smart Grids
Giovanni Coppola, Enel SpA

Smart Grids vision
13
Renewables
Dispatching
Network Automation
Forecast
Storage
Smart Secondary Substation
Electric Mobility
Interoperability
Smart Charging
Fast-Charge
Active Demand
Market Services
Smart-Info
Energy-Box
Load Balancing
Public Lighting
LED Technology
Remote Control
Gas Smart Metering
New Strategic Roles of the Infrastructures
Electricity Smart Metering

E-mobility business space
14
The research leading to these results has received funding from the European Union Seventh Framework Programme (FP7/2007 – 2013) under grant agreement No. 265499.
A seamless customer experience is built on IT system harmonized interfaces
B2C
DSO
LV/MV Electricity Grid
EV Service Provider
B2C service
B2B service
EVSE Operator
EVSE EV
RENs Production
search
access
pay ?
EV Customer

E-mobility standardization
select – your location
select – your connector
Type 2 AC
DC CHAdeMO
Combo 2
search
access
pay Alternative Fuels directive 94/2014
POI e-mobility interface
The research leading to these results has received funding from the European Union Seventh Framework Programme (FP7/2007 – 2013) under grant agreement No. 265499.

Smart Charging: turning risk into opportunity
16
Smart Charging could be a service sold by OEMs
Increasing flexibility burden for the DSOs
The increase of battery capacity could lead OEMs to step into virtual utility marketplace

Smart Charging: the customer’s perspective
17
Enabling customers to trade time flexibility with money savings,
while enhancing DERs hosting capacity
Smart charging
State Of Charge
Time of departure
EV tracking
EVSE Op.
EVSE

18
DSO
LV/MV Electricity Grid
EV Service Provider
B2C service
B2B service
Charging Station Operator
Charging Station EVs
RENs Production
Smart charging
State Of Charge
Time of departure
EV tracking
A wide set of B2B / M2M interfaces needs to be established for product implementation
and service execution
Load Management
LV/MV Grid monitoring
RENs integration
Smart Charging: IT interfaces

Page 19
DSO
DMS
EV Smart-Grids Integration
EVSE Operator
Load Area IT-ENE-001-0001
RENs Traceability & Forecast
0
10
20
30
40
50
60
1 3 5 7 9 11 13 15 17 19 21 23
Desired Load Area Target Curve
kW
hours
Customer Preferences
DER Operator
{ Smart charging State Of Charge
Time of departure
EV tracking
0
10
20
30
40
50
60
1 3 5 7 9 11 13 15 17 19 21 23
Effective vs Ideal Target Curve
Ideal
Effective
hours
po
we
r
Smart Charging: Projects exploitation
po
we
r

09.03.2015 Page 20
Smart Charging: next steps in EU
A position paper over Smart Charging from EU electricity industry, released on March 24th
To go forward with smart charging research and development within H2020 calls
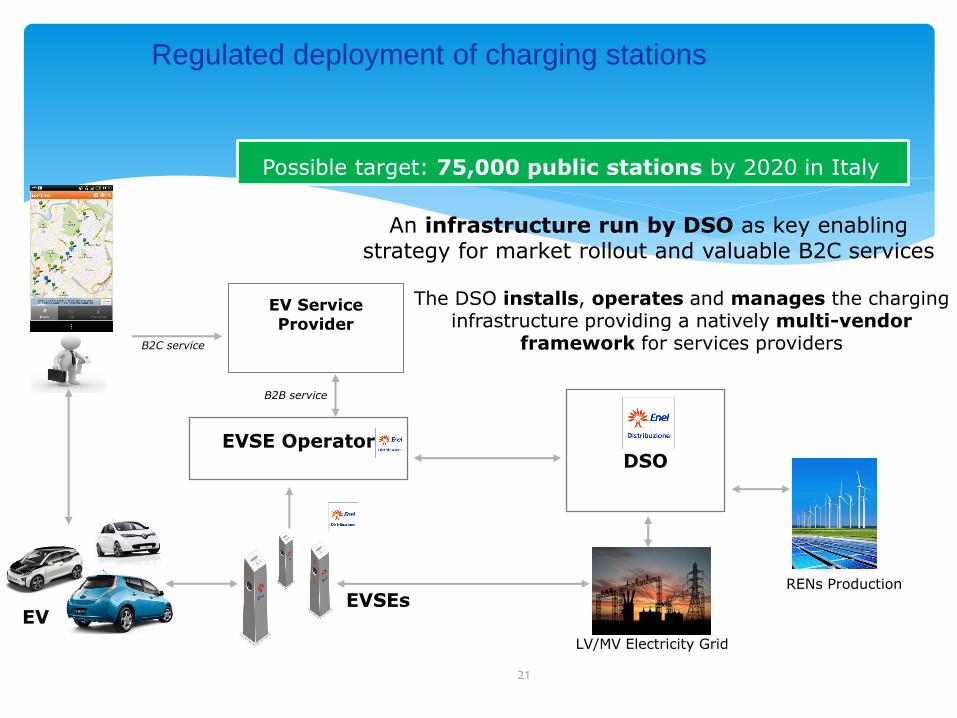
Regulated deployment of charging stations
21
B2C
DSO
LV/MV Electricity Grid
EV Service Provider
B2C service
B2B service
EVSE Operator
EVSEs EV
RENs Production
An infrastructure run by DSO as key enabling strategy for market rollout and valuable B2C services
The DSO installs, operates and manages the charging infrastructure providing a natively multi-vendor
framework for services providers
Possible target: 75,000 public stations by 2020 in Italy

Thank you
Giovanni COPPOLA Product Manager of Enel SpA
End-Customer Application & New Technologies

3rd E-MOBILITY STAKEHOLDER FORUM
Charging Infrastructure Effects of Electrifying Rotterdam’s City Fleet
Jos Streng Roland Steinmetz (Traffic & Transport Planner, City of Rotterdam) (EV Consult)

Rotterdam
Stakeholder Forum
Historical development of City and Port

Contents
o Overview
o Brainstorming objectives
An attractive place to be…

EC-sources abroad
rest of NL
local traffic
industry shipping
consumers
…but it should and could even be better….

How the city tries to clear the air
Ecostars (fleet recognition scheme for companies & organisations, more Ecostars means more sustainable –public- image and more traffic-related privileges)
Green Deal Zero Emission Urban Distribution 2020 (declaration of intent, signed by city, companies and TNO research institute)
FREVUE (demonstrating the use of E-trucks & vans for Urban Distribution, and investigating conditions for large scale introduction)
Minimizing emission from our duty vehicles (replacement of vehicles by fully electric, unless…)

Basic figures
o 614.00 inhabitants, 319 km2, (113 km2 water)
o Captive fleet of 1343 four-wheeled duty vehicles:
(63% diesel, 20% hybrid, 14% gasoline, 3% electric)
- 470 passenger cars - 270 small vans - 196 pickups with various equipment (cranes, compressors, etc.) - 400 trucks & special vehicles (refuse, sewage suction)
o 222 scooters, bicycles and segways (96% E)

60% of passenger cars and light vans can be electrified

XYZ
o Text here
o Text here
Where do these cars spend the night?

Property Rented locations Number of vehicles
Small (1 to 4)
Medium (5 to 9)
Large (10 to 19)
Super (20 or more)
Total

Analyzed scenarios
Standard: all vehicles charge overnight at 11 kW Power Connections upgraded when necessary
Smart: locations with 5 or more vehicles get 70% occupation, vehicles with more than 120 km/day get 11 kW, other vehicles 3,7kW
Fast and Smart: 1 fast charger per 8 vehicles at locations with 20 or more vehicles
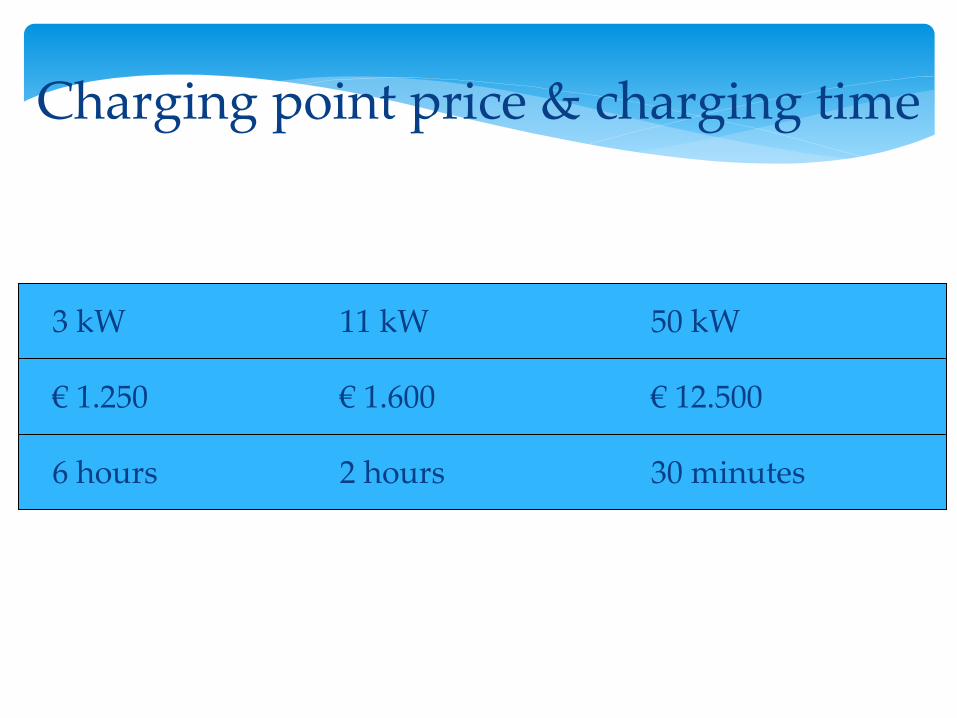
Charging point price & charging time
3 kW 11 kW 50 kW
€ 1.250 € 1.600 € 12.500
6 hours 2 hours 30 minutes

Fuel savings (238 vehicles)
Current annual Corresponding Annual savings fuel expense electricity cost
€ 390.000 € 70.000 € 320.000
Interesting detail: those who pay the fuel don’t pay the electricity bill

Avoided PM10 emission (238 vehicles)
Average PM10 Average annual Annual savings emission per km mileage (km) (g PM 10)
0,0025 g/km 16.592 10.086

Charging infrastructure requirements (per scenario)
Standard: 238 charging points 11 kW 14 connection upgrade of 175 kVA 1 connection upgrade of 300 kVA
Smart: 167 charging points 3,7 kW 12 charging points 11 kW 4 connection upgrade 175 kVA
Fast and Smart: 127 charging point 3,7 kW 10 charging points 11 kW 8 fast chargers 50 kW 4 connection upgrade 175 kVA

Financial implications (indicative)
Hardware (as indicated)
Installation (about the same cost as charging point, based on experience over the last year with 50 points)
Power connection upgrade (Stedin estimate)
Charging point exploitation (offer by supplier)
Periodic costs
Depreciation in 8 years
15% contingencies

Show me the money…..
Scenario Hardware Installation Connection
upgrade Total
Annual
(8 years)
Standard 382.400 382.400 84.312 976.479 180.000
Smart 227.950 286.400 15.368 609.176 105.000
Fast and Smart 274.750 214.400 15.368 600.436 100.000

Perspective o Taking fuel savings into account, 50-75 € per vehicle per month would
be available to improve the business case for the vehicle
o Final decision on scenario and speed of introduction is being prepared (e.g. facility managers include maintenance cost in regular budget).
o For one fleet owner, the implications are far reaching but overseeable.
o But if FREVUE would be succesfull, and our Green Deal would become reality (hence all business trucks and vanselectric by 2020), the grid operator should prepare for a huge strategy adaptation.
o Therefore, a joint research project to determine the match between projected demand and current grid capacity is being prepared.
o If all vehicle kilometers in Rotterdam would be electric, an additional 200 MW of continuous electric power would be required.

3rd E-MOBILITY STAKEHOLDER FORUM
Making the connection
Kai Tullius European Commission
DG ENERGY

Directive on the deployment of alternative fuels infrastructure (AFID)
Facilitate development of a single market for alternative fuels vehicles (electricity, natural gas, LNG, CNG, hydrogen) and infrastructures
Focus on the "missing links" – infrastructure and standards
Remove technical and regulatory barriers across the EU

• "Appropriate number" of recharging points accessible to the public at least in urban agglomerations → MSs national policy frameworks
• Number of EVs estimated to be registered by 2020
• Best practices and recommendations by the Commission
• As an indication: 10 cars per recharging point
• Additional recharging points to be put in place by 31/12/2025 could be proposed by the Commission
• Measures to facilitate private recharging points
Minimum infrastructure by 2020
Charging Infrastructure

• Publicly recharging points shall, if technically feasible and economically reasonable, make use of intelligent metering systems
Integration in the electricity system
The use of intelligent metering systems: 1) Contributes to the stability of the grid 2) Enhances consumer protection and demand response 3) Incentivizes the development of new business models 4) It is an affordable investment 5) Reinforces the coherence of EU energy policy (Third Energy Market Package)
Integration

• "Ad-hoc" charging without contract
• Consumers can contract electricity simultaneous with several suppliers
• Prices at publicly accessible recharging points reasonable, easily and clearly comparable, transparent and non-discriminatory
More flexibility for consumers
• Any person can establish or operate publicly accessible recharging points
• Operators are free to purchase electricity from any EU electricity supplier
• DSOs cooperate on a non-discriminatory basis with recharging point owners or operators
Recharging service – market driven
Market Rules

• AC normal and fast recharging points with connectors of type 2
• DC fast recharging points with connector of type "Combo 2"
EU common standards for charging plugs
Standards

Coordination
National
• National policy frameworks (NPF):targets and actions for development of market and deployment of infrastructure
• Population density and geographical characteristics to consider
• Notification to the Commission 2 years after entry into force of AFID
Regional
• Cooperation with neighbouring countries by means of consultations or joint policy frameworks
EU
• The Commission shall facilitate the exchange of information and best practices
• Responsible for the publication and updating of information on the national targets
• It shall assess the coherence of NPF and assist MSs in the cooperation process
• Adoption of guidelines concerning the reporting on the implementation of NPF

Thank you
Kai Tullius European Commission
DG ENERGY


![“While there’s life, there’s hope .” — Marcus Tullius Cicero [Add an image]](https://img.pdfslide.us/doc/110x75/56813424550346895d9b1068/while-theres-life-theres-hope-marcus-tullius-cicero-add.jpg)