Embed Size (px)
Citation preview

Stair Steps to QualityA Guide for States and Communities Developing Quality Rating Systemsfor Early Care and Education
By Anne W. Mitchell, Alliance for Early Childhood Finance
July 2005

This report is the product of a collaborative effort between Collins Management Consulting, Inc., a wholly owned subsidiary of Caliber Associates, Inc., and United Way of America Success By 6,® under the direction of Marlo Nash, national director of impact strategies at United Way of America Success By 6. For additional copies of this publication, contact the National Child Care Information Center at 800-616-2242.

Stair Steps to QualityA Guide for States and Communities Developing Quality Rating Systemsfor Early Care and Education
By Anne W. Mitchell, Alliance for Early Childhood Finance
July 2005

Stair Steps to Quality
Preface
United Way Success By 6®
This publication is aptly named Stair Steps to Quality: A Guide for States and Communities Developing Quality Rating Systems for Early Care and Education. A favorite proverb says that the fi nal destination often illumi-nates the fi rst steps. Qualistar Early Learning was formed in Colorado in 1997 as a consortium of business, philanthropic, and governmental leaders dedicated to partnering with parents and child care providers to improve the early learning outcomes for our youngest citizens. At the time, this was an audacious fi nal destination.
The fi rst step was the creation of a fi rst-of-its-kind, patented Quality Rating System (QRS). After 10,000 volunteer hours, two years of professional effort, overcoming differences, and a signifi cant initial phil-anthropic investment, we congratulated ourselves on a job well done. No longer would we hear, “I don’t know how to defi ne quality in child care but I know what it is when I see it.” We had come to a point where we had defi ned child care quality and developed a matrix-based measurement rubric to assess settings effectively. However, our self-congratulation was premature.
A brief summary of Qualistar’s success is described on page 26 of this guide. Although highlighting the success is important, this summary does not document the enormous learning about and the valuable benefi ts to the process of improving early learning settings that have accrued as a result of our failures. Fear of failure should not inhibit your efforts to pursue a QRS project. We will all benefi t from your work.
Today, Qualistar Early Learning is recognized as the statewide rating and quality improvement system in Colorado, serves over 10,000 children in close to 400 settings, and collaborates with the RAND Corporation on an evaluation and continuous improvement project to test the validity of our assumptions and the outcomes of our work. The results of this study should be benefi cial to the general development of QRS across the nation.
The development of a QRS is the fi rst step toward a disciplined ac-countability and governance structure for the early care and education system in your state or community. Implementation of a successful QRS requires constancy of purpose, a commitment of adequate fi nancial and

United Way Success By 6® Stair Steps to QualityUnited Way Success By 6® Stair Steps to Quality
human resources, and a liberal dose of humility. Humility is important because no one person or process has the ability to transform overnight an educational system that has seen such under-investment in facilities, fi nancing, and faculty.
My own experience studying settings throughout the United States, Europe, and East Africa has clarifi ed what is important: although the assets and liabilities of individual communities may differ, the develop-mental needs of children remain the same. QRS is a signifi cant tool for community leaders who truly are committed to making a difference in the quality of early learning programs in this nation. Accountability is here to stay. QRS can help us deliver results. This guide serves as an invita-tion for all of us to focus on the same fi nal destination. Let us all partner together to improve the early learning outcomes for America’s youngest citizens.
Douglas M. Price Managing DirectorBenjamin Douglas CompaniesFounding ChairmanQualistar Early Learning
Preface

United Way Success By 6® Stair Steps to QualityUnited Way Success By 6® Stair Steps to Quality
What Matters Most When It Comes to Building a Child’s Future? High-quality early education and care programs can help prepare children for success in school, work, and life. Research proves it: every $1 invested in high-quality early education and care programs for disadvantaged chil-dren saves as much as $17 down the road, with tangible results measured by lower crime, fewer teen parents, and higher individual earning and educa-tion levels (Schweinhart, 2004).
For a growing number of states and communities, the key is a Quality Rating System (QRS)—a strategy to improve the quality of early education and care by providing “star ratings” like those for hotels and restaurants. A QRS is a consumer guide, a benchmark for program improvement, and an accountability measure for funding.
Now in place in 10 states and in development in more than half the country, QRS improve the quality of early learning and empower parents to become savvy consumers and choose the best early education and care for their children. Armed with knowledge and understanding about a star system, parents can demand quality with their pocketbooks.
A QRS also can help policymakers create policies that will improve quality. It can promote accountability so donors, elected offi cials, and taxpayers have confi dence investing in quality. It also can give programs a roadmap to quality improvement.
A state or community with a QRS is aligned around the best interests of its children and is on track to build successful schools, productive citizens, and a well-trained, well-educated future workforce to support long-term economic development.
This how-to guide is the fi rst of its kind—putting the best research, prom-ising practices, and proven models into the hands of anyone interested in creating quality early education and care.
First Things First

United Way Success By 6® Stair Steps to QualityUnited Way Success By 6® Stair Steps to Quality
Using this guide, leaders from public, private, and nonprofi t sectors can work together with child development experts, regulators, and programs to create a QRS. These stakeholders can push for long-term policy, program, and funding changes in communities or states to support QRS.
This guide is not designed for experts. It is for real people who are work-ing in their communities to make signifi cant changes for young children: elected offi cials, United Way staff or board members, child care resource and referral staff, child advocates, business leaders, and early childhood development professionals. Together, all of us can take the lead to improve early education and care dramatically.
A Snapshot of Quality Rating Systems and Their Impact The concept of QRS emerged from the grassroots, where state administra-tors of child care subsidy programs and early education advocates worked in recent years to develop systems that drive improvements in the quality of care—and simplify for parents and families the process of choosing high-quality early education and care settings. The fi rst public and private QRS initiatives took root in the late 1990s, with the fi rst state-sponsored QRS beginning in Oklahoma and the fi rst private QRS in Denver, Colorado.
The momentum for QRS continues to build, so much so that this guide is a work in progress! The guide offers online resources and tools, such as how-to tools, checklists, and summaries of the most recent information about what states and communities are doing with QRS. It will be followed by additional QRS publications, as part of a national commitment of the National Child Care Information Center and United Way Success By 6® (UW SB6) to “move the needle” on school readiness in the country over the next decade.
The national strategic focus of UW SB6 includes QRS to support the systemic approach to improving the quality, building supply, and driving demand for high-quality early education and care programs. QRS can be a tool to galvanize stakeholders, and it can make quality issues tangible for policy-makers. Most importantly, QRS is a cornerstone of higher-quality education and care for young children. Also critical to QRS success are efforts to educate and engage consumers. UW SB6 is committed to support planning,
First Things First

United Way Success By 6® Stair Steps to QualityUnited Way Success By 6® Stair Steps to Quality
strengthening coalitions, and building coalitions around QRS—along with piloting innovations locally.
The need for quality care and QRS is increasing across the United States. Almost 70 percent of local United Way agencies are involved in early educa-tion and care. But, many have experienced frustration by directing resources to initiatives that did not work well enough. Typically focused on vulner-able neighborhoods, United Way agencies and their partners struggled to move lower-performing child care programs to the high-quality standards required by national accreditation programs.
To clear those hurdles, local United Way leaders looked for vehicles that directed resources toward defi ned, accelerated, and continuous quality im-provement. Time and again, QRS has helped communities meet all of those needs. Here are just a few examples:
In Buffalo, New York, the UW SB6 Quality Improvement Project set out to help 100 child care centers and family child care homes get accreditation. They secured fi nancing for assistance and quality enhancements and saw 45 programs become accredited. Buffalo planners and investors realized that the gap between basic, daily care and a high-quality, enriched learning environment was too large to be bridged without new support. They devised a quality improvement project to begin development of an infrastructure that provides steps toward quality, utilizing environment rating scales developed by Thelma Harms, Richard Clifford, and Debby Cryer to assist an additional 80 providers measurably increase quality. They are also advocates for the development of QRS in New York State.
In Tucson, Arizona, the local United Way assisted 60 child care centers in the poorest areas of the community with the National Association for the Education of Young Children’s accreditation process. The efforts resulted in 34 centers receiving accreditation. To build on its success, United Way is working to reach more programs and to create a system of continuous quality improvement in Tuscon. Using funds from a $1 million federal Early Learning Opportunities Act grant, United Way of Tuscon and Southern Arizona is developing a QRS.
First Things First

United Way Success By 6® Stair Steps to QualityUnited Way Success By 6® Stair Steps to Quality
Tucson’s groundbreaking work earned the attention of Governor Janet Napolitano, for whom school readiness is a priority. United Way is now working in partnership with the Governor’s Offi ce to develop and pilot a local QRS, with plans to take it statewide in 2007.
In Lawton, Oklahoma, UW SB6 leaders offered modest grants to fund quality improvements that were key to increasing star ratings, as identifi ed by the state child care licensing offi ce.
In two neighboring states, United Way of the Mid-South in Memphis, Tennessee, and the statewide United Way of North Carolina worked with local partners to conduct awareness campaigns that informed parents about the states’ newly developed QRS.
In Pennsylvania, the development of Pennsylvania’s Keystone STARS was led by the in-kind work provided by staff from the United Way of Southeastern Pennsylvania.
Why Does Quality Matter? Ask the Experts.Research by social scientists, neuroscientists, medical doctors, and econo-mists demonstrates that high-quality early childhood education has a profound and lasting effect on children’s ability to gain from future educa-tional and life opportunities.
According to James Heckman, Nobel laureate and University of Chicago eco-nomics professor, “Learning starts in infancy, long before formal education begins, and continues throughout life. Recent research in psychology and cognition demonstrates how vitally important the early preschool years are for skill formation. Early learning begets later learning and early success breeds later success, just as early failure breeds later failure” (Heckman, 2000, p.3).
The 40-year longitudinal High/Scope Perry Preschool research in Michigan continues to prove that high-quality early learning experiences prepare children for success in school, work, and life. As Art Rolnick, senior vice president and director of research at the Federal Reserve Bank of Minneapolis, emphasizes, “Investment in human capital breeds not only
First Things First

United Way Success By 6® Stair Steps to QualityUnited Way Success By 6® Stair Steps to Quality
economic success for those being educated, but also for the overall economy” (Rolnick & Grunewald, 2003). He makes the case that the United States does not invest enough in early childhood education, despite the strong return on investment that results from studies like the Perry Preschool demonstrate.
The fact is, 46 percent of U.S. kindergartners come to school at risk for failure (U.S. Department of Education, 2001). The poorest children start school at least one year behind (Urahn, 2001). The children who most need the tools for success are receiving the fewest, which has implications for economic self-suffi ciency and the long-term economic health and prosperity of our nation as the demand for high-skill, high-wage jobs increases.
Dr. Jack Shonkoff, prominent pediatrician and chair of the National Scientifi c Council on the Developing Child, states, “There is an unaccept-ably wide gap between what we know and what we do to promote healthy childhood development” (Cobb, 2003).
This QRS guide can be part of a strengthened vision and collective mission across the United States to ensure all children enter school prepared to succeed.
Brian A. GallagherPresident and CEOUnited Way of America
First Things First

United Way Success By 6® Stair Steps to Quality
Acknowledgments
This guide is part of a national strategy of United Way Success By 6® (UW SB6). Thanks go to Doug Price, Gerrit Westervelt, and the Qualistar staff for their help in shaping that strategy. Thanks go to Susan Stevenson, former director of operations at United Way Success By 6, for her insight and direc-tion. Many pioneers in the Quality Rating System (QRS) fi eld made this guide a reality. Thanks go to the National Child Care Information Center (Executive Director Eric Karolak and his predecessor, Janet Mascia, as well as Tracy Dry, Judy Collins, Eva Carter, Dave Edie, Oxana Golden, Desireé Reddick-Head, Susan Rohrbough, Louise Stoney, and Amy Shillady); Ray Collins, of Collins Management Consulting, Inc., and Caliber Associates, Inc., who supported the development of the guide; UW SB6 leaders across the country who are doing the diffi cult spade work of QRS, but still took time to review the guide and offer their valuable perspective (Lavonne Douville, Tracy Koopman, Laurie Rovin, Anne Ryan, Jason Sabo, and Diane Umstead); QRS leaders on the ground who offered insights about their local QRS work; and Louise Stoney for her excellent work on Financing Quality Rating Systems: Lessons Learned, a companion to this guide. Finally, UW SB6 would like to thank Anne Mitchell for sharing her knowledge of QRS in a way that makes it easier for all of us to improve the lives of children and families.

Table of Contents
OVERVIEW 1
CHAPTER I—INTRODUCTION TO QUALITY RATING SYSTEMS 3
What Is a Quality Rating System? 4
Where Are Quality Rating Systems? 5
Who Initiates Quality Rating Systems? 6
What Are the Goals of Quality Rating Systems? 6
What Is the Scope of Quality Rating Systems? 7
Will the Quality Rating System Be Established in Statute or through Regulation? 10
Tools and Resources 11
Key Points 12
CHAPTER II—GETTING STARTED 13
Who Is Involved? 13
How Does the Planning Process Work? 14
How Are Families Involved? 15
How Long Does It Take? 15
Who Are the Likely Allies and Opponents of Quality Rating Systems? 15
What Are the First Steps? 16
How Is Quality Defi ned? 16
How Does Research Evidence Inform a Quality Rating System? 17
Communication about Quality Rating Systems 18
Tools and Resources 19
Key Points 20
CHAPTER III—TIERED STANDARDS 21
What Standards Already Exist and What Needs to Be Developed? 21
What Categories of Quality Criteria Are Commonly Used? 22
How Are the Tiers or Steps Determined? 23
How Does Program Accreditation Relate to Quality Rating System Steps? 25
Are Quality Rating System Standards Aligned with Early Learning Standards? 26
United Way Success By 6® Stair Steps to Quality

Table of Contents, cont.
United Way Success By 6® Stair Steps to Quality
Are Quality Rating Systems Related to Child Outcomes? 26
Tools and Resources 28
Key Points 29
CHAPTER IV—ACCOUNTABILITY 31
What Monitoring Currently Occurs? 32
Will an Environment Rating Scale Be Used? 33
What Other Assessment Methods Can Be Used? 33
Who Is Responsible for Monitoring and Assessment? 34
What Are the Consequences and Implications of Accountability Policies? 36
Forms and Procedures 36
Tools and Resources 37
Key Points 38
CHAPTER V—PROGRAM AND PRACTITIONER SUPPORTS AND INCENTIVES 39
Supports in Quality Rating Systems 39
What Supports Currently Exist and What Needs to Be Developed? 39
Professional Development for Practitioners 40
Technical Assistance to Programs 40
Financial Incentives 41
Outreach to Programs about the Quality Rating System 42
Staging as a Strategy for Providing Supports 43
Tools and Resources 43
Key Points 44
CHAPTER VI—FINANCING 45
What Are the Cost Drivers and Tradeoffs for Each Component? 45
What Is the Total Cost of the Quality Rating System? 47
What Sources of Funding Exist to Finance Quality Rating Systems? 47
Tools and Resources 48
Key Points 48
CHAPTER VII—EDUCATING PARENTS ABOUT THE QUALITY RATING SYSTEM 49
How Do Parents Choose Programs and What Factors Infl uence Their Choice? 49
Why Is Educating Parents about the Quality Rating System Important? 50

United Way Success By 6® Stair Steps to Quality
Table of Contents, cont.
Educating Other Consumers about the Quality Rating System 50
Successful Strategies for Educating Consumers and the Public 51
Tools and Resources 53
Key Points 54
CHAPTER VIII—PUTTING IT ALL TOGETHER 55
The Benefi ts and Opportunities of a Quality Rating System 55
APPENDIX A—DESIGN FOR AN EARLY CARE AND EDUCATION SYSTEM 57
APPENDIX B—FEDERAL AND STATE FUNDING FOR EARLY CARE AND EDUCATION 59
APPENDIX C—SUMMARY OF RESEARCH ON QUALITY INDICATORS 65
REFERENCES 73


Overview
11United Way Success By 6® Stair Steps to Quality
T he purpose of this guide is to inform public and private-sector leaders in communities and states about a promising approach to improving the quality of early care and education and school-age care—Quality Rating
Systems (QRS). A QRS can give families clear information about the relative quality of different settings they may be considering for the care and education of their children. Such a system can provide benchmarks for programs to set improvement goals for themselves and measure progress toward meeting them. It can offer an accountability measure for policymakers and others concerned with results. It can be used to inform funding decisions of public and private agencies and help gauge the effects of their investments. A QRS can tell a community or state how well it is doing on an important measure of quality of life—the quality of early care and education programs for children.
The guide is designed as a hands-on, practical resource. To be both brief and up-to-date, the guide references materials that are available on the Web, such as how-to tools, checklists, sample forms, and summaries of the most recent informa-tion about what states and communities are doing with QRS.
The guide is organized as a planning tool for readers to use as they consider how to develop a new QRS or review and improve an existing one.
In the introduction, we begin with a defi nition of QRS, which outlines the fi ve elements common to QRS operating in states and communities.
Each chapter that follows will explain more about one of the fi ve elements of QRS and discuss the related principles, policies, and practices.
Throughout the guide, examples illustrate how different states and communities around the country have tackled the work of creating and implementing a QRS.
The fi nal chapter discusses QRS in the context of building an early care and education system, and emphasizes that a QRS is the linchpin that binds quality improvement strategies together to create the framework for a thriving system of early care and education and school-age services.
The appendices offer readers additional information about QRS. Appendix A includes a model for the design of an early care and education system, Appendix B includes a table with information about federal and state funding for early care and education, and Appendix C includes a summary of research on quality indicators.


Chapter I Introduction toQualit y Rating Systems
33United Way Success By 6® Stair Steps to Quality
M illions of young children in the United States are in child care and early education settings every day, both because their parents work and because families want their children to be learning. There are
several types of programs1 that families use: child care centers, Head Start pro-grams, prekindergarten, nursery schools, family child care homes, and friends and relatives. Families spend tens of billions of dollars every year paying for these services.2 States and the federal government also spend billions on early care and education.3 There is overwhelming evidence that the quality of the experi-ences that young children have in these programs matters to their later success in school and in life. There is also clear research identifying the characteristics of early care and education programs that lead to these good outcomes. Quality matters and it can be defi ned.
Because a growing body of research has proven just how much quality matters and billions are being invested, states and communities have paid increasing attention to improving quality in early care and education. Every state regulates programs for children to ensure their health and safety. The major federal funding source for child care, the Child Care and Development Fund (CCDF), includes a set-aside of funds for states to invest in quality improvement efforts.4 Most states have worked to build professional development systems to educate the people who work in early care and education. National professional organizations have developed accreditation systems for early care and education, family child care, and school-age programs. States and communities support technical assistance and provide grants to help programs improve and often to help programs achieve national accreditation. Several states created initiatives to increase the compensation of early care and education workers—rewarding educational attainment and increas-ing retention.
In the 1990s, states began to reward quality through their child care subsidy systems, creating tiered reimbursement5 policies, typically paying higher rates for accredited programs. States began to examine the growing array of quality promotion strategies through the lens of overall effectiveness and in terms of demonstrated results. This led to more systemic structuring of strategies; for example, ensuring that the offerings in the professional development system matched the content and credential requirements for personnel in licensing regu-lations, or that staff in programs engaged in quality improvement projects had

4United Way Success By 6® Stair Steps to Quality4
Introduction to Quality Rating Systems
priority for scholarships to advance their educa-tion. In 1998, Oklahoma created the fi rst statewide Quality Rating System (QRS), combining the state’s quality improvement elements into one coherent system. Since then, the QRS strategy has gained great momentum. Ten states have adopted QRS, and more than half the country is either piloting or actively exploring/developing a QRS.
What Is a Quality Rating System?A QRS is a method to assess, improve, and communi-cate the level of quality in early care and education settings. QRS are systemic, addressing multiple aspects of early care and education through a uni-form approach that is available throughout a state. QRS may be launched as a locally piloted initia-tive intended for statewide application. The scope of a QRS may include a broad range of early care and education programs (e.g., center-based child care, family child care, afterschool, prekindergar-ten, and/or Head Start) and funding streams. QRS are part of a state’s broader quality improvement continuum, and have the following fi ve common elements:
Standards that are based on the foundation of compliance with the state’s child care licensing regulations (taking into account exemptions) and include two or more levels, or tiers, of quality criteria above basic licensing requirements. Quality rating standards are based on early care and education research and on standards of quality for programs and practitioners that have gained wide acceptance (e.g., National Association for the Education of Young Children [NAEYC] and other valid forms of accreditation, educational qualifi cations and continuing professional development, and Head Start Program Performance Standards). Quality
1.
rating standards may align with the state’s early learning guidelines.
Accountability, through appropriate means of assessment and monitoring, for compliance with the specifi c criteria of the standards. QRS use valid and reliable methods of assessment to monitor compliance with standards and assign quality ratings. These ratings provide a benchmark for measuring improvement in the quality of care and education. Monitoring and assessment together provide the accountability measures for funding and program and practitioner support.
Program and practitioner outreach and support, including efforts to promote participation in the QRS, as well as technical assistance, training, mentoring, and other supports designed to assist programs and practitioners to improve quality by meeting the various quality criteria expressed in the standards.
Financing incentives specifi cally linked to compliance with quality standards, such as quality bonus payments, tiered reimbursement rates, contracts, quality grants, and wage supplements.
Parent education designed to ensure parents understand the QRS and how it benefi ts children, families, and the early care and education system as a whole. Parent education includes the development of a quality rating indicator or symbol that parents can use as a consumer guide. These symbols, which represent varying quality rating levels, are easy-to-understand indicators of quality such as a “fi ve-star” or “gold level” that parents can
2.
3.
4.
5.

United Way Success By 6® Stair Steps to Quality 5
Introduction to Quality Rating Systems
use when making decisions about the care and education of their children.
Where Are Quality Rating Systems?States and communities are responding to the grow-ing awareness of the importance of quality. They recognize the facts: quality in early care and educa-tion varies widely and overall program quality is not good enough.6 There is a long distance between current regulatory standards for early care and education programs and the high standards of na-tional accreditation. Few programs can bridge that
distance in one leap. QRS provide the stair steps to move upward in manageable increments.
The concept of employing a systematic approach to measuring quality and aligning investments to promote it is spreading among states. According to information compiled by the National Child Care Information Center (NCCIC) between March and July 2004, 10 states (Colorado, District of Columbia, Kentucky, Maryland, Montana, North Carolina, Oklahoma, Pennsylvania, Tennessee, and Vermont) reported having a QRS with multiple levels available throughout their state. New Mexico
States and Communities Operating or Exploring/Designing QRS
AK
CA
OR
WA
NV
ID
MT
WY
AZNM
TX
OK
CO
ND
SD
NE
KS
MN
MO
AR
LA
WI
IL
MS AL GA
TN
KY
OHPA
IN
VA
SC
NC
FL
MEVT
NH
RI
CTMA
DE
NJ
MD
HI
PR
MI
DC
WV
UT
NY
- Operating Statewide
- Operating Local
- Exploring/Designing
Los Angeles County
Palm Beach County
Kansas City
IA
Source: Data compiled by NCCIC as of June 2005.

6United Way Success By 6® Stair Steps to Quality6
reported plans to launch its new QRS in July 2005. Several states were in the pilot stage of developing a QRS. Georgia piloted in 14 counties and currently isexploring quality improvement approaches to take statewide. Metropolitan Kansas City has a local QRS and both Kansas and Missouri are exploring QRS as a statewide strategy. New York had a QRS in fi ve upstate counties and is now designing a state-wide system. Ohio is piloting QRS in eight counties (rural, urban, and suburban) and is exploring state-wide implementation. In a few states (California and Florida), communities have established QRS that are intended for local use. In 2005, at least 25 states (Alabama, Arizona, Arkansas, Connecticut, Delaware, Georgia, Illinois, Indiana, Iowa, Kansas, Louisiana, Maine, Michigan, Minnesota, Mississippi, Missouri, Nebraska, Nevada, New Jersey, New Mexico, New York, Ohio, Rhode Island, South Carolina, South Dakota, Washington, Wisconsin, and Wyoming) are in the process of exploring or designing a QRS. In sum, in the seven years since the fi rst statewide QRS was developed in Oklahoma, almost two-thirds of the states have adopted or are actively exploring QRS.
Another approach to recognizing and reward-ing program quality is tiered reimbursement. In 2004, more than two dozen states reported hav-ing a tiered reimbursement system, in which higher rates are paid to programs that meet higher standards than the state’s licensing regulations. Typically these have two levels—licensing and ac-creditation. Thirteen of these states, including six with statewide QRS (District of Columbia, Georgia, Kentucky, Maryland, Massachusetts, Montana, New Mexico, North Carolina, Oklahoma, South Carolina, Tennessee, Texas, and Washington) report tiered reimbursement with multiple lev-els (from three in South Carolina to six in New Mexico). For more information, see State Tiered Quality Strategies (TQS), 2004 on NCCIC’s Web site athttp://nccic.org/poptopics/statetqs.html.
Who Initiates Quality Rating Systems?Governors are often the initiators of QRS, either di-recting a state agency or commission to develop one or responding to recommendations for a QRS from commissions appointed by the governor to address early care and education. The impetus for some of the earlier QRS was welfare reform. Commissions charged with the task of reforming welfare almost invariably addressed child care, and quality was a common issue. In one state, the deaths of several children in child care during one summer caused the legislature to demand improvements in quality and regulation, which led to a QRS. In another, business leadership is largely responsible for the QRS. In many of the states now planning QRS, gov-ernors were champions of the concept as part of an overall strategy for promoting school readiness and/or building an early childhood system. Lately, the federal Maternal and Child Health Bureau’s grants (available to all states) to plan State Early Childhood Comprehensive Systems have provided the venue and support to develop QRS. In nearly every state, the state child care administrator is a key champion and leader in developing the QRS as a comprehensive strategy to improve services and build a system.
What Are the Goals of Quality Rating Systems?It is important to be clear from the beginning about the goals that will guide the creation of QRS. While improving quality is a primary goal, other goals may be priorities, and all will affect the system design. The goals that motivated states and communities to develop a QRS included one or more of the following:
Increase the overall quality of early care and education programs for all children
Introduction to Quality Rating Systems
United Way Success By 6® Stair Steps to Quality 7
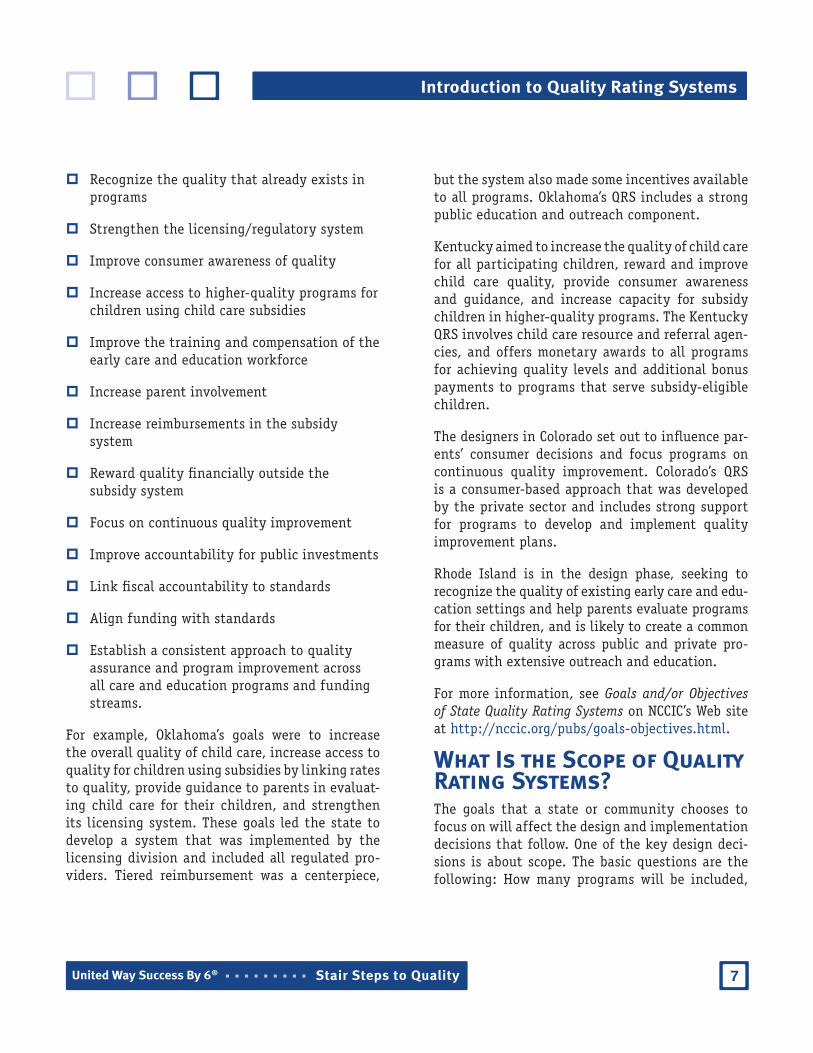
Recognize the quality that already exists in programs
Strengthen the licensing/regulatory system
Improve consumer awareness of quality
Increase access to higher-quality programs for children using child care subsidies
Improve the training and compensation of the early care and education workforce
Increase parent involvement
Increase reimbursements in the subsidysystem
Reward quality fi nancially outside the subsidy system
Focus on continuous quality improvement
Improve accountability for public investments
Link fi scal accountability to standards
Align funding with standards
Establish a consistent approach to quality assurance and program improvement across all care and education programs and funding streams.
For example, Oklahoma’s goals were to increase the overall quality of child care, increase access to quality for children using subsidies by linking rates to quality, provide guidance to parents in evaluat-ing child care for their children, and strengthen its licensing system. These goals led the state to develop a system that was implemented by the licensing division and included all regulated pro-viders. Tiered reimbursement was a centerpiece,
but the system also made some incentives available to all programs. Oklahoma’s QRS includes a strong public education and outreach component.
Kentucky aimed to increase the quality of child care for all participating children, reward and improve child care quality, provide consumer awareness and guidance, and increase capacity for subsidy children in higher-quality programs. The Kentucky QRS involves child care resource and referral agen-cies, and offers monetary awards to all programs for achieving quality levels and additional bonus payments to programs that serve subsidy-eligible children.
The designers in Colorado set out to infl uence par-ents’ consumer decisions and focus programs on continuous quality improvement. Colorado’s QRS is a consumer-based approach that was developed by the private sector and includes strong support for programs to develop and implement quality improvement plans.
Rhode Island is in the design phase, seeking to recognize the quality of existing early care and edu-cation settings and help parents evaluate programs for their children, and is likely to create a common measure of quality across public and private pro-grams with extensive outreach and education.
For more information, see Goals and/or Objectives of State Quality Rating Systems on NCCIC’s Web site at http://nccic.org/pubs/goals-objectives.html.
What Is the Scope of Quality Rating Systems?The goals that a state or community chooses to focus on will affect the design and implementation decisions that follow. One of the key design deci-sions is about scope. The basic questions are the following: How many programs will be included,
Introduction to Quality Rating Systems

8United Way Success By 6® Stair Steps to Quality8
i.e., will participation be voluntary or mandatory? Which program types will be included? and Will the system be implemented statewide from the beginning or will a pilot phase be needed?
Voluntary or Mandatory?Most QRS are voluntary and are for licensed programs. Conventional wisdom holds that a vol-untary approach will encounter less resistance than a mandate, making voluntary approaches easier to launch and implement. Mandatory ap-proaches may be resisted by programs as mandates without the help and support to meet them; simi-larly, state licensing staff may feel overburdened by the potential additional work of a mandatory system. On the other hand, mandatory approaches
involve the majority of programs, which may be an important goal. Voluntary systems can shift to being required when a critical mass of programs is participating successfully and a tipping point is reached. Only Tennessee has implemented a man-datory QRS. North Carolina established its QRS as a rated license, ensuring that all licensed programs participate and offering an incentive for programs not required to be licensed to seek licenses to gain access to QRS benefi ts. Oklahoma begins its QRS with licensed programs as the fi rst level (One Star). A mandatory QRS can be aligned with, but distinct from, the state’s program licensing system, or a QRS can be part of it, as in North Carolina’s rated license.
The Scope of Statewide Quality Rating Systems: Which Programs are Included?
StateChild Care Centers
Family Child Care Homes
Afterschool Programs
Head StartPublicPrekindergarten7
Colorado
District of Columbia
Kentucky
Maryland
Montana
North Carolina
Oklahoma
Pennsylvania
Tennessee
Vermont
Source: Data compiled by NCCIC between March and July 2004.
Introduction to Quality Rating Systems

United Way Success By 6® Stair Steps to Quality 9
There is an important consideration with QRS and licenses. Licenses are property rights with a ba-sis in statute, which usually grants authority to a specifi c agency to promulgate the details of the licensing requirements in regulation. Establishing a QRS as a rated license may make reducing or removing a quality rating from a program more dif-fi cult than if the QRS is not part of the program’s license. North Carolina is the only state that has established a QRS as a rated license. Displaying a program’s quality rating on the program’s license document is a helpful way to promote quality and advertise ratings to consumers, but this practice can be done without making the rating legally part of the license (rated license).
Which Program Types?States have made different choices about the scope of their QRS in terms of which types of programs are included. In all cases of statewide QRS, child care centers and family child care homes are in-cluded. Some QRS pilots, like those conducted in Pennsylvania, begin with center-based programs and expand to include family child care. Most states include school-age programs and Head Start in their QRS. Some include public prekindergarten programs as well.
In many respects, the goals of a QRS infl uence its scope; if creating a common quality measurement system that integrates all types of early care and education settings is the goal, then the scope will be broadly inclusive. On the other hand, if the goals are specifi c to improving child care for chil-dren using subsidies, then a narrower scope may be appropriate.
Statewide?A few communities have established QRS that are intended only for use in one location. For example, Palm Beach County in Florida has a local QRS, and
Los Angeles County in California is using a locally designed QRS to select programs to participate in its universal preschool program. A community may have infl uence beyond its boundaries that can spur action statewide. Local QRS can grow beyond their original location, becoming statewide, if care is taken in the design phase to ensure the system is relevant and feasible across the state.
Some states intentionally allow localities to take the lead and then work toward statewide imple-mentation. For example, the QRS spearheaded by United Way of Tucson, with two federal grants through the Early Learning Opportunities Act, advanced national accreditation in its community and began to design a QRS. Meanwhile, the gover-nor appointed a state School Readiness Board to develop and implement a variety of strategies. One item on its agenda was a QRS. Now the Tucson ef-fort has become the pilot for the governor’s plan for a statewide QRS in Arizona.
There are several reasons to establish a QRS as a statewide system. Parents will be able to refer to and use the same standards, regardless of where they live or move within the state. Public offi -cials will be able to measure child care and early education services using consistent standards throughout the state. As a statewide initiative, a QRS also can take full advantage of existing proj-ects, initiatives, and funding streams that support enhancing quality.
With or Without a Pilot Phase?Whether a pilot is necessary depends on several factors. For example, limited funding and/or po-litical support may require phased implementation at a slow to moderate pace; the features of the QRS may be suffi ciently different from current practices such that a testing phase would be prudent. There may be other system-building initiatives being
Introduction to Quality Rating Systems

10United Way Success By 6® Stair Steps to Quality10
implemented simultaneously, and all may need to be piloted. On the other hand, political and fi nan-cial support may be high, opening the window of opportunity for full-scale implementation as soon as practical. Rather than a pilot phase, a quickly implemented QRS will benefi t from a strong for-mative evaluation to ensure effective and rapid implementation.
Will the Quality Rating System Be Established in Statute or through Regulation? A question that should be considered when de-signing a QRS is whether to establish the system through agency regulation or in statute (in law). The answer depends on a state’s political context and history. Some states have historically used stat-ute for major policies; other states are accustomed to establishing policy through agency regulation. Regulation is generally more fl exible than statute when changes are needed; establishing the QRS in statute can provide permanence over time. If a statutory QRS is preferred, then it is essential to secure bipartisan legislative support early to de-velop the concept, and later for co-sponsors of the bill that will establish the QRS. Legislative support is the key to securing state funds for the QRS.
For more information, see Quality Rating Systems in Statute on NCCIC’s Web site at http://nccic.org/pubs/qrs-statute.html.
Introduction to Quality Rating Systems

11United Way Success By 6® Stair Steps to Quality
Introduction to Quality Rating Systems
Tools and Resources
Goals and/or Objectives of State Quality Rating Systems, by Judy Collins, NCCIC, available at http://nccic.org/pubs/goals-objectives.html.
Quality Rating Systems in Statute is available on NCCIC’s Web site at http://nccic.org/pubs/qrs-statute.html.
State Tiered Quality Strategies (TQS), 2004, by Tracy Dry, Judy Collins, Sheri Azer, Eric Karolak, and Laura Clark, NCCIC, provides summary information about all states that reported having a QRS and/or tiered reimbursement in 2004 and is at http://nccic.org/poptopics/statetqs.html.
Statewide Quality Rating Systems (QRS) Standards/Criteria: Web Sites provides the name, start date, and the URLs where general information about the QRS is located and those for the QRS standards/criteria. It is available on NCCIC’s Web site at http://nccic.org/poptopics/qrs-criteria-websites.html.
Endnotes1 “Program” is used throughout this guide as an
inclusive term that means all types of centers, schools, and family child care homes.
2 It is estimated that families pay about $40 billion a year for early care and education (Mitchell, Stoney, & Dichter, 2001).
3 See Appendix B for a summary of public funding for early care and education.
4 States use these quality set-aside funds for a variety of activities. By statute, states are required to set aside at least 4 percent of the total CCDF grant to improve quality. Twenty-three of 42 states surveyed reported spending 8 percent or more of CCDF on quality-related activities in Fiscal Year 2000 (U.S. General Accounting Offi ce, 2002).
5 States offer child care fi nancial assistance to qualifying low-income families. Programs that families choose are paid through a reimbursement approach in which rates may refl ect geography and the age or other characteristics of children. In tiered reimbursement, states provide higher rates of pay for child care centers and/or family child care homes that participate in the subsidy program and achieve one or more levels of quality beyond basic licensing requirements.
6 Research on the quality of child care centers and homes reveals that only about one-quarter are offering high-quality care with the rest rated poor to mediocre (Cost, Quality & Child Outcomes Study Team, 1995).
7 Not all states have prekindergarten programs.

12Stair Steps to Quality12 United Way Success By 6®
Introduction to Quality Rating Systems
KEY POINTS
Because a growing body of research has proven just how much quality matters and billions are being invested, states and communities have paid increasing attention to improving quality in early care and education.
QRS have fi ve common elements:
Standards
Accountability
Program and practitioner outreach and support
Financing incentives linked to compliance with quality standards
Parent education.
According to information compiled by NCCIC between March and July 2004, 10 states (Colorado, District of Columbia, Kentucky, Maryland, Montana, North Carolina, Oklahoma, Pennsylvania, Tennessee, and Vermont) reported having a QRS with multiple levels available throughout their state. New Mexico reported plans to launch its new QRS in July 2005.
In the seven years since the fi rst statewide QRS was developed in Oklahoma, almost two-thirds of the states have adopted or are actively exploring QRS.
It is important to be clear from the beginning about the goals that will guide the creation of QRS.
Most QRS are voluntary (only Tennessee has implemented a mandatory QRS).
Most QRS are established through agency regulation.
There are several reasons to establish a QRS as a statewide system. Parents will be able to refer to and use the same standards, regardless of where they live or move within the state. Public offi cials will be able to measure child care and early education services using consistent standards throughout the state. As statewide initiatives, QRS can also take full advantage of existing projects, initiatives, and funding streams that support enhancing quality.
Chapter II Getting Started
1313United Way Success By 6® Stair Steps to Quality
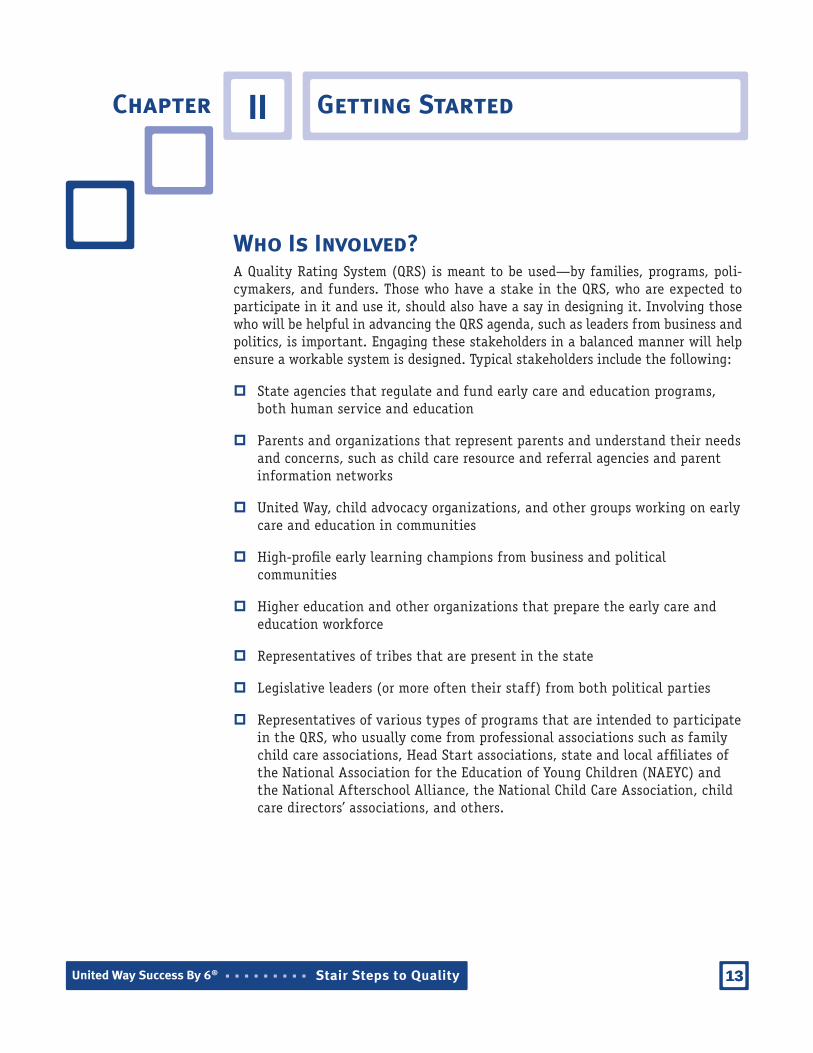
Who Is Involved?A Quality Rating System (QRS) is meant to be used—by families, programs, poli-cymakers, and funders. Those who have a stake in the QRS, who are expected to participate in it and use it, should also have a say in designing it. Involving those who will be helpful in advancing the QRS agenda, such as leaders from business and politics, is important. Engaging these stakeholders in a balanced manner will help ensure a workable system is designed. Typical stakeholders include the following:
State agencies that regulate and fund early care and education programs, both human service and education
Parents and organizations that represent parents and understand their needs and concerns, such as child care resource and referral agencies and parent information networks
United Way, child advocacy organizations, and other groups working on early care and education in communities
High-profi le early learning champions from business and political communities
Higher education and other organizations that prepare the early care and education workforce
Representatives of tribes that are present in the state
Legislative leaders (or more often their staff) from both political parties
Representatives of various types of programs that are intended to participate in the QRS, who usually come from professional associations such as family child care associations, Head Start associations, state and local affi liates of the National Association for the Education of Young Children (NAEYC) and the National Afterschool Alliance, the National Child Care Association, child care directors’ associations, and others.

14Stair Steps to Quality14
Getting Started
United Way Success By 6®
For a useful tool for identifying and engaging stakeholders in partnerships, see Questions for State-Level Leaders to Consider on the National Child Care Information Center (NCCIC) Web site at http://nccic.org/quilt/questions.html. A set of community mobilization technical assistance briefs developed by United Way of America®, called Mobilization Matters, is on the Web at http://national.unitedway.org/mobilization/mobilization_matters.cfm. Involving the right mix of constituencies in planning is key, and who asks particular individuals to participate can infl uence whether they agree. Trusted colleagues, respected peers, and well-known or high-profi le leaders can be infl uential.
How Does the Planning Process Work?The process of developing a QRS needs to be inclu-sive and participatory as well as effi cient. Some states have established a working group or steer-ing committee, which is fairly representative and of a reasonable size (20–30 individuals), to be re-sponsible for the overall design of the QRS. Often the steering committee is organized into subcom-mittees assigned to specifi c tasks. The steering committee will need to agree on a decision-making procedure—majority rule, consensus, or gradients of agreement approach. A gradients of agreement approach is a decision-making method that offers several options between yes and no, providing a clearer sense of group members’ positions on an issue. More information about this approach can be found in the Facilitator’s Guide to Participatory Decision-Making. In many cases, these overarching working groups are augmented and informed by related groups, such as task forces on specifi c as-pects of the design, that allow for participation by as many as several hundred additional stakehold-ers. The structure resembles concentric circles or a well-connected web of communication.
For example, Ohio’s planning process for its pilot QRS was inclusive and thoughtful, engaging a wide range of stakeholders. Ohio’s Department of Job and Family Services (ODJFS), along with eight Ohio foundations, funded the design of a voluntary three-star certifi cation system for licensed child care centers. More than 60 individuals represent-ing Ohio’s early care and education and school-age professionals, for-profi t and nonprofi t licensed pro-grams, the Ohio Child Care Resource and Referral Association, ODJFS and Ohio Department of Education agency personnel, and funders partici-pated in nine days of stakeholder group meetings over a two-year time frame. This group was charged with developing the blueprint for a voluntary rat-ing system.
After agreeing on principles and goals through a large group process, Wisconsin used an approach in which a small team developed a range of sys-tem design options for the large group to consider. This approach resulted in a design that was ap-proved unanimously in a process that took just six months. The Wisconsin approach is described in Developing a Child Care Quality Rating System: Wisconsin’s Approach, available at http://www.uwex.edu/ces/fl p/wccrp/pdfs/policy0305l.pdf.
Vermont used a focus group approach in which a small number of people conducted sessions in com-munities across the state to gather input and test potential design elements. Focus groups can be conducted with peers, including family child care providers alone, in mixed groups organized geo-graphically, and in other formations. The Vermont approach is described in A Summary of Focus Group Discussions on a Graduated System of Child Care Recognition, Final Report. For more information about this report, visit the NCCIC Online Library at http://nccic.org.

United Way Success By 6® Stair Steps to Quality 15
Getting Started
Typically, as the design of the QRS evolves, input is gathered on key decision points through broad participation. This participation helps ensure the QRS will be both grounded in the realities of ex-perience and well-understood by potential users. Ideally, responsibility for coordinating the overall process of developing the QRS should be someone’s job. This is often accomplished with donated time from staff in state agencies and/or state and community groups that secure private funds to support planners. For example, the United Way of Southeastern Pennsylvania donated staff time for coordinating the development of the statewide QRS. Assistance from many volunteers is necessary for the broad input required for a viable system de-sign; however, it is hard to develop a major system only with volunteer planners.
How Are Families Involved?The perspective of families is important in design-ing a QRS. For example, parents were members of a welfare reform commission that recommended development of a QRS in one state. In Ohio, fo-cus groups were conducted with parents to learn how they defi ned quality, what mattered to them, and what help they wanted in understanding the relative quality of different programs. Some states in the QRS design stage are planning to conduct similar efforts with families.
How Long Does It Take?For most states and communities, the process of developing a QRS involves a broad group of stake-holders working over an extended period of time across multiple systems. The design phase takes from 6–18 months and may be followed by a pilot phase to test the QRS before fi nal decisions are made. Final is a relative term; most states and communities consider their QRS to be a dynamic system that requires regular review and revision based on experience and evolving knowledge.
Who Are the Likely Allies and Opponents of Quality Rating Systems?The leaders among policymakers who have champi-oned the initial concept of QRS are obvious allies, as are families who want information on qual-ity and better ways to select programs for their children. Professional organizations in the early care and education fi eld are also generally strong supporters. Programs that provide early care and education can be both allies and opponents. Those who want to be recognized for the quality of the services they offer welcome QRS. Programs that believe they will not benefi t fi nancially, and that increased requirements will come without suffi -cient support to achieve or maintain them, have opposed QRS. In some states, the proprietary child care sector has opposed QRS because of the belief that new requirements will not be accompanied by fi nancial support (unfunded mandates) and because it opposes intrusion into what it regards as a private business. State departments of educa-tion (DOE) have been allies in most cases—eager to use the QRS in the state-funded, prekindergarten program and mindful of the impact of increased quality on school readiness. In at least one case, the state DOE changed from supporter to opponent when it became clear that some of the QRS require-ments would be diffi cult for schools to meet.
By far, the most successful strategy for increasing support and hearing and addressing concerns is to commit to open planning, design, and imple-mentation processes. State experience shows that closed planning leads to speculation and miscon-ceptions that can spread rapidly, undermining the effort. In one state, programs that were excluded from planning began to organize in opposition be-fore even knowing what the QRS might contain. Listening to all perspectives is essential, and

16Stair Steps to Quality16
Getting Started
United Way Success By 6®
communicating early, often, and through multiple means is key, which is why states use web-like, concentric planning processes that are capable of engaging hundreds of people and organizations. Posting materials such as meeting minutes and de-sign drafts on the Web for easy access, and inviting all who wish to be involved to join a communica-tion network such as a listserv or regular mailing list, can disarm much of the opposition and build broader support. The goals of communication are to inform all parties and increase the number of supporters and their enthusiasm for QRS.
What Are the First Steps?One of the fi rst steps planners in many states have taken is to contact NCCIC. The NCCIC Web site has a host of useful documents and tools, and NCCIC’s information services staff are available to answer questions. Several states and communities have implemented QRS, and models and insights are available. NCCIC can help connect you with these QRS pioneers. In addition, NCCIC technical assis-tance staff can help with planning and design, and are engaged with nearly every state that is plan-ning a QRS.
Once the planning group has been assembled, its fi rst task is to agree on common goals to set clear direction for the work ahead. The second task is to assess the state of early childhood and education services in the state or community to establish a realistic picture of the early care and education and afterschool systems. Questions include the fol-lowing: How many programs of what types exist in the state or community? How many are regulated? How many are accredited by national organiza-tions? What is the current status of qualifi cations in the workforce? What professional development is available? and How are public funds currently used to support quality?
For a complete list of questions, see Quality Rating Systems: Questions to Ask on NCCIC’s Web site at http://nccic.org/pubs/qrs-questions.html. Several resources are available to help answer some of these questions. The Web sites of the major national accrediting associations have information about accredited programs. The NCCIC publications, State Early Childhood Workforce Studies at http://nccic.org/poptopics/workforcestudy.html, and Size of the Early Childhood Workforce at http://nccic.org/poptopics/sizeworkforce.html, provide overviews of workforce studies, descriptions of data sources for workforce information, and Web links to data sites. Reviewing the systems developed by other states is a good idea at this stage of the design process. Statewide Quality Rating Systems (QRS) Standards/Criteria: Web Sites provides links to each state’s QRS and is available at http://nccic.org/poptopics/qrs-criteria-websites.html. Planners can draw on the experience of others systematically by studying their examples.
How Is Quality Defi ned?What do we know about early care and educa-tion? Children learn from the moment they are born, not the moment they enter formal school. Children learn through relationships with humans and interactions with their environment—the families and communities in which they live. We know that good early care and education programs produce positive results for overall child develop-ment and learning. Mediocre and poor programs do not produce good results and some may even harm children’s development and learning.
Positive results in development and learning occur in cognitive and language development, social and emotional competence, health, and physical de-velopment. High-quality early care and education programs produce school readiness—children who have knowledge, skills, and the ability to get along with others. High-quality early care and education

United Way Success By 6® Stair Steps to Quality 17
Getting Started
programs contribute to school achievement in liter-acy and mathematics in the primary grades and to the development of other learning and life skills. We also know that the positive results of quality early care and education programs accrue in some mea-sure to all participating children. All participating children benefi t; children who are at-risk because of poverty and other disadvantages benefi t more.
For a brief yet comprehensive summary of research on the effects of early care and education and program quality indicators, see Appendix C. Another useful resource on research-based aspects of quality is Regulating Dimensions of Quality in Early Care and Education: A Review of the Research, available from the National Association for Regulatory Administration’s Web site at http://www.nara-licensing.org/NARAQualityReport.pdf.
Several conclusions emerge from research on the effects of early care and education that have direct implications for QRS. First, high-quality programs can lead to dramatic benefi ts for children in terms of school readiness, later school achievement, and life-long success, yielding a positive return on investment for society. Second, the majority of program settings are not high quality; children who experience medio-cre or low-quality care do not demonstrate signifi cant gains and, in some situations, may be at developmen-tal risk or in danger. Program improvement is clearly needed. Third, we know the program variables that are associated with worthwhile outcomes for chil-dren, and that competent early childhood educators know how to improve quality.
How Does Research Evidence Inform a Quality Rating System?Research on program characteristics provides a fi rm foundation for determining quality criteria in a QRS. The program characteristics that are related
to good outcomes for children inform the devel-opment of the standards or categories of quality criteria that are the heart of a QRS. Taking account of all the research evidence, three major categories of important criteria emerge:
Structure—the size of the group of children and the ratio of staff to children in the group
Staff qualifi cations and characteristics—the teacher’s formal education, specifi c training, and experience; the administrator’s experience; and staff compensation and turnover
Program dynamics—this category has several aspects
Curriculum integrated across developmental areas (cognitive, language, approaches to learning, social, emotional, etc.)
Nature of the learning environment (teacher-child interactions, positive teacher behaviors, small-group activities, and implementation of the curriculum)
Engagement of parents, especially in educational activities at home with their children (reading to children, talking with them, etc.).
Some of the criteria in these categories often are refl ected in child care regulations; for example, group size and staff-child ratios, some aspects of staff qualifi cations, and certain learning activities. Similarly, research has informed the de-velopment of national accreditation standards. For example, the recently approved program standards for the NAEYC’s revised accreditation system, to be implemented in 2006, include 10 major categories: relationships, curriculum, teaching, assessment
1.
2.
3.
a.
b.
c.

18Stair Steps to Quality18
Getting Started
United Way Success By 6®
of child progress, health, teachers, families, com-munity relationships, physical environment, and leadership and management. This research on pro-gram characteristics and effects is a major resource for the development of standards in a QRS.
Communication about Quality Rating SystemsNot everyone will see the inherit benefi ts of QRS. Some may oppose QRS due to ideological concerns, which frequently include the belief that child care minimizes the role of parents. A strategy employed by supporters of QRS is listening to concerns, seeking common ground based on what is good
for children, and responding with facts that ex-plain why the QRS is being developed. Research on program quality is often part of the explanation, along with affi rmation that parents are children’s fi rst teachers and that many children are in out-of-home programs because their parents work.
In several states, commissions were charged with developing an overall strategy that included a QRS. Commission members included legislators from both parties. Some who were originally skeptical re-sponded favorably to research on program features, quality criteria, and child development outcomes. Effective communication involves both message—facts and information—and messenger. Choosing the right messenger is key, so it is important to be thoughtful about who is picked.

United Way Success By 6® Stair Steps to Quality 19
Tools and Resources
Developing a Child Care Quality Rating System: Wisconsin’s Approach (2005), by David Edie, Diane Adams, Dave Riley, and Mary Roach, is available at http://www.uwex.edu/ces/fl p/wccrp/pdfs/policy0305l.pdf.
For information about the Facilitator’s Guide to Participatory Decision-Making (1996), by Sam Kaner, Lenny Lind, Catherine Toldi, Sarah Frisk, and Duane Berger, contact New Society Publishers at 250-247-9737 or visit the Web at http://www.newsociety.com/.
Mobilization Matters, a set of community mobilization technical assistance briefs developed by United Way of America, is on the Web at http://national.unitedway.org/mobilization/mobilization_matters.cfm.
National Accreditation Organizations and Standards for Early Childhood Programs: Web Sites provides a list of national accreditation systems for early care and education programs and links to their accreditation standards and criteria, available on NCCIC’s Web site at http://nccic.org/poptopics/nationalaccred-websites.html. To fi nd out how many programs are accredited by state, visit the following Web sites:
National Afterschool Association: http://www.naaweb.org/accreditation.htm
National Association for the Education of Young Children: http://www.naeyc.org/accreditation/search/
National Association for Family Child Care: http://www.nafcc.org/accred/search.html
Quality Rating Systems: Questions to Ask, by Judy Collins, NCCIC, at http://nccic.org/pubs/qrs-questions.html.
Questions for State-Level Leaders to Consider (2002), prepared by the Education Development Center and NCCIC, is available at http://nccic.org/quilt/questions.html.
Regulating Dimensions of Quality in Early Care and Education: A Review of the Research (2002), by Judith Colbert, is available from the National Association for Regulatory Administration’s Web site at http://www.nara-licensing.org/NARAQualityReport.pdf.
Size of the Early Childhood Workforce on NCCIC’s Web site at http://nccic.org/poptopics/sizeworkforce.html.
State Early Childhood Workforce Studies on NCCIC’s Web site at http://nccic.org/poptopics/workforcestudy.html.
Statewide Quality Rating Systems (QRS) Standards/Criteria: Web Sites provides links to each state’s QRS and is available on NCCIC’s Web site at http://nccic.org/poptopics/qrs-criteria-websites.html.
For more information about A Summary of Focus Group Discussions on a Graduated System of Child Care Recognition, Final Report (2001), prepared by Deb Curtis and Kathy Bayles, Learning Partners, Inc., visit the NCCIC Online Library at http://nccic.org.
Information about the revised standards for NAEYC accreditation is on NAEYC’s Web site at http://www.naeyc.org/accreditation/nextEra.asp.
Getting Started

Engaging stakeholders—families, programs, funders, policymakers, and business and political leaders—in a balanced manner will help ensure a workable system is designed.
States use web-like, concentric planning processes that are capable of engaging hundreds of people and organizations. There is usually a steering committee and several related work groups.
The process of developing a QRS involves a broad group of stakeholders working over an extended period of time across multiple systems. The design phase takes from 6–18 months.
By far, the most successful strategy for increasing support for a QRS and addressing any opposition is to commit to open planning, design, and implementation processes.
Ideally, responsibility for coordinating the overall process of developing the QRS should be someone’s job.
High-quality early care and education programs produce positive results for the overall development and learning of participating children in the areas of cognitive and language development, social and emotional competence, health, and physical development.
Program variables that are associated with worthwhile outcomes for children include structure, staff qualifi cations and characteristics, and program dynamics.
Research on program variables provides a fi rm foundation for determining quality criteria in a QRS. The program characteristics that are related to good outcomes for children inform the development of the standards or categories of quality criteria that are the heart of a QRS.
20Stair Steps to Quality20 United Way Success By 6®
KEY POINTS
Getting Started

Chapter III Tiered Standards
S tandards1 are the foundation of a Quality Rating System (QRS). As noted earlier, program standards are primarily evidence-based; they are based on research about the characteristics of programs that produce positive
child outcomes. Standards, or quality criteria, are also based on community and family values, such as respect for diversity. The standards in a QRS help focus the early care and education industry, parents, and policymakers on what matters most in early care and education settings—the features that can produce impor-tant positive outcomes for children and the characteristics that are valued by the community and families.
What Standards Already Exist and What Needs to Be Developed? The fi rst step is to consider mandatory and voluntary program standards that al-ready apply to programs in the state or community. The federal Head Start Program Performance Standards apply to all Head Start programs no matter where they are located or what kind of entity operates them.
National accreditation systems have program standards. Most states have a pre-kindergarten program and many of these have program standards. Some state education departments have voluntary program standards for preschools. Child care programs—in centers and homes—are regulated in every state.2 Some com-munities have local program licensing standards in addition to, or instead of, state regulations.
Most states now have early learning guidelines or child outcome standards. Standards for personnel are also relevant; most states have established an early childhood teaching license or certifi cate. Many states offer credentials such as those for directors or children’s program administrators, as well as for other roles. Understanding what is contained in each of these sets of standards is the start for developing QRS standards.
A set of helpful tables for afterschool, family child care, and early childhood education programs has been developed, which can be used to compare state standards with national accreditation and Head Start Program Performance Standards. The tables include maximum staff-child ratios, maximum group/class size, minimum teacher qualifi cations, and can be downloaded from the Web and customized for a state.
2121United Way Success By 6® Stair Steps to Quality

The Foundation of a Quality Rating System:Compliance with State Licensing Requirements
State licensing requirements establish the foundation for operating child care programs in centers and homes in a particular state. These regulations specify the minimum standards that must be met to op-erate legally and are the fi rst step in a QRS, which also will have several steps above licensing, leading to the top step that represents the highest quality. Every state exempts certain categories of programs from regulation. Typically, these exemptions are for religious-affi liated programs, public school-based programs, and/or programs that operate only a few hours per day, such as nursery schools. Compliance with licensing requirements is essential for all programs that are subject to them. Some states consider being licensed as the fi rst star in their QRS (e.g., Oklahoma); some begin the ratings above licensing (e.g., Colorado and Tennessee). North Carolina has integrated quality rating into its licensing system, creating a rated license with fi ve levels; all programs must have at least one star, meeting basic licens-ing requirements. The higher star levels (2–5) are voluntary.
See the following QRS planning tools: Standards for Early Childhood Education Programs at http://nccic.org/poptopics/qrs-pt-ece.html, Standards for Family Child Care Programs at http://nccic.org/poptopics/qrs-pt-fcc.html, and Standards for School-Age Care Programs at http://nccic.org/poptopics/qrs-pt-sac.html.
What Categories of Quality Criteria Are Commonly Used?The key research-based criteria are group size, staff-child ratios, staff qualifi cations, aspects of the learning environment, and parent/family engagement. Comparing these criteria across the existing sets of standards provides a framework to begin developing the tiers of standards that will become the QRS. Common categories of quality criteria used in states’ QRS standards include the following:
Staff qualifi cations and professional development—formal education (degrees in early education, child development,
or related fi elds) and credentials (Child Development Associate) for teaching staff and administrators, training hours, professional development plans and activities, and membership in professional associations
Learning environment—curriculum, developmentally appropriate materials and equipment, learning centers, and reading to children
Family involvement—best practices of family involvement such as parent-teacher conferences, regular communication systems, and parent handbooks, more intensive practices such as parent-support groups and family resource centers, and family-friendliness
Licensing status and/or compliance history—usually a current valid license and a history of good compliance (i.e., few violations, no uncorrected violations, and no serious violations) are included to ensure
22United Way Success By 6® Stair Steps to Quality22
Tiered Standards

health and safety criteria, which are important to families
Group size and ratios—progressively better ratios and smaller group sizes as the steps advance toward high quality, which are important criteria in states that either allow large group sizes or do not regulate group size and allow high ratios
Program evaluation—improvement plans based on formal assessments such as environment rating scales, parent and staff surveys, self-assessment, and demonstrated progress on meeting benchmarks for improvement, such as reducing staff turnover
Compensation—best practices such as salary schedules that reward formal education qualifi cations and experience, and benefi ts such as health insurance, paid leave, retirement, and reduced-rate child care
Administrative policies and procedures—regular staff meetings, planning time, written job descriptions, personnel policies, and annual performance evaluations.
For more information, see Common Categories of Criteria Used in State Quality Rating Systems, avail-able on the National Child Care Information Center (NCCIC) Web site at http://nccic.org/pubs/qrs-comcat.html.
National Accreditation and Quality Rating Systems CriteriaNational accreditation standards and criteria cover most, if not all, of the various QRS criteria out-lined in the last section. For that reason, nearly all QRS include national accreditation, most com-monly accreditation from the National Association for the Education of Young Children (NAEYC), the
National Association for Family Child Care, the National AfterSchool Association, the Council on Accreditation, and the National Early Childhood Program Accreditation. Accreditation is typically placed at the top level in a building block ap-proach, or generates a signifi cant number of points in a point-based rating system.
Eight states have developed procedures and tools to evaluate and approve accrediting organizations that apply to be recognized within the state’s QRS and/or tiered reimbursement system. For more in-formation about District of Columbia’s, Missouri’s, and Oklahoma’s resources, visit the NCCIC Online Library at http://nccic.org. The Florida Department of Children and Families’ Departmental Procedures for Gold Seal Accreditation is on the Web at http://www.dcf.state.fl .us/childcare/docs/gsapp.pdf.
The table on the next page shows the most com-monly included accreditation systems and the number of programs across the nation that have been accredited by each as of April 2005.
How Are the Tiers or Steps Determined?Determining the number of tiers or steps in a QRS depends on several factors, including the following:
The difference between the criteria in licensing requirements and those in the highest set of standards currently in place (usually this will be national accreditation or prekindergarten standards). If the difference is great, then more steps may be needed to allow programs to make progress toward higher quality.
The current status of the early care and education industry in terms of particular criteria. For example, it is important to
1.
2.
United Way Success By 6® Stair Steps to Quality 23
Tiered Standards

determine if the majority of staff in centers meet only the minimum staff qualifi cations required in licensing, or if many have education and training beyond that. If most are above the required minimum, then fewer steps may be needed.
The differences between steps need to be manageable, so movement toward higher quality is achievable within a reasonable time frame. In existing state-wide QRS, the number of steps ranges from two steps above licensing in Montana to fi ve in Vermont. The most common number of steps is four.
A related question is whether to begin with licens-ing as the fi rst step in the QRS, or begin the QRS above licensing. The answer depends on the goal of the QRS. If the goal is to recognize existing high quality, then beginning with licensing may not be reasonable. If the goal is to include as many pro-grams as possible, then beginning the QRS with licensing as the fi rst step will automatically in-clude all regulated programs in the system. The downside is that the QRS will, by default, include some low-quality programs; thus, it is imperative to be clear what the fi rst level represents and en-sure differences among levels are meaningful.
National Accreditation Organizations for Early Childhood ProgramsCenters (Early Childhood and Afterschool)Organization Number of Programs
Association of Christian Schools International (ACSI) Preschool Accreditation Program
88
Council on Accreditation (COA) 152 agencies
National Accreditation Commission for Early Care and Education Programs (NAC)
135
National Accreditation Council for Early Childhood Professional Personnel and Programs (NACECPPP)
Not Available
National Association for the Education of Young Children (NAEYC) Academy for Early Childhood Program Accreditation
10,128
National Early Childhood Program Accreditation (NECPA) More than 110
National Lutheran School Accreditation (NLSA) 333
National AfterSchool Association (NAA) 543
Family Child Care HomesOrganization Number of Programs
National Association for Family Child Care (NAFCC) 2,369
Source: Data compiled by NCCIC as of April 2005.
24United Way Success By 6® Stair Steps to Quality24
Tiered Standards

QRS have taken one of two approaches to determine rating steps: using discrete levels (the building block approach) or a point system. In the build-ing block approach, standards are set for criteria in each major category, increasing at each step. Programs must meet the standards for all catego-ries at the fi rst step before moving up to the next step. The QRS in the District of Columbia, Kentucky, Montana, Oklahoma, and Pennsylvania use the building block approach. The other approach is to assign points to various criteria in each category. The total of points across all categories determines the program’s step. For example, if the highest possible score across all criteria areas is 40, then step one might be scores up to 10 points, step two would be 11–20, and so on. The QRS in Colorado, North Carolina, Tennessee, and Vermont use the points approach. The building block approach en-sures consistency of quality among programs with the same rating and outlines a clear pathway to higher quality. The points approach permits a wider range of quality criteria to be included, recogniz-ing the diversity among programs and outlining multiple pathways to higher quality. A potential pitfall of the points approach is that a program may earn many points in one category and none in others, providing an uneven measure of quality among programs. To prevent this, a point system can be designed to require that some points be earned in each category and/or ensure the score to earn a high-level rating equals more than the maximum points that can be earned in any one or two areas.
An essential part of a QRS is the use of easily un-derstood symbols to identify each quality level. By far, the most common approach is to use increasing numbers of stars. This is a familiar model that is used in rating restaurants, lodging, and consumer goods. The other approach is to use gold, silver, and bronze seals, or other symbols reminiscent of fi rst, second, and third place athletic medals.
How Does Program Accreditation Relate to Quality Rating System Steps?Accreditation systems have been in existence for several decades, and their criteria refl ect the re-search on effects of early care and education and best practices in the fi eld. Accreditation standards are generally high and cover aspects of program quality ranging from staff qualifi cations, group size, and ratios to curriculum, family involvement, and management. When states began to implement tiered reimbursement in their child care subsidy systems in the 1990s, they usually had two rates: one for licensed programs and a higher rate for accredited programs. Experience in some states showed that fewer programs than expected were able to attain accreditation, leading some states to develop tiered reimbursement systems with more levels between licensing and accreditation, and rates that increased with these levels. New Mexico, South Carolina, and Texas used this approach. Strategies to bridge the gap between licensing and accreditation led to the development of QRS.
States that have developed a QRS commonly in-clude accreditation on the highest step in their QRS. For example, Pennsylvania’s Keystone STARS system has four levels. To be rated at the Four Star level, a program can be nationally accredited or meet the Keystone STARS performance standards for the Four Star level. In some cases, the QRS re-quires accreditation and additional criteria be met at the top step. To achieve Oklahoma’s top level, programs must be accredited and meet all the cri-teria for top-level status. Other states’ QRS assign points for accredited status along with the points assigned to other quality criteria (Colorado and Vermont).
United Way Success By 6® Stair Steps to Quality 25
Tiered Standards

Are Quality Rating System Standards Aligned with Early Learning Standards?The QRS standards include both standards for pro-grams (the structure and dynamic criteria in the previous section) and standards for practitioners (staff qualifi cations). In recent years, states have developed learning guidelines for young children that specify what children should know and be able to do at different ages, and are sometimes called early learning standards, child outcomes standards, learning expectations, or learning results. President Bush’s Good Start, Grow Smart initiative asked all states to report their prog-ress in developing early learning guidelines for preschoolers in language and math; many states have done more. For example, Connecticut is one of several states that is developing Early Learning Guidelines for Infants and Toddlers. For a summary of state efforts, see Status of State Efforts to Develop and Implement Early Learning Guidelines (ELGs) on NCCIC’s Web site at http://nccic.org/pubs/goodstart/elg-efforts.html.
These early learning guidelines inform the standards for programs, which specify the characteristics that programs must have so children learn. In turn, the standards for personnel or practitioners spell out what adults need to know and be able to do so chil-dren learn. Standards that are aligned are mutually reinforcing—each informs the other—and together form a strong foundation for defi ning quality in a system of early care and education.
As part of the implementation of their early learn-ing guidelines/standards, states such as Ohio and Rhode Island developed training on understanding and implementing the guidelines/standards. Several states have started to align the content of their
early learning guidelines with the content specifi ed in their professional development systems.
States are beginning to align program standards in their QRS with their early learning guidelines/standards. Ohio developed Early Learning Content Standards for preschool-aged children and is cur-rently piloting a QRS for center-based early care and education programs that has three steps above licensing. One of the fi ve categories of quality cri-teria in the pilot QRS is early learning. At the top step, each classroom must have a lead teacher with at least 10 hours of in-service training in language and literacy development, use a child assessment system aligned with the Ohio Early Learning Content Standards, and implement a literacy ac-tion plan developed using the Early Language and Literacy Classroom Observation tool.
Are Quality Rating Systems Related to Child Outcomes?There is growing evidence of the relationship be-tween program quality and child outcomes. The RAND Corporation is conducting a three-year longi-tudinal study of the effectiveness of the Qualistar Rating System in Colorado. Results to date dem-onstrate strong positive correlations between Qualistar ratings and other measures of program quality. The study is continuing to investigate the relationship between Qualistar ratings and social and cognitive child outcomes, and whether child development outcomes improve when program quality increases. Further reports are expected in the summer of 2005 and will be noted on the Qualistar Web site at http://www.qualistar.org; fi nal reports will be available in December 2006.
In North Carolina, research on Smart Start has shown that children who attended higher-quality
26United Way Success By 6® Stair Steps to Quality26
Tiered Standards

centers scored signifi cantly higher on measures of skills and abilities considered important for school success, compared to children from lower-quality centers. See Smart Start and Preschool Child Care Quality in North Carolina: Change Over Time and Relation to Children’s Readiness at http://www.fpg.unc.edu/smartstart/reports/Child_Care_Quality_2003.pdf.
According to a recent study in Minnesota, better child outcomes are linked to NAEYC program ac-creditation. The study compared child outcomes of 226 children in NAEYC accredited child care centers to child outcomes of the 3,000 children in the statewide Minnesota school readiness survey. Nearly twice as many children in the accredited centers were rated as profi cient—i.e., ready for school—compared to children statewide. In the accredited centers, children from lower-income and higher-income families performed similarly well, and children of color performed as well as white children. Children from lower-income families in the accredited centers had much higher profi cien-cy scores than children from lower-income families in the statewide sample. See School Readiness in Child Care Settings at http://edocs.dhs.state.mn.us/lfserver/Legacy/DHS-4362-ENG.
Better child outcomes and improved school readi-ness are salient public policy goals. Knowing that the quality of programs is positively linked to child outcomes increases the urgency and importance of developing a QRS. Understanding that program quality is directly linked to children’s school readiness has been a compelling argument causing policymakers to act in support of QRS. Experienced QRS implementers caution that QRS planners need to be realistic about the results policymakers can expect in a reasonable time frame.
Endnotes
1 “Standards” in the context of a QRS refers to program standards and practitioner standards. QRS standards can be aligned with, but are distinct from, early learning standards for children.
2 In some states, licensing regulations do not include important regulatable criteria such as group size, or may set low requirements for other criteria. In some of these cases, rather than working to change the regulations, effort is directed to establish a QRS that sets levels higher than the regulations and addresses important criteria.
3 This number does not refl ect early childhood programs within an elementary school.
United Way Success By 6® Stair Steps to Quality 27
Tiered Standards

Tools and Resources
Accreditation approval tools—For information about policy guidelines and applications for accrediting institutions for the District of Columbia; accreditation evaluation criteria from the District of Columbia; the Accreditation Organization Evaluation and Scoring Instrument for Missouri; and the policies and the Approval of Accreditation Programs Evaluation and Scoring Instrument for Oklahoma, visit the NCCIC Online Library at http://nccic.org. Departmental Procedures for Gold Seal Accreditation, by the Florida Department of Children and Families, is available at http://www.dcf.state.fl .us/childcare/docs/gsapp.pdf.
Common Categories of Criteria Used in State Quality Rating Systems, by Judy Collins and Tracy Dry, NCCIC, is available at http://nccic.org/pubs/qrs-comcat.html.
Decision Points and Options for Weaving Early Learning Guidelines into Professional Development on NCCIC’s Web site at http://nccic.org/pubs/goodstart/dpweavingelg.html, and Discussion Questions on Embedding Early Learning Guidelines in the Professional Development (PD) System on NCCIC’s Web site at http://nccic.org/pubs/goodstart/embed-tool.html.
National Accreditation Organizations for Early Childhood Programs, is on NCCIC’s Web site at http://nccic.org/poptopics/nationalaccred.html.
National Accreditation Organizations and Standards for Early Childhood Programs: Web Sites provides a list of national accreditation systems for early care and education programs and links to their accreditation standards and criteria, available on NCCIC’s Web site at http://nccic.org/poptopics/nationalaccred-websites.html.
Quality Rating Systems and the Impact on Quality in Early Care and Education Settings, on NCCIC’s Web site at http://nccic.org/poptopics/qrs-impactqualitycc.html, describes research on the process and impact of QRS in states.
Quality Rating Systems Planning Tool: Standards for Early Childhood Education Programs is available at http://nccic.org/poptopics/qrs-pt-ece.html, Quality Rating Systems Planning Tool: Standards for Family Child Care Programs is available at http://nccic.org/poptopics/qrs-pt-fcc.html, and Quality Rating Systems Planning Tool: Standards for School-Age Care Programs is available at http://nccic.org/poptopics/qrs-pt-sac.html.
School Readiness in Child Care Settings: A Developmental Assessment of Children in 22 Accredited Child Care Centers (2005), by the Minnesota Department of Human Services, is available at http://edocs.dhs.state.mn.us/lfserver/Legacy/DHS-4362-ENG.
Smart Start and Preschool Child Care Quality in North Carolina: Change Over Time and Relation to Children’s Readiness (2003), by the Frank Porter Graham Child Development Institute-University of North Carolina at Chapel Hill, is available at http://www.fpg.unc.edu/smartstart/reports/Child_Care_Quality_2003.pdf.
Statewide Quality Rating Systems (QRS) Standards/Criteria: Web Sites, includes the Web site address for QRS standards for each state that has this information on the Web, and is available on NCCIC’s Web site at http://nccic.org/poptopics/qrs-criteria-websites.html.
Status of State Efforts to Develop and Implement Early Learning Guidelines (ELGs) summarizes the status of development and the age range of states’ early learning guidelines, which are linked to the Good Start, Grow Smart initiative, and is available on NCCIC’s Web site at http://nccic.org/pubs/goodstart/elg-efforts.html.
28United Way Success By 6® Stair Steps to Quality28
Tiered Standards

United Way Success By 6® Stair Steps to Quality 29
Tiered Standards
KEY POINTS
The standards in a QRS help focus the early care and education industry, parents, and policymakers on what matters most in early care and education settings—the features that can produce important positive outcomes for children and the characteristics that are valued by the community and families.
The fi rst step is to consider the mandatory and voluntary standards that are already in place for programs in the state or community.
Common quality criteria used by states in standards are staff qualifi cations and professional development, learning environment, family involvement, group size and staff-child ratios, program evaluation, and personnel and administrative policies.
Nearly all QRS include national program accreditation.
The number of steps in a QRS depends on the distance between the lowest and highest existing regulations in a state and the current quality status of programs. The differences between steps need to be manageable so movement toward higher quality is achievable within a reasonable time frame.
States use either a building block approach or a point system to determine QRS levels.
An essential element of a QRS is easily understood symbols to identify each level. By far, the most common is increasing numbers of stars.
States are beginning to align program standards in their QRS with the state early learning guidelines (learning standards for children).
There is growing evidence that QRS are related to positive child outcomes.


Chapter IV Accountability
S tandards cannot stand alone; any set of standards must have an assessment system to measure compliance. Accountability is the process of using valid and reliable methods of assessment to monitor compliance with a set of
standards. Standards are statements of expectations—what should happen in early care and education settings. Assessment is a systematic procedure for obtaining information to make a judgment about the component of quality that a particu-lar standard addresses, and across all standards, to assign a quality rating. Each standard, or category of quality criteria, in a Quality Rating System (QRS) must be monitored and the assessment method for each standard specifi ed. Monitoring is the means of keeping track of compliance with each of the standards.
A QRS is primarily concerned with program assessment. The purpose of the assess-ment is to determine a quality rating for a program, which is a fairly high-stakes decision. Such a decision requires the assessment be focused on content that is evidence-based, meaning that measured standards are supported by research, multiple sources of data are used, and assessments are highly reliable and valid. Assessment and monitoring are the basis for assigning quality ratings, which provide a benchmark for measuring improvement in the quality of care and educa-tion. Assessment and monitoring are the accountability measures for funding and for the effectiveness of program and practitioner support.
Generally, accountability is the willingness to be held responsible for actions or results. A QRS is accountable to several audiences: funders, consumers, policymak-ers, and programs. Government and private funders invest to improve quality; the QRS accountability system ensures their investment results in higher quality. To be accountable to parents, a QRS must be sure ratings are accurate in differentiat-ing levels of quality so consumers know what they are purchasing. For programs, a QRS is accountable for an assessment and monitoring system that can be trusted to give fair and reliable ratings. In turn, many of these audiences are accountable to the QRS for providing the fi nancial, technical, and other resources to ensure the overall accountability of the QRS.
Key questions for developing a QRS include the following: How will each standard be assessed (What tools, procedures, methods will be used?)? Who will conduct the assessment and monitoring (What staffi ng is required? Will self-assessment and/or self-reporting be used?)? and How often will assessment and monitoring be per-formed (What is the frequency of assessment?)?
3131United Way Success By 6® Stair Steps to Quality

What Monitoring Currently Occurs?Each of the standards that already exists for various early childhood programs has some assessment and monitoring component. For the sake of effi ciency, the place to start is with these existing standards. How are these monitored now, by whom, and how often? State licensing regulations are monitored for compliance through a combination of document review and direct observation (onsite visits) by outside inspectors using checklists and observa-tion tools. Accreditation systems typically combine a comprehensive report, prepared by the program seeking accreditation, with an onsite assessment that validates the information in the self-report, and with the accreditation decision made by a sepa-rate body. Head Start programs are required to meet Head Start Program Performance Standards, which are monitored using the PRISM (Program Review Instrument for Systems Monitoring) in an annual self-assessment and in an onsite review by a team of outside experts at least once every three years. Prekindergarten program standards most often are monitored through annual written self-reports, sometimes with onsite observation. Prekindergarten monitoring varies widely among states.
Ideally, an integrated approach to monitoring for the QRS can be built on the foundation of systems that already exist. For each category of quality criteria in the QRS, two basic questions must be answered: How will this be assessed? Are these criteria already being monitored by an existing system (by state licensing, in accreditation, by Head Start)?
Some criteria are easily reported and monitored; for example, staff qualifi cations can be verifi ed by transcripts or copies of degrees or credentials. Some states have personnel registries (databases
with individual records of education, training, and other pertinent qualifi cations). Other criteria may require new assessment tools and monitoring strat-egies. For example, many QRS include the learning environment as a category of quality criteria. Curriculum may be part of the learning environ-ment and can be partially assessed by submission of a curriculum manual. Determining whether the curriculum is implemented may require direct ob-servation. Oklahoma requires posted lesson plans, which can be observed during a site visit. If learn-ing environment criteria are more extensive, an observational assessment tool, such as an environ-ment rating scale, may be used to monitor this category. Some criteria, such as staff-child ratios, need to be monitored carefully at various times during the program day to ensure accuracy.
National accreditation and Head Start are examples of systems with standards that address all or near-ly all the categories of quality criteria that a QRS generally includes and that use valid and reliable assessments. For this reason, it is sensible to con-sider how to include accreditation and compliance with Head Start standards in a QRS. Programs that have achieved national accreditation from major accrediting bodies have submitted documentation and been visited to ensure they meet standards in teacher qualifi cations, group size and ratio, learn-ing environment and curriculum, and management and administration. It is ineffi cient to require Head Start and nationally accredited programs to be assessed and monitored a second time for crite-ria that already have been met. Such programs can submit as evidence for the QRS the reports from their monitoring bodies. QRS monitoring for these programs can be designed to address only those criteria that are not assessed through Head Start or national accreditation systems, saving valuable assessment and monitoring resources.
32Stair Steps to Quality32
Accountability
United Way Success By 6®

Will an Environment Rating Scale Be Used?This is an important question with cost and va-lidity implications. Environment rating scales are used as assessment tools mainly for two ar-eas of QRS categories: learning environment and program evaluation. Eight of the 10 states with a statewide QRS require the use of an environment rating scale (Montana and Vermont do not). All of these QRS use environment rating scales developed by Thelma Harms, Richard Clifford, and Deborah Cryer at the University of North Carolina at Chapel Hill. There are four scales: Early Childhood Environment Rating Scale-Revised (ECERS-R), Infant/Toddler Environment Rating Scale-Revised, Family Day Care Rating Scale, and School-Age Care Environment Rating Scale. For more information about these scales, visit the Frank Porter Graham Child Development Institute’s Web site at http://www.fpg.unc.edu/~ecers/.
While there is some variation in how the scales are used, annual rating is the norm, and the predominant approach is to require that one-third of the class-rooms in a center (or the entire program in a home) be rated annually using setting- and age-appropriate scales. Classroom scores are usually averaged for a total center score. There are exceptions, as Maryland requires each classroom to be rated annually and es-tablishes a minimum classroom score for each level of its QRS. Colorado and the District of Columbia rate all classrooms annually and average the scores for a center score, and North Carolina uses the lowest classroom score. Oklahoma requires that one class-room, randomly selected, be assessed every two years and uses the results to guide technical assistance but not to assign a quality rating.
Environment rating scales can be administered as a self-assessment or by outside observers. For example, Maryland requires an outside observer to
conduct the environment rating only at the top two levels of its system; programs at level two or below conduct a self-assessment. Some states (the District of Columbia, Kentucky, Maryland, and Tennessee) require a specifi c numerical score on an environment rating scale for each level of their QRS; one state awards points equal to the environ-ment rating scale score (North Carolina).
Using any standardized assessment tool reliably, whether it is one of the environment rating scales or another tool, requires that assessors/observ-ers be well trained. Inter-rater reliability must be ensured and checked regularly; best practice for research purposes is inter-rater reliability of 85 percent or higher. These requirements make using any standardized onsite observational assessment more costly than other assessment methods.
What Other Assessment Methods Can Be Used?Estimating program quality may be possible with-out direct observation of classrooms, according to a report from the Wisconsin Child Care Research Partnership, What Can Research Contribute to Child Care Consumer Rating Systems?, available at http://www.uwex.edu/ces/flp/wccrp/pdfs/brief13.pdf. Centers’ scores on fi ve quality indicators (teacher education, wages, experience, director education, and program accreditation) that are easily re-ported without direct observation were compared with their scores on the ECERS-R. Centers were given stars for performance on the fi ve indicators, and the result was a direct positive relationship between scores on the reportable quality indica-tors and the ECERS-R scores. For more information, see Common Categories of Criteria Used in State Quality Rating Systems on the National Child Care Information Center (NCCIC) Web site at http://nc-cic.org/pubs/qrs-comcat.html.
United Way Success By 6® Stair Steps to Quality 33
Accountability

Overall, assessment and monitoring should be as simple and effi cient as possible while maintain-ing validity. Monitoring tools, such as forms and checklists, can be developed for the QRS to ease reporting for participating programs and mini-mize the labor of monitoring. Technology can be developed to increase the effi ciency of monitoring. Self-reporting with adequate documentation and verifi cation can be the base of the monitoring sys-tem; e.g., accreditation is verifi ed by submitting the certifi cate issued by the accrediting body, and staff qualifi cations are verifi ed by a report from the state personnel registry. The labor-intensive aspects of assessment and monitoring are directly
related to those criteria that require onsite obser-vation to assess or verify.
Who Is Responsible for Monitoring and Assessment?QRS are generally administered by state agencies, usually the agency responsible for child care assis-tance and/or child care licensing. The Tennessee Report Card and Star Quality Program are admin-istered by employees of the licensing agency. In many cases, part of the administration of QRS may be contracted to private-sector organizations such as child care resource and referral agencies
0 1 2 3
No Response
Private Entity
Licensing Agency & Private Entity
Subsidy Office & Private Entity
Licensing Agency
Monitoring Agency
Number of States
Agencies Monitoring Quality Criteria
n=10 states
Source: Adapted from “National Overview of Tiered Quality Strategies: A Preliminary Analysis” (July 2004), prepared by Judy Collins and Tracy Dry, NCCIC, for the State Child Care Administrators Meeting held in Washington, DC.
34Stair Steps to Quality34
Accountability
United Way Success By 6®

or institutions of higher education. Pennsylvania contracts most of the administration of Keystone STARS to regional child care resource developer agencies. In Kentucky’s STARS for KIDS NOW program, star raters are state employees in the licensing agency. The exception is the Qualistar Rating System in Colorado, which is administered in the private sector.
The capacity for administering a QRS is a central issue to consider in the design phase. Oklahoma’s Reaching for the Stars is administered in the li-censing agency. All licensed programs are at least One-Star. One-Star Plus, Two-Star, and Three-Star
programs are required to meet additional criteria and have an environment rating scale observation once every two years. Compliance with star qual-ity criteria for all levels is verifi ed by licensors who make a minimum of three visits per year to every facility. To handle the increased workload for li-censors, Oklahoma increased the licensing staff by 36 positions; caseloads are 1 to 55. Regardless of whether a state agency administers the QRS itself or contracts with the private sector, the capacity for monitoring must be suffi cient to ensure ad-equate accountability for the QRS.
0 1 2 3 4 5
No Response
Three Times per Year
Annually
Frequency
Number of States
Frequency of Program Monitoring
n=10 states
Source: Adapted from “National Overview of Tiered Quality Strategies: A Preliminary Analysis” (July 2004), prepared by Judy Collins and Tracy Dry, NCCIC, for the State Child Care Administrators Meeting held in Washington, DC.
United Way Success By 6® Stair Steps to Quality 35
Accountability

What Are the Consequences and Implications of Accountability Policies? A key accountability issue in a QRS is the accuracy of quality ratings. A well-designed and implemented accountability system, bolstered by clear commu-nication about the structure and operation of the QRS, should minimize disagreements. A concern that has been raised about rating systems, espe-cially those connected with licensing, is whether rating the quality of programs will result in chal-lenges to ratings and an increase in requests for hearings. Anticipating that some programs may not agree with the rating they receive, an appeals pro-cess should be designed in advance. Administrators of statewide QRS report that although quality rat-ings do change, there are relatively few challenges and little or no increase in hearing requests.
Quality ratings, once established, must be main-tained over time. Monitoring of quality criteria occurs on a regular basis, generally annually, to determine the quality level of a program. In the interim between monitoring, program quality might increase or decline. It is important to deter-mine how changes will be addressed, i.e., whether a program can request a new rating if quality im-proves, if programs are required to give notice if a quality criterion ceases to be met, if declines in all categories are treated equally, and/or if some specifi ed categories are more signifi cant. In a QRS with fi nancial incentives tied to ratings, such as tiered reimbursement or quality grants, there are fi nancial consequences for a program if its quality level decreases. If the rating is revised immediate-ly, the fi nancial loss may be too much to weather and programs may close. A transition period of one or more months might be established for the program to attempt to regain its former level or adjust to the fi nancial loss and other consequences
of a reduced rating, such as changing its market-ing materials. The QRS design will need to address these issues as well as whether and how consumers will be notifi ed of new ratings.
Another issue related to accountability is how much of the information about a program participating in the QRS is made public. The specifi c quality rating of a program must be public information since that is how the system functions as a consumer guide to quality. States vary in the type and amount of other information that is shared. The Qualistar sys-tem in Colorado prepares Early Learning Reports© on each program that is rated. Programs can choose to have these one or two page reports available on the Web. The reports provide the program’s score in each of the fi ve quality categories and a summary of strengths and recommendations for improve-ment. The Web database is searchable by program name, city, county, or zip code. To access these Early Learning Reports, visit http://www.qualistar.org. Pennsylvania’s Keystone STARS system lists programs and their STARS status on a Web site. The list, which is not searchable, is organized into state regions, by STARS rating levels, and within each STARS level alphabetically by county and program name. This information is available at http://www.ccrdpa.org/stars.htm.
Forms and ProceduresAs the QRS takes shape during the design phase, it is useful to think about implementation. One im-portant aspect of implementation is the procedures, forms, and accompanying instructions needed for each stage of the process: applications, rating de-cision notifi cations, and appeals procedures. Other materials that need to be developed are assess-ment and monitoring tools such as checklists and observations. Technology can make the process more effi cient; training and retraining for staff who will use the assessment and monitoring tools
36Stair Steps to Quality36 United Way Success By 6®
Accountability

need to be considered. For more information, see Quality Rating Systems: Implementation Guidelines on NCCIC’s Web site at http://nccic.org/poptopics/qrs-implementation.html.
Tools and Resources
Assessment and Evaluation: Becoming an Educated Consumer; Part II: Program Evaluation is on NCCIC’s Web site at http://nccic.org/pubs/goodstart/assess-eval2.html.
Brief and to the Point: What Can Research Contribute to Child Care Consumer Rating Systems?, Issue Brief No. 13 (December 2003), by the Wisconsin Child Care Research Partnership, is online at http://www.uwex.edu/ces/fl p/wccrp/pdfs/brief13.pdf.
Common Categories of Criteria Used in State Quality Rating Systems, by Judy Collins and Tracy Dry, NCCIC, is available at http://nccic.org/pubs/qrs-comcat.html.
Early Childhood Education Workforce: Practitioner Registry Systems is on NCCIC’s Web site athttp://nccic.org/poptopics/practitioner-registry.html.
Quality Rating Systems: Implementation Guidelines, by Judy Collins, NCCIC, is available at http://nccic.org/poptopics/qrs-implementation.html.
To access Colorado’s Qualistar Early Learning Reports, visit the Qualistar Early Learning Web site at http://www.qualistar.org.
For information about environment rating scales, visit the Frank Porter Graham Child Development Institute’s Web site at http://www.fpg.unc.edu/~ecers/.
For information about Pennsylvania’s Keystone STARS, including programs’ STARS status, visithttp://www.ccrdpa.org/stars.htm.
United Way Success By 6® Stair Steps to Quality 37
Accountability
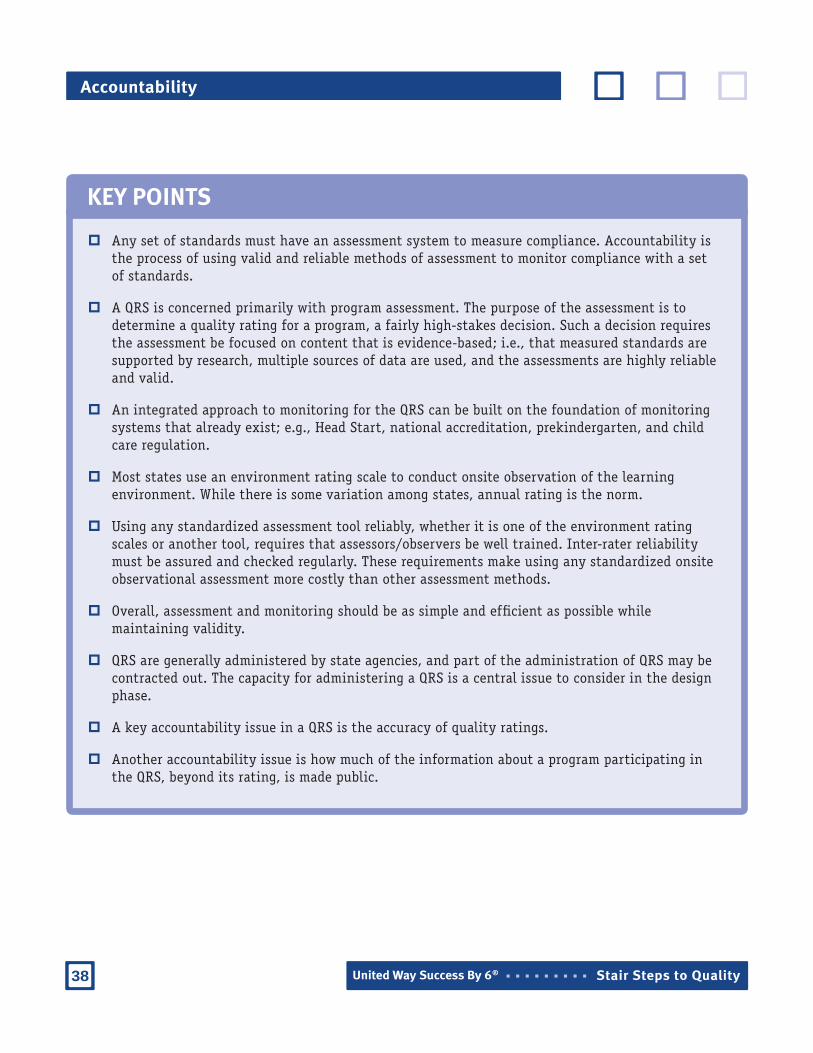
Any set of standards must have an assessment system to measure compliance. Accountability is the process of using valid and reliable methods of assessment to monitor compliance with a set of standards.
A QRS is concerned primarily with program assessment. The purpose of the assessment is to determine a quality rating for a program, a fairly high-stakes decision. Such a decision requires the assessment be focused on content that is evidence-based; i.e., that measured standards are supported by research, multiple sources of data are used, and the assessments are highly reliable and valid.
An integrated approach to monitoring for the QRS can be built on the foundation of monitoring systems that already exist; e.g., Head Start, national accreditation, prekindergarten, and child care regulation.
Most states use an environment rating scale to conduct onsite observation of the learning environment. While there is some variation among states, annual rating is the norm.
Using any standardized assessment tool reliably, whether it is one of the environment rating scales or another tool, requires that assessors/observers be well trained. Inter-rater reliability must be assured and checked regularly. These requirements make using any standardized onsite observational assessment more costly than other assessment methods.
Overall, assessment and monitoring should be as simple and effi cient as possible while maintaining validity.
QRS are generally administered by state agencies, and part of the administration of QRS may be contracted out. The capacity for administering a QRS is a central issue to consider in the design phase.
A key accountability issue in a QRS is the accuracy of quality ratings.
Another accountability issue is how much of the information about a program participating in the QRS, beyond its rating, is made public.
KEY POINTS
38Stair Steps to Quality38 United Way Success By 6®
Accountability

Chapter VProgram and Practitioner Supports and Incentives
39United Way Success By 6® Stair Steps to Quality
S tandards and accountability are necessary but not suffi cient to generate quality improvement. An essential element of a Quality Rating System (QRS) is the support offered to programs and practitioners to help them
meet the quality criteria of the QRS. Providing supports can also increase program participation. This chapter includes information about what kinds of support can be offered, what incentives are used, and how programs are informed about the QRS.
Supports in Quality Rating SystemsThe categories of support in a QRS may include:
Professional development, such as credit and non-credit community-based training sessions, college courses leading to credentials and degrees, and distance learning opportunities
Technical assistance (TA) for program improvement, mentoring, accreditation facilitation projects, and director support groups
Financial incentives such as compensation awards, quality bonuses, and tiered reimbursement
Information about the QRS and how to participate in it.
What Supports Currently Exist and What Needs to Be Developed? Many of the necessary supports may already exist in some form in many states and communities, and these existing supports can be connected to the QRS. An important step in the process of developing the QRS is to inventory the existing supports, paying special attention to accessibility. A needed resource often exists but is limited in scope or scale. For example, a mentoring initiative may be avail-able only to certain types of programs, or college courses leading to a credential may be accessible only within a certain geographic area or only at particular times. Making an inventory of supports is a particularly appropriate task for a community group, such as United Way Success By 6®, to take on since support var-ies within a state. Such an inventory will provide information on what supports are available. Any gaps identifi ed can be used as a guide to what might need to

40United Way Success By 6® Stair Steps to Quality40
Program and Practitioner Supports and Incentives
be developed later to support programs reaching higher levels of quality.
Professional Development for PractitionersPerhaps the most signifi cant support for a QRS is professional development, since staff qualifi cations are such an important component of quality early care and education. All states have an early child-hood education professional development system or initiative. See State Professional Development Systems and Initiatives for the Early Childhood Workforce on the National Child Care Information Center (NCCIC) Web site at http://nccic.org/pubs/goodstart/state-ece.html. Practitioners need ac-cess to education that leads to the qualifi cations and credentials specifi ed in the QRS. Some states offer scholarships to help pay for the college courses needed. Others directly link the levels on the career paths in their professional development system to their QRS. Montana has a professional development registry to track career paths and requires a certain percentage of staff at specifi ed career levels for each of the levels in the QRS.
In support of its QRS, Oklahoma established Early Childhood Scholar Coordinators in each commu-nity college to counsel and support child care staff pursuing coursework and degrees. North Carolina has worked to ensure that every community col-lege offers early childhood coursework leading to the credentials specifi ed in its rated license, and has a statewide articulation agreement to support transfer of credit and degrees. Vermont has rede-signed its professional development system with the goal of integrating it with its QRS. Pennsylvania redesigned its professional development system to integrate program technical assistance, creating a program improvement system aligned with its QRS.
Technical Assistance to ProgramsPrograms need TA to help them assess their cur-rent quality status and create improvement plans. Some resources exist for programs. According to the National Association for the Education of Young Children (NAEYC), there are more than 100 accreditation facilitation projects in communities across the country. These projects provide TA to programs seeking national accreditation, which is helpful since nearly all QRS include accreditation. Several states have made investments in accredi-tation support. Connecticut is notable for the duration and public support of its accreditation facilitation project; it has been publicly funded for 10 years and provides free assistance in all regions of the state. More than one-quarter of programs in Connecticut are accredited. Massachusetts, through Community Partnerships for Children (its state-funded prekindergarten program), pro-vides TA, grants for accreditation fees, and other support—and with 27 percent of centers (and 23 percent of homes) accredited, has achieved one of the highest levels in the nation.
Many states have invested in training and TA through their child care resource and referral agencies (CCR&Rs). Some have invested in special-ized training and TA such as working with infants and toddlers or integrating children with special needs. Head Start programs can access TA through a dedicated regional network that is federally funded; professional development can be paid for with funds included in each program’s direct grant. These resources can be connected to the QRS and become resources to support it.
QRS-specifi c TA is often part of the design, and most QRS help conduct an initial assessment of a program

United Way Success By 6® Stair Steps to Quality 41
Program and Practitioner Supports and Incentives
and work with the staff to develop a quality improve-ment plan. Pennsylvania Keystone STARS contracts specifi cally for STARS TA provided by a network of consultants who offer intensive, one-on-one services to child care facilities (centers or homes). Qualistar in Colorado provides programs with an initial star rating and a Quality Performance Profi le© (QPP) with a one-year action plan for improvement that is implemented with support from Qualistar staff who act as coaches. After each annual monitoring visit, the assessor’s ratings are entered electronically and the next year’s QPP is automatically generated. The QPP is an example of using technology to streamline monitoring and TA.
North Carolina has aligned all of the available TA and support offered through the Smart Start initiative toward helping programs attain higher star ratings. The accountability system for Smart Start and other public funds uses the star ratings as an accountability measure within the state’s Performance Based Incentive System. Local Smart Start partnerships in communities are responsible for increasing the number of programs at higher ratings and ensuring children using subsidies are in higher-rated programs.
Financial Incentives Financial incentives are designed to address the gap between the cost of producing a higher-quality pro-gram and the tuition price that is charged to families to cover the cost. Tuition prices do not match the cost of quality because competition within the market tends to lower prices, and most families’ income is in-suffi cient to cover the full cost of quality. Financial incentives are investments in program quality.
Financial support also is a powerful incentive for participation, and all the existing statewide QRS provide fi nancial incentives of some kind, in-cluding subsidy payments at higher rates (tiered
reimbursement), grants and loans for program improvement, bonuses tied to quality levels, schol-arships, and other incentives.
The most common fi nancial incentive related to a QRS is tiered subsidy reimbursements. Federal and state governments help qualifi ed low-income par-ents pay for child care by reimbursing providers for part of the cost of care. Higher-quality programs can be paid a higher reimbursement rate for the children in their program who are receiving child care assistance (if the program charges tuition at or above that higher reimbursement rate).1 Many states, with or without a QRS, offer tiered reim-bursement. As part of its QRS, Oklahoma nearly doubles its reimbursement rates for infants in Three-Star centers compared to One-Star centers, from $15 per day to $29 per day.
Quality bonuses or merit awards are fi nancial awards related to quality but not integrated into the subsidy reimbursement system, creating in-centives for programs serving all children, not just those on subsidy, to participate. Pennsylvania’s Keystone STARS offers annual STARS Support Grants to help programs improve. Calibrated by program enrollment size and star level, the support grants range from $750 for a One Star family child care home to $12,000 for a very large Three Star center (more than 180 children). Programs at Two Stars, Three Stars, and Four Stars are eligible for annual ongoing Education and Retention Awards for staff with degrees in early childhood educa-tion or related fi elds; awards range from $1,000 to $4,000 per staff member. Programs at Two Stars, Three Stars, and Four Stars are eligible for annual STARS Merit Awards that range from $800 for a Two Star family child care home to $54,000 for a very large Four Star center. These fi nancial in-centives are intentionally structured outside the subsidy system so tuition prices for the private-paying families are not affected. All these fi nancial
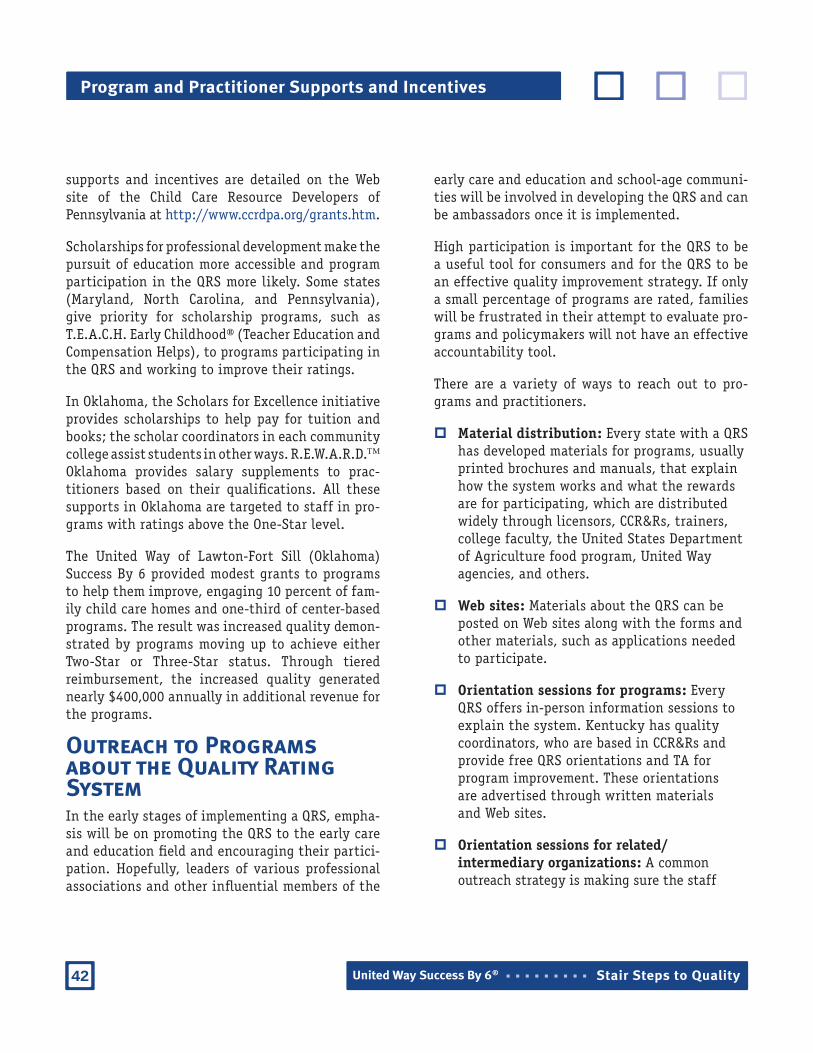
42United Way Success By 6® Stair Steps to Quality42
Program and Practitioner Supports and Incentives
supports and incentives are detailed on the Web site of the Child Care Resource Developers of Pennsylvania at http://www.ccrdpa.org/grants.htm.
Scholarships for professional development make the pursuit of education more accessible and program participation in the QRS more likely. Some states (Maryland, North Carolina, and Pennsylvania), give priority for scholarship programs, such as T.E.A.C.H. Early Childhood® (Teacher Education and Compensation Helps), to programs participating in the QRS and working to improve their ratings.
In Oklahoma, the Scholars for Excellence initiative provides scholarships to help pay for tuition and books; the scholar coordinators in each community college assist students in other ways. R.E.W.A.R.D.TM Oklahoma provides salary supplements to prac-titioners based on their qualifi cations. All these supports in Oklahoma are targeted to staff in pro-grams with ratings above the One-Star level.
The United Way of Lawton-Fort Sill (Oklahoma) Success By 6 provided modest grants to programs to help them improve, engaging 10 percent of fam-ily child care homes and one-third of center-based programs. The result was increased quality demon-strated by programs moving up to achieve either Two-Star or Three-Star status. Through tiered reimbursement, the increased quality generated nearly $400,000 annually in additional revenue for the programs.
Outreach to Programs about the Quality Rating SystemIn the early stages of implementing a QRS, empha-sis will be on promoting the QRS to the early care and education fi eld and encouraging their partici-pation. Hopefully, leaders of various professional associations and other infl uential members of the
early care and education and school-age communi-ties will be involved in developing the QRS and can be ambassadors once it is implemented.
High participation is important for the QRS to be a useful tool for consumers and for the QRS to be an effective quality improvement strategy. If only a small percentage of programs are rated, families will be frustrated in their attempt to evaluate pro-grams and policymakers will not have an effective accountability tool.
There are a variety of ways to reach out to pro-grams and practitioners.
Material distribution: Every state with a QRS has developed materials for programs, usually printed brochures and manuals, that explain how the system works and what the rewards are for participating, which are distributed widely through licensors, CCR&Rs, trainers, college faculty, the United States Department of Agriculture food program, United Way agencies, and others.
Web sites: Materials about the QRS can be posted on Web sites along with the forms and other materials, such as applications needed to participate.
Orientation sessions for programs: Every QRS offers in-person information sessions to explain the system. Kentucky has quality coordinators, who are based in CCR&Rs and provide free QRS orientations and TA for program improvement. These orientations are advertised through written materials and Web sites.
Orientation sessions for related/intermediary organizations: A common outreach strategy is making sure the staff

United Way Success By 6® Stair Steps to Quality 43
Program and Practitioner Supports and Incentives
in public and private agencies—licensors, CCR&R staff, and college instructors—who have contact with early care and education practitioners and programs are well-informed about the QRS.
Specifi c outreach staff: Oklahoma established fi ve new positions, called Stars Outreach Specialists, who encourage programs to participate, offer assistance, and approve applications.
Staging as a Strategy for Providing SupportsOut of necessity, a QRS will be phased-in over time. The most important supports in the early stages will be those that assist programs in assessing their status and provide the supports to begin the improvement process. Not every support has to be
fully operational and funded at the beginning. They can be staged to increase as participation in the QRS grows. The supports that are offered, especially those that are free to the program (e.g., TA) and bring in more funds (e.g., quality bonuses and tiered reimbursement), are major attractions for programs and increase participation.
Endnotes
1 Reimbursement rates in subsidy systems are based on the prices charged to non-subsidized families. Higher reimbursement rates can be set based on quality, such as in a tiered reimbursement approach. To receive the higher rate, a program must charge at least that rate to non-subsidized families. Financial rewards for quality can be structured as bonuses within the subsidy system so as not to drive up prices for non-subsidized families.
Tools and Resources
State Professional Development Systems and Initiatives for the Early Childhood Workforce, which includes the names and contact information of the state systems or initiatives and highlights online information provided on professional development system elements and components, is available on NCCIC’s Web site at http://nccic.org/pubs/goodstart/state-ece.html.
Information about NAEYC accreditation facilitation projects, including a searchable map with contact information, is at http://www.naeyc.org/accreditation/facilitation.asp.
For information about the supports for Pennsylvania’s Keystone STARS, visit the Child Care Resource Developers of Pennsylvania’s Web site at http://www.ccrdpa.org/grants.htm.
For information about Qualistar’s Quality Performance Profi les, visit http://www.qualistar.org/page.html?id=15&clear_inputs=1.

44United Way Success By 6® Stair Steps to Quality44
Program and Practitioner Supports and Incentives
KEY POINTS
An essential element of a QRS is the support that is offered to programs and practitioners to help them meet the quality criteria of the QRS.
Categories of support in a QRS include professional development for practitioners, TA for program improvement, fi nancial incentives, and information about the QRS and how to participate in it.
Perhaps the most signifi cant support for a QRS is professional development, since staff qualifi cations are such an important component of quality early care and education.
Programs need TA to help them assess their current quality status and create improvement plans. Some resources exist and others are created in the design of the QRS.
Financial support is a powerful incentive for participation. All existing statewide QRS provide fi nancial incentives that may include subsidy payments at higher rates (tiered reimbursement), grants and loans for program improvement, bonuses tied to quality levels, scholarships, and other incentives.
Quality bonuses or merit awards are fi nancial awards related to quality but not integrated into the subsidy reimbursement system, creating incentives for programs serving all children, not just those on subsidy, to participate.
Scholarships for professional development make the pursuit of education more accessible and program participation in the QRS more likely. Several states give priority for scholarships to practitioners in programs participating in the QRS that are working to improve their ratings.
Promoting the QRS to the early care and education fi eld will encourage participation. High participation is important for the QRS to be a useful tool for consumers and for the QRS to be an effective quality improvement strategy.
Outreach to the fi eld includes multiple methods such as materials, Web sites, orientation sessions, and dedicated outreach staff.

Chapter FinancingVI
45United Way Success By 6® Stair Steps to Quality
C alculating the cost of designing and implementing a Quality Rating System (QRS) is not an exact science; it depends on many variables, including the structure of the QRS, types of assessment, frequency of
monitoring, program participation rates, the current capacity of support systems, and other factors. This section summarizes the main cost factors and how states have addressed them, including what funding sources are used. This chapter is based primarily on information from the companion United Way Success By 6® (UW SB6) report, Financing Quality Rating Systems: Lessons Learned, available at http://national.unitedway.org/fi les/pdf/sb6/Louise_Stoney_QRS_Financing_Paper.pdf.
What Are the Cost Drivers and Tradeoffs for Each Component? Designing the QRS is a process that takes time and involves many stakeholders, who usually volunteer their time. Some paid staff time is required, and it may be available as in-kind donations from government agencies or private organiza-tions. When costs have been paid directly, states have used federal Child Care and Development Fund (CCDF) quality funds and/or donations from philanthropy or United Way agencies. An all-volunteer process may seem most cost-effective but may take longer to design a QRS than a process that relies on some paid staff.
Administration and accountability will likely be the majority of the direct cost of implementing a QRS. The primary cost is staffi ng, followed by automation and evaluation. Staff are needed to assess the initial quality status of programs, moni-tor compliance with quality criteria on a regular basis, and assign quality ratings. Automation can ease the workload and facilitate outreach and information dissemi-nation to programs and consumers. Evaluation is helpful in refi ning the QRS in the early implementation stage and demonstrating its effectiveness in later stages.
The number of participating programs is a key factor in determining staffi ng. Another is how many of the quality standards in the QRS involve criteria that must be observed directly and require onsite visits. Any assessment made by di-rect observation using a validated tool or instrument will require that staff be trained to use it and that periodic checks of inter-rater reliability are made. This is true for an environment rating scale as well as any other standardized assessment tool that is used to monitor quality. To address these reliability concerns, several

46United Way Success By 6® Stair Steps to Quality46
Financing
states have contracted with universities to con-duct observations and maintain reliability among raters. Some states that require environment rat-ing scales or other direct observational assessment permit programs in the fi rst level of the QRS to conduct these as a self-assessment. Programs in the upper levels must use an independent asses-sor. One argument for including accreditation in a QRS is that the responsibility for assessment and monitoring rests with other organizations and is conducted at no cost to the state.1
Caseloads and participation rates will determine how many staff are needed. Current practice in statewide QRS indicates that caseloads for staff who assign ratings and conduct assessments rang-es from 1 to 30 up to 1 to 55. The range primarily refl ects differences in the frequency of monitor-ing and the extent of observational assessment. If the expected participation is 500 programs and the desirable caseload is 1 to 50, then 10 staff will be needed to administer and monitor the QRS. The exact cost will depend on staff compensation levels. There are strategic considerations, too. Creating an entirely new set of staff positions may be politically harder than expanding an existing set. If administration of the QRS can be integrated with an existing monitoring system, such as child care licensing, then a more modest expansion of staff and some retraining will be needed.
Automation is a cost that is hard to estimate. It may be low- or even no-cost if the QRS can be integrated into an existing data management system with rela-tively little reprogramming. If the data management system must be created from scratch, then the cost will likely be much higher, perhaps as much as sev-eral hundred thousand dollars. In the design phase of the QRS, it is a good idea to involve staff who are responsible for designing and maintaining data management systems so they are aware of the need for automation and can contribute their expertise.
Evaluation is useful during the pilot phase to guide improvements to the process and inform the fi nal design. Evaluation is also useful once the system is operational. Several states have invested in evalu-ation to determine whether the QRS is meeting its goals, such as whether and how much programs have improved and whether children in the subsidy sys-tem are gaining access to higher-quality programs. Evaluation can also be used to investigate the ef-fectiveness of the QRS, such as whether certain standards or quality criteria predict quality well enough so that other standards can be eliminated. The cost of evaluation can range from several hun-dred thousand to several million dollars, depending on how many years the evaluation runs, whether classroom observations and individual child assess-ments are involved, and other factors. A rule of thumb is that evaluation costs are 1–2 percent of the direct cost of the initiative being evaluated.
The sources states use for administration and monitoring are primarily CCDF quality funds, some funds from Temporary Assistance for Needy Families, and/or state general revenue. Kentucky uses funds from Phase I of the Tobacco Settlement and CCDF quality money.
Supports for practitioners and programs (pro-fessional development or training and technical assistance investments) that contribute to the effectiveness of a QRS may have existed prior to its launch and are not direct costs of the QRS. Other supports may be directly attributable to the QRS, such as quality improvement grants, quality bonuses, and technical assistance for program im-provement plans. The supports that are associated with educating programs about the QRS and how it works—such as information sessions, training on assessment, and program evaluation—are direct costs of the QRS. Supports that existed prior to the QRS can be realigned to support it. For example, practitioner supports such as scholarships can give

United Way Success By 6® Stair Steps to Quality 47
Financing
priority to staff in programs at a certain quality level and those working to increase quality levels.
While public funds such as CCDF are often used to pay for supports, communities can be particularly helpful in funding aspects of supports that are needed to make the QRS work effectively. UW SB6 groups have invested in program improvement initiatives, offered technical assistance, and sponsored professional de-velopment activities.
Outreach to families is an essential element of a QRS. Some of the costs for parent education are already accounted for in the services offered by child care re-source and referral agencies (CCR&Rs), most of which are supported at least partially with public funds. The CCR&R adds the information about quality levels to the database it is already using to make referrals for families seeking early care and education pro-grams. Additional costs are mainly in materials, such as brochures, for parents that describe how the QRS works and what the benefi ts are, and press releases that promote the latest set of programs to increase quality levels. Several states have conducted or contracted for fairly extensive public education cam-paigns to promote the QRS. Often these have been funded by private-sector partners such as corpora-tions (Bank of America in North Carolina) and UW SB6 groups (Kentucky, North Carolina, Oklahoma, and Tennessee).
What Is the Total Cost of the Quality Rating System?The cost factors discussed briefl y in the previ-ous section can lead to an estimate of the overall cost of the QRS. The straightforward approach is to go through each component and estimate the cost under ideal circumstances. Undoubtedly, the total will be higher than is feasible to implement. Then a series of trade-offs are made to reduce costs, aiming to maintain the overall reliability
of the QRS. The process of developing or revising a QRS interacts with the cost estimating process. Replicating parts of another state’s QRS may save time and money.
What Sources of Funding Exist to Finance Quality Rating Systems?There are essentially fi ve sources of funding for a QRS: federal, state and local government, corpora-tions, and philanthropy. Government funds come in two forms: general revenue, directly appropriated in the budget or indirectly through the tax system (credits and deductions); or dedicated revenue sources such as a lottery or specifi c tax. For exam-ple, for several years the federal budget has made available competitive grant funds through the Early Learning Opportunities Act that have been used in several places to develop QRS. For more information about federal and state funding, see Appendix B. Private sources are usually in the form of grants from corporations and foundations. United Way of America initiatives, especially Success By 6, have invested in QRS in many states and communities.
QRS are funded largely with federal and state child care funds (CCDF). One state (Kentucky) also has used tobacco settlement funds. One local QRS in California (Los Angeles) is funded through state tobacco taxes; one in Florida (Palm Beach County) is funded by property taxes collected by the children’s services taxing district. Tax credits can be used to indirectly support the QRS and promote it to taxpayers. Two states (Arkansas and Maine) have child and dependent care tax credits that include incentives for using quality programs. Colorado has combined philanthropic resources to match public funds to support its QRS. While states are creative in fi nding public and private funds for QRS, they face an inherent challenge to fi nd reliable, permanent funding sources that are suffi cient to

KEY POINTS
Calculating the cost of designing and implementing a QRS is not an exact science; it depends on many variables including the structure of the QRS, types of assessment, frequency of monitoring, program participation rates, the current capacity of support systems, and other factors.
The cost drivers are designing the system, administration and accountability, supports for practitioners and programs, and outreach to families and other consumers.
There are essentially fi ve sources of funding for a QRS: federal, state and local government, corporations, and philanthropy. QRS are largely funded with federal and state child care funds. Some communities have used federal Early Learning Opportunity Act grants to design a QRS for statewide replication. United Way and foundations are other sources used.
48United Way Success By 6® Stair Steps to Quality48
Financing
support quality improvement while simultaneously supporting families’ access to services.
While not specifi cally focused on funding a QRS, the 2001 edition of Financing Child Care in the United States covers the full range of funding mechanisms that are in use to support early care and education and school-age programs. For infor-mation specifi c to QRS, see Financing Quality Rating Systems: Lessons Learned.
Endnotes
1 Many states do contribute by paying for accreditation fees; e.g., Alabama, Arkansas, the District of Columbia, Florida, Massachusetts, Nebraska, New Hampshire, Utah, and West Virginia report offering grants to help programs pursue accreditation.
Tools and Resources
Financing Child Care in the United States: An Expanded Catalog of Current Strategies (2001), by Anne Mitchell, Louise Stoney, and Harriet Dichter, is available at http://www.kauffman.org/pdf/childcare2001.pdf.
Financing Quality Rating Systems: Lessons Learned (2004), by Louise Stoney, Alliance for Early Childhood Finance, for UW SB6, is available at http://national.unitedway.org/fi les/pdf/sb6/Louise_Stoney_QRS_Financing_Paper.pdf.

Chapter Educating Parents about the Quality Rating SystemVII
49United Way Success By 6® Stair Steps to Quality
How Do Parents Choose Programs and What Factors Infl uence Their Choice?Most American children, especially those who are 3 years and older, are enrolled in some kind of early care and education program chosen by their families. Choosing a program is a personal decision involving preferences and values about adult work, childrearing, and early education, and it is an important decision that has long-term consequences. From an economic perspective, the choice involves three competing factors: the quality of the program, the price, and the family’s resources (fi nancial and other resources that infl uence choice, such as having transporta-tion so more locations are convenient). Overlaid on this basic transaction are more subjective factors such as childrearing values and educational philosophy. No family can maximize all of these factors, and the choice is actually a series of trade-offs among them until a decision is reached.
Research on consumer behavior and preferences reveal several characteristics that are important to parents: health and safety, how children get along with each other and with adults, opportunities for learning, the personality of the staff, and the program philosophy. In national surveys, 60 percent of parents cite some as-pect of child-oriented quality as being the most important factor in their choice. Economists say that parents do not effectively demand quality programs, in part because they cannot afford them, but also because parents lack information to judge the quality of programs.
Consumer education can help. Child care resource and referral agencies (CCR&Rs) have been perfecting the process of providing information about different pro-grams (e.g., locations, hours, activities, and price), developing checklists of features to look for, and other materials to help families choose. Basic information about a program is fairly easy to convey. What has been missing until the advent of Quality Rating Systems (QRS) is a simple way to convey information about the relative quality of different programs.

50United Way Success By 6® Stair Steps to Quality50
Educating Parents about the Quality Rating System
Why Is Educating Parents about the Quality Rating System Important?Families are the biggest purchasers of early care and education in the United States; they care about quality, and the QRS can give them information about it. Consumers need to know that the QRS is a reliable and trustworthy source. The parent edu-cation component of a QRS can explain in simple terms how the system works and note the evidence for its standards. The nature and reputation of the administering agency and the stakeholders who developed the system contribute to the trustwor-thiness of the QRS and should be promoted.
Financial incentives linked to quality can be powerful educational tools. Maine offers taxpay-ers a state Child and Dependent Care Tax Credit that is doubled for taxpayers who use a program that has a Maine Quality Certifi cate. This works as a consumer (and public) education tool, since parents and tax preparers are interested in know-ing whether a program meets the criteria for the double tax credit.
Consumer information about quality needs to be easily understood, thus the use of stars or other recognizable symbols in a QRS is very important. Information must also be accessible. Nearly all statewide QRS post quality ratings on a Web site. These Web sites should be located easily, contain up-to-date searchable information displayed at-tractively, and be accessible with a few clicks of the mouse and not buried deep within a site’s pages. These sites can be linked with other sites parents might visit, like children’s libraries. Ensuring that consumers understand and use the QRS is a benefi t to children and families and will increase participa-tion of programs in the QRS. When programs have prospective customers asking what their quality
rating is, they will want to be able to answer. If there is a shortage of affordable, high-quality programs, then informed parents can be more ef-fective advocates for changing the situation.
CCR&Rs are obvious partners in this effort since they already engage in extensive consumer edu-cation with families seeking programs for their children. QRS are important tools for CCR&Rs to use in their work with families and employ-ers, providing the framework for communicating about quality. All statewide QRS have developed partnerships with CCR&Rs, not only for consumer education, but also for technical assistance and other aspects of QRS operation. Other natural allies for distributing consumer education are libraries, pediatricians’ offi ces, elementary schools, places of worship, and other religious organizations.
Educating Other Consumers about the Quality Rating System Increasingly, public discussion of early childhood issues focuses on accountability, and parents and teachers want to know that children will arrive at school ready for kindergarten. Taxpayers and corporations demand a return on their investment in early care and education programs. Educating these consumers about the QRS communicates that accountability is taken seriously.
Families are not the only consumers of early care and education services. Other consumers who can benefi t from the QRS are employers, private funders, government, school districts, and others. Many employers offer resource and referral services to their employees and want quality information from the QRS to be available to employees who use the service. Some employers purchase child care on behalf of their employees, and quality and reliability are high concerns to them.1 The QRS can

United Way Success By 6® Stair Steps to Quality 51
Educating Parents about the Quality Rating System
help them make better choices about where to buy child care. Private funders, such as United Way agencies and community foundations, invest in early care and education programs in communities. The QRS can help them target their resources to fund programs that are working to achieve higher quality and using the QRS levels as benchmarks of progress. Head Start agencies that partner with other early care and education programs can use QRS ratings as one measure of a program’s ability to deliver Head Start services.
Nearly all state prekindergarten programs allow and encourage contracting with programs in addition to public schools to provide prekindergarten. The QRS provides a tool for assessing the quality of various programs that apply. Some states include public school prekindergarten programs in their QRS. North Carolina rates all programs, including those in schools. The state’s More at Four prekindergarten program contracts with schools and community-based programs to operate classrooms, and only with those that have a four- or fi ve-star rating.
Successful Strategies for Educating Consumers and the PublicMany strategies have been used to educate consum-ers. Basic informational brochures and Web sites are common, and some states promote the QRS with posters, banners, certifi cates, decals, pins, and other items that are displayed by rated programs to publi-cize their rating. These items are visible signs that reach parents, too. The program’s license certifi cate can educate consumers. Licenses in North Carolina have fi ve stars on the certifi cate to be displayed in each program, and the stars are fi lled in with color to indicate the program’s rating. Thus, the extent of the rating system (fi ve stars) is displayed as well as the rating that a given program has achieved.
Some states provide sample press releases for pro-grams to announce their rating, which extends the audience beyond consumers. Several states have developed multi-faceted public awareness campaigns related to their QRS. These campaigns educate consumers, programs, and the general
Shows the number of stars earned (shaded) out of the number of stars possible (blank)
Shows the name and physical location of the program
Shows basic licensing information, such as number of children allowed, ages allowed, and any restrictions
Shows how many points the program earned in each of the three components

52United Way Success By 6® Stair Steps to Quality52
Educating Parents about the Quality Rating System
public simultaneously and can include television and radio public service announcements about the QRS, as well as press releases announcing programs that have advanced in quality status. Colorado’s ex-perience shows how effective public education can be in stimulating consumer demand. In the month following a front-page article on program ratings in Denver’s premier city magazine, 5210, Qualistar’s call volume increased from 300 to 15,000 calls per month. Tennessee has even succeeded in having TV stations in the four major media markets of the state run a feature announcing the results of the programs that were rated each week. United Way Success by 6® (UW SB6) in Memphis helped develop the campaign to publicize the QRS to parents and the public.
Business leaders can be especially helpful to advancing a QRS. Business can be engaged in support of QRS in several ways if it understands that child care contributes to the bottom line of business and the economy. The quality of a community’s early care and education programs matters to business productivity and contributes to the health of the regional economy. Tools for understanding the business case for child care and applying economic development policy to child care are available online from Cornell University’s Linking Economic Development and Child Care Project at http://economicdevelopment.cce.cornell.edu. These may be helpful to planners of QRS who wish to engage business leaders.
Promoting the QRS to consumers and the public is an opportunity for partnerships. Several states have developed and jointly funded their outreach campaigns with UW SB6 initiatives. North Carolina and Tennessee are leading examples. Local media are an important part of the outreach strategy and local organizations, like United Way agen-cies, are often in a good position to help make the
connections. Public engagement campaigns can be costly, but it is possible to reduce costs by adapt-ing existing materials from other QRS.
The timing of outreach and education about a QRS is important. Consumer education is most effec-tive at the point when a modest proportion of the state’s early care and education programs is partic-ipating in the QRS. Launching consumer education about quality ratings before there are many rated programs to choose from will likely result in dis-appointed consumers. On the other hand, waiting too long or underinvesting in consumer education may fail to stimulate parent demand, which is a major driver of program participation, public sup-port, and funding of QRS.
When outreach is done in ways that reach beyond direct consumers, such as through broadcast me-dia, the QRS itself becomes a tool for educating the public about quality early care and education and generating more support for it. Further, the entre-preneurial aspects of a QRS and its market-driven approach to quality improvement are features that appeal to citizens with a wide range of political philosophies.
Endnotes
1 For corporate taxpayers, Maine offers a tax credit for employer-assisted child care that is doubled if the program has a Quality Certifi cate.

United Way Success By 6® Stair Steps to Quality 53
Educating Parents about the Quality Rating System
Tools and Resources
Child Care and Parent Productivity: Making the Business Case (2004), by Karen Shellenback, Cornell University’s Linking Economic Development and Child Care Project, provides background information on child care as a work/life strategy for business and its value to employers’ bottom line, and is available at http://www.earlychildhoodfi nance.org/handouts/Shellenback_Final.pdf.
Economic Development Strategies to Promote Quality Child Care (2004), by Mildred Warner and the research team at Cornell University’s Linking Economic Development and Child Care Project, provides a conceptual framework for child care as economic development and tools for practical application, and is available at http://www.earlychildhoodfi nance.org/handouts/EconDevStrat_Final.pdf.
To access Colorado’s Qualistar Early Learning Reports©, visit the Qualistar Early Learning Web site at http://www.qualistar.org.
For information about Cornell University’s Linking Economic Development and Child Care Project, visit http://economicdevelopment.cce.cornell.edu.
Information about Maine’s tax benefi ts for quality child care is on the Web at http://www.maine.gov/dhhs/occhs/taxcredits.htm#Dependent.

54United Way Success By 6® Stair Steps to Quality54
Educating Parents about the Quality Rating System
KEY POINTS
Families are the biggest purchasers of early care and education in the United States.
Consumer information about quality needs to be easily understood and accessible. Nearly all statewide QRS post quality ratings on a Web site.
Families are not the only consumers of early care and education services. Other consumers who can benefi t from the QRS are employers, private funders, government, school districts, and other purchasers.
Many strategies have been used to educate consumers, including basic informational brochures and Web sites. Some states promote the QRS with posters, banners, certifi cates, decals, pins, and other items that are meant to be displayed by rated programs to publicize their rating.
Several states have developed multi-faceted public awareness campaigns around their QRS. These campaigns help educate consumers, programs, and the general public simultaneously.
Business leaders can be especially helpful in advancing a QRS. Business can be engaged in support of QRS in several ways if it understands that child care contributes to the bottom line of business and the economy.
The timing of outreach and education about a QRS is important. Launching consumer education about quality ratings before there are many rated programs to choose from will likely result in disappointed consumers. On the other hand, waiting too long or underinvesting in consumer education may fail to stimulate parent demand, which is a major driver of program participation, public support, and funding of QRS.

Chapter VIII Putting It All Together
T he preceding chapters have described the essential elements of a Quality Rating System (QRS)—standards, accountability, program supports and outreach, fi nance, and consumer education. A fully developed QRS op-
erating with all these elements is the essence of the system of early care and education. The QRS defi nes the infrastructure elements that support the services to children and families. Aligned standards are the heart of the system—child outcomes, practitioner standards, and program standards mutually informing one another and defi ning outcomes for the system. Accountability is built in, draw-ing the best from existing monitoring and assessment procedures. Supports to programs and practitioners across service sectors—child care, Head Start, pre-kindergarten, and others—are connected to be coherent, accessible, and aligned with the standards of the QRS. Financial support and investment from public and private sectors are connected to the levels of quality in the system and deployed to support and encourage movement toward higher quality. Consumer education reaches the majority of purchasers, from families and government to corporations. A QRS is a powerful policy tool for states and communities intent on building systems of early care and education.
The Benefi ts and Opportunities of a Quality Rating SystemThe QRS is a systemic approach that provides the structure for connecting previ-ously disparate strategies and initiatives and aligning them toward system goals. Many states and communities have developed projects and initiatives that are aimed at accomplishing some of the elements in a QRS. The following are some of these efforts:
Educating consumers (e.g., checklists for choosing, brochures on quality, databases of program information, referral counseling, and searchable Web sites)
Improving quality (e.g., mentoring, technical assistance on inclusive child care, courses on infant-toddler development, and full-fl edged professional development systems)
Investing in services and supports (e.g., child care subsidies, prekindergarten programs, Head Start grants, compensation initiatives, and scholarships)
Accomplishing many other worthwhile, but often isolated efforts.
55United Way Success By 6® Stair Steps to Quality

A few of these state efforts have been evaluated for effectiveness, although most have not. Without a QRS, there is almost no way to know the collective impact of these efforts on program quality. With a QRS, there is a structure to align these efforts with system goals and understand their impact on quality.
The design and implementation of a QRS offer an opportunity to examine current initiatives in terms of their contribution to quality improvement, phase-out those initiatives that are not contribut-ing, and redirect those resources to maintain or expand initiatives and strategies that are effec-tive. States are aligning professional development systems with QRS, making sure that educational offerings are credit-bearing and lead to credentials and degrees, and phasing-out support for one-shot workshops and other less-effective methods. States are merging technical assistance projects and professional development systems to create a comprehensive quality improvement system. The results can be measured by tracking the changes in quality ratings over time.
One of the best features of a QRS is the opportuni-ty to align funding and connect existing funding sources and fi nancial incentives to the QRS. Tiered reimbursement policies can be expanded to tie rates to each of the levels of quality in the QRS. Grants for various types of program improvement can be made available to programs above the fi rst level or to programs seeking to progress. Wage supplements (compensation initiatives) can be redirected as support for programs to maintain higher-quality levels. Tax credits for families and corporations that purchase early care and educa-tion services or invest in the infrastructure can reward quality. The point is to think strategically about aligning existing resources of all kinds with the QRS.
The accountability built into a QRS offers funders and investors in early care and education what they need to determine if their investments are effective. Whether a community foundation or United Way agency invests in quality improvement projects, or the state or a corporation buys services on a large scale, they will know what they are purchasing and that they are receiving a positive return on their investment—gains in early care and education quality, which can lead to better child outcomes.
Making the most of this powerful policy tool re-quires widespread buy-in and support, which is why outreach to programs and consumers are es-sential. Moving from unconnected strategies to a system is groundbreaking. The impetus for such major change must be a partnership between the state and communities, and programs and families. State and community leaders can shape the state-wide system; and communities can take on the challenge of increasing participation in the QRS, encouraging programs to improve their ratings, and aligning state and community investments to pro-duce improvement. Working together, leaders can use this innovative approach to build the systems of early care and education that children and fami-lies deserve.
56United Way Success By 6® Stair Steps to Quality56
Putting It All Together
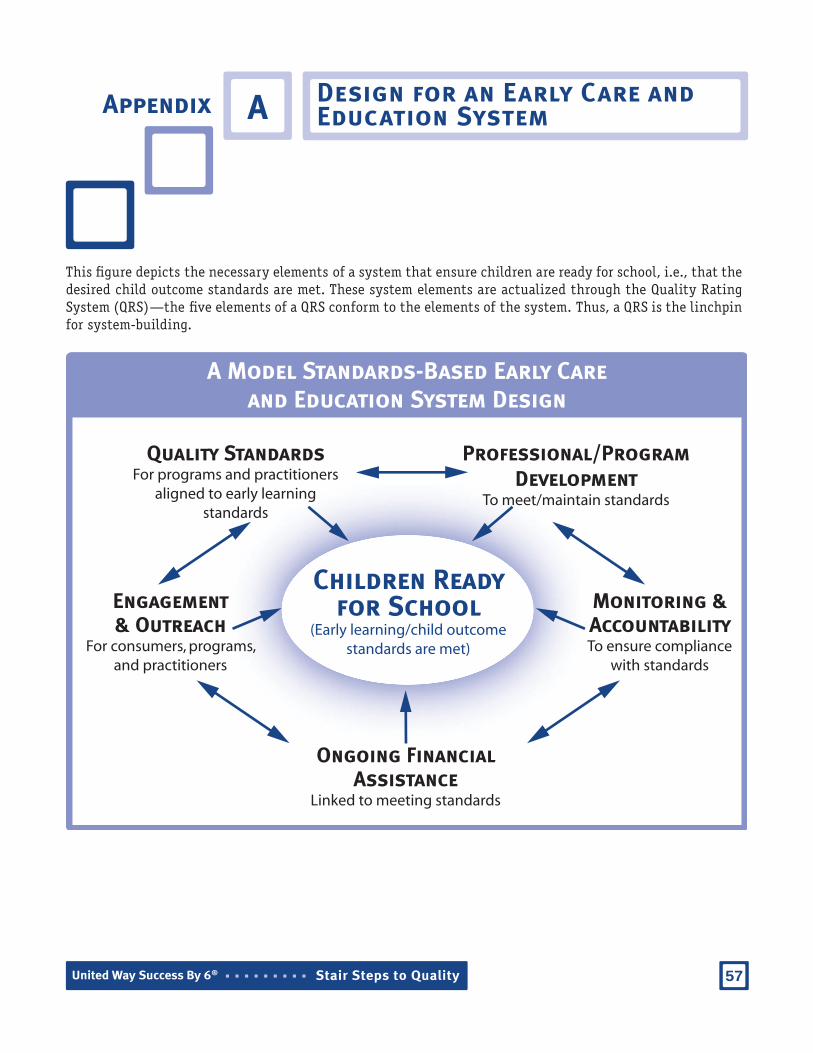
Appendix ADesign for an Early Care and Education System
A Model Standards-Based Early Careand Education System Design
Quality Standards For programs and practitioners
aligned to early learning standards
Professional/Program Development
To meet/maintain standards
Children Ready for School
(Early learning/child outcome standards are met)
Monitoring &AccountabilityTo ensure compliance
with standards
Engagement& Outreach
For consumers, programs, and practitioners
Ongoing Financial Assistance
Linked to meeting standards
This fi gure depicts the necessary elements of a system that ensure children are ready for school, i.e., that the desired child outcome standards are met. These system elements are actualized through the Quality Rating System (QRS)—the fi ve elements of a QRS conform to the elements of the system. Thus, a QRS is the linchpin for system-building.
57United Way Success By 6® Stair Steps to Quality


Programs FundingNumber of Children Served
Comments
Federal
Head Start/Early Head Start
$6.8 billion1
[Expenditure FY 2004]
905,8512
[FY 2004]
Head Start and Early Head Start programs are administered by the Head Start Bureau. They are child-focused programs that serve children from birth to age 5, pregnant women and their families, and have the overall goal of increasing the school readiness of young children in low-income families. In FY 2004, nearly $677 million was used to support more than 650 programs to provide Early Head Start child development and family support services in all 50 states, the District of Columbia, and Puerto Rico. These programs served nearly 62,000 children under the age of 3 years. http://www2.acf.dhhs.gov/programs/hsb/
Child Care and Development Fund (CCDF)
$4.8 billion3
[ExpenditureFY 2004]
1,732,5004
(average monthly)[FY 2004-
Preliminary Estimates]
CCDF assists low-income families, families receiving temporary public assistance, and those transitioning from public assistance in obtaining child care so they can work or attend training/education programs. CCDF serves children under the age of 13; however, some states may elect to serve children age 13 to 19 who are physically or mentally incapacitated or under court supervision. In FY 2003, 63 percent of children served were between birth to 5 years, and 35 percent were between 6 and 13 years. http://www.acf.hhs.gov/programs/ccb/geninfo/index.htm
Temporary Assistance for Needy Families (TANF)
$1.8 billion
(transfer)5
$1.7 billion
(direct)6
[Expenditure FY 2003]
NA
TANF provides grants to states, territories, and tribes to assist needy families with children so that children can be cared for in their own homes; to reduce dependency by promoting job preparation, work, and marriage; to reduce and prevent out-of-wedlock pregnancies; and to encourage the formation and maintenance of two-parent families. States may transfer TANF funds to CCDF or directly spend funds on child care. http://www.acf.dhhs.gov/programs/ofa/
NA= Not Available
The following table summarizes available data for the major federal and state early care education funding streams in the United States. This table is available on the National Child Care Information Center’s Web site at http://nccic.org/poptopics/ecarefunding.html.
Appendix B Federal and State Funding for Early Care and Education
59United Way Success By 6® Stair Steps to QualityUnited Way Success By 6® Stair Steps to Quality

Programs FundingNumber of Children Served
Comments
Federal
Early Intervention Program for Infants and Toddlers with Disabilities
$444 million7
[Appropriation FY 2004]
272,0008
[FY 2004]
The Program for Infants and Toddlers with Disabilities (Part C of IDEA) is a federal grant program administered by the Offi ce of Special Education Programs that assists states in operating a comprehensive statewide program of early intervention services for infants and toddlers with disabilities, ages birth through age 2 years, and their families.http://www.ed.gov/about/offi ces/list/osers/osep/index.html
Preschool Grants for Children with Disabilities
$388 million9
[Appropriation FY 2004]
647,00010
[School Year 2002-2003]
The Preschool Grants Program, authorized under Section 619 of Part B of IDEA and administered by the Offi ce of Special Education Programs, was established to provide grants to states to serve young children with disabilities, ages 3 through 5 years.http://www.ed.gov/about/offi ces/list/osers/osep/index.html
21st Century Community Learning Centers
$991 million11 [Appropriation
FY 2005]
1,320,00012
students were served [FY 2004]
This program is now a state formula grant. It was formerly a discretionary grant program under the Improving America’s Schools Act. Under the reauthorized authority, funds fl ow to states based on their share of Title I, Part A funds. States use their allocations to provide competitive awards to eligible entities. The purpose is to provide expanded academic enrichment opportunities for school-age children attending low-performing schools.http://www.ed.gov/programs/21stcclc/index.html
Even Start$226 million13
[Appropriation FY 2005]
50,000 families14
[FY 2003-2004]
The Even Start Family Literacy Program addresses the basic educational needs of parents and children, up to age 8, from low-income families by providing a unifi ed program of (1) adult basic or secondary education and literacy programs for parents, (2) assistance for parents to effectively promote their children’s educational development, and (3) early childhood education for children.http://www.ed.gov/programs/evenstartformula/index.html
NA= Not Available
United Way Success By 6® Stair Steps to Quality60
Federal and State Funding for Early Care and Education

Programs FundingNumber of Children Served
Comments
Federal
Title I Preschool$200 million15
[Appropriation FY 2002]
300,00016
[FY 2002]
Many school districts support preschool programs with their Title I (Education for the Disadvantaged) funds. In FY 2002, the Department of Education estimated that about 2–3 percent of Title I funds, approximately $200 million, was used for this purpose. Title I preschool programs help more than 300,000 children in high-poverty communities enter kindergarten with the skills they need to succeed in school.http://www.ed.gov/programs/titleiparta/index.html
Social Services Block Grant (SSBG)
$164.5 million17
[Expenditure FY 2003]
NA
SSBG funds a broad range of social services and is a signifi cant federal funding source for child care. SSBG expenditure on child care includes $74.3 million SSBG allocation for child care and $90.2 million TANF transfers to SSBG.http://www.acf.hhs.gov/programs/ocs/ssbg/docs/
Early Reading First$ 104 million18
[Appropriation FY 2005]
NA
Early Reading First provides competitive grants to school districts and preschool programs that fund the development of model programs to support the school readiness of preschool-aged children, particularly those from low-income families. http://www.ed.gov/programs/earlyreading/index.html
State
Child Care $2.2 billion19
[Expenditure FY 2004]
NA
States typically fund child care in conjunction with the CCDF block grant requirements. There is no current and complete estimate of all state funding for child care; however, state expenditures used to meet CCDF Matching Fund and Maintenance of Effort requirements are reported.http://www.acf.hhs.gov/programs/ccb/geninfo/index.htm
Prekindergarten
$2.54 billion20
[Expenditure School Year2002-2003]
740,00021
[School Year 2002-2003]
States have started creating programs to increase access, improve quality, and invest public resources in preschool education. Forty states funded preschool programs in 2001-2002.http://nieer.org/yearbook/
NA= Not Available
United Way Success By 6® Stair Steps to Quality 61
Federal and State Funding for Early Care and Education

Endnotes
1 Head Start Bureau. (2005). Head Start program fact sheet: Fiscal year 2004. Retrieved June 28, 2005, from http://www.acf.hhs.gov/programs/hsb/research/2005.htm
2 Head Start Bureau. (2005). Head Start program fact sheet: Head Start enrollment history. Retrieved June 28, 2005, from http://www.acf.hhs.gov/programs/hsb/research/2005.htm
3 Child Care Bureau. (2005). Fiscal year 2004 Child Care and Development Fund summary of expenditure by categorical items. Retrieved July, 25, 2005, from http://www.acf.hhs.gov/programs/ccb/research/04acf696/table1.htm
4 Child Care Bureau. (2005). Child Care and Development Fund average monthly adjusted number of families and children served (FFY 2003). Retrieved June 28, 2005, from http://www.acf.hhs.gov/programs/ccb/research/03acf800/table1.htm
5 Offi ce of Family Assistance. (2004). Table A - Combined federal funds spent in FY 2003: Spending from federal TANF grant in FY 2003 through the fourth quarter. Retrieved June 28, 2005, from http://www.acf.hhs.gov/programs/ofs/data/tableA_spending_2003.html
6 Offi ce of Family Assistance. (2004). Table A - Combined federal funds spent in FY 2003 through the fourth quarter: Summary of expenditures on assistance in 2003 and Table A - Combined federal funds spent in FY 2003 through the fourth quarter: Expenditures on non-assistance in 2003. Retrieved June 28, 2005, from http://www.acf.hhs.gov/programs/ofs/data/tableA_summary_2003.html and http://www.acf.hhs.gov/programs/ofs/data/tableA_expend_2003.html
7 National Early Childhood Technical Assistance Center. (2004). Annual appropriations and number of children served under Part C of IDEA, federal fi scal years 1987–2005. Retrieved June 28, 2005, from http://www.nectac.org/partc/partcdata.asp
8 Ibid.
9 U.S. Department of Education, Offi ce of Special Education and Rehabilitative Services. (n.d.). Preschool Grants for Children with Disabilities: Funding status, fi scal year 2004. Retrieved June 28, 2005, from http://www.ed.gov/programs/oseppsg/funding.html
10 National Early Childhood Technical Assistance Center. (n.d.). Section 619—Preschool program federal appropriations and national child count, 1977–2004. Retrieved June 28, 2005, from http://www.nectac.org/~pdfs/growthcomp.pdf
11 U.S. Department of Education. (2005). 21st Century Community Learning Centers: Funding status, 2005. Retrieved July 6, 2005, from http://www.ed.gov/programs/21stcclc/funding.html
United Way Success By 6® Stair Steps to Quality62
Federal and State Funding for Early Care and Education

12 General Services Administration. (2005). 84.287 Twenty-First Century Community Learning Centers. In Catalog of Federal Domestic Assistance. Available from the Catalog of Federal Domestic Assistance Web site, http://12.46.245.173/cfda/cfda.html
13 Offi ce of Elementary and Secondary Education. (n.d.). Even Start: Funding status, 2005. Retrieved June 28, 2005, from http://www.ed.gov/programs/evenstartformula/funding.html
14 Offi ce of Elementary and Secondary Education. (n.d.). Even Start facts and fi gures: Estimated number of families served, FY 2003-2004. Retrieved June 28, 2005, from http://www.ed.gov/about/offi ces/list/oese/sasa/esfacts.html
15 The White House. (2003, September). Good Start, Grow Smart: The Bush Administration’s Early Childhood Initiative, Executive summary. Retrieved June 28, 2005, from http://www.whitehouse.gov/infocus/earlychildhood/earlychildhood.pdf
16 Ibid.
17 Offi ce of Community Services. (n.d.). “Table 2-1: Expenditures by service, 2003.” In Annual Report on Expenditures and Recipients 2003. Retrieved July, 25, 2005, from http://www.acf.hhs.gov/programs/ocs/ssbg/annrpt/2003/index.html
18 Offi ce of Elementary and Secondary Education. (n.d.). Early Reading First: Funding status, fi scal year 2005. Retrieved June 28, 2005, from http://www.ed.gov/programs/earlyreading/funding.html
19 Child Care Bureau. (2005). Fiscal year 2004 Child Care and Development Fund summary of expenditure by categorical items. Retrieved July, 25, 2005, from http://www.acf.hhs.gov/programs/ccb/research/04acf696/table1.htm
20 Barnett, W. S., Hustedt, J. T., Robin, K. B., & Schulman, K. L. (2004). The state of preschool: 2004 state preschool yearbook [Electronic version]. Retrieved June 28, 2005, from http://nieer.org/yearbook/pdf/yearbook.pdf
21 Ibid.
Endnotes, cont.
Appendix A
United Way Success By 6® Stair Steps to Quality 63
Federal and State Funding for Early Care and Education


C
By Ray Collins, Ph.D.Former director of research for Head Start and the Administration on Children, Youth and Families and former senior researcher at the National Child Care Information Center
What Does Research Tell Us about the Effects of Early Care and Education on Children and the Characteristics of Quality Early Care and Education Programs?Our knowledge about the impact of child care and other early education programs has grown considerably in recent years. For more than a decade, it has been widely known among policymakers and other stakeholders that a high-quality early childhood program that is well-designed, adequately funded, and properly staffed can produce lasting benefi ts in the academic achievement and life success of low-income and disadvantaged chil-dren, including high-risk African-American, Hispanic, and Caucasian children (Barnett, 1995). These benefi ts have been documented in research-oriented programs, including the Perry Preschool Project (Schweinhart, 2004), the Abecedarian Preschool Program (Ramey, 2000), and the Chicago Child-Parent Centers (Reynolds, Temple, Robertson, & Mann, 2001).
These high-quality demonstration programs have documented lasting effects of preschool that include im-proving readiness for school, enhancing subsequent educational success (language, literacy, reading, and arithmetic), avoiding special education, decreasing grade retention, reducing school dropout and improving high school graduation rates, reducing delinquency and crime, and improving adult job prospects and income. A benefi t-cost analysis of the Perry Preschool Project shows that a $1 investment in high-quality preschool can return $17 in benefi ts to society through reducing cost of crimes, reducing justice system costs, increasing taxes paid by participants through higher earnings, saving schooling costs (e.g., through reducing need for special education services), and reducing welfare costs (Schweinhart, 2004).
Are these demonstration programs unique or can we attain comparable results in ordinary Head Start, child care, and prekindergarten settings? To what extent is it possible to achieve important lasting benefi ts in large-scale, community-run early childhood programs? A growing body of research is helping to answer these questions and defi ne the characteristics of programs that produce these results, thus defi ning quality.
Head Start
Evidence from Head Start over the years suggests that the program produces both short-term and long-term educational benefi ts (Barnett, 2002). Syntheses of Head Start research studies spanning the program’s fi rst two decades documented the cumulative evidence for the value of the program, particularly in producing language and cognitive benefi ts (McKey et al., 1985). In addition, studies conducted during this early period
Summary of Research on Qualit y IndicatorsAppendix
65United Way Success By 6® Stair Steps to Quality

of Head Start’s history, using relatively strong scientifi c designs, found benefi ts of health services (Fosburg & Brown, 1984), as well as developmental gains for children with disabilities (e.g., gains in physical, self-help, academic, and communication skills) (Roy Littlejohn Associates, Inc., 1985), compared with children who did not participate in Head Start.
The Head Start Family and Child Experiences Survey (FACES) has collected information on a nationally rep-resentative sample of Head Start children who were followed from the time they entered Head Start at ages 3 or 4 through 1st grade (McKey, 2003). Data are now available on the 1997 and 2000 groups of Head Start children. Head Start children showed signifi cant gains in areas of early literacy, including vocabulary and let-ter recognition. Classroom quality in the FACES study was affected by teacher qualifi cations and experience, teachers’ knowledge of best practices, and curriculum used. The majority of teachers used either the Creative Curriculum (39 percent) or High/Scope (20 percent). Classrooms that used either of those two curricula had substantially higher-quality ratings than classrooms that used other curricula.1
Program characteristics believed to be associated with improved cognitive and social and emotional outcomes in the FACES study included:
Using an integrated and comprehensive preschool curriculum
Having more ample program resources
Providing classrooms of higher quality as early learning environments
Employing a better prepared teaching staff
Providing preschool services for a longer period each day
Conducting educational activities in smaller groups with more personal attention to needs and prefer-ences of individual children
Encouraging parents to engage in more educational activities with their children at home (Zill, 2003).
Research has documented important effects of Head Start on racial/ethnic minorities, including Hispanics (Collins & Ribeiro, 2004). RAND researchers analyzed the benefi ts of participation in Head Start for Hispanic children during the period from 1979–1992 and found large positive effects on language, literacy, and school achievement (Currie & Thomas, 2000).
In addition to the regular Head Start program which focuses on preschoolers, the Early Head Start program serves infants, toddlers, and pregnant women. A well-designed evaluation of Early Head Start found that participating children did better on measures of cognitive, language, and social and emotional development than a randomly assigned group of control children. Early Head Start children were less likely to score in the at-risk range of developmental functioning on cognitive and language measures. Although the magnitude of the effects were modest, there were indications that the benefi ts were cumulative, strengthening from age 2 to age 3, particularly on social and emotional development (including reducing aggressive behavior) (Head Start Bureau, 2002).
United Way Success By 6® Stair Steps to Quality66
Summary of Research on Quality Indicators

Although hundreds of research and evaluation studies of Head Start have been conducted over the 40 years of the program’s operation, the studies have not combined the features of strong design (e.g., random as-signment, longitudinal data collection following the same children over time), have not been nationally representative, and have only collected information about program quality linked to a broad range of program outcomes. Aware of the need for more knowledge in light of the rapidly growing federal and state investments in Head Start, Congress mandated that the U.S. Department of Health and Human Services launch a rigorous study of Head Start on child outcomes. The contract for a nationwide longitudinal study was awarded in 2000, data collection is scheduled for 2002–2006, and the fi nal report is targeted for December 2006 (Westat, 2003). The study will address two main questions:
What difference does Head Start make to the key outcomes of development and learning (and, in particular, the multiple domains of school readiness)?
Under what circumstances does Head Start work best and for which children?
Child Care
The Cost, Quality and Child Outcomes in Child Care Centers Study was a comprehensive analysis of center care in communities in four states: California, Colorado, Connecticut, and North Carolina (Cost, Quality & Child Outcomes Study Team, 1995). Child care at most centers was found to be poor to mediocre.2 Child care quality was primarily related to higher staff-child ratios, staff education, administrators’ prior experience, and teach-ers’ wages, education, and specialized early childhood training.
A positive relationship was found between child care quality and child outcomes for all children. Children in high-quality centers (termed “developmentally appropriate”) tended to score well on language and academic skills (pre-reading and pre-math). Children in centers rated as mediocre or poor scored substantially poorer on those outcomes. Moreover, participation in centers of lesser quality compromised the children’s ability to enter school ready to learn, and in one out of eight centers, the care was of such poor quality it threatened the children’s health and safety.
In a fi nding that foreshadowed the standards discussed in this paper on Quality Rating Systems (QRS), the report noted:
States in this study with more demanding licensing standards have fewer poor-quality centers; centers that comply with additional standards beyond those required for basic licensing (such as those required for funding or accreditation) provide higher quality services (Cost, Quality & Child Outcomes Study Team, 1995, p. 1).
In a longitudinal study, the researchers followed the same children through the end of 2nd grade to examine the infl uence of typical center-based care on children’s development as they moved into elementary school (Peisner-Feinberg et al., 1999). The study confi rmed and extended the fi nding that children in high-quality care achieved important and lasting gains in cognitive, social, and emotional skills. 3
1.
2.
United Way Success By 6® Stair Steps to Quality 67
Summary of Research on Quality Indicators

Children from a wide range of family backgrounds who attended high-quality centers performed better through kindergarten, and in many cases through the end of 2nd grade, on basic cognitive skills (language and math) and children’s behavioral skills in the classroom (thinking/attention skills, sociability, problem behaviors, and peer relations). For some outcomes (math skills and problem behaviors), the children who gained the most were those most at risk, and these long-term benefi ts tended to be sustained through 2nd grade.
The study sheds additional light on those factors in the child care program that were associated with enduring child outcomes. Children did best in elementary school if they had experienced child care settings that used high-quality classroom practices and if they had close relationships with their child care teachers.
Following the pattern set by the Cost, Quality and Child Outcomes project, numerous syntheses of child care research studies, as well as original research, have been conducted. In general, child care research has moved from the attempt to determine whether typical child care as operated at the community level is helpful (or harmful) to a focus on what level of quality is necessary to produce important and sustained benefi ts and what factors are present in high-quality programs.
A synthesis of 28 child care research studies found that quality in family child care homes and child care centers is generally mediocre, particularly in programs used by low-income families. The researchers confi rmed that high-quality program settings (in both centers and homes) are associated with benefi ts for children (Love, Schochet, & Meckstroth, 1996). The report provided a thoughtful and useful analysis of the factors that contribute to high quality (the discussion that follows focuses on child care centers, since less evidence is available about family child care homes).
Quality was categorized as having three dimensions: classroom structure, classroom dynamics, and staff characteristics: 4
Classroom structure includes variables focused on classroom composition, such as staff-child ratio and group size.
Classroom dynamics includes variables focused on teacher and caregiver behaviors, such as the qual-ity of teacher-child interaction, positive (or negative) teacher behaviors, teachers’ verbal interaction with children, and developmentally appropriate activities (as defi ned by National Association for the Education of Young Children).
Staff characteristics includes variables focused on the qualifi cations of teachers and other center staff, such as level of formal education, extent of experience in early care and education, specialized early childhood training, and staff turnover.
Researchers found that variables in all three dimensions were associated, both separately and in combination, with important cognitive, language, and social and emotional outcomes. Moreover, these variables (particu-larly child-staff ratio, group size, and staff characteristics) have a major impact on the cost of child care and other early education programs.
Precise answers are not yet available from existing knowledge on the quality enhancements of each variable that are necessary to produce worthwhile and enduring outcomes, or the danger thresholds below which
United Way Success By 6® Stair Steps to Quality6868
Summary of Research on Quality Indicators

children would be harmed, development would be impaired, and at-risk children would fall even further be-hind. What is known is that high-quality programs (perhaps the top 25 percent) produce important benefi ts, and the evidence suggests that mediocre or low-quality programs do not.
In recent years, studies have emerged on the impact of 1996 welfare reform (Temporary Assistance for Needy Families or TANF) on the availability and quality of child care in families where mothers have been in pro-grams to move them from welfare to work (Loeb, Fuller, Kagan, & Carrol, 2004). In a carefully designed study of selected child care providers in California and Florida, the researchers found strong positive effects of participation in center-based child care on a broad range of cognitive and language outcomes compared with children in kith or kin child care settings. Quality variables associated with child gains included providers’ education and caregiver-child interaction.
The National Institute of Child Health and Human Development (NICHD) has sponsored an important longitu-dinal study of a large sample of children who were followed from birth through 54 months. Analyses conducted by the NICHD Early Child Care Research Network have confi rmed the relationship of quality to children’s development (NICHD Early Child Care Research Network, 2002). Over and above the effect of family variables, the quality of the child’s nonmaternal caregiving was associated with cognitive competence and caregivers’ ratings of social competence. Caregiver training and staff-child ratios tended to operate in concert with the family’s infl uence to promote positive child outcomes. Researchers concluded that these fi ndings provide empirical support for state policies to improve caregiver training and staff-child ratios.
Prekindergarten
As of 2003, there were 55 statewide prekindergarten (preK) programs operating in 40 states (Gilliam & Zigler, 2004). Eleven states both fund and administer their own preK system and supplement Head Start; 27 fund a state preK system, but do not supplement Head Start; 2 states supplement Head Start, but do not fund a state preK system; and 10 states do not provide any form of preK funding. Evaluation results are available that provide some data on children’s developmental outcomes for 13 of these states at the end of the preK program or during early elementary school.
In general, studies of state preK show positive effects in overall developmental competence, with some evidence that these gains persist into kindergarten. Signifi cant effects were found in language, literacy, arithmetic, social, and self-help skills. A few studies reported fi ndings in other outcome domains, but evaluators rarely used the same measures or collected data consistently, making it diffi cult to generalize.
Although sustained effects at 1st grade were uncommon, they were most frequently reported in language, lit-eracy, and arithmetic skills. When effects beyond 1st or 2nd grade were reported, they related to the children’s actual performance in school (e.g., reduced grade retention). Researchers speculated that, by enhancing school readiness, preK programs may set children on a path of improved classroom behavior, motivation, and academic performance—outcomes better measured by administrative data collected in school rather than by test scores. Researchers concluded that the overall fi ndings closely resemble the effects of Head Start and other large-scale programs, rather than the consistently high-quality, research-oriented demonstration programs.
The U.S. Government Accountability Offi ce (GAO) conducted an in-depth analysis of preK programs in four states (Georgia, New Jersey, New York, and Oklahoma) to assess child outcomes and the implications of quality
United Way Success By 6® Stair Steps to Quality 69
Summary of Research on Quality Indicators

features for other early care and education programs (GAO, 2004). Prekindergarten programs across the four states served more than 143,000 children, ranging from approximately one-third to more than one-half of the age-eligible children in each state.
GAO’s review of studies that had been conducted of child outcomes in two states (Georgia and Oklahoma) confi rmed the fi nding that preK tends to produce positive but modest effects on children’s development, particularly on cognitive and language benefi ts. The GAO study is noteworthy in that it summarizes available information on the distribution of quality variables in preK programs and adds to the body of knowledge about the benefi ts of collaboration, in which school districts partner with child care and Head Start providers to administer a community-wide system of preK services. Among the quality variables highlighted by GAO were class size, staff-child ratio, teacher qualifi cations, comprehensive curriculum standards, and program intensity (whether the program is half-day or full-day, the number of days during the week and year in which children receive services, and whether children participate for one or two years).
What Are the Implications of the Research on Program Quality and Child Outcomes for Quality Rating Systems? Several conclusions emerge from this review of the effects of early care and education that have direct implications for QRS. First, high-quality programs can lead to dramatic benefi ts for children in terms of school readiness, later school achievement, and lifelong success, yielding a positive return on investment for society. Second, the majority of program settings are not high quality. Children who experience mediocre or low-quality care do not demonstrate signifi cant gains and, in some situations, may be at developmental risk or actual danger. Program improvement is needed. Third, we know the program variables that are associated with worthwhile outcomes for children, and that competent early childhood educators know how to improve quality.
The program characteristics that are related to good outcomes for children inform the standards or quality criteria for a QRS. Taking account of the research evidence, three categories matter:
Structure—group size and staff-child ratios
Staff qualifi cations—teachers’ formal education, specifi c training, experience and turnover, and administrators’ experience
Program dynamics—
Curriculum integrated across developmental areas (cognitive, language, approaches to learning, social, emotional, etc.)
Nature of the learning environment—teacher-child interactions, positive teacher behaviors, small group activities, and implementation of the curriculum
Engagement of parents—especially in educational activities at home with their children, reading to children, talking with them.
United Way Success By 6® Stair Steps to Quality7070
Summary of Research on Quality Indicators

Endnotes
1 Quality ratings were based on standardized classroom observation assessment instruments, including the Early Childhood Environment Rating Scale-Revised and the Assessment Profi le.
2 Quality at centers was rated with a variety of instruments, including the Early Childhood Environment Rating Scale, Infant/Toddler Environment Rating Scale, Caregivers Interaction Scale, Teacher Involvement Scale, and UCLA Early Childhood Observation Form. Observations were also taken of classroom staffi ng ratios and group size at different times during the day.
3 It must be recognized, however, that only one-quarter of the child care centers in the study were rated high quality, which was defi ned as a center that meets the defi nition of developmentally appropriate care put forth by the National Association for the Education of Young Children, as determined in this research by a classroom score of fi ve or higher on the Early Childhood Environment Rating Scale.
4 These are the three terms used in the research report; however, these dimensions were called by many different names in the original studies. In recent years, terms similar to classroom structure, classroom dynamics, and staff characteristics have been widely used; although some researchers group and name the variables differently (e.g., structural features, including staff-child ratios, and process features, in-cluding quality of caregiving).
United Way Success By 6® Stair Steps to Quality 7171
Summary of Research on Quality Indicators


United Way Success By 6® Stair Steps to Quality
References
Barnett, W. S. (2002, September). The battle over Head Start: What the research shows. Paper presented at a Congressional Science and Public Policy Briefi ng sponsored by the Federation of Behavioral, Psychological, and Cognitive Sciences and the Foundation for Child Development. Retrieved November 19, 2004, from http://nieer.org/resources/research/BattleHeadStart.pdf
Barnett, W. S. (1995). Long-term effects of early childhood programs on cognitive and school outcomes. The Future of Children: Long-Term Outcomes of Early Childhood Programs, 5(3), 25–50. Retrieved November 19, 2004, from http://www.futureofchildren.org/usr_doc/vol5no3ART2.pdf
Cobb, K. (2003). The ABCs of ECD: Conference explores the latest research on the economics of early childhood development. Retrieved July, 18, 2005, from http://www.minneapolisfed.org/pubs/region/03-12/ecd.cfm
Collins, R., & Ribeiro, R. (2004, Fall). Toward an early care and education agenda for Hispanic children. Early Childhood Research and Practice, 6(2). Retrieved November 23, 2004, from http://ecrp.uiuc.edu/v6n2/collins.html
Cost, Quality & Child Outcomes Study Team. (1995). Cost, quality, and child outcomes in child care centers, Public Report. Denver: University of Colorado at Denver, Economics Department.
Currie, J., & Thomas, D. (2000). Does Head Start help Hispanic children? RAND Labor and Population Program Reprints, RP-881. (Reprinted from Journal of Public Economics, 74(2), pp. 235–262, 1999).
Fosburg, L., & Brown, B. (1984). The effects of Head Start health services: Executive summary of the Head Start health evaluation. Cambridge, MA: Abt Associates.
Gilliam, W. S., & Zigler, E. F. (2004). State efforts to evaluate the effects of prekindergarten: 1977 to 2003. Retrieved November 19, 2004, from http://nieer.org/resources/research/StateEfforts.pdf
Head Start Bureau. (2002, June). Early Head Start benefi ts children and families. Retrieved July 25, 2005, from http://www.acf.hhs.gov/programs/opre/ehs/ehs_resrch/reports/dissemination/research_briefs/research_brief_overall.pdf
Heckman, J. J. (2000). Invest in the very young. Retrieved July 18, 2005, from http://www.ounceofprevention.org/downloads/publications/Heckman.pdf
Loeb, S., Fuller, B., Kagan, S. L., & Carrol, B. (2004). Child care in poor communities: Early learning effects of type, quality, and stability. Child Development, 75(1), 47–65.
Love, J. M., Schochet, P. Z., & Meckstroth, A. L. (1996, May). Are they in any real danger? What research does—and doesn’t—tell us about child care quality and children’s well-being. Retrieved November 22, 2004, from http://www.mathematica-mpr.com/publications/PDFs/realdanger.pdf
McKey, R. H. (2003). The Head Start Family and Child Experiences Survey (FACES): What are we learning about program quality and child development? Children and Families, XVII(1), 62–64.
73

United Way Success By 6® Stair Steps to QualityUnited Way Success By 6® Stair Steps to Quality
McKey, R. H., Condelli, L., Ganson, H., Barnett, B., McConkey, C., & Plantz, M. (1985). The impact of Head Start on children, families, and communities: Final report of the Head Start evaluation, synthesis, and utilization project (DHHS Publication No. (OHDS) 90-31193). Washington, DC: U.S. Department of Health and Human Services.
Mitchell, A., Stoney, L., & Dichter, H. (2001). Financing child care in the United States: An expanded catalogue of current strategies. Retrieved November 19, 2004, from http://www.kauffman.org/pdf/childcare2001.pdf
National Institute of Child Health and Human Development Early Child Care Research Network. (2002). Child-care structure process outcome: Direct and indirect effects of child-care quality on young children’s development. Psychological Science, 13(3), 199–206.
Peisner-Feinberg, E. S., Burchinal, M. R., Clifford, R. M., Culkin, M. L., Howes, C., Kagan, S. L., et al. (1999). The children of the cost, quality, and outcomes study go to school: Executive summary. Retrieved November 19, 2004, from http://www.fpg.unc.edu/~ncedl/PDFs/CQO-es.pdf
Ramey, C. (2000). Why early childhood intervention is a key investment for state and local policymakers. Retrieved November 22, 2004, from http://www.circ.uab.edu/cslides/ramey.pdf
Reynolds, A. J., Temple, J. A., Robertson, D. L., & Mann, E. A. (2001). Long-term effects of an early childhood intervention on educational achievement and juvenile arrest: A 15-year follow-up of low-income children in public schools. Journal of the American Medical Association, 285(18), 2339–2346.
Rolnick, A., & Grunewald, R. (2003). Early childhood development: Economic development with a high public return. Retrieved July 18, 2005, from http://minneapolisfed.org/pubs/fedgaz/03-03/earlychild.cfm
Roy Littlejohn Associates, Inc. (1985). Follow-up evaluation of the effects of mainstreaming handicapped children in Head Start. Washington, DC: Author.
Schweinhart, L. J. (2004). The High/Scope Perry Preschool Study through age 40: Summary, conclusions, and frequently asked questions. Retrieved July 15, 2005, from http://www.highscope.org/Research/PerryProject/PerryAge40SumWeb.pdf
Urahn, S. K. (2001). Promoting universal access to high quality early education for three and four year olds: The Pew Charitable trusts and the Starting Early, Starting Strong Initiative. Washington, DC: Pew Charitable Trusts.
U.S. Department of Education, National Center for Education Statistics. (2001). Entering kindergarten: A portrait of American children when they begin school: Findings from The Condition of Education 2000. Retrieved June 16, 2005, from http://nces.ed.gov/pubs2001/2001035.pdf
U.S. Government Accountability Offi ce. (2004, September). Prekindergarten: Four selected states expanded access by relying on schools and existing providers of early education and care to provide services (Publication No. GAO-04-852). Retrieved November 19, 2004, from General Accountability Offi ce Reports Online via GPO Access: http://www.gao.gov/new.items/d04852.pdf
References
74

United Way Success By 6® Stair Steps to QualityUnited Way Success By 6® Stair Steps to Quality
U.S. General Accounting Offi ce. (2002, September). Child care: States have undertaken a variety of quality improvement initiatives, but more evaluations of effectiveness are needed (Publication No. GAO-02-897). Retrieved November 19, 2004, from General Accountability Offi ce Reports Online via GPO Access: http://www.gao.gov/new.items/d02897.pdf
Westat. (2003). Building futures: The Head Start Impact Study, interim report. Retrieved July 25, 2005, from http://www.acf.hhs.gov/programs/opre/hs/impact_study/reports/imptstdy_interim/imptstdy_interimrpt.pdf
Zill, N. (2003, April). Relationship of program and classroom characteristics to children’s cognitive gains and social development in Head Start. Presentation at the Society for Research in Child Development Biennial Conference, Washington, DC. Retrieved July 25, 2005, from http://www.acf.hhs.gov/programs/opre/hs/faces/pres_papers/relation_program/prog_title.html
References
75

National Child Care Information Center
NCCIC is a service of the
10530 Rosehaven Street, Suite 400Fairfax, VA 22030
Voice: 800-616-2242 TTY: 800-516-2242 Fax: 800-716-2242E-mail: [email protected] Web: http://nccic.org
Additional copies are available from NCCIC.

701 North Fairfax StreetAlexandria, VA 22314
703-836-7112
www.unitedway.org


![GLOBAL INDUSTRIES, INC. Clarifi er Installationglobaltreatmentsystems.com/wp-content/uploads/2012/... · 2 Clarifi er Installation 80010036 11-09 [1] GLOBAL ... General Safety Statement](https://img.pdfslide.us/doc/110x75/5b2bbbc77f8b9a6d188b79bf/global-industries-inc-clari-er-installationgl-2-clari-er-installation.jpg)