Embed Size (px)
Citation preview

Stainless Steel Materials
South African Fund Manager Presentation : June 2003
Dr Chris Pointon – President, Stainless Steel Materials Customer Sector Group

SSM SA Fund Manager Presentation June 2003Page 2
SSM already has a established production and marketing presence
NewIndonesia
AustraliaWestern
Operations
Exploration
Ni/Cr marketing office
Caledonia
Cerro MatosoColombia
South AfricaSamancor Chrome
QNIYabulu
Refinery
Philippines
The Hague - Marketing
SSM SA Fund Manager Presentation June 2003Page 3
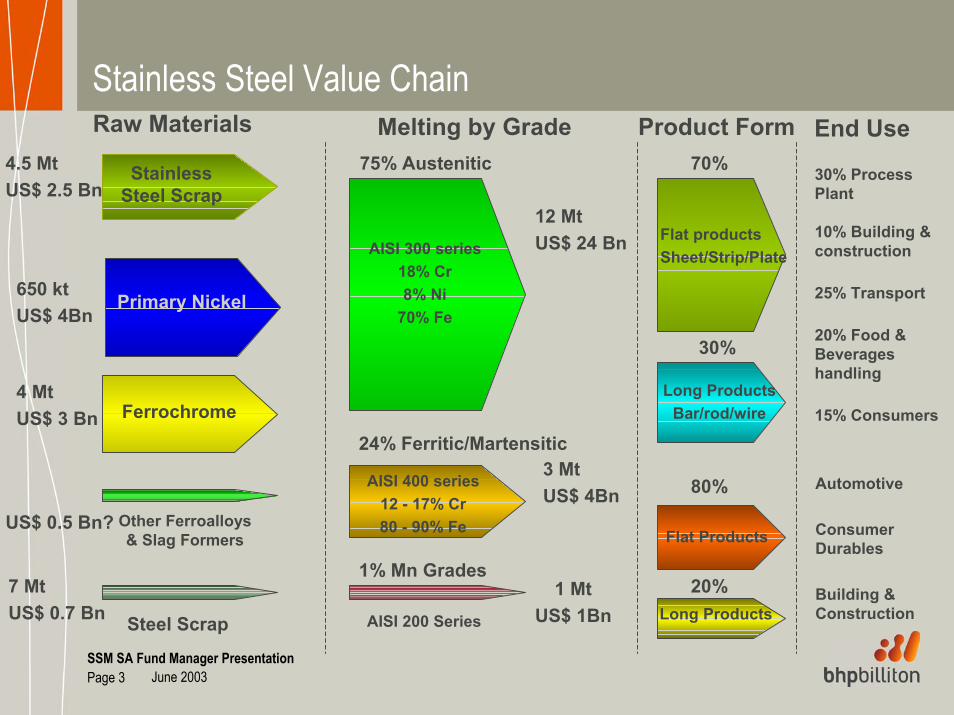
Stainless Steel Value Chain
Steel Scrap AISI 200 Series
Automotive
Consumer Durables
Building &Construction
StainlessSteel Scrap
Primary Nickel
Ferrochrome
Other Ferroalloys & Slag Formers
75% Austenitic
AISI 300 series18% Cr8% Ni
70% Fe
24% Ferritic/Martensitic
AISI 400 series12 - 17% Cr80 - 90% Fe
1% Mn Grades
4.5 MtUS$ 2.5 Bn
650 ktUS$ 4Bn
4 MtUS$ 3 Bn
US$ 0.5 Bn?
7 MtUS$ 0.7 Bn
70%
80%
30%
20%
Flat productsSheet/Strip/Plate
Long ProductsBar/rod/wire
Flat Products
Long Products
30% Process Plant
10% Building & construction
25% Transport
20% Food & Beverageshandling
15% Consumers
12 MtUS$ 24 Bn
3 MtUS$ 4Bn
1 MtUS$ 1Bn
Raw Materials Melting by Grade Product Form End Use

SSM SA Fund Manager Presentation June 2003Page 4
Stainless Steel is the fastest growing major use of metals, and will continue to grow strongly
0
5
10
15
20
25
1970 1975 1980 1985 1990 1995 2000
0
5
10
15
20
25
1970 1975 1980 1985 1990 1995 2000
W. Europe
USA
Japan
Russia Other
China
Stainless Slab Production – million tonnes

SSM SA Fund Manager Presentation June 2003Page 5
Chrome Value Chain – >80% of ore converted to FeCr, and 75% of FeCr used in stainless steels
OreOreProductionProduction
Chemical Chemical ProducersProducers
Integrated Integrated Alloyers Alloyers
85%85%
Independent Independent Alloyers Alloyers
15%15%
10%10%
8%8%
82%82%
LowLow--carboncarbonferrochromeferrochrome Other usesOther uses 25%25%
5%
MediumMedium--carboncarbonferrochromeferrochrome 3%
Stainless SteelStainless SteelProductionProduction 75%75%
HighHigh--carboncarbonferrochrome &ferrochrome &Charge chromeCharge chrome 92%
* Percentages based oncontained chrome units
RefractoriesRefractories& Foundries
Ferrochrome production 2000LCFeCr = 240 ktMCFeCr = 140 ktHCFeCr = 4900 kt
& FoundriesTotal = 13 Mtpa
Source: Samancor

SSM SA Fund Manager Presentation June 2003Page 6
Austenitic Stainless has maintained a strong growth trend. Primary Ni and FeCr inputs will grow proportionately faster as scrap supply is constrained
CAGR1989-2002
Projections2003-2010
>4.5%
5.4%
6.7%
4.4%
>5%
3.1% >5.0%
>5%
Primary Growth - Rising to 5%paSecondary Growth - Exceeding Primary
0
1,000
2,000
3,000
4,000
5,000
6,000
1989 1990 1991 1992 1993 1994 1995 1996 1997 1998 1999 2000 2001 20020
2000
4000
6000
8000
10000
12000
14000
16000
Austenitic Steel Production(Right Hand Scale)
Primary Nickel production
High Carbon Ferrochrome Production
Stainless Steel Scrap (*)
kt
Note: * Excludes internal scrap

SSM SA Fund Manager Presentation June 2003Page 7
The primary nickel supply business has high financial and technical barriers to entry
Buyer power
LOW
Threat ofsubstitution
Industryrivalry
MODERATE TO HIGH
Market demand growing @ 4-5%pa
MODERATE TO HIGH
High Capital Intensity, Technical
Complexity
Capital Efficient Growth
Barriers to entryHIGH
Supplier power
HIGH
Growth Sustainability

SSM SA Fund Manager Presentation June 2003Page 8
A primary nickel supply gap is set to emerge over the present decade. Only three major projects at Feasibility. Lead times for new projects are 7-10 years. The majority of current production is from sulphide mines, but most new nickel projects will be from laterite ores.
1.0
1.1
1.2
1.3
1.4
1.5
1.6
1.7
2000 2001 2002 2003 2004 2005 2006 2007 2008 2009 2010
Use
GoroVBN
Brownfield expansions
Capacity in 2002 less sulphide depletion
BHPBilliton
“Supply Gap”
Market surplus
Nickel reserves Nickel production
oxide 75%
sulphide 25% oxide40%
sulphide 60%
Mt

SSM SA Fund Manager Presentation June 2003Page 9
Cerro Matoso Project – Colombia – 99.8% OwnershipProduction History
Reserves : 46.9Mt @ 1.93% NiResources : 65.4Mt @ 1.75% NiNB based on 1.1% Ni cut-off
0
5,000
10,000
15,000
20,000
25,000
30,000
35,000
40,000
45,000
50,000
83 88 93 98 2000 2001 2002 2003
1.00
1.50
2.00
2.50
1998 1999 2000 2001 2002 2003
Year Ending June
US$/l
b Ni
(Rea
l 200
3)
C1 Cost C3 CostLost Time Injury Frequency Rate
012345
1998 1999 2000 2001 2002 2003
LTIF
R
Year Ending June

SSM SA Fund Manager Presentation June 2003Page 10
The QNI strategy
Stabilise Yabulu operation
• Zero harm • Catch-up maintenance. • Commence installation of
modern management practices.
Utilities due forcompletion in FY04
Ore processing plants at world class orebodies with expansion of refinery part of Yabulu
• Phase I:Concurrently develop Ravensthorpe and Yabulu Extension Projects.
• Phase II:Develop 2nd Ore Processing project at suitable orebody with no further expansion of Yabulu
Feasibility Study
Optimise Yabulu margins
• Incremental value-added product development.
• Incremental Ni and Co production increases:
•YOI quick payback project suite
•LGSO strategy• Cost reduction initiatives:
•Small group projects•Capitalise on gas at Yabulu site
•Best management practices, particularly Maintenance
• Establish own mine for up to one third of ore supply.
In Progress

SSM SA Fund Manager Presentation June 2003Page 11
QNI Yabulu – Australia - 100% Ownership
25,000
26,000
27,000
28,000
29,000
30,000
31,000
32,000
1998 1999 2000 2001 2002 2003
Year Ending June
Tonn
esNi
0123456789
LTIF
R
Nickel - Tonnes
LTIFR
Yabulu Site Cash Cost of Production after Cobalt Credits
2.50
2.75
3.00
3.25
FY00 FY01 FY02 FY03
US$
/ lb
Site Cash Cost of Production after Cobalt CreditsLinear (Site Cash Cost of Production after Cobalt Credits)
Normalised on FY03 Assumptions:LME $3.44 US$/A$ 0.584 Oil A$301/t Coal A$60/tLMB $7.34 Insurance A$5.7m Naphtha A$734/t
SSM SA Fund Manager Presentation June 2003Page 12
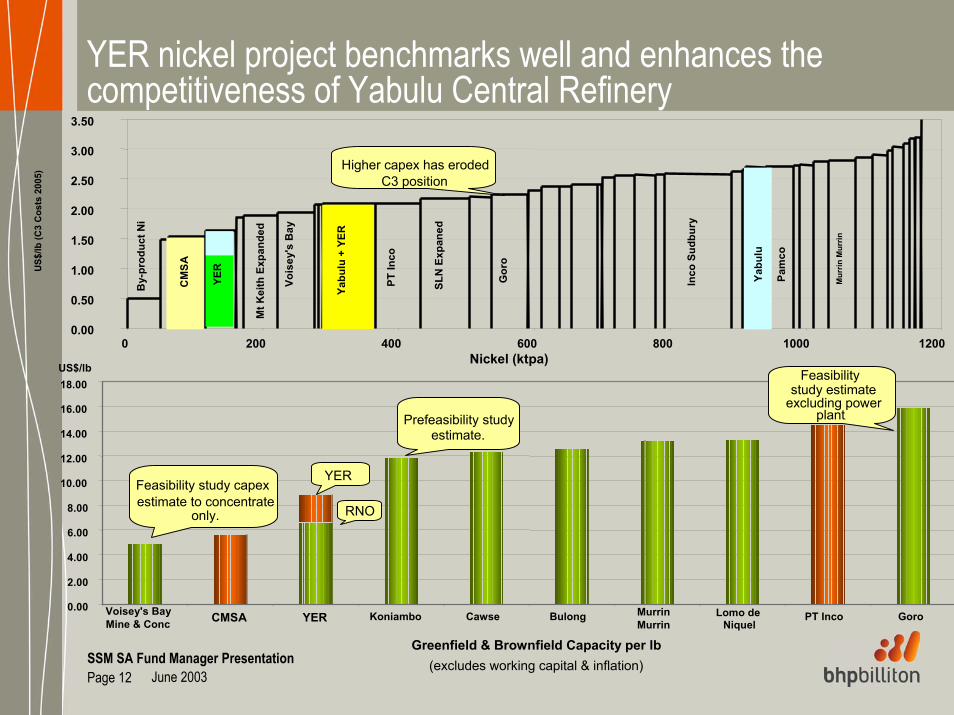
Greenfield & Brownfield Capacity per lb(excludes working capital & inflation)
0.00
2.00
4.00
6.00
8.00
10.00
12.00
14.00
16.00
18.00
Voisey's BayMine & Conc CMSA YER Koniambo Cawse Bulong Murrin
MurrinLomo de
NiquelPT Inco Goro
US$/lb
YER
RNO
Feasibilitystudy estimate
excluding power plant.
Feasibility study capex estimate to concentrate
only.
Prefeasibility study estimate.
Nickel (ktpa)
US$/
lb (C
3 C
osts
200
5)
0.00
0.50
1.00
1.50
2.00
2.50
3.00
3.50
0 200 400 600 800 1000 1200
CM
SA
Mt K
eith
Exp
ande
d
Vois
ey's
Bay
YER
Yabu
lu+
YER
PT In
co
SLN
Exp
aned
Gor
o
Inco
Sudb
ury
Yabu
lu
Pam
co
Mur
rin M
urrin
Higher capex has eroded C3 position
By-
prod
uct N
i
YER nickel project benchmarks well and enhances the competitiveness of Yabulu Central Refinery

SSM SA Fund Manager Presentation June 2003Page 13
The FeCr industry has high internal rivalry, low barriers to entry, but growth is strong and there is no substitute, except for scrap
Low capital cost per tonne FeCr capacity
Threat ofsubstitution
LOW
Barriers to Entry
LOW
Buyer power
HIGH/CYCLICAL
Depends upon SS cycle and scrap availability
IndustryrivalryHIGH
SA to remain ore-long
Supplier power
HIGH
No substitute for Cr, but scrap cyclical

SSM SA Fund Manager Presentation June 2003Page 14
Ferrochrome demand growth outlook is robust – supply side is thus the issue
0
2,000
4,000
6,000
8,000
10,000
12,000
14,00019
90
1992
1994
1996
1998
2000
2002
2004
2006
2008
2010
2012
2014
2016
2018
2020
0
5,000
10,000
15,000
20,000
25,000
30,000
35,000
40,000
45,000
50,000Ferrochrome Demand (LHS)Stainless Steel Production (RHS)
(kt) (kt)
•Stainless growth 2005 – 2020: assumed 5% per annum•Ferrochrome demand = Stainless + other uses consumption•Growth rate of secondary chrome units decline from 2005 onwards
Growth Rates1990-1995
1995-2000
2000-2005
2005-2010
2010-2020
Total Ferrochrome demand growth (%) 4.7% 3.0% 4.0% 4.7% 5.2%No. of standard 120 kt furnaces required per annum 1.3 1.0 1.6 2.4 3.8

SSM SA Fund Manager Presentation June 2003Page 15
South Africa dominates the primary FeCr sector and will have the major share of future expansions
Zimbabwe19%
India1%
Finland1%
Kazakhstan7% Other
2%
South Africa70%
Source: Samancor
World Chrome Ore Reserves
Scandinavia9% Kazchrome
15%
Zimbabwe7%
Asia12%
Other8% Samancor
16%
ASA1%
Feralloys5%
Hernic5%
Xstrata20%
SA Chrome1%
World Primary Chrome Supply

SSM SA Fund Manager Presentation June 2003Page 16
Ferrochrome falling price trend is a continuing challenge to theindustry
20
40
60
80
100
120
140
160
1980
1985
1990
1995
2000
USc/lb (Real)
CAGR Price (80 - 00) = -3.24%
CAGR Cost (80 - 00) = -4.3%
Source: CRU, Samancor Analysis
Largest risk s to cost
•Reductants
•Electricity

SSM SA Fund Manager Presentation June 2003Page 17
South Africa has failed to create industry discipline for FeCrgrowth, and has exported most of the value of its dominant supplier position
60%
80%
100%
120%
140%
160%
180%
1996 1997 1998 1999 2000 2001 2002
SA FeCr Production
SA FeCr Revenue
Revenue in real US$ based on CRU US Import list price – 50-55%
CAGRProduction + 6.6%Revenue -2.0%
Xstrata 620 ktHernic 260 kt - new entrantSA Chrome 230 kt – new entranAssmang 200 ktSamancor 160 ktASA 60 kt – new entrant
SA has been the price setter in the industry in the past 7 years
But the total revenue to SA industry declined in real terms since 1996
SA Accounted for the 100% of net increase in FeCr world capacity since 1995 (1.53Mt)
Index SA production and Revenue (1996-2002)

SSM SA Fund Manager Presentation June 2003Page 18
BEE and the Ferrochrome business
3500
4000
4500
5000
5500
6000
(kt)
0
100
200
300
400
500
600
700
Capacityadditions
Demand
Supply
Capacity additions 40 220 260 348 482 336Demand 4530 4599 4409 4717 5011 5076 5374Supply 4622 4918 4040 4350 4976 5458 5794
1999 2000 2001 2002 2003 2004 2005
• The historic trend in SA capacity growth will continue. Entry barriers will be lower, as producers will not be able to retain unutilised resources.
• However, costs will rise - Rand, reductantcosts, increased electricity prices, social obligations for South African producers.
• Will HDSA participation in FeCr Smelters be profitable?
Hence HSDA business focus will likely center on:
• Procurement
• Mining and ore preparation
• Community development
• New smelting where there is a genuine low cost position
SA Project IRR ~ 12.5% Real
20
22
24
26
28
30
32
34
36
38
0.08 0.1 0.12 0.14 0.16 0.18 0.2 0.22 0.24Electricity Price R c/kWh
Cr R
ealiz
ed p
rice
CIF
US
c/lb
8 R:US$ 9 R :US$ 10 R:US$

SSM SA Fund Manager Presentation June 2003Page 19
Samancor Chrome (60% Ownership) : a Turnaround Asset
Reserves : 40Mt @ 42.4% CrResources : 570Mt @ 43.3% CrNB based on 38% Cr cut-off
PRODUCTION FACILITIES SOUTH AFRICA
Chrome OreFerrochrome
!
!
!
!
!!
!
!
!
!
!
!
!
!
!
!
!
!
!
!
!
!
!
!
!
!
!
!
!
!
!
!
!
!
!
!
!
!
!
!
!
!
!!
!
!
!
!
!
!
!
!
!
WCM Tubatse (incl ECM)
Ferrometals/IC3 MFC/MTC

SSM SA Fund Manager Presentation June 2003Page 20
Restructuring of Chrome Division by a 3 Horizon Strategy
Manufacturing mindset to reposition chrome at the bottom of the cost curve
• Zero harm • People lynchpin everything. • Eliminate waste.• ETG, furnace and mine stability, Procurement & contractor management, maintenance, GSAP&MES, Six Sigma. • Site specific cost reductions.
Reposition in Future Industry Context•Understand emerging industry dynamics. •Understand SA Government approach to FeCr industry.•Understand new product requirements in advance of the rest of the producers by working with customers.
•Increasing business maturity•Improving market / production interface
Optimise value chain through prudent investment•Understand future customer requirements.•Implementing high IRR capacity creep projects at the works.•Rationalise the mines with the value chain as the driver.

SSM SA Fund Manager Presentation June 2003Page 21
Variable cost drivers + results against benchmark show positive trends.
3.903.794.083.98SEC (k/Wh/ton)
50.976.510.642.49
FY03
50.951.151.3Cr content (%)74.172.2379.24Cr Recovery (%)0.630.650.64Reductant (t/t)2.542.582.43Ore (t/t)
FY02FY01FY00Cost Driver
Smelter Cost (R/t Real 2000)1700
1600
1400
1500
1300FY00 FY01 FY02 FY03
Samancor Benchmark

SSM SA Fund Manager Presentation June 2003Page 22
800
900
1000
1100
1200
1300
1400
Q1 Q2 Q3 Q4 Q1 Q2 Q3 Q4 Q1 Q2 Q3 Q4 Q1 Q2 Q3 Q4 Q1 Q2 Q3 Q4
2000 2000 2000 2000 2001 2001 2001 2001 2002 2002 2002 2002 2003 2003 2003 2003 2004 2004 2004 2004
-200
-100
0
100
200
300
400
500
600
700
800
900Cumulative Balance (Right-hand scale) Production Demand
Supply and demand balance – Samancor production
Forecast
(000
’t)
(000
’t)(0
00’t)
250
270Samancor Production
230
210
190
170
150

SSM SA Fund Manager Presentation June 2003Page 23
Conclusion
• Stainless steel – the highest growth major use of metals – provides a strong market for primary FeCr and Nickel
• A looming nickel supply gap is becoming apparent, a result of high entry barriers and inadequate returns on capital in 1990s
• SA will provide new FeCr capacity to meet the strong, but volatile, demand growth
• Uncontrolled FeCr capacity growth in SA has led, and may continue to lead, to significant value transfer to overseas customers.
• For Samancor Chrome, cost-efficiency is key, as input costs in SA are likely to increase
• BHP Billiton is a mature nickel producer, customer-focused with options for further capital-efficient growth