Embed Size (px)
Citation preview
STAGING OF ACUTE LEUKEMIA AND T H E REL,ATIONSHIP T O CNS INVOLVEMENT
Staging of ALL and C N S Disease
JOHN FITZPATKICK, MB,* NANCY LIEBERMAN, MD, AND I,ucivs F. SINKS, MD+
One hundred eighty-two children with acute lymphoblastic leukemia (ALL), reticulum cell sarcoma (RCS), and lymphocytic lymphosarcoma (LS) were divided into four groups as follows: Group 1-LS or RCS which never under- goes leukemic conversion; Group 2-Gross nodal enlargement either ALL from diagnosis or localized LCS or RCS subsequently converting to ALL; Group 3-ALL with palpable spleen or liver, but no gross nodal enlargement; Group G A L L without palpable spleen, liver, or gross nodal enlargement. I t was found that Group 4, despite a superior survival (42.5 months), had a reduced incidence (31.8%) of central nervous system leukemia. Leukemic “conversion” of LS or RCS and ALL with gross nodal enlargement (Group 2) had the shortest survival (median 8.5 months) but a relatively high percentage (58.8%) with CNS disease. In non-converting LS or RCS (Group 1) only 20% had CNS involvement. On histologic criteria alone, 14.3% with RCS had CNS disease, whereas 57.9% of those with LS were affected. It is felt that a distinct adverse relationship exists between extra medullary enlargement of spleen, liver, and lymph nodes a t diagnosis and the subsequent involvement of the CNS in ALL and transforming LS.
Cancer 33:1376-1881, 1974.
HE WIDE VARIETY OF PRESENTING SYMPSOMS T and signs in central nervous systeni (CNS) leukemia has been extensively described.9~10~12, 13,17s19~20 The increasing incidence of the com- plication has been attributed to such general factors as lengthening surviva1,T the unex- pected detection of CNS involvement during routine spinal taps in asymptomatic patients,15 and the increased awareness of its varied pre- sentation.6 The highest reported incidence of CNS involvement is in acute lymphoblastic leukemia of childhood.7~1~ Among other lym- phoproliferative disorders, Burkitt’s lym- phoma23 and the leukemic “conversion” group of lymphosarcoma8 also have a high percent- age with CNS infiltration. This study of childhood lymphosarcoma and ALL was un- dertaken to determine whether a disease classi-
From the Roswell Park Memorial Institute, Buffalo, N.Y.
Supported in part by Grant No. CA-07918-07, Na- tional Cancer Institute, National Institutes of Health.
Chief, Department of Clinical Pathology. t Chief, Department of Pediatrics. Address for reprints: Lucius F. Sinks, MD, Depart-
ment of Pediatrics, Roswell Park Memorial Institute, 666 Elm Street, Buffalo, N.Y. 14203.
The authors wish to thank Dr. J. D. Merrett and Dr. L. Bluemenson for their help in the statistical analysis.
Received for publication August 24, 1973.
fication on the basis of hepatic, splenic, or nodal enlargement at diagnosis had any rela- tionship to the subsequent development of CNS involvement.
MATERIALS A N D METHODS
For purposes of this study, CNS disease was defined as the postmortem histologic finding of leukemic cell infiltration of the brain or leptomeninges, or the presence at lumbar puncture of 10 or more mononuclear cells in the cerebrospinal fluid in the absence of gross blood contamination or positive bacteriologic culture.
The records of 182 children, 15 years or younger, admitted to the Pediatrics Depart- ment, Roswell Park Memorial Institute, be- tween January 1, 1960 and July 1, 1969 and diagnosed as ALL, lymphocytic lymphosar- coma (LS), or reticulum cell sarcoma (RCS) were reviewed. No other lymphomatous dis- ease such as Hodgkin’s disease or giant fol- licular lymphoma was included in the study. Because of the rather long time span of the study and the rapidly changing concepts of cancer chemotherapy over the past decade, no uniform chemotherapeutic regimen was em-
1376
No. 5 STAGING OF ALL AND CNS DISEASE - Fitzpatrick et al. 1377
4. ALL without palpable liver and spleen or gross nodal enlargement.
Gross nodal enlargement was considered clinically to be a mass greater than 3 cm in any diameter, and radiographically as me- diastinal widening or a soft tissue mass large enough to displace any adjacent organ.
The Life Table Method, as described by Cutler and Ederer,‘ was used i n analysis of survival and CNS data.
ployed in the children studied. Patients ini- tially diagnosed as LS or RCS were treated solely with radiotherapy unless the disease was multifocal, in which case, chemotherapy with vincristine (VCR), prednisone (pred), and an alkylating agent was added. Leukemic trans- formation was treated similarly to ALL. An occasional patient in each group received sporadic intrathecal methotrexate, but their numbers were small and insignificant and dis- tributed evenly among Groups 2, 3, and 4 and did not affect statistical analysis. Present- ing age, sex, total white blood cell count (WBC), size of hepatic and splenic projection below the costal margin, site and degree of nodal enlargement, or mediastinal mass on roentgenogram were recorded. The survival, time of onset, and the number of episodes of CNS leukemia were also obtained.
A bone marrow examination had been done on all children in Groups 1 and 2 during their initial hospitalization, though some not until 3 to 4 weeks after initial lymph node biopsy diagnosis. Leukemic transformation of LS or RCS was indicated by the presence of 25% or more blast cells on bone marrow examina- tion in association with an alteration as indi- cated in one or more of the following periph- eral blood parameters: hemoglobin less than 9 g/100 ml, platelets below 50,00O/m3, or more than 5y0 blast cells on the peripheral blood smear.1
On the basis of this information, the pa- tients were divided into four groups:
1. Lymphosarcoma or reticulum cell sar- coma which never undergoes leukemic conversion. 2. Gross nodal enlargement (>3 cm) either ALL from diagnosis or LS/RCS subsequently converting to ALL. 3. ALL with palpable liver or spleen, but no gross nodal enlargement.
TABLE 1. Patient Characteristics for Groups 1-4
Number and Number Male/ percentage Median
of female with CNS survival Group patients ratio disease in months
1 15 4 .0 3(20.0%) 12.0 2 26 4.2 14 ( 5 3 . 8 % ) 8 . 5 3 119 1.4 70(58.8%) 23.0 4 22 2 . 1 7(31.8%) 4 2 . 5
There is a statistically significant difference (p < 0.01) between Group 1 and the other 3 groups. Group 4 differs significantly (p < 0 . 0 5 ) from combined Groups 2 and 3.
RESULTS
Table 1 shows the distribution of the 182 children among the four groups together with the percentage and number ot patients in each having CNS disease. A Chi-square test using Yates’ correction performed on the data in Table 1 demonstrated a significant difference (p < 0.01) between Group 1 and the other three groups. Group 4 was significantly dif- ferent (p < 0.05) from combined Groups 2 and 3. All children with CNS involvement in Group 1 had direct tumor invasion of the brain or spinal cord and did not respond favorably to any form of therapy. Thirty-seven (40.6%) of the patients with CNS involvement in Groups 2 4 were in systemic relapse when initial CNS involvement was recorded. The mean number of bouts of CNS disease was similar for Groups 2-4.
The distribution by age for ALL in Groups 3 4 showed the expected peak in the 2-5-year range. There were 10 children in these two Groups who were under 2 years of age at diagnosis; 8 (80%) of them developed CNS leukemia. All 8 affected children fell into Group 3. In Group 2, 85% of the children were 5 years and older; 60% of Group 1 were between the ages of 10 and 15 years.
Nodal histology was available for 33 of the 41 persons in Groups 1 and 2. In “leukemic” Group 2, from a total of 18 reports, 4 were classified as RCS, and the remaining 14 (77%) as lymphocytic or lymphoblastic lymphosar- coma. Only 1 of the 4 children diagnosed as RCS in this group had CNS involvement. Group 1 had 10 (My0) classified as RCS and the remaining 5 as lymphocytic lymphosar- coma. Two of these latter 5 patients developed CNS disease, whereas only 1 of the 10 pa- tients with RCS had CNS invastion. Con- sideration of CNS disease incidence purely on the basis of histologic type showed that 2 of 14 children (14.3y0) classified as RCS and

1378 CANCER May 1974 VOl. 33
11 of the 19 (57.9%) with LS had CNS dis- ease.
The most common site of nodal involve- ment in Group 2 was the mediastinum with 14 patients (53.9y0) involved. In comparison, Group 1 had only 2 patients (13.3%) with mediastinal enlargement. In addition, Group 1 had 4 persons (26.6%) with disease involve- ment in the neck and 4 with involvement of the retroperitoneum. Two of the long term survivors in Group 1 had disease of the ileum. No particular relationship was found between the nodal areas involved and the amount of CNS invasion observed.
Both Groups 1 and 2 contain children with a diagnosis of LS or RCS. By definition, Group 2 contains all those who convert to leukemia. Thus, the maximum possible num- ber converting to leukemia is 26 (all those in Group 2) or 63% of the 41 children in the combined Groups 1 and 2. Some of the chil- dren in Group 2 could however be considered primary ALL with gross nodal enlargement. These are difficult to separate from leukemic conversion LS or RCS if the initial marrow was delayed and a definite sequence of normal marrow replacement by leukemic cells cannot be documented. However, if those children in Group 2 whose marrow showed replacement during the 1st 4 weeks of hospital admission are arbitrarily considered primary ALL and
loot 90
not leukemic conversion lymphosarcoma, then the conversion rate falls to 40%. All but one of the children in Group 2 underwent “leu- kemic conversion” before the onset of CNS leukemia. This solitary case involved the face and orbit, and presumably directly invaded the brain via the optic nerve.
The relationship of the presenting total white blood cell count (WBC) to CNS leu. kemia was investigated. Patients were divided into groups of less than lO,OOO/mm3 and greater than lO,OOO/mm3. In Group 3 there were almost equal numbers of patients above and below IO,OOO/mm3. In Group 4, however, 77.3% of the patients had initial WBC below lO,OOO/mm3. There was no significant increase in the incidence of CNS disease in the patients with high WBC’s in any of these stages. In the 0-2-year age group, however, 90% of the chil- dren had WBC’s above lO,OOO/mm3 and 89% of these children developed CNS complica- tions.
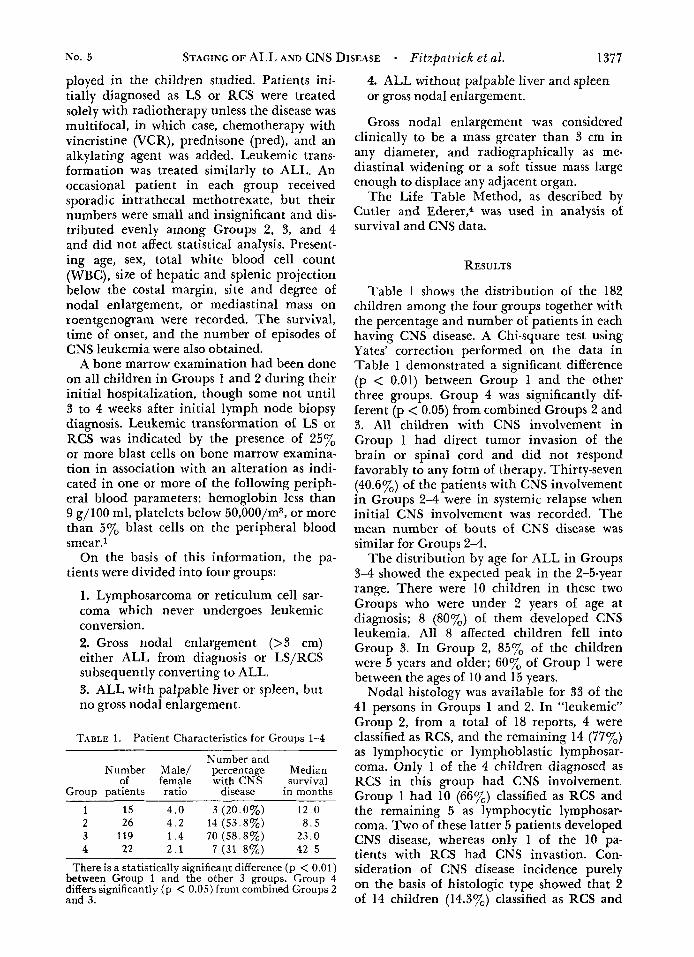
Survival from diagnosis by life table anal- ysis is shown in Fig. 1. The best survival was in Group 4 (median 42.5 months). In this group, six (27%) children were alive at the time of the study. All six had survived greater than 3 years, and three for longer than 5 years. In Group 3, with a median survival of 23 months, three children had lived longer than 5 years. The shortest median survival
FIG. 1. Survival curve for Groups 1 4 as esti- mated by life table analysis. Group 1--0; Group 2-N; Group 3-V; Group 4 - 0 . The vertical lines rep- resent plus or minus one standard deviation from the mean.
TIME IN MONTHS FllOM O I A G N O S I S
No. 5 STAGING OF ALL AND CNS DISEASE - Fitzpatl-ick et a2. 1379
was in Group 2 (8.5 months). Survival dura- tion was not influenced by the degree of organomegaly in Group 3, nor by the time of conversion to acute leukemia in Group 2. In Group 1 the median survival was 12 months, but there were four (27%) alive longer than 5 years, and one had lived for 10 years.
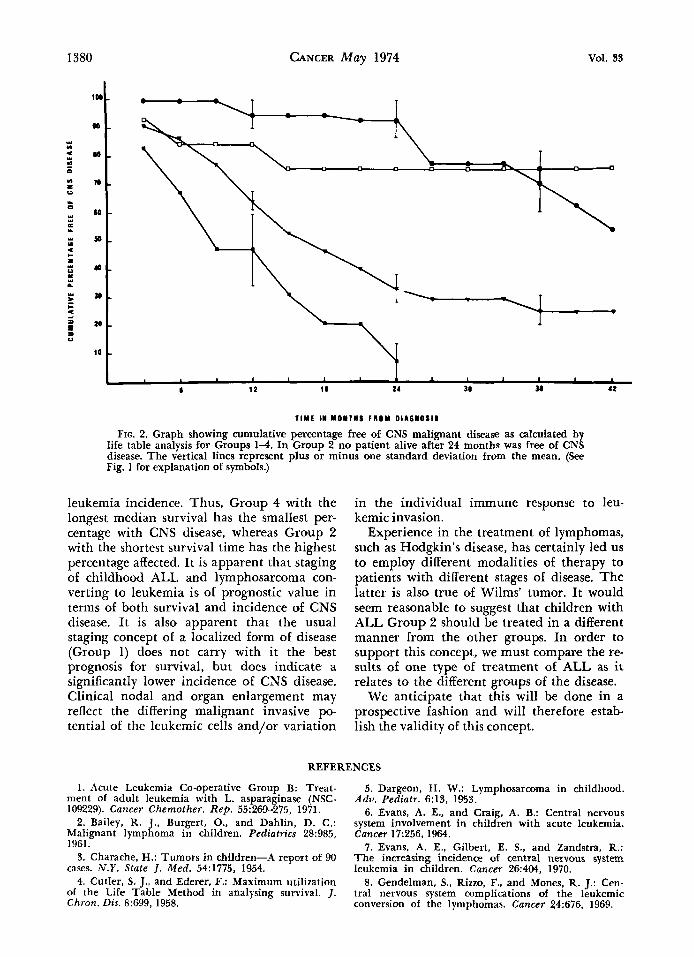
The percentage free from CNS leukemia as calculated by life table analysis is shown in Fig. 2. No cases in any group occurred past 42 months from diagnosis. I n Group 2, the longest time taken to develop CNS leukemia was 24 months; all five children who survived past this time had CNS involvement. The much poorer median survival in Group 2 (8.5 months as opposed to 23 months in Group 3) and the faster attrition rate (seven (27y0) patients died within 3 months after diagnosis) must be kept in mind when trying to evaluate this data.
Only four patients had CNS disease in Group 1 and all developed within 15 months of diagnosis. This group appears to differ from the other groups both in over-all inci- dence and type of CNS disease.
DISCUSSION
The superior survival found in Group 4 without organomegaly is consistent with the report of Hardisty and Ti11,ll who found that organomegaly in children with ALL is as- sociated with an inferior median survival time. They also concluded that the presence of a mediastinal mass was an unfavorable prognostic feature. The present study, show- ing a high percentage (53.9y0) with mediasti- nal masses in unfavorable Group 2, tends to support this suggestion. Further, it would seem that gross lymphadenopathy, irrespec- tive of site, is indicative of poor prognosis. In both studies, no uniform drug program was used. Accordingly the prognostic possibilities of Group 2 and 4 will have to remain specu- lative until they have been evaluated in pa- tients on similar therapy.
Lymphosarcoma comprises only some 6-7% of childhood cancers.3~6 It is more akin to ALL than to its adult counterpart and under- goes “conversion” to leukemia at a reported rate of between 14 and 52y0.2J4316J8.21 In the present study the “conversion” rate of LS and RCS was difficult to evaluate because of the delay, in some cases, before the initial bone
marrow was obtained. It appeared to lie some- where between 40 and 63%. The importance of early and repeated bone marrow examina- tion in all cases of lymphosarcoma needs em- phasizing. Only if this is done will reliable data on the relationship and interconversion of lymphosarcoma and leukemia become avail- able.
T h e relationship between histologic type of lymphosarcoma and CNS disease in these children differs from the coincidence rate re- ported by Gendelman et al.8 in a mainly adult population. They found that 60% of their patients with RCS and 35y0 of those with transforming lymphosarcoma subsequently developed CNS leukemia. In the present study, only 14.3y0 of children with RCS de- veloped CNS disease, whereas 57.90/, of all those children with lymphocytic or lympho- blastic lymphosarcoma were affected. This may in part be explained by the higher rate of leukemic transformation (62.6’7,) in this latter group of patients, although it may re- sult from a different disease pattern between the adult and childhood varieties of RCS and LS.
T w o theories are held regarding the source of the leukemic cells in the CNS. Sullivan19 supports the concept of malignant initiation of the remnants of the embryonic mesenchy- ma1 hematopoietic cells in the choroid plexus or meninges by the leukemic “stimulus,” which promotes abnormal hematopoiesis in the bone marrow and reticuloendothelial sys- tem. An extracerebral source for the CNS leukemic cell is supported by the experimental work of Thomas et a1.22 using the mouse L1210 leukemia model. The present clinical data show a significant correlation of CNS disease with peripheral organ infiltration in the “leukemic” state. All cases but one in Group 2 underwent leukemic transformation before the onset of CNS disease. This is simi- lar to the findings of Gendelman, et a1.8 It would appear that bone marrow and blood stream invasion, as well as the stimulus to leukemic change, are necessary before CNS leukemia will develop. This will fit best with the theory of an extracerebral source of the leukemic cell in CNS leukemia.
Evans et al.7 consider that increasing sur- vival is the chief cause for the increased inci- dence of CNS leukemia in the past decade. However, from the present study, factors other than survival appear to influence the CNS
I380 CANCER May 1974 VOl. 33
Y n
n m
* Y
L U
0 Y
Y Y E Y
Y U
* I-
1 Y U
Y L
Y
c * 4 = z
z
lop
90
M
10
60
50
4
30
20
10
1 \ I 1 I I I 1 I
8 1 2 18 14 3a 3I 4 2
TIYE IN YONlWS FROM 01A6NOS11
FIG. 2. Graph showing cumulative percentage free of CNS malignant disease as calculated by life table analysis for Groups 1-4. In Group 2 no patient alive after 24 months was free of CNS disease. The vertical lines represent plus or minus one standard deviation from the mean. (See Fig. 1 for explanation of symbols.)
leukemia incidence. Thus, Group 4 with the longest median survival has the smallest per- centage with CNS disease, whereas Group 2 with the shortest survival time has the highest percentage affected. It is apparent that staging of childhood ALL and lymphosarcoma con- verting to leukemia is of prognostic value in terms of both survival and incidence of CNS disease. It is also apparent that the usual staging concept of a localized form of disease (Group 1) does not carry with it the best prognosis for survival, but does indicate a significantly lower incidence of CNS disease. Clinical nodal and organ enlargement may reflect the differing malignant invasive po- tential of the leukemic cells and/or variation
in the individual immune response to leu- kemic invasion.
Experience in the treatment of lymphomas, such as Hodgkin’s disease, has certainly led us to employ different modalities of therapy to patients with different stages of disease. The latter is also true of Wilms’ tumor. It would seem reasonable to suggest that children with ALL Group 2 should be treated in a different manner from the other groups. In order to support this concept, we must compare the re- sults of one type of treatment of ALL as it relates to the different groups of the disease.
We anticipate that this will be done in a prospective fashion and will therefore estab- lish the validity of this concept.
REFERENCES
1. Acute Leukemia Co-operative Group B: Treat- ment of adult leukemia with L. asparaginase (NSC- 109229). Cancer Chemother. Rep. 55:269-275, 1971.
2. Bailey, R. J.. Burgert, 0.. and Dahlin, D. C.: Malignant lymphoma in children. Pediatrics 28:985, 1961.
3. Charache, H.: Tumors in children-A report of 90 cases. N.Y. State J. Med. 54:1775, 1954.
4. Cutler, S. J., and Ederer, F.: Maximum utilization of the Life Table Method in analysing survival. J. Chron. Dis. 8599, 1958.
5. Dargeon, H. W.: Lymphosarcoma in childhood. Adv. Pediatr. 6:13, 1953.
6. Evans, A. E., and Craig, A. B.: Central nervous system involvement in children with acute leukemia. Cancer 17256, 1961.
7. Evans, A. E., Gilbert, E. S., and Zandstra, R.: The increasing incidence of central nwvous system leukemia in children. Cancer 26404, 1970.
8. Gendelman, S., Rizzo, F., and Mones, R. J.: Cen- tral nervous system complications of the leukemic conversion of the lymphomas. Cancer 24:676, 1969.
No. 5 STAGING OF ALL AND CNS DISEASE - Fitzpatrick et al. 1381 9. Gilbert, E. F., and Rice, E. C. Neurologic mani-
festations of leukemia. Pediatrics 19801, 1957. 10. Harclisty, R. M., and Norman, P. M.: Meningeal
leukemia. Arcti. Llis. Child. 42:441, 1967. 11. Hardisty, R. M., and Till, M. M.: Acute leu-
kemia 1959-1964-Factors influencing prognosis. Arch. Dis. Child. 43: 107, 1968.
12. Hunt, W. E., Bouroncle, B. A,, and Meagher, J. N.: Neurologic complications of leukemias and lymphomas. J. Neitrosurg. 16: 135, 1959.
13. Hyman, C. B., Bogle, J. M.. Brubaker, C. A,, Williams, K., and Hammond, D.: Central nervous system involvement by leukemia in children-I. Re- lationship to systemic leukemia and description of clinical and laboratory manifestations. Blood 25:1, 1965.
14. Jones, B., and Klingberg, W. G.: Lymphosar- coma in children. .7. Pediat. 63:15, 1963.
15. Nies, B. A., Thomas, L. B., and Freireich, E. J.: Meningeal leukemia-A followup study. Cancer 18:546, 1 965.
16. Pierce, M. I . : Lymphosarcoma and Hodgkin’s
disease in children. In Proceedings of the Fourth Na- tional Cancer Conference. Philadelphia, J. B. Lippin- cott Company, 1960; p. 559.
kemia in children. Pediatr. Clin. North A m . 9:425, 1962. 18. Rosenberg, S. A., Diamond, H. D., Datgeon,
H. W,. and Carver, L. F.: Lymphosarcoma in child- hood. N . Engl. J. Med. 259505, 1958.
19. Sullivan, M. P.: Leukemic infiltration of men- inges and spinal nerve roots. Pediatrics 3263, 1963.
childhood. Pedia t~ics 20:757, 1957.
coma of childhood. Pediatrics 29:589, 1962. 22. Thomas, L. B., Chirigos, M. A., Humphrey, S. R.,
and Goldin, A.: Development of meningeal leukemia (L1210) during treatment of subcutaneously innocu- lated mice with methotrexate. Cancer 17:352, 1964. 23. Ziegler, J. L., Bluming, A. Z., Morrow, R. H.,
Fass, L., and Carbone, P. P.: Central nervous system involvement in Burkitt’s lymphoma. Blood 36:718, 1970.
17. -’ . Neurologic complications in acute leu-
20. -. . Intracranial complications of leukemia in
21.--. . Leukemic transformation in lymphosar-


![[PPT]What is t,n,m staging and summary staging? Staging for... · Web viewWhat are we discussing? What is AJCC Staging Purpose of staging General rules for clinical and pathological](https://img.pdfslide.us/doc/110x75/5b1cc7cc7f8b9a8c5a8ba42e/pptwhat-is-tnm-staging-and-summary-staging-staging-for-web-viewwhat.jpg)