Embed Size (px)
DESCRIPTION
Objective: Up to today we remain a long way from identifying the most robust predictors of drop-out and (non-)response for treatment. To enable assigning patients to the right intensity of treatment, the Altrecht Academic Anxiety center (AAA) has developed a Checklist Staging and Profiling (CSP), based on consensus between clinicians and common sense. This exploratory study has investigated whether the CSP can differentiate between different disease stages in anxiety disorders and predict treatment outcome in anxiety patients, based on their stage of illness. Methods: The current study consisted of a retrospective study – using the electronic health records of the AAA – and a prospective study of two months duration. Both studies included anxiety patients of Altrecht (specialized mental health care), whose data on background variables and symptoms were collected. Multiple questionnaires were filled out at various moments. Results: The CSP has sufficient internal consistency, and differentiates accurately between the different stages of anxiety disorders. The CSP can predict the course of treatment in patients with anxiety disorders and also which patients will drop-out if no appropriate measures are taken. Discussion: With some adaptations, the CSP has a lot of potential. In future research, the improved version in Appendix F should be tested in clinical practice to further enhance the usefulness of the CSP. Further, we recommend to add items on patients’ belief in the treatment rationale, motivation for treatment and social support to the CSP and study whether this would enhance its predictability.Doelstelling: Tot op de dag van vandaag hebben we nog een lange weg te gaan voordat we de meest robuuste voorspellers kunnen identificeren van uitval en therapieresistentie. Om het mogelijk te maken patiënten de juiste intensiteit van behandeling toe te wijzen, heeft het Altrecht Academisch Angstcentrum (AAA) de Checklist Stagering en Profilering (CSP) ontwikkelt, gebaseerd op consensus tussen clinici en algemene kennis. Deze explorerende studie heeft onderzocht of de Checklist Stagering en Profilering (CSP) kan differentiëren tussen de verschillende ziektestadia in angststoornissen en behandeluitkomst bij angstpatiënten kan voorspellen, gebaseerd op hun ziektestadium. Methoden: Het huidige onderzoek bestond uit een retrospectief onderzoek – gebruikmakend van het elektronisch patiëntendossier van het AAA – en een prospectief onderzoek. Beide onderzoeken maakten gebruik van angstpatiënten binnen Altrecht (specialistische GGz), wiens data betreffende achtergrondvariabelen en symptomen waren verzameld. Er werden meerdere vragenlijsten ingevuld op verschillende momenten. Resultaten: De CSP heeft voldoende interne consistentie, en differentieert accuraat tussen de verschillende stadia van angststoornissen. De CSP kan de behandeluitkomst voorspellen in patiënten met angststoornissen, en ook welke patiënten zullen uitvallen indien er geen passende maatregelen worden genomen. Discussie: Met enkele aanpassingen heeft de CSP veel potentie. In toekomstig onderzoek zou de verbeterde versie in Appendix F getest moeten worden in de klinische praktijk om zo de bruikbaarheid van de CSP te verbeteren. Daarnaast raden wij aan om items over de overtuigingen van patiënten over de rationale van de behandeling, de behandelmotivatie en sociale steun toe te voegen aan de CSP en te onderzoeken of dit toegevoegde, voorspellende waarde heeft.
Citation preview

i
Staging and profiling in clinical practice:
To what extent do items on a checklist of staging
and profiling predict treatment course in anxiety
patients? An exploratory study.
Claire Kortenoeven-Chillaud, MSc., Tonnie Staring, PhD,
Daniëlle Cath, Dr. & Naomi T. Paauw, MSc.
July 24th 2015
Abstract Objective: Up to today we remain a long way from identifying the most robust predictors of
drop-out and (non-)response for treatment. To enable assigning patients to the right intensity of
treatment, the Altrecht Academic Anxiety center (AAA) has developed a Checklist Staging and
Profiling (CSP), based on consensus between clinicians and common sense. This exploratory
study has investigated whether the CSP can differentiate between different disease stages in
anxiety disorders and predict treatment outcome in anxiety patients, based on their stage of
illness. Methods: The current study consisted of a retrospective study – using the electronic
health records of the AAA – and a prospective study of two months duration. Both studies
included anxiety patients of Altrecht (specialized mental health care), whose data on
background variables and symptoms were collected. Multiple questionnaires were filled out at
various moments. Results: The CSP has sufficient internal consistency, and differentia tes
accurately between the different stages of anxiety disorders. The CSP can predict the course of
treatment in patients with anxiety disorders and also which patients will drop-out if no
appropriate measures are taken. Discussion: With some adaptations, the CSP has a lot of
potential. In future research, the improved version in Appendix F should be tested in clinica l
practice to further enhance the usefulness of the CSP. Further, we recommend to add items on
patients’ belief in the treatment rationale, motivation for treatment and social support to the
CSP and study whether this would enhance its predictability.

ii
Doelstelling: Tot op de dag van vandaag hebben we nog een lange weg te gaan voordat we de
meest robuuste voorspellers kunnen identificeren van uitval en therapieresistentie. Om het
mogelijk te maken patiënten de juiste intensiteit van behandeling toe te wijzen, heeft het
Altrecht Academisch Angstcentrum (AAA) de Checklist Stagering en Profilering (CSP)
ontwikkelt, gebaseerd op consensus tussen clinici en algemene kennis. Deze explorerende
studie heeft onderzocht of de Checklist Stagering en Profilering (CSP) kan differentiëren tussen
de verschillende ziektestadia in angststoornissen en behandeluitkomst bij angstpatiënten kan
voorspellen, gebaseerd op hun ziektestadium. Methoden: Het huidige onderzoek bestond uit
een retrospectief onderzoek – gebruikmakend van het elektronisch patiëntendossier van het
AAA – en een prospectief onderzoek. Beide onderzoeken maakten gebruik van angstpatiënten
binnen Altrecht (specialistische GGz), wiens data betreffende achtergrondvariabelen en
symptomen waren verzameld. Er werden meerdere vragenlijsten ingevuld op verschillende
momenten. Resultaten: De CSP heeft voldoende interne consistentie, en differentieert accuraat
tussen de verschillende stadia van angststoornissen. De CSP kan de behandeluitkomst
voorspellen in patiënten met angststoornissen, en ook welke patiënten zullen uitvallen indien
er geen passende maatregelen worden genomen. Discussie: Met enkele aanpassingen heeft de
CSP veel potentie. In toekomstig onderzoek zou de verbeterde versie in Appendix F getest
moeten worden in de klinische praktijk om zo de bruikbaarheid van de CSP te verbeteren.
Daarnaast raden wij aan om items over de overtuigingen van patiënten over de rationale van de
behandeling, de behandelmotivatie en sociale steun toe te voegen aan de CSP en te onderzoeken
of dit toegevoegde, voorspellende waarde heeft.

iii
Acknowledgements
I would like to thank both dr. Tonnie Staring and dr. Daniëlle Cath for their support and
guidance throughout the completion of my master research and thesis. It was quite an adventure,
full of obstacles, but in the end we made it. I would also like to thank Naomi Paauw for our
collaboration throughout this process. Particularly for helping me to collect the data. Further, I
would like to thank all members of the methodology & statistics help committee who assisted
me throughout this process, and also a special thanks to dr. Shahab Jolani who helped me with
the data imputation I’d never learned before and I couldn’t have done without him.

iv
Index Abstract.................................................................................................................................... i
Acknowledgements ............................................................................................................... iii
Index ......................................................................................................................................... iv
Preface ....................................................................................................................................... 1
Methods ..................................................................................................................................... 6
Design ..................................................................................................................................... 6
Material................................................................................................................................... 6
Participants ........................................................................................................................... 10
The retrospective study ..................................................................................................... 10
The prospective study........................................................................................................ 12
Procedure .............................................................................................................................. 13
The retrospective study ..................................................................................................... 13
The prospective study........................................................................................................ 14
Statistical analyses ................................................................................................................ 14
The retrospective study ..................................................................................................... 14
The prospective study........................................................................................................ 15
Results ..................................................................................................................................... 16
Psychometric aspects of the CSP ......................................................................................... 16
Descriptive statistics ............................................................................................................. 18
General results ...................................................................................................................... 19
Inductive statistics of the retrospective study (N = 150) ...................................................... 21
Hypothesis I....................................................................................................................... 21
Hypothesis II ..................................................................................................................... 22
Inductive statistics of the prospective study ......................................................................... 23
Hypothesis I....................................................................................................................... 23
Discussion ................................................................................................................................ 23
Literature ................................................................................................................................ 28
Appendix A1 – Original Checklist Staging and Profiling (CSP) in Dutch ............................ v
Appendix A2 – Original Checklist Staging and Profiling (CSP) in English....................... viii
Appendix B1 – Adjusted CSP (CSP-A) in Dutch ................................................................. xi
Appendix B2 – Adjusted CSP (CSP-A) in English............................................................. xiii
Appendix C – Background variables (prospective and retrospective study) ....................... xv
Appendix D – Remaining descriptives (N = 21, N = 129 and N = 150) ........................... xviii
Appendix E – Treatment and research drop-out.................................................................. xxi
Appendix F1 – Improved CSP for future research (CSP-A2) in Dutch ............................. xxii
Appendix F2 – Improved CSP for future research (CSP-A2) in English.......................... xxiv

1
Preface
Anxiety disorders are common, often disabling, and costly in terms of personal suffering and
demands on the health care system (Tolin, Gilliam & Dufresne, 2010). With an average
prevalence of 10.8% in the total population, anxiety disorders are the most common disorders
amongst adults according to the World Mental Health surveys of the World Health
Organization, a cross-sectional study (2001-2009) of a representative sample of adults in 24
countries worldwide (Wang, et al., 2011). According to NEMESIS-2 (Netherlands Mental
Health Survey and Incidence Study-2) of the Trimbos Institute (a national Dutch knowledge
Institute of mental health care) the lifetime prevalence of anxiety disorder in The Netherlands
is 19.6% and the one-year incidence was 10.1% in 2009 (De Graaf, Ten Have & Van
Dorsselaer, 2010). A meta-analysis of 41 prevalence and 5 incidence studies performed by
Somers, Goldner, Waraich and Hsu (2006) showed similar figures, with pooled 1-year and
lifetime prevalence rates for total anxiety disorders of 10.6% and 16.6% respectively. Although
an insufficient number of incidence studies were available to clarify details concerning the onset
of anxiety symptoms worldwide, Kessler, Ruscio, Shear and Wittchen (2009) showed in their
review that anxiety disorders typically begin early. Most specific phobias have their onset in
childhood, with the vast majority of lifetime cases having onsets by the age of 18. Social phobia
and obsessive-compulsive disorder have their onset in adolescence or early adulthood, with the
vast majority of lifetime cases beginning by their twenties. Panic disorder, agoraphobia and
generalized anxiety disorder have a more dispersed onset distribution, with most of lifet ime
cases beginning in their twenties. Posttraumatic stress disorder is generally found to have the
latest and most variable onset distribution, presumably reflecting the fact that trauma exposure
can occur at any time in the course of life. It is noteworthy that despite their generally early age
of onset, first treatment of anxiety disorders usually does not occur until adulthood, often more
than a decade after the onset of the disorder (Christiana et al. 2000).
Anxiety disorders are defined by abnormal fear, in which the fear gives rise to sustained
subjective distress or impedes social functioning. There are several types of anxiety disorders.
The current study follows the internationally accepted classification of anxiety disorders
according to the DSM-IV-TR, which differentiates panic disorder (sudden and repeated feelings
of terror with physical symptoms like sweating and heartbeats), agoraphobia (fear of any
situation where escaping is difficult, along with avoidance and safety behaviors), specific
phobia (intense and unreasonable fear of a specific object or situation), social anxiety disorder
2
(persistent overwhelming worry and self-consciousness about everyday social situations),
obsessive-compulsive disorder (intrusive thoughts that cause unreasonable fears and repetitive
behaviors aimed at reducing the associated anxiety), posttraumatic stress disorder (recurring,
frightening thoughts or memories of a traumatic event, including emotionally numbness,
nightmares and physiological fear reactions) and generalized anxiety disorder (excessive,
unrealistic worry and tension, even if there is nothing to provoke the anxiety, that causes
physical stress symptoms; American Psychiatric Association, 2001).
The ESEMeD study (European Study of the Epidemiology of Mental Disorders), a
cross-sectional study (2001-2003) of a representative sample of adults in The Netherlands,
Belgium, Germany, France, Italy and Spain, shows that the overall proportion of adequate
treatment for anxiety disorders in Europe was on average 54.5% for the general mental care and
specialized mental care sectors together. Treatment adequacy for both anxiety and depressive
disorders in the general mental care sector was on average 23.3% and in the specialized mental
care sector 57.4%, which shows that patients often don’t get the help they need (Fernández, et
al., 2007). Another study shows the same results for The Netherlands: in moderate to severe
anxiety disorders, 44% of the subjects were not treated sufficiently with medication or
psychological treatment. Treatment inadequacy was more prominent in general health care
(60%) than in specialized health care (30%; Bet, et al., 2013). The result is that they stay in
treatment much longer than expected, they drop-out halfway or relapse afterwards. Several
studies reported dropout rates from different types of anxiety treatment varying up to 88%, with
the vast majority being in the 15-30% range (Høifødt, Strøm, Kolstrup, Eisemann & Waterloo,
2011; Santana & Fontenelle, 2011). Meta-analyses of anxiety disorders have reported dropout
rates in the range of 9–21% for CBT and 18–30% for SRIs (Taylor, Abramowitzb & McKay,
2012). One of the factors that are assumed to contribute to this lack of treatment success in
patients is that patients are not adequately allocated to the treatment modalities and intens ity
they need. Can we decrease drop-out and relapse rates by allocating patients to the adequate
treatment intensity at an early stage of treatment? And can we predict which patients will react
well on an anxiety treatment and which patients will dropout, and subsequently design
alternatives for the potential drop-outs at an early phase of treatment allocation?
One of the assumptions we make is that the longer and more severely affected patients
are, the more intensive the treatment they need. We expect that the stage of the anxiety disorder
– that includes severity, duration and the like – and the profile of the patient’s characteristics –
including age, GAF score and the like – at the start of treatment can predict the course of

3
treatment. Van Balkom and colleagues (2012) were the first in the Netherlands to propose a
staging model for patients with anxiety disorders. In this article we will reserve the term
'staging' to classify differences in severity of anxiety disorders into different stages. Figure 1
shows this model, which is subdivided into four stages, either with favorable and unfavorab le
courses. The first stage is the least severe stage and the fourth stage is the most severe one.
Figure 1. The staging model of Van Balkom and colleagues (2012)

4
Staging is important for clinical practice; when we can predict what patients need, how
they will respond to treatment and which patients will profit from more intensive as opposed to
less intensive treatment, we can reduce treatment duration and drop-out. This would not only
be great for the patients themselves, but also for the costs of mental health care. Van Balkom
and colleagues (2012) explain that clinicians generally base their decisions for treatment on the
individual characteristics of the patient and his anxiety disorder, but they don’t do it based on
scientific insights. The Dutch guideline Anxiety Disorders, existing since 2003, gives treatment
guidelines based on severity of the disorder and the effect of previous treatments, without a
proper scientific foundation as well (Van Balkom, et al., 2013). Checklists on staging are
currently not available, but staging of patients is important to decide on intensity of treatment
and, accordingly, to decide whether a patient should be treated in basic or in specialized mental
health care. Therefore, based on a consensus meeting by clinicians from the Altrecht Academic
Anxiety (AAA) outpatient clinics a checklist was designed: the Checklist Staging and Profiling
(CSP1). This checklist has the aim to decide in a more rational way on whether patients should
receive specialized treatment, and on treatment intensity. As the AAA encompasses a
specialized treatment center aiming to treat treatment resistant patients, the assumption at our
department was that such patients can mostly be treated adequately, on the premise that this
encompasses an intensive and specialized treatment that targets their symptoms rather than
presumed underlying processes. However, we are in need of an instrument that is able to assess
and detect those factors that contribute to assigning to the adequate treatment and predict
whether a treatment is successful. If the CSP is able to accurately determine the stage of an
anxiety disorder, patients will get the treatment they need and recover sooner from their illness.
But how can we predict which patients will need a more intensive treatment? Which factors
affect the course of treatment?
The CSP contains 13 items that include variables that are judged by practitioners to be
clinically relevant for predicting the course of treatment. Further, most items are supported by
research findings on treatment refractoriness. To summarize, items 2, 3 and 11 reflect number
of co-morbid conditions (A), items 4, 5, 6 and 9 reflect illness severity (B), item 7 age (C), item
8 illness duration (D), items 10a and 10c previous treatments (E) and items 12 and 13 level of
premorbid functioning, including level of education (F). Illness severity (B) and the number of
symptoms, including comorbid disorders (A), have proven to be predictors of non-response to
1 See Table 1 and Appendix A for the items of the CSP.
5
treatment (Slaap, Van Vliet, Westenberg & Den Boer, 1996; Taylor, Abramowitz & McKay,
2012; Mululo, Bezerra de Menezes, Paula & Fontenelle, 2012). White and colleagues (2010)
found that older age (C) predicted higher odds of completing treatment in panic disorder. With
respect to illness duration, it has been found that a duration (D) of an untreated panic disorder
longer than one year was linked to more frequent comorbidity with major depressive disorder
(Altamura, Santini, Salvadori and Mundo, 2005), reduced response to antidepressants and
worse long-term outcome (Altamura, et al., 2008; as cited in Altamura, Buoli, Albano &
Dell’Osso, 2010). The number of previous treatments and their effect (E) also seem clinica l ly
important, but have not been examined as a relevant treatment outcome predictor before (Van
Balkom, et al., 2012). Furthermore, there are some conflicting findings about the role of
education (F) as a predictor for treatment outcome. For example, McLean and colleagues (2001)
found that treatment completers were relatively well educated: most had at least some
postsecondary education. However, Ebert and colleagues (2013) found that treatment is
especially effective for participants with low education levels. So it’s interesting to investiga te
if education level is a predictor for treatment outcome. Smith, Van Ryzin, Fowler and Handler
(2014) found that patients with lower premorbid Global Assessment Functioning (GAF) scores
showed little to no improvement. This literature supports the relevance of these variables,
included in the CSP, to predict the stage of illness that the patient is in. Whether the clinicians-
constructed CSP meets these goals forms the subject of the current thesis.
We aimed to investigate the relative contribution of the items of the CSP to the correct
prediction of the illness stage of a patient’s anxiety disorder. Prior to investigating this, we
studied the association between the categories of the CSP and illness severity and treatment
refractoriness. This way, we checked the validity of these categories to indicate stage of the
illness, that is: uncomplicated v/s complicated disorder and a favorable v/s unfavorab le
prognosis. It was expected that (1) the CSP predicts the course of treatment in patients with
anxiety disorders, and that (2) the CSP also predicts drop-out in patients with anxiety disorders,
in de following way: patients with high scores on the CSP (e.g. the third and fourth category)
would be less likely to make progress in their treatment and be more likely to drop out, because
the first category would contain the patients with the least illness severity and the fourth
category would contain patients with the highest illness severity.
6
Methods
Design
The current study consisted of a retrospective (retro) and a prospective study (pro). An attempt
was made to replicate the results from the retrospective study in the prospective study. In both
studies the predictive value of the CSP for treatment outcome, that is reduction in anxiety, was
studied. In these primary analyses the score on the CSP was the independent variable, both the
continuous (0-35 points) as the categorical variable (four categories), and the scores on the
anxiety measures were the dependent variables. The dependent variables consisted of six
(sub)scales: OQ45 total score, BSI total score, BSI depressive subscale, BSI anxiety subscale,
BSI phobic anxiety subscale and BDI total score. The CSP was measured only once for each
participant, at the beginning of their therapy. The dependent variables were measured at least
two times for each participant, comparing baseline-measurement (T0) with a measurement after
two months treatment (T1) in the prospective study, and also with a post-treatment measurement
(T2) and follow-up measurement (T3) in the retrospective study.
Material
Both studies included the following questionnaires:
Checklist Staging and Profiling
The version that we just of the Checklist Staging and Profiling (CSP; dr. D. Cath, head of the
AAA, personal correspondence, September 24th 2013) consisted of 13 items about the patient
and his anxiety disorder (Table 1, next page) and the total score ranged from 0 to 35. Scores on
the CSP yield four categories which are somewhat similar to the stages proposed by Van
Balkom and colleagues (2012): uncomplicated anxiety disorder with favorable prognosis (0-14
points, first category), uncomplicated anxiety disorder with unfavorable prognosis (15-22
points, second category), complicated anxiety disorder with favorable prognosis (23-28 points,
third category) and complicated anxiety disorder with unfavorable prognosis (28-35 points,
fourth category). Patients in the first category are considered to be adequately treated within the
context of general mental health care, those in the second category in specialized (secondary)
mental health care, the third category is regarded as needing a more intensive outpatient
treatment in specialized (secondary or tertiary/topclinical) mental health care and the fourth
category should get a highly intensive treatment or support according to a handicap model.

7
Table 1
Items of the Checklist Staging and Profiling (CSP)
Items Score
1) Are there multiple anxiety disorders? 0-1
2) Is there a comorbid depression / dysthymia? 0 or 2
3) What is the severity of the (main) anxiety disorder? 0-2
4) In how many life areas does the (main) disorder affects daily functioning? 0-3
5) In how may situation does the patient use avoidance behavior? 0-3
6) Age 0-4
7) Duration of symptoms or complaints 0-4
8) Course of the (main) disorder: fluctuating or chronic? 0-3
9) How many previous treatments (of every kind)? 0-2
10) Effect of previous treatment (considered as a whole)? 0-2
11) Are there other comorbidities (beside anxiety disorders and depression)? 0-3
12) GAF score at premorbid functioning or intake 0-3
13) Highest education completed 0-3
In the prospective study, the master students interviewed the professionals (mostly
psychologists or cognitive behavioral therapists) involved in the treatment of patients, with the
aid of the CSP. In the retrospective study, all the answers to the CSP items were derived from
the electronic health records of the AAA. The item about the severity of the anxiety disorder
(item 4) was derived from the total score of the Anxiety Sensitivity Index (ASI-3; Taylor et al.,
2007), derived at baseline as follows: 0-15 points for a mild (0), 16-30 points for a moderate
(1) and 31-72 points for a severe (2) anxiety disorder. This questionnaire was solely used to
calculate the CSP item about the severity of the anxiety disorder and to calculate it’s correlation
with the CSP (for missing data and validity). The ASI-3 (Taylor et al., 2007) is an 18-item
version of the original ASI (Reiss et al., 1986) that measures beliefs about the feared
consequences of symptoms associated with anxious arousal. In addition, seven items aren’t a
score, but provide important descriptive information to the practitioner: the nature of comorbid
anxiety disorders, the nature of life areas affected by the main diagnosis, the nature of avoided
situations, the quality and character of previous treatments and the nature of comorbid disorders
other than anxiety or depression .
Anxiety Sensitivity Index
This questionnaire was solely used to calculate the CSP item about the severity of the anxiety
disorder (with the total scale) and to calculate it’s correlation with the CSP (with all scales).

8
The Anxiety Sensitivity Index-3 (ASI-3; Taylor et al., 2007) is an 18-item version of the
original ASI (Reiss et al., 1986) that measures beliefs about the feared consequences of
symptoms associated with anxious arousal. Patients indicated their agreement with each item
from “very little” (coded as 0) to “very much” (coded as 4). Total scores range from 0 to 72.
The ASI-3 contains three empirically established subscales relating to fears of social concerns
(e.g., “It is important for me not to appear nervous”), physical concerns (e.g., “It scares me
when my heart beats rapidly”), and cognitive concerns (e.g., “It scares me when I am unable to
keep my mind on a task”). The measure possesses excellent psychometric properties,
performing well on various indices of reliability and validity (Taylor et al., 2007). Internal
consistency estimates for the subscales Social, Physical and Cognitive range from adequate to
good (R² = .80, .88 and .90, respectively). Reliability for the total score is excellent (R² = .93;
Nunnally & Bernstein, 1994).
Outcome Questionnaire 45
The Outcome Questionnaire 45 (OQ45; Wells, Burlingame, Lambert, Hoag & Hope, 1996)
consists of 45 items that measures general emotional and lifestyle stressors (such as depression,
anxiety, stress, substance abuse and suicidality), satisfaction with relationships (marital, family
and friendships), work relations and leisure activities over the past week. Patients indicated the
frequency of each item from “never” (coded as 0) to “almost always” (coded as 4). Total scores
range from 0 to 180. The OQ45 contains three empirically established subscales assessing
symptom distress (e.g., “I feel anxious”), interpersonal relations (e.g., “I feel lonely”), and
social role (e.g., “I am under stress at work/school”). Scores on the complete OQ45 scale have
been reported to be reliable and valid, distinguishing well between clinical and non-clinica l
subjects (Umphress, Lambert, Smart & Barlow, 1997). Internal consistency and test-retest
reliability estimates range from .70 to .93 and .78 to .84, respectively (Wells et al., 1996),
showing good to excellent psychometric properties (Nunnally & Bernstein, 1994).
Brief Symptom Inventory
The Brief Symptom Inventory (BSI; Derogatis, 1975) consists of 53 items that measures to
what extent the patient was suffering of mental and/or physical symptoms over the past period
of time (e.g., “During the past week, how much did you suffer from nervousness or
shakiness?”). Patients indicated the frequency of each item from “never” (coded as 0) to “very
much” (coded as 4). Total scores range from 0 to 212. The BSI contains nine empirica l ly
9
established subscales assessing somatic complaints, cognitive problems, interpersona l
sensitivity, depressive mood, anxiety, hostility, phobic anxiety, paranoid thoughts, and
psychoticism. The BSI has been reported to be sufficiently reliable and valid (Beurs & Zitman,
2006).
Beck Depression Inventory
The Beck Depression Inventory (BDI; Beck, Ward, Mendelson, Mock, & Erbaugh, 1961)
consists of 21 items that measures the severity of a depressive disorder over the past two weeks
(e.g., “I don’t feel gloomy / I feel gloomy a lot of times / I feel gloomy all the time / I feel so
gloomy or unhappy that I can’t bare it anymore”). Patients indicated the severity of each item
from “never” (coded as 0) to “very much” (coded as 3). Total scores range from 0 to 63. Studies
reviewed by Steer, Beck, and Garrison (1986) have supported internal consistencies in the .90s
and high positive correlations with clinical ratings of depression, showing excellent
psychometric properties (Nunnally & Bernstein, 1994).
Complementary questionnaire used in the prospective study only:
Beck Anxiety Inventory
This questionnaire was solely used to calculate it’s correlation with the CSP (with all scales).
The Beck Anxiety Inventory (BAI; Beck, Epstein, Brown & Steer, 1988) consists of 21 items
that measures the severity of, especially somatic symptoms of, anxiety. Patients indicated their
agreement with each item from “not at all” (coded as 0) to “severely” (coded as 3). Total scores
range from 0 to 63. The BAI contains two empirically established subscales relating to the
somatic symptoms of anxiety (e.g., “Dizzy or light-headed”) and the subjective characterist ics
of anxiety (e.g., “Afraid that the worst happens”). The BAI scale has a high internal consistency
(α = .92) and item-total correlations ranging from .30 to .71. The test-retest reliability for the
total score is .75, showing good psychometric properties (Beck et al., 1988; Nunnally &
Bernstein, 1994).

10
Participants
The retrospective study
All participants were patients of the AAA. One hundred and fifty patients were randomly
selected from a total of 737 patients, based on the following criteria: patients had had treatment
between 2008 and 2013, were treated for an anxiety disorder and had had at least one
measurement, at baseline. As part of the standard procedure in their treatment, all participants
had had multiple psychodiagnostic measurements to evaluate their symptoms. Of these 150
patients 45 patients just had had the baseline measurement, 50 patients had had two
measurements, 49 patients had had three measurements and 6 patients had had all four
measurements. Two-thirds of the patients that have taken part in this study were women
(68.0%), and men and women did not differ in age (Table 2). The vast majority (ca. 70-80%)
of patients was native or had The Netherlands as their country of origin.
Table 2
Number, Age and Country of Origin broken down by Gender (Retrospective Study)
Men Women Total
N 48 102 150
Min. – max. age 22 – 56 18 – 57 18 – 57
Age M (SD) 35.17 (9.78) 32.08 (9.26) 33.07 (9.50)
Native 38 (79.2) 70 (68.6) 108 (72.0)
First generation immigrant 8 (16.7) 18 (17.6) 26 (17.3)
Second generation immigrant 2 (4.2) 14 (13.7) 16 (10.7)
The Netherlands 40 (83.3) 82 (80.4) 122 (81.3)
Turkey 0 (0.0) 4 (3.9) 4 (2.7)
Morocco 3 (6.3) 10 (9.8) 13 (8.7)
Surinam 1 (2.1) 1 (1.0) 2 (1.3)
The Dutch Antilles 0 (0.0) 1 (1.0) 1 (0.7)
Other country 4 (8.3) 4 (3.9) 8 (5.3)
Fifty-three patients (35.3%) scored in the first category, 65 patients (43.3%) in the
second category, 28 (18.7%) in the third category and 4 patients (2.7%) in the fourth category
of the CSP. Most patients had only one anxiety disorder (56.7%) and were suffering from panic
disorder with agoraphobia (26.0%), social anxiety disorder (23.3%) or obsessive-compuls ive
disorder (22.0%, Table 3). In those with comorbid anxiety disorders specific phobia (12.7%),
generalized anxiety disorder (11.3%) and social anxiety disorder (10.0%) were the most

11
common additional anxiety disorders (see Appendix C, Table 16). Sixty percent of patients had
at least one non-anxiety comorbid disorder (see Appendix C, Table 18). Of those, major
depressive disorder or dysthymia was the most common additional comorbid disorder (46.0%,
Table 3). See Table 4 for further details with respect to work and family status.
Table 3
CSP Category, Main Diagnosis, Comorbid Anxiety and Depressive Disorders broken down by
Gender (Retrospective Study)
Men N (%) Women N (%) Total N (%)
First CSP category 18 (37.5) 35 (34.3) 53 (35.3)
Second CSP category 17 (35.4) 48 (47.1) 65 (43.3)
Third CSP category 13 (27.1) 15 (14.7) 28 (18.7)
Fourth CSP category 0 (0.0) 4 (3.9) 4 (2.7)
Panic disorder (without agoraphobia) 2 (4.2) 0 (0.0) 2 (1.3)
Panic disorder with agoraphobia 14 (29.2) 25 (24.5) 39 (26.0)
Social anxiety disorder (social phobia) 12 (25.0) 23 (22.5) 35 (23.3)
Obsessive-compulsive disorder 12 (25.0) 21 (20.6) 33 (22.0)
Posttraumatic stress disorder 3 (6.3) 17 (16.7) 20 (13.3)
Generalized anxiety disorder 3 (6.3) 12 (11.8) 15 (10.0)
Anxiety disorder NAO 2 (4.2) 4 (3.9) 6 (4.0)
One anxiety disorder 36 (75.0) 49 (48.0) 85 (56.7)
Two anxiety disorders 10 (20.8) 40 (39.2) 50 (33.3)
Three anxiety disorders 2 (4.2) 12 (11.8) 14 (9.3)
Four anxiety disorders 0 (0.0) 1 (1.0) 1 (0.7)
Major depressive disorder or dysthymia 21 (43.8) 48 (47.1) 69 (46.0)
Table 4
Work and Family Status broken down by Gender (Retrospective Study)
Men N (%) Women N (%) Total N (%)
Working 35 (72.9) 52 (51.0) 87 (58.0)
Studying 2 (4.2) 16 (15.7) 18 (12.0)
Working and studying 3 (6.2) 4 (3.9) 7 (4.7)
Neither working nor studying 8 (16.7) 30 (29.4) 38 (25.3)
Living alone 14 (29.2) 28 (27.5) 42 (28.0)
Living with partner 14 (29.2) 26 (25.5) 40 (26.7)
Living (alone) with children 0 (0.0) 12 (11.8) 12 (8.0)
Living with partner and children 14 (29.2) 19 (18.6) 33 (22.0)
Living with parents/guardians 3 (6.3) 10 (9.8) 13 (8.7)
Living with other person 3 (6.3) 7 (6.9) 10 (6.7)
12
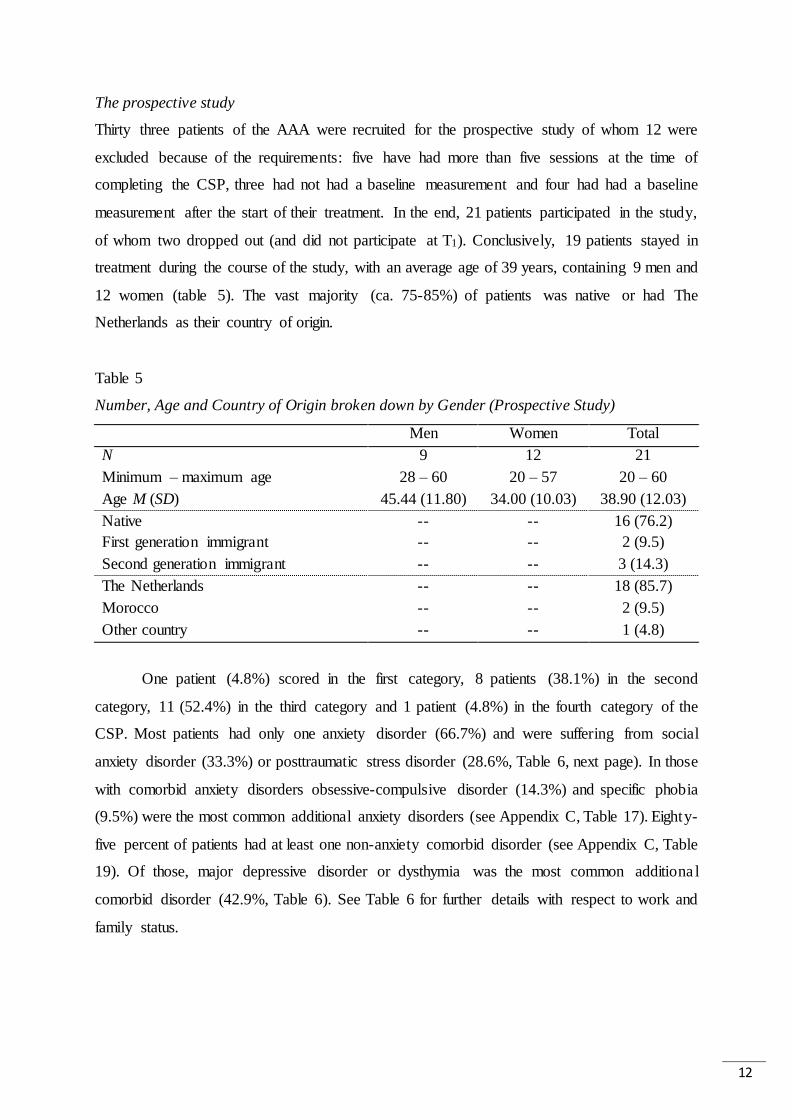
The prospective study
Thirty three patients of the AAA were recruited for the prospective study of whom 12 were
excluded because of the requirements: five have had more than five sessions at the time of
completing the CSP, three had not had a baseline measurement and four had had a baseline
measurement after the start of their treatment. In the end, 21 patients participated in the study,
of whom two dropped out (and did not participate at T1). Conclusively, 19 patients stayed in
treatment during the course of the study, with an average age of 39 years, containing 9 men and
12 women (table 5). The vast majority (ca. 75-85%) of patients was native or had The
Netherlands as their country of origin.
Table 5
Number, Age and Country of Origin broken down by Gender (Prospective Study)
Men Women Total
N 9 12 21
Minimum – maximum age 28 – 60 20 – 57 20 – 60
Age M (SD) 45.44 (11.80) 34.00 (10.03) 38.90 (12.03)
Native -- -- 16 (76.2)
First generation immigrant -- -- 2 (9.5)
Second generation immigrant -- -- 3 (14.3)
The Netherlands -- -- 18 (85.7)
Morocco -- -- 2 (9.5)
Other country -- -- 1 (4.8)
One patient (4.8%) scored in the first category, 8 patients (38.1%) in the second
category, 11 (52.4%) in the third category and 1 patient (4.8%) in the fourth category of the
CSP. Most patients had only one anxiety disorder (66.7%) and were suffering from social
anxiety disorder (33.3%) or posttraumatic stress disorder (28.6%, Table 6, next page). In those
with comorbid anxiety disorders obsessive-compulsive disorder (14.3%) and specific phobia
(9.5%) were the most common additional anxiety disorders (see Appendix C, Table 17). Eighty-
five percent of patients had at least one non-anxiety comorbid disorder (see Appendix C, Table
19). Of those, major depressive disorder or dysthymia was the most common additiona l
comorbid disorder (42.9%, Table 6). See Table 6 for further details with respect to work and
family status.

13
Table 6
Main Diagnosis, Comorbid Anxiety and Depressive Disorders, Work and Family Status
(Prospective Study)
Total N (%)
Panic disorder with agoraphobia 1 (4.8)
Social anxiety disorder (social phobia) 7 (33.3)
Obsessive-compulsive disorder 4 (19.0)
Posttraumatic stress disorder 6 (28.6)
Generalized anxiety disorder 2 (9.5)
Anxiety disorder NAO 1 (4.8)
One anxiety disorder 14 (66.7)
Two anxiety disorders 6 (28.6)
Three anxiety disorders 1 (4.8)
Major depressive disorder or dysthymia 9 (42.9)
Working 10 (47.6)
Studying 4 (19.0)
Neither working nor studying 7 (33.3)
Living alone 2 (9.5)
Living with partner 9 (42.9)
Living (alone) with children 4 (19.0)
Living with partner and children 6 (28.6)
Procedure
The retrospective study
The CSP has been filled in by the master students (Claire Kortenoeven-Chillaud and Naomi
Paauw), using all available information from patients electronic health records, and – when
possible – information obtained retrospectively from the treating professionals. This study has
used the data of 150 patients who had entered the AAA for treatment in the period between
December 2007 and December 2012. As part of the standard procedure in their treatment, a ll
participants had had psychodiagnostic measurements to evaluate their symptoms at T0, using
self-reports (OQ45, BSI, BDI, ASI and BAI) and SCID-I interviews to assess diagnoses. Of
these 150 patients 28 patients filled out T1, with on average eight months (M = 242.1, SD =
105.1) between T0 and T1; 89 patients filled out T2, with on average eleven months (M = 349.8,
SD = 195.6) between T0 and T2; and 50 patients filled out T3, with on average one and a half
year (M = 553.6, SD = 187.4) between T0 and T3.

14
The prospective study
This study was executed between October 2013 and February 2014. Seventeen health care
professionals (mostly psychologists) were interviewed by the master students who filled out the
CSP (on paper) concerning their anxiety patients. As part of the standard procedure in their
treatment, all participants had had psychodiagnostic measurements to evaluate their symptoms
at T0, using self-reports (OQ45, BSI, BDI, ASI and BAI) and SCID-I interviews to assess
diagnoses. Patients had had a maximum of 5 treatment sessions at the moment of filling in the
CPS and T0. The master students made sure that all patients (that didn’t drop out) filled in those
same psychodiagnostic measurements at T1, with on average three months (M = 88.7, SD =
45.8) between the first treatment session and the T1 and four months (M = 121.7, SD = 45.4)
between the T0 and the T1. Up to the T1 patients had between one and seven treatment sessions
(M = 4).
Statistical analyses
The retrospective study
IBM SPSS Statistics 21 was used for all analyses. From the one hundred and fifty patients, there
were 21 patients for which we were unable to retrospectively fill out some CSP items on basis
of their patient records because of missing data. Therefore CSP scores were calculated by using
multiple data imputation. There were 37 variables used in this procedure, with 5 imputations,
100 parameter draws and 500 case draws: 4 CSP variables with missing data (effect of previous
treatment, GAF score at premorbid functioning or intake, duration of symptoms or complaints,
and course of the main disorder), 9 remaining CSP variables and 24 baseline or background
variables that correlated significantly with those 4 CSP variables. A correlation matrix indicated
that those 33 variables correlated significantly with those 4 missing CSP items, and could
therefore be used to make the most accurate estimation of the missing data. This created a
dataset of N = 129, in which all participants with missing values were removed, and a dataset
of N = 150, in which all the missing values were substituted with imputed data. As shown in
Appendix D, Tables 20 till 22, the data were randomly missing, and we therefore decided to
only use the imputed data set in subsequent analyses.
To investigate the internal consistency of the CSP, Cronbach’s alpha’s were calculated
on the items of the CSP. Further, to explore whether the items of the CSP were able to assign
the anxiety disordered patients to the four categories of the CSP, one-way ANOVA’s and a

15
validity correlation matrix were used. For the ANOVA’s the categorical variable of the CSP
was the independent variable, and the thirteen CSP items were the dependent variables. The
validity of the CSP was calculated by means of a pooled correlation matrix in which the total
scale of the adjusted CSP2 was compared with the total scales and subscales of all the
questionnaires included in the test battery at T0.
Because of otherwise small sample sizes (and violations of assumptions), Kruskal-
Wallis tests were performed, with the categories of the CSP as independent variable and the T0-
T3 difference scores of the dependent variables as dependent variables, to analyze whether the
category of the CSP predicts treatment progress. To investigate whether drop-out was predicted
by the total score or the categories of the CSP, a binary logistic regression analysis was
performed with the enter method and the non-drop-outs as reference category, with drop-out
(yes/no) as dependent variable and separately the total score or the categories of the CSP as
independent variable. The number of treatment drop-outs are calculated and the reasons why
patients ended their treatment were investigated.
Prior to interpreting the results of the binary logistic regression analysis, several
assumptions were evaluated in the retrospective study: both dependent and independent
variables were normally distributed; the assumptions of normality, linearity and
homoscedasticity of residuals were met; there were no univariate outliers or outliers in the XY-
space; and multicollinearity would not interfere with our ability to interpret the outcome of the
logistic regression analysis. Prior to interpreting the results of the ANOVA’s, it was concluded
that the assumptions of normality and normality of difference scores were not violated. The
assumption of homogeneity of variance was violated, but this is logical as the three categories
of the CSP should differ significantly.
The prospective study
IBM SPSS Statistics 21 was used for all analyses. Because of otherwise small sample sizes (and
violations of assumptions), Kruskal-Wallis tests were performed, with the categories of the CSP
as independent variable and the T0-T3 difference scores of the dependent variables as dependent
variables, to analyze whether the category of the CSP predicts treatment progress. Because of
the small sample size of the prospective study (N = 21), the small amount of drop-out (N = 2)
and the selective drop-out (only patients from the second category of the CSP), a binary logist ic
2 See ‘Psychometric aspects of the CSP’ in the Results .

16
regression analysis couldn’t be performed to investigate whether drop-out was predicted by the
total score or the categories of the CSP.
Prior to interpreting the results of the binary logistic regression analysis, several
assumptions were evaluated in the retrospective study: both dependent and independent
variables were normally distributed; the assumptions of normality, linearity and
homoscedasticity of residuals were met; there were no univariate outliers or outliers in the XY-
space; and multicollinearity would not interfere with our ability to interpret the outcome of the
logistic regression analysis. Prior to interpreting the results of the ANOVA’s, it was concluded
that the assumptions of normality and normality of difference scores were not violated. The
assumption of homogeneity of variance was violated, but this is logical as the three categories
of the CSP should differ significantly.
Results
Psychometric aspects of the CSP
With respect to the CSP we looked at Cronbach’s alpha using the data of the 5th imputat ion,
because Cronbach’s alpha’s of all imputations were almost identical. The checklist as a whole
had an alpha of .566, which indicated a low internal consistency and was therefore insuffic ient
for research on group level (Evers, 2001). The column 'Cronbach’s Alfa if Item Deleted' showed
that the value of alpha could be increased by removing the items ‘age’ and ‘level of education’
respectively. After those removals, the CSP would exist of eleven items with an interna l
consistency that’s sufficient for research on group level (α = .638, M = 13.56, SD = 4.67; Evers,
2001). See Table 11 for more details. The interpretation of the scores was adapted accordingly :
total scores of the CSP subsequently ranged from 0 to 28, the first category ranged from 0 to
11 points, the second category from 12 to 17 points, the third category from 18 to 22 points and
the fourth category from 23 to 28 points. See Appendix B1 (Dutch) and B2 (English) for the
adjusted version of the CSP, that was used for all subsequent analyses.
Table 11
The Internal Consistency of CSP (in Cronbach's Alpha)
Removed item Cronbach's Alphaa
Alpha with every item included .566
Age .629
Level of education .638 aCronbach’s alpha for the 5th imputation.
17
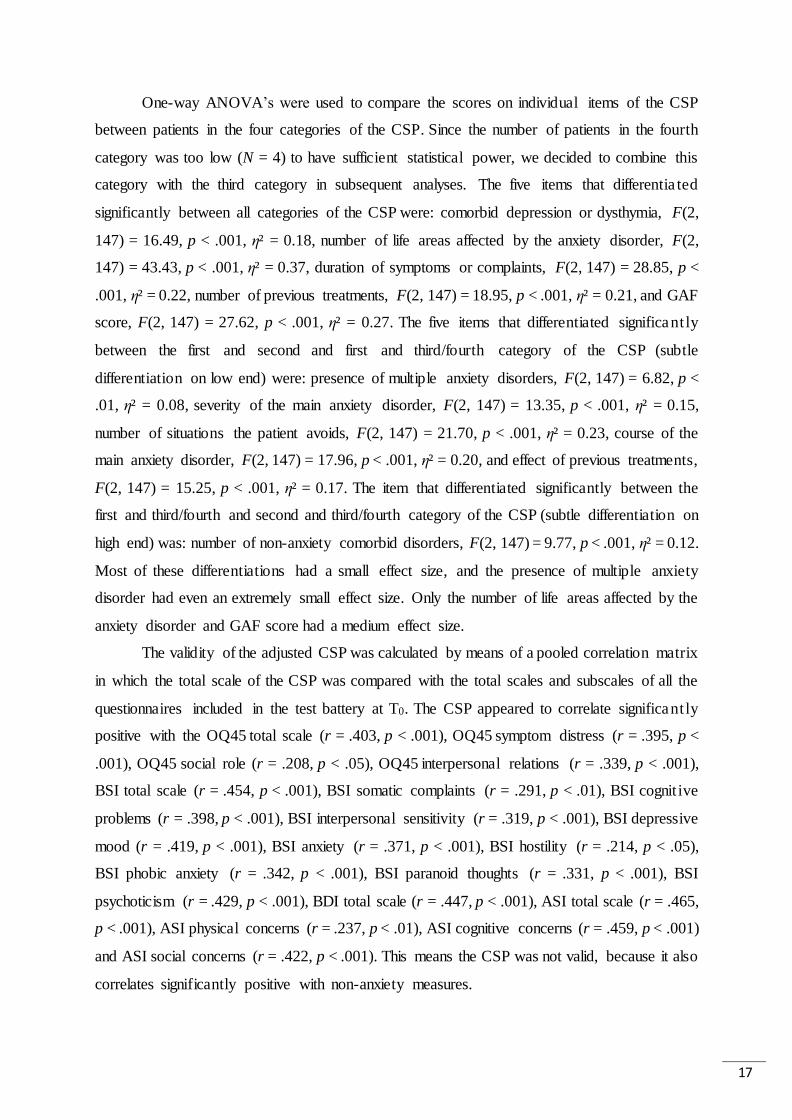
One-way ANOVA’s were used to compare the scores on individual items of the CSP
between patients in the four categories of the CSP. Since the number of patients in the fourth
category was too low (N = 4) to have sufficient statistical power, we decided to combine this
category with the third category in subsequent analyses. The five items that differentia ted
significantly between all categories of the CSP were: comorbid depression or dysthymia, F(2,
147) = 16.49, p < .001, η² = 0.18, number of life areas affected by the anxiety disorder, F(2,
147) = 43.43, p < .001, η² = 0.37, duration of symptoms or complaints, F(2, 147) = 28.85, p <
.001, η² = 0.22, number of previous treatments, F(2, 147) = 18.95, p < .001, η² = 0.21, and GAF
score, F(2, 147) = 27.62, p < .001, η² = 0.27. The five items that differentiated significantly
between the first and second and first and third/fourth category of the CSP (subtle
differentiation on low end) were: presence of multiple anxiety disorders, F(2, 147) = 6.82, p <
.01, η² = 0.08, severity of the main anxiety disorder, F(2, 147) = 13.35, p < .001, η² = 0.15,
number of situations the patient avoids, F(2, 147) = 21.70, p < .001, η² = 0.23, course of the
main anxiety disorder, F(2, 147) = 17.96, p < .001, η² = 0.20, and effect of previous treatments,
F(2, 147) = 15.25, p < .001, η² = 0.17. The item that differentiated significantly between the
first and third/fourth and second and third/fourth category of the CSP (subtle differentiation on
high end) was: number of non-anxiety comorbid disorders, F(2, 147) = 9.77, p < .001, η² = 0.12.
Most of these differentiations had a small effect size, and the presence of multiple anxiety
disorder had even an extremely small effect size. Only the number of life areas affected by the
anxiety disorder and GAF score had a medium effect size.
The validity of the adjusted CSP was calculated by means of a pooled correlation matrix
in which the total scale of the CSP was compared with the total scales and subscales of all the
questionnaires included in the test battery at T0. The CSP appeared to correlate significantly
positive with the OQ45 total scale (r = .403, p < .001), OQ45 symptom distress (r = .395, p <
.001), OQ45 social role (r = .208, p < .05), OQ45 interpersonal relations (r = .339, p < .001),
BSI total scale (r = .454, p < .001), BSI somatic complaints (r = .291, p < .01), BSI cognit ive
problems (r = .398, p < .001), BSI interpersonal sensitivity (r = .319, p < .001), BSI depressive
mood (r = .419, p < .001), BSI anxiety (r = .371, p < .001), BSI hostility (r = .214, p < .05),
BSI phobic anxiety (r = .342, p < .001), BSI paranoid thoughts (r = .331, p < .001), BSI
psychoticism (r = .429, p < .001), BDI total scale (r = .447, p < .001), ASI total scale (r = .465,
p < .001), ASI physical concerns (r = .237, p < .01), ASI cognitive concerns (r = .459, p < .001)
and ASI social concerns (r = .422, p < .001). This means the CSP was not valid, because it also
correlates significantly positive with non-anxiety measures.

18
Descriptive statistics
The mean scores and standard deviations of the (sub)scales of the questionnaires are shown in
Tables 7 (for the retrospective study) and 8 (for the prospective study).
Table 7
Means and Standard Deviations of the (Sub)scales of the Questionnaires (Retrospective Study)
T0 (N = 150) T1 (N = 28) T2 (N = 87) T3 (N = 150)
M SD M SD M SD M SD
CSP 16.43 4.79 -- -- -- -- -- --
OQ45 total scale 81.31 21.98 76.00 23.51 65.89 24.07 58.65 22.05
OQ45 symptom distress 47.79 12.64 43.82 15.23 37.57 14.86 32.37 12.42
BSI total scale 1.38 .67 1.20 .74 .94 .66 .65 .47
BSI anxiety 1.82 .89 1.41 1.03 1.12 .87 .82 .63
BSI phobic anxiety 1.53 .95 1.29 .85 .92 .75 .60 .62
BDI total scale 22.20 12.08 18.39 12.41 14.59 12.09 9.88 8.38
Table 8
Means and Standard Deviations of the (Sub)scales of the Questionnaires (Prospective Study)
T0 (N = 21) T1 (N = 19)
M SD M SD
CSP 18.95 3.64 -- --
OQ45 total scale 80.57 15.53 77.79 13.17
OQ45 symptom distress 42.71 10.66 41.53 9.24
BSI total scale 59.29 30.55 51.74 27.44
BSI anxiety 1.51 .77 1.26 .52
BSI phobic anxiety .87 .67 .62 .55
BDI total scale 21.38 11.66 18.95 8.95
BAI total scalea 36.55 8.77 33.29 8.10 aN = 11, bN = 12, cN = 18
19
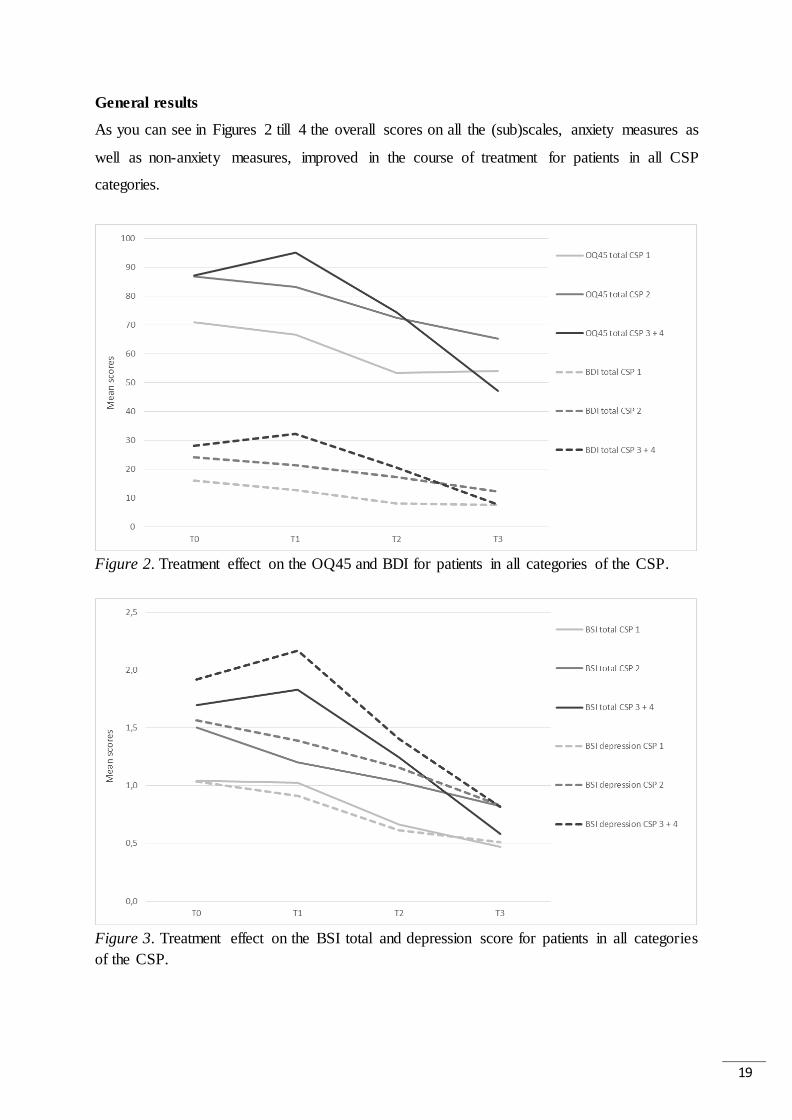
General results
As you can see in Figures 2 till 4 the overall scores on all the (sub)scales, anxiety measures as
well as non-anxiety measures, improved in the course of treatment for patients in all CSP
categories.
Figure 2. Treatment effect on the OQ45 and BDI for patients in all categories of the CSP.
Figure 3. Treatment effect on the BSI total and depression score for patients in all categories
of the CSP.

20
Figure 4. Treatment effect on the BSI anxiety scores for patients in all categories of the CSP.
A one-way ANOVA showed that patients in the different CSP categories had significant
different scores at baseline (T0) on the total score of the OQ45, F(2, 147) = 9.74, p < .001, η2 =
0.12; the total score of the BDI, F(2, 147) = 12.76, p < .001, η2 = 0.15; the total score of the
BSI, F(2, 147) = 12.57, p < .001, η2 = 0.15; the depressive subscale of the BSI, F(2, 147) =
12.41, p < .001, η2 = 0.14; the anxiety subscale of the BSI, F(2, 147) = 7.69, p < .01, η2 = 0.09;
and the phobic anxiety subscale of the BSI, F(2, 147) = 5.79, p < .01, η2 = 0.07. The graphs
show that, in general, the scores of patients in the first CSP category were lower than those of
patients in the second category, and the scores of patients in the second category were lower
than those of patients in the third and fourth category. It also seems that reduction of symptom
severity was most prominent right after treatment (T2) and about six months after treatment
(T3). The 2-tailed planned contrasts test of the one-way ANOVA indicated that patients in the
first CSP category indeed had significantly lower scores compared to patients in the second,
third and fourth category at T0, T1 and T2 for the total score of the OQ45 (respectively, t(147)
= -4.22, p < .001; t(25) = -2.61, p < .01; t(84) = -3.82, p < .001), BDI (respectively, t(147) = -
5.02, p < .001; t(25) = -3.31, p < .01; t(84) = -4.12, p < .001) and BSI depressive subscale
(respectively, t(147) = -4.86, p < .001; t(25) = -2.49, p < .05; t(84) = -3.37, p < .01); and at T0
and T2 for the BSI total scale (respectively, t(147) = -4.96, p < .001; t(84) = -3.26, p < .01), BSI
anxiety subscale (respectively, t(147) = -3.79, p < .001; t(84) = -2.61, p < .01) and BSI phobic
anxiety subscale (respectively, t(147) = -3.48, p < .01; t(84) = -2.61, p < .01). Patients in the

21
second category only had significantly lower scores compared to patients in the third and fourth
category on the BSI depressive subscale at T0, t(147) = -1.98, p < .05. Apparently, reduction of
symptom severity for all CSP categories was only significant right after treatment (T2) and
sometimes during treatment (T1).
After inspection of the graphs, it seems that, unlike patients in the first and second
category of the CSP, patients in de third and fourth category regularly had little peaks at T1,
indicating a little deterioration of scores before they improve their scores. Remarkably enough,
when looking at the graphs, patients in the third category of the CSP seemed to experience the
largest symptom reduction. A paired samples t-test indicated that patients in all categories of
the CSP made significant treatment progress on all scores between T0 and T3, but effect size
increased as the category of the CSP became higher. That is, patients in the second category
had bigger effect sizes than patients in the first category and patients in the third and fourth
category had bigger effect sizes than patients in the second category, which means that the more
severely affected patients made relatively more treatment progress compared to the less
severely affected patients. Note: all effect sizes showed at least a large effect.
Inductive statistics of the retrospective study (N = 150)
Hypothesis I
First, it was expected that the CSP predicts the course of treatment in patients with anxiety
disorders. The categories of the CSP could significantly predict treatment progress between T0
and T3 measured by the difference scores on the total scale of the OQ45, H(2) = 35.83, p < .001;
the total scale of the BSI, H(2) = 35.99, p < .001; the depressive subscale of the BSI, H(2) =
33.79, p < .001; the anxiety subscale of the BSI, H(2) = 19.84, p < .001; the phobic anxiety
subscale of the BSI, H(2) = 25.17, p < .001; and the total scale of the BDI, H(2) = 47.03, p <
.001. Jonckheere’s test revealed a significant linear trend in the data: the higher the CSP
category, the lower the (negative) median of the difference scores on the total scale of the OQ45,
J = 8710, z = -4.76, r = -.28; the total scale of the BSI, J = 8294, z = -5.34, r = -.32; the depressive
subscale of the BSI, J = 8294, z = -5.57, r = -.33; the anxiety subscale of the BSI, J = 9761, z =
-3.33, r = -.20; the phobic anxiety subscale of the BSI, J = 9068, z = -4.28, r = -.25; and the
total scale of the BDI, J = 8304, z = -5.33, r = -.31.These results indicate that patients in the
higher categories of the CSP made significantly more treatment progress between T0 and T3
than patients in the lower categories of the CSP.

22
Hypothesis II
Second, it was expected that the CSP predicts drop-out in patients with anxiety disorders.
Twenty-six patients dropped out of the retrospective study in total: 16 patients stopped showing
up at treatment sessions and 10 patients interrupted their treatment in agreement with their
mental health care practitioners (mostly psychologists). The percentage of drop-out was 11.3%
for patients in the first category, 15.4% for the second category, 35.7% for the third category
and 0% for the fourth category of the CSP3.
As seen in Table 13, both the total score and the categories of the CSP could predict
drop-out. The final logistic regression model (including the CSP) explained a significant
amount of the original variability and therefore was a better fit than the original model (without
the CSP). However, the pseudo R-squareds indicate that the model does only explain a very
small percentage of the observed variation, with a very low odds ratio for the total scale of the
CSP and a higher one for the categories of the CSP.
Table 13
Drop-out predicted by the CSP (Retrospective Study)
B (SE) Odds Ratio 95% BI
Total scale of the CSP a
CSP total score 0.11 (0.05)* 1.11 [1.01, 1.23]
Constant -3.07 (0.78)*** 0.05 [0.01, 0.22]
Categories of the CSP b
CSP category 0.63 (0.30)* 1.87 [1.03, 3.39]
Constant -2.79 (0.67)*** 0.06 [0.02, 0.23]
Note. The pooled results were used for all data in this table.
a For the 5th imputation: R2 = .03 (Cox & Snell), .05 (Nagelkerke). Model χ2(1)= 4.97, p < .05.
b For the 5th imputation: R2 = .03 (Cox & Snell), .05 (Nagelkerke). Model χ2(1)= 4.95, p < .05.
*p < .05. **p < .01. *** p < .001.
Furthermore, a frequency analysis of drop-outs showed that patients with a GAF score
between 40 and 49 were three times more likely to drop-out and that drop-outs, in comparison
with the entire group of patients that participated in this study, were two times more likely to
have PTSD, were a little bit older (30 till 49 year instead of 20 till 39 year), were one and a half
times more likely to be a (first generation) migrant, were two and a half times more likely to be
3 See Appendix E for all drop-out, including research drop-out.

23
of Moroccan descent, were one and a half times more likely to neither work nor study and were
one and a half times more likely to have children and live with children (as a single parent or
with a partner).
Inductive statistics of the prospective study
Hypothesis I
First, it was expected that the CSP predicts the course of treatment in patients with anxiety
disorders. The categories of the CSP couldn’t significantly predict treatment progress between
T0 and T1 measured by the difference scores on the total scale of the OQ45, H(2) = 1.48, p >
.05; the total scale of the BSI, H(2) = 1.83, p > .05; the depressive subscale of the BSI, H(2) =
0.81, p > .05; the anxiety subscale of the BSI, H(2) = 0.17, p > .05; the phobic anxiety subscale
of the BSI, H(2) = 0.34, p > .05; or the total scale of the BDI, H(2) = 1.71, p > .05.
Discussion
In this study we aimed to investigate the relative contribution of the items of the CSP to the
correct prediction of the illness stage of a patient’s anxiety disorder. Next, it was expected that
the CSP predicts the course of treatment in patients with anxiety disorders, and it also predicts
drop-out in patients with anxiety disorders, in de following way: patients with high scores on
the CSP (e.g. the third and fourth category) would be less likely to make progress in their
treatment and be more likely to drop out, because the first category would contain the patients
with the least illness severity and the fourth category would contain patients with the highest
illness severity.
The original CSP (Appendix A) had a low internal consistency and was therefore
insufficient for research on group level (Evers, 2001). After removal of the items ‘age’ and
‘level of education’ the CSP (Appendix B) had an internal consistency which was sufficient for
research on group level (Evers, 2001). This version was used for further analyses. Most items
of the CSP contributed to a significant differentiation between the categories of the CSP: five
items differentiated between all categories, five items between the first and second and first and
third/fourth category, and one item between the first and third/fourth and second and
third/fourth category. However, the CSP didn’t seem to be valid enough, because it also
correlated significantly positive with non-anxiety measures.

24
The first results established that patients in the different CSP categories had significant
different baseline (T0) scores on all (sub)scales. Second, at all times (except at T3), the scores
of patients in the first CSP category were significantly lower than those of patients in the other
categories, and there was a significant reduction of symptom severity for all CSP categories
right after treatment (T2) and sometimes during treatment (T1), indicating that the scores of
patients in all categories started to converge after treatment (at T3): the more severely affected
patients made stronger improvements after treatment ended, than the less severely affected
patients (which continued to improve a little).
Third, the results showed that patients in all categories of the CSP made significant
treatment progress (between T0 and T3) on all scores, anxiety measures as well as non-anxiety
measures; and effect size increased as the category of the CSP became higher, which means
that the more severely affected patients made relatively more treatment progress compared to
less severely affected patients. This was confirmed by the results of the first hypothesis, in
which it was expected that the CSP predicts the course of treatment in patients with anxiety
disorders. In the retrospective study, the categories of the CSP could significantly predict
treatment progress (between T0 and T3) measured by the difference scores on all (sub)scales.
There was a linear trend in the data: the higher the CSP category, the greater the treatment
progress. Patients in the third and fourth category of the CSP seemed to experience the largest
symptom reduction, but unlike patients in the first and second category of the CSP, patients in
de third and fourth category regularly had a little deterioration of scores at T1 before they
improved their scores at T2 and T3. The fact that the scores of these patients increased a little at
T1, could be because they have more difficulty in following treatment at first, due to ingrained
behavioral patterns (because of long duration and chronic course of the disorder), persistent
symptoms or a comorbid depressive disorder. Nevertheless, these severely affected patients
seemed to experience the largest symptom reduction, which means that not all patients with
severe pretreatment psychopathology or comorbidity respond poorly to treatment. In fact, the
magnitude of reduction of scores can be identical between people with severe versus milder
anxiety disorders, although people with initially more severe symptoms could be more likely
to have clinically significant residual symptoms at the end of treatment (Taylor, Abramowitz
& McKay, 2012). In the prospective study, however, the categories of the CSP could not
significantly predict treatment progress between T0 and T1 measured by any of the difference
scores. This could be because of low statistical power, due to the small sample size, and because
of the small timespan of the prospective study: on average, there were only three months

25
between the first treatment session and T1 (instead of the one and a half year in the retrospective
study), in which patients only had had up to seven treatment sessions (with an average of four).
Fourth, it was expected that the CSP predicts drop-out in patients with anxiety disorders.
The results showed that both the total score and the categories of the CSP could predict drop-
out, but only a very small percentage of the observed variation could be explained by the model.
When examining the drop-out rates per category, most patients who dropped out belonged to
the third category (35.7%), followed by patients in the second category (15.4%) and the lowest
proportion of dropouts in the first category (11.3%) of the CSP. This pattern was exactly like it
was predicted to be: the higher the category, the more likely to drop-out. This means that special
attention should be given to the more severely affected patients in the third CSP category to
prevent premature drop-out. In our opinion, instead of dropping out, these patients often benefit
more from an extended course of treatment or a more intensive treatment, although at the same
time the greater demands of intensive treatment might increase the risk of treatment drop-out
(Taylor, Abramowitz & McKay, 2012). Furthermore, it appeared that patients with a GAF score
between 40 and 49 were three times more likely to drop-out and that drop-outs, in comparison
with the entire group of patients that participated in this study, were two times more likely to
have PTSD, were a little bit older (30 till 49 year instead of 20 till 39 year), were one and a half
times more likely to be a (first generation) migrant, were two and a half times more likely to be
of Moroccan descent, were one and a half times more likely to neither work nor study and were
one and a half times more likely to have children and live with children (as a single parent or
with a partner).
The fact that patients diagnosed with PTSD dropped out more often (more than a
quarter) is comprehensible, as traumatization is a known risk factor for completing treatment
and treatment typically involves exposure to trauma-related stimuli and imagery, which can be
aversive: the majority of patients receiving psychotherapy tend to drop out before they have
received an “adequate dose” for symptom relief (Barrett, Chua, Crits-Cristoph, Gibbons, &
Thompson, 2008; Cully, et al., 2008; both as cited in Angeli, 2009). The older age of patients
who dropped out might be explained by the fact that older patients might have undergone more
often previous treatments without success or with rapid recurrence of symptoms. As a result
they often are demoralized and prematurely drop-out. Another reason could be that older
patients maintain their treatment gains less well than younger patients (Foa, et al., 1983) and
are less flexible to change. This could be a burden for therapy, as they suddenly have to learn
how to change their ways and change isn’t that easy to accomplish anymore. The fact that

26
patients with a low GAF score were more likely to drop-out is understandable, because a low
GAF score indicates a more severe anxiety disorder, with more daily functioning issues than
patients with higher GAF scores. This may impede treatment. Sue, McKinney and Allen (1976)
found that ethnicity was a very important predictor in early termination of treatment and in
length of therapy. Although they primarily investigated this in Afro-American patients, this
could be true for minorities in The Netherlands too (e.g. patients of Moroccan descent). Ouellet-
Plamondon, Rousseau, Nicole and Abdel-Baki (2015), and also a study in our own AAA sample
(Rijkeboer, et al., in review), found that (first- and second-generation) immigrants were more
likely than non-immigrants to disengage from treatment. In an overview of the current literature
Jonsdottir and Waghorn (2015) found that the proportions of people employed decreased with
the more severe disorder categories, indicating that severe psychiatric illnesses might contribute
to employment struggles for people with these illnesses, across countries. However, the
causality might also point into the opposite direction, i.e. that work struggles cause
psychological problems. The more severe the anxiety disorder, the more difficult it becomes
for patients to work or study. This could explain why the drop-outs contain more patients
without job or study compared to patients who complete their treatment. Issakidis and Andrews
(2004) found that the fact of having at least one child also heightens the probability of drop-
out, which could explain why drop-outs, more often than completers, had children.
There could also be other explanations for drop-out that have not been measured in our
research. Hofmann and Suvak (2006), for example, found that drop-outs rated the treatment
rationale as less logical than completers at the beginning of treatment. Non-adherence with
treatment has also been found to be related to patients’ motivation for treatment (Kortrijk, et al,
2012) and their expectations and opinions about treatment (Santana & Fontenelle, 2011). So it
could be interesting to pay more attention to these variables before starting treatment. Social
support from their loved ones and/or from their employer, or educational institution, is also
important for patients to complete their treatment with confidence. Maybe all these variables
could even be added to the CSP at a later stage to enhance its predictive value.
Ultimately, we can conclude that patients generally did improve significantly, and that
the CSP was able to predict this. Besides the recommendations mentioned here-above about
adding extra variables to predict drop-out, we made some extra suggestions for further
improvement of the CSP. First, a possible explanation of why age and education didn’t
contribute to the predictive value of the CSP. The fact that age wasn’t a good predictor, could
be explained by the fact that this was the age at intake and not the age at onset of the anxiety

27
disorder. It was thought that an early age of onset (young patient) would predict a bad prognosis
for their anxiety disorder. The older patients often have a longer duration of their anxiety
disorder (more than ten years), which often means their age of onset was early on in life. Illness
duration was included in the CSP. However, this item does not fully cover whether a patient
has a young age at onset, and therefore it might add to predictability of the CSP when age at
onset would be specifically added to the CSP. Interestingly, the level of education could only
marginally differentiate between the first and third category of the CSP. This is in line with the
literature, because level of education often influences other variables indirectly, which in turn
affect the severity of the anxiety disorder. Alonso, et al. (2004), for example, found that a higher
educational level was associated with a higher risk of pure anxiety disorder, whereas a low
educational level was associated with a higher risk for anxiety-comorbid mood disorder.
Second, the fact that many items couldn’t significantly differentiate between the second
and third category of the CSP could be due to the scoring of these items. The number of affected
life areas, duration of anxiety symptoms and course of the anxiety disorder all have a limited
score range (0-2). The patients of the AAA might all have scores on these items that easily
reach this maximum score, adding to a ceiling effect of the score. Maybe if there were more
options to choose from, the more severely affected patients (third and fourth category) would
score even higher than patients who scored in the second category, and these items would
become more sensitive to pick up differences between CSP categories. The fact that the number
of non-anxiety comorbid disorders couldn’t significantly differentiate between the first and
second category of the CSP could simply be due to the fact that comorbidity occurs by far more
often in the more severely affected patients, like the ones in the third and fourth category of the
CSP. In the first category of the CSP around 83% of the patients had no comorbid disorder, as
had 76% of the patients in the second category, whereas patients in the third and fourth category
had no comorbid disorder in only 42% of cases. So the number of non-anxiety comorbid
disorders can indicate the most severe patients, but cannot differentiate between the first and
second category of the CSP. This might also be due to the fact that some patients in the second
category should in fact have been in the third category of the CSP, but were assigned to the
wrong category because of scoring and/or cut-off issues.
Therefore it’s important to remark that scoring possibilities could be adjusted to increase
the internal consistency of the CSP even more, increase the possibility that patients score in the
fourth category of the CSP, and that patients are distributed more accurately between all
categories. In this study most patients scored in the first, second and third category, and only

28
four patients scored in the fourth category, although we would expect this patient population of
Altrecht to score especially in the second, third and fourth category, as this is a specialized
mental health institution for the more severe cases of anxiety disorders. Therefore we’ve
suggested to change the future interpretation of the scores so it matches the population of
Altrecht. See Appendix F1 (Dutch) and F2 (English) for these suggested changes. Next the CSP
should be tested again on anxiety patients in the basic mental health care and specialized mental
health care to see if these scores improve the internal consistency and categorization.
Conclusively, the CSP seems a reliable checklist which differentiates accurately
between the different stages of anxiety disorders. It can predict the course of treatment in
patients with anxiety disorders and also which patients (e.g. the ones in the higher categories)
will drop-out if no appropriate measures are taken (e.g. more intensive treatment).
Literature
Alonso, J., Angermeyer, M.C., Bernert, S., Bruffaerts, R., Brugha, T.S., Bryson, H., de
Girolamo, G., de Graaf, R., Demyttenaere, K., Gasquet, I., Haro, J.M., Katz, S.J.,
Kessler, R.C., Kovess, V., Lépine, J.P., Ormel, J., Polidori, G., Russo, L.J., Vilagut, G.,
Almansa, J., Arbabzadeh-Bouchez, S., Autonell, J., Bernal, M., Buist-Bouwman, M.A.,
Codony, M., Domingo-Salvany, A., Ferrer, M., Joo, S.S., Martínez-Alonso, M.,
Matschinger, H., Mazzi, F., Morgan, Z., Morosini, P., Palacín, C., Romera, B., Taub, N.
& Vollebergh, W.A.M. (2004). 12-Month comorbidity patterns and associated factors
in Europe: results from the European Study of the Epidemiology of Mental Disorders
(ESEMeD) project. Acta Psychiatrica Scandinavica, 109(420), 28-37.
Altamura, A.C., Buoli, M., Albano, A. & Dell’Osso, B. (2010). Age at onset and latency to
treatment (duration of untreated illness) in patients with mood and anxiety disorders: a
naturalistic study. International Clinical Psychopharmacology, 25, 172-179.
Altamura, A.C., Santini, A., Salvadori, D. & Mundo, E. (2005). Duration of untreated illness
in panic disorder: a poor outcome risk factor? Neuropsychiatric Disease and Treatment,
1(4), 345–347.
American Psychiatric Association (2001). DSM-IV-TR. Pearson: Amsterdam.
Angeli, N.C. (2009). Adherence to psychotherapy for post-traumatic stress in veterans of
military combat in Afghanistan (Operation Enduring Freedom) and Iraq (Operation
Iraqi Freedom). Atlanta: Georgia State University.
Beck, A.T., Epstein, N., Brown, G. & Steer, R.A. (1988). An inventory for measuring clinical

29
anxiety: psychometric properties. Journal of Consulting and Clinical Psychology, 56(6),
893-897.
Beck, A.T., Ward, C.H., Mendelson, M., Mock, J. & Erbaugh, J. (1961). An inventory for
measuring depression. Archives of General Psychiatry, 4, 561-571.
Bet, P.M., Hugtenburg, J.G., Penninx, B.W.J.H., Van Balkom, A., Nolen, W.A. & Hoogendijk,
W.J.G. (2013). Treatment inadequacy in primary and specialized care patients with
depressive and/or anxiety disorders. Psychiatry Research, 210(2), 594–600.
Beurs, E. de & Zitman, F.G. (2006). De Brief Symptom Inventory (BSI): de betrouwbaarheid
en validiteit van een handzaam alternatief voor de SCL‐90. [The Brief Symptom
Inventory (BSI): the reliability and validity of a brief alternative of the SCL‐90.]
Maandblad Geestelijke Volksgezondheid, 61, 120‐141.
Christiana, J.M., Gilman, S.E., Guardino, M., Mickelson, K., Morselli, P.L., Olfson, M. &
Kessler, R.C. (2000). Duration between onset and time of obtaining initial treatment
among people with anxiety and mood disorders: an international survey of members of
mental health patient advocate groups. Psychological Medicine, 30, 693–703.
Cohen J. E. (1988). Statistical Power Analysis for the Behavioral Sciences. Hillsdale, NJ:
Lawrence Erlbaum Associates, Inc
De Graaf, R., Ten Have, M. & Van Dorsselaer, S. (2010). De Psychische gezondheid van de
Nederlandse bevolking. NEMESIS-2: opzet en eerste resultaten. Utrecht: Trimbos
Instituut.
Derogatis, L.R. (1975). Brief Symptom Inventory. Baltimore, MD: Clinical Psychometr ic
Research.
Ebert, D.D., Gollwitzer, M., Riper, H., Cuijpers, P., Baumeister, H. & Berking, M. (2013). For
whom does it work? Moderators of outcome on the effect of a transdiagnostic internet-
based maintenance treatment after inpatient psychotherapy: randomized controlled trial.
Journal of Medical Internet Research, 15(10), 231-247.
Evers, A. (2001). Beoordelingssysteem voor de kwaliteit van tests. Amsterdam: COTAN/
Nederlands Instituut van Psychologen.
Fernández, A, Haro, J.M., Martinez-Alonso, M, Demyttenaere, K., Brugha, T.S., Autonell, J.,
De Girolamo, G., Bernert, S., Lépine, J.P. & Alonso, J. (2007). Treatment adequacy for
anxiety and depressive disorders in six European countries. British Journal of
Psychiatry, 190, 172-173.

30
Foa, E.B., Grayson, J.B., Steketee, G.S., Doppelt, H.G., Turner, R.M. & Latimer, P.R. (1983).
Succes and failure in the behavioral treatment of obsessive-compulsives. Journal of
Consulting & Clinical Psychology, 51(2), 287-297.
Høifødt, R.S., Strøm, C., Kolstrup, N., Eisemann, M. & Waterloo, K. (2011). Effectiveness of
cognitive behavioural therapy in primary health care: a review. Family Practice, 28,
489-504.
Jonsdottir, A. & Waghorn, G. (2015). Psychiatric disorders and labour force activity. Mental
Health Review Journal, 20(1), 13-27.
Kessler, R.C., Ruscio, A.M., Shear, K. & Wittchen, H.-U. (2009). Behavioral neurobiology of
anxiety and its treatment. In Stein, M.B. & Steckler, T. (eds.), Current topics in
behavioral neurosciences 2 (pp. 21-35). Berlin: Springer‐Verlag Berlin Heidelberg.
Kortrijk, H.E., Mulder, C.L., Drukker, M., Wiersma, D. & Duivenvoorden, H.J. (2012).
Duration of assertive community treatment and the interpretation of routine outcome
data. Australian and New Zealand Journal of Psychiatry, 46(3), 240-248.
McLean, P. D., Whittal, M. L., Soechtig, I., Koch, W. J., Paterson, R., Thordarson, D. S., et al.
(2001). Cognitive versus behaviour therapy in the group treatment of obsessive-
compulsive disorder. Journal of Consulting and Clinical Psychology, 69(2), 205–214.
Mululo, S.C.C., Bezerra de Menezes, G., Vigne, P. & Fontenelle, L.F. (2012). A review on
predictors of treatment outcome in social anxiety disorder. Revista Brasileira de
Psiquiatria, 34, 92-100.
Nunnally, J.C. & Bernstein, I.H. (1994). Psychometric theory. New York: McGraw-Hill.
Ouellet-Plamondon, C., Rousseau, C., Nicole, L. & Abdel-Baki, A. (2015). Engaging
immigrants in early psychosis treatment: a clinical challenge. Psychiatric Services,
66(3), n.p.
Reiss, S., Peterson, R.A., Gursky, D.M. & McNally, R.J. (1986). Anxiety sensitivity, anxiety
frequency, and the prediction of fearfulness. Behaviour Research and Therapy, 24, 1-8.
Rijkeboer, M.M. et al. (in review). …
Santana, L. & Fontenelle, L.F. (2011). A review of studies concerning treatment adherence of
patients with anxiety disorders. Patient Preference and Adherence, 5, 427–439.
Slaap, B.R., Van Vliet, I.M., Westenberg, H.G.M. & Den Boer, J.A. (1996). MHPG and heart
rate as correlates of nonresponse to drug therapy in panic disorder patients.
Psychopharmacol, 127, 353-358.

31
Smith, J.D., Van Ryzin, M.J., Fowler, J.C. & Handler, L. (2014). Predicting response to
intensive multimodal inpatient treatment: a comparison of single- and multiple-c lass
growth modeling approaches. Journal of Personality Assessment, 96(3), 306-315.
Somers, J.M., Goldner, E.M., Waraich, P. & Hsu, L. (2006). Prevalence and incidence studies
of anxiety disorders: a systematic review of the literature. Canadian Journal of
Psychiatry, 51, 100-113.
Steer, R.A., Beck, A.T. & Garrison, B. (1986). Applications of the Beck Depression Inventory.
In N. Sartorious & T.A. Ban (Eds.), Assessment of depression (pp. 121-142). Geneva:
World Health Organization.
Sue, S., McKinney, H., & Allen, D.B. (1976). Predictors of the duration of therapy for clients
in the community mental health system. Community Mental Health Journal, 12, 365-
375.
Taylor, S., Abramowitz, J.S. & McKay, D. (2012). Non-adherence and non-response in the
treatment of anxiety disorders. Journal of Anxiety Disorders, 26, 583–589.
Taylor, S., Zvolensky, M., Cox, B., Deacon, B., Heimberg, R., Ledley, D.R., Abramowitz, J.S.,
Holaway, R.M., Sandin, B., Stewart, S.H., Coles, M., Eng, W., Daly, E.S., Arrindell,
W.A., Bouvard, M. & Cardenas, S.J. (2007). Robust dimensions of anxiety sensitivity:
development and initial validation of the Anxiety Sensitivity Index-3 (ASI-3).
Psychological Assessment, 19, 176-188.
Tolin, D.F., Gilliam, C.M. & Dufresne, D. (2010). The economic and social burden of anxiety
disorders. In Stein, D.J., Hollander, E. & Rothbaum, B.O. (Eds.), Textbook of anxiety
disorders (2nd ed., pp. 731–746). Arlington, VA: American Psychiatric Publishing.
Umphress, V.J., Lambert, M.J., Smart, D.W., Barlow, S.H., Clouse, G. (1997). Concurrent and
construct validity of the outcome questionnaire. Journal of Psychoeducational
Assessment, 15(1), 40-55.
Van Balkom, A.L.J.M., Oosterbaan, D.B., Batelaan, N., Cath, D.C., Hendriks, G.-J.,
Van Megen, H.J.G.M., Schruers, K., Spijker, J., Van der Wee, N. & Van Vliet, I.M.
(2012). De karakterisering van angststoornissen: stageren en profileren met gezond
verstand. Tijdschrift Voor Psychiatrie, 54, 935-940.
Van Balkom, A.L.J.M., Van Vliet, I.M., Emmelkamp, P.M.G., Bockting, C.L.H., Spijker,
J., Hermens, M.L.M., Meeuwissen, J.A.C., namens de Werkgroep Multidisciplina ire
richtlijnontwikkeling Angststoornissen/Depressie [on behalf of the Workgroup
Multidisciplinary Guideline Development Anxiety Disorders/Depression] (2013).

32
Multidisciplinaire richtlijn Angststoornissen (Derde revisie). Richtlijn voor de
diagnostiek, behandeling en begeleiding van volwassen patiënten met een angststoornis.
[Multidisciplinary guideline Anxiety Disorders (Third revision). Guideline for the
diagnostics, treatment and guidance of adult patients with an anxiety disorder.] Utrecht:
Trimbos-instituut.
Wang, P.S., Aguilar-Gaxiola, S., AlHamzawi, A.O., Alonso, J., Andrade, L.H., Angermeyer,
M., Borges, G., Bromet E.J., Bruffaerts, R., Bunting, B., Caldas de Almeida, J.M.,
Florescu, S., De Girolamo, G., De Graaf, R., Gureje, O., Haro, J.M., Hinkov, H.R., Hum
C.Y., Karam, E.G., Kovess, V., Lee, S., Levinson, D., Ono, Y., Petukhova, M., Posada-
Villa, J., Sagar, R., Seedat, S., Wells, J.E., Kessler, R.C. (2011). Treated and untreated
prevalence of mental disorder worldwide. In Thornicroft, G., Szmukler, G. & Mueser,
K.T. (Eds.), Oxford textbook of community mental health (pp. 50-66). New York:
Oxford University Press.
Wells, M.G, Burlingame, G.M, Lambert, M.J., Hoag, M.J. & Hope, C.A. (1996).
Conceptualization and measurement of patient change during psychotherapy:
development of the outcome questionnaire and youth outcome questionna ire.
Psychotherapy, 33(2), 275-283.
White, K.S., Allen, L.B., Barlow, D.H., Gorman, J.M., Shear, M.K. & Woods, S.W. (2010).
Attrition in a multicenter clinical trial for panic disorder. Journal of Nervous and Mental
Disease, 198, 665-671.

v
Appendix A1 – Original Checklist Staging and Profiling (CSP) in Dutch
Vraag Score (omcirkel) Toelichting op antwoord
1) Is de hoofddiagnose een
angststoornis?
Ja / Nee
Geen punten
Zo ja, welke?
…………………………………
…………………………………
2) Zijn er meerdere
angststoornissen?
Nee = 0
Ja = 1
Zo ja, welke?
…………………………………
…………………………………
3) Is er een comorbide
depressie / dysthymie?
Nee = 0
Ja = 2
4) Wat is de ernst van de
(hoofd)angststoornis?
Licht = 0
Matig = 1
Ernstig = 2
5) Hoeveel levensgebieden
zijn er aangetast?
0 = 0
1 = 1
2 = 2
≥ 3 = 3
Werk / school / opleiding
Relatie
Huishouden / opvoeding
kinderen
Sociale contacten
Vrijetijdsbesteding / hobby’s
6) In hoeveel situaties
vertoont de patient
vermijdingsgedrag?
0 gebieden = 0
1 gebieden = 1
2 gebieden = 2
≥ 3 gebieden = 3
Openbare ruimtes
Sociale situaties
Werk / opleiding
Overige situaties
7) Leeftijd 10-19 = 4
20-29 = 3
30-39 = 2
40-49 = 1
≥ 50 = 0
8) Aantal jaren klachten < 1 jaar = 0
1 - 2 jaar = 1
2 - 5 jaar = 2
6-10 jaar = 3
> 10 jaar = 4
9) Beloop: fluctuerend of
chronisch?
Eerste episode = 0
Eén recidive met herstel
tussendoor = 1
≥ Twee recidives met
herstel tussendoor = 2
Chronisch (geen of
nauwelijks herstel) = 3

vi
10) a. Hoeveel eerdere
behandelingen (van welke
soort dan ook)?
0-1 = 0
2 = 1
≥ 3 = 2
Zo ja, hoeveel?
…………………………………
10) b. Wat is de kwaliteit van
eerdere behandelingen in
zijn geheel beschouwd?
Goed / twijfelachtig /
onvoldoende / n.v.t.
Geen punten
CGT (of andere therapie volgens
de richtlijnen) / farmaco / beide /
n.v.t. Geen punten
10) c. Wat is het effect van
eerdere behandelingen?
Goed of n.v.t. = 0
Twijfelachtig = 1
Onvoldoende = 2
Hoeveel behandelingen waren er
zonder effect?
…………………………………
11) Zijn er nog andere
comorbide stoornissen
aanwezig (naast
angststoornissen of een
depressie)?
0 = 0
1 = 1
2 = 2
≥ 3 = 3
Zo ja, welke stoornissen?
…………………………………
…………………………………
Denk aan: persoonlijkheids-
stoornis met crisisgedrag,
psychotische of bipolaire
stoornis, verslaving, somatische
aandoening die interfereert, etc.
12) GAF-score t.t.v.
premorbide functioneren
of intake
> 60 = 0
50-59 = 1
40-49 = 2
< 40 = 3
13) Schoolopleiding Hoog = 0
Midden = 1
Laag = 2
Geen = 3
Hoog = HAVO / VWO / HBO /
WO
Midden = VMBO / MTS
Laag = LS / LBO
Geen = < 5 jaar lagere school
Totaal score
………….... punten
Toelichting tabel. Het stageringsmodel van Van Balkom en zijn collega’s (2012) heeft ons mede
geïnspireerd bij het opstellen van deze checklist. De checklist is t.b.v. de intake.
Interpretatie van de score (0-35)
≤ 14 punten: Ongecompliceerde angststoornis met gunstige prognose. Verwijzen naar basis GGZ.
15-22 punten: Ongecompliceerde angststoornis met ongunstige prognose. Specialistische GGZ
behandeling: combinatie van CGT en medicatie.
23-28 punten: Gecompliceerde angststoornis met gunstige prognose. Specialistische GGZ
behandeling: combinatie van CGT en medicatie. Overweeg een intensievere
behandeling (eendaagse deeltijd, thuisbehandeling, dubbele sessies, additioneel e-
health, etc.)
≥ 28 punten: Gecompliceerde angststoornis met ongunstige prognose. Klachten zijn chronisch of
verergerd ondanks eerdere behandeling. Verwijzen naar intramurale GGZ.

vii
Twee extra overwegingen
1) Bij suboptimale behandelvoorgeschiedenis en/of aanwijzingen voor klachtreductie bij eerdere
behandeling laten instromen in intramurale GGZ behandeling: combinatie CGT en medicatie,
en start zo mogelijk deeltijd behandeling of in elk geval intensieve behandeling.
2) Bij optimale eerdere behandeling en/of geen klachtreductie bij eerdere uitvoerige
behandelingen: overweeg handicap model (doorverwijzen naar rehabilitatie) of niet in
behandeling nemen.

viii
Appendix A2 – Original Checklist Staging and Profiling (CSP) in English
Question Score (circle) Clarification on answer
1) Is the main diagnosis an
anxiety disorder?
Yes / No
No points
If so, which disorder?
…………………………………
…………………………………
2) Are there multiple anxiety
disorders?
No = 0
Yes = 1
If so, which other disorder(s)?
…………………………………
…………………………………
3) Is there a comorbid
depression / dysthymia?
No = 0
Yes = 2
4) What is the severity of the
(main) anxiety disorder?
Light = 0
Medium = 1
Severe = 2
5) In how many life areas
does the (main) disorder
affects daily functioning?
0 = 0
1 = 1
2 = 2
≥ 3 = 3
Work / school / education
Relationship
Household / raising children
Social contacts / friendships
Leisure activities / hobbies
6) In how many situation
does the patient use
avoidance behavior?
0 situations = 0
1 situation = 1
2 situations = 2
≥ 3 situations = 3
Public spaces
Social situations
Work / education
Other situations
7) Age 10-19 = 4
20-29 = 3
30-39 = 2
40-49 = 1
≥ 50 = 0
8) Duration of symptoms or
complaints
< 1 year = 0
1 - 2 year = 1
2 - 5 year = 2
6-10 year = 3
> 10 year = 4
9) Course of the (main)
disorder: fluctuating or
chronic?
First episode = 0
One relapse with
recovery in between = 1
≥ Two relapses with
recovery in between = 2
Chronic (no or barely
recovery) = 3
10) a. How many previous
treatments (of every
kind)?
0-1 = 0
2 = 1
≥ 3 = 2
If so, how many?
…………………………………

ix
10) b. Quality of previous
treatment (considered as a
whole)?
Good / questionable /
unsatisfying / n.a.
No points
CBT (or other therapy according
to guidelines) / pharmacotherapy
/ both / n.a. No points
10) c. Effect of previous
treatment (considered as a
whole)?
Good or n.a. = 0
Questionable = 1
Unsatisfying = 2
How many treatments were
there without effect?
…………………………………
11) Are there other
comorbidities (beside
anxiety disorders and
depression)?
0 = 0
1 = 1
2 = 2
≥ 3 = 3
If so, which disorders?
…………………………………
…………………………………
Think of: personality disorder
with crisis behavior, psychotic
or bipolar disorder, addiction,
somatic disorder that interferes,
etc.
12) GAF score at premorbid
functioning or intake
> 60 = 0
50-59 = 1
40-49 = 2
< 40 = 3
13) Highest education
completed
High = 0
Medium = 1
Low = 2
None = 3
High = general secondary
education / higher education /
university
Medium = preparatory
secondary vocational education /
secondary technical school
Low = lower vocational
education
None = < 5 year primary school
Total score
………….... points
Clarification on the table. The staging model of Van Balkom and his colleagues (2012) has also inspired
us in the drafting of this checklist. This checklist is made for use during intake.
Interpretation of the score (0-35)
≤ 14 points: Uncomplicated anxiety disorder with favorable prognosis. Redirect to general mental
health care.
15-22 points: Uncomplicated anxiety disorder with unfavorable prognosis. Treatment at specialized
outpatient mental health care: combination of CBT and medication.
23-28 points: Complicated anxiety disorder with favorable prognosis. Treatment at specialized
mental health care: combination of CBT and medication. Consider a more intensive
outpatient treatment (group training, home treatment, double sessions, additional e-
health, etc.)

x
≥ 28 points: Complicated anxiety disorder with unfavorable prognosis. Symptoms are chronic or
aggravated despite previous treatment. Redirect to specialized inpatient health care.
Two extra considerations:
1) With suboptimal treatment history and/or clues for reduction of complaints with previous
treatments: let the patient join in specialized inpatient mental health care: combination of CBT
and medication, and start a more intensive outpatient treatment as soon as possible.
2) With optimal treatment history and/or no clues for reduction of complaints with previous
treatments: consider the handicap model (redirect to rehabilitation) or do not accept the person
as a patient at your mental health care institution.

xi
Appendix B1 – Adjusted CSP (CSP-A) in Dutch
Vraag Score (omcirkel) Toelichting op antwoord
1) Is de hoofddiagnose een
angststoornis?
Ja / Nee
Geen punten
Zo ja, welke?
…………………………………
…………………………………
2) Zijn er meerdere
angststoornissen?
Nee = 0
Ja = 1
Zo ja, welke?
…………………………………
…………………………………
3) Is er een comorbide
depressie / dysthymie?
Nee = 0
Ja = 2
4) Wat is de ernst van de
(hoofd)angststoornis?
Licht = 0
Matig = 1
Ernstig = 2
5) Hoeveel levensgebieden
zijn er aangetast?
0 = 0
1 = 1
2 = 2
≥ 3 = 3
Werk / school / opleiding
Relatie
Huishouden / opvoeding
kinderen
Sociale contacten
Vrijetijdsbesteding / hobby’s
6) In hoeveel situaties
vertoont de patient
vermijdingsgedrag?
0 gebieden = 0
1 gebieden = 1
2 gebieden = 2
≥ 3 gebieden = 3
Openbare ruimtes
Sociale situaties
Werk / opleiding
Overige situaties
7) Aantal jaren klachten < 1 jaar = 0
1 - 2 jaar = 1
2 - 5 jaar = 2
6-10 jaar = 3
> 10 jaar = 4
8) Beloop: fluctuerend of
chronisch?
Eerste episode = 0
Eén recidive met herstel
tussendoor = 1
≥ Twee recidives met
herstel tussendoor = 2
Chronisch (geen of
nauwelijks herstel) = 3
9) a. Hoeveel eerdere
behandelingen (van welke
soort dan ook)?
0-1 = 0
2 = 1
≥ 3 = 2
Zo ja, hoeveel?
…………………………………
9) b. Wat is de kwaliteit van
eerdere behandelingen in
zijn geheel beschouwd?
Goed / twijfelachtig /
onvoldoende / n.v.t.
Geen punten
CGT (of andere therapie volgens
de richtlijnen) / farmaco / beide /
n.v.t. Geen punten

xii
9) c. Wat is het effect van
eerdere behandelingen?
Goed of n.v.t. = 0
Twijfelachtig = 1
Onvoldoende = 2
Hoeveel behandelingen waren er
zonder effect?
…………………………………
10) Zijn er nog andere
comorbide stoornissen
aanwezig (naast
angststoornissen of een
depressie)?
0 = 0
1 = 1
2 = 2
≥ 3 = 3
Zo ja, welke stoornissen?
…………………………………
…………………………………
Denk aan: persoonlijkheids-
stoornis met crisisgedrag,
psychotische of bipolaire
stoornis, verslaving, somatische
aandoening die interfereert, etc.
11) GAF-score t.t.v.
premorbide functioneren
of intake
> 60 = 0
50-59 = 1
40-49 = 2
< 40 = 3
Totaal score
………….... punten
Toelichting tabel. Het stageringsmodel van Van Balkom en zijn collega’s (2012) heeft ons mede
geïnspireerd bij het opstellen van deze checklist. De checklist is t.b.v. de intake.
Interpretatie van de score (0-28)
≤ 11 punten: Ongecompliceerde angststoornis met gunstige prognose. Verwijzen naar basis GGZ.
12-17 punten: Ongecompliceerde angststoornis met ongunstige prognose. Specialistische GGZ
behandeling: combinatie van CGT en medicatie.
18-22 punten: Gecompliceerde angststoornis met gunstige prognose. Specialistische GGZ
behandeling: combinatie van CGT en medicatie. Overweeg een intensievere
behandeling (eendaagse deeltijd, thuisbehandeling, dubbele sessies, additioneel e-
health, etc.)
≥ 23 punten: Gecompliceerde angststoornis met ongunstige prognose. Klachten zijn chronisch of
verergerd ondanks eerdere behandeling. Verwijzen naar intramurale GGZ.
Twee extra overwegingen
1) Bij suboptimale behandelvoorgeschiedenis en/of aanwijzingen voor klachtreductie bij eerdere
behandeling laten instromen in intramurale GGZ behandeling: combinatie CGT en medicatie,
en start zo mogelijk deeltijd behandeling of in elk geval intensieve behandeling.
2) Bij optimale eerdere behandeling en/of geen klachtreductie bij eerdere uitvoerige
behandelingen: overweeg handicap model (doorverwijzen naar rehabilitatie) of niet in
behandeling nemen.

xiii
Appendix B2 – Adjusted CSP (CSP-A) in English
Question Score (circle) Clarification on answer
1) Is the main diagnosis an
anxiety disorder?
Yes / No
No points
If so, which disorder?
…………………………………
…………………………………
2) Are there multiple anxiety
disorders?
No = 0
Yes = 1
If so, which other disorder(s)?
…………………………………
…………………………………
3) Is there a comorbid
depression / dysthymia?
No = 0
Yes = 2
4) What is the severity of the
(main) anxiety disorder?
Light = 0
Medium = 1
Severe = 2
5) In how many life areas
does the (main) disorder
affects daily functioning?
0 = 0
1 = 1
2 = 2
≥ 3 = 3
Work / school / education
Relationship
Household / raising children
Social contacts / friendships
Leisure activities / hobbies
6) In how many situation
does the patient use
avoidance behavior?
0 situations = 0
1 situation = 1
2 situations = 2
≥ 3 situations = 3
Public spaces
Social situations
Work / education
Other situations
7) Duration of symptoms or
complaints
< 1 year = 0
1 - 2 year = 1
2 - 5 year = 2
6-10 year = 3
> 10 year = 4
8) Course of the (main)
disorder: fluctuating or
chronic?
First episode = 0
One relapse with
recovery in between = 1
≥ Two relapses with
recovery in between = 2
Chronic (no or barely
recovery) = 3
9) a. How many previous
treatments (of every
kind)?
0-1 = 0
2 = 1
≥ 3 = 2
If so, how many?
…………………………………
9) b. Quality of previous
treatment (considered as a
whole)?
Good / questionable /
unsatisfying / n.a.
No points
CBT (or other therapy according
to guidelines) / pharmacotherapy
/ both / n.a. No points

xiv
9) c. Effect of previous
treatment (considered as a
whole)?
Good or n.a. = 0
Questionable = 1
Unsatisfying = 2
How many treatments were
there without effect?
…………………………………
10) Are there other
comorbidities (beside
anxiety disorders and
depression)?
0 = 0
1 = 1
2 = 2
≥ 3 = 3
If so, which disorders?
…………………………………
…………………………………
Think of: personality disorder
with crisis behavior, psychotic
or bipolar disorder, addiction,
somatic disorder that interferes,
etc.
11) GAF score at premorbid
functioning or intake
> 60 = 0
50-59 = 1
40-49 = 2
< 40 = 3
Total score
………….... points
Clarification on the table. The staging model of Van Balkom and his colleagues (2012) has also inspired
us in the drafting of this checklist. This checklist is made for use during intake.
Interpretation of the score (0-28)
≤ 11 points: Uncomplicated anxiety disorder with favorable prognosis. Redirect to general mental
health care.
12-17 points: Uncomplicated anxiety disorder with unfavorable prognosis. Treatment at specialized
outpatient mental health care: combination of CBT and medication.
18-22 points: Complicated anxiety disorder with favorable prognosis. Treatment at specialized
mental health care: combination of CBT and medication. Consider a more intensive
outpatient treatment (group training, home treatment, double sessions, additional e-
health, etc.)
≥ 23 points: Complicated anxiety disorder with unfavorable prognosis. Symptoms are chronic or
aggravated despite previous treatment. Redirect to specialized inpatient health care.
Two extra considerations:
1) With suboptimal treatment history and/or clues for reduction of complaints with previous
treatments: let the patient join in specialized inpatient mental health care: combination of CBT
and medication, and start a more intensive outpatient treatment as soon as possible.
2) With optimal treatment history and/or no clues for reduction of complaints with previous
treatments: consider the handicap model (redirect to rehabilitation) or do not accept the person
as a patient at your mental health care institution.

xv
Appendix C – Background variables (prospective and retrospective study)
Table 16
Comorbid Anxiety Disorders broken down by Gender (Retrospective Study, N = 150)
Men N (%) Women N (%) Total N (%)
Agoraphobia (without panic disorder) 0 (0.0) 0 (0.0) 0 (0.0)
Panic disorder (without agoraphobia) 0 (0.0) 5 (4.9) 5 (3.3)
Panic disorder with agoraphobia 1 (2.1) 4 (3.9) 5 (3.3)
Specific phobia 5 (10.4) 14 (13.7) 19 (12.7)
Social anxiety disorder (social phobia) 3 (6.3) 12 (11.8) 15 (10.0)
Obsessive-compulsive disorder 0 (0.0) 9 (8.8) 9 (6.0)
Posttraumatic stress disorder 3 (6.3) 4 (3.9) 7 (4.7)
Acute stress disorder 0 (0.0) 0 (0.0) 0 (0.0)
Generalized anxiety disorder 1 (2.1) 16 (15.7) 17 (11.3)
Other anxiety disorder 1 (2.1) 1 (1.0) 2 (1.3)
Table 17
Comorbid Anxiety Disorders broken down by Gender (Prospective Study)
Total N (%)
Agoraphobia (without panic disorder) 0 (0.0)
Panic disorder (without agoraphobia) 1 (4.8)
Panic disorder with agoraphobia 0 (0.0)
Specific phobia 2 (9.5)
Social anxiety disorder (social phobia) 0 (0.0)
Obsessive-compulsive disorder 3 (14.3)
Posttraumatic stress disorder 1 (4.8)
Acute stress disorder 0 (0.0)
Generalized anxiety disorder 0 (0.0)
Other anxiety disorder 0 (0.0)

xvi
Table 18
Non-Anxiety Comorbid Disorders broken down by Gender (Retrospective Study, N = 150)
Men N (%) Women N (%) Total N (%)
No non-anxiety comorbid disorder 17 (35.4) 43 (42.2) 60 (40.0)
One non-anxiety comorbid disorder 10 (20.8) 14 (13.7) 24 (16.0)
Two non-anxiety comorbid disorders 14 (29.2) 31 (30.4) 45 (30.0)
Three non-anxiety comorbid disorders 6 (12.5) 7 (6.9) 13 (8.7)
Four non-anxiety comorbid disorders 0 (0.0) 6 (5.9) 6 (4.0)
Five non-anxiety comorbid disorders 1 (2.1) 1 (1.0) 2 (1.3)
Major depressive disorder or dysthymia 21 (43.8) 48 (47.1) 69 (46.0)
Cognitive disorder 0 (0.0) 0 (0.0) 0 (0.0)
Substance-related disorder 0 (0.0) 0 (0.0) 0 (0.0)
Psychotic disorder 0 (0.0) 1 (1.0) 3 (2.0)
Somatoform disorder 0 (0.0) 0 (0.0) 0 (0.0)
Dissociative disorder 0 (0.0) 0 (0.0) 0 (0.0)
Sexual disorder 0 (0.0) 0 (0.0) 0 (0.0)
Eating disorder 0 (0.0) 0 (0.0) 0 (0.0)
Sleeping disorder 0 (0.0) 0 (0.0) 0 (0.0)
Adjustment disorder 0 (0.0) 0 (0.0) 0 (0.0)
Impulse-control disorder 2 (4.2) 4 (3.9) 6 (4.0)
Bipolar disorder 0 (0.0) 1 (1.0) 1 (0.7)
Developmental disorder 3 (6.3) 3 (2.9) 6 (4.0)
Personality disorder 6 (12.5) 19 (18.6) 25 (16.7)
Interfering physical illness 1 (2.1) 5 (4.9) 6 (4.0)

xvii
Table 19
Non-Anxiety Comorbid Disorders broken down by Gender (Prospective Study)
Total N (%)
No non-anxiety comorbid disorder 3 (14.3)
One non-anxiety comorbid disorder 8 (38.1)
Two non-anxiety comorbid disorders 4 (19.0)
Three non-anxiety comorbid disorders 4 (19.0)
Four non-anxiety comorbid disorders 2 (9.5)
Five non-anxiety comorbid disorders 0 (0.0)
Major depressive disorder or dysthymia 9 (42.9)
Cognitive disorder 1 (4.8)
Substance-related disorder 4 (19.0)
Psychotic disorder 1 (4.8)
Somatoform disorder 0 (0.0)
Dissociative disorder 1 (4.8)
Sexual disorder 0 (0.0)
Eating disorder 2 (9.5)
Sleeping disorder 0 (0.0)
Adjustment disorder 0 (0.0)
Impulse-control disorder 2 (9.5)
Bipolar disorder 2 (9.5)
Developmental disorder 5 (23.8)
Personality disorder 7 (33.3)
Interfering physical illness 4 (19.0)

xviii
Appendix D – Remaining descriptives (N = 21, N = 129 and N = 150)
Table 20
Means and Standard Deviations of the (Sub)scales of the Questionnaires (Retrospective Study
of N = 129)
T0 (N = 129) T1 (N = 26) T2 (N = 74) T3 (N = 41)
M SD M SD M SD M SD
Checklist Staging and
Profiling
16.43 4.79 -- -- -- -- -- --
OQ45 suicide item .57 .78 .69 .88 .40 .74 .27 .55
OQ45 substance use 1 .09 .44 .19 .80 .01 .12 .10 .37
OQ45 substance use 2 .16 .67 .12 .43 .04 .26 .02 .16
OQ45 violence .47 .82 .38 .70 .44 .82 .29 .60
OQ45 total scale 79.88 22.06 76.23 24.04 64.32 23.98 55.12 21.77
OQ45 symptom distress 47.07 12.84 44.00 15.53 36.57 14.69 30.29 12.01
OQ45 social role 12.64 5.08 12.81 3.94 10.60 4.21 10.00 4.69
OQ45 interpersonal
relations
16.40 6.35 15.85 6.12 14.35 6.38 12.51 6.35
BSI total scale 1.35 .68 1.20 .76 .92 .68 .59 .46
BSI somatic complaints 1.13 .89 .95 .85 .74 .68 .54 .50
BSI cognitive problems 1.50 .89 1.41 .93 1.07 .79 .80 .65
BSI interpersonal
sensitivity
1.67 .95 1.58 1.01 1.25 .96 .72 .68
BSI depressive mood 1.41 .87 1.27 .98 .96 .88 .60 .61
BSI anxiety 1.83 .92 1.45 1.04 1.13 .89 .77 .62
BSI hostility .83 .79 .76 .69 .55 .64 .29 .31
BSI phobic anxiety 1.52 .96 1.29 .88 .94 .78 .49 .51
BSI paranoid thoughts 1.10 .89 1.05 .93 .84 .81 .47 .62
BSI psychoticism 1.12 .77 1.11 .88 .78 .76 .55 .67
BDI total scale 21.69 11.95 18.23 12.82 13.64 11.91 8.54 7.87

xix
Table 21
Means and Standard Deviations of the (Sub)scales of the Questionnaires (Retrospective Study
of N = 21)
T0 (N = 21) T1 (N = 2) T2 (N = 15) T3 (N = 8)
M SD M SD M SD M SD
OQ45 suicide item .57 .75 .00 .00 .60 .91 .38 .52
OQ45 substance use 1 .00 .00 .00 .00 .00 .00 .00 .00
OQ45 substance use 2 .05 .22 .50 .71 .00 .00 .25 .71
OQ45 violence 1.05 1.07 .50 .71 .67 1.11 .63 .92
OQ45 total scale 90.10 19.82 73.00 21.21 73.40 23.86 76.75 13.31
OQ45 symptom distress 52.24 10.56 41.50 14.85 42.40 15.26 43.00 8.91
OQ45 social role 15.00 6.44 10.00 5.66 12.93 4.11 14.38 3.29
OQ45 interpersonal
relations
18.62 6.30 19.00 2.83 15.40 5.58 16.38 4.81
BSI total scale 1.60 .64 1.10 .28 1.04 .56 .99 .40
BSI somatic complaints 1.36 .79 1.00 .99 .79 .65 .64 .40
BSI cognitive problems 2.19 .91 .75 1.06 1.40 1.06 1.52 .86
BSI interpersonal
sensitivity
1.82 .90 2.65 .49 1.38 .91 1.16 .59
BSI depressive mood 1.72 .90 .85 .49 1.25 .85 1.22 .99
BSI anxiety 1.79 .73 .80 .71 1.07 .79 1.08 .63
BSI hostility 1.07 .80 .60 .00 .73 .67 .80 .52
BSI phobic anxiety 1.59 .95 1.20 .57 .84 .56 1.13 .90
BSI paranoid thoughts 1.53 .79 1.70 .14 .91 .77 .60 .47
BSI psychoticism 1.29 .68 .90 .14 .87 .56 .68 .54
BDI total scale 25.33 12.71 20.50 6.36 19.13 12.35 16.75 7.96

xx
Table 22
Means and Standard Deviations of the (Sub)scales of the Questionnaires (Prospective Study)
T0 (N = 21) T1 (N = 19)
M SD M SD
Checklist Staging and
Profiling
18.95 3.64 -- --
OQ45 suicide item .48 .68 .26 .56
OQ45 substance use 1 .00 .00 .11 .46
OQ45 substance use 2 .00 .00 .05 .23
OQ45 violence .52 .87 .11 .46
OQ45 total scale 80.57 15.53 77.79 13.17
OQ45 symptom distress 42.71 10.66 41.53 9.24
OQ45 social role 12.71 3.68 12.42 3.81
OQ45 interpersonal
relations
22.14 4.14 21.00 3.07
BSI total scale 59.29 30.55 51.74 27.44
BSI somatic complaints .87 .82 .86 .68
BSI cognitive problems 1.40 .80 1.45 .84
BSI interpersonal
sensitivity
1.30 .82 1.16 .94
BSI depressive mood 1.47 .88 1.20 .87
BSI anxiety 1.51 .77 1.26 .52
BSI hostility .71 .57 .73 .57
BSI phobic anxiety .87 .67 .62 .55
BSI paranoid thoughts .88 .87 .60 .37
BSI psychoticism .91 .68 .79 .58
BDI total scale 21.38 11.66 18.95 8.95
BAI total scale 36.55a 8.77a 33.29d 8.10d
BAI somatic symptoms 23.33b 6.47b 21.44e 7.06e
BAI subjective anxiety 14.33c 4.27c 13.00f 3.52f aN = 11, bN = 12, cN = 18, dN = 17, eN = 18, fN = 18

xxi
Appendix E – Treatment and research drop-out
Except for the treatment drop-out, discussed in the results, there also was research drop-out.
These were patients that didn’t (yet) drop-out of their treatment, but didn’t had a second
measurement. So we couldn’t follow their treatment progress. Table 25 show the total drop-out
(treatment and research drop-out) per category of the CSP.
Table 23
Drop-out reasons broken down by the Categories of the CSP (Retrospective Study)
First
category
Second
category
Third
category
Fourth
category
Total
Total N 53 65 28 4 150
No-show N (%) 4 (7.5) 4 (6.2) 8 (28.6) -- 16 (10.7)
Interrupted in agreement N (%) 2 (3.8) 6 (9.2) 2 (7.1) -- 10 (6.7)
Completed without T2/T3 N (%) 13 (24.5) 15 (23.1) 3 (10.7) -- 31 (20.7)
Still in treatment N (%) 3 (5.7) 3 (4.6) 3 (10.7) 1 (25.0) 10 (6.7)
Total research drop-out N (%) 22 (41.5) 28 (43.1) 5 (57.1) 1 (25.0) 61 (44.7)
Total treatment drop-out N (%) 6 (11.3) 10 (15.4) 3 (35.7) 0 (0.0) 26 (17.4)
Note. The 5th imputation was used for all data. There were almost no differences observed between all
the imputation numbers.

xxii
Appendix F1 – Improved CSP for future research (CSP-A2) in Dutch
Vraag Score (omcirkel) Toelichting op antwoord
1) Zijn er meerdere
angststoornissen?
Nee = 0
Ja = 1
Zo ja, welke?
…………………………………
…………………………………
2) Is er een comorbide
depressie / dysthymie?
Nee = 0
Ja = 1
3) Wat is de ernst van de
(hoofd)angststoornis?
Licht = 0
Matig = 1
Ernstig = 2
4) Hoeveel levensgebieden
zijn er aangetast?
0 = 0
1 = 1
2 = 2
3 = 3
≥ 4 = 4
Werk / school / opleiding
Relatie
Huishouden / opvoeding
kinderen
Sociale contacten
Vrijetijdsbesteding / hobby’s
5) In hoeveel situaties
vertoont de patient
vermijdingsgedrag?
0 gebieden = 0
1 gebieden = 1
2 gebieden = 2
3 gebieden = 3
≥ 4 gebieden = 4
Openbare ruimtes
Sociale situaties
Werk / opleiding
Overige situaties
6) Aantal jaren klachten < 1 jaar = 0
1 - 2 jaar = 1
2 - 5 jaar = 2
6-10 jaar = 3
> 10 jaar = 4
7) Beloop: fluctuerend of
chronisch?
Eerste episode = 0
Eén recidive met herstel
tussendoor = 1
≥ Twee recidives met
herstel tussendoor = 2
Chronisch (geen of
nauwelijks herstel) = 3
8) a. Hoeveel eerdere
behandelingen (van welke
soort dan ook)?
0-1 = 0
2 = 1
≥ 3 = 2
Zo ja, hoeveel?
…………………………………
8) b. Wat is de kwaliteit van
eerdere behandelingen in
zijn geheel beschouwd?
Goed / twijfelachtig /
onvoldoende / n.v.t.
Geen punten
CGT (of andere therapie volgens
de richtlijnen) / farmaco / beide /
n.v.t. Geen punten
8) c. Wat is het effect van
eerdere behandelingen?
Goed of n.v.t. = 0
Twijfelachtig = 1
Onvoldoende = 2
Hoeveel behandelingen waren er
zonder effect?
…………………………………

xxiii
9) Zijn er nog andere
comorbide stoornissen
aanwezig (naast
angststoornissen of een
depressie)?
0 = 0
1 = 1
2 = 2
≥ 3 = 3
Zo ja, welke stoornissen?
…………………………………
…………………………………
Denk aan: persoonlijkheids-
stoornis, psychotische of
bipolaire stoornis, verslaving,
somatische aandoening die
interfereert, etc.
10) GAF-score t.t.v.
premorbide functioneren of
intake
> 60 = 0
50-59 = 1
40-49 = 2
< 40 = 3
Totaal score
………….... punten
Toelichting tabel. Het stageringsmodel van Van Balkom en zijn collega’s (2012) heeft ons mede
geïnspireerd bij het opstellen van deze checklist. De checklist is t.b.v. de intake.
Interpretatie van de score (0-29)
≤ 9 punten: Ongecompliceerde angststoornis met gunstige prognose. Verwijzen naar basis GGZ.
10-14 punten: Ongecompliceerde angststoornis met ongunstige prognose. Specialistische GGZ
behandeling: combinatie van CGT en medicatie.
25-19 punten: Gecompliceerde angststoornis met gunstige prognose. Specialistische GGZ
behandeling: combinatie van CGT en medicatie. Overweeg een intensievere
behandeling (eendaagse deeltijd, thuisbehandeling, dubbele sessies, additioneel e-
health, etc.)
≥ 20 punten: Gecompliceerde angststoornis met ongunstige prognose. Klachten zijn chronisch of
verergerd ondanks eerdere behandeling. Verwijzen naar intramurale GGZ.
Twee extra overwegingen
1) Bij suboptimale behandelvoorgeschiedenis en/of aanwijzingen voor klachtreductie bij eerdere
behandeling laten instromen in intramurale GGZ behandeling: combinatie CGT en medicatie,
en start zo mogelijk deeltijd behandeling of in elk geval intensieve behandeling.
2) Bij optimale eerdere behandeling en/of geen klachtreductie bij eerdere uitvoerige
behandelingen: overweeg handicap model (doorverwijzen naar rehabilitatie) of niet in
behandeling nemen.

xxiv
Appendix F2 – Improved CSP for future research (CSP-A2) in English
Question Score (circle) Clarification on answer
1) Are there multiple anxiety
disorders?
No = 0
Yes = 1
If so, which other disorder(s)?
…………………………………
…………………………………
2) Is there a comorbid
depression / dysthymia?
No = 0
Yes = 1
3) What is the severity of the
(main) anxiety disorder?
Light = 0
Medium = 1
Severe = 2
4) In how many life areas
does the (main) disorder
affects daily functioning?
0 = 0
1 = 1
2 = 2
3 = 3
≥ 4 = 4
Work / school / education
Relationship
Household / raising children
Social contacts / friendships
Leisure activities / hobbies
5) In how many situation does
the patient use avoidance
behavior?
0 situations = 0
1 situation = 1
2 situations = 2
≥ 3 situations = 3
Public spaces
Social situations
Work / education
Other situations
6) Duration of symptoms or
complaints
< 1 year = 0
1 - 2 years = 1
3 - 5 years = 2
6-10 years = 3
11-15 years = 4
> 15 years = 5
7) Course of the (main)
disorder: fluctuating or
chronic?
First episode = 0
One relapse with
recovery in between = 1
≥ Two relapses with
recovery in between = 2
Chronic (no or barely
recovery) = 3
8) a. How many previous
treatments (of every kind)?
0-1 = 0
2 = 1
≥ 3 = 2
If so, how many?
…………………………………
8) b. Quality of previous
treatment (considered as a
whole)?
Good / questionable /
unsatisfying / n.a.
No points
CBT (or other therapy according
to guidelines) / pharmacotherapy
/ both / n.a. No points
8) c. Effect of previous
treatment (considered as a
whole)?
Good or n.a. = 0
Questionable = 1
Unsatisfying = 2
How many treatments were
there without effect?
…………………………………

xxv
9) Are there other
comorbidities (beside
anxiety disorders and
depression)?
0 = 0
1 = 1
2 = 2
≥ 3 = 3
If so, which disorders?
…………………………………
…………………………………
Think of: personality disorder,
psychotic or bipolar disorder,
addiction, somatic disorder that
interferes, etc.
10) GAF score at premorbid
functioning or intake
> 60 = 0
50-59 = 1
40-49 = 2
< 40 = 3
Total score
………….... points
Clarification on the table. The staging model of Van Balkom and his colleagues (2012) has also inspired
us in the drafting of this checklist. This checklist is made for use during intake.
Interpretation of the score (0-29)
≤ 9 points: Uncomplicated anxiety disorder with favorable prognosis. Redirect to general mental
health care.
10-14 points: Uncomplicated anxiety disorder with unfavorable prognosis. Treatment at specialized
outpatient mental health care: combination of CBT and medication.
15-19 points: Complicated anxiety disorder with favorable prognosis. Treatment at specialized
mental health care: combination of CBT and medication. Consider a more intensive
outpatient treatment (group training, home treatment, double sessions, additional e-
health, etc.)
≥ 20 points: Complicated anxiety disorder with unfavorable prognosis. Symptoms are chronic or
aggravated despite previous treatment. Redirect to specialized inpatient mental health
care.
Two extra considerations:
1) With suboptimal treatment history and/or clues for reduction of complaints with previous
treatments: let the patient join in specialized inpatient mental health care: combination of CBT
and medication, and start a more intensive outpatient treatment as soon as possible.
2) With optimal treatment history and/or no clues for reduction of complaints with previous
treatments: consider the handicap model (redirect to rehabilitation) or do not accept the person
as a patient at your mental health care institution.


![[PPT]What is t,n,m staging and summary staging? Staging for... · Web viewWhat are we discussing? What is AJCC Staging Purpose of staging General rules for clinical and pathological](https://img.pdfslide.us/doc/110x75/5b1cc7cc7f8b9a8c5a8ba42e/pptwhat-is-tnm-staging-and-summary-staging-staging-for-web-viewwhat.jpg)