Embed Size (px)
Citation preview

ALABAMA JUVENILE JUSTICE
TASK FORCE
Agenda
• Introduction (Chairs)
• Our Charge (Chairs)
• Timeline & Process (Chairs)
• System Assessment & Drivers Part 2 (Pew)
• Discussion and Next Steps (Chairs)

Our Charge“The task force is hereby authorized and directed to study,
evaluate, and analyze, a comprehensive review of the state's
juvenile justice system and, using a data-driven approach,
develop evidence-based policy recommendations for legislative
consideration that will accomplish the following:
• Protect public safety;
• Hold juvenile offenders accountable;
• Contain costs;
• Improve outcomes for youth, families, and communities
in Alabama.”
Timeline and Process
Stakeholder
Engagement
June-August
• Data Analysis
• System Assessment
September
• Research Review
• Data Follow-Up
• Policy Development
• Subgroups
October
• Subgroups
• Policy Development
• Policy Consensus
November• Policy Consensus
• Final Report

Stakeholder Roundtables
Completed
Roundtables
Detention
directors
June
15
Juvenile
judgesJuly 10
Diversion
program
providers
July 12
County
commissionersJuly 17
Completed
Roundtables
Youth in
facilities
July
21
Probation
officers
July
25, 27,
Aug. 8
Defense
counsel
July
25, 26
DYS
contracted
providers
July
26
Upcoming
Roundtables
Youth and
families
Aug. 17,
21
DYS youth Aug. 22
Sheriffs Aug. 23
Mental health Aug. 21
Detention
youth and staffAug. 30
Prosecutors TBD
Crime Victims,
Survivors and
Advocates
TBD
Others to be scheduled at the request of the Task Force
Juvenile Justice Drivers Analysis
and System Assessment, Part 2
Alabama Juvenile Justice Task Force
August 16, 2017

7
Com
pla
int
Intake Adjudication Disposition
Probation
Detention
DYS Custody Aftercare
DHR Custody
Other
Presentation Scope (Parts 1 and 2)
Complaint to Adjudication
Presentation 1Disposition, Supervision and Custody
Presentation 2
Pre-Disposition Custody
8
Presentation 1 Overall Key Takeaways
• Decision Making
– State law requires court referral for certain school-based behaviors and
mandates prosecution of parents in certain circumstances
• Local interpretations of statute may vary and lead to disparate
responses to similar school-based behavior
– There is variation across the state in which offenses are eligible for
information adjustment and what conditions are applied
– Limited statutory criteria and local interpretation allow for inconsistent
detention practices
• There is no statewide funding stream for alternatives to detention pre-
adjudication
– JPOs report divergent eligibility criteria for consent decrees and
inconsistent practices for issuing fees

9
Presentation 1 Overall Key Takeaways
• Youth Flow
– Lower-level offenses account for most cases in the juvenile justice system
• The proportion of referrals coming from schools has increased,
mostly due to truancy
– Racial and gender disparities exist among complaints (in comparison to
the general population) and grow as youth get deeper into the juvenile
justice system
– There is wide variation in whether counties’ share of complaints is
consistent with their share of the youth population
– Declines in detention have not kept pace with declines in complaints, and
in some regions, detention admissions have increased
• Nearly 300 youth are in detention on a given day, roughly the same
as 2012
10
Presentation 1 Overall Key Takeaways
• Youth Flow
– 2/3 of complaints result in petitions, consistent with trends in 2006
• There is variation in how and to what extent counties use informal
adjustment and consent decrees
– The proportion of complaints that result in petitions varies by county
– The length of informal adjustment/lecture & releases is up 61%; 15% last
longer than 6 months
11
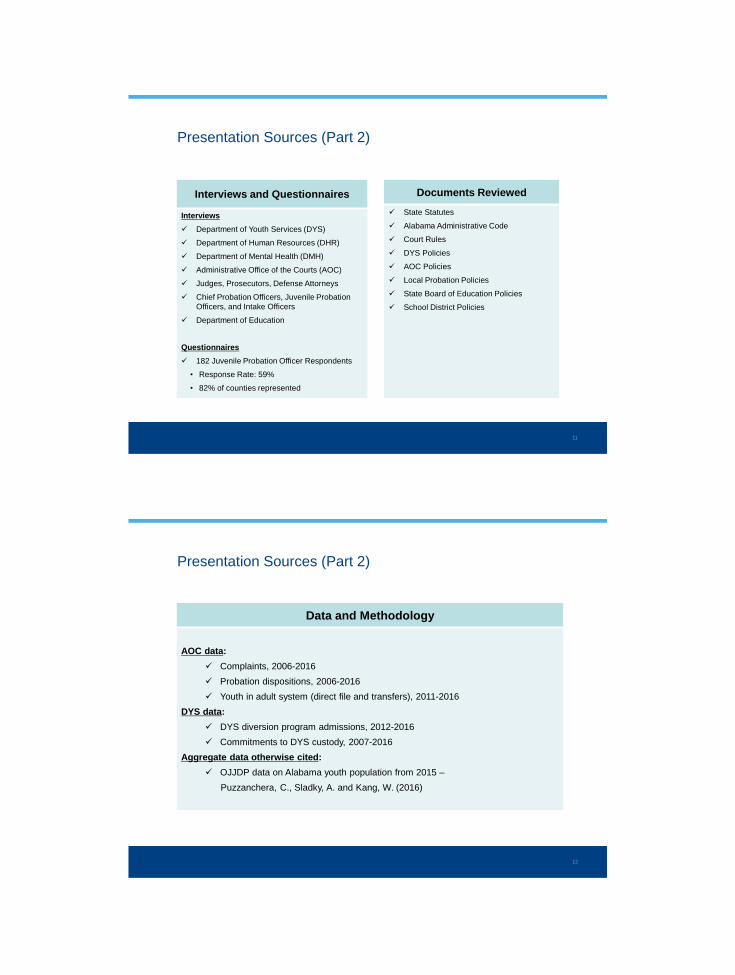
Presentation Sources (Part 2)
Interviews and Questionnaires
Interviews
Department of Youth Services (DYS)
Department of Human Resources (DHR)
Department of Mental Health (DMH)
Administrative Office of the Courts (AOC)
Judges, Prosecutors, Defense Attorneys
Chief Probation Officers, Juvenile Probation
Officers, and Intake Officers
Department of Education
Questionnaires
182 Juvenile Probation Officer Respondents
• Response Rate: 59%
• 82% of counties represented
Documents Reviewed
State Statutes
Alabama Administrative Code
Court Rules
DYS Policies
AOC Policies
Local Probation Policies
State Board of Education Policies
School District Policies
12
Presentation Sources (Part 2)
Data and Methodology
AOC data:
Complaints, 2006-2016
Probation dispositions, 2006-2016
Youth in adult system (direct file and transfers), 2011-2016
DYS data:
DYS diversion program admissions, 2012-2016
Commitments to DYS custody, 2007-2016
Aggregate data otherwise cited:
OJJDP data on Alabama youth population from 2015 –
Puzzanchera, C., Sladky, A. and Kang, W. (2016)

13
Data Follow-Up
14
Petitioning of Complaints
Data Follow Up
15
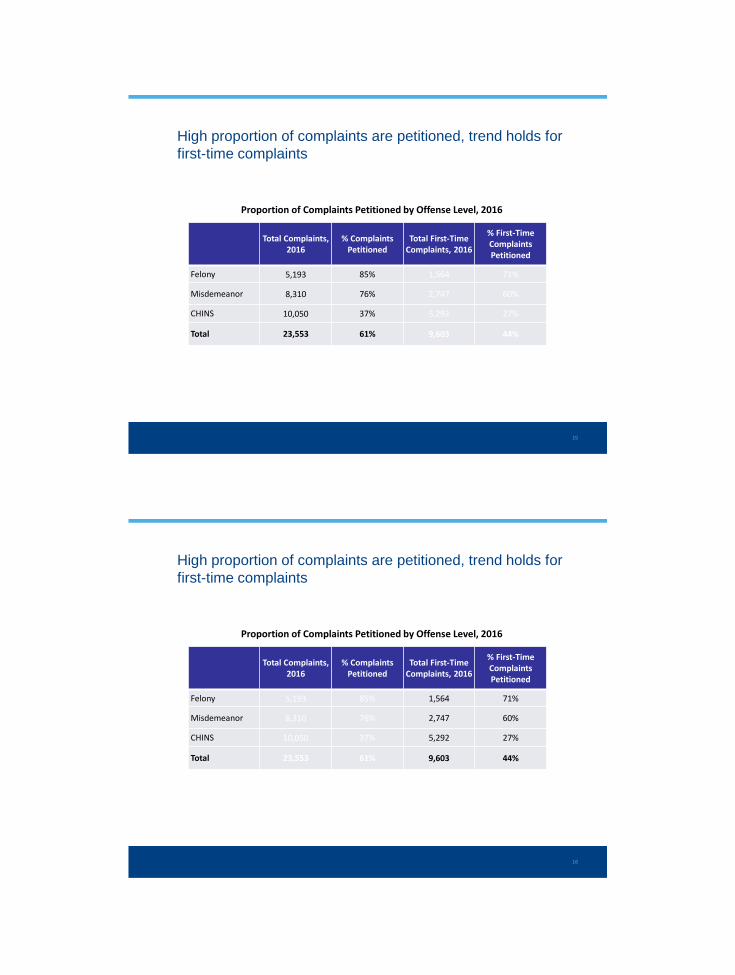
High proportion of complaints are petitioned, trend holds for
first-time complaints
Total Complaints, 2016
% Complaints Petitioned
Total First-Time Complaints, 2016
% First-Time Complaints Petitioned
Felony 5,193 85% 1,564 71%
Misdemeanor 8,310 76% 2,747 60%
CHINS 10,050 37% 5,292 27%
Total 23,553 61% 9,603 44%
Proportion of Complaints Petitioned by Offense Level, 2016
16
High proportion of complaints are petitioned, trend holds for
first-time complaints
Total Complaints, 2016
% Complaints Petitioned
Total First-Time Complaints, 2016
% First-Time Complaints Petitioned
Felony 5,193 85% 1,564 71%
Misdemeanor 8,310 76% 2,747 60%
CHINS 10,050 37% 5,292 27%
Total 23,553 61% 9,603 44%
Proportion of Complaints Petitioned by Offense Level, 2016

17
Little variation across counties in proportion of all felonies
that are petitioned, but more variation for first timers
Top 10 Counties for Felony Complaints,
2016
Total Felony Complaints
% FelonyComplaints Petitioned
Total First-Time Felony
Complaints
% First-Time Felonies
Petitioned
Madison 504 65% 134 39%
Mobile 503 75% 173 53%
Jefferson 423 78% 152 59%
Montgomery 411 87% 89 63%
Baldwin 306 87% 102 70%
Houston 244 63% 83 25%
Tuscaloosa 187 81% 54 57%
Morgan 129 92% 35 89%
Autauga 108 94% 30 83%
Escambia 106 99% 16 100%
Statewide 5,176 85% 1,558 71%
Proportion of Felony Complaints Petitioned, 2016
18
Little variation across counties in proportion of all felonies
that are petitioned, but more variation for first timers
Top 10 Counties for Felony Complaints,
2016
Total Felony Complaints
% FelonyComplaints Petitioned
Total First-Time Felony
Complaints
% First-Time Felonies
Petitioned
Madison 504 65% 134 39%
Mobile 503 75% 173 53%
Jefferson 423 78% 152 59%
Montgomery 411 87% 89 63%
Baldwin 306 87% 102 70%
Houston 244 63% 83 25%
Tuscaloosa 187 81% 54 57%
Morgan 129 92% 35 89%
Autauga 108 94% 30 83%
Escambia 106 99% 16 100%
Statewide 5,176 85% 1,558 71%
Proportion of Felony Complaints Petitioned, 2016

19
Variation across counties in proportion of misdemeanors that
are petitioned, and variation holds for first timers
Top 10 Counties for Misdemeanor
Complaints, 2016
Total Misdemeanor
Complaints
% Misdemeanor Complaints Petitioned
Total First-Time Misdemeanor
Complaints
% First-Time Misdemeanors
Petitioned
Mobile 905 69% 289 48%
Madison 655 33% 236 11%
Jefferson 550 59% 205 32%
Montgomery 541 83% 172 65%
Baldwin 484 75% 169 49%
Calhoun 367 58% 157 37%
Tuscaloosa 347 55% 102 29%
Houston 300 57% 94 28%
Shelby 244 89% 96 82%
Morgan 231 93% 57 89%
Statewide 8,303 76% 2,742 60%
Proportion of Misdemeanor Complaints Petitioned, 2016
20
Variation across counties in proportion of misdemeanors that
are petitioned, and variation holds for first timers
Top 10 Counties for Misdemeanor
Complaints, 2016
Total Misdemeanor
Complaints
% Misdemeanor Complaints Petitioned
Total First-Time Misdemeanor
Complaints
% First-Time Misdemeanors
Petitioned
Mobile 905 69% 289 48%
Madison 655 33% 236 11%
Jefferson 550 59% 205 32%
Montgomery 541 83% 172 65%
Baldwin 484 75% 169 49%
Calhoun 367 58% 157 37%
Tuscaloosa 347 55% 102 29%
Houston 300 57% 94 28%
Shelby 244 89% 96 82%
Morgan 231 93% 57 89%
Statewide 8,303 76% 2,742 60%
Proportion of Misdemeanor Complaints Petitioned, 2016

21
Variation across counties in proportion of CHINS that are
petitioned, and variation holds for first timers
Top 10 Counties for CHINS Complaints,
2016
Total CHINS Complaints
% Complaints Petitioned
Total First-Time CHINS
Complaints
% First-Time CHINS
Petitioned
Jefferson 1,078 5% 815 3%
Cullman 785 1% 379 1%
Morgan 733 37% 295 24%
Talladega 645 20% 451 3%
Coffee 562 3% 234 1%
Marshall 469 32% 195 15%
Montgomery 416 37% 192 7%
Mobile 367 95% 186 97%
Shelby 324 27% 191 20%
Madison 302 19% 56 20%
Statewide 10,047 37% 5,290 27%
Proportion of CHINS Complaints Petitioned, 2016
22
Variation across counties in proportion of CHINS that are
petitioned, and variation holds for first timers
Top 10 Counties for CHINS Complaints,
2016
Total CHINS Complaints
% Complaints Petitioned
Total First-Time CHINS
Complaints
% First-Time CHINS
Petitioned
Jefferson 1,078 5% 815 3%
Cullman 785 1% 379 1%
Morgan 733 37% 295 24%
Talladega 645 20% 451 3%
Coffee 562 3% 234 1%
Marshall 469 32% 195 15%
Montgomery 416 37% 192 7%
Mobile 367 95% 186 97%
Shelby 324 27% 191 20%
Madison 302 19% 56 20%
Statewide 10,047 37% 5,290 27%
Proportion of CHINS Complaints Petitioned, 2016
23
Re-Offending: Petitions and Informal Adjustments
Data Follow Up
24
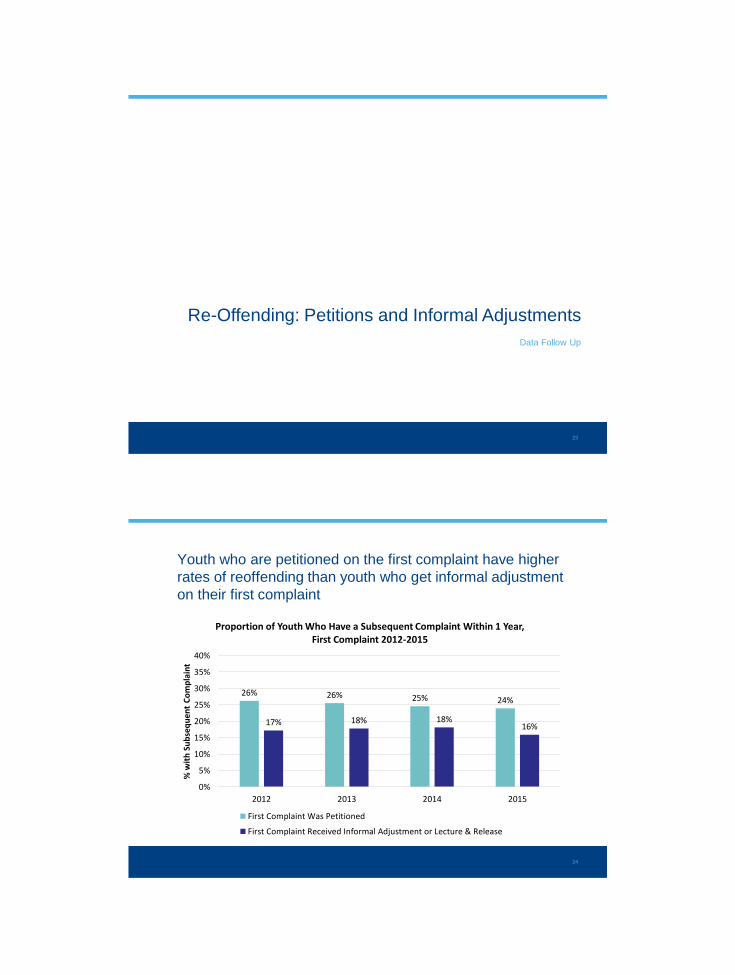
Youth who are petitioned on the first complaint have higher
rates of reoffending than youth who get informal adjustment
on their first complaint
26% 26% 25% 24%
17% 18% 18%16%
0%
5%
10%
15%
20%
25%
30%
35%
40%
2012 2013 2014 2015
% w
ith
Su
bse
qu
ent
Co
mp
lain
t
Proportion of Youth Who Have a Subsequent Complaint Within 1 Year, First Complaint 2012-2015
First Complaint Was Petitioned
First Complaint Received Informal Adjustment or Lecture & Release

25
Variation in outcomes for first time petitions vs. informal
adjustments holds for misdemeanor and CHINS offenses
25%23%
17% 16%
0%
5%
10%
15%
20%
25%
30%
First Complaint Was Misdemeanor First Complaint Was CHINS
% w
ith
Su
bse
qu
ent
Co
mp
lain
t
Proportion of Youth Who Have a Subsequent Complaint Within 1 Year, First Complaint 2015
First Complaint Was Petitioned
First Complaint Received Informal Adjustment or Lecture & Release
26
Adult Transfer and Direct File
Data Follow Up
27
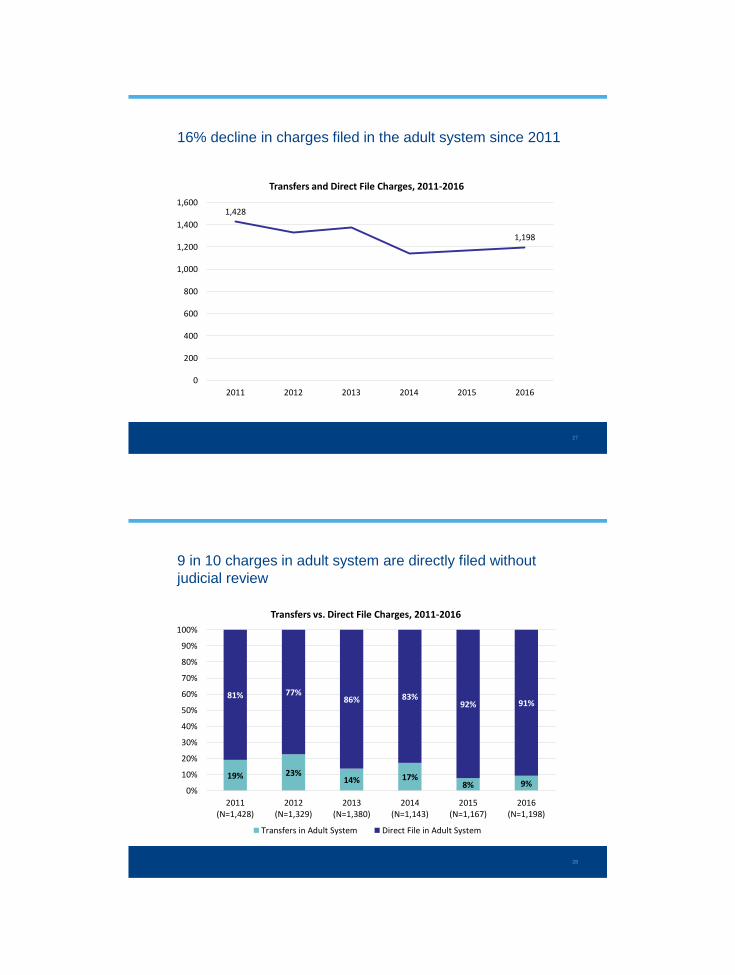
16% decline in charges filed in the adult system since 2011
1,428
1,198
0
200
400
600
800
1,000
1,200
1,400
1,600
2011 2012 2013 2014 2015 2016
Transfers and Direct File Charges, 2011-2016
28
9 in 10 charges in adult system are directly filed without
judicial review
19% 23%14% 17%
8% 9%
81% 77%86% 83%
92% 91%
0%
10%
20%
30%
40%
50%
60%
70%
80%
90%
100%
2011(N=1,428)
2012(N=1,329)
2013(N=1,380)
2014(N=1,143)
2015(N=1,167)
2016(N=1,198)
Transfers vs. Direct File Charges, 2011-2016
Transfers in Adult System Direct File in Adult System

29
Across direct file and transfers to adult court, Robbery 1st
most common offense leading youth into the adult system
Offense Count% All Direct File and
Transfer Charges
1 Robbery 1st Degree 372 31%
2 Burglary 1st Degree 76 6%
3 Discharge of Gun in Buidling/Vehicle 42 4%
4 Murder 42 4%
5 Assault 2nd 41 3%
6 Breaking and Entering a Vehicle 53 4%
7 Sodomy 1st Degree 36 3%
8 Theft of Property 2nd Degree 36 3%
9 Assault 1st Degree 36 3%
10 Theft of Property 1st Degree 38 3%
Statewide Total 1,198
Top 10 Charges for Youth in Adult System, 2016
30
29% of charges transferred to adult court are for
misdemeanor offenses
Misdemeanor Charges Transferred to Adult Court, 2016
Offense % All Transfers
1 Criminal Mischief 3rd 8%
2 Theft of Property 4th 5%
3 Possession of Marijuana 2nd 5%
4 Disorderly Conduct 4%
5 Harassment 2%
6 Reckless Endangerment 2%
7 Assault 3rd 1%
8 Criminal Trespass 2nd 1%
9 False Reporting to Law Enforcement 1%
10 Resisting Arrest 1%
% Misdemeanor Transfers 29%
Statewide Total 111

31
Adding direct file charges to overall complaints does not
magnify variation by county
County% Youth
Population(2015)
% All Complaints
(2016)
% All Complaints+ Direct File
(2016)
1 Mobile 9% 9% 9%
2 Jefferson 13% 8% 9%
3 Madison 7% 6% 6%
4 Montgomery 5% 6% 6%
5 Baldwin 4% 5% 5%
6 Morgan 3% 4% 4%
7 Cullman 2% 4% 3%
8 Talladega 2% 3% 3%
9 Houston 2% 3% 3%
10 Tuscaloosa 4% 3% 3%
Statewide Total 504,235 27,925 29,012
Total Complaints in Juvenile and Adult System Among Top 10 Counties for Juvenile Complaints, 2016
32
Adding direct file charges to overall complaints does not
magnify variation by county
County% Youth
Population(2015)
% All Complaints
(2016)
% All Complaints+ Direct File
(2016)
1 Mobile 9% 9% 9%
2 Jefferson 13% 8% 9%
3 Madison 7% 6% 6%
4 Montgomery 5% 6% 6%
5 Baldwin 4% 5% 5%
6 Morgan 3% 4% 4%
7 Cullman 2% 4% 3%
8 Talladega 2% 3% 3%
9 Houston 2% 3% 3%
10 Tuscaloosa 4% 3% 3%
Statewide Total 504,235 27,925 29,012
Total Complaints in Juvenile and Adult System Among Top 10 Counties for Juvenile Complaints, 2016

33
Data Follow Up Key Takeaways
• Youth Flow
– Across the state, 44% of youth charged with an offense for the first time
have their cases petitioned in court, including 60% of youth charged with
misdemeanors
• Counties vary widely in their proportion of first-time complaints that are
petitioned
– Youth who are petitioned on their first complaint have higher rates of
reoffending than youth who get informal adjustment on their first complaint
• This difference holds for different offense types
– The majority of charges against youth in the adult system are directly filed
without judicial review
• 29% of transferred charges are misdemeanors
• Other?
34
Disposition

35
Dis
po
sit
ion
*
No Change in Custody
Parental Supervision
Probation Supervision
Financial OrdersFines up to $250 and restitution
Change in Custody
Place with any agency or person
DHR Custody
DYS Custody**
The court may order any dispositions for most adjudicated
youth
*No statewide validated risk and needs assessment used to inform disposition decision-making
**In most cases CHINS may not be placed in DYS custody
§ 12-15-215
The court may make any other order it deems in the best interest of the child
Child
adjudicated
and in need
of care and
rehabilitation
36
Statute does not limit the length of supervision or custody,
apart from age 21
Until age 21
* For purposes of enforcing financial orders, the court retains contempt remedies indefinitely,
including incarceration in jail.
No statutory
criteria preclude
determinate
commitments
§12-15-117; § 12-15-215; § 12-15-219
Statutory Limit
on Length
Until age 21
Until age 21
Until age 21, but shall be
extended to enforce court order*
Supervision or
Custody Type
Probation
DYS Custody
Aftercare
Court Jurisdiction

37
Statute requires imposition of specific conditions for some
youth
Mandatory Discretionary
School
notification
• Class A and B felony • Any other offense
Driver’s
license
suspension
• Possession of a pistol on
school premises
• Withdrawal from school
• Certain alcohol offenses
• DUI
• Drug trafficking
• N/A
Financial
obligations
• When custody is
transferred, parent must
pay child support
• DUI Fines
• Restitution (any offense)
• Fines up to $250
(any offense)
• Court costs (any offense)
Community
service
• N/A • Community service order
(any offense)
§ 28-3A-25,§ 13A-12-291,§ 12-15-215, § 12-15-217, § 16-28-40
38
JPO respondents report wide variation in which types of
financial obligations can be assessed against youth
Financial Obligations That Can Be Assessed
JPO Respondents (N=180)
Restitution 94%
Court costs 92%
Supervision fee 51%
Assessment to the Crime Victims’ Compensation Fund 48%
A fine as part of disposition 47%
A fee to pay for a child’s attorney 32%
A fee for a consent decree 29%
Electronic monitoring fee 28%
Drug testing fee 26%
Assessment to the Fair Trial Tax Fund 8%
Other fees 15%
39
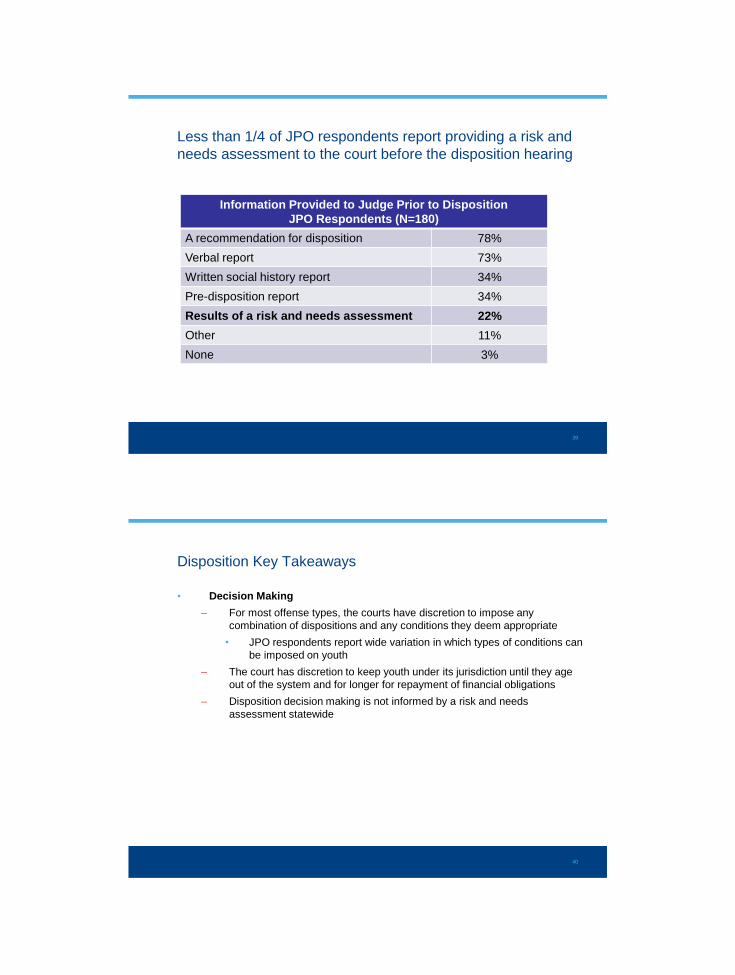
Less than 1/4 of JPO respondents report providing a risk and
needs assessment to the court before the disposition hearing
Information Provided to Judge Prior to Disposition
JPO Respondents (N=180)
A recommendation for disposition 78%
Verbal report 73%
Written social history report 34%
Pre-disposition report 34%
Results of a risk and needs assessment 22%
Other 11%
None 3%
40
Disposition Key Takeaways
• Decision Making
– For most offense types, the courts have discretion to impose any
combination of dispositions and any conditions they deem appropriate
• JPO respondents report wide variation in which types of conditions can
be imposed on youth
– The court has discretion to keep youth under its jurisdiction until they age
out of the system and for longer for repayment of financial obligations
– Disposition decision making is not informed by a risk and needs
assessment statewide

41
Probation
42
JPOs who supervise youth on probation receive little
guidance from the state to inform decision-making
Statute provides clear
guidance
§ 12-15-107
Statute does not provide
clear guidance

43
According to JPO respondents, whether they use an
individualized case plan with probation youth varies
Yes , 63%
No, 29%
For some youth, 8%
Use individualized case planJPO Respondents (N=180)
Yes No For some youth. Please explain:
44
About 2/3 of JPO respondents do not use an assessment or
written guidelines to inform meeting frequency
Determining Frequency of Meetings for Youth on Caseload
JPO Respondents (N=180)
Professional judgment 72%
Offense type 56%
Court order 56%
Criminal history 54%
Placement status (at home vs. in non-
secure out-of-home community
placements vs. secure placement)
54%
Written guidelines 39%
Risk and needs assessment 30%
Other 10%
Proximity to the youth 9%

45
3/4 of JPO respondents report gaps in services; less than
half report that available services are timely
Accessing Service Gaps: Strongly Agree or Agree with Statement
JPO Respondents (N=180)
I have the ability to accurately assess the needs of youth 91%
There are appropriate services to meet the needs of
youth
51%
There are enough services to meet the needs of youth 29%
There are gaps in services locally based on the
geographic location of youth and the service
77%
The services available for youth are of high quality 54%
The services available for youth are timely (not long wait
lists)
40%
46
Lack of statewide standards and access to services leads to
regional variation in supervision practices for probation youth
Pickens County
May not leave county
No cell phone
8pm curfew
Must maintain C average
May not possess alcohol or tobacco
May not be in the presence of alcohol or tobacco
No association with anyone with a court record
Shelby County
May not leave state
Maintain passing grades
No victim contact
No possession of drugs or alcohol
No association with any other probationers
Montgomery County
May not leave county
No association with “known law violators”

47
Fewer than half of JPO respondents report using written
guidelines, court rules, and/or statute to guide sanction
decisions for violations
Factors Guiding Sanction Decisions for Violations
JPO Respondents (N=180)
Professional judgement 87%
Court order 63%
Supervisor 50%
Written guidelines 46%
Court rules 46%
Conferencing with others who know the youth 41%
Judge’s input 33%
District Attorney’s input 30%
Statute 28%
Other 10%
48
2/3 of JPO respondents may sanction youth for technical
violations of probation without returning to court
Yes66%
No 16%
It depends18%
Able to Sanction Without Returning to Court JPO Respondents (N=180)

49
Probation violation alleged
Youth may be placed in detention
Revocationpetition
Any further disposition, including
out-of-home placement
Where the court is involved in sanctioning technical
violations, it may order any disposition, including extending
probation, adding conditions, and placing out of home
JPO may
respond formally
or informally
(unless court
order requires
formal response)
72 hours per 6
month period if
status offender
No DYS
placement on
VCO violation if
status offender
If filed, VOP is
a new charge
Code of Ala. § 12-15-132
50
JPO respondents reported wide variation in removal of youth
from home as a sanction for technical violations of probation
Types of Sanctions
JPO Respondents (N=180)
Family meeting with probation 91%
Increased frequency of contacts 89%
Drug testing 88%
Earlier curfew 83%
Substance abuse treatment (alcohol or drugs) 79%
Community service 70%
Request a pick up order to detain a youth 54%
Diversion program 54%
Electronic monitoring/house arrest 51%
Secure custody 42%
Non-secure out-of-home placement 38%
Essay writing 37%
Other 6%

51
Half of JPO respondents who are able to detain youth as a
sanction report doing so without returning to court
Yes34%
No49%
It depends17%
Able to Detain Without Returning to Court JPO Respondents Who Detain Youth As Sanction
(N=97)
52
More than 3/4 of JPO respondents say probation-imposed
financial conditions must be completed before termination
Factors Leading to Successful Termination
JPO Respondents (N=180)
Complete probation-imposed conditions (non-
pecuniary)
86%
Pay fines and fees in full 78%
Pay restitution in full 77%
Complete timeframe in court order 74%
Complete non-pecuniary court-ordered conditions in the
court order
67%
Complete pecuniary court-ordered conditions in the
court order
66%
Other 8%

53
Majority of JPO respondents must get approval from the
judge to successfully terminate a probation case
Who Must Sign Off on Successful Termination
JPO Respondents (N=180)
I must get approval from the judge 68%
I must get approval from my supervisor 46%
No one – it is up to probation alone to decide when to close
a youth’s case18%
It depends 9%
I must get approval from the district attorney 6%
54
Probation
Data

55
51% decline in probation dispositions, matching 50%
decline in complaints
12,761
6,233
0
2,000
4,000
6,000
8,000
10,000
12,000
14,000
2006 2007 2008 2009 2010 2011 2012 2013 2014 2015 2016
Total Probation Dispositions
56
Offense profile for probation dispositions has remained
steady over the past decade
Felony27%
Misdemeanor42%
Traffic1%
CHINS16%
Technical Violation
14%
Probation Dispositions by Offense Level, 2006(N=12,106)
Felony26%
Misdemeanor38%
Traffic0.3%
CHINS18%
Technical Violation
18%
Probation Dispositions by Offense Level, 2016(N=5,663)
57
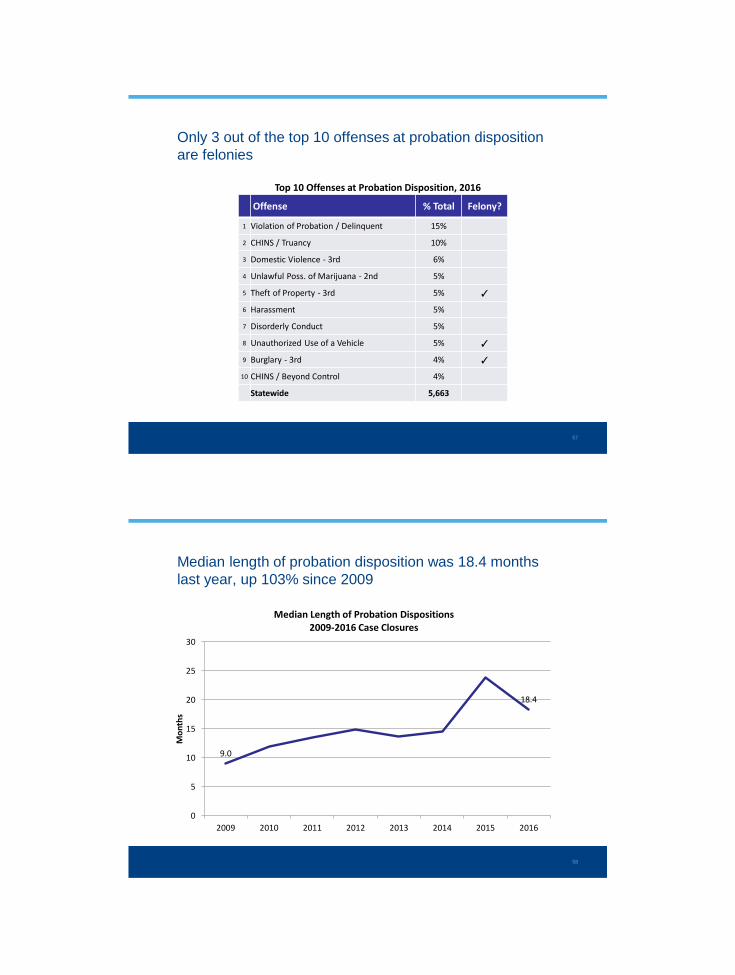
Only 3 out of the top 10 offenses at probation disposition
are felonies
Offense % Total Felony?
1 Violation of Probation / Delinquent 15%
2 CHINS / Truancy 10%
3 Domestic Violence - 3rd 6%
4 Unlawful Poss. of Marijuana - 2nd 5%
5 Theft of Property - 3rd 5% ✓
6 Harassment 5%
7 Disorderly Conduct 5%
8 Unauthorized Use of a Vehicle 5% ✓
9 Burglary - 3rd 4% ✓
10 CHINS / Beyond Control 4%
Statewide 5,663
Top 10 Offenses at Probation Disposition, 2016
58
Median length of probation disposition was 18.4 months
last year, up 103% since 2009
9.0
18.4
0
5
10
15
20
25
30
2009 2010 2011 2012 2013 2014 2015 2016
Mo
nth
s
Median Length of Probation Dispositions2009-2016 Case Closures

59
41% of probation dispositions last longer than 2 years,
1/3 last more than 3 years
Less than 6 months
12%
6 months to 1 year21%
1 - 1.5 years16%1.5 - 2 years
9%2 - 2.5 years
6%
2.5 -3 years4%
3+ years32%
Length of Probation Disposition, 2016 Case Closures(N=7,464)
60
Younger youth stay on probation for longer than older youth
28.3
22.5
14.8
0
5
10
15
20
25
30
Under 14 Years Old(N=881)
14-15 Years Old(N=2,640)
16+ Years Old(N=3,913)
Mo
nth
s
Median Length of Probation Disposition by Age Group2016 Case Closures

61
Median length of probation dispositions increased for all
offense types
8.2 8.99.9
11.0
20.418.8
16.3 16.6
0
5
10
15
20
25
Felony Misdemeanor CHINS Technical Violation
Mo
nth
sMedian Length of Probation Disposition by Offense Level
2009 vs. 2016 Case Closures
2009 2016
62
Across all their probation cases, 1/3 of youth on probation
spend more than 3 years on probation before aging out
Less than 1 year26%
1 - 1.5 years17%
1.5 - 2 years10%
2 - 2.5 years7%2.5 - 3 years
5%
3 - 3.5 years5%
3.5 - 4 years3%
Longer than 4 years27%
Total Length of Probation DispositionsClosed Probation Cases Where Youth Aged Out, 2016
(N=4,032)

63
Probation Key Takeaways
• Decision Making
– A lack of statewide standards leads to wide variation in both conditions of
supervision, and how long supervision lasts
• Fewer than half of JPO respondents report using written guidelines,
court rules, and/or statute to guide technical violation sanction
decisions
• More than 3/4 of JPO respondents say financial conditions must be
completed before youth can successfully complete probation
• Fewer than one-third of JPO respondents report that there are enough
services to meet the needs of youth on probation
– When a JPO files a probation violation with the court, the court may
impose additional conditions, or may elect to place the youth out of home
• About half of JPO respondents report using out-of-home placement in
response to technical violations
64
Probation Key Takeaways
• Youth Flow
– Probation dispositions have declined 50% since 2006, consistent with the
decline in juvenile complaints
• Despite this decline, the offense profile of probation dispositions is
primarily low-level and has stayed consistent since 2006
• Only three out of the top 10 offenses at probation disposition are
felonies
– The median length of probation dispositions was more than 18 months last
year, and has more than doubled since 2009, despite the fact that the
offense profile of probationers has not grown more serious
• The median length of probation increased for all offense types and is
longest for younger youth
• 41% of probation dispositions are longer than 2 years
– More than 1/3 of youth on probation spend more than 3 years on probation
before aging out
• Other?

65
DYS Diversion
66
DYS funds targeted community-based diversion programs
for youth facing DYS custody
“…to provide funding to county juvenile courts to aid in the
development and operation of diversion programs to serve
youth that meet the legal criteria for commitment to DYS,
but the juvenile court has determined that community based
services may be a better intervention or sanction.”
DYS Diversion Goal
(2017 Diversion Grant Application)
DYS Diversion not defined in statute

67
DYS diversion programs not funded in all jurisdictions
Nonresidential
Residential
68
While DYS contracts specify some set criteria, in practice,
length, eligibility and services vary widely
Related requirement
in DYS contract?
What is the
requirement?What happens in practice?
Residential status Yes “Community-based”4 residential
25 non-residential
Length No N/A
6 weeks
up to
2 years
Provides
evidence-based
treatment
No N/A Treatment quality varies
Available to low-
risk youthYes Low-risk excluded Some admitted
Available to
CHINS/
Status offenders
Yes CHINS excluded Some admitted
Available to non-
court involved
youth
Yes
Youth without court-
involvement
excluded
Some admitted

69
Type of intervention available to youth through DYS diversion
varies considerably based on location
Robert E. Lewis Academy
Residential
6 counties served
3 months (reported avg. length)
Physical training, therapy and aftercare
Project Turnaround
Nonresidential
1 county served
6-18 months (reported avg. length)
Wrap-around services
Youth Villages
Nonresidential
2 counties served
5 months (reported avg. length)
Multi-Systemic Therapy
70
DYS Diversion
Data

71
Admissions to non-residential and out-of-home diversion
programs have increased similarly (26% and 25%)
2,445
3,085
563701
0
1,000
2,000
3,000
4,000
5,000
2012 2013 2014 2015 2016
Total DYS Diversion Admissions, Residential vs. Non-Residential
Non-residential Residential
72
Average length of diversion has converged for non-residential
and out-of-home programs, about 3 months
169.3
104.2100.1
109.4
0
50
100
150
200
2012 2013 2014 2015 2016
Day
s
Average Length of DYS Diversion, Non-Residential vs. Residential
Non-residential Residential

73
Daily non-residential diversion population is down 19%, but
daily out-of-home diversion population is up 52%
150228
1,133
921
0
200
400
600
800
1,000
1,200
1,400
2012 2013 2014 2015 2016
July
1 S
nap
sho
tYouth in DYS Diversion Programs, July 1 Snapshot
Residential Diversion Non Residential Diversion
74
Approximately 1 in 5 DYS diversion admissions are to
out-of-home programs
81%81% 83% 79% 81%
19% 19% 17% 21% 19%
0%
10%
20%
30%
40%
50%
60%
70%
80%
90%
100%
2012 2013 2014 2015 2016
DYS Diversion Admissions, Non-Residential vs. Residential
Non-residential Residential

75
More than half of out-of-home diversion admissions are
for CHINS and misdemeanor offenses
Felony18%
Misdemeanor
39%CHINS14%
Technical Violation
29%
Residential Diversion by Offense Level, 2016(N=701)
76
Only 2 out the top 10 offenses leading to out-of-home
diversion are felonies
Offense % Total Felony?
1 Technical Violation 28%
2 CHINS/Ungovernable 9%
3 Domestic Violence 3rd 7%
4 Disorderly Conduct 6%
5 Harassment 4%
6 Burglary 3rd 4% ✓
7 CHINS/Truancy 3%
8 Theft of Property 3rd 3% ✓
9 Possession of Marijuana 2nd 3%
10 Criminal Mischief 3rd 2%
Statewide Total 701
Top 10 Offenses Leading to Residential Diversion, 2016

77
County variation in non-residential diversion greater than
county variation in complaints
County% Youth
Population (2015)
% All Complaints
(2016)
% All Non-Residential
Admissions (2016)
1 Montgomery 5% 6% 18%
2 Etowah 2% 1% 9%
3 Jefferson 13% 8% 9%
4 Madison 7% 6% 9%
5 Morgan 3% 4% 9%
6 Tuscaloosa 4% 3% 6%
7 Franklin 1% 1% 5%
8 Colbert 1% 2% 4%
9 Shelby 5% 3% 3%
10 Mobile 9% 9% 3%
Statewide 504,235 27,925 3,084
Top 10 Counties for Non-Residential Diversion, 2016
78
County% Youth
Population (2015)
% All Complaints
(2016)
% All Residential Admissions
(2016)1 Houston 2% 3% 8%
2 Mobile 9% 9% 8%
3 Baldwin 4% 5% 7%
4 Dallas 1% 1% 6%
5 Franklin 1% 1% 5%
6 Dale 1% 1% 5%
7 Calhoun 2% 2% 4%
8 Barbour 0% 1% 4%
9 St. Clair 2% 2% 4%
10 Morgan 3% 4% 3%
Statewide 504,235 27,925 700
Top 10 Counties for Residential Diversion, 2016
County variation in out-of-home diversion greater than
county variation in complaints

79
Completion rate higher for non-residential diversion than
out-of-home diversion
86%77%
14%23%
0%
10%
20%
30%
40%
50%
60%
70%
80%
90%
100%
Non-residential (N=3,001) Residential (N=664)
DYS Diversion Completion - Residential vs. Non-Residential Programs, 2016 Completion
Successful Unsuccessful
80
7% of youth who start in non-residential diversion, 20% who
start in out-of-home diversion end up committed within 1 year
7%
20%
0%
5%
10%
15%
20%
25%
First Diversion Nonresidential First Diversion Residential
Proportion of Youth Committed Within 1 Year of After Their First Diversion, First Diversion End Date 2015

81
DYS Diversion Key Takeaways
• Decision Making
– To divert youth from state custody, DYS provides funds for community-
based programming to some, but not all, localities
– A lack of statewide standards leads to wide variation in program length,
eligibility, services provided, and whether youth remain in their homes
• Youth Flow
– The out-of-home diversion population is up 52% since 2012, while the non-
residential diversion population is down 19%
• This is driven by increasing length of stay for out-of-home programs
– The use of out-of-home versus non-residential diversion varies widely
across counties
– More than half of out-of-home diversion admissions are for CHINS and
misdemeanor offenses, and only two out the top 10 offenses are felonies
– Youth who start in out-of-home diversion have higher rates of subsequent
DYS commitment than youth who start in non-residential diversion
• Other?
82
DYS Custody

83
Once committed to DYS Custody, DYS has discretion to
place youth in an array of residential settings
4 Group Homes
9 Residential Treatment Programs
3 Drug treatment
2 Specialized Treatment
1 High Intensity Treatment (HIT)
program
2 Secure Facilities
DYS-Contracted
Facilities
DYS-Operated
Facilities
NOTE: Facilities not required to provide evidence-based services shown to reduce reoffending
84
DYS placement determination is guided by a risk
assessment, but that risk assessment is not validated
*Placement required within 7 days unless placement would violate state
statute or occupancy standard; may be longer in practice
Court commits child to DYS
custody*
DYS determines placement
Child placed
Youth may be detained pending
placement for 7 days*
DYS requires
JPOS to conduct a
risk assessment
(not validated) to
guide placement
§ 12-15-215

85
DYS has discretion to determine length of stay for most
youth
Court commits* to
DYS
DYS placesQuarterly custody reviews
Re-staff
Higher security
Lower security
Release/
discharge
Program completion based on individual plan; no uniform criteria
*For determinate commitments, DYS discretion to release is limited
Team within
DYS conducts
86
DYS develops release plan and aftercare recommendations;
local court implements
DYS develops release
plan
Notification to court of release/
discharge*
Probation implements
aftercare plan with available services
Educationalalternatives
may be required
*60 days notice when sex offender is released, 30 days notice when
SJO is released, 10 days notice for all other releases
No statewide funding stream for aftercare-specific services
§ 15-20A-26, § 12-15-219,§ 44-1-36

87
JPOs who supervise youth on aftercare receive little
guidance from the state to inform decision-making
Aftercare Supervision
Length Indefinite up to jurisdictional age limit
Services Recommended by DYS, ordered by court
SupervisionSupervised by JPOs, frequency and type of contact
varies
Conditions No statewide parameters, vary by jurisdiction
88
For those youth placed on aftercare, violation may lead to
recommitment
DYS Custody
Discharge*
Release Aftercare
Successful Completion*
Revocation**
Supervised by JPO;
under jurisdiction of
juvenile court
DYS makes service
plan recommendations
Any youth who turns
21 in custody or others
ordered by court
*Denotes case is closed
**Statute does not distinguish probation violations from aftercare violations

89
DYS Custody
Data
90
DYS commitments are down 59% since 2007, but the decline
has leveled off since 2012
3,120
1,281
0
500
1,000
1,500
2,000
2,500
3,000
3,500
2007 2008 2009 2010 2011 2012 2013 2014 2015 2016
Total DYS Commitments, 2007-2016

91
Regular commitments down 54%, HIT commitments down
68%, SJO commitments down 62% since 2007
2,099
956974
307
47 180
500
1,000
1,500
2,000
2,500
2007 2008 2009 2010 2011 2012 2013 2014 2015 2016
Total DYS Commitments by Type, 2007-2016
Regular Commitments HIT Commitments SJOs
92
County variation in DYS commitments
County% Youth
Population(2015)
% All Complaints
(2016)
% DYSCommitments
(2016)
1 Mobile 9% 9% 9%
2 Jefferson 13% 8% 9%
3 Baldwin 4% 5% 8%
4 Montgomery 5% 6% 7%
5 Madison 7% 6% 5%
6 Talladega 2% 3% 4%
7 Calhoun 2% 2% 4%
8 Lee 3% 3% 3%
9 Houston 2% 3% 3%
10 Tallapoosa 1% 1% 3%
Statewide Total 504,235 27,925 1,281
Top 10 Counties for DYS Commitments, 2016

93
Nearly 2/3 of DYS commitments are for non-felonies, now
driven by a higher proportion of technical violators
43%37%
31%30%
25%33%
0%
10%
20%
30%
40%
50%
60%
70%
80%
90%
100%
2011 (N=1,698) 2016 (N=1,280)
DYS Commitments by Offense Level,2011 vs. 2016
Felony Misdemeanor Technical Violation
94
Mostly technical violations, property, and drug offenses
among top drivers of DYS commitment
Offense% All Offenses
(2016)Felony?
Petition to Revoke Probation 25%
Theft of Property, 1st 5% ✓
Petition to Revoke Aftercare 4%
Possession of Marijuana, 2nd 4%
Burglary, 3rd 3% ✓
Receiving Stolen Property, 1st 3% ✓
Disorderly Conduct 3%
Domestic Violence, 3rd 3%
Theft of Property, 2nd 2% ✓
Breaking and Entering into a Vehicle 2% ✓
Statewide Total 1,281
Top 10 Offenses for DYS Commitments, 2016

95
Average length of stay is 4.6 months for regular commitments,
1.1. months for HIT, 13.4 months for SJOs
4.9 4.6
1.1 1.1
12.1
13.4
0.0
2.0
4.0
6.0
8.0
10.0
12.0
14.0
16.0
18.0
20.0
2009 2010 2011 2012 2013 2014 2015 2016
Mo
nth
sAverage Length of DYS Commitment by Type, 2009-2016 Releases
Regular Commitments HIT Commitments SJOs
96
Nearly 60% of DYS commitments were not in a DYS
diversion program prior to their first commitment
41%46%
26%
0%
10%
20%
30%
40%
50%
All Commitments(N=1,281)
Regular Commitments(N=956)
HIT Commitments(N=307)
Proportion of Youth Who Were in DYS Diversion Prior to their First DYS Commitment, 2016 Commitments

97
85% of DYS commitments were not in a non-residential DYS
diversion program before commitment
15% 15% 17%
0%
10%
20%
30%
40%
50%
All Commitments (N=1,281)
Regular Commitments (N=956)
HIT Commitments (N=307)
Proportion of Youth Who Were in DYS Non-Residential Diversion Prior to First DYS Commitment, 2016 Commitments
98
Daily committed out-of-home population down 33% since
2009, but daily out-of-home diversion up 52% since 2012
665
485443
150
228
0
100
200
300
400
500
600
700
2009 2010 2011 2012 2013 2014 2015 2016
July
1 S
nap
sho
t
Total DYS Funded Out-of-Home Placement July 1 Snapshot
DYS Committed Out of Home Placement DYS Residential Diversion

99
Out-of-home diversion now accounts for 1/3 of the DYS-
funded out-of-home population, which is up 6% since 2012
635671
24%
34%
0%
5%
10%
15%
20%
25%
30%
35%
40%
0
100
200
300
400
500
600
700
800
2012 2013 2014 2015 2016
% To
tal DYS O
ut o
f Ho
me P
op
ulatio
nJu
ly 1
Sn
apsh
ot
Total DYS Funded Out-of-Home Placement, July 1 Snapshot
Total DYS-Funded Out of Home Population (Commitment + Diversion)
Proportion of Out of Home Population in Residential Diversion
100
Nearly 3/4 of DYS commitments are released to aftercare
69%73%
0%
20%
40%
60%
80%
100%
2009 2010 2011 2012 2013 2014 2015 2016
Proportion of DYS Commitments Released to Aftercare, 2009-2016 Releases

101
Gender disparities grow at each decision point in the juvenile
system and are largest for charges filed in the adult system
49%33% 27% 26% 27%
14%2% 6%
51%66% 72% 74% 73%
86%98% 94%
0%
10%
20%
30%
40%
50%
60%
70%
80%
90%
100%
Gender Breakdown of Key Decision Points
Female
Male
102
Racial disparities grow at each decision point in the juvenile
system and are largest for charges filed in the adult system
61%49% 49% 49% 50%
41%34%
15%
31% 47% 49% 49% 44% 57%61%
84%
8% 3% 2% 2% 6% 2% 5% 1%
0%
10%
20%
30%
40%
50%
60%
70%
80%
90%
100%
Race Breakdown of Key Decision Points
White
Black
Other

103
DYS Custody Key Takeaways
• Decision Making
– DYS has discretion to place youth in an array of facilities, none of which
are required to provide evidence-based services shown to reduce
reoffending
• The risk assessment tool used by DYS to guide the placement
decision is not validated on Alabama youth
– JPOs who supervise youth on aftercare receive little guidance from the
state to inform decision making, including when to release a youth from
supervision
• Aftercare youth whose supervision is revoked by the court could be
recommitted to DYS custody or ordered to complete additional
conditions
104
DYS Custody Key Takeaways
• Youth Flow
– DYS commitments are down 59% since 2007, but the decline has leveled off
since 2012
– Nearly 2/3 of DYS commitments are for non-felonies, now driven by a higher
proportion of technical violations
– Nearly 60% of DYS commitments were not in a DYS diversion program prior to
their first commitment; 85% were not in a non-residential DYS diversion
program
– Youth in out-of-home diversion now account for 1/3 of the DYS-funded out-of-
home population
• When out-of-home diversion and commitments are combined, the overall
DYS-funded out-of-home population is up 6% since 2012
– Nearly 3/4 of DYS commitments are released to aftercare, and revocations from
aftercare are the 3rd most common reason for DYS commitment
– Of all decision points in the juvenile justice system (excluding adult transfers
and direct files), racial and gender disparities are largest for DYS commitment
• Other?

105
System Costs
106
Out-of-home diversion programs cost the state 58% more
than non-residential programs on average
*Rates reflect only dollars paid by DYS and do not include additional funds that come from
other sources such as counties, Medicaid, the Department of Education
$20,075
$31,755
$0
$5,000
$10,000
$15,000
$20,000
$25,000
$30,000
$35,000
Non-residential Residential
Average Annual Cost to DYS for DYS Diversion

107
Out-of-home placements cost the state 15 to 91 times more
than probation
$1,768 $2,278
$33,945
$80,300
$106,945
$161,694
$-
$20,000
$40,000
$60,000
$80,000
$100,000
$120,000
$140,000
$160,000
$180,000
Probation (AllCounties)
Probation(Assumed Only)
DYS PrivatePlacement
(Lowest Cost)
DYS PrivatePlacement
(Highest Cost)
DYS Group Home DYS Secure
FY 2016 Annual Cost of Probation and Out-of-Home Placement Beds*
*Per Diem figures for Probation calculated from data provided by AOC, per diem figures for
DYS provided by DYS
108
Com
pla
int
Intake Adjudication Disposition
Probation
Detention*
DYS Custody Aftercare
DHR Custody
Other
State expenditures on juvenile supervision and placement
supplemented by county funding in certain areas
DYS & County DYS Funded DHR FundedAOC & County Funded
Pre-Disposition Custody*
*State does not fund home-based alternatives to detention

109
The state funds detention at a set level statewide and all
remaining costs borne by counties
$14,000 per county
served
$0.2449 per person
in each county
All remaining
costs*
Funding for Juvenile
Detention Facility
DYS pays to facility
Pro-rated based
on actual legislative
appropriation
County pays to facility
*In some jurisdictions, municipalities contribute to detention operation costs
Juvenile Detention Facility Funding Formula
110
System Costs Key Takeaways
– Out-of-home diversion programs cost the state 58% more than non-
residential programs on average
– DYS out-of-home placement for committed youth costs up to 91 times
more than probation
• DYS out-of-home placements cost as much as $161,694 per youth per
year
– The state funds detention at a set level statewide, subject to legislative
appropriation, with remaining costs borne by counties

111
Overall Key Takeaways
• Decision Making
– Statute allows the court to impose any combination of dispositions or
conditions for most youth
– Disposition decision making is not informed by a risk and needs
assessment statewide
– The court has discretion to keep youth under its jurisdiction until they age
out of the system, or for longer to repay financial obligations
– Youth may be placed out of home or have any condition added for any
violation of supervision
– DYS is not required to use evidence-based services shown to reduce
reoffending
– DYS out-of-home placement costs 15 to 91 times more than probation
112
Overall Key Takeaways
• Youth Flow
– Probation dispositions and DYS commitments have declined by more than
50% over the past decade
– Racial disparities and gender disparities are present for all decision points
and are largest for youth in the adult system
– The median length of probation has more than doubled since 2009,
despite the fact that the offense profile has not grown more serious,
• Nearly 1/3 of probation dispositions last longer than 3 years
– Probation violations are growing as a share of DYS commitments and out-
of-home diversion admissions
– Most youth committed to DYS have not been given the opportunity for a
non-residential DYS diversion prior to their first commitment
• Other?

Next Steps
• Research presentations
• Subgroup planning
• Stakeholder outreach and roundtables
• Individual meetings
Future Meetings
• September 6
– September 7: Hold for Research Webinar
• October 18
• November 15