Embed Size (px)
Citation preview
Staff Working Paper ERSD-2012-17 Date: 18 October 2012
World Trade Organization Economic Research and Statistics Division
More Trade for Better Health?
International Trade and Tariffs on Health Products
by
Matthias Helble Universal Postal Union
Manuscript date: October 2012
________________________
Disclaimer: This is a working paper, and hence it represents research in progress. This paper represents the opinions of the author, and is the product of professional research. It is not meant to represent the position or opinions of the WTO or its Members, nor the official position of any staff members. Any errors are the fault of the author(s). Copies of working papers can be requested from the divisional secretariat by writing to: Economic Research and Statistics Division, World Trade Organization, Rue de Lausanne 154, CH 1211 Geneva 21, Switzerland. Please request papers by number and title.
More Trade for Better Health? -
International Trade and Tariffs on Health Products
Matthias Helble1
Abstract:
The main objective of this paper is to analyse trade flows and tariff policies of health products.
Compared to previous studies, we not only focus on medicines, but on a large set of products that
enter the public health space and can be identified in the common trade classification. The first
contribution is thus to construct three groups of health products based on the 2007 Harmonized
System classification of international trade. Using these commodity groups, we analyse trade flows
between 167 countries for the years 1996 to 2009. We find that trade in health products has developed
very dynamically, with trade in dosified medicine displaying the strongest growth with an annual
growth rate of almost 12 per cent. The results further indicate that the market of health products is
dominated by a small number of developed countries. Looking at tariffs on health products for
developed and developing countries as well as LDCs and transition economies we find that the overall
level of tariffs is low, but far from being zero, especially in the last three country groups. Finally,
studying the tariffs on health products in preferential trade agreements between developing countries,
the results show that the tariff level is low, but in some individual cases still substantive.
Keywords: Public health, tariffs, trade, pharmaceuticals, medical devices, medical technology
JEL Classifications: F14, I11, O24
1Statistical Expert/Economist, Economic and Regulatory Affairs Directorate, International Bureau,
Universal Postal Union, United Nations, Weltpoststrasse 4, 3000 Berne 15, Switzerland, email: [email protected], T: +41 31 350 36 05. I am very grateful to Joaquin Montes from the WTO Economic Research and Statistics Division for all his time and efforts spent in downloading and preparing the trade and tariff data used in this paper. I drafted the paper while working in the Intellectual Property Division of the World Trade Organization in 2011.
2
I. INTRODUCTION
Health expenditures around the world have been growing strongly both in developed and in
developing countries over the past decades. One key ingredient of every health system are physical
goods that are directly used for diagnosis and treatment of patients or that are vital for other elements
of the health system, such as laboratory equipment to conduct medical research. The other main
ingredients are the delivery of health services and services related to public health (such as health
insurance services, financial services, etc.). In an increasingly interconnected world, an ever larger
share of these products and services is traded internationally. The objective of this paper is to analyse
the development in international trade of health products and of the corresponding trade policies over
the past fifteen years (1995-2009). Due to the paucity of international services' trade data, we only
look at international trade in health products and not in health services.
Despite the growing importance of public and private expenditures related to health, there is not yet
an agreed international definition of the "universe" of health products. This paper constitutes the first
attempt to construct such a "universe" using the product classification of the Harmonized System
(HS) as a basis. The HS is a classification that was developed to clearly identify products that enter a
country at the border and to be able to accord the respective treatment. Having been developed from a
trade perspective, it does not offer the refinement which, from a public health perspective, would be
desirable. However, we believe that it offers enough detail to assemble a list of health products which
covers a substantial share of all health products that enter the public health sphere and thus offers
interesting opportunities for analysis.
In trying to build up a comprehensive universe of health products, our study contrasts with previous
studies which have focused only on a subset of health products. For example, Krasovec & Connor
(1998) looked at tax exemptions for three product groups, namely vaccines, oral rehydration salts, and
contraceptives. Olcay & Laing (2005) analyse tariffs on pharmaceutical products.
Using this newly defined universe of health products, the paper analyses in detail international trade
flows and trade policies applied to these products. It thus provides an important update and extension
of previous studies, such as Olcay & Laing (2005). Foreshadowing the results, we find that
international trade in health products, and especially trade in dosified medicines, has developed in a
very dynamic manner over the past fifteen years. The market of health products, measured by
exportations and importations, is heavily dominated by developed countries, while developing
countries are gaining ground only slowly. Finally, we observe that the tariffs have come down
substantially in all country groups: Developed, developing, transition countries as well as LDCs.
However, even at a relatively low level, imposing tariffs still raises domestic prices for health
products, especially for products with long supply chains.
3
The study is structured as follows: We first present the methodology used to establish the group of
health products, followed by a short description of the data sources. In the section III the main results
are presented and discussed. Finally, we summarize the main conclusions and suggest areas for future
research.
II. METHODOLOGY AND DATA
A. METHODOLOGY
(a) The Harmonized System Classification of international trade flows
Countries typically keep detailed records of goods that enter their domestic markets. In order to make
national trade data comparable and in order to facilitate the exchange of goods across borders, the
World Customs Organization has developed a classification for international trade in goods, the so-
called Harmonized System (HS) which is now being widely used across the world. The HS
classification dissects all trade flows into clearly distinguishable groups and breaks them down into 97
chapters and almost 6000 subheadings. It thereby follows a certain economic logic, mainly from crude
products to more complex products and by sector of economic activity.
In this study, we are interested in all internationally traded goods that can contribute in one way or
another to public health. Analysing in detail the HS classification (2007), we are able to identify 207
subheadings containing products which can be directly linked to a health purpose. In order to allow
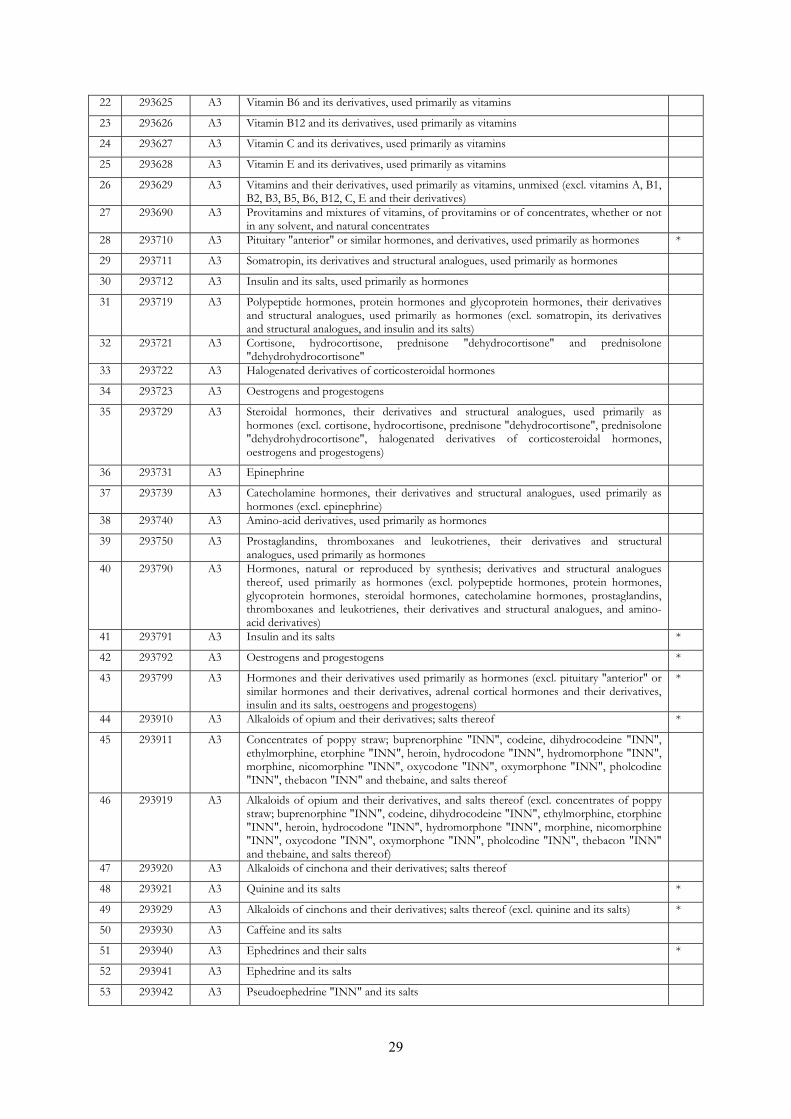
for further analysis, we regroup all 207 products into three groups (A, B, C) and five subgroups (A1,
A2, A3, C1 and C2), namely:
1. A1: Dosified Medicines
2. A2: Bulk Medicines
3. A3: Inputs specific to the pharmaceutical industry
4. B: Chemical inputs of general purpose
5. C1: Hospital and laboratory inputs
6. C2: Medical technology equipment
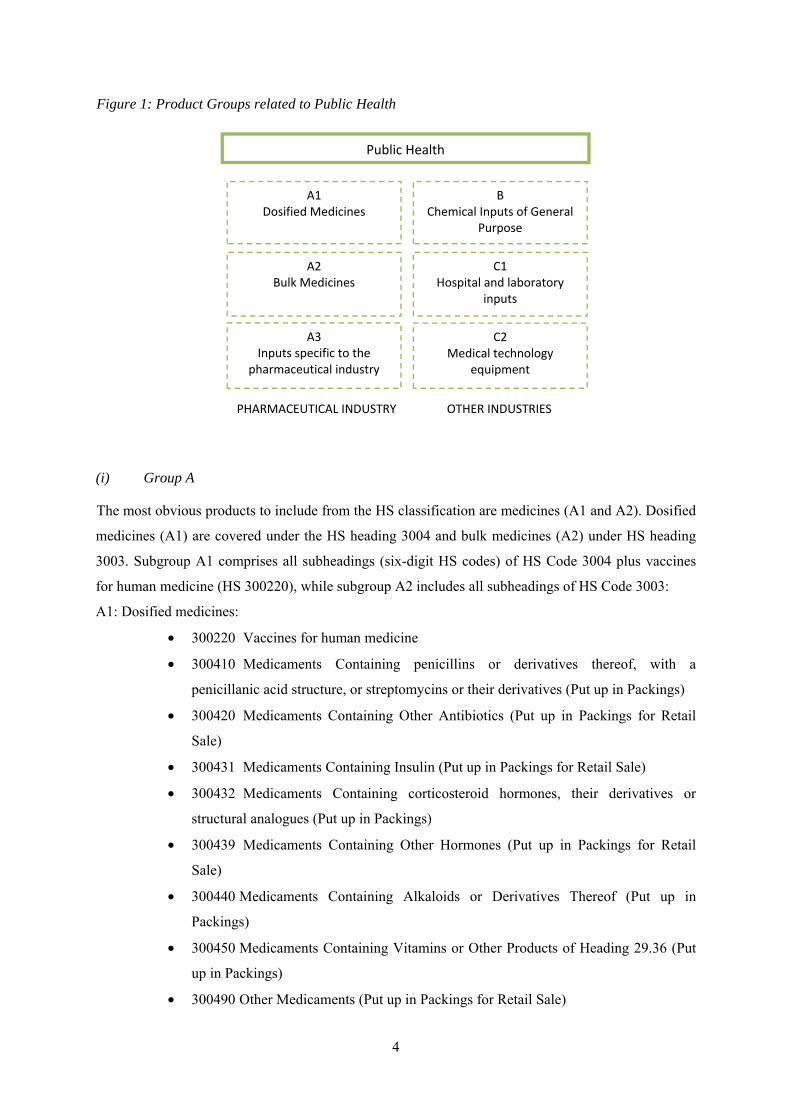
Figure 1 presents the all groups and subgroups in a schematic way. Group A covers all products and
specific inputs into the pharmaceutical industry. Subgroups A1, A2 and A3 thus contain products that
are either finished medicines (A1 and A2) or specific inputs into the pharmaceutical industry (A3).
Goods in groups B and C are produced by other industries. In the following we will explain in detail
the composition of each of the six groups.
4
Figure 1: Product Groups related to Public Health
(i) Group A
The most obvious products to include from the HS classification are medicines (A1 and A2). Dosified
medicines (A1) are covered under the HS heading 3004 and bulk medicines (A2) under HS heading
3003. Subgroup A1 comprises all subheadings (six-digit HS codes) of HS Code 3004 plus vaccines
for human medicine (HS 300220), while subgroup A2 includes all subheadings of HS Code 3003:
A1: Dosified medicines:
• 300220 Vaccines for human medicine
• 300410 Medicaments Containing penicillins or derivatives thereof, with a
penicillanic acid structure, or streptomycins or their derivatives (Put up in Packings)
• 300420 Medicaments Containing Other Antibiotics (Put up in Packings for Retail
Sale)
• 300431 Medicaments Containing Insulin (Put up in Packings for Retail Sale)
• 300432 Medicaments Containing corticosteroid hormones, their derivatives or
structural analogues (Put up in Packings)
• 300439 Medicaments Containing Other Hormones (Put up in Packings for Retail
Sale)
• 300440 Medicaments Containing Alkaloids or Derivatives Thereof (Put up in
Packings)
• 300450 Medicaments Containing Vitamins or Other Products of Heading 29.36 (Put
up in Packings)
• 300490 Other Medicaments (Put up in Packings for Retail Sale)
PHARMACEUTICAL INDUSTRY OTHER INDUSTRIES
Public Health
A1 Dosified Medicines
BChemical Inputs of General
Purpose
A2 Bulk Medicines
A3 Inputs specific to the
pharmaceutical industry
C1Hospital and laboratory
inputs
C2Medical technology
equipment
5
A2: Bulk medicines:
• 300310 Medicaments Containing penicillins or derivatives thereof, with a penicillanic
acid structure, or streptomycins or their derivatives
• 300320 Medicaments Containing Other Antibiotics
• 300331 Medicaments Containing Insulin
• 300339 Medicaments Containing Other Hormones
• 300340 Medicaments Containing Alkaloids or Derivatives Thereof
• 300390 Other Medicaments
From a public health perspective these HS subheadings might appear insufficient as they offer little
details, making it difficult to detect the specific amount of certain medicines that are traded. For
example, one might be interested to know which specific medicines, including the name and dosage,
containing insulin were imported. The HS classification at the six digit level leaves these questions
open. Several countries apply more specific goods classifications beyond the six-digit codes.
However, as these codes are not yet harmonized at the international level, it is not possible to use
them for comparative statistical analysis.
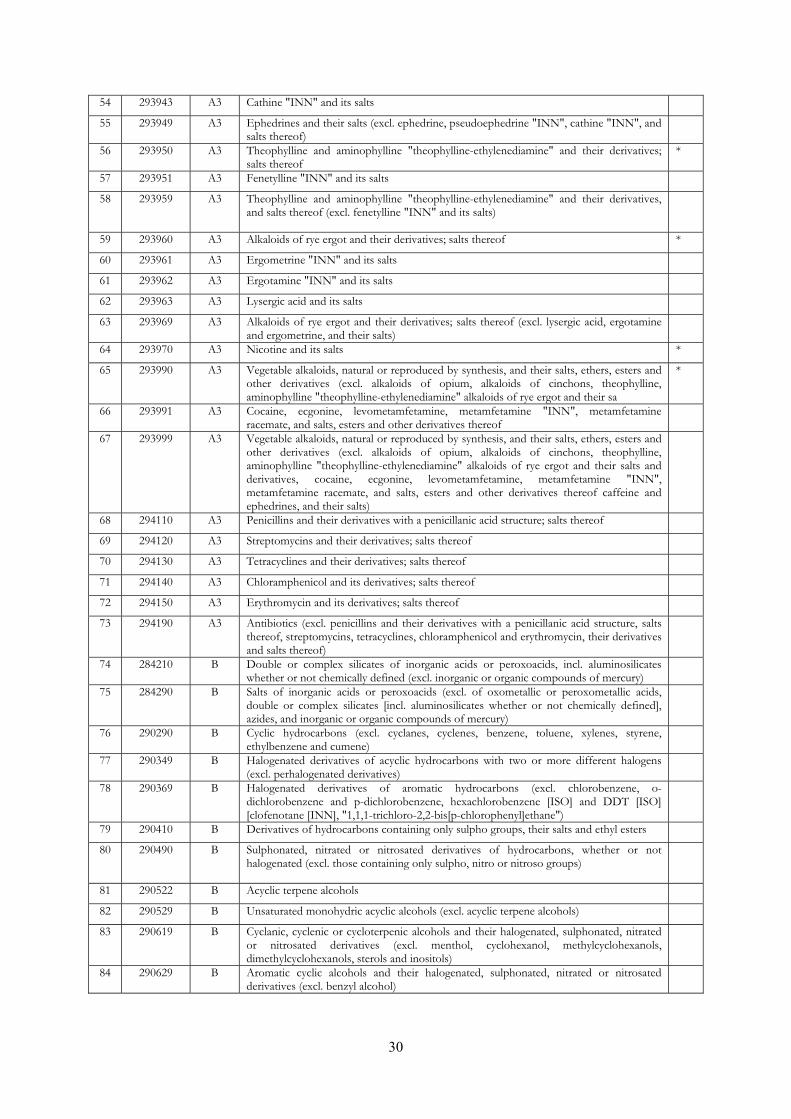
The production of drugs requires certain inputs. The HS classification specifies 57 subheadings which
are used explicitly for the production of pharmaceuticals. These inputs, which we label A3 (Inputs
specific to the pharmaceutical industry), can be found in the following HS headings: 2935, 2936,
2937, 2939, and 2941. A detailed list of the 57 subheadings can be found in the Appendix 1 of this
paper.
(ii) Group B
Obviously, not all inputs used in the production of pharmaceuticals are specific to that sector, but are
also used in other industries. For example, under HS 292142 we find 'Aniline Derivatives', which are
needed for the production of Paracetamol. At the same time, aniline derivates are used since the 19th
century as important ingredients for dyestuffs. Most of these chemicals that are used in the
pharmaceutical industry and beyond fall under the HS Chapter 29 "Organic Chemicals".
There is yet no agreed international definition which formally establishes a list of organic chemicals
that could be considered relevant inputs into the production of pharmaceuticals. At the international
level the "Pharmaceutical Tariff Elimination Agreement" (PTEA) gives some indication which
products might be regarded to be pertinent in this context. The PTEA was concluded in 1994 during
the WTO Uruguay Round and entered into force on 1st, January 1995. Under this agreement, which
6
was signed by nine WTO Members, all parties have eliminated tariffs on all finished pharmaceutical
products.2 For active ingredients and intermediates zero tariffs do not automatically apply, but need to
be added to the list of eligible products. The PTEA therefore contains at the end a detailed list of
products that some or all signatories consider active ingredients and intermediates and thereby grant
duty free market access. We estimate that this list gives some valuable indications of products that
could be considered relevant inputs into the production of medicines. In our analysis we have
therefore included all those subheadings that eight out of the nine signatories have added to the list of
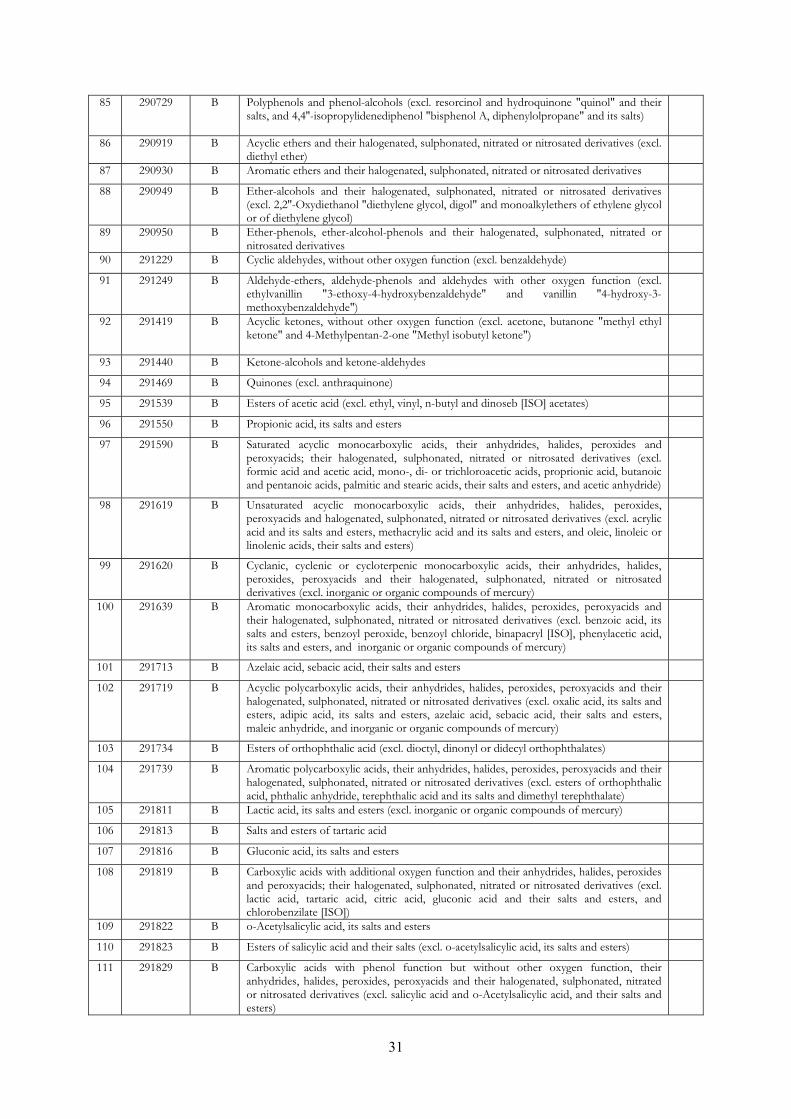
eligible products. In total, product group B is composed of 73 HS subheadings, mostly from chapter
HS 29 (see Appendix 1).3
(iii) Group C
The HS classification holds other goods beyond medicines that can be considered relevant inputs for
public health. First, we have identified hospital and laboratory inputs (C1). Two examples of hospital
inputs are HS subheading 300590: 'Wadding, gauze, bandages and the like', and HS subheading
901831: 'Syringes, with or without needles, used in medical, surgical, dental or veterinary sciences'.
As the last example demonstrates some of these products might not only be used for human health
purposes, but also for the treatment of animals. The question of multiple use becomes even more
apparent for laboratory inputs. For example, HS Code 701710 contains 'Laboratory, hygienic or
pharmaceutical glassware, whether or not graduated or calibrated, of fused quartz or other fused
silica'. In order to limit the problem of multiple use, we have only included those product lines, where
a direct link, such as "pharmaceutical", is included in the product description. Overall group C1
contains 28 HS subheadings (see Appendix 1).
Second, we have identified medical technology equipment (C2), which encompasses all those
products which are used either for diagnosis, such as ultraviolet or infra-red ray apparatuses (HS
901820), or in treatment, such as ozone therapy apparatuses (HS 901920) or artificial joints for
orthopaedic purposes (HS 902111). Overall, group C contains 61 HS subheadings (28 in C1 and in 33
C2).
(iv) Caveats
One of the key challenges when working with the HS classification is that at the six-digit level one
might capture products that are not used exclusively in the health sector, but also in other sectors. A
2Signatories of the agreement were the European Community, US, Switzerland, Japan, Canada,
Norway, Czech Republic, Slovak Republic and Macau. 3We are well aware of the fact that the PTEA is a plurilateral agreement and therefore reflecting only
the views of certain WTO Members. However, in the absence of any other similar international agreements and definition, we consider the PTEA as an important benchmark to identify inputs for pharmaceutical productions based on the HS classification.
7
very stark example of this problem is the case of malaria bed nets. Bed nets are officially imported
under the tariff subheading HS 630493: "Not knitted or crocheted, of synthetic fibres; articles for
interior furnishing, of synthetic fibres (excl. knitted or crocheted, blankets and travelling rugs, bed
linen, table linen, toilet linen, kitchen linen, curtains, incl. drapes, interior blinds, curtain or bed
valances, bedspreads, lampshades and articles of heading 9404)". For many countries, the largest part
of the importations or exportations under HS 630493, both in terms of volume and value, are probably
not malaria bed nets, but blankets, bed linen, etc.
Not only the trade flows recorder under HS 630493 are composed of different products, but also the
custom duties for HS 630493 are an average of all tariff lines that a countries apply at a higher level
of disaggregation to the different products within this specific HS code. As a consequence, the
average custom duties for HS 630493 might appear substantive, even though malaria bed nets might
enter the country duty free. The study of Simon, Larson, Zusman, & Rosen (2002) on the importance
of lowering tariffs on insecticide treated bed nets suffer from this methodological challenge. The
authors themselves state that "the ambiguous nature of the coding systems makes it difficult to
determine accurate tariff rates for ITNs…" (Simon et al., 2002, p. 5). In order to avoid this kind of
problems, we have attempted to include only those subheading for which we had evidence that the use
is predominantly for public health purposes or that included goods of multiple use, health being one of
them (such as laboratory equipment). Following this logic, we decided to exclude the tariff headings
such as HS 630493 from our sample.
Overall, the drawbacks of working with the HS subheadings are mainly twofold. First, as the example
of the bed nets illustrates, a particular HS subheading might cover in its majority non-health related
products. In order to guarantee a certain level of accuracy in the trade flows that we measure and that
are related to public health, we find ourselves obliged to ignore international trade in some goods that
actually do enter the public health space.
Second, in case products have multiple uses, and only one being for public health, we include in our
trade statistics products which do not enter in their entirety the public health domain. The commodity
group B (Chemical inputs of general purpose) is a good example for this problem, as chemical inputs
of general purpose are needed in very many sectors.
In summary, using the HS classification at the six-digit (subheading) level we are on the one hand
unable to capture all trade flows that contribute to public health, and on the other hand, we overstate
some trade flows, since we are unable to fully discriminate between trade flows related to public
health and those that are unrelated. The trade and tariff statistics that are presented in the sections
below should therefore be interpreted with caution.
8
Another caveat when interpreting the data in the subsequent sections concerns the units used to
measure trade. International trade statisticts are typically recorded in national currencies and then
converted into current US Dollars. It is common practice to compare trade flows across time without
adjusting for US inflation, which we follow in this paper. According to the US Consumer Price Index
data, the inflation in the United States was between 1.6 and 3.8 per cent annually between the years
1995 to 2008 and minus 0.4 in 2009.4 The compounded inflation rate from 1995 to 2009 was 28.1 per
cent, in other words, the value of trade flows in 2009 would need to be divided by 1.281 in order to
compare them with the value of trade flows in 1995. In the following sections, we present yearly trade
data and growth rates for the periods 1995 to 2009 without inflation adjustment. The yearly growth
rates would have to be adjusted on average by around 1.7 per cent in order to obtain the inflation-
adjusted value.
III. RESULTS
A. INTERNATIONAL TRADE IN HEALTH PRODUCTS FROM 1995 TO 2009
1. General Overview of Trade Data
Let us first start with some general trade statistics. Graph 1 depicts the evolution of trade (measured in
total imports) in all three commodity groups (A, B, and C) among 167 countries (see Appendix 2)
from 1995 to 2009.5 The first observation is that overall trade in health products grew substantially
from 92 billion USD in 1995 to about 419 billion USD in 2009, which equals an annual growth rate of
about 11.5 per cent. Compared to the average growth rate of overall world trade, which has been
around 6 per cent per year (measured in current US Dollars),6 international trade in health products
thus developed particularly strongly. In 2009, trade in health products (commodity groups A, B plus
C) represented 3.7 per cent of total international merchandise trade (not depicted in graph).
4 http://www.usinflationcalculator.com/inflation/consumer-price-index-and-annual-percent-changes-
from-1913-to-2008/ 5 At the time of writing this study (July 2011), not all countries had reported their trade flows for 2010. 6 The annual growth rate of world merchandise trade in value terms was about 6.1 per cent according to
the WTO Statistics Database.
9
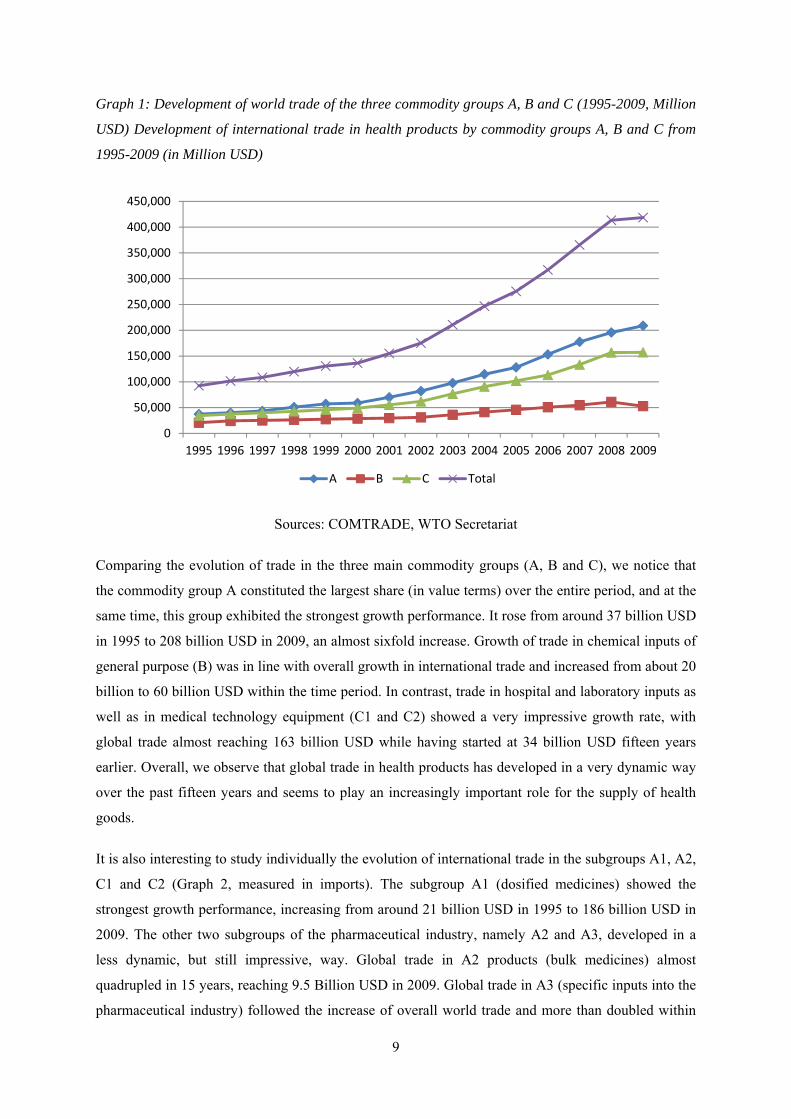
Graph 1: Development of world trade of the three commodity groups A, B and C (1995-2009, Million
USD) Development of international trade in health products by commodity groups A, B and C from
1995-2009 (in Million USD)
Sources: COMTRADE, WTO Secretariat
Comparing the evolution of trade in the three main commodity groups (A, B and C), we notice that
the commodity group A constituted the largest share (in value terms) over the entire period, and at the
same time, this group exhibited the strongest growth performance. It rose from around 37 billion USD
in 1995 to 208 billion USD in 2009, an almost sixfold increase. Growth of trade in chemical inputs of
general purpose (B) was in line with overall growth in international trade and increased from about 20
billion to 60 billion USD within the time period. In contrast, trade in hospital and laboratory inputs as
well as in medical technology equipment (C1 and C2) showed a very impressive growth rate, with
global trade almost reaching 163 billion USD while having started at 34 billion USD fifteen years
earlier. Overall, we observe that global trade in health products has developed in a very dynamic way
over the past fifteen years and seems to play an increasingly important role for the supply of health
goods.
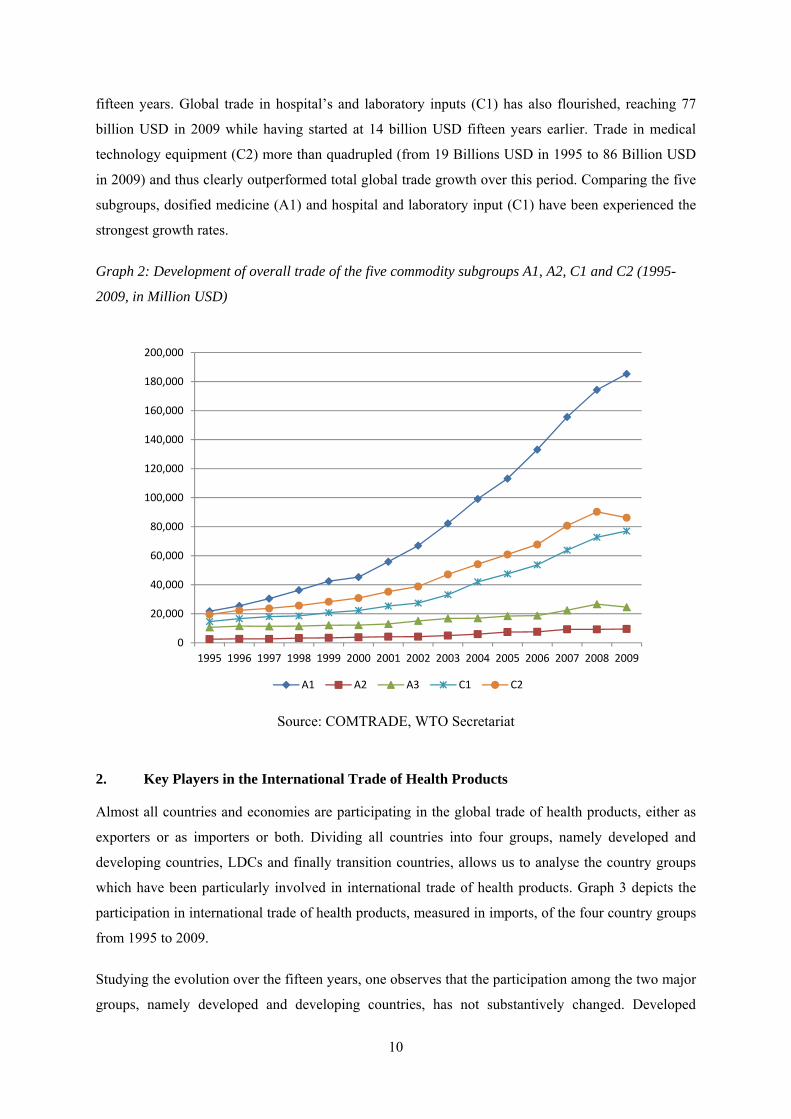
It is also interesting to study individually the evolution of international trade in the subgroups A1, A2,
C1 and C2 (Graph 2, measured in imports). The subgroup A1 (dosified medicines) showed the
strongest growth performance, increasing from around 21 billion USD in 1995 to 186 billion USD in
2009. The other two subgroups of the pharmaceutical industry, namely A2 and A3, developed in a
less dynamic, but still impressive, way. Global trade in A2 products (bulk medicines) almost
quadrupled in 15 years, reaching 9.5 Billion USD in 2009. Global trade in A3 (specific inputs into the
pharmaceutical industry) followed the increase of overall world trade and more than doubled within
0
50,000
100,000
150,000
200,000
250,000
300,000
350,000
400,000
450,000
1995 1996 1997 1998 1999 2000 2001 2002 2003 2004 2005 2006 2007 2008 2009
A B C Total
10
fifteen years. Global trade in hospital’s and laboratory inputs (C1) has also flourished, reaching 77
billion USD in 2009 while having started at 14 billion USD fifteen years earlier. Trade in medical
technology equipment (C2) more than quadrupled (from 19 Billions USD in 1995 to 86 Billion USD
in 2009) and thus clearly outperformed total global trade growth over this period. Comparing the five
subgroups, dosified medicine (A1) and hospital and laboratory input (C1) have been experienced the
strongest growth rates.
Graph 2: Development of overall trade of the five commodity subgroups A1, A2, C1 and C2 (1995-
2009, in Million USD)
Source: COMTRADE, WTO Secretariat
2. Key Players in the International Trade of Health Products
Almost all countries and economies are participating in the global trade of health products, either as
exporters or as importers or both. Dividing all countries into four groups, namely developed and
developing countries, LDCs and finally transition countries, allows us to analyse the country groups
which have been particularly involved in international trade of health products. Graph 3 depicts the
participation in international trade of health products, measured in imports, of the four country groups
from 1995 to 2009.
Studying the evolution over the fifteen years, one observes that the participation among the two major
groups, namely developed and developing countries, has not substantively changed. Developed
0
20,000
40,000
60,000
80,000
100,000
120,000
140,000
160,000
180,000
200,000
1995 1996 1997 1998 1999 2000 2001 2002 2003 2004 2005 2006 2007 2008 2009
A1 A2 A3 C1 C2
11
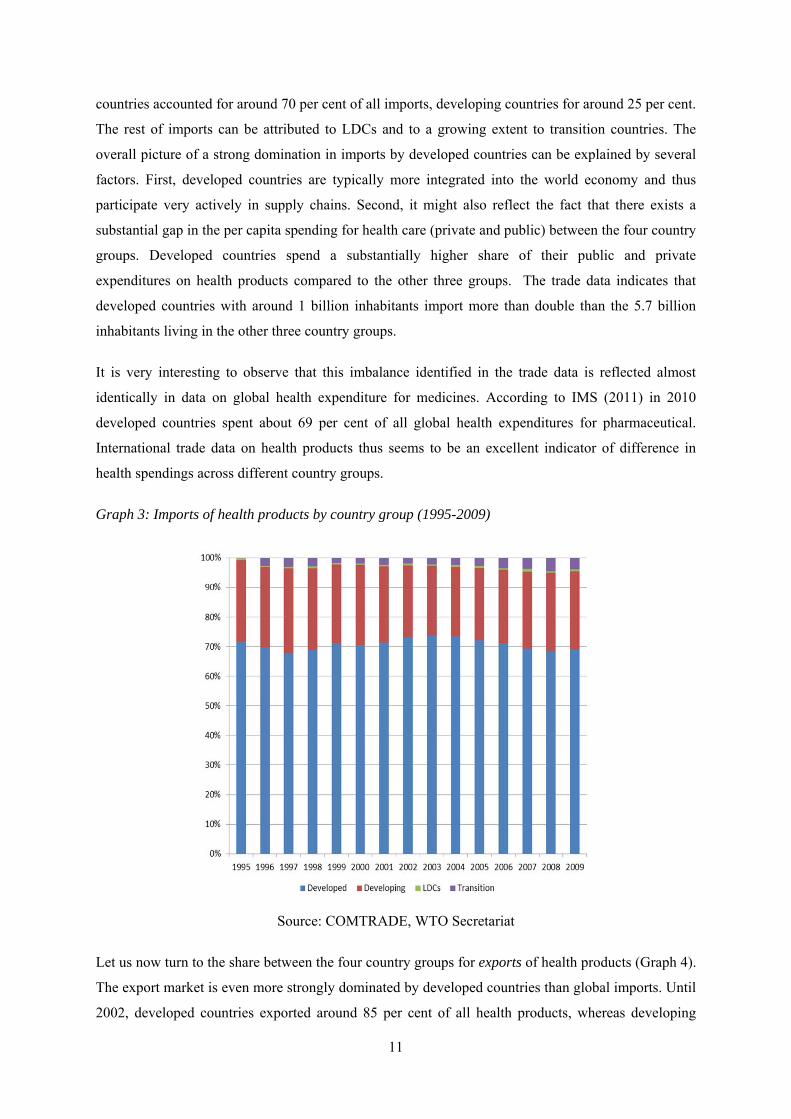
countries accounted for around 70 per cent of all imports, developing countries for around 25 per cent.
The rest of imports can be attributed to LDCs and to a growing extent to transition countries. The
overall picture of a strong domination in imports by developed countries can be explained by several
factors. First, developed countries are typically more integrated into the world economy and thus
participate very actively in supply chains. Second, it might also reflect the fact that there exists a
substantial gap in the per capita spending for health care (private and public) between the four country
groups. Developed countries spend a substantially higher share of their public and private
expenditures on health products compared to the other three groups. The trade data indicates that
developed countries with around 1 billion inhabitants import more than double than the 5.7 billion
inhabitants living in the other three country groups.
It is very interesting to observe that this imbalance identified in the trade data is reflected almost
identically in data on global health expenditure for medicines. According to IMS (2011) in 2010
developed countries spent about 69 per cent of all global health expenditures for pharmaceutical.
International trade data on health products thus seems to be an excellent indicator of difference in
health spendings across different country groups.
Graph 3: Imports of health products by country group (1995-2009)
Source: COMTRADE, WTO Secretariat
Let us now turn to the share between the four country groups for exports of health products (Graph 4).
The export market is even more strongly dominated by developed countries than global imports. Until
2002, developed countries exported around 85 per cent of all health products, whereas developing
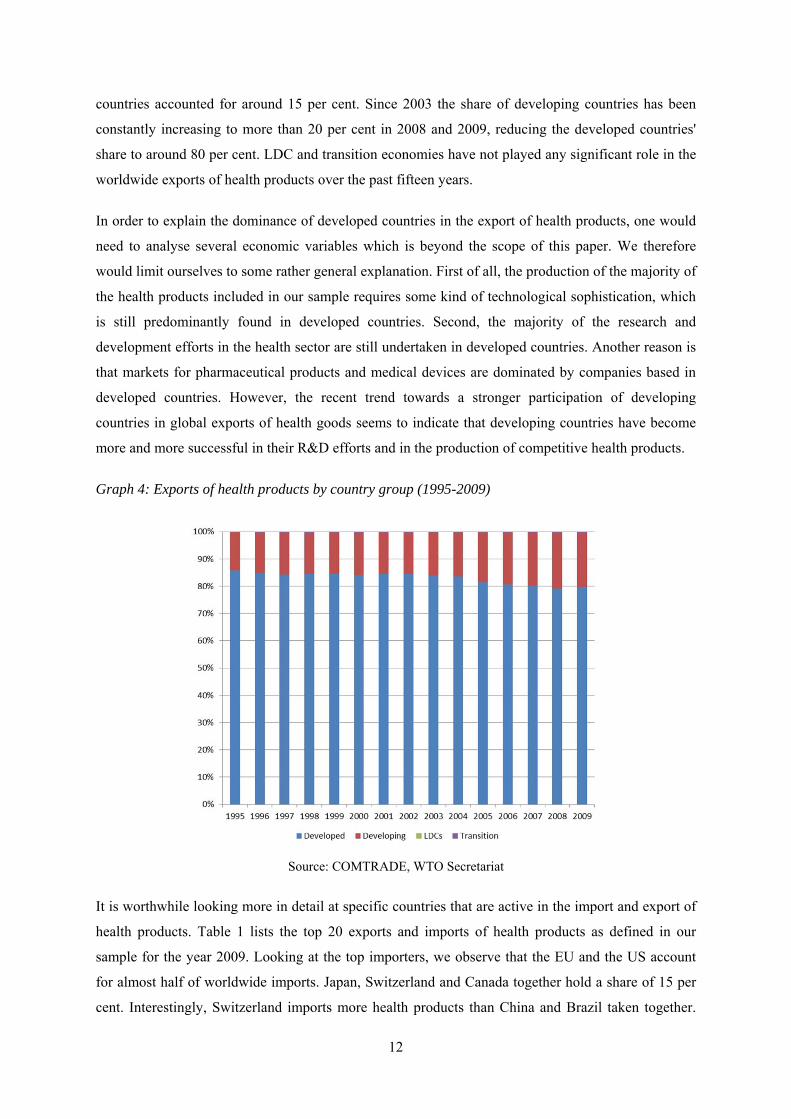
12
countries accounted for around 15 per cent. Since 2003 the share of developing countries has been
constantly increasing to more than 20 per cent in 2008 and 2009, reducing the developed countries'
share to around 80 per cent. LDC and transition economies have not played any significant role in the
worldwide exports of health products over the past fifteen years.
In order to explain the dominance of developed countries in the export of health products, one would
need to analyse several economic variables which is beyond the scope of this paper. We therefore
would limit ourselves to some rather general explanation. First of all, the production of the majority of
the health products included in our sample requires some kind of technological sophistication, which
is still predominantly found in developed countries. Second, the majority of the research and
development efforts in the health sector are still undertaken in developed countries. Another reason is
that markets for pharmaceutical products and medical devices are dominated by companies based in
developed countries. However, the recent trend towards a stronger participation of developing
countries in global exports of health goods seems to indicate that developing countries have become
more and more successful in their R&D efforts and in the production of competitive health products.
Graph 4: Exports of health products by country group (1995-2009)
Source: COMTRADE, WTO Secretariat
It is worthwhile looking more in detail at specific countries that are active in the import and export of
health products. Table 1 lists the top 20 exports and imports of health products as defined in our
sample for the year 2009. Looking at the top importers, we observe that the EU and the US account
for almost half of worldwide imports. Japan, Switzerland and Canada together hold a share of 15 per
cent. Interestingly, Switzerland imports more health products than China and Brazil taken together.
13
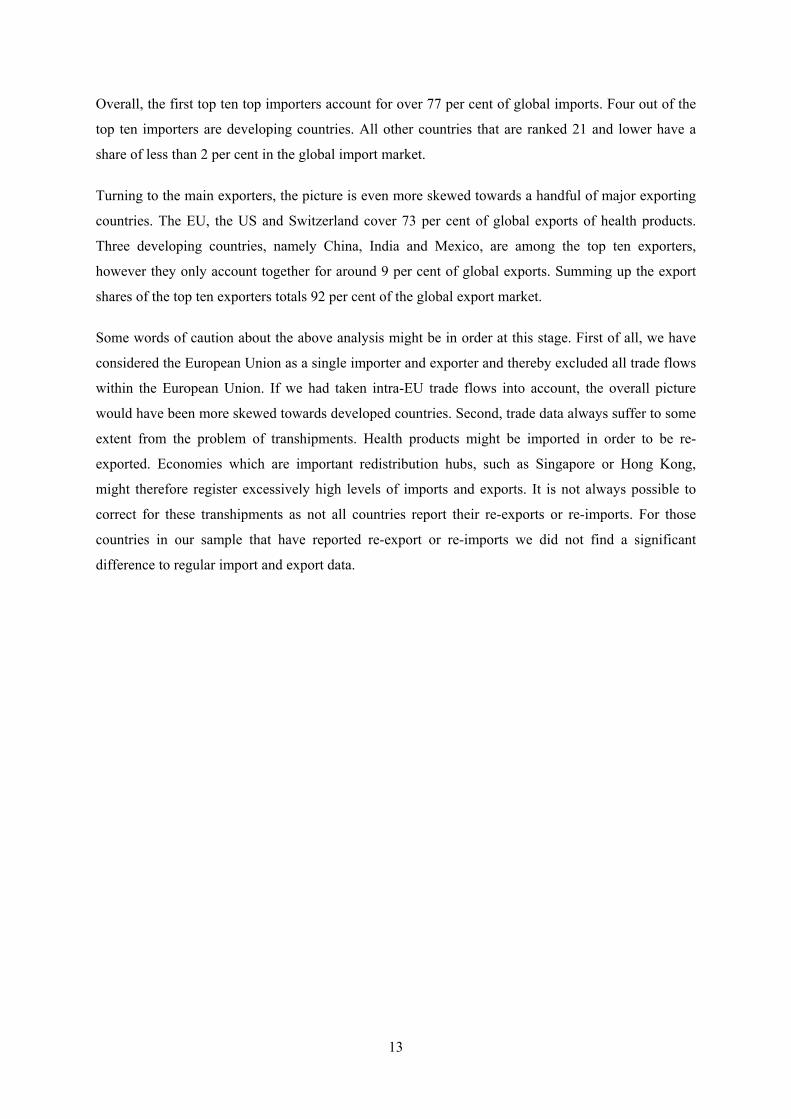
Overall, the first top ten top importers account for over 77 per cent of global imports. Four out of the
top ten importers are developing countries. All other countries that are ranked 21 and lower have a
share of less than 2 per cent in the global import market.
Turning to the main exporters, the picture is even more skewed towards a handful of major exporting
countries. The EU, the US and Switzerland cover 73 per cent of global exports of health products.
Three developing countries, namely China, India and Mexico, are among the top ten exporters,
however they only account together for around 9 per cent of global exports. Summing up the export
shares of the top ten exporters totals 92 per cent of the global export market.
Some words of caution about the above analysis might be in order at this stage. First of all, we have
considered the European Union as a single importer and exporter and thereby excluded all trade flows
within the European Union. If we had taken intra-EU trade flows into account, the overall picture
would have been more skewed towards developed countries. Second, trade data always suffer to some
extent from the problem of transhipments. Health products might be imported in order to be re-
exported. Economies which are important redistribution hubs, such as Singapore or Hong Kong,
might therefore register excessively high levels of imports and exports. It is not always possible to
correct for these transhipments as not all countries report their re-exports or re-imports. For those
countries in our sample that have reported re-export or re-imports we did not find a significant
difference to regular import and export data.
14
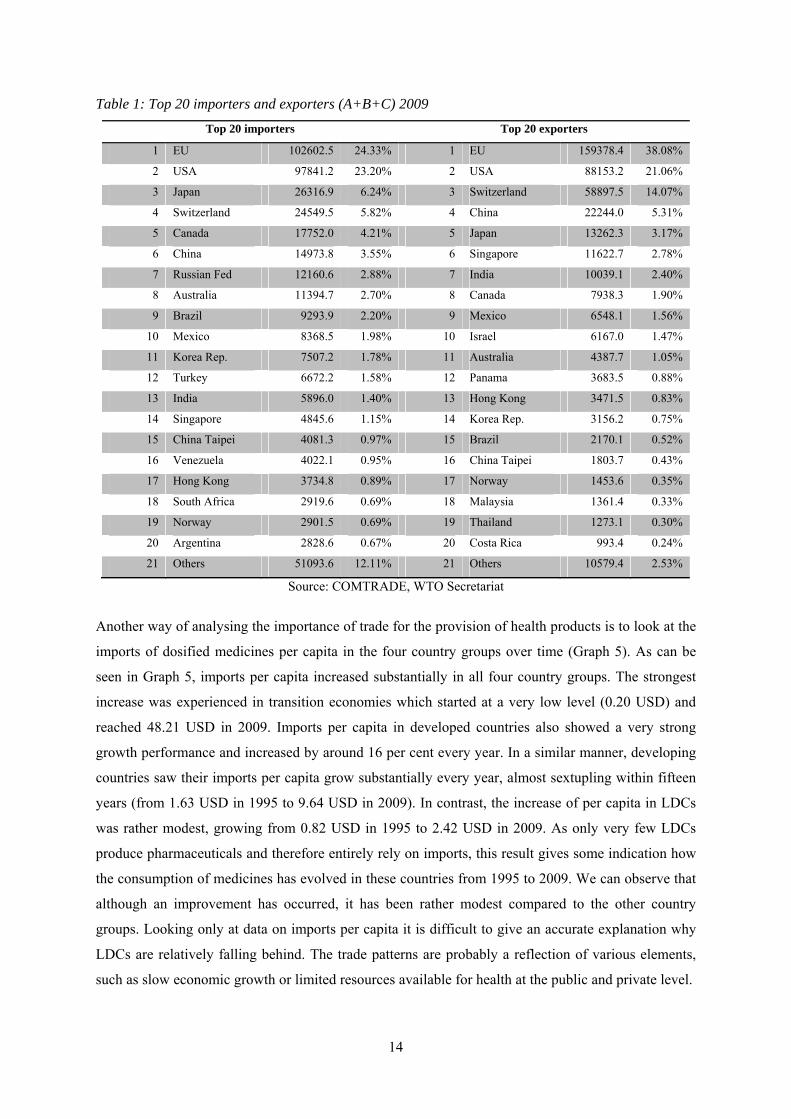
Table 1: Top 20 importers and exporters (A+B+C) 2009
Top 20 importers Top 20 exporters
1 EU 102602.5 24.33% 1 EU 159378.4 38.08%
2 USA 97841.2 23.20% 2 USA 88153.2 21.06%
3 Japan 26316.9 6.24% 3 Switzerland 58897.5 14.07%
4 Switzerland 24549.5 5.82% 4 China 22244.0 5.31%
5 Canada 17752.0 4.21% 5 Japan 13262.3 3.17%
6 China 14973.8 3.55% 6 Singapore 11622.7 2.78%
7 Russian Fed 12160.6 2.88% 7 India 10039.1 2.40%
8 Australia 11394.7 2.70% 8 Canada 7938.3 1.90%
9 Brazil 9293.9 2.20% 9 Mexico 6548.1 1.56%
10 Mexico 8368.5 1.98% 10 Israel 6167.0 1.47%
11 Korea Rep. 7507.2 1.78% 11 Australia 4387.7 1.05%
12 Turkey 6672.2 1.58% 12 Panama 3683.5 0.88%
13 India 5896.0 1.40% 13 Hong Kong 3471.5 0.83%
14 Singapore 4845.6 1.15% 14 Korea Rep. 3156.2 0.75%
15 China Taipei 4081.3 0.97% 15 Brazil 2170.1 0.52%
16 Venezuela 4022.1 0.95% 16 China Taipei 1803.7 0.43%
17 Hong Kong 3734.8 0.89% 17 Norway 1453.6 0.35%
18 South Africa 2919.6 0.69% 18 Malaysia 1361.4 0.33%
19 Norway 2901.5 0.69% 19 Thailand 1273.1 0.30%
20 Argentina 2828.6 0.67% 20 Costa Rica 993.4 0.24%
21 Others 51093.6 12.11% 21 Others 10579.4 2.53%
Source: COMTRADE, WTO Secretariat
Another way of analysing the importance of trade for the provision of health products is to look at the
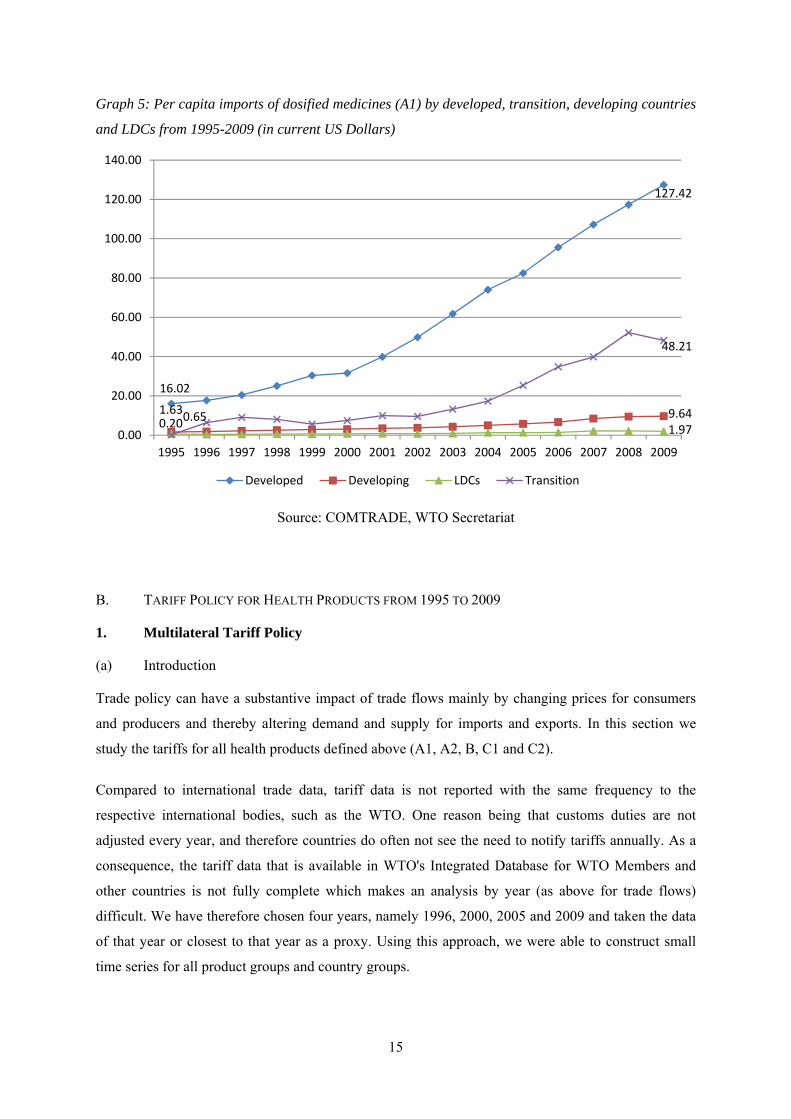
imports of dosified medicines per capita in the four country groups over time (Graph 5). As can be
seen in Graph 5, imports per capita increased substantially in all four country groups. The strongest
increase was experienced in transition economies which started at a very low level (0.20 USD) and
reached 48.21 USD in 2009. Imports per capita in developed countries also showed a very strong
growth performance and increased by around 16 per cent every year. In a similar manner, developing
countries saw their imports per capita grow substantially every year, almost sextupling within fifteen
years (from 1.63 USD in 1995 to 9.64 USD in 2009). In contrast, the increase of per capita in LDCs
was rather modest, growing from 0.82 USD in 1995 to 2.42 USD in 2009. As only very few LDCs
produce pharmaceuticals and therefore entirely rely on imports, this result gives some indication how
the consumption of medicines has evolved in these countries from 1995 to 2009. We can observe that
although an improvement has occurred, it has been rather modest compared to the other country
groups. Looking only at data on imports per capita it is difficult to give an accurate explanation why
LDCs are relatively falling behind. The trade patterns are probably a reflection of various elements,
such as slow economic growth or limited resources available for health at the public and private level.
15
Graph 5: Per capita imports of dosified medicines (A1) by developed, transition, developing countries
and LDCs from 1995-2009 (in current US Dollars)
Source: COMTRADE, WTO Secretariat
B. TARIFF POLICY FOR HEALTH PRODUCTS FROM 1995 TO 2009
1. Multilateral Tariff Policy
(a) Introduction
Trade policy can have a substantive impact of trade flows mainly by changing prices for consumers
and producers and thereby altering demand and supply for imports and exports. In this section we
study the tariffs for all health products defined above (A1, A2, B, C1 and C2).
Compared to international trade data, tariff data is not reported with the same frequency to the
respective international bodies, such as the WTO. One reason being that customs duties are not
adjusted every year, and therefore countries do often not see the need to notify tariffs annually. As a
consequence, the tariff data that is available in WTO's Integrated Database for WTO Members and
other countries is not fully complete which makes an analysis by year (as above for trade flows)
difficult. We have therefore chosen four years, namely 1996, 2000, 2005 and 2009 and taken the data
of that year or closest to that year as a proxy. Using this approach, we were able to construct small
time series for all product groups and country groups.
16.02
127.42
1.63 9.640.651.970.20
48.21
0.00
20.00
40.00
60.00
80.00
100.00
120.00
140.00
1995 1996 1997 1998 1999 2000 2001 2002 2003 2004 2005 2006 2007 2008 2009
Developed Developing LDCs Transition
16
An important conceptual distinction to be made when it comes to tariffs is the difference between
bound and applied tariffs. All WTO Members have mutually committed themselves to guarantee a
certain level of market access, which typically translates into a specific level of tariff rates (customs
duty) for goods' trade. According to WTO rules, once a Member has made a commitment towards
other Members not to increase a rate of customs duty beyond an agreed level, it cannot raise it without
compensating the affected parties. In other words, once a WTO Member has bound its tariff at the
WTO, it cannot easily break this commitment. Developed country Members have bound 99 per cent
of their product lines and developing country Members 73 per cent. WTO Members are obviously
allowed to charge customs duties lower than the bound rates. These tariff rates, called applied rates,
can be subject to changes, but the bound rates serve as upper ceilings. In the following, we will first
analyse the evolution of applied tariff rates and we then study the difference between applied and
bound tariff rates.
The data presented below only includes tariff data from WTO Members and other countries for which
information is available in the WTO Integrated Database. For some countries tariff data is not
available for any of the four points in time, and therefore these countries are excluded from our
sample (see Appendix 3 for list of countries included). The tariff data for each commodity group is
trade weighted, meaning that tariffs levied on larger imports are given more weight compared to
smaller imports.
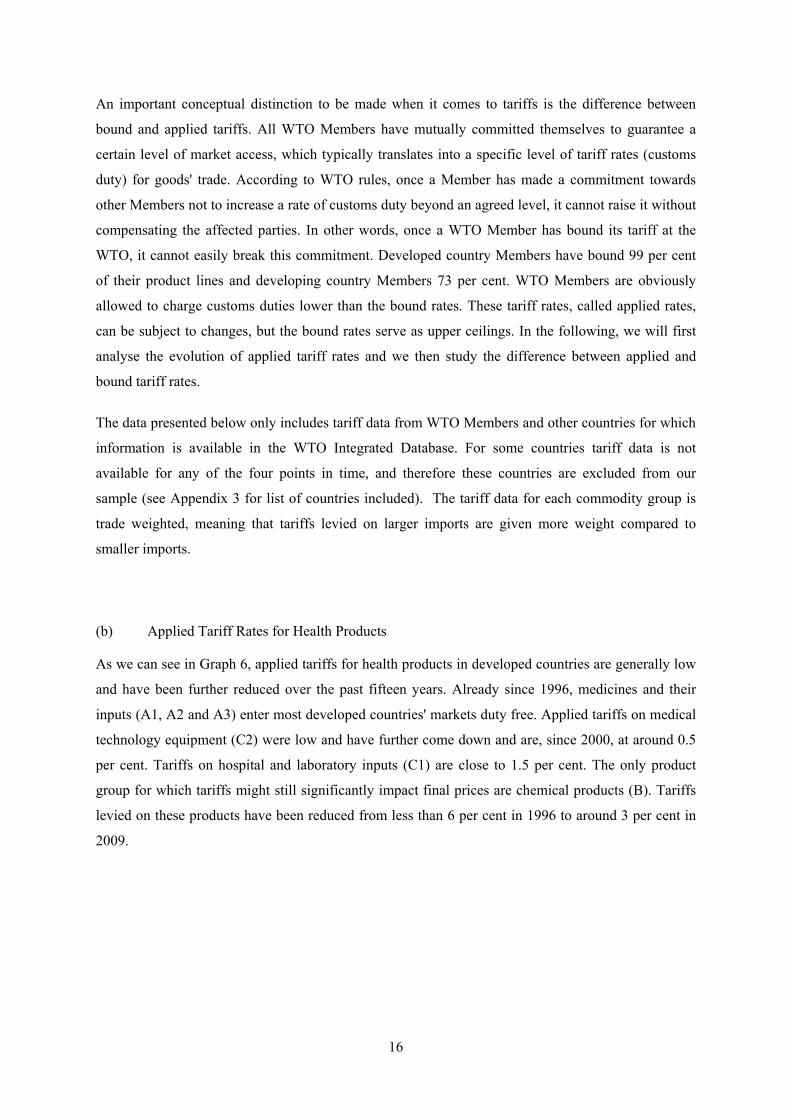
(b) Applied Tariff Rates for Health Products
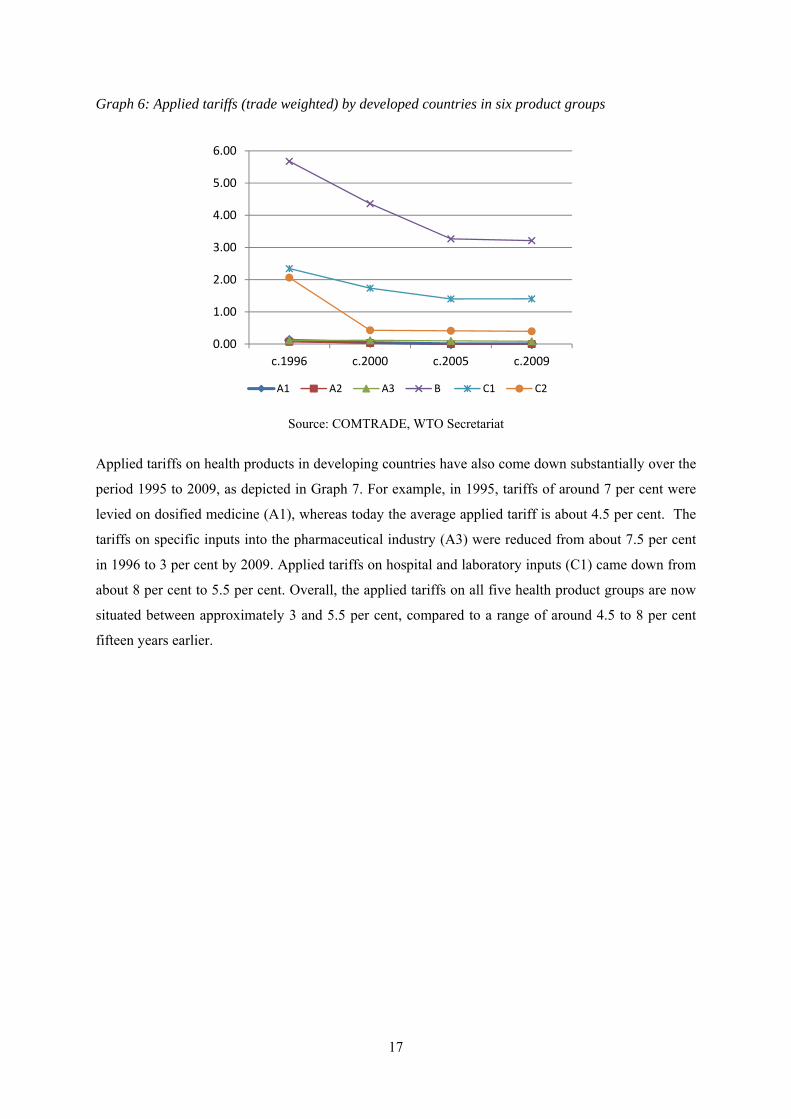
As we can see in Graph 6, applied tariffs for health products in developed countries are generally low
and have been further reduced over the past fifteen years. Already since 1996, medicines and their
inputs (A1, A2 and A3) enter most developed countries' markets duty free. Applied tariffs on medical
technology equipment (C2) were low and have further come down and are, since 2000, at around 0.5
per cent. Tariffs on hospital and laboratory inputs (C1) are close to 1.5 per cent. The only product
group for which tariffs might still significantly impact final prices are chemical products (B). Tariffs
levied on these products have been reduced from less than 6 per cent in 1996 to around 3 per cent in
2009.
17
Graph 6: Applied tariffs (trade weighted) by developed countries in six product groups
Source: COMTRADE, WTO Secretariat
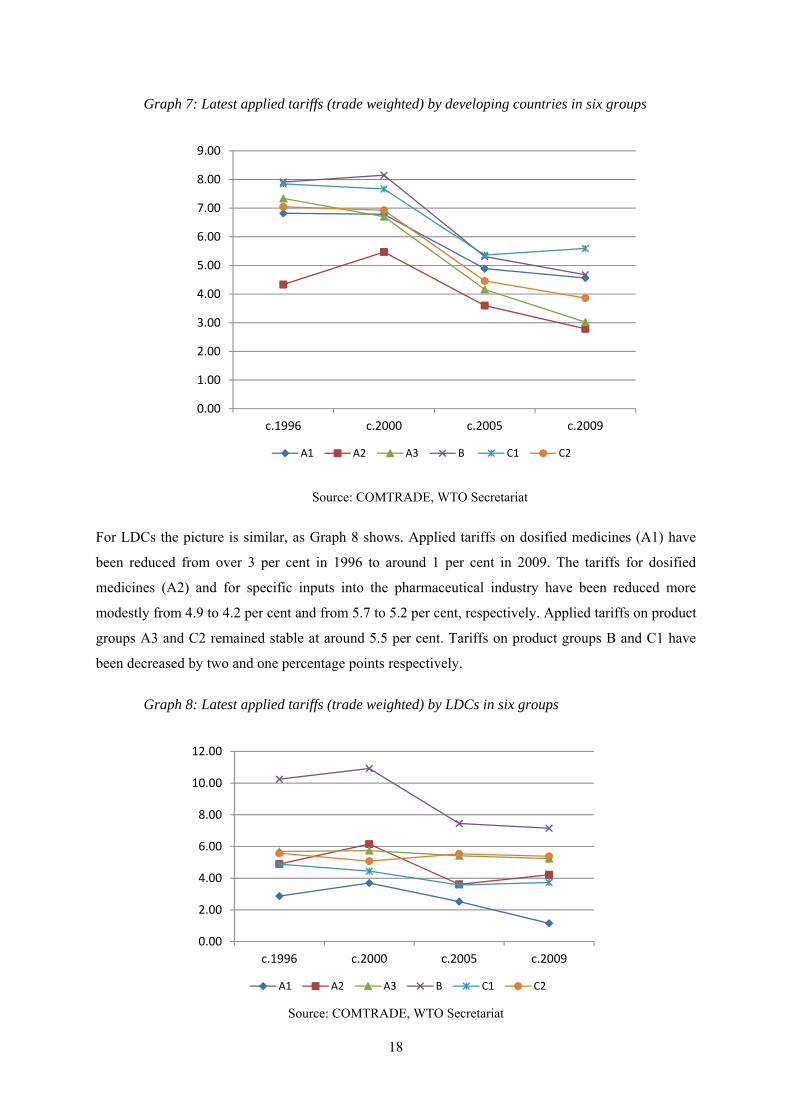
Applied tariffs on health products in developing countries have also come down substantially over the
period 1995 to 2009, as depicted in Graph 7. For example, in 1995, tariffs of around 7 per cent were
levied on dosified medicine (A1), whereas today the average applied tariff is about 4.5 per cent. The
tariffs on specific inputs into the pharmaceutical industry (A3) were reduced from about 7.5 per cent
in 1996 to 3 per cent by 2009. Applied tariffs on hospital and laboratory inputs (C1) came down from
about 8 per cent to 5.5 per cent. Overall, the applied tariffs on all five health product groups are now
situated between approximately 3 and 5.5 per cent, compared to a range of around 4.5 to 8 per cent
fifteen years earlier.
0.00
1.00
2.00
3.00
4.00
5.00
6.00
c.1996 c.2000 c.2005 c.2009
A1 A2 A3 B C1 C2
18
Graph 7: Latest applied tariffs (trade weighted) by developing countries in six groups
Source: COMTRADE, WTO Secretariat
For LDCs the picture is similar, as Graph 8 shows. Applied tariffs on dosified medicines (A1) have
been reduced from over 3 per cent in 1996 to around 1 per cent in 2009. The tariffs for dosified
medicines (A2) and for specific inputs into the pharmaceutical industry have been reduced more
modestly from 4.9 to 4.2 per cent and from 5.7 to 5.2 per cent, respectively. Applied tariffs on product
groups A3 and C2 remained stable at around 5.5 per cent. Tariffs on product groups B and C1 have
been decreased by two and one percentage points respectively.
Graph 8: Latest applied tariffs (trade weighted) by LDCs in six groups
Source: COMTRADE, WTO Secretariat
0.00
1.00
2.00
3.00
4.00
5.00
6.00
7.00
8.00
9.00
c.1996 c.2000 c.2005 c.2009
A1 A2 A3 B C1 C2
0.00
2.00
4.00
6.00
8.00
10.00
12.00
c.1996 c.2000 c.2005 c.2009
A1 A2 A3 B C1 C2
19
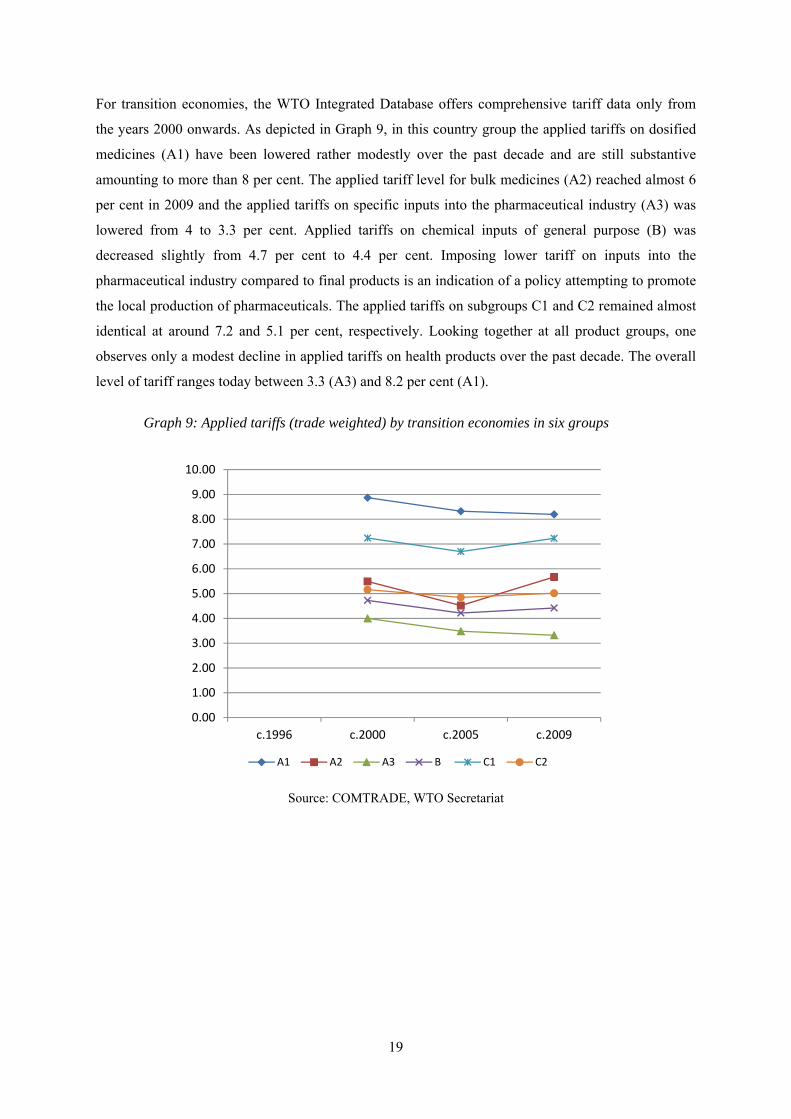
For transition economies, the WTO Integrated Database offers comprehensive tariff data only from
the years 2000 onwards. As depicted in Graph 9, in this country group the applied tariffs on dosified
medicines (A1) have been lowered rather modestly over the past decade and are still substantive
amounting to more than 8 per cent. The applied tariff level for bulk medicines (A2) reached almost 6
per cent in 2009 and the applied tariffs on specific inputs into the pharmaceutical industry (A3) was
lowered from 4 to 3.3 per cent. Applied tariffs on chemical inputs of general purpose (B) was
decreased slightly from 4.7 per cent to 4.4 per cent. Imposing lower tariff on inputs into the
pharmaceutical industry compared to final products is an indication of a policy attempting to promote
the local production of pharmaceuticals. The applied tariffs on subgroups C1 and C2 remained almost
identical at around 7.2 and 5.1 per cent, respectively. Looking together at all product groups, one
observes only a modest decline in applied tariffs on health products over the past decade. The overall
level of tariff ranges today between 3.3 (A3) and 8.2 per cent (A1).
Graph 9: Applied tariffs (trade weighted) by transition economies in six groups
Source: COMTRADE, WTO Secretariat
0.00
1.00
2.00
3.00
4.00
5.00
6.00
7.00
8.00
9.00
10.00
c.1996 c.2000 c.2005 c.2009
A1 A2 A3 B C1 C2
20
In summary, the tariff rates applied on health products by the four country groups have decreased over
the past fifteen years. In developed countries and in LDCs applied tariffs on medicines (A1 and A2)
seem to be either zero or negligibly low, whereas in developing countries and transition economies
they apparently still play an important role. All four country groups keep applied tariffs between 3.2
and 7.3 per cent on chemical inputs of general purpose (B). As for C1 (hospital and laboratory inputs)
and C2 (medical technology equipment), all country groups apply higher tariffs for C1 than C2,
except for LDCs. It is not straightforward to explain this observation, as C2 contains more final
products than C1 and in case of tariff escalation should have the higher tariff level. Overall, we
observe that applied tariffs on health products are low, however, in all country groups there is room
for further lowering tariffs and thus for improving access.
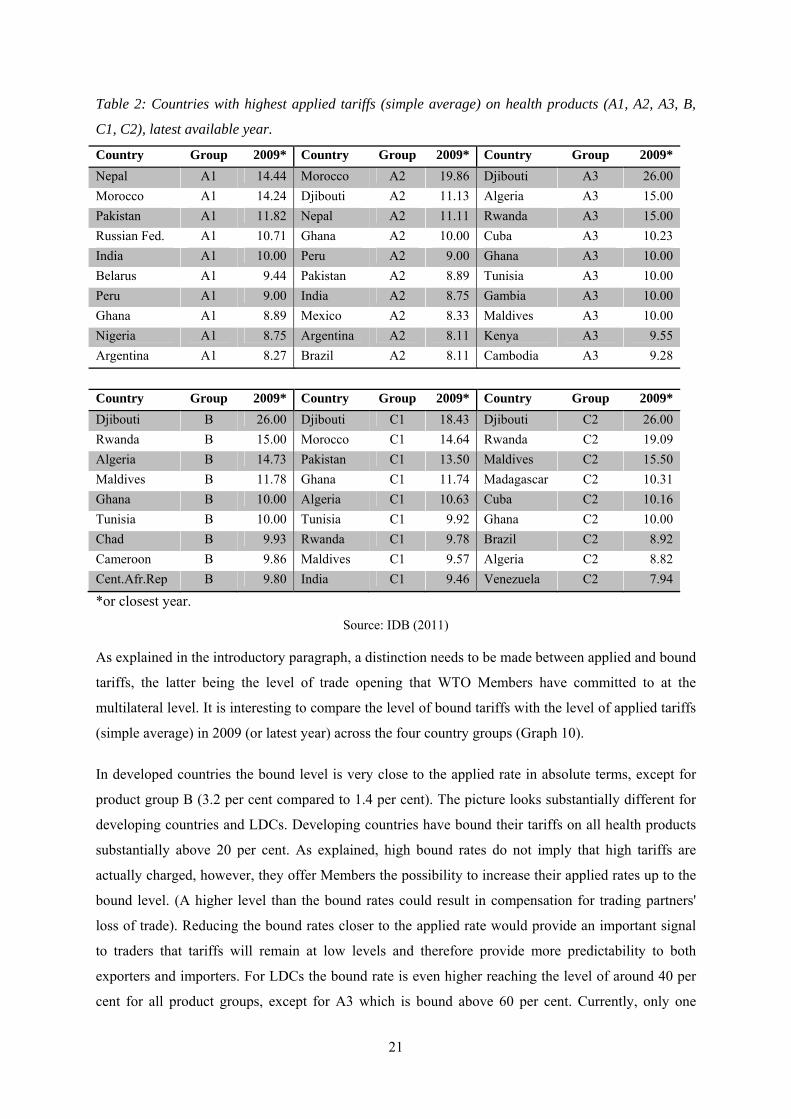
Instead of studying country groups, one might be interested in knowing the level of applied tariff
levied by individual countries. Table 2 lists the ten countries which apply the highest import duties on
health products in the six product (sub) groups. For dosified medicines (A1) Nepal, Morocco,
Pakistan, the Russian Federation and India impose tariffs above 10 per cent. Bulk medicines are
subject to tariffs above 10 per cent in Morocco, Dijbouti, Nepal and Ghana. Dijbouti leads the list of
A3 products, imposing custom duties of 26 per cent. Eight out of ten countries in subgroup A3 are
located in Africa. This finding becomes even starker for group B, where all top ten countries are in
Africa, with Dijbouti, Rwanda and Algeria ranging at the top of the list. Dijbouti is also at the top of
the list for medical technologies (C1 and C2). For the two subgroup, five countries levy custom duties
above ten per cent. Overall, we observe that some countries appear in several rankings, such as Ghana
which is present in all six categories; Dijbouti comes up five time and is often ranked at the top;
Maldives and Rwanda are listed four times. It seems difficult to understand why these rather small
countries maintain relatively high tariffs on health products and thereby pushing up domestic prices
for these products. This is even more surprising when considering that these countries have no or only
a small domestic production of these goods.
21
Table 2: Countries with highest applied tariffs (simple average) on health products (A1, A2, A3, B,
C1, C2), latest available year.
Country Group 2009* Country Group 2009* Country Group 2009*
Nepal A1 14.44 Morocco A2 19.86 Djibouti A3 26.00
Morocco A1 14.24 Djibouti A2 11.13 Algeria A3 15.00
Pakistan A1 11.82 Nepal A2 11.11 Rwanda A3 15.00
Russian Fed. A1 10.71 Ghana A2 10.00 Cuba A3 10.23
India A1 10.00 Peru A2 9.00 Ghana A3 10.00
Belarus A1 9.44 Pakistan A2 8.89 Tunisia A3 10.00
Peru A1 9.00 India A2 8.75 Gambia A3 10.00
Ghana A1 8.89 Mexico A2 8.33 Maldives A3 10.00
Nigeria A1 8.75 Argentina A2 8.11 Kenya A3 9.55
Argentina A1 8.27 Brazil A2 8.11 Cambodia A3 9.28
Country Group 2009* Country Group 2009* Country Group 2009*
Djibouti B 26.00 Djibouti C1 18.43 Djibouti C2 26.00
Rwanda B 15.00 Morocco C1 14.64 Rwanda C2 19.09
Algeria B 14.73 Pakistan C1 13.50 Maldives C2 15.50
Maldives B 11.78 Ghana C1 11.74 Madagascar C2 10.31
Ghana B 10.00 Algeria C1 10.63 Cuba C2 10.16
Tunisia B 10.00 Tunisia C1 9.92 Ghana C2 10.00
Chad B 9.93 Rwanda C1 9.78 Brazil C2 8.92
Cameroon B 9.86 Maldives C1 9.57 Algeria C2 8.82
Cent.Afr.Rep B 9.80 India C1 9.46 Venezuela C2 7.94
*or closest year.
Source: IDB (2011)
As explained in the introductory paragraph, a distinction needs to be made between applied and bound
tariffs, the latter being the level of trade opening that WTO Members have committed to at the
multilateral level. It is interesting to compare the level of bound tariffs with the level of applied tariffs
(simple average) in 2009 (or latest year) across the four country groups (Graph 10).
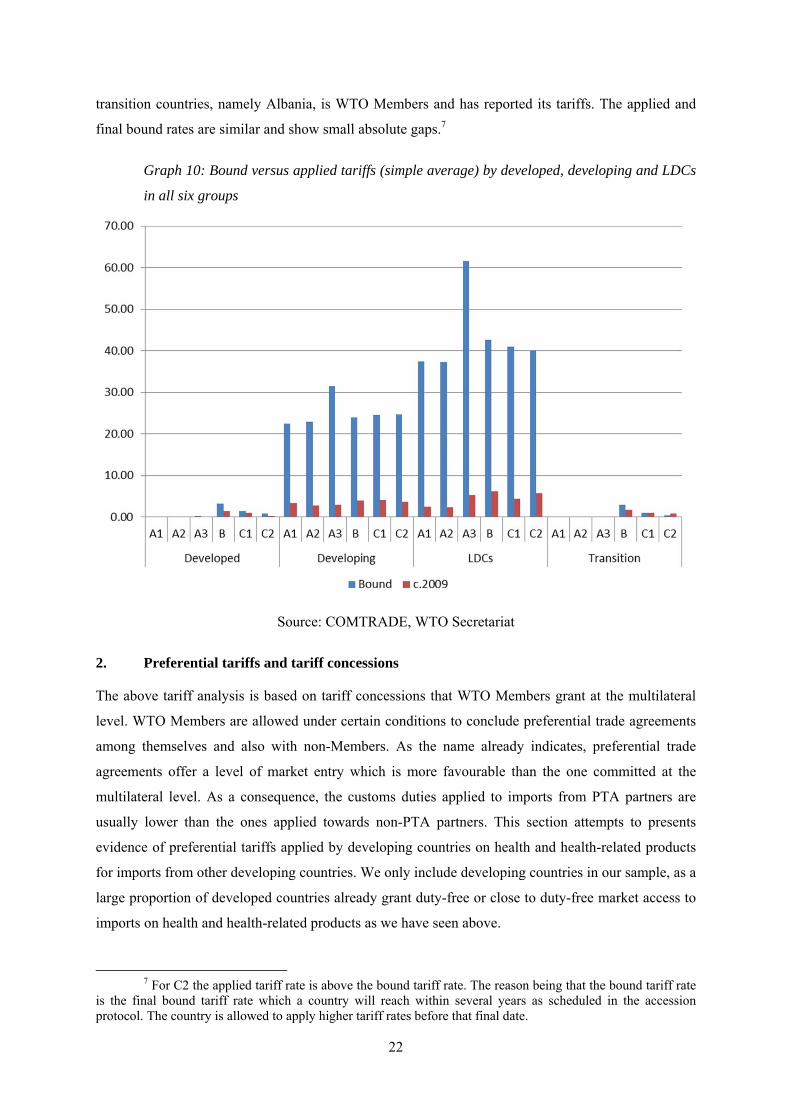
In developed countries the bound level is very close to the applied rate in absolute terms, except for
product group B (3.2 per cent compared to 1.4 per cent). The picture looks substantially different for
developing countries and LDCs. Developing countries have bound their tariffs on all health products
substantially above 20 per cent. As explained, high bound rates do not imply that high tariffs are
actually charged, however, they offer Members the possibility to increase their applied rates up to the
bound level. (A higher level than the bound rates could result in compensation for trading partners'
loss of trade). Reducing the bound rates closer to the applied rate would provide an important signal
to traders that tariffs will remain at low levels and therefore provide more predictability to both
exporters and importers. For LDCs the bound rate is even higher reaching the level of around 40 per
cent for all product groups, except for A3 which is bound above 60 per cent. Currently, only one
22
transition countries, namely Albania, is WTO Members and has reported its tariffs. The applied and
final bound rates are similar and show small absolute gaps.7
Graph 10: Bound versus applied tariffs (simple average) by developed, developing and LDCs
in all six groups
Source: COMTRADE, WTO Secretariat
2. Preferential tariffs and tariff concessions
The above tariff analysis is based on tariff concessions that WTO Members grant at the multilateral
level. WTO Members are allowed under certain conditions to conclude preferential trade agreements
among themselves and also with non-Members. As the name already indicates, preferential trade
agreements offer a level of market entry which is more favourable than the one committed at the
multilateral level. As a consequence, the customs duties applied to imports from PTA partners are
usually lower than the ones applied towards non-PTA partners. This section attempts to presents
evidence of preferential tariffs applied by developing countries on health and health-related products
for imports from other developing countries. We only include developing countries in our sample, as a
large proportion of developed countries already grant duty-free or close to duty-free market access to
imports on health and health-related products as we have seen above.
7 For C2 the applied tariff rate is above the bound tariff rate. The reason being that the bound tariff rate
is the final bound tariff rate which a country will reach within several years as scheduled in the accession protocol. The country is allowed to apply higher tariff rates before that final date.
23
Preferential tariff data is rather difficult to obtain and it is not systematically notified to any
international organization. The International Trade Centre (ITC) in Geneva has recently undertaken
major efforts to collect the preferential tariff rates of major developing country exporters. In this
section, we present the preferential tariff data collected by ITC as they apply to health products.
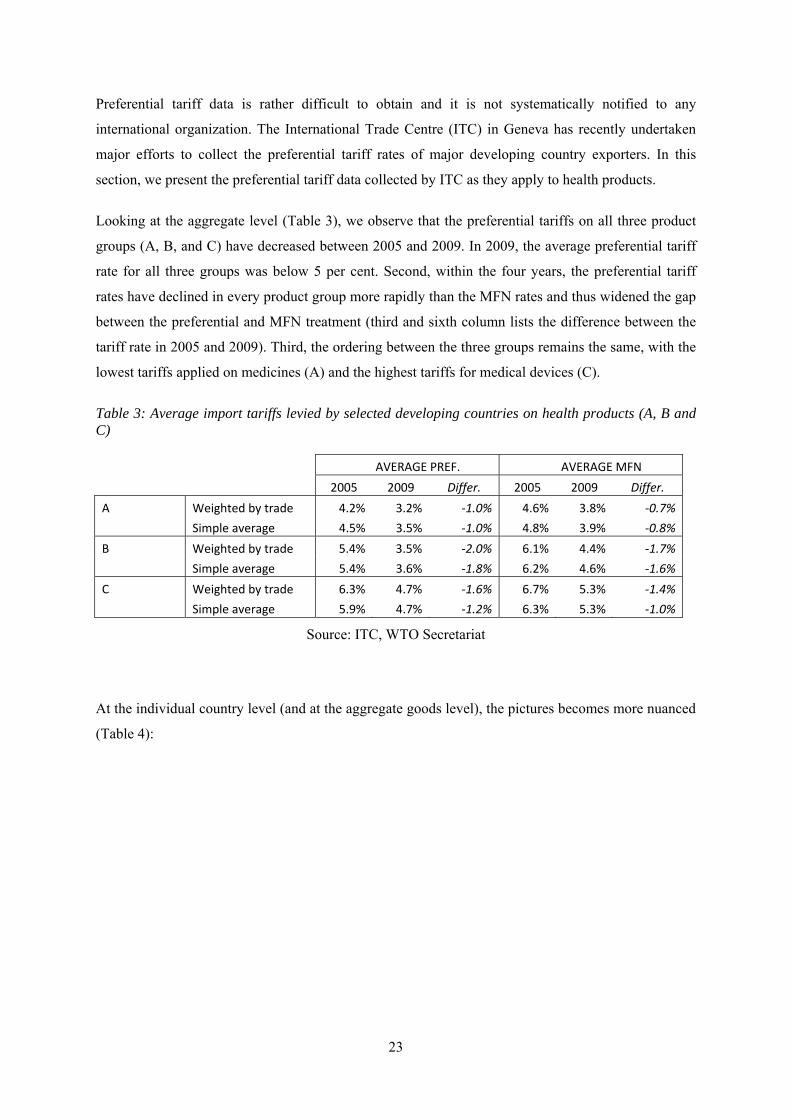
Looking at the aggregate level (Table 3), we observe that the preferential tariffs on all three product
groups (A, B, and C) have decreased between 2005 and 2009. In 2009, the average preferential tariff
rate for all three groups was below 5 per cent. Second, within the four years, the preferential tariff
rates have declined in every product group more rapidly than the MFN rates and thus widened the gap
between the preferential and MFN treatment (third and sixth column lists the difference between the
tariff rate in 2005 and 2009). Third, the ordering between the three groups remains the same, with the
lowest tariffs applied on medicines (A) and the highest tariffs for medical devices (C).
Table 3: Average import tariffs levied by selected developing countries on health products (A, B and C)
AVERAGE PREF. AVERAGE MFN 2005 2009 Differ. 2005 2009 Differ.
A Weighted by trade 4.2% 3.2% -1.0% 4.6% 3.8% -0.7% Simple average 4.5% 3.5% -1.0% 4.8% 3.9% -0.8% B Weighted by trade 5.4% 3.5% -2.0% 6.1% 4.4% -1.7% Simple average 5.4% 3.6% -1.8% 6.2% 4.6% -1.6% C Weighted by trade 6.3% 4.7% -1.6% 6.7% 5.3% -1.4% Simple average 5.9% 4.7% -1.2% 6.3% 5.3% -1.0%
Source: ITC, WTO Secretariat
At the individual country level (and at the aggregate goods level), the pictures becomes more nuanced
(Table 4):
24
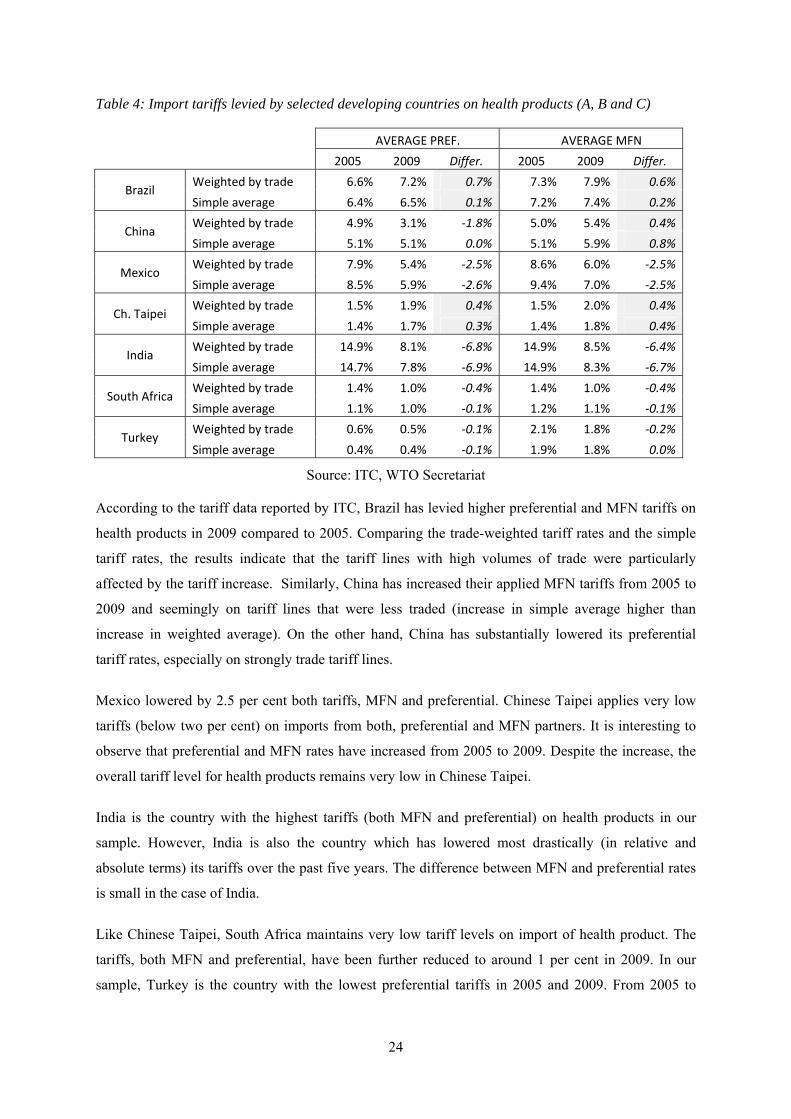
Table 4: Import tariffs levied by selected developing countries on health products (A, B and C)
AVERAGE PREF. AVERAGE MFN 2005 2009 Differ. 2005 2009 Differ.
Brazil Weighted by trade 6.6% 7.2% 0.7% 7.3% 7.9% 0.6% Simple average 6.4% 6.5% 0.1% 7.2% 7.4% 0.2%
China Weighted by trade 4.9% 3.1% -1.8% 5.0% 5.4% 0.4% Simple average 5.1% 5.1% 0.0% 5.1% 5.9% 0.8%
Mexico Weighted by trade 7.9% 5.4% -2.5% 8.6% 6.0% -2.5% Simple average 8.5% 5.9% -2.6% 9.4% 7.0% -2.5%
Ch. Taipei Weighted by trade 1.5% 1.9% 0.4% 1.5% 2.0% 0.4% Simple average 1.4% 1.7% 0.3% 1.4% 1.8% 0.4%
India Weighted by trade 14.9% 8.1% -6.8% 14.9% 8.5% -6.4% Simple average 14.7% 7.8% -6.9% 14.9% 8.3% -6.7%
South Africa Weighted by trade 1.4% 1.0% -0.4% 1.4% 1.0% -0.4% Simple average 1.1% 1.0% -0.1% 1.2% 1.1% -0.1%
Turkey Weighted by trade 0.6% 0.5% -0.1% 2.1% 1.8% -0.2% Simple average 0.4% 0.4% -0.1% 1.9% 1.8% 0.0%
Source: ITC, WTO Secretariat
According to the tariff data reported by ITC, Brazil has levied higher preferential and MFN tariffs on
health products in 2009 compared to 2005. Comparing the trade-weighted tariff rates and the simple
tariff rates, the results indicate that the tariff lines with high volumes of trade were particularly
affected by the tariff increase. Similarly, China has increased their applied MFN tariffs from 2005 to
2009 and seemingly on tariff lines that were less traded (increase in simple average higher than
increase in weighted average). On the other hand, China has substantially lowered its preferential
tariff rates, especially on strongly trade tariff lines.
Mexico lowered by 2.5 per cent both tariffs, MFN and preferential. Chinese Taipei applies very low
tariffs (below two per cent) on imports from both, preferential and MFN partners. It is interesting to
observe that preferential and MFN rates have increased from 2005 to 2009. Despite the increase, the
overall tariff level for health products remains very low in Chinese Taipei.
India is the country with the highest tariffs (both MFN and preferential) on health products in our
sample. However, India is also the country which has lowered most drastically (in relative and
absolute terms) its tariffs over the past five years. The difference between MFN and preferential rates
is small in the case of India.
Like Chinese Taipei, South Africa maintains very low tariff levels on import of health product. The
tariffs, both MFN and preferential, have been further reduced to around 1 per cent in 2009. In our
sample, Turkey is the country with the lowest preferential tariffs in 2005 and 2009. From 2005 to
25
2009, Turkey has further reduced their tariffs and offers today a high degree of market access,
especially for preferential trading partners.
In summary, analysing preferential tariffs we observe that tariffs are indeed lower compared to MFN,
however, the difference does not exceed 1 per cent. Studying individual countries, the tariff level for
health products, both preferential and MFN, differs substantially between countries. While for
example Chinese Taipei and South Africa maintain low tariff rates, India imposes substantially higher
tariff rates on trade towards the rest of the world as well as preferential trading partners. However,
the difference between preferential rates and MFN is often small (below) 1 per cent and is biggest for
case of China in 2009 (2.2 per cent lower tariffs).
IV. CONCLUSION
The first objective of this paper has been to establish a group of commodities based on the HS
classification that are all important goods (as inputs or final products) entering the public health
sphere. We suggest three commodity groups and five commodity subgroups to capture all
international trade flows relevant for public health.
The paper then gave an overview of the corresponding international trade flows from 1995 to 2009.
We found that the international trade in health products have grown in a very dynamic way, especially
trade in dosified and bulk medicines. Our results further indicate that international trade in health
products is strongly dominated by trade among a small number of developed countries. Studying
detailed tariff data at the multilateral level, we show that the tariff level has decreased significantly
over the past fifteen years and is on average well below ten per cent. Tariffs in preferential trade
arrangements are even lower.
Overall, tariffs on health products have come down substantially over the past years, and in many
countries tariffs on health products are probably among the smaller obstacles for access to health. As a
corollary, in the majority of countries applied tariffs are not used anymore as an instrument of
industrial policy. One reason might be that the production of pharmaceutical and of medical devices
typically requires a certain degree of technical sophistication which cannot be easily created or
promoted. However, given these difficulties and the already low level of tariffs, the question to ask is
why countries even maintain tariffs on health products. Imposing tariffs typically translates into
higher product prices, especially in presence of long supply changes. Maintaining tariffs ultimaty
means taxing the sick and creating additional costs for the health system.
26
Reducing the gap between international prices and domestic prices by lowering tariffs would therefore
not only be a positive development for patients, but also for all health service providers that rely on
cheap inputs of health products. In addition, lower prices for specific and general chemical inputs into
the pharmaceutical industry (groupings A3 and B1) can also help promoting the competitiveness of
the local pharmaceutical industry.
As several studies indicate, there are various factors that determine the domestic price of
internationally traded health products (e.g. Cameron et al. 2011). These factors might include pricing
strategies of the manufacturers, tariffs and non-tariff barriers, transportation and distribution costs,
domestic taxes and other mark-up costs. Import tariffs levied on the value of an imported good thus
constitute only one cost element. However, they can substantively alter the price of both, the final
products as well as of intermediated inputs. In this paper, we only focus on tariffs and neglect other
price determinants. In a study by Bate & Tren (2005), the authors combine tariff data with data on
value added tax and other duties and find that all duties taken together constituted a major impediment
for access to medicine.
Another topic for future research could be to analyse special import regimes for health products.
Many countries exempt certain products from customs duties for various reasons, for example the
government or international agencies often do not pay import duties on products imported for official
purposes. Krasovec & Connor (1998) mention several countries that provide such tariff exemptions
for public health commodities, especially the products are purchased by a non-profit buyer. In order to
be able to evaluate the effect of such duty exemptions in a systematic way, one would need very
detailed import data which specify for every import flow whether a duty was paid or not. The World
Bank has recently launched the Tariff Reform Impact Simulation Tool (TRIST) which attempts to
estimate the impact of trade reforms on trade flows by using highly disaggregated trade flows. Due to
this new tool,8 detailed national data is available with the necessary level of disaggregation.9 As an
extension of this paper, it would certainly be worthwhile retrieving this type of information and
providing an in-depth analysis.
As indicated above, tariff data give only limited insights into the final price of health products in the
importing countries, as other cost elements might play an important role.10 Looking only at tariffs in
isolation, one is unable to make predictions about final prices in countries, even less to make
8
http://web.worldbank.org/WBSITE/EXTERNAL/TOPICS/TRADE/0,,contentMDK:22326433~pagePK:210058~piPK:210062~theSitePK:239071,00.html
9 TRIST has been used for Albania, Bolivia, Ethiopia, Jordan, Kenya, Madagascar, Malawi, Mauritius, Morocco, Mozambique, Nigeria, Seychelles, Syria, Tanzania, Tunisia, and Zambia.
10 Woodward (2001) observes that countries with low tariffs often had higher medicines' prices than countries with high tariffs.
27
comparisons across countries. From a trade perspective, lowering tariffs should result in lower prices
and thus an increased demand for health products. Instead of thus looking at the absolute price level,
one interesting research question would be to verify whether the decrease in tariffs has resulted in
larger amounts of importations.11 If lowering prices has indeed led to more imports, the question
asked in the title of this paper would probably have a positive answer.
V. REFERENCES
Bate, R., Tren, R., & Urbach, J. (2005). Taxed to Death. AEI-Brookings Joint Center for Regulatory Studies. (April 2005), online: http://www.fightingmalaria.org/pdfs/taxed_to_death1.pdf.
Cameron, A., Ewen, M., Auton, M., & Abegunde, D. (2011). The World Medicines Situation
2011: Medicines Prices, Availability and Affordability. World Health Organization. Geneva.
IMS. (2011). The Global Use of Medicines: Outlook Through 2015. Report by the IMS
Institute for Healthcare Informatics (May). Krasovec, K., & Connor, C. (1998). Using Tax Relief to Support Public Health Goals,
(September). Partners for Health Reformplus. Online: http://www.phrplus.org/Pubs/pib21.pdf
Olcay, M., & Laing, R. (2005). Pharmaceutical Tariffs: What is their effect on prices,
protection of local industry and revenue generation?, Study prepared for the Commission on Intellectual Property Rights, Innovation and Public Health. World Health.
Simon, J. L., Larson, B. A., Zusman, A., & Rosen, S. (2002). Policy and Practice How will the reduction of tariffs and taxes on insecticide- treated bednets affect household purchases ? Bulletin of the World Health Organization, 80(01).
World Health Organization (2001). How to Develop and Implement a National Drug Policy.
World Health Organization. Geneva. Online: http://apps.who.int/medicinedocs/pdf/s2283e/s2283e.pdf
11 In order to test this hypothesis one might construct a simple econometric model, which stipulates that the change in imports is explained by a change in tariffs. Higher imports might not only stem from lower tariffs, but demand might have increased for other reasons, such as higher private and public spending for health care or a changing age structure. In order to controll for these changes, one would need to introduce into the econometric three additional variables, namely the change in per capita income (GDP/Pop), the change in public health spending per capita (HeX/Pop) and finally the change in life expectancy (Lexp). The equation to be estimated could take the following form (all variables are included for all countries, i, in the sample. ε constitutes the error term):
∆im = α + ∆(tariff ) + ∆ + ∆ + ∆Lexp + ε
28
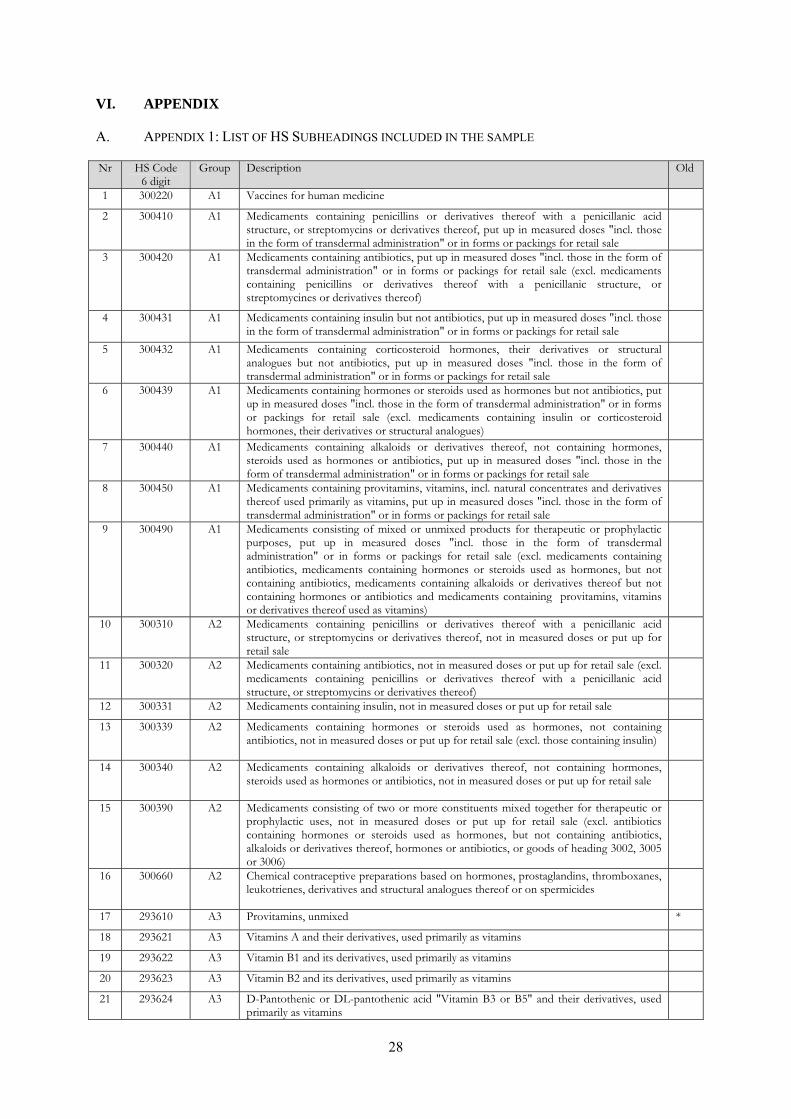
VI. APPENDIX
A. APPENDIX 1: LIST OF HS SUBHEADINGS INCLUDED IN THE SAMPLE
Nr HS Code 6 digit
Group Description Old
1 300220 A1 Vaccines for human medicine
2 300410 A1 Medicaments containing penicillins or derivatives thereof with a penicillanic acid structure, or streptomycins or derivatives thereof, put up in measured doses "incl. those in the form of transdermal administration" or in forms or packings for retail sale
3 300420 A1 Medicaments containing antibiotics, put up in measured doses "incl. those in the form of transdermal administration" or in forms or packings for retail sale (excl. medicaments containing penicillins or derivatives thereof with a penicillanic structure, or streptomycines or derivatives thereof)
4 300431 A1 Medicaments containing insulin but not antibiotics, put up in measured doses "incl. those in the form of transdermal administration" or in forms or packings for retail sale
5 300432 A1 Medicaments containing corticosteroid hormones, their derivatives or structural analogues but not antibiotics, put up in measured doses "incl. those in the form of transdermal administration" or in forms or packings for retail sale
6 300439 A1 Medicaments containing hormones or steroids used as hormones but not antibiotics, put up in measured doses "incl. those in the form of transdermal administration" or in forms or packings for retail sale (excl. medicaments containing insulin or corticosteroid hormones, their derivatives or structural analogues)
7 300440 A1 Medicaments containing alkaloids or derivatives thereof, not containing hormones, steroids used as hormones or antibiotics, put up in measured doses "incl. those in the form of transdermal administration" or in forms or packings for retail sale
8 300450 A1 Medicaments containing provitamins, vitamins, incl. natural concentrates and derivatives thereof used primarily as vitamins, put up in measured doses "incl. those in the form of transdermal administration" or in forms or packings for retail sale
9 300490 A1 Medicaments consisting of mixed or unmixed products for therapeutic or prophylactic purposes, put up in measured doses "incl. those in the form of transdermal administration" or in forms or packings for retail sale (excl. medicaments containing antibiotics, medicaments containing hormones or steroids used as hormones, but not containing antibiotics, medicaments containing alkaloids or derivatives thereof but not containing hormones or antibiotics and medicaments containing provitamins, vitamins or derivatives thereof used as vitamins)
10 300310 A2 Medicaments containing penicillins or derivatives thereof with a penicillanic acid structure, or streptomycins or derivatives thereof, not in measured doses or put up for retail sale
11 300320 A2 Medicaments containing antibiotics, not in measured doses or put up for retail sale (excl. medicaments containing penicillins or derivatives thereof with a penicillanic acid structure, or streptomycins or derivatives thereof)
12 300331 A2 Medicaments containing insulin, not in measured doses or put up for retail sale
13 300339 A2 Medicaments containing hormones or steroids used as hormones, not containing antibiotics, not in measured doses or put up for retail sale (excl. those containing insulin)
14 300340 A2 Medicaments containing alkaloids or derivatives thereof, not containing hormones, steroids used as hormones or antibiotics, not in measured doses or put up for retail sale
15 300390 A2 Medicaments consisting of two or more constituents mixed together for therapeutic or prophylactic uses, not in measured doses or put up for retail sale (excl. antibiotics containing hormones or steroids used as hormones, but not containing antibiotics, alkaloids or derivatives thereof, hormones or antibiotics, or goods of heading 3002, 3005 or 3006)
16 300660 A2 Chemical contraceptive preparations based on hormones, prostaglandins, thromboxanes, leukotrienes, derivatives and structural analogues thereof or on spermicides
17 293610 A3 Provitamins, unmixed *
18 293621 A3 Vitamins A and their derivatives, used primarily as vitamins
19 293622 A3 Vitamin B1 and its derivatives, used primarily as vitamins
20 293623 A3 Vitamin B2 and its derivatives, used primarily as vitamins
21 293624 A3 D-Pantothenic or DL-pantothenic acid "Vitamin B3 or B5" and their derivatives, used primarily as vitamins
29
22 293625 A3 Vitamin B6 and its derivatives, used primarily as vitamins
23 293626 A3 Vitamin B12 and its derivatives, used primarily as vitamins
24 293627 A3 Vitamin C and its derivatives, used primarily as vitamins
25 293628 A3 Vitamin E and its derivatives, used primarily as vitamins
26 293629 A3 Vitamins and their derivatives, used primarily as vitamins, unmixed (excl. vitamins A, B1, B2, B3, B5, B6, B12, C, E and their derivatives)
27 293690 A3 Provitamins and mixtures of vitamins, of provitamins or of concentrates, whether or not in any solvent, and natural concentrates
28 293710 A3 Pituitary "anterior" or similar hormones, and derivatives, used primarily as hormones *
29 293711 A3 Somatropin, its derivatives and structural analogues, used primarily as hormones
30 293712 A3 Insulin and its salts, used primarily as hormones
31 293719 A3 Polypeptide hormones, protein hormones and glycoprotein hormones, their derivatives and structural analogues, used primarily as hormones (excl. somatropin, its derivatives and structural analogues, and insulin and its salts)
32 293721 A3 Cortisone, hydrocortisone, prednisone "dehydrocortisone" and prednisolone "dehydrohydrocortisone"
33 293722 A3 Halogenated derivatives of corticosteroidal hormones
34 293723 A3 Oestrogens and progestogens
35 293729 A3 Steroidal hormones, their derivatives and structural analogues, used primarily as hormones (excl. cortisone, hydrocortisone, prednisone "dehydrocortisone", prednisolone "dehydrohydrocortisone", halogenated derivatives of corticosteroidal hormones, oestrogens and progestogens)
36 293731 A3 Epinephrine
37 293739 A3 Catecholamine hormones, their derivatives and structural analogues, used primarily as hormones (excl. epinephrine)
38 293740 A3 Amino-acid derivatives, used primarily as hormones
39 293750 A3 Prostaglandins, thromboxanes and leukotrienes, their derivatives and structural analogues, used primarily as hormones
40 293790 A3 Hormones, natural or reproduced by synthesis; derivatives and structural analogues thereof, used primarily as hormones (excl. polypeptide hormones, protein hormones, glycoprotein hormones, steroidal hormones, catecholamine hormones, prostaglandins, thromboxanes and leukotrienes, their derivatives and structural analogues, and amino-acid derivatives)
41 293791 A3 Insulin and its salts *
42 293792 A3 Oestrogens and progestogens *
43 293799 A3 Hormones and their derivatives used primarily as hormones (excl. pituitary "anterior" or similar hormones and their derivatives, adrenal cortical hormones and their derivatives, insulin and its salts, oestrogens and progestogens)
*
44 293910 A3 Alkaloids of opium and their derivatives; salts thereof *
45 293911 A3 Concentrates of poppy straw; buprenorphine "INN", codeine, dihydrocodeine "INN", ethylmorphine, etorphine "INN", heroin, hydrocodone "INN", hydromorphone "INN", morphine, nicomorphine "INN", oxycodone "INN", oxymorphone "INN", pholcodine "INN", thebacon "INN" and thebaine, and salts thereof
46 293919 A3 Alkaloids of opium and their derivatives, and salts thereof (excl. concentrates of poppy straw; buprenorphine "INN", codeine, dihydrocodeine "INN", ethylmorphine, etorphine "INN", heroin, hydrocodone "INN", hydromorphone "INN", morphine, nicomorphine "INN", oxycodone "INN", oxymorphone "INN", pholcodine "INN", thebacon "INN" and thebaine, and salts thereof)
47 293920 A3 Alkaloids of cinchona and their derivatives; salts thereof
48 293921 A3 Quinine and its salts *
49 293929 A3 Alkaloids of cinchons and their derivatives; salts thereof (excl. quinine and its salts) *
50 293930 A3 Caffeine and its salts
51 293940 A3 Ephedrines and their salts *
52 293941 A3 Ephedrine and its salts
53 293942 A3 Pseudoephedrine "INN" and its salts
30
54 293943 A3 Cathine "INN" and its salts
55 293949 A3 Ephedrines and their salts (excl. ephedrine, pseudoephedrine "INN", cathine "INN", and salts thereof)
56 293950 A3 Theophylline and aminophylline "theophylline-ethylenediamine" and their derivatives; salts thereof
*
57 293951 A3 Fenetylline "INN" and its salts
58 293959 A3 Theophylline and aminophylline "theophylline-ethylenediamine" and their derivatives, and salts thereof (excl. fenetylline "INN" and its salts)
59 293960 A3 Alkaloids of rye ergot and their derivatives; salts thereof *
60 293961 A3 Ergometrine "INN" and its salts
61 293962 A3 Ergotamine "INN" and its salts
62 293963 A3 Lysergic acid and its salts
63 293969 A3 Alkaloids of rye ergot and their derivatives; salts thereof (excl. lysergic acid, ergotamine and ergometrine, and their salts)
64 293970 A3 Nicotine and its salts *
65 293990 A3 Vegetable alkaloids, natural or reproduced by synthesis, and their salts, ethers, esters and other derivatives (excl. alkaloids of opium, alkaloids of cinchons, theophylline, aminophylline "theophylline-ethylenediamine" alkaloids of rye ergot and their sa
*
66 293991 A3 Cocaine, ecgonine, levometamfetamine, metamfetamine "INN", metamfetamine racemate, and salts, esters and other derivatives thereof
67 293999 A3 Vegetable alkaloids, natural or reproduced by synthesis, and their salts, ethers, esters and other derivatives (excl. alkaloids of opium, alkaloids of cinchons, theophylline, aminophylline "theophylline-ethylenediamine" alkaloids of rye ergot and their salts and derivatives, cocaine, ecgonine, levometamfetamine, metamfetamine "INN", metamfetamine racemate, and salts, esters and other derivatives thereof caffeine and ephedrines, and their salts)
68 294110 A3 Penicillins and their derivatives with a penicillanic acid structure; salts thereof
69 294120 A3 Streptomycins and their derivatives; salts thereof
70 294130 A3 Tetracyclines and their derivatives; salts thereof
71 294140 A3 Chloramphenicol and its derivatives; salts thereof
72 294150 A3 Erythromycin and its derivatives; salts thereof
73 294190 A3 Antibiotics (excl. penicillins and their derivatives with a penicillanic acid structure, salts thereof, streptomycins, tetracyclines, chloramphenicol and erythromycin, their derivatives and salts thereof)
74 284210 B Double or complex silicates of inorganic acids or peroxoacids, incl. aluminosilicates whether or not chemically defined (excl. inorganic or organic compounds of mercury)
75 284290 B Salts of inorganic acids or peroxoacids (excl. of oxometallic or peroxometallic acids, double or complex silicates [incl. aluminosilicates whether or not chemically defined], azides, and inorganic or organic compounds of mercury)
76 290290 B Cyclic hydrocarbons (excl. cyclanes, cyclenes, benzene, toluene, xylenes, styrene, ethylbenzene and cumene)
77 290349 B Halogenated derivatives of acyclic hydrocarbons with two or more different halogens (excl. perhalogenated derivatives)
78 290369 B Halogenated derivatives of aromatic hydrocarbons (excl. chlorobenzene, o-dichlorobenzene and p-dichlorobenzene, hexachlorobenzene [ISO] and DDT [ISO] [clofenotane [INN], "1,1,1-trichloro-2,2-bis[p-chlorophenyl]ethane")
79 290410 B Derivatives of hydrocarbons containing only sulpho groups, their salts and ethyl esters
80 290490 B Sulphonated, nitrated or nitrosated derivatives of hydrocarbons, whether or not halogenated (excl. those containing only sulpho, nitro or nitroso groups)
81 290522 B Acyclic terpene alcohols
82 290529 B Unsaturated monohydric acyclic alcohols (excl. acyclic terpene alcohols)
83 290619 B Cyclanic, cyclenic or cycloterpenic alcohols and their halogenated, sulphonated, nitrated or nitrosated derivatives (excl. menthol, cyclohexanol, methylcyclohexanols, dimethylcyclohexanols, sterols and inositols)
84 290629 B Aromatic cyclic alcohols and their halogenated, sulphonated, nitrated or nitrosated derivatives (excl. benzyl alcohol)
31
85 290729 B Polyphenols and phenol-alcohols (excl. resorcinol and hydroquinone "quinol" and their salts, and 4,4''-isopropylidenediphenol "bisphenol A, diphenylolpropane" and its salts)
86 290919 B Acyclic ethers and their halogenated, sulphonated, nitrated or nitrosated derivatives (excl. diethyl ether)
87 290930 B Aromatic ethers and their halogenated, sulphonated, nitrated or nitrosated derivatives
88 290949 B Ether-alcohols and their halogenated, sulphonated, nitrated or nitrosated derivatives (excl. 2,2''-Oxydiethanol "diethylene glycol, digol" and monoalkylethers of ethylene glycol or of diethylene glycol)
89 290950 B Ether-phenols, ether-alcohol-phenols and their halogenated, sulphonated, nitrated or nitrosated derivatives
90 291229 B Cyclic aldehydes, without other oxygen function (excl. benzaldehyde)
91 291249 B Aldehyde-ethers, aldehyde-phenols and aldehydes with other oxygen function (excl. ethylvanillin "3-ethoxy-4-hydroxybenzaldehyde" and vanillin "4-hydroxy-3-methoxybenzaldehyde")
92 291419 B Acyclic ketones, without other oxygen function (excl. acetone, butanone "methyl ethyl ketone" and 4-Methylpentan-2-one "Methyl isobutyl ketone")
93 291440 B Ketone-alcohols and ketone-aldehydes
94 291469 B Quinones (excl. anthraquinone)
95 291539 B Esters of acetic acid (excl. ethyl, vinyl, n-butyl and dinoseb [ISO] acetates)
96 291550 B Propionic acid, its salts and esters
97 291590 B Saturated acyclic monocarboxylic acids, their anhydrides, halides, peroxides and peroxyacids; their halogenated, sulphonated, nitrated or nitrosated derivatives (excl. formic acid and acetic acid, mono-, di- or trichloroacetic acids, proprionic acid, butanoic and pentanoic acids, palmitic and stearic acids, their salts and esters, and acetic anhydride)
98 291619 B Unsaturated acyclic monocarboxylic acids, their anhydrides, halides, peroxides, peroxyacids and halogenated, sulphonated, nitrated or nitrosated derivatives (excl. acrylic acid and its salts and esters, methacrylic acid and its salts and esters, and oleic, linoleic or linolenic acids, their salts and esters)
99 291620 B Cyclanic, cyclenic or cycloterpenic monocarboxylic acids, their anhydrides, halides, peroxides, peroxyacids and their halogenated, sulphonated, nitrated or nitrosated derivatives (excl. inorganic or organic compounds of mercury)
100 291639 B Aromatic monocarboxylic acids, their anhydrides, halides, peroxides, peroxyacids and their halogenated, sulphonated, nitrated or nitrosated derivatives (excl. benzoic acid, its salts and esters, benzoyl peroxide, benzoyl chloride, binapacryl [ISO], phenylacetic acid, its salts and esters, and inorganic or organic compounds of mercury)
101 291713 B Azelaic acid, sebacic acid, their salts and esters
102 291719 B Acyclic polycarboxylic acids, their anhydrides, halides, peroxides, peroxyacids and their halogenated, sulphonated, nitrated or nitrosated derivatives (excl. oxalic acid, its salts and esters, adipic acid, its salts and esters, azelaic acid, sebacic acid, their salts and esters, maleic anhydride, and inorganic or organic compounds of mercury)
103 291734 B Esters of orthophthalic acid (excl. dioctyl, dinonyl or didecyl orthophthalates)
104 291739 B Aromatic polycarboxylic acids, their anhydrides, halides, peroxides, peroxyacids and their halogenated, sulphonated, nitrated or nitrosated derivatives (excl. esters of orthophthalic acid, phthalic anhydride, terephthalic acid and its salts and dimethyl terephthalate)
105 291811 B Lactic acid, its salts and esters (excl. inorganic or organic compounds of mercury)
106 291813 B Salts and esters of tartaric acid
107 291816 B Gluconic acid, its salts and esters
108 291819 B Carboxylic acids with additional oxygen function and their anhydrides, halides, peroxides and peroxyacids; their halogenated, sulphonated, nitrated or nitrosated derivatives (excl. lactic acid, tartaric acid, citric acid, gluconic acid and their salts and esters, and chlorobenzilate [ISO])
109 291822 B o-Acetylsalicylic acid, its salts and esters
110 291823 B Esters of salicylic acid and their salts (excl. o-acetylsalicylic acid, its salts and esters)
111 291829 B Carboxylic acids with phenol function but without other oxygen function, their anhydrides, halides, peroxides, peroxyacids and their halogenated, sulphonated, nitrated or nitrosated derivatives (excl. salicylic acid and o-Acetylsalicylic acid, and their salts and esters)
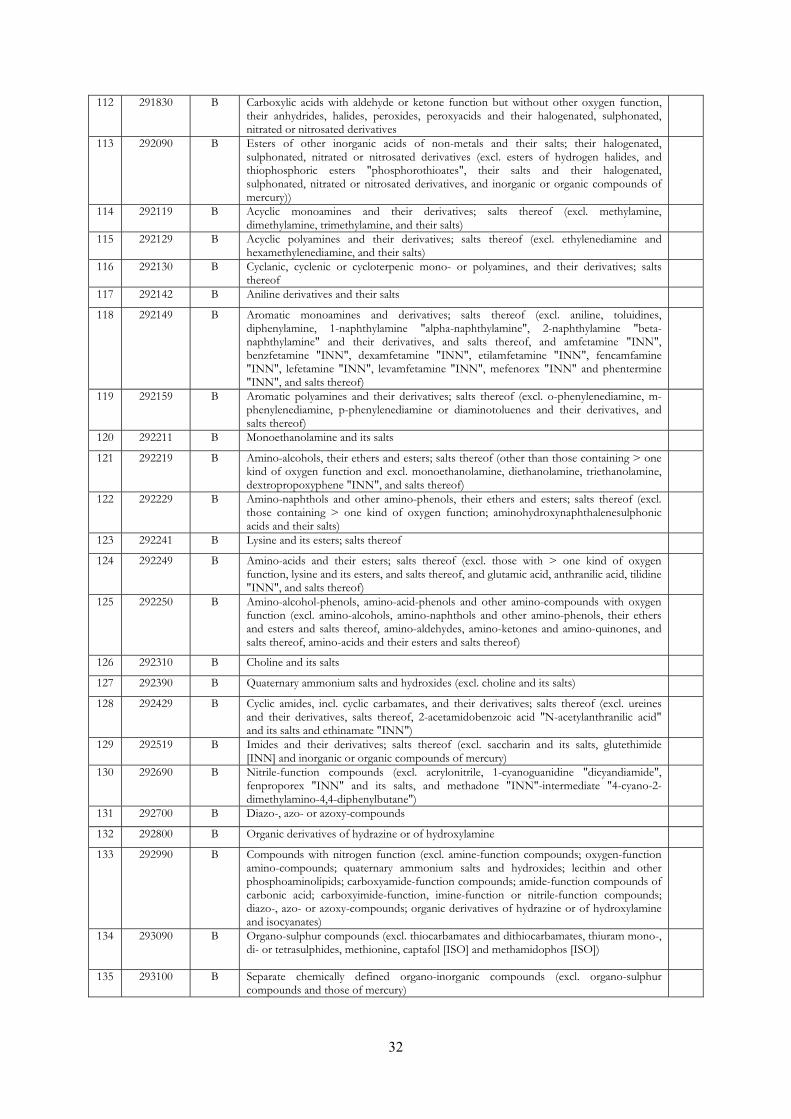
32
112 291830 B Carboxylic acids with aldehyde or ketone function but without other oxygen function, their anhydrides, halides, peroxides, peroxyacids and their halogenated, sulphonated, nitrated or nitrosated derivatives
113 292090 B Esters of other inorganic acids of non-metals and their salts; their halogenated, sulphonated, nitrated or nitrosated derivatives (excl. esters of hydrogen halides, and thiophosphoric esters "phosphorothioates", their salts and their halogenated, sulphonated, nitrated or nitrosated derivatives, and inorganic or organic compounds of mercury))
114 292119 B Acyclic monoamines and their derivatives; salts thereof (excl. methylamine, dimethylamine, trimethylamine, and their salts)
115 292129 B Acyclic polyamines and their derivatives; salts thereof (excl. ethylenediamine and hexamethylenediamine, and their salts)
116 292130 B Cyclanic, cyclenic or cycloterpenic mono- or polyamines, and their derivatives; salts thereof
117 292142 B Aniline derivatives and their salts
118 292149 B Aromatic monoamines and derivatives; salts thereof (excl. aniline, toluidines, diphenylamine, 1-naphthylamine "alpha-naphthylamine", 2-naphthylamine "beta-naphthylamine" and their derivatives, and salts thereof, and amfetamine "INN", benzfetamine "INN", dexamfetamine "INN", etilamfetamine "INN", fencamfamine "INN", lefetamine "INN", levamfetamine "INN", mefenorex "INN" and phentermine "INN", and salts thereof)
119 292159 B Aromatic polyamines and their derivatives; salts thereof (excl. o-phenylenediamine, m-phenylenediamine, p-phenylenediamine or diaminotoluenes and their derivatives, and salts thereof)
120 292211 B Monoethanolamine and its salts
121 292219 B Amino-alcohols, their ethers and esters; salts thereof (other than those containing > one kind of oxygen function and excl. monoethanolamine, diethanolamine, triethanolamine, dextropropoxyphene "INN", and salts thereof)
122 292229 B Amino-naphthols and other amino-phenols, their ethers and esters; salts thereof (excl. those containing > one kind of oxygen function; aminohydroxynaphthalenesulphonic acids and their salts)
123 292241 B Lysine and its esters; salts thereof
124 292249 B Amino-acids and their esters; salts thereof (excl. those with > one kind of oxygen function, lysine and its esters, and salts thereof, and glutamic acid, anthranilic acid, tilidine "INN", and salts thereof)
125 292250 B Amino-alcohol-phenols, amino-acid-phenols and other amino-compounds with oxygen function (excl. amino-alcohols, amino-naphthols and other amino-phenols, their ethers and esters and salts thereof, amino-aldehydes, amino-ketones and amino-quinones, and salts thereof, amino-acids and their esters and salts thereof)
126 292310 B Choline and its salts
127 292390 B Quaternary ammonium salts and hydroxides (excl. choline and its salts)
128 292429 B Cyclic amides, incl. cyclic carbamates, and their derivatives; salts thereof (excl. ureines and their derivatives, salts thereof, 2-acetamidobenzoic acid "N-acetylanthranilic acid" and its salts and ethinamate "INN")
129 292519 B Imides and their derivatives; salts thereof (excl. saccharin and its salts, glutethimide [INN] and inorganic or organic compounds of mercury)
130 292690 B Nitrile-function compounds (excl. acrylonitrile, 1-cyanoguanidine "dicyandiamide", fenproporex "INN" and its salts, and methadone "INN"-intermediate "4-cyano-2-dimethylamino-4,4-diphenylbutane")
131 292700 B Diazo-, azo- or azoxy-compounds
132 292800 B Organic derivatives of hydrazine or of hydroxylamine
133 292990 B Compounds with nitrogen function (excl. amine-function compounds; oxygen-function amino-compounds; quaternary ammonium salts and hydroxides; lecithin and other phosphoaminolipids; carboxyamide-function compounds; amide-function compounds of carbonic acid; carboxyimide-function, imine-function or nitrile-function compounds; diazo-, azo- or azoxy-compounds; organic derivatives of hydrazine or of hydroxylamine and isocyanates)
134 293090 B Organo-sulphur compounds (excl. thiocarbamates and dithiocarbamates, thiuram mono-, di- or tetrasulphides, methionine, captafol [ISO] and methamidophos [ISO])
135 293100 B Separate chemically defined organo-inorganic compounds (excl. organo-sulphur compounds and those of mercury)
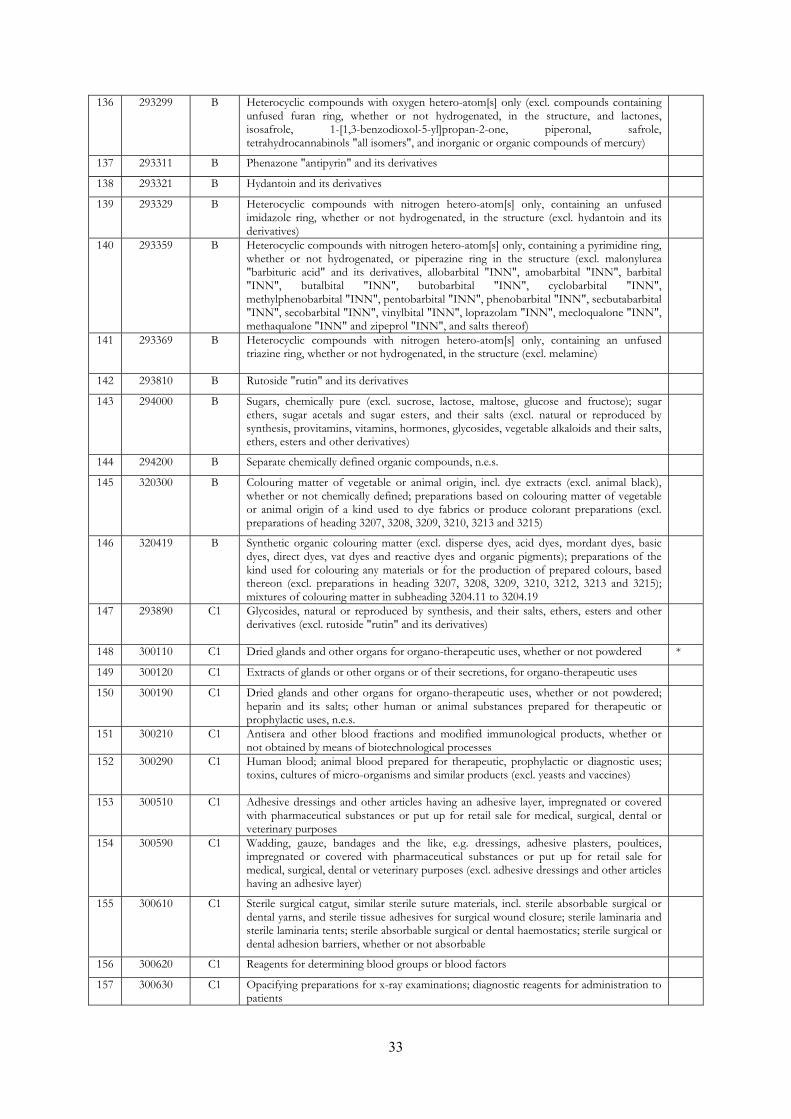
33
136 293299 B Heterocyclic compounds with oxygen hetero-atom[s] only (excl. compounds containing unfused furan ring, whether or not hydrogenated, in the structure, and lactones, isosafrole, 1-[1,3-benzodioxol-5-yl]propan-2-one, piperonal, safrole, tetrahydrocannabinols "all isomers", and inorganic or organic compounds of mercury)
137 293311 B Phenazone "antipyrin" and its derivatives
138 293321 B Hydantoin and its derivatives
139 293329 B Heterocyclic compounds with nitrogen hetero-atom[s] only, containing an unfused imidazole ring, whether or not hydrogenated, in the structure (excl. hydantoin and its derivatives)
140 293359 B Heterocyclic compounds with nitrogen hetero-atom[s] only, containing a pyrimidine ring, whether or not hydrogenated, or piperazine ring in the structure (excl. malonylurea "barbituric acid" and its derivatives, allobarbital "INN", amobarbital "INN", barbital "INN", butalbital "INN", butobarbital "INN", cyclobarbital "INN", methylphenobarbital "INN", pentobarbital "INN", phenobarbital "INN", secbutabarbital "INN", secobarbital "INN", vinylbital "INN", loprazolam "INN", mecloqualone "INN", methaqualone "INN" and zipeprol "INN", and salts thereof)
141 293369 B Heterocyclic compounds with nitrogen hetero-atom[s] only, containing an unfused triazine ring, whether or not hydrogenated, in the structure (excl. melamine)
142 293810 B Rutoside "rutin" and its derivatives
143 294000 B Sugars, chemically pure (excl. sucrose, lactose, maltose, glucose and fructose); sugar ethers, sugar acetals and sugar esters, and their salts (excl. natural or reproduced by synthesis, provitamins, vitamins, hormones, glycosides, vegetable alkaloids and their salts, ethers, esters and other derivatives)
144 294200 B Separate chemically defined organic compounds, n.e.s.
145 320300 B Colouring matter of vegetable or animal origin, incl. dye extracts (excl. animal black), whether or not chemically defined; preparations based on colouring matter of vegetable or animal origin of a kind used to dye fabrics or produce colorant preparations (excl. preparations of heading 3207, 3208, 3209, 3210, 3213 and 3215)
146 320419 B Synthetic organic colouring matter (excl. disperse dyes, acid dyes, mordant dyes, basic dyes, direct dyes, vat dyes and reactive dyes and organic pigments); preparations of the kind used for colouring any materials or for the production of prepared colours, based thereon (excl. preparations in heading 3207, 3208, 3209, 3210, 3212, 3213 and 3215); mixtures of colouring matter in subheading 3204.11 to 3204.19
147 293890 C1 Glycosides, natural or reproduced by synthesis, and their salts, ethers, esters and other derivatives (excl. rutoside "rutin" and its derivatives)
148 300110 C1 Dried glands and other organs for organo-therapeutic uses, whether or not powdered *
149 300120 C1 Extracts of glands or other organs or of their secretions, for organo-therapeutic uses
150 300190 C1 Dried glands and other organs for organo-therapeutic uses, whether or not powdered; heparin and its salts; other human or animal substances prepared for therapeutic or prophylactic uses, n.e.s.
151 300210 C1 Antisera and other blood fractions and modified immunological products, whether or not obtained by means of biotechnological processes
152 300290 C1 Human blood; animal blood prepared for therapeutic, prophylactic or diagnostic uses; toxins, cultures of micro-organisms and similar products (excl. yeasts and vaccines)
153 300510 C1 Adhesive dressings and other articles having an adhesive layer, impregnated or covered with pharmaceutical substances or put up for retail sale for medical, surgical, dental or veterinary purposes
154 300590 C1 Wadding, gauze, bandages and the like, e.g. dressings, adhesive plasters, poultices, impregnated or covered with pharmaceutical substances or put up for retail sale for medical, surgical, dental or veterinary purposes (excl. adhesive dressings and other articles having an adhesive layer)
155 300610 C1 Sterile surgical catgut, similar sterile suture materials, incl. sterile absorbable surgical or dental yarns, and sterile tissue adhesives for surgical wound closure; sterile laminaria and sterile laminaria tents; sterile absorbable surgical or dental haemostatics; sterile surgical or dental adhesion barriers, whether or not absorbable
156 300620 C1 Reagents for determining blood groups or blood factors
157 300630 C1 Opacifying preparations for x-ray examinations; diagnostic reagents for administration to patients
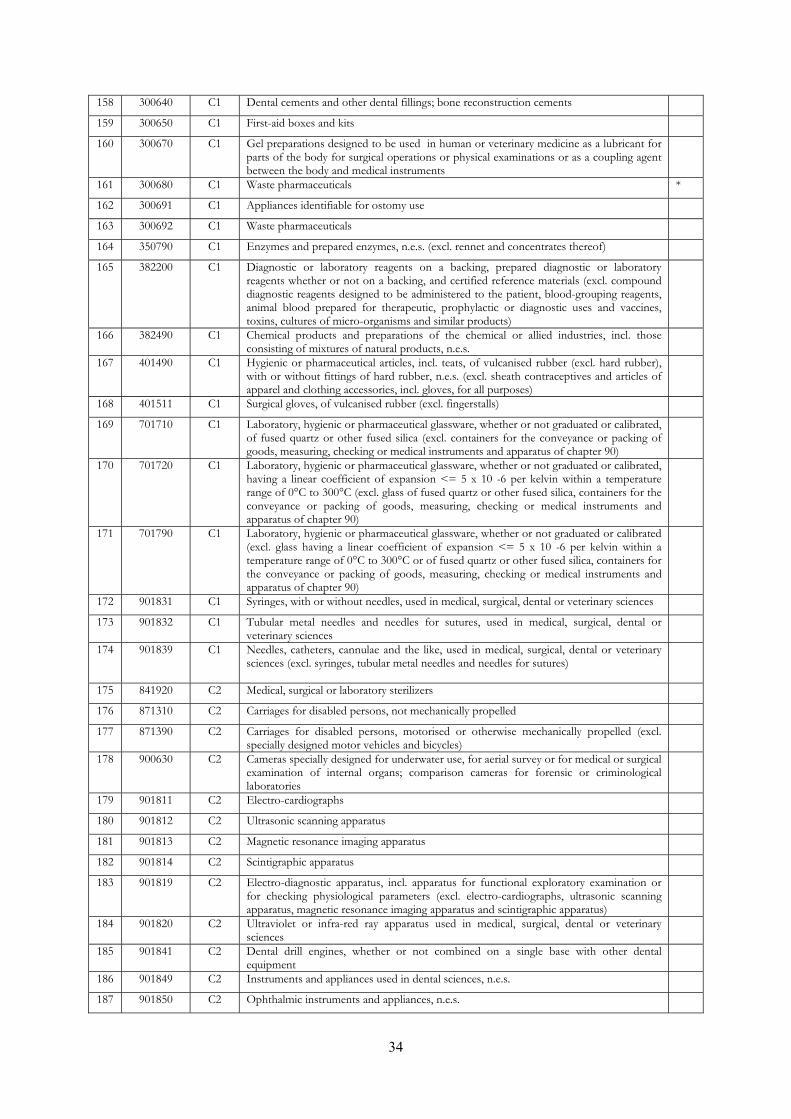
34
158 300640 C1 Dental cements and other dental fillings; bone reconstruction cements
159 300650 C1 First-aid boxes and kits
160 300670 C1 Gel preparations designed to be used in human or veterinary medicine as a lubricant for parts of the body for surgical operations or physical examinations or as a coupling agent between the body and medical instruments
161 300680 C1 Waste pharmaceuticals *
162 300691 C1 Appliances identifiable for ostomy use
163 300692 C1 Waste pharmaceuticals
164 350790 C1 Enzymes and prepared enzymes, n.e.s. (excl. rennet and concentrates thereof)
165 382200 C1 Diagnostic or laboratory reagents on a backing, prepared diagnostic or laboratory reagents whether or not on a backing, and certified reference materials (excl. compound diagnostic reagents designed to be administered to the patient, blood-grouping reagents, animal blood prepared for therapeutic, prophylactic or diagnostic uses and vaccines, toxins, cultures of micro-organisms and similar products)
166 382490 C1 Chemical products and preparations of the chemical or allied industries, incl. those consisting of mixtures of natural products, n.e.s.
167 401490 C1 Hygienic or pharmaceutical articles, incl. teats, of vulcanised rubber (excl. hard rubber), with or without fittings of hard rubber, n.e.s. (excl. sheath contraceptives and articles of apparel and clothing accessories, incl. gloves, for all purposes)
168 401511 C1 Surgical gloves, of vulcanised rubber (excl. fingerstalls)
169 701710 C1 Laboratory, hygienic or pharmaceutical glassware, whether or not graduated or calibrated, of fused quartz or other fused silica (excl. containers for the conveyance or packing of goods, measuring, checking or medical instruments and apparatus of chapter 90)
170 701720 C1 Laboratory, hygienic or pharmaceutical glassware, whether or not graduated or calibrated, having a linear coefficient of expansion <= 5 x 10 -6 per kelvin within a temperature range of 0°C to 300°C (excl. glass of fused quartz or other fused silica, containers for the conveyance or packing of goods, measuring, checking or medical instruments and apparatus of chapter 90)
171 701790 C1 Laboratory, hygienic or pharmaceutical glassware, whether or not graduated or calibrated (excl. glass having a linear coefficient of expansion <= 5 x 10 -6 per kelvin within a temperature range of 0°C to 300°C or of fused quartz or other fused silica, containers for the conveyance or packing of goods, measuring, checking or medical instruments and apparatus of chapter 90)
172 901831 C1 Syringes, with or without needles, used in medical, surgical, dental or veterinary sciences
173 901832 C1 Tubular metal needles and needles for sutures, used in medical, surgical, dental or veterinary sciences
174 901839 C1 Needles, catheters, cannulae and the like, used in medical, surgical, dental or veterinary sciences (excl. syringes, tubular metal needles and needles for sutures)
175 841920 C2 Medical, surgical or laboratory sterilizers
176 871310 C2 Carriages for disabled persons, not mechanically propelled
177 871390 C2 Carriages for disabled persons, motorised or otherwise mechanically propelled (excl. specially designed motor vehicles and bicycles)
178 900630 C2 Cameras specially designed for underwater use, for aerial survey or for medical or surgical examination of internal organs; comparison cameras for forensic or criminological laboratories
179 901811 C2 Electro-cardiographs
180 901812 C2 Ultrasonic scanning apparatus
181 901813 C2 Magnetic resonance imaging apparatus
182 901814 C2 Scintigraphic apparatus
183 901819 C2 Electro-diagnostic apparatus, incl. apparatus for functional exploratory examination or for checking physiological parameters (excl. electro-cardiographs, ultrasonic scanning apparatus, magnetic resonance imaging apparatus and scintigraphic apparatus)
184 901820 C2 Ultraviolet or infra-red ray apparatus used in medical, surgical, dental or veterinary sciences
185 901841 C2 Dental drill engines, whether or not combined on a single base with other dental equipment
186 901849 C2 Instruments and appliances used in dental sciences, n.e.s.
187 901850 C2 Ophthalmic instruments and appliances, n.e.s.
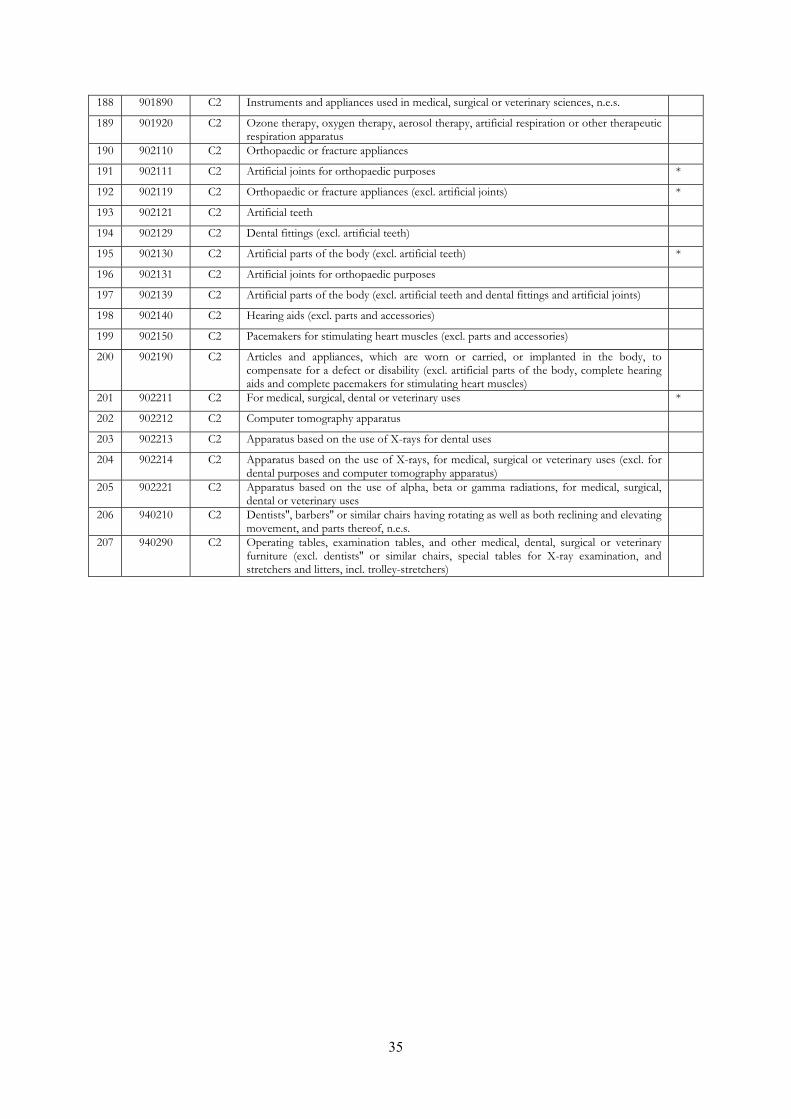
35
188 901890 C2 Instruments and appliances used in medical, surgical or veterinary sciences, n.e.s.
189 901920 C2 Ozone therapy, oxygen therapy, aerosol therapy, artificial respiration or other therapeutic respiration apparatus
190 902110 C2 Orthopaedic or fracture appliances
191 902111 C2 Artificial joints for orthopaedic purposes *
192 902119 C2 Orthopaedic or fracture appliances (excl. artificial joints) *
193 902121 C2 Artificial teeth
194 902129 C2 Dental fittings (excl. artificial teeth)
195 902130 C2 Artificial parts of the body (excl. artificial teeth) *
196 902131 C2 Artificial joints for orthopaedic purposes
197 902139 C2 Artificial parts of the body (excl. artificial teeth and dental fittings and artificial joints)
198 902140 C2 Hearing aids (excl. parts and accessories)
199 902150 C2 Pacemakers for stimulating heart muscles (excl. parts and accessories)
200 902190 C2 Articles and appliances, which are worn or carried, or implanted in the body, to compensate for a defect or disability (excl. artificial parts of the body, complete hearing aids and complete pacemakers for stimulating heart muscles)
201 902211 C2 For medical, surgical, dental or veterinary uses *
202 902212 C2 Computer tomography apparatus
203 902213 C2 Apparatus based on the use of X-rays for dental uses
204 902214 C2 Apparatus based on the use of X-rays, for medical, surgical or veterinary uses (excl. for dental purposes and computer tomography apparatus)
205 902221 C2 Apparatus based on the use of alpha, beta or gamma radiations, for medical, surgical, dental or veterinary uses
206 940210 C2 Dentists'', barbers'' or similar chairs having rotating as well as both reclining and elevating movement, and parts thereof, n.e.s.
207 940290 C2 Operating tables, examination tables, and other medical, dental, surgical or veterinary furniture (excl. dentists'' or similar chairs, special tables for X-ray examination, and stretchers and litters, incl. trolley-stretchers)
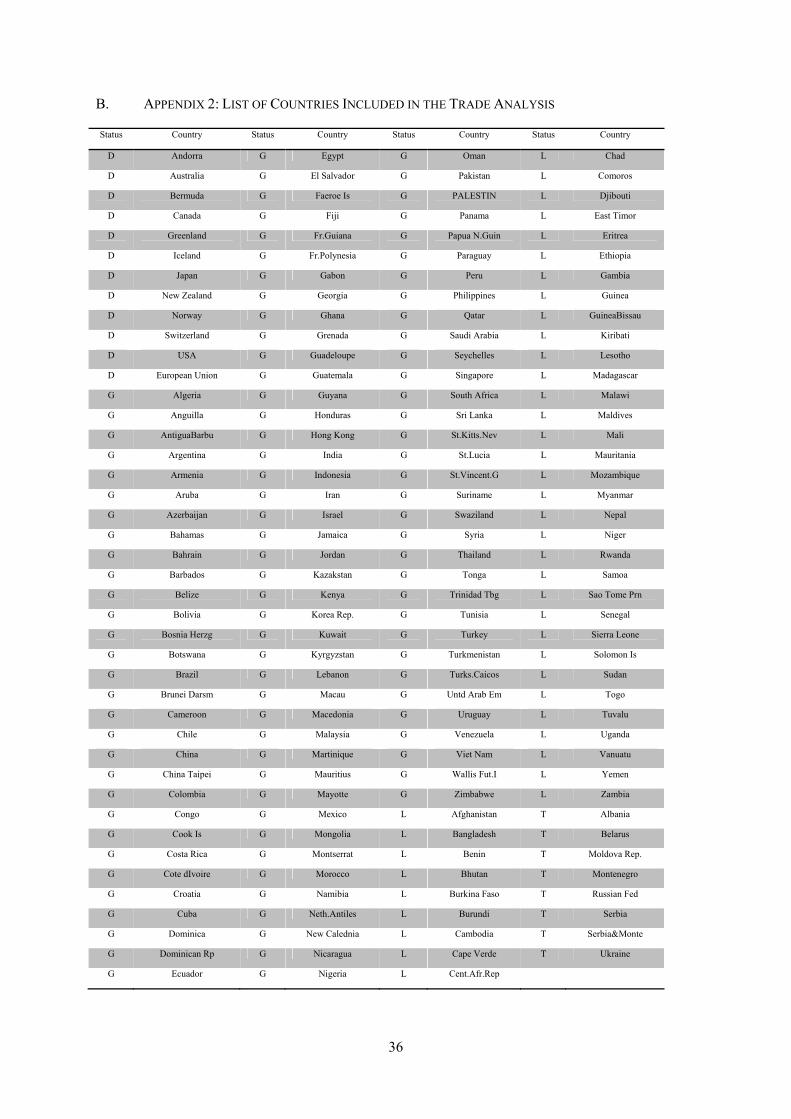
36
B. APPENDIX 2: LIST OF COUNTRIES INCLUDED IN THE TRADE ANALYSIS
Status Country Status Country Status Country Status Country
D Andorra G Egypt G Oman L Chad
D Australia G El Salvador G Pakistan L Comoros
D Bermuda G Faeroe Is G PALESTIN L Djibouti
D Canada G Fiji G Panama L East Timor
D Greenland G Fr.Guiana G Papua N.Guin L Eritrea
D Iceland G Fr.Polynesia G Paraguay L Ethiopia
D Japan G Gabon G Peru L Gambia
D New Zealand G Georgia G Philippines L Guinea
D Norway G Ghana G Qatar L GuineaBissau
D Switzerland G Grenada G Saudi Arabia L Kiribati
D USA G Guadeloupe G Seychelles L Lesotho
D European Union G Guatemala G Singapore L Madagascar
G Algeria G Guyana G South Africa L Malawi
G Anguilla G Honduras G Sri Lanka L Maldives
G AntiguaBarbu G Hong Kong G St.Kitts.Nev L Mali
G Argentina G India G St.Lucia L Mauritania
G Armenia G Indonesia G St.Vincent.G L Mozambique
G Aruba G Iran G Suriname L Myanmar
G Azerbaijan G Israel G Swaziland L Nepal
G Bahamas G Jamaica G Syria L Niger
G Bahrain G Jordan G Thailand L Rwanda
G Barbados G Kazakstan G Tonga L Samoa
G Belize G Kenya G Trinidad Tbg L Sao Tome Prn
G Bolivia G Korea Rep. G Tunisia L Senegal
G Bosnia Herzg G Kuwait G Turkey L Sierra Leone
G Botswana G Kyrgyzstan G Turkmenistan L Solomon Is
G Brazil G Lebanon G Turks.Caicos L Sudan
G Brunei Darsm G Macau G Untd Arab Em L Togo
G Cameroon G Macedonia G Uruguay L Tuvalu
G Chile G Malaysia G Venezuela L Uganda
G China G Martinique G Viet Nam L Vanuatu
G China Taipei G Mauritius G Wallis Fut.I L Yemen
G Colombia G Mayotte G Zimbabwe L Zambia
G Congo G Mexico L Afghanistan T Albania
G Cook Is G Mongolia L Bangladesh T Belarus
G Costa Rica G Montserrat L Benin T Moldova Rep.
G Cote dIvoire G Morocco L Bhutan T Montenegro
G Croatia G Namibia L Burkina Faso T Russian Fed
G Cuba G Neth.Antiles L Burundi T Serbia
G Dominica G New Calednia L Cambodia T Serbia&Monte
G Dominican Rp G Nicaragua L Cape Verde T Ukraine
G Ecuador G Nigeria L Cent.Afr.Rep
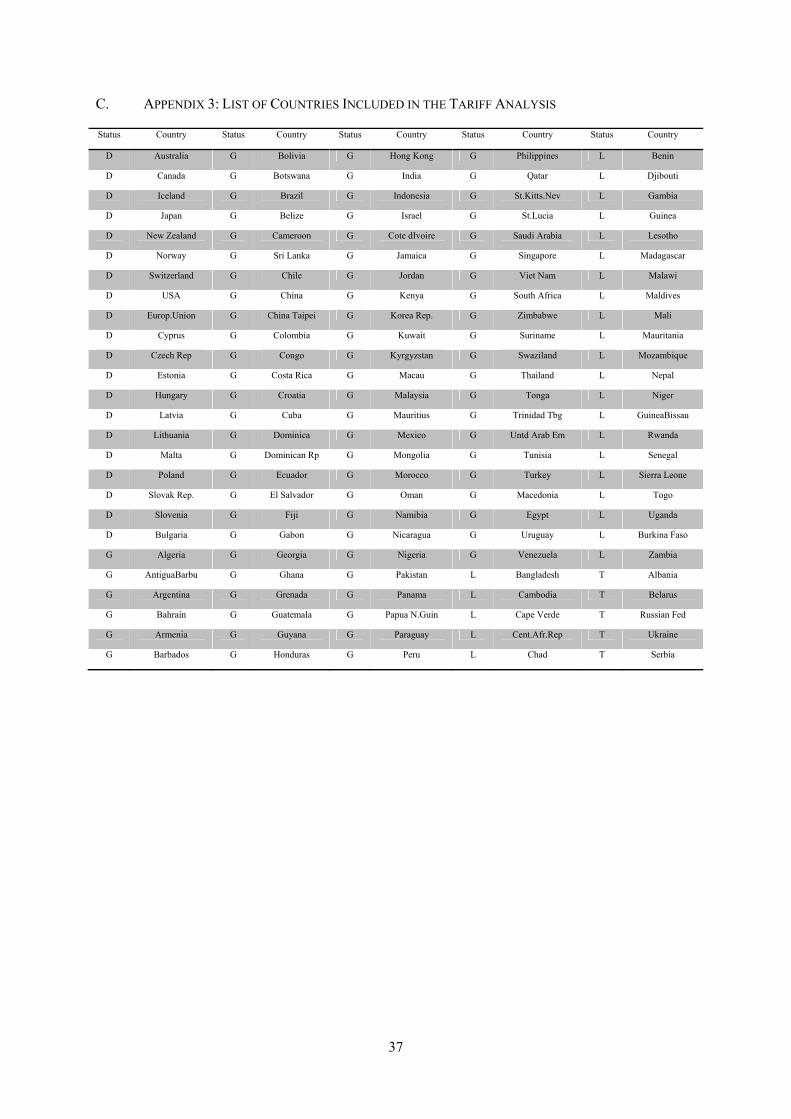
37
C. APPENDIX 3: LIST OF COUNTRIES INCLUDED IN THE TARIFF ANALYSIS
Status Country Status Country Status Country Status Country Status Country
D Australia G Bolivia G Hong Kong G Philippines L Benin
D Canada G Botswana G India G Qatar L Djibouti
D Iceland G Brazil G Indonesia G St.Kitts.Nev L Gambia
D Japan G Belize G Israel G St.Lucia L Guinea
D New Zealand G Cameroon G Cote dIvoire G Saudi Arabia L Lesotho
D Norway G Sri Lanka G Jamaica G Singapore L Madagascar
D Switzerland G Chile G Jordan G Viet Nam L Malawi
D USA G China G Kenya G South Africa L Maldives
D Europ.Union G China Taipei G Korea Rep. G Zimbabwe L Mali
D Cyprus G Colombia G Kuwait G Suriname L Mauritania
D Czech Rep G Congo G Kyrgyzstan G Swaziland L Mozambique
D Estonia G Costa Rica G Macau G Thailand L Nepal
D Hungary G Croatia G Malaysia G Tonga L Niger
D Latvia G Cuba G Mauritius G Trinidad Tbg L GuineaBissau
D Lithuania G Dominica G Mexico G Untd Arab Em L Rwanda
D Malta G Dominican Rp G Mongolia G Tunisia L Senegal
D Poland G Ecuador G Morocco G Turkey L Sierra Leone
D Slovak Rep. G El Salvador G Oman G Macedonia L Togo
D Slovenia G Fiji G Namibia G Egypt L Uganda
D Bulgaria G Gabon G Nicaragua G Uruguay L Burkina Faso
G Algeria G Georgia G Nigeria G Venezuela L Zambia
G AntiguaBarbu G Ghana G Pakistan L Bangladesh T Albania
G Argentina G Grenada G Panama L Cambodia T Belarus
G Bahrain G Guatemala G Papua N.Guin L Cape Verde T Russian Fed
G Armenia G Guyana G Paraguay L Cent.Afr.Rep T Ukraine
G Barbados G Honduras G Peru L Chad T Serbia