Embed Size (px)
Citation preview

Staff Report CARB Review of the Sacramento County Second 10-Year PM10 Maintenance Plan
Release Date: August 13, 2021
Hearing Date: September 23, 2021

This page intentionally left blank.

CARB staff has prepared a written report reviewing the District Plan. Copies of the report may be obtained from 2021 Sacramento County Second 10-Year PM10 Maintenance Plan|California Air Resources Board on August 13, 2021. However, because of current travel, facility, and staffing restrictions, CARB’s office may have limited access. Please contact Bradley Bechtold, Regulations Coordinator, at [email protected] or (916) 322-6533 if you need physical copies of the documents.
For individuals with sensory disabilities, this document is available in Braille, large print, audiocassette, or compact disc. Please contact CARB’s Disability Coordinator at (916) 323-4916 by voice or through the California Relay Services at 711 to place your request for disability services. If you are a person with limited English and would like to request interpreter services, please contact CARB’s Bilingual Manager at (916) 323-7053.
This document has been prepared by the staff of the California Air Resources Board. Publication does not signify that the contents reflect the views and policies of the California Air Resources Board, nor do trade names or commercial products constitute endorsement or recommendation for use.
For questions, please contact:
Earl Withycombe, Air Resources Engineer Central Valley Air Quality Planning Section California Air Resources Board P.O. Box 2815 Sacramento, California 95814 Email: [email protected]
Or
Alicia Adams, Manager Central Valley Air Quality Planning Section California Air Resources Board P.O. Box 2815 Sacramento, California 95814 Email: [email protected]

Table of Contents Executive Summary ................................................................................................................... 4
Background ............................................................................................................................... 4
Designation Requirements ........................................................................................................ 5
Evaluation of the Second PM10 Plan .......................................................................................... 7
Attainment of the Standard ................................................................................................... 7
Fully Approved SIP ................................................................................................................ 9
Attainment Results from Permanent and Enforceable Emission Reductions ......................... 9
Maintenance Plan Provides for Continuing Attainment ........................................................ 9
Attainment Year Emission Inventory .................................................................................. 9
Maintenance Demonstration ............................................................................................ 10
PM10 Monitoring Network ................................................................................................ 12
Verification of Continued Attainment .............................................................................. 12
Contingency Plan ............................................................................................................. 13
Motor Vehicle Emission Budgets ......................................................................................... 13
General Conformity ............................................................................................................. 14
Environmental Impacts ............................................................................................................ 14
Staff Recommendation ............................................................................................................ 15

4
Executive Summary
This report presents the California Air Resources Board (CARB or Board) staff assessment of the Second 10-Year PM10 Maintenance Plan for Sacramento County (Second PM10 Plan or Plan) developed by the Sacramento Metropolitan Air Quality Management District (District). The Plan identifies the conditions under which the Sacramento County Planning Area (Sacramento County or County) has demonstrated attainment of the 150 µg/m324-hour PM10 National Ambient Air Quality Standard (PM10 standard) since 1998, and commits to actions designed to maintain the PM10 standard. The Second PM10 Plan is the maintenance plan required under federal Clean Air Act (Act) Section 175A(b) for the second 10-year period following attainment of the standard. The contents of the Second PM10 Plan are prescribed in a U.S. Environmental Protection Agency (U.S. EPA) memo dated September 4, 1992.1
The 2010 PM10 Maintenance Plan and Redesignation Request for the Sacramento County Planning Area (2010 PM10 Plan) was adopted by the District on September 27, 2010 and was approved by U.S. EPA on September 26, 2013.2 The 2010 PM10 Plan demonstrated maintenance of the PM10 standard based on an emission inventory that projected emissions of PM10 in 2020 to be slightly greater in 2010, but that oxides of nitrogen (NOx) emissions – a contributory precursor – would decline by 49 percent. Because the correlation between NOx reductions and reductions in ambient PM10 are not linear, the District used a speciated rollback analysis to demonstrate that Sacramento County would remain in attainment of the standard in 2020. Subsequent to 2010 PM10 Plan adoption, the District has recorded only two exceedances of the PM10 standard. The speciated rollback analysis in the Second PM10 Plan continues to demonstrate maintenance of the PM10 standard through 2030, the horizon date of the Plan.
CARB staff has concluded that the Plan satisfies the SIP planning requirements of the Act for maintenance plans, including an attainment emission inventory, maintenance demonstration, continued air quality monitoring, commitment for verification of continued attainment, transportation conformity budgets, and a contingency plan to promptly correct any violation of the PM10 standard.
Background
Sacramento County is located at the southern end of the Sacramento Valley and is bounded by the Coastal and Diablo Ranges on the west and the Sierra Nevada on the east. The County encompasses approximately 994 square miles and hosts a current population of 1,578,680.
On December 21, 1993, Sacramento County was designated by U.S. EPA as moderate nonattainment for the PM10 standard on the basis of three exceedances recorded during the winters of 1989 and 1990. Subsequent to the designation of Sacramento County as a PM10
1 “Procedures for Processing Requests to Redesignate Areas to Attainment”, John Calcagni, Director, Air Quality Management Division to U.S. EPA Regional Directors, September 4, 1992. 2 Federal Register 78 FR 59261, September 26, 2013.

5
nonattainment area, the District implemented an aggressive residential woodburning control program. No further exceedances of the PM10 standard were recorded since December 25, 1990. On the basis of clean data recorded in 1998 through 2000, U.S. EPA on February 15, 2002, determined that Sacramento County had attained the PM10 standard. To be redesignated to attainment for the PM10 standard, the District adopted the 2010 PM10 Plan on September 27, 2010. The 2010 PM10 Plan was approved by CARB on November 18, 2010 and forwarded to U.S. EPA on December 7, 2010. U.S. EPA approved the 2010 PM10 Plan on September 26, 2013.
Section 175A(b) of the Act requires the state to submit to U.S. EPA a second 10-year maintenance plan succeeding the first 10-year plan. On August 27, 2021, the District Board is scheduled to adopt the Second 10-Year PM10 Maintenance Plan for Sacramento County (Second PM10 Plan) to satisfy this requirement. Analysis of air quality data accessed shows that the number of exceedances per year during the 2018-2020 averaging period to be less than 1.0, the federal threshold for nonattainment of the PM10 standard.
Designation Requirements
The Act authorizes the U.S. EPA to retain the designation of an area as a maintenance area if a number of requirements are satisfied. These requirements, as listed in Section 107(d)(3)(E) of the Act, are:
1. The area continues to attain the standard;
2. The applicable implementation plan for the area is fully approved under Section 110(k) of the Act;
3. The improvements in air quality are due to permanent and enforceable emission reductions resulting from implementation of the applicable implementation plan;
4. The area has a fully approved maintenance plan satisfying the requirements of Section 175A of the Act; and
5. The state in which the area is located has met all applicable requirements under Section 110 and Part D of the Act.

6
Figure 1 – Sacramento County PM10 Planning Area
U.S. EPA guidance also enumerates the required elements of approvable maintenance plans.3 Each PM10 maintenance plan must provide for continued maintenance of the PM10 standard for twenty years after redesignation from nonattainment to attainment and include the following components:
1. Attainment emission inventory; 2. Maintenance demonstration; 3. Commitment to continued operation of the monitoring network; 4. Commitment to verification of continued attainment; and 5. Contingency plan to promptly correct any violation of the PM10 standard that occurs
after the area has been redesignated.
3 Calcagni , John, Memorandum, Procedures for Processing Requests to Redesignate Areas to Attainment, Office of Air Quality Planning and Standards, Research Triangle Park, North Carolina, September 4, 1992.

7
Evaluation of the Second PM10 Plan
Based on review of the Second PM10 Plan and supporting technical analysis, CARB staff concurs that the Second PM10 Plan meets the Act’s requirements. The following sections summarize CARB staff findings and conclusions with respect to the required elements of the Second PM10 Plan. The Second PM10 Plan covers the period from October 2023 to October 2033.
Attainment of the Standard
PM10 air quality has remained relatively good since redesignation of Sacramento County to attainment in 2013. Ambient air quality data for PM10 is currently collected by four monitoring stations, three of which are operated by the District and one by CARB. Table 1 lists maximum PM10 concentrations recorded between 1998 and 2020. The annual peak monitoring site changes from year to year, which suggests that the potential for elevated PM10 concentrations is mainly caused by emissions from area-wide and mobile source activities in the Sacramento area.
Table 1 – PM10 Maximum 24-Hour Average Concentrations (µg/m3) for Sacramento County Monitoring Sites, 1998 – 2020 (Exceptional Events Excluded)
Yea
r
N. H
ighl
and
s
DPM
-1
DPM
-2
DPM
-3
SacT
-St-
1
SacT
-St-
2
SacT
-St-
3
SacT
-St-
4
Airp
ort
Rd
-1
Airp
ort
Rd
-2
Go
lden
Ct-
1
Go
lden
Ct-
3
Bra
nch-
Ctr
-1
Bra
nch-
Ctr
-2
Hea
lth-C
tr-2
Hea
lth-C
tr-3
Peak
1998 72 100 104 67 75 65 74 99 93 81 79 61 104
1999 73 139 141 126 99 143 90 53 70 86 88 132 143
2000 82 59 58 67 64 57 62 37 73 56 86 58 86
2001 64 68 66 65 89 73 48 73 51 78 58 122 122
2002 53 86 84 43 77 86 144 73 77 85 103 144
2003 62 63 54 43 65 57 75 53 73 75
2004 44 38 49 101 58 35 47 45 44 91 101
2005 110 71 72 49 53 56 51 64 70 110
2006 65 63 62 132 109 90 38 81 56 159 159
2007 56 70 70 66 53 94 56 56 51 94

8
Yea
r
N. H
ighl
and
s
DPM
-1
DPM
-2
DPM
-3
SacT
-St-
1
SacT
-St-
2
SacT
-St-
3
SacT
-St-
4
Airp
ort
Rd
-1
Airp
ort
Rd
-2
Go
lden
Ct-
1
Go
lden
Ct-
3
Bra
nch-
Ctr
-1
Bra
nch-
Ctr
-2
Hea
lth-C
tr-2
Hea
lth-C
tr-3
Peak
2008 97 71 69 92 73 71 56 89 86 92 97
2009 33 45 45 39 47 48 76 45 44 76
2010 48 44 41 25 53 42 55 62 45 50 62
2011 65 62 62 38 53 69 69 60 73 73
2012 34 41 39 36 32 76 60 34 37 76
2013 48 56 55 53 89 51 95 59 47 95
2014 29 40 38 105 33 46 45 39 105
2015 45 40 42 57 53 30 44 41 57
2016 31 31 31 49 33 22 45 34 49
2017 66 57 59 149 23 16 79 149
2018 50 42 43 147 147 147
2019 53 53 53 174 53 174
2020 116 122 120 132 109
Note: All active monitoring stations are highlighted in yellow, and all other monitoring stations have been either closed, relocated, or operations discontinued. Data source: Second 10-Year PM10 Maintenance Plan for Sacramento County, May 2021, SMAQMD
Only two exceedances of the standard – independent of exceptional events – have been recorded in Sacramento County since 1998. One occurred at the District Health Center site in 2006 and the other at the 13th and T Street CARB site in 2019.

9
Fully Approved SIP
The 2010 PM10 Plan is a fully approved portion of the California SIP. The 2010 PM10 Plan was submitted to U.S. EPA by CARB on December 7, 2010. In a Final Rule Notice published in the September 26, 2010 Federal Register, U.S. EPA fully approved the 2010 PM10 Plan.4
Attainment Results from Permanent and Enforceable Emission Reductions
Attainment of the standard was achieved through an aggressive residential woodburning control program. The control program included the adoption and enforcement of new rules - Rule 417 (Wood Burning Appliances) and Rule 421 (Mandatory Episodic Curtailment of Wood and Other Solid Fuel Burning), a Check Before You Burn public information campaign, and financial incentives for the replacement of older woodstoves and fireplaces with electric, natural gas, pellet, or low emission Phase II certified wood stoves.
Maintenance Plan Provides for Continuing Attainment
Section 175(A) of the Act establishes the required elements of a maintenance plan for areas seeking redesignation from nonattainment to attainment. Using an attainment year inventory and future inventory projections, plans must demonstrate continued attainment through the first and second 10-year maintenance periods. The Second PM10 Plan contains information on the construction of the inventories for the base year (2017) through the end of the second 10-year maintenance period (2033). Much of the emission inventory data in the Plan was provided by CARB to the District. Detailed information on the construction of the CARB emission inventory for Sacramento County is contained in Attachment 1 of this Staff Report. Attachment 1 is being submitted to U.S. EPA as a portion of the Second PM10 Plan.
Attainment Year Emission Inventory
As the standard being addressed in the Second PM10 Plan is the PM10 standard, and as exceedances of this standard prior to attainment occurred on winter days, the emission inventories in the 2010 PM10 Plan and this Plan are based on average winter day activity rates and emission factors. An analysis of peak PM10 24-hour average concentrations by month, between 2010 and 2019, also confirm that the highest peaks continue to occur during late fall and early winter months. The starting point for inventory tracking in the Plan is 2017, the base year for which the Second PM10 Plan was developed, and the horizon year is 2033, the end of the second 10-year maintenance period.
The Sacramento County PM10 emission inventory shows a small increase in directly emitted PM10 from 33.58 to 36.43 tons per winter day, between 2017 and 2033. This increase is due to on-road vehicle and construction emissions continuing to increase over time as total County vehicle-miles traveled and construction activity increase. Over the same period, NOx
4 Federal Register 78 FR 59261, September 26, 2013.

10
emissions are forecasted to decline from 35.84 to 20.08 tons per winter day. NOx emissions contribute to the formation of ammonium nitrate, the most significant PM10 precursor in Sacramento County. Other precursors such as oxides of sulfur (SOx) and carbon species contribute much smaller mass fractions to Sacramento County PM10 concentrations as evidenced by an analysis conducted by CARB in 1999.5 Table 3 shows PM10 and precursor emissions in Sacramento County in 2017 and 2033 in units of tons per winter day.6 The roles these precursor emissions will be more fully described in the next section of this Staff Report.
Table 2. Sacramento County Winter Day PM10 and Precursor Emissions (ton/day)
Pollutant 2017 2033 PM10 33.58 36.43 NOx 35.84 20.08 SOx 0.91 0.96 ROG 52.54 47.83 Ammonia 11.80 12.86
A Summary of Emission Inventory Methodologies prepared by CARB staff is contained in Attachment 1. This Summary describes the methodologies used in preparing the CARB emission inventory for Sacramento County that was relied upon for compiling categories of emissions by District staff and is being submitted to U.S. EPA as a revision of the California SIP.
Maintenance Demonstration
The District used the 1999 CARB speciated rollback analysis to evaluate the impacts of emissions inventory changes over the period of the 2010 PM10 Plan. The CARB analysis used a Chemical Mass Balance (CMB) receptor model to link ambient PM10 species to emission inventory sectors during 1995. The results of the CARB analysis are presented in Table 3.
5 Motallebi, Nahzat. “Wintertime PM2.5 and PM10 Source Apportionment at Sacramento California.” Air and Waste Management Association [1999] 6 2019 CEPAM: External Adjustment Reporting Tool, California Air Resources Board internal webpage, accessed on June 28, 2021

11
Table 3. 1995 CARB CMB Ambient PM10 Source Apportionment
PM10 CMB Source Category 1995 CMB Modeling Results µg/m3
1995 CMB Modeling
Results % of Total
Ammonium Nitrate 14.90 28.9% Ammonium Sulfate 2.27 4.4% Motor Vehicles 11.79 22.9% Wood Smoke 8.57 16.6% Fugitive Dust 6.40 12.4% Unidentified Other 7.60 14.7% Total PM10 51.53 100.00%
The District used these relationships to forecast future PM10 concentrations based on changes in emission inventory sectors between the 1995 study year and the 2033 Plan horizon year. These changes are shown in Table 4.
Table 4. PM10 and Precursor Emissions Inventories for Sacramento County
Emissions Emission Inventory tons per winter day
1995
Emission Inventory tons per winter day
2033
% Change from Base Year
NOx 118.2 20.1+1.7* 81.6% SOx 2.2 1.0+0.3* 40.9% Motor Vehicles 3.6 2.5 30.6% Wood Smoke 10.2 9.1 10.8% Fugitive Dust 17.8 23.1 -29.8% Unidentified Other 1.5 1.8 -20.0%
* The numbers after the “+” signs for emissions in 2033 are Emission Reduction Credits banked by the District for future use in stationary source permitting.
Table 5 shows the resulting changes in forecasted PM10 concentrations in 2033 based on the CMB source category fractions and the changes in PM10 and precursor emissions between 1995 and 2033. The assumption is that a one percent reduction in emissions reduces ambient concentrations of the corresponding precursor by one percent, except for ammonium nitrate. Research has shown that reductions in NOx emissions do not produce linear reductions in ammonium nitrate ambient concentrations, but instead a one percent reduction in NOx emissions corresponds to a 0.7 percent reduction in ammonium nitrate concentrations.
12
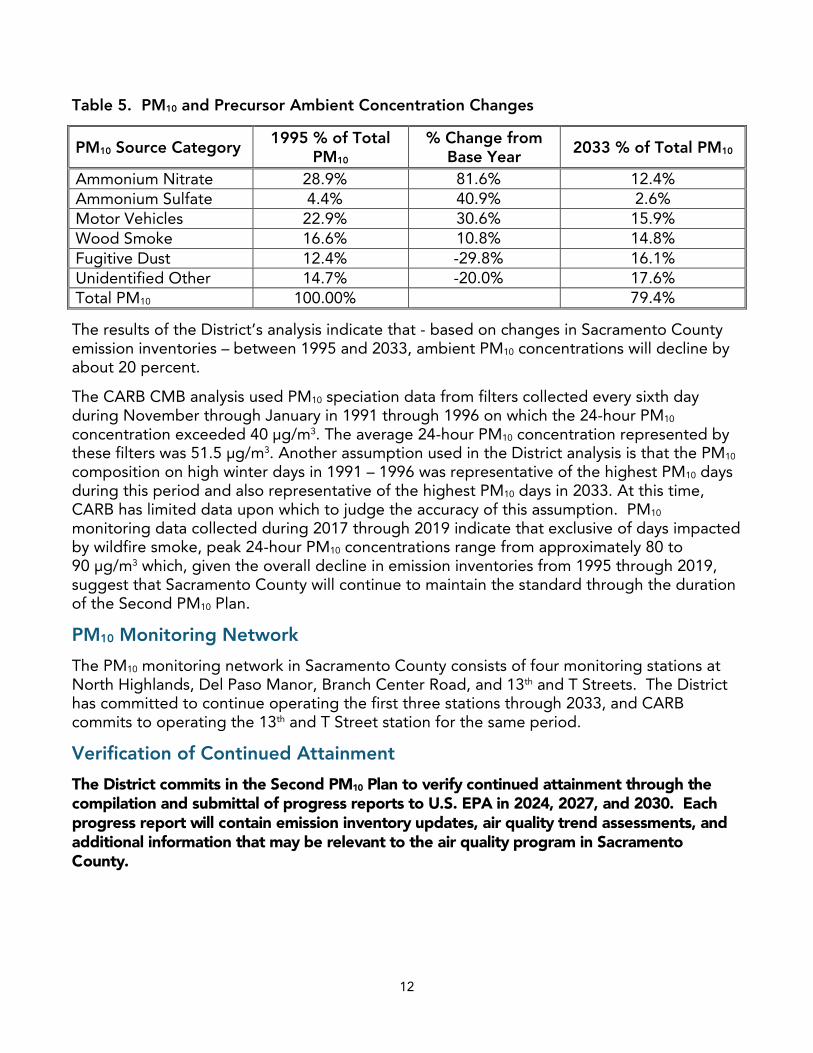
Table 5. PM10 and Precursor Ambient Concentration Changes
PM10 Source Category 1995 % of Total
PM10 % Change from
Base Year 2033 % of Total PM10
Ammonium Nitrate 28.9% 81.6% 12.4% Ammonium Sulfate 4.4% 40.9% 2.6% Motor Vehicles 22.9% 30.6% 15.9% Wood Smoke 16.6% 10.8% 14.8% Fugitive Dust 12.4% -29.8% 16.1% Unidentified Other 14.7% -20.0% 17.6% Total PM10 100.00% 79.4%
The results of the District’s analysis indicate that - based on changes in Sacramento County emission inventories – between 1995 and 2033, ambient PM10 concentrations will decline by about 20 percent.
The CARB CMB analysis used PM10 speciation data from filters collected every sixth day during November through January in 1991 through 1996 on which the 24-hour PM10 concentration exceeded 40 µg/m3. The average 24-hour PM10 concentration represented by these filters was 51.5 µg/m3. Another assumption used in the District analysis is that the PM10 composition on high winter days in 1991 – 1996 was representative of the highest PM10 days during this period and also representative of the highest PM10 days in 2033. At this time, CARB has limited data upon which to judge the accuracy of this assumption. PM10 monitoring data collected during 2017 through 2019 indicate that exclusive of days impacted by wildfire smoke, peak 24-hour PM10 concentrations range from approximately 80 to 90 µg/m3 which, given the overall decline in emission inventories from 1995 through 2019, suggest that Sacramento County will continue to maintain the standard through the duration of the Second PM10 Plan.
PM10 Monitoring Network
The PM10 monitoring network in Sacramento County consists of four monitoring stations at North Highlands, Del Paso Manor, Branch Center Road, and 13th and T Streets. The District has committed to continue operating the first three stations through 2033, and CARB commits to operating the 13th and T Street station for the same period.
Verification of Continued Attainment
The District commits in the Second PM10 Plan to verify continued attainment through the compilation and submittal of progress reports to U.S. EPA in 2024, 2027, and 2030. Each progress report will contain emission inventory updates, air quality trend assessments, and additional information that may be relevant to the air quality program in Sacramento County.

13
Contingency Plan
The Act requires a maintenance plan to include contingency provisions for prompt correction of any PM10 standard violation that might occur after the area has been redesignated to attainment. If a violation of the standard occurs, the District will evaluate the cause of the exceedance within six months of occurrence. If the exceedance is determined to result from a natural or exceptional event, the District will prepare and submit the necessary documentation for a natural or exceptional event as required by U.S. EPA’s “Initial Notification of Potential Exceptional Event” (40 CFR 50.14(c)(2)). If the exceedance does not qualify as a natural or exceptional event, the District will adopt and implement applicable control measures within a 12-month period following the completion of exceedance analysis.
Motor Vehicle Emission Budgets
The Act requires that transportation plans, programs, and projects receiving federal funding or requiring federal approval must be fully consistent with the applicable SIP. The federal Transportation Conformity Rule requires SIPs to specify on-road motor vehicle emission budgets (transportation conformity budgets) that are consistent with the attainment and maintenance demonstrations in the SIP.7 The conformity regulation requires transportation agencies to demonstrate that emissions from applicable portions of regional transportation plans and programs do not exceed these emissions budgets.
The transportation conformity budgets in PM10 SIPs must include emissions from several categories of sources that are integral components of on-road infrastructure construction, maintenance, and use. These source categories are identified in the Second PM10 Plan as vehicle exhaust, vehicle wear (e.g., abrasive generation of particles from brake linings, tire surfaces, etc.), re-entrained road dust, and road construction.
Table 6 shows the District-adopted transportation conformity budgets for NOx and PM10 emissions for Sacramento County. If U.S. EPA determines these budgets to be adequate, future transportation plan amendments and updates in Sacramento County will need to conform to these budgets. The Sacramento Area Council of Governments (SACOG - the Municipal Planning Organization for the Sacramento region) must ensure that the aggregate transportation NOx and PM10 emissions in Sacramento County do not exceed these levels when approving new transportation plans and transportation programs, even if the mix of projects changes or growth increases. These budgets will remain in effect until other budgets are found adequate through approval by U.S. EPA.
7 The Transportation Conformity Regulation is found at 40 CFR Parts 51 and 93.

14
Table 6. Motor Vehicle Emission Budgets for PM10 Maintenance Plan (tons per winter day)
Mobile Source PM10 Emissions (tons per annual average day)
2024 NOx
2024 PM10
2027 NOx
2027 PM10
2033 NOx
2033 PM10
Vehicular Exhaust, Tire and Brake Weara
10.68 2.09 9.57 2.17 8.30 2.27
Re-Entrained Paved Road Dust N/A 8.25 N/A 8.52 N/A 9.15
Re-Entrained Unpaved Road Dust (City and County Roads)
N/A 0.62 N/A 0.61 N/A 0.59
Road Construction Dust N/A 3.65 N/A 4.04 N/A 4.31
Safety Margin 0.5 N/A N/A N/A N/A N/A
Totalb 11.19 14.62 9.57 15.34 8.30 16.32
Motor Vehicle Emission Budgetc 11.2 14.7 9.6 15.4 8.4 16.4
a These values reflect the adjustment factor for SAFE Vehicle Rule part one using EMFAC 2017. b Values from CEPAM 2019 External Adjustment Reporting Tool Version 1.02 may not add up due to rounding. c Motor Vehicle Emission Budgets are rounded up from the previous row, which the Total, to the nearest tenth of a ton per day.
The Safety Margin of 0.5 tons per day of NOx was added to the 2024 NOx budgets to accommodate the emissions increase resulting from switching from EMFAC2014 to EMFAC 2017. Previous conformity determinations by SACOG were based on EMFAC2014. SACOG will be using EMFAC2017 in their next Metropolitan Transportation Plan update in 2022. Including the safety margin for NOx will not impact the ability to demonstrate maintenance of the PM10 standard in the future.
General Conformity
General conformity requirements contained in District Rule 104 that incorporates the provisions of Code of Federal Regulations title 40, chapter I, subchapter C, part 6 and part 51, sections 51.850 through 51.860, in effect on November 3, 1994, as enforceable District regulations. These regulations require that federal actions and federally funded non-transportation projects conform to SIP rules and they not interfere with efforts to attain federal air quality standards.
Environmental Impacts
The District filed a Notice of Exemption under the California Environmental Quality Act (CEQA) for the Second PM10 Plan. The Notice of Exemption reports that the adoption of the Second PM10 Plan is exempt from the requirements of CEQA as this action qualifies for a

15
Categorical Exemption as a Class 8 action taken by a regulatory agency for the protection of the environment.8
CARB has determined that its review and approval of the Second PM10 Plan submitted by the District for inclusion in the SIP is a ministerial activity by CARB for purposes of CEQA (14 CCR § 15268). A “ministerial” decision is one that involves fixed standards or objective measurements, and the agency has no discretion to shape the activity in response to environmental concerns. (14 CCR § 15369; San Diego Navy Broadway Complex Coalition v. City of San Diego (2010) 185 Cal.App.4th 924, 934.)
CARB’s review of the Second PM10 Plan is limited to determining if it meets all the requirements of the Act. CARB is prohibited from not approving it or changing it unless CARB finds that it does not comply with the Act (HSC § 41650 and 41652). Since CARB’s review concludes that the Plan meets the requirements of the Act, CARB lacks authority to not adopt the plan, or modify it, in response to environmental concerns raised through the CEQA process. Therefore, CARB’s action on the plan is ministerial for purposes of CEQA.
Approval of Attachment 1, Summary of Emission Inventory Methodologies, is exempt from CEQA under California Code of Regulations, title 14, section 15061(b)(3) (“common sense” exemption) because the record evidence shows with certainty that there is no possibility that the proposed approval may result in a significant adverse impact on the environment.
Staff Recommendation
CARB staff has reviewed the Second PM10 Plan and consulted with District staff during this review. CARB staff finds that the Second PM10 Plan meets all applicable Act requirements. The monitoring data shows that the area attained the PM10 standard in 1998, and the maintenance demonstration shows that the standard will be maintained through 2033, the horizon year for the Second PM10 Plan.
Therefore, staff recommends that the Board adopt the Second 10-Year PM10 Maintenance Plan for Sacramento County and submit the Second PM10 Plan to U.S. EPA for approval as a revision to the California State Implementation Plan (SIP) and direct the Executive Officer to work with the District and U.S. EPA and take appropriate action to resolve any completeness or approvability issues that may arise regarding the SIP submission. Additionally, staff recommends that the Board authorize the Executive Officer to include in the SIP submittal any technical corrections, clarifications, or additions that may be necessary to secure U.S. EPA approval.
8 California Code of Regulations, Title 14, Division 6, Chapter 3, Article 19, Section 15308

16

Attachment 1
Summary of Emission Inventory Methodologies
18
CARB Sacramento County PM10 Maintenance Plan Emission Inventory Write-Up
CEPAM 2019 v1.02
Contents Emission Inventory Background ............................................................................................ 19
Emissions Inventory Overview .............................................................................................. 19
Inventory Base Year ........................................................................................................... 19
Forecasted Inventories ....................................................................................................... 20
Temporal Resolution .......................................................................................................... 20
Geographic Scope .............................................................................................................. 20
Quality Assurance and Quality Control ............................................................................. 20
Emission Inventory Components ........................................................................................... 21
Mobile Source Emissions .................................................................................................... 21
On-Road Mobile Source Emissions ................................................................................ 21
Off-Road Mobile Source Emissions ................................................................................ 23
Mobile Source Forecasting ............................................................................................. 25
Stationary Point Sources .................................................................................................... 27
Area-Wide Sources ............................................................................................................. 29
Point and Areawide Source Emissions Forecasting ...................................................... 32

19
Emission Inventory Background
Emissions inventories are one of the fundamental building blocks in the development of a Maintenance Plan (MP or Plan). In other words, an emissions inventory is a systematic listing of the sources of air pollution along with the amount of pollution emitted from each source or category over a given time period. This document describes the emissions inventory included in the California Emission Projection Analysis Model (CEPAM), 2019 Emission Projections, Version 1.02.
The California Air Resources Board (CARB) and the Sacramento Metropolitan Air Quality Management District (District) have developed a comprehensive, accurate, and current emissions inventory consistent with the requirements set forth in Section 182(a)(1) of the federal Clean Air Act. CARB and District staff conducted a thorough review of the inventory to ensure that the emission estimates reflect accurate emission reports for point sources, and that estimates for mobile and areawide sources are based on the most recent models and methodologies at the time of development.
CARB also reviewed the growth profiles for point and areawide source categories and updated them as necessary to ensure that the emission projections are based on data that reflect historical trends, current conditions, and recent economic and demographic forecasts. Growth forecasts for most point and areawide sources were developed by CARB.
Emissions Inventory Overview
Emissions inventories are estimates of the amount and type of pollutants emitted into the atmosphere by industrial facilities, mobile sources, and areawide sources such as consumer products and paint. They are fundamental components of an air quality plan, and serve critical functions such as:
1. the primary input to air quality modeling used in attainment demonstrations; 2. the emissions data used for developing control strategies; and 3. a means to track progress in meeting the emission reduction commitments.
The inventory in this Plan contains emissions data for directly emitted particulate matter under 10 microns per meter cubed (PM10) and oxides of Nitrogen (NOx), which is one of the precursors to PM10.
Inventory Base Year
The base year inventory forms the basis for all future year projections and establishes the emission levels against which progress in emission reductions will be measured. The U.S. Environmental Protection Agency (U.S. EPA) regulations establish that the base year inventory should be preferably consistent with the triennial reporting schedule required under the Air Emissions Reporting Requirements (AERR) rule. CARB selected 2017, which is

20
the most recent triennial National Emissions Inventory (NEI) year required to be submitted to U.S. EPA, as the base inventory year.
Forecasted Inventories
In addition to a base year inventory, U.S. EPA regulations also require future year inventory projections for specific years. Forecasted inventories are a projection of the base year inventory that reflects expected growth trends for each source category and emission reductions due to adopted control measures. CARB develops emission forecasts by applying growth and control profiles to the base year inventory.
Growth profiles for point and areawide sources are derived from surrogates, such as economic activity, fuel usage, population, housing units, etc., that best reflect the expected growth trends for each specific source category. Growth projections were obtained primarily from government entities with expertise in developing forecasts for specific sectors, or, in some cases, from econometric models. Control profiles, which account for emission reductions resulting from adopted rules and regulations, are derived from data provided by the regulatory agencies responsible for the affected emission categories.
Projections for mobile source emissions are generated by models that predict activity rates and vehicle fleet turnover by vehicle model year along with activity inputs from the metropolitan planning organization (MPO). As with stationary sources, the mobile source models include control algorithms that account for all adopted regulatory actions.
Temporal Resolution
Planning inventories typically include annual as well as seasonal (summer and winter) emission estimates. Annual emission inventories represent the total emissions over an entire year (tons per year), or the daily emissions produced on an average day (tons per day). Seasonal inventories account for temporal activity variations throughout the year, as determined by category-specific temporal profiles. Since PM10 concentrations tend to be highest during the winter months, the emission inventory used in this Plan is based on the winter season (November through April).
Geographic Scope
The inventory presented in this Plan consists of the Sacramento County PM10 Nonattainment Area.
Quality Assurance and Quality Control
CARB has established a quality assurance and quality control (QA/QC) process to ensure the integrity and accuracy of the emission inventories used in the development of air quality plans. QA/QC occurs at the various stages of SIP emission inventory development. Base year

21
emissions are assembled and maintained in the California Emission Inventory Development and Reporting System (CEIDARS). CARB inventory staff works with District staff, who are responsible for developing and reporting point source emission estimates, to verify these data are accurate. The locations of point sources, including stacks, are checked to ensure they are valid. Area-wide source emission estimates are developed by CARB and District staff. The methodologies are reviewed by both CARB and District staff before their inclusion in the emission inventory. Mobile categories are verified with CARB mobile source staff for consistency with the on-road and off-road emission models. Additionally, CEIDARS is designed with automatic system checks to prevent errors, such as double counting of emission sources. The system also makes various reports available to assist staff in their efforts to identify and reconcile anomalous emissions.
Emission Inventory Components
A summary of the components that make up the Plan’s emission inventory is presented in the following sections. These include mobile (on- and off-road) sources, stationary point sources, and areawide sources. Natural sources are not included in this emission inventory.
Mobile Source Emissions
CARB develops the emission inventory for the mobile sources using various modeling methods. These models account for the effects of various adopted regulations, technology types, fleet turnover, and seasonal conditions on emissions. Mobile sources in the emission inventory are composed of both on-road and off-road sources, described in the sections below.
On-Road Mobile Source Emissions
Emissions from on-road mobile sources, which include passenger vehicles, buses, and trucks, were estimated using outputs from CARB’s EMFAC2017 model. The on-road emissions were calculated by applying EMFAC2017 emission factors to the transportation activity data provided by the Sacramento Area Council of Governments (SACOG), the local MPO.
EMFAC2017 includes data on California’s car and truck fleets and travel activity. Light-duty motor vehicle fleet age, vehicle type, and vehicle population were updated based on 2016 DMV data. The model also reflects the emissions benefits of CARB’s recent rulemakings such as the Pavley Standards and Advanced Clean Cars Program and includes the emissions benefits of CARB’s Truck and Bus Rule and previously adopted rules for other on-road diesel fleets.
EMFAC2017 utilizes a socio-econometric regression modeling approach to forecast new vehicle sales and to estimate future fleet mix. Light-duty passenger vehicle population includes 2016 DMV registration data along with updates to mileage accrual using Smog Check data. Updates to heavy-duty trucks include model year specific emission factors based

22
on new test data, and population estimates using DMV data for in-state trucks and International Registration Plan (IRP) data for out-of-state trucks.
EMFAC2017 SAFE Vehicles Rules Off-Model Adjustment
On September 27, 2019, U.S. EPA and National Highway Traffic Safety Administration (NHTSA) published the “Safer Affordable Fuel-Efficient (SAFE) Vehicles Rule Part One: One National Program.”9 The Part One Rule revokes California’s authority to set its own greenhouse gas emissions standards and set zero-emission vehicle mandates in California. The SAFE Vehicle Rule Part One impacts some of the underlying assumptions in CARB’s EMFAC2017 model, which was used to assess emissions from on-road mobile sources. Therefore, CARB developed off-model adjustment factors for future transportation emissions estimates using EMFAC2017 to reflect SAFE Vehicle Rule Part One. These adjustments, provided in the form of multipliers, were applied to emissions outputs from the EMFAC2017 model to account for the impact of this rule. The off-model adjustment factors were only applied to emissions from gasoline light duty vehicles (LDA, LDT1, LDT2 and MDV).
EMFAC2017 ACT Off-Model Adjustment
The Advanced Clean Trucks (ACT) regulation was approved on June 25, 2020 and has two main components, a manufacturers zero-emission vehicle (ZEV) sales requirement and a one-time reporting requirement for large entities and fleets. The first component requires manufacturers to sell ZEVs as a percentage of annual truck and bus sales in California for model years 2024 and newer.
The ACT regulation impacts some of the underlying assumptions in CARB’s EMFAC2017 model, which was used to assess emissions from on-road mobile sources. Therefore, CARB developed off-model adjustment factors in order to reflect the regulation. Adjustment factors were based on the percentage of California-certified ZEV sales for each EMFAC category and model year. More information on inventory modelling methods can be found in the ACT Initial Statement of Reasons (ISOR) Appendix F. These adjustments, provided in the form of multipliers, were applied to emissions outputs from the EMFAC2017 model to account for the impact of the ACT regulation.
The ACT off-model adjustment factors were only applied to the medium-and heavy-duty truck sectors. Off-model calculations were done in the Mobile Emissions Toolkit for Analysis (META).
EMFAC2017 Heavy-Duty Omnibus Off-Model Adjustment
On August 27, 2020, CARB adopted the Heavy-Duty Omnibus regulation (Ominibus Regulation), which would establish NOx engine emission standards 90 percent lower than today's levels. The Omnibus Regulation will dramatically reduce NOx emissions by
9 84 FR 51310.

23
comprehensively overhauling exhaust emission standards, test procedures, and other emissions-related requirements for 2024 and subsequent model year California-certified heavy-duty engines.
The Omnibus Regulation impacts some of the underlying assumptions in CARB’s EMFAC2017 model, which was used to assess emissions from on-road mobile sources. Therefore, CARB developed off-model adjustment factors in order to reflect the regulation. These adjustments, provided in the form of multipliers, were applied to emissions outputs from the EMFAC2017 model to account for the impact of the Omnibus Regulation. The adjustment factors reflect the impact of all components of the Omnibus Regulation on in-use (i.e. real-world) NOx emissions and deterioration-related emissions. More details on the inventory analysis for this regulation can be found in Appendix D of the Heavy-Duty Omnibus Initial Statement of Reasons (ISOR) Appendix D.
The Omnibus Regulation off-model adjustment factors were only applied to on-road heavy-duty engines. Off-model calculations were done in the Mobile Emissions Toolkit for Analysis (META).
Off-Road Mobile Source Emissions
Emissions from off-road sources are estimated using a suite of category-specific models or, where a new model was not available, the OFFROAD2007 model. Many of the newer models are developed to support recent regulations, including in-use off-road equipment, ocean-going vessels, and others. The sections below summarize the updates made to specific off-road categories.
Commercial Harbor Craft
Commercial Harbor Craft (CHC) are grouped into 18 vessel types: articulated tug barge (ATB), bunker barge, towed petrochemical barge, other barge, dredge, commercial passenger fishing, commercial fishing, crew and supply, catamaran ferry, monohull ferry, short run ferry, excursion, ATB tug, push and tow tug, escort/ship assist tug, pilot boat, research boat, and work boat.
Vessel and engine activity data were obtained from reported data by vessel operators to CARB in March 2019 (hereinafter referred to as CARB reporting 2019). Vessel population data were collected from various sources, including the CARB reporting 2019, U.S. Coast Guard, and estimates by Port of Los Angeles, Long Beach, and Oakland. Population and activity growth factors were inferred from historical growth trends in the past decade. Survival and purchasing rates were developed from the age distribution of CHC from CARB reporting 2019. Load factors were updated using CARB reporting 2019 and engine control module data from industry. Emission factors were updated based on U.S. EPA marine and off-road engine certification data.

24
Pleasure Crafts and Recreational Vehicles
Pleasure craft, or recreational watercraft (RW), is a broad category of marine vessels that includes gasoline-powered spark-ignition marine watercraft (SIMW) and diesel-powered marine watercraft. Off-highway recreational vehicles (OHRV) include off-highway motorcycles (OHMC), all-terrain vehicles (ATV), off-road sport vehicles, off-road utility vehicles, sand cars, and golf carts. A new model was developed in 2014 to estimate emissions from pleasure craft and another new model was developed in 2018 to estimate emissions from recreational vehicles. In both cases, population, activity, and emission factors were re-assessed using new surveys, DMV registration information, and emissions testing.
Locomotives
Line-Haul (Class I): The line-haul locomotive model population and activity is based primarily on line-haul population, activity and fuel use data reported to CARB by the two primary Class I freight locomotive companies that operate in California. To estimate emissions and forecast future Tier mix, CARB used activity, rail visit, fuel consumption, and remanufacturing behavior data obtained for the calendar years 2010 to 2018. Emission factors are based on U.S. EPA published reports for emission inventory development, updated in 2016.
Short-Haul (Class III): Short-haul locomotive emissions were developed directly from voluntary reporting data provided by the 22 short-haul companies, and included engine population, age, activity, and fuel use. Forecasting was based on discussions with industry, which reflected plans to turn over engines or grow activity or population. Emission factors are based on U.S. EPA published reports, updated in 2016.
Passenger: Passenger locomotive emissions were developed based on voluntary reporting by all he passenger locomotive agencies and companies, with 2017 base year. This data included interstate operations such as Amtrak, as well as smaller regional operations. The reporting data included population, age, fuel use that were incorporated into the inventory. Forecasting was based on discussions with industry, and included public funding of locomotives to newer, cleaner engines where contracts were in place. Emission factors are based on U.S. EPA published reports, updated in 2014 for passenger locomotives.
Diesel Agricultural Equipment
The inventory for agricultural diesel equipment (such as tractors, harvesters, combines, sprayers, and others) is based on a voluntary survey of farmers, custom operators, and first processors conducted in 2009. The survey data, along with information from the 2007 USDA Farm Census, was used to revise almost every aspect of the agricultural inventory, including population, activity, age distribution, fuel use, and allocation. Agricultural growth rates through 2050 were developed through a contract with URS Corp.

25
In-Use Off-Road Equipment
This category covers construction, industrial, mining, oil drilling, and ground support equipment. CARB developed this model in 2010 to support the analysis for amendments to the In-Use Off-Road Diesel Fueled Fleets Regulation. Population is based on reporting data, while activity, load, and fuel use are based on survey data and statewide fuel estimates.
Cargo Handling Equipment
The emissions inventory for the Cargo Handling Equipment category reflects 2011 information on equipment population, activity, recessionary impacts on growth, and engine load. The information includes regulatory reporting data which provide an accounting of all the cargo handling equipment in the State including their model year, horsepower, and activity.
Transportation Refrigeration Units (TRU)
This model reflects updates to activity, population, growth and turn-over data, and emission factors developed to support the 2021 TRU rule amendments. The population is based on 2020 ARBER reporting data (reporting database, required for all California TRUs), as well as dataloggers for TRUs for activity, certification data specific to TRU engines for new emission factors. Forecasting was based on IBIS World Reports forecast for related industries, and turnover was forecasted based on 2011 to 2020 equipment population trends.
Small Off-Road Engines (SORE)
Small off-road engines (SORE) are spark-ignition engines rated at or below 19 kilowatts (i.e., 25 horsepower). Typical engines in this category are used in lawn and garden equipment as well as other outdoor power equipment and specialty vehicles and cover a broad range of equipment. The majority of this equipment belongs to the Lawn & Garden (e.g., lawnmower, leaf blower, trimmer) and Light Commercial (e.g., compressor, pressure washer, generator) categories of CARB’s SORE emissions inventory model.
The newly developed, stand-alone SORE2020 Model reflects the recovering California economy from the 2008 economic recession and incorporates emission results from CARB’s recent in-house testing as well as CARB’s most recent Certification Database. CARB also has conducted an extensive survey of SORE operating within California through the Social Science Research Center (SSRC) at the California State University, Fullerton (CSUF). Data collected through this survey provides the most up-to-date information regarding the population and activity of SORE equipment in California.
Mobile Source Forecasting
Table 1, below, summarizes the data and methods used to forecast future-year mobile source emissions by broad source category groupings.

26
Table 1. Mobile Source Categories
Category Growth Methodology
On-Road Sources
All Match total VMT projections provided by SACOG
Off-Road Gasoline Fueled Equipment Lawn & Garden
Household growth projection
Off-Road Gasoline Fueled Equipment Off-Road Equipment
Employment growth projection
Off-Road Gasoline Fueled Equipment Recreational Boats
Housing starts (short-term) and human population growth (long-term)
Off-Road Gasoline Fueled Equipment Recreational Vehicles
Housing starts (short-term) and human population growth (long-term)
Off-Road Diesel-Fueled Equipment Commercial Harbor Craft
Growth rates provided by District, except for tugs and fishing vessels. Fishing fleet growth rates were adjusted to reflect a decline in fish landings. Assumed no growth for tugboats.
Off-Road Diesel-Fueled Equipment Construction and Mining
California construction employment data from U.S. Bureau of Labor Statistics
Off-Road Diesel-Fueled Equipment Farm Equipment
2011 study of forecasted growth by URS Corp.
Off-Road Diesel-Fueled Equipment Industrial Equipment
California construction employment data from Bureau of Labor Statistics

27
Category Growth Methodology
Off-Road Diesel-Fueled Equipment Trains
Line Haul: FAF 4.5 growth projections and historical Bureau of Transportation Statistics locomotive fuel trends (2010-2019 data)
Short Haul and Passenger: No Growth
Off-Road Diesel-Fueled Equipment Transport Refrigeration Units
Projection of historical Truck/Trailer TRU sales from ACT Research, adjusted for recession.
Off-Road Equipment (Other Fuels) Aircraft
All aircraft categories are grown by Federal Air Administration Terminal Area Forecast data (2015), except for agricultural aircraft which is a California Agricultural Aircraft Association State Ag Aircraft Projection (2004)
Stationary Point Sources
The stationary source inventory is composed of point sources and area-wide sources. The data elements in the inventory are consistent with the data elements required by the Air Emissions Reporting Requirements (AERR). The inventory reflects actual emissions from industrial point sources reported to the District by the facility operators through calendar year 2017.
Stationary point sources also include smaller point sources that are not inventoried individually but are estimated as a group and reported as a single source category. Emissions from these sources are estimated using various models and methodologies. Estimation methods include source testing, direct measurement by continuous emissions monitoring systems, or engineering calculations. Emissions for these categories are estimated by both CARB and the Districts.
The point source categories that occur in the PM10 Sacramento County Nonattainment Area are listed below in Table 2.
Table 2. Point Source Categories
Source Category Subcategory
Fuel Combustion Electrical Utilities

28
Source Category Subcategory
Fuel Combustion Cogeneration
Fuel Combustion Oil and Gas Production (Combustion)
Fuel Combustion Manufacturing and Industrial
Fuel Combustion Food and Agricultural Processing
Fuel Combustion Service and Commercial
Fuel Combustion Other (Fuel Combustion)
Waste Disposal Landfills
Waste Disposal Incinerators
Waste Disposal Soil Remediation
Waste Disposal Other (Waste Disposal)
Petroleum Production and Marketing Petroleum Marketing
Industrial Processes Chemical
Industrial Processes Food and Agriculture
Industrial Processes Mineral Processes
Industrial Processes Metal Processes
Industrial Processes Wood and Paper
Industrial Processes Electronics
Industrial Processes Other (Industrial Processes)

29
Estimates for the categories below were developed by CARB and has been reviewed by CARB staff to reflect the most up-to-date information at the time of the development of the model.
Agricultural Diesel Irrigation Pumps
This category includes emissions from the operation of diesel-fueled stationary and mobile agricultural irrigation pumps. The emission estimates are based on a 2003 CARB methodology using statewide population and include replacements due to the Carl Moyer Program. Emissions are grown based on projected acreage for irrigated farmland from the California Department of Conservation’s Farmland Mapping and Monitoring Program (FMMP), 2008.
Area-Wide Sources
Area-wide sources include categories where emissions take place over a wide geographic area, such as consumer products. Emissions from these sources are estimated using various models and methodologies. Estimation methods include source testing, direct measurement by continuous emissions monitoring systems, or engineering calculations. Emissions for these categories are estimated by both CARB and the District.
The area-wide source categories that occur in the PM10 Sacramento County Nonattainment Area are listed below in Table 3.
Table 3. Area-Wide Source Categories
Source Category Subcategory
Solvent Evaporation Asphalt Paving and Roofing
Miscellaneous Processes Residential Fuel Combustion
Miscellaneous Processes Farming Operations
Miscellaneous Processes Construction and Demolition
Miscellaneous Processes Paved Road Dust
Miscellaneous Processes Unpaved Road Dust
Miscellaneous Processes Fugitive Windblown Dust
Miscellaneous Processes Fires

30
Source Category Subcategory
Miscellaneous Processes Managed Burning and Disposal
Miscellaneous Processes Cooking
Estimates for the categories below were developed by CARB and has been reviewed by CARB staff to reflect the most up-to-date information at the time of the development of the model.
Residential Wood Combustion
The methodology for residential wood combustion reflects 2005 fuel use. The emission estimates reflect emission factors from U.S. EPA’s National Emission Inventory. No growth is assumed for future years.
Residential Natural Gas Combustion
CARB staff updated the methodology to reflect 2017 fuel use from the California Energy Consumption Database. The emissions estimates reflect the most recent emissions factors from U.S. EPA’s AP-42 for residential natural gas combustion. Growth is based on California Energy Commission (CEC) projections for natural gas consumption, 2014.
Residential Distillate Oil and Liquefied Petroleum Gas
The residential distillate oil/liquefied petroleum gas (LPG) category includes emissions occurring in the residential sector. Distillate oil for heating is generally used in older homes and remote areas where natural gas lines are not available.
Activity is based on the number of housing units, population, and LPG and distillate oil capacities. The 1991 Fuels Report Working Paper published by the CEC was used to determine energy demand by fuel type in terms of the number of houses heated by a specific fuel in a particular area. Heating degree days (HDD) are used to estimate how many heating days are likely to occur in a particular area.
This category uses emission factors from U.S. EPA's AP-42. The emissions were initially calculated in 1993 then grown to 2012 using housing unit data from the DOF, 2013. Emissions were grown from 2012 to 2017 using a ‘no growth’ profile developed by Pechan (2012).

31
Farming Operations
Cattle emissions are primarily based on the USDA 2012 Census of Agriculture. A seasonal adjustment was added to account for the suppression of dust emissions in months in which rainfall occurs. No growth is assumed for dairy and feedlots.
Construction and Demolition
Emission estimates for building construction and road construction operations are based on CARB methodologies. Emissions are estimated by applying emission factors developed by Midwest Research Institute (MRI) to the acreage disturbed by construction. The emission estimates were grown from CARB estimates developed in 2002 and 1997, respectively. The growth profile for construction is based on DOF construction jobs forecast, 2020.
Paved Road Dust
Paved road dust emissions for 2017 were estimated in 2021 using a CARB methodology consistent with the current U.S. EPA method (AP-42). Data from CARB’s EMFAC2017 model, the District and its transportation planning agency were used to estimate region specific vehicle miles traveled (VMT). VMT were distributed using 2017 travel fractions calculated using California Department of Transportation (Caltrans) Highway Performance Monitoring System (HPMS) data, by COADBIS, for each of five road types: freeway, major, collector, and local/local urban, and local rural. Emissions were grown using VMT projections from SACOG.
Unpaved Road Dust – Farm Roads
Emissions for unpaved farm roads are based on CARB’s methodology and 2012 harvested crop acreage from NASS. Emissions reflect crop specific VMT rates and an emission factor based on California test data conducted by the University of California, Davis (UC Davis), and the Desert Research Institute (DRI). Temporal profiles are based on crop specific activity profiles. Growth for this category is based on projected FMMP farmland acreage, 2016.
Unpaved Nonfarm Road Dust
Emissions from unpaved nonfarm roads were estimated from 2008 unpaved road data collected from the California Statewide Local Streets and Roads Needs Assessment, Caltrans, and local agencies. Dust emissions were calculated using an emission factor derived from tests conducted by UC Davis and DRI. In addition, a rainfall adjustment factor was applied. Staff assumed no growth for this category based on the assumption that existing unpaved roads tend to get paved as vehicle traffic on them increases, which counteracts any additional emissions from new unpaved roads.
Fugitive Windblown Dust from Open Areas and Non-pasture Agriculture Lands
Fugitive windblown dust emissions were estimated using CARB’s 1997 methodology. The methodology is based on 1993 harvested crop acreage and a wind erosion equation that incorporates climate, soil, and vegetative cover attributes. Emissions for agricultural lands

32
were grown based on projections of acreage from FMMP, 2016. No growth is assumed for non-agricultural lands.
Windblown Dust from Unpaved Roads and Associated Areas
Emissions for this source category were estimated based on a 1997 CARB methodology reflecting unpaved road mileage and local parameters that affect wind erosion. The estimates assume no growth.
Fires
Emissions from structural and automobile fires were estimated based on a 1999 CARB methodology using the number of fires and the associated emission factors. Estimates for structural fires are calculated using the amount of the structure that is burned, the amount and content of the material burned, and emission factors derived from test data. Estimates for automobile fires are calculated using the weight of the car and components and composite emission factors derived from AP-42 emission factors. Growth is based on DOF population forecasts, 2020.
Managed Burning & Disposal
CARB updated the emissions inventory to reflect burn data reported by air district staff for 2017. Emissions are calculated using crop specific emission factors and fuel loadings. Temporal profiles reflect monthly burn activity. Growth for agricultural burning is based on CARB projections of FMMP farmland acres, 2016. No growth is assumed for burning associated with weed abatement.
Point and Areawide Source Emissions Forecasting
Emission forecasts (2018 and subsequent years) are based on growth profiles that in many cases incorporate historical trends up to the base year or beyond. The growth surrogates used to forecast the emissions from these categories are presented below in Table 4. The emissions inventory also reflects emission reductions from point and areawide sources subject to District rules and CARB regulations, as described in Table 5.
Table 4: Growth Surrogates for Point and Areawide Sources Source Category Subcategory Growth Surrogate Electric Utilities
Natural Gas California Energy Commission (CEC) Integrated Energy Policy Report forecast, 2017
Electric Utilities Other Fuels Energy Information Administration (EIA) Annual
Energy Outlook, 2019 Cogeneration All CEC forecast, 2017 Oil and Gas Production (Combustion)
All Assumed 2.9% annual decline reflecting CalGEM historical trend, 2000 through 2016

33
Source Category Subcategory Growth Surrogate Manufacturing and Industrial
Natural Gas CEC forecast, 2014
Manufacturing and Industrial
Other Fuels EIA forecast, 2018
Food and Agricultural Processing
Ag Irrigation I. C. Engines
FMMP irrigated farmland acreage, 2008
Food and Agricultural Processing
Natural Gas CEC forecast, 2014
Food and Agricultural Processing Others
REMI economic forecast, version 2.4.3; EIA forecast, 2018
Service and Commercial
Natural Gas CEC forecast, 2014
Service and Commercial
Other Fuels EIA forecast, 2018
Other (Fuel Combustion)
Diesel Modeled estimate, 2003
Other (Fuel Combustion)
Other than diesel EIA forecast, 2018
Waste Disposal Landfill Flares District no growth assumption Waste Disposal All DOF population forecast, 2020 Oil and Gas Production All
Assumed 2.9% annual decline reflecting CalGEM historical trend, 2000 through 2016
Petroleum Marketing All Fuel use from CARB EMFAC2017 model Chemical All REMI economic forecast, version 2.4.3 Food & Agriculture All REMI economic forecast, version 2.4.3 Mineral Processes All REMI economic forecast, version 2.4.3 Metal Processes All REMI economic forecast, version 2.4.3 Other Industrial Processes All REMI economic forecast, version 2.4.3
Asphalt Paving & Roofing All
DOF construction jobs forecast, 2020; CARB projection
Residential Fuel Combustion
Natural Gas CEC forecast, 2014
Residential Fuel Combustion
Other Fuels No growth
Farming Operations Dairy / Feedlots
No growth
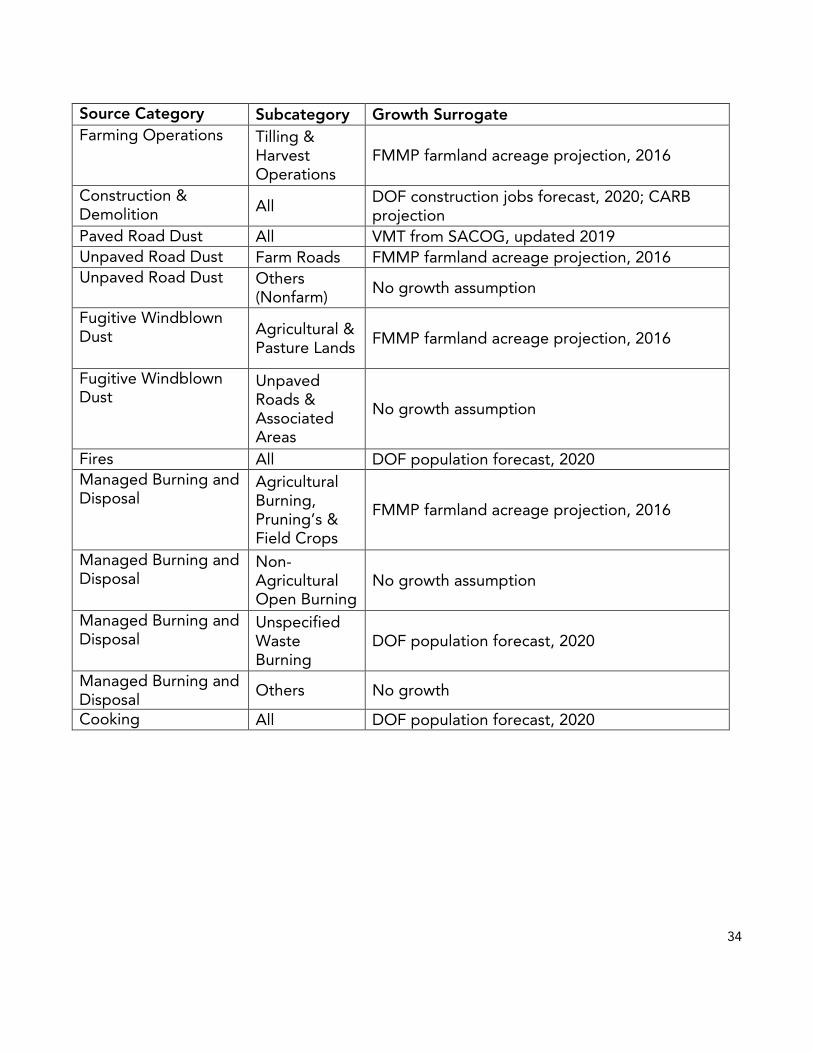
34
Source Category Subcategory Growth Surrogate Farming Operations Tilling &
Harvest Operations
FMMP farmland acreage projection, 2016
Construction & Demolition All
DOF construction jobs forecast, 2020; CARB projection
Paved Road Dust All VMT from SACOG, updated 2019 Unpaved Road Dust Farm Roads FMMP farmland acreage projection, 2016 Unpaved Road Dust Others
(Nonfarm) No growth assumption
Fugitive Windblown Dust Agricultural &
Pasture Lands FMMP farmland acreage projection, 2016
Fugitive Windblown Dust
Unpaved Roads & Associated Areas
No growth assumption
Fires All DOF population forecast, 2020 Managed Burning and Disposal
Agricultural Burning, Pruning’s & Field Crops
FMMP farmland acreage projection, 2016
Managed Burning and Disposal
Non-Agricultural Open Burning
No growth assumption
Managed Burning and Disposal
Unspecified Waste Burning
DOF population forecast, 2020
Managed Burning and Disposal
Others No growth
Cooking All DOF population forecast, 2020

35
Table 5: District and CARB Stationary Source Control Rules and Regulations Included in the Inventory
Agency Rule/Reg No. Rule Title
Source Categories Impacted
SAC_AQMD 411 Boilers, Process Heaters and Steam Generators
Fuel combustion - boilers, process heaters and steam generators
SAC_AQMD 412 Stationary Internal Combustion Engines
Stationary internal combustion engines
SAC_AQMD 413 Stationary Gas Turbines Internal combustion turbines
SAC_AQMD 414 / 414A Natural Gas-Fired Water Heaters
Residential fuel combustion - water heating
SAC_AQMD 417 Wood Burning Appliances Residential wood combustion - wood stoves and fireplaces
SAC_AQMD 419 NOx from Miscellaneous Combustion Units
Miscellaneous combustion such as incineration and asphaltic concrete production
SAC_AQMD 421 Mandatory Episodic Curtailment of Wood and Other Solid Fuel Burning
Residential wood combustion
SAC_AQMD RWC_CH
ANGE Wood Stove and Fireplace Changeout Incentives Program
Residential wood combustion
CARB AG_IC_E
NG Agricultural IC Engine Emission Scalers
Agricultural irrigation internal combustion engines

36
Agency Rule/Reg No. Rule Title
Source Categories Impacted
CARB NONAGI
CENG Non-Agricultural IC Engine Emission Scalers
Non-agricultural internal combustion reciprocating engines