Embed Size (px)
Citation preview

Version APlease note the legal information at the beginning of the presentation.
STADA Arzneimittel AG
One of the worldwide leading players in genericswith increasing share of sales in emerging markets and
focus on cost efficiency

Corporate Presentation November 2010 (A) page 2www.stada.com
General information:By making use of this document the reader acknowledges and agrees to the following: We accept no liability arising from the use of thisdocument. STADA Arzneimittel AG, Bad Vilbel (in the following “STADA”), has made every effort to make sure that this document containscorrect and up-to-date information. However, it accepts no responsibility or guarantee whatsoever in respect of topicality, accuracy andcompleteness of the information and assumes no obligation to update, complete or correct the information contained therein. The anticipatedopportunities and risks to STADA’s activities have been described in detail in the Executive Board’s management reports in the annual reports.Current possible opportunities and risks are mentioned in the respective interim report. STADA’s performance indicators are party influenced byone-time special effects and/or effects not arising from the operating business. Disclosure of key figures adjusted for these effects (so called“pro forma” key figures) by STADA is only to provide a supplement to the recorded IFRS key figures for a transparent comparison to a relevantperiod from the previous year. All text, pictures, trademarks, and other information contained in this document are subject to the copyright ofSTADA or subject to rights acquired from third parties. Trademark protection may apply even for preparations not indicated as trade marks.This document may not be reproduced in whole or in part without the express written consent of STADA. Any disputes arising out of or inconnection with the content of this document, insofar as they are directed against STADA, shall be subject to German law, without prejudice tomandatory provisions of foreign law. The place of jurisdiction is Frankfurt am Main to the extent legally permissible .
Forward-looking statements:This STADA Arzneimittel AG presentation (subsequently "STADA") contains certain statements regarding future events (as understood in theU.S. Private Securities Litigation Reform Act of 1995) that express the beliefs and expectations of management. Such statements are based oncurrent expectations, estimates and forecasts on the part of company management and imply various known and unknown risks anduncertainties, which may result in actual earnings, the financial situation, growth or performance to be materially different from the estimatesexpressed or implied in the forward-looking statements. Statements with respect to the future are characterized by the use of words such as“expect”, “intend”, “plan”, “anticipate”, “believe”, “estimate” and similar terms. STADA is of the opinion that the expectations reflected in forward-looking statements are appropriate; however, it cannot guarantee that these expectations will actually materialize. Risk factors include inparticular: The influence of regulation of the pharmaceutical industry; the difficulty in making predictions concerning approvals by the regulatoryauthorities and other supervisory agencies; the regulatory environment and changes in the health-care policy and in the health care system ofvarious countries; acceptance of and demand for new drugs and new therapies; the influence of competitive products and prices; the availabilityand costs of the active ingredients used in the production of pharmaceutical products; uncertainty concerning market acceptance wheninnovative products are introduced, presently being sold or under development; the effect of changes in the customer structure; dependence onstrategic alliances; exchange rate and interest rate fluctuations, operating results, as well as other factors detailed in the annual reports and inother Company statements. STADA not assume any obligation to update these forward-looking statements or adapt them to future events anddevelopments.
Disclaimer

Corporate Presentation November 2010 (A) page 3www.stada.com
Worldwide leading generics company with traditional strong position in Europe
M&A activities with focus on emerging markets
Efficient cost management
Flexibility through lean decision structures
Broad international sales structure with local spirit
Comprehensive generics portfolio supplemented with highly profitable branded products business
Strategic
success factors
STADA – assets and strategy

Please note the legal information at the beginning of the presentation. Version A
STADA introduction
Corporate Presentation November 2010 (A) page 5www.stada.com
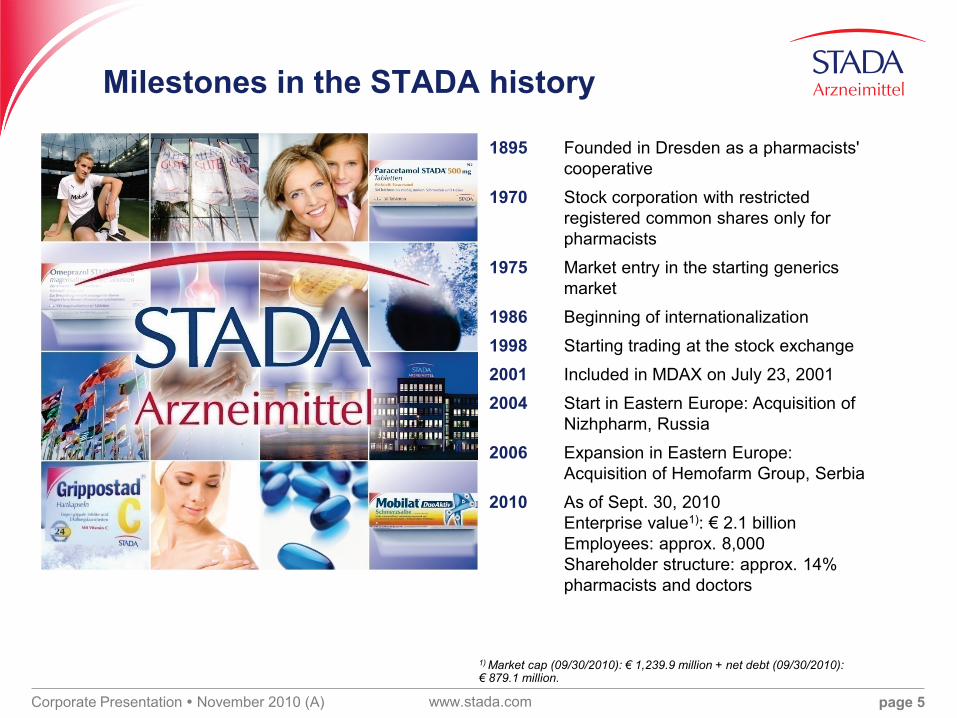
Milestones in the STADA history
1895 Founded in Dresden as a pharmacists' cooperative
1970 Stock corporation with restricted registered common shares only for pharmacists
1975 Market entry in the starting generics market
1986 Beginning of internationalization
1998 Starting trading at the stock exchange
2001 Included in MDAX on July 23, 2001
2004 Start in Eastern Europe: Acquisition of Nizhpharm, Russia
2006 Expansion in Eastern Europe: Acquisition of Hemofarm Group, Serbia
2010 As of Sept. 30, 2010Enterprise value1): € 2.1 billion Employees: approx. 8,000 Shareholder structure: approx. 14% pharmacists and doctors
1) Market cap (09/30/2010): € 1,239.9 million + net debt (09/30/2010): € 879.1 million.

Corporate Presentation November 2010 (A) page 6www.stada.com
Pos. CompanySales 2009 in € million
01 Teva/ratiopharm (ISR) 11,3261)
02 Sandoz2) 5,29303 Mylan (USA) 3,56104 Watson (USA) 1,95305 STADA 1,56906 Actavis (ISL) n.a.3)
07 Hospira5) 1,11208 Dr. Reddy s 1,1024)
09 Ranbaxy 1,09810 Sanofi-aventis5) 1,01211 Gedeon Richter 98012 Krka (SLO) 95313 Cipla 8414)
14 Par 77215 Aspen 666
STADA today
Data source: Annual Report. Currency calculation as of Dec. 30, 2009.1) Pro forma sales of the combined company, Teva press release as of March 18, 2010.2) Part of the Novartis Group.3) Position 6 of Actavis is based on STADA estimates.4) Based on calendar year instead of fiscal year.5) Generics only.7) Local supplier/producer.
Germany Position 3
Russia Position 27)
Belgium Position 1
Italy Position 3
Spain Position 3
Serbia Position 1

Corporate Presentation November 2010 (A) page 7www.stada.com
Broad international sales structure –active in more than 80 countries
Increasing share of sales in emerging markets

Version APlease note the legal information at the beginning of the presentation.
STADA growth perspectives

Corporate Presentation November 2010 (A) page 9www.stada.com
+„STADA –build the future“
(BtF) bis 2013
Group sales: approx. € 1.57 billionEBITDA: approx. € 280 millionNet income: approx. € 100 million
2009
Organic Group developmentbased on proven success factors:
Positioned in growth markets
Strong product developmentBroad international sales
infrastructure
Continuous cost optimizationCautious acquisition policy
Group sales: approx. € 2.15 billionEBITDA: approx. € 430 millionNet income: approx. € 215 million
Assumptions/framework Investments BtF until 2013
approx. € 20 millionExpenses BtF (one-time special
effects) until 2013 approx. € 50 millionForecast range +/- 5%
Additional assumptions: largely organic growth, without consideration of one-time special effects, continuation of the current currency parities, the current interest rate level, as well as the current framework conditions in the markets relevant for STADA.
+
2014
„STADA –build the future“
(BtF) until 2013
Roadmap
Corporate Presentation November 2010 (A) page 10www.stada.com
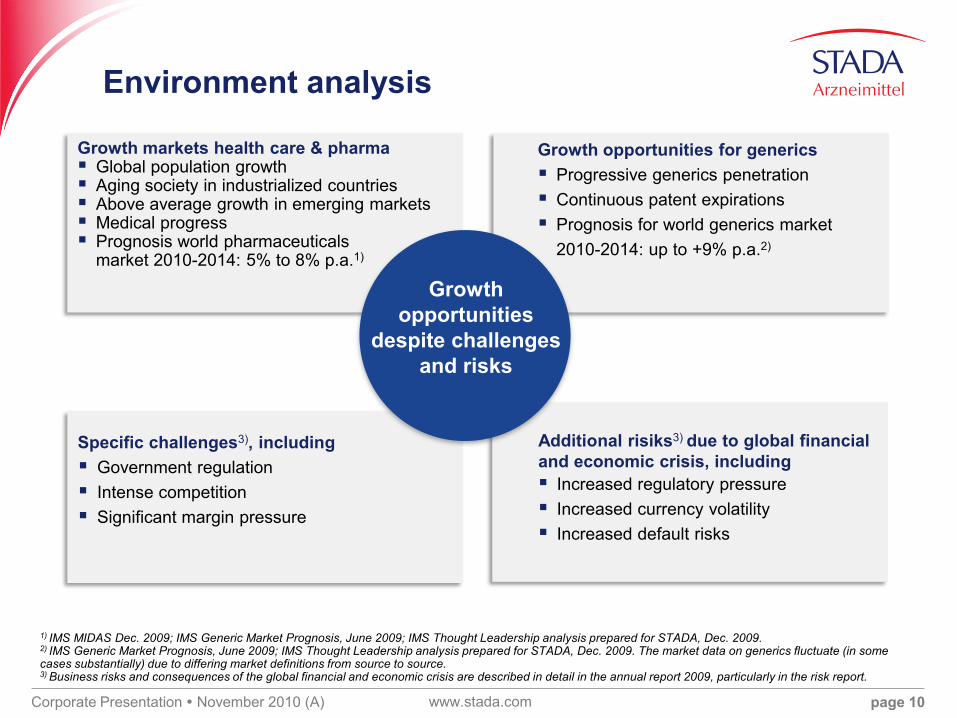
Growth markets health care & pharma Global population growth Aging society in industrialized countries Above average growth in emerging markets Medical progress Prognosis world pharmaceuticals
market 2010-2014: 5% to 8% p.a.1)
Specific challenges3), including Government regulation Intense competition Significant margin pressure
Growth opportunities for generics Progressive generics penetration Continuous patent expirations Prognosis for world generics market
2010-2014: up to +9% p.a.2)
Additional risiks3) due to global financial and economic crisis, including Increased regulatory pressure Increased currency volatility Increased default risks
Growth opportunities
despite challenges and risks
Environment analysis
1) IMS MIDAS Dec. 2009; IMS Generic Market Prognosis, June 2009; IMS Thought Leadership analysis prepared for STADA, Dec. 2009.2) IMS Generic Market Prognosis, June 2009; IMS Thought Leadership analysis prepared for STADA, Dec. 2009. The market data on generics fluctuate (in some cases substantially) due to differing market definitions from source to source.3) Business risks and consequences of the global financial and economic crisis are described in detail in the annual report 2009, particularly in the risk report.

Corporate Presentation November 2010 (A) page 11www.stada.com
Generics: 13.2% CAGR
OTC: 9.6% CAGR
RX: 12.8% CAGR
TOTAL MARKET: 12.0% CAGRThe Russian market has an estimated value
of ruble 555 billion in 2010.
Above average growth rates with 12% p.a.
between 2010 and 2014 expected
(in comparision 10.5% India, 11.9% China).
Growth market Russia
2005 2006 2007 2008 2009 2010 2011 2012 2013 2014
Development of the Russian pharmaceutical market (2005-2014 in billion ruble)
Source: BMI, Broker Research.
5986 86
128153
184
211
235
261
298
93122 131
159179
203230
263298 332
72
89 105
137
156 168185
206227
242
RX Generics OTC

Corporate Presentation November 2010 (A) page 12www.stada.com
Total volume GER, UK, F, I (54% of EU population) for 2010-2013 (at current prices and volumes): > € 15 billion
Sales potential having become or becoming available for generic competition in billion €
Total volume Germany 2010-2013 (at current prices and volumes): > € 4 billion
Growth driver patent expiry
Source: STADA estimate of sales volumes in MAT/3/2010 at ex-factory prices.
2010 2011 2012 2013
2010 2011 2012 2013
GER
GER, UK, F, I
4.25.3
3.22.3
1.1 1.31.0
0.7

Corporate Presentation November 2010 (A) page 13www.stada.com
Unchanged full pipeline: Planning horizon: beyond the year 2015 Submission horizon for approvals of EU-wide
Group significance: > 3 years Current approval procedures: > 140 active
ingredients worldwide for > 50 countries1)
Increased share of newly launched products in Group sales of 9% within the previous 2 fiscal years (2008: 8%)
Biosimilars development via BIOCEUTICALS2)
Erythropoetin (Epo-zeta)Expansion of approval for s.c. application in the area of nephrology
Monoclonal antibodiesPreparatory work for the development has begun in Q1/2009; STADA is currently reviewing various financing models and in-licensing alternatively; decision expected in 2010
Newly launched products* in the STADA Group
Strong product development
*Counted as individual products launched in individual national markets i.e. new API´s, dosage strengths and application forms (except different pack sizes).
2006 2007 2008 2009
1) As of Dec. 2009.2) Via BIOCEUTICALS Arzneimittel AG: predominantly financed via venture capital; STADA share 15.86%; STADA continues to hold a call option to acquire all shares in BIOCEUTICALS (exercisable annually from 2011).
1-9/2009 1-9/2010
335
442
331424
483 486

Corporate Presentation November 2010 (A) page 14www.stada.com
Eastern EuropeVrsac (Serbia)Sabac (Serbia)Dubovac (Serbia)Banja Luka (Bosnia-Herzegovina)Podgorica (Montenegro)Nizhny Novgorod (Russia)Obninsk (Russia)Moscow (Russia)Ryazanskaya (Russia)
Continuous cost optimization
Optimization of procurement costs: Global sourcing Stronger involvement of suppliers in market
price risk Increased in-house developments
Optimization of pharmaceutical production: Efficiency improvement Production allocation by means of transfer
program to own plants in low-cost countries Use of economy of scale effects
Declining cost of sales ratio: Economy of scale effects for product launches
Goal: cost optimization ≥ price erosion (price erosion 2009: > 5% of Group sales)
Own Production sites
~ 34%
Share ofproduction
volume 2009
Western EuropeBad Vilbel (Germany)Pfaffenhofen (Germany)Clonmel (Ireland)
~ 56%
AsienHo Chi Minh City (Vietnam; 50% JV)Beijing (China; only locally)
~ 10%
Sites which outside of the EU have been oriented at least partly to the production of individual product for the EU or which have been approved by EU authorities after local auditing.

Corporate Presentation November 2010 (A) page 15www.stada.com
467 538634
745 8141,022
1,245
1,571 1,646 1,569
Sales in € million
Longstanding internal & external growth
Clonmel Healthcare
(Ireland)
Bayvit (Spain)
Crinos (Italy)
Nizhpharm (Russia)
Hemofarm (Serbia)
MAKIZ (Russia)
Britannia Pharmaceuticals
(UK)
Forum Products (UK)Deconsolidation
Acquisition
2000 2001 2002 2003 2004 2005 2006 2007 2008 2009
Sales growth
adjusted1)
2009: +4%
1) Adjusted for changes in the Group portfolio as well as from currency effects.

Corporate Presentation November 2010 (A) page 16www.stada.com
„Build the future“for the sustained improvement
of success structures
Reduction of
complex Group
structures
More efficient
centralized control
of Group
companies
Acceleration of
continuous cost
optimization
Cost of salesFocus:
Production sites
Organizational structures
Personnal/reporting structures
„STADA – build the future“

Corporate Presentation November 2010 (A) page 17www.stada.com
Transfer of the packaging unit Etten-Leur Access to capacities during the transition period at defined conditions 113 full-time employees (142 employees by headcount) and the assets in
the amount of € 0.7 million passed to the acquiring company Restructuring of branded products sales force in Italy, cutback targeted One-time special effect within the scope of project planning for „STADA –
build the future“ of € 15.2 million before, € 13.0 million after taxes in total
3rd quarter
Consistent execution „STADA –build the future“
4th quarter
Since Oct. 1, 2010 new functional reporting lines & organizational structuresForeign subsidiaries with direct reporting lines to the corporate headquarter. More transparent and faster decision making processes Further measures planned
Please note the legal information at the beginning of the presentation. Version A
1-9/2010 Highlights

Corporate Presentation November 2010 (A) page 19www.stada.com
Highlights 1-9/2010
Group sales: +3%
EBITDA adjusted1): +12%
EPS adjusted1): +8%
Burdening one-time special effects of € 63.1 million before or € 53.6 million after taxes
Free cash flow +9% – net debt further reduced to € 879.1 million Outlook 2010 reiterated
Developments in the current fourth quarter:
Consistent execution of “STADA – build the future”, new functional reporting lines and organizational structures in the scope of „STADA –build the future” since Oct. 1, 2010
New management and new business policy in Serbia
1) Adjusted for one-time special effects as well as effects from currency influences and interest rate hedge transactions.

Corporate Presentation November 2010 (A) page 20www.stada.com
Sales increase by +3.4%
Portfolio Effect: +1.2% points, Acquisition EUNOVA Multi-Vitalstoffe, the purchase in Denmark of branded products and of the MIR product portfolio in Russia, sales with transferred Dutch packaging unit
Currency effect: +0.3% points, appreciation of the Russian ruble, which more than compensated for devaluation of the Serbian dinar
Adjusted1) sales growth +1.9%
Sales in € million
Sales development 1-9/2010
1) Adjusted for changes in the Group portfolio as well as currency effects.
1-9/2009 Organic1) Portfolio Currency 1-9/2010
+1.9% +1.2%
1,138.51,177.8+3.4%+0.3%

Corporate Presentation November 2010 (A) page 21www.stada.com
1.4%3.4%
22.9%
72.3%
0.5%3.8%
26.4%
69.3%
() = Adjusted for sales contributions from acquisitions and disposals as well as currency effects.
Sales by segment & region 1-9/2010
By regionBy segment
Generics € 815.7 million0%, (0%)
Branded Products € 311.4 million+12%, (+6%)
Commercial business € 44.4 million+20%, (+21%)
Group holding/Other € 6.3 million0%, (-46%)
Western Europe € 852.1 million+3%, (+2%)
Eastern Europe € 270.0 million+1%, (-1%)
Asia € 39.7 million+23%, (+18%)
Rest of world € 16.0 million+21%, (+19%)
Core segments € 1,127.1 million+3%, (+2%)
Total Group € 1,177.8 million+3%, (+2%)

Corporate Presentation November 2010 (A) page 22www.stada.com
Sales in € million 1-9/2010
Δ vs. 1-9/2009 in % CER1) in %
Germany 392.7 -4
Russia 156.0 +22 +16
Italy 99.9 +20
Belgium 99.1 +10
Spain 61.8 +10
France 57.0 -3
Serbia 52.7 -33 -27
Share of total sales
STADA – top national markets 1-9/2010
1) CER: In constant exchange rates.
4%
5%
5%
8%
8%
13%
33%

Corporate Presentation November 2010 (A) page 23www.stada.com
2010E1) Sales development
2010E Operating profitability
Germany +(+)
Russia +++
Italy ++
Belgium ++
Spain +
France +
Serbia ++(+)2)
Regulatory environment & outlook 2010
+++ = above operating Group margin++ = in the area of Group margin + = below Group margino = break-even- = operating loss
Environment
Health care reform 2011 with moderate upside potential
Strong development despite of price registration
Increasing generics penetration, restricted discounts to the distribution channels, price reduction August 2010
Positive regulatory environment
Increasing generics penetration, limit of discounts to the distribution channels, price reduction April 2010
Strong competition, high discounts
Liquidity problems of wholesaler, restructuring plan was signed3)
1) 2010E: Today´s STADA expectation for fiscal year 2010.2) In the scope of the Hemofarm subgroup.3) Between Hemofarm and Velefarm (see the ad hoc release as of Sept. 28, 2010).

Corporate Presentation November 2010 (A) page 24www.stada.com
21.314.5 16.9
Restructuring Serbia
Q1/2010 Q2/2010 Q3/2010 Q4/2010
Deliberate avoidance of sales possibleclearly in double-digit EUR million area due to liquidity problems of a Serbian wholesaler
Sales in € million
Expected recovery of the Serbian business
New management Special project for
cost structure Hemofarm1)
Restructuring wholesaler
New distribution model
1) Local subgroup Hemofarm.

Corporate Presentation November 2010 (A) page 25www.stada.com
EBITDAreported adjusted1)
Operating profitreported adjusted1)
Margin16.7% 15.5% 17.6% 19.0%
EBITDA & operating profit 1-9/2010
Margin11.3% 8.9% 12.6% 14.1%
Underlying business clearly improved, adjusted operating margins expanded; reported operating profit burdened by one-time special effects of € 60.7 million in 1-9/2010
1) Adjusted for one-time special effects as well as effects from currency influences and interest rate hedge transactions.
1-9/2009 1-9/2010 1-9/2009 1-9/2010 1-9/2009 1-9/2010 1-9/2009 1-9/2010
129.1143.5
165.6-4% 224.2200.4190.2 182.9
104.9
+12%
-19%
+15%

Corporate Presentation November 2010 (A) page 26www.stada.com
in € million 1-9/2010 Reconciliation of reported and adjusted operating profitreported 104.9
+10.4 Unscheduled amortization net of write-ups on intangible assets after impairment tests
+16.7 Expenses in connection with „STADA – build the future“
+34.3 Primarily value adjustments on receivables from local wholesalers in Serbia
-0.7 Other
adjusted1) 165.6
Operating profit 1-9/2010
1) Adjusted for one-time special effects as well as effects from currency influences and interest rate hedge transactions.

Corporate Presentation November 2010 (A) page 27www.stada.com
Assets in € million Dec. 31, 2009 Sept. 30, 2010
A. Non-current assets 1,406.6 1,342.5B. Current assets 1,045.1 1,088.9Total assets 2,451.7 2,431.4
Equity and liabilities in € million Dec. 31, 2009 Sept. 30, 2010A. Equity 869.7 837.0B. Non-current liabilities and provisions 683.5 1,113.2C. Current liabilities and provisions 898.5 481.2Total equity and liabilities 2,451.7 2,431.4
Working capital in € million
Stable balance sheet structure
Equity-to-assets ratio in %
09/30/2009 12/31/2009 06/30/2010 09/30/2010
34.5% 35.5% 34.6% 34.4%
09/30/2009 12/31/2009 06/30/2010 09/30/2010
627
528 538 541-16%
+2% +1%
Corporate Presentation November 2010 (A) page 28www.stada.com
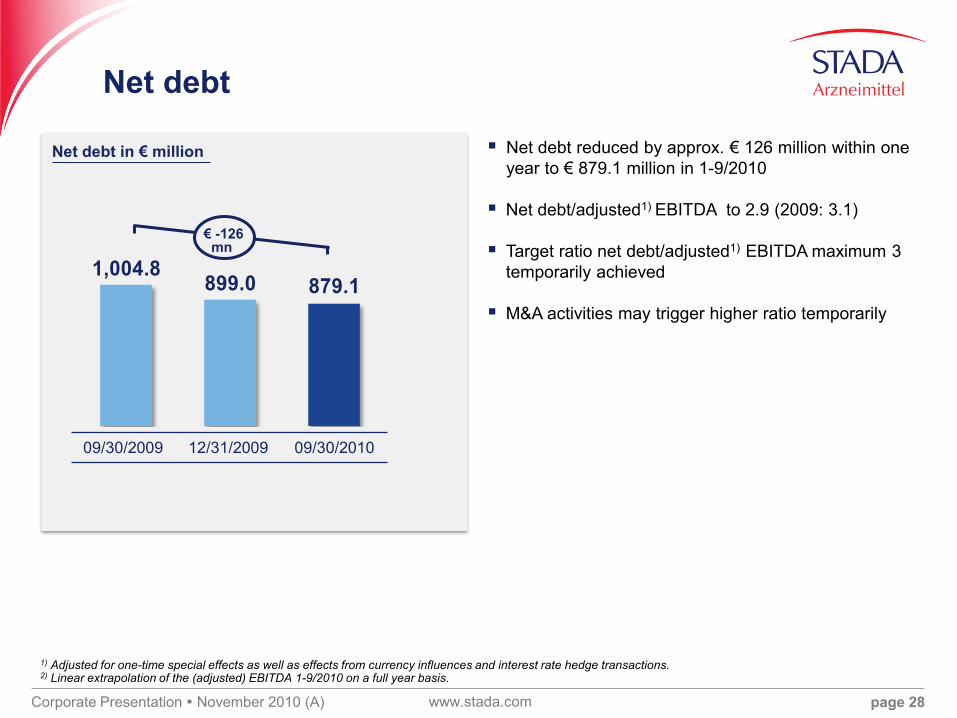
1,004.8899.0 879.1
Net debt
Net debt in € million Net debt reduced by approx. € 126 million within one year to € 879.1 million in 1-9/2010
Net debt/adjusted1) EBITDA to 2.9 (2009: 3.1)
Target ratio net debt/adjusted1) EBITDA maximum 3 temporarily achieved
M&A activities may trigger higher ratio temporarily
09/30/2009 12/31/2009 09/30/2010
€ -126 mn
1) Adjusted for one-time special effects as well as effects from currency influences and interest rate hedge transactions.2) Linear extrapolation of the (adjusted) EBITDA 1-9/2010 on a full year basis.

Corporate Presentation November 2010 (A) page 29www.stada.com
Maturities of financial liabilities due to banks as of Sept. 30, 2010 in € million
Stable debt structure
Issuance of a corporate bond on April 21, 2010 (€ 350 million nominal value, 4.0% p.a. bond due April 2015) Maturity of the next bigger tranche of promissory notes in the amount of € 195.5 million in the fourth
quarter of 2011 Short-term liabilities to banks with maturity under one year: accepted credit lines which have been provided to
STADA by banks on a revolving basis for years Weighted interest burden for Group financial liabilities on Sept. 30, 2010:
4.8% (Dec. 31, 2009: 3.8%); switch of a euro loan in Russia into ruble in order to minimize the currency risk exposure of the Group
2010 2011 2012 2013 2014 2015 > 2015
195.5
35.0
244.0
50.59.6
51.8
24.1
36.2
11.010.8
22.1
350.0
BondAmounts due to banksPromissory notes

Corporate Presentation November 2010 (A) page 30www.stada.com
4.0 4.8 0.142.0
72.250.8
59.141.7
46.4
35.1 9.727.4
125.1
42.29.0
0.1 3.5
38.6 24.3
40.9
23.6
8.7
24.1
7.3
3.1
Expenses for capital expenditure
Total expenses 2007-2009 € million
265.3
170.6
133.7
Purchase of consolidated companiesEssential investment in intangible assets for short-term expansion of the product portfolioInvestment in other intangible assets (support organic growth)Investment in property, plant and equipment (maintenance)Investment in financial assets
Proceeds2009: € 27.3 million2008: € 27.3 million2007: € 31.8 million
Total expenses 1-9/2010 vs. 1-9/2009 in € million
1-9/2010: expenses clearly below previous year;proceeds of € 4.2 million
2007 2008 2009
95.6
78.6
1-9/2009 1-9/2010

Corporate Presentation November 2010 (A) page 31www.stada.com
Cash flow from operating activities and free cash flow
2005-2009
2005-2009
1-9/2010 vs. 1-9/2009
1-9/2010 vs. 1-9/2009
Improvement of free cash flow, supported by intensified Working Capital Management
Cash flow from operating activities (in € million)
Free cash flow1) (in € million)
2005 2006 2007 2008 2009 1-9/2009 1-9/2010
1-9/2009 1-9/20102005 2006 2007 2008 2009
1) Free cash flow includes cash flow from operating activities and cash flow from investing activities.
96.361.8
92.9129.3
250.5
-100.7
-515.9
-140.6-14.0
144.0
124.7 130.6
51.8 56.2

Corporate Presentation November 2010 (A) page 32www.stada.com
Growth of sales and all operational key earnings figures (adjusted)
Adjusted1) operating margin at least stable
Net debt/adjusted1) EBITDA: maximum 3
1) Adjusted for one-time special effects as well as effects from currency influences and interest rate hedge transactions.
Operational outlook 2010 reiterated
Assumption: Recovery of the Serbian business in the 4th quarter of 2010

Corporate Presentation November 2010 (A) page 33www.stada.com
Financial calendar
201103/30/2011 Publication of 2010 results with analysts´ and press conference
05/12/2011 Publication of Q1/2011 results
06/16/2011 Annual General Meeting
08/11/2011 Publication of 2011 interim results with analysts´ and press conference
11/10/2011 Publication of Q3/2011 results

Corporate Presentation November 2010 (A) page 34www.stada.com
Corporate Communications – Your contact:
Dr. Markus Metzger Elisabeth Reichert(Director Communications) (Assistant)E-Mail: [email protected] E-Mail: [email protected]
Corporate Communications / Equity & Credit Investor Relations
Maike Mennecke E-Mail: [email protected]
Kay ReubeltE-Mail: [email protected]
Martina CailloudE-Mail: [email protected]
Jessica GepelE-Mail: [email protected]
Melanie WeisE-Mail: [email protected]
STADA Arzneimittel AGCorporate Communications61118 Bad Vilbel,DeutschlandP: +49 (0) 6101 603-113 F: +49 (0) 6101 603-506

Please note the legal information at the beginning of the presentation. Version A
Notes

Corporate Presentation November 2010 (A) page 36www.stada.com
Current shareholder structure:
100% free float
Approx. 55% institutional investors
Current notices with regard to the exceeding of legal reporting threshold of > 3% ofshareholdings are published on STADA website (www.stada.com)
Approx. 14% pharmacists and doctors
Amount of own shares on March 31, 2010: 102,404 shares2)
Sept. 30, 2010
Outstanding STADA shares1)2)3) 58,876,360
Possible shares from warrants 00/154) 3,513,860
Share capital and shareholder structure
1) Owners of the restricted registered common shares must be recorded in the shareholders’ register in order to be able to exercise their shareholders’ rights. Recording in the shareholders’ register is only possible with the approval of the Executive Board.2) The purchase of up to further 10% of the capital stock in own shares until Dec. 10, 2010 was approved by the shareholders’ meeting 2009. 3) Additional authorized capital of 29.4 mill. common shares. 4) Exercise price for subscription of 20 common shares: € 329.00.

Corporate Presentation November 2010 (A) page 37www.stada.com
Market
Total pharma-ceutical market
in € million Δ%
Off-patent market in €
million
Generics market
in € millionGenerics
penetration1)
Germany 25,308 +4 8,900 4,983 56%
France 21,279 +2 5,298 2,484 47%
UK 15,734 +3 5,894 3,111 53%
Italy 11,852 +1 4,266 653 15%
Spain 10,401 +3 6,789 885 13%
Belgium 3,101 +2 1,266 278 22%
Austria 2,073 +3 600 321 54%
Finland 1,945 0 729 280 38%
Market analysis: Generics penetration inselected EU markets by sales 2009
Source: STADA estimate at ex-factory prices based on market data provided by various international market research institutes.1) Share in percent of the generics capable market.

Corporate Presentation November 2010 (A) page 38www.stada.com
Currency effects 1-9/2010
P&L effects due to foreign currency items for monetary assets & liabilities
Equity effects attributable to shareholders of STADA Arzneimittel AG due to currency differences directly recognized there
Translation effects when transferring sales from local operating units into the Group accounting currency euro
in % points 2008 2009 Q1/2010 Q2/2010 Q3/2010 1-9/2010
Currency effects +2.0 -5.0 +0.1 +0.7 +0.2 +0.3
in € million 2008 2009 Q1/2010 Q2/2010 Q3/2010 1-9/2010
Net currency influence(from other operating income and other operating expenses)
-13.0 -4.1 +8.4 +5.8 -6.4 +7.8
thereof: special effect (from existing loan for earlier Russian acquisition) -3.7 -1.1 +2.4 – – +2.4
in € million 2008 2009 Q1/2010 Q2/2010 Q3/2010 1-9/2010
Equity netting -107.6 -37.5 +1.4 -10.5 -30.4 -39.5

Corporate Presentation November 2010 (A) page 39www.stada.com
in € million 2009Δvs.2008 1-9/2010
Δvs. 1-9/2009 2009
Δ vs. 2008 1-9/2010
Δ vs. 1-9/2009
Operating profit 191.9 +9% 104.9 -19% 211.1 -5% 165.6 +15%
EBITDA 280.1 +10% 182.9 -4% 287.5 -2% 224.2 +12%
EBIT 192.5 +10% 105.3 -19% 210.8 -4% 166.0 +16%
EBT 141.5 +34% 66.1 -28% 163.0 -1% 127.4 +17%
Net income 100.4 +32% 38.8 -46% 115.8 0% 91.2 +8%
EPS in € 1.71 +32% 0.66 -46% 1.97 0% 1.55 +8%
EPS in € (dil.) 1.70 +33% 0.65 -47% 1.96 +1% 1.52 +6%
Adjusted for one-time special effects & non-operational effects
Adjusted earnings figures clearlyincreased in 1-9/2010

Corporate Presentation November 2010 (A) page 40www.stada.com
2009 in € million
2009 in % of sales
1-9/2010 in € million
1-9/2010 in % of sales
Gross profit 723.4 46.1% 561.5 47,7%
Cost of sales 346.1 22.1% 276.9 23,5%
G&A expenses 125.0 8.0% 92.0 7,8%
R&D expenses1) 46.6 3.0% 39.1 3,3%
Financial result -50.4 -38.9
Taxes on income 40.8 27.2
P&L details 1-9/2010
Increase of cost of sales ratio, among other things, due to the deliberate avoidance of sales possible in order to reduce the default risk on receivables and seasonal higher advertising costs
Tax rate 1-9/2010: 41.1% (1-9/2009: 21.8%); affected by shifts in regional earnings mix and limited tax deductibility of one-time special effects
1) In financial year 2009, development expenses for new products in the amount of € 14.8 million were capitalized.

Corporate Presentation November 2010 (A) page 41www.stada.com
Non-operational earnings-influencing effects from currency influences and interest rate hedge transactions 1-9/2010 in € million
One-time special effects and non-operational earnings-influencing effects 1-9/2010
One-time special effects 1-9/2010 in € millionBefore taxes:Q1/2010: -7.9 mainly unscheduled amortization on assets, impairmentsQ2/2010: -5.5 mainly value adjustments on receivablesQ3/2010: -49.7 mainly value adjustments on receivables and expenses for “STADA – build the future”1-9/2010: -63.1 one-time special effects 1-9/2010 before taxes (netted); (1-9/2009: € -12.1 million)
After taxes:1-9/2010: -53.6 one-time special effects 1-9/2010 after taxes (netted); (1-9/2009: € -9.4 million)thereof -14.1 burden as a result of expenses in connection with the „STADA – build the future“ project
Before taxes:
1-9/2010: +1.8 non-operational earnings-influencing effects 1-9/2010 before taxes (netted); (1-9/2009: € -5.1 million)
After taxes:
1-9/2010: +1.2 non-operational earnings-influencing effects 1-9/2010 after taxes (netted); (1-9/2009: € -3.4 million)

Corporate Presentation November 2010 (A) page 42www.stada.com
Residual carrying amounts of intangible assets at the end of reporting period in € million
1-9/2010 2009 2008 2007 2006 2005
Goodwill 323 331 339 377 289 140
Approvals, trademarks etc. 570 571 567 651 579 399
Advance payments made 98 98 95 69 77 73
Total 991 1,000 1,001 1,097 945 612
Balance sheet detail: intangible assets
Top position in terms of goodwill with unproblematic impairment test as at Sept. 30, 2010: Hemofarm subgroup: € 107.1 million Nizhpharm/MAKIZ (joint Cash Generating Unit): € 68.2 million
Additional > € 500 million of value in use alone for all consolidated companies with goodwill that, in accordance with IFRS, cannot be reported in the balance sheet (by making use of the criteria for impairment testing that are usual at STADA)