Embed Size (px)
Citation preview

Stable Isotope and Organic Biomarker Analysis of theLate Proterozoic Coppercap Formation in the
MacKenzie MountainsMASSACHUSETT
by OFTEQHNO
Katherine S. Thomas SEP 28
LIBRAR
Submitted to the Department of Earth, Atmospheric and Planetary Sciences
in Partial Fulfillment of the Requirements for the Degree of
Bachelor of Science in Earth, Atmospheric and Planetary Sciences
at the
MASSACHUSETTS INSTITUTE OF TECHNOLOGY
May 2010 I 0, R1 \ o
Katherine S. Thomas, MMX All rights reserved.
The author hereby grants to M.I.T. permission to reproduce anddistribute publicly paper and electronic copies of this thesis
and to grant others the right to do so.
ARCHIVES
Signature redactedAuthor.................. ...
Certified by...
Accepted by........
SignaturE7
SignalTh* rnthnr h,~a.r~hv c2~fltS to MIT oerrni
--------.-... --.-. ---------.. ---------Department of Earth, Atmospheric and Planetary Sciences
May 21, 2010~ rdaced.........
Shuhei Ono
ure redacted. Thesis Supervisor
Samuel Bowring
ssion to Chair, Committee on Undergraduate Programrmproduce and to distuibut* putbicy paper andciectronic copes o- tis thesii document inwhclc cin part in zny mediurn now known or
1! NTUN0TELOGY
2017
IES

MITLibraries77 Massachusetts AvenueCambridge, MA 02139http://Iibraries.mit.edu/ask
DISCLAIMER NOTICE
The pagination in this thesis reflects how it was delivered to theInstitute Archives and Special Collections.
Stable Isotope and Organic Biomarker Analysis of theLate Proterozoic Coppercap Formation in the
MacKenzie Mountains
by
Katherine S. Thomas
Submitted to the Department of Earth, Atmospheric and Planetary Scienceson May 21, 2010 in partial fulfillment of the requirements for the
Degree of Bachelor of Science in Earth, Atmospheric and Planetary Sciences
Abstract
Sulfur and carbon stable isotope ratios and organic biomarker abundance were performed on drillcore samples from the Coppercap Formation of the Coates Lake Group in the WindermereSupergroup of the MacKenzie Mountains to reconstruct an environmental condition procededingthe first Neoproterozoic Snowball Earth event. The Coppercap Formation directly underlies theRapitan Group, Sturtian glacigenic deposits, and represents a depositional environment existingdirectly before the Cryogenian glacial episodes. Based on aryl isoprenoids, n-propyl cholestane,isopropyl cholestane, total organic carbon, carbonate mineral analysis, 834S from pyrite,813Corganic and 8 13 Ccarbonate values, environmental conditions of the Coppercap Formation werereconstructed. The Coppercap Formation was found to be a shallow euxinic marine basin withpurple and green sulfur bacteria microbial mats. This suggest persistent hydrogen sulfide richwaters in the shallow photic zone persisted until the Sturtian.
Thesis Supervisor: Shuhei OnoTitle: Professor of Geobiology


Acknowledgements
Without the generous support and encouragement of my extended community of advisors,
coworkers, family and friends this thesis would not be possible. The foremost thanks go to
Shuhei Ono, my thesis advisor. Professor Ono's assistance in the lab, enthusiasm to discuss
materials, commentary, and support demonstrate his dedication to his students and their research.
A very large thank you goes to Christian Hallmann for all his help in the preparation of this
thesis, guidance and encouragement throughout the process. I would like to thank Francis
MacDonald for his collaboration and sample analysis. Finally, I would also like to show my
great appreciation to Roger Summons, for his enthusiasm and support that lead me to study
geobiology initially, as well as continue my studies.
Thanks also goes to Nicole Keller, for her guidance with sulfur extractions; Emily Matys
for her integration help; Andrew Whitehill and Jon Grabenstatter for their encouragement during
the writing process; to my family who has supported me throughout my time at MIT; my friends
and housemates for their support; and all the wonderful people of E25 who have created a
supportive and collaborative community. Last, I want to thank the Thomas Lord Foundation for
their benevolent funding of my research.

THIS PAGE IS INTENTIONALLY LEFT BLANK

Contents
TITLE PAGE.................................................1
ABSTRACT.................................................3
ACKNOWLEDGMENTS.........................................5
CONTENTS..................................................7
LIST OF IMAGES AND FIGURES..................................................9
1. IN TR O D U CTIO N ........................................................................ 11
2. BACKGROUND ...................................................................... 14
2.1 Stable Isotope Geochemistry and Lipid Biomarker Analysis.............14
2.1.1 Sulfur Isotope Analysis...............................................15
2.1.2 Carbon Isotope Analysis...........................................16
2.1.3 Lipid Biomarker Analysis.........................................17
2.2 Late Proterozoic Ocean Chemistry and Environment Leading into theSturtian Event......................................................................20
2.3 Geologic Setting of the Coppercap Formation in the MacKenzieM ountains......................................................................... 22
2.4 Hypothesis to be Tested.....................................................25
3. M E T H O D S ................................................................................ 28
3.1 Sulfur Extraction and Isotope Analysis....................................29
3.2 Carbon Extraction and Isotope Analysis.....................................31
3.3 Molecular Biological Material Analysis...................................32

4. R E SU L T S ................................................................................. 35
5. DISCUSSION.............................................................................43
5.1 Geologic and Environmental Setting of the Coppercap Formation......43
5.2 Evidence of Euxinia and Environmental Conditions of the CoppercapFormation....................................................................... .46
6. CONCLUSION AND FURTHER STUDIES......................................52
REFERNCES.............................................................................. 54
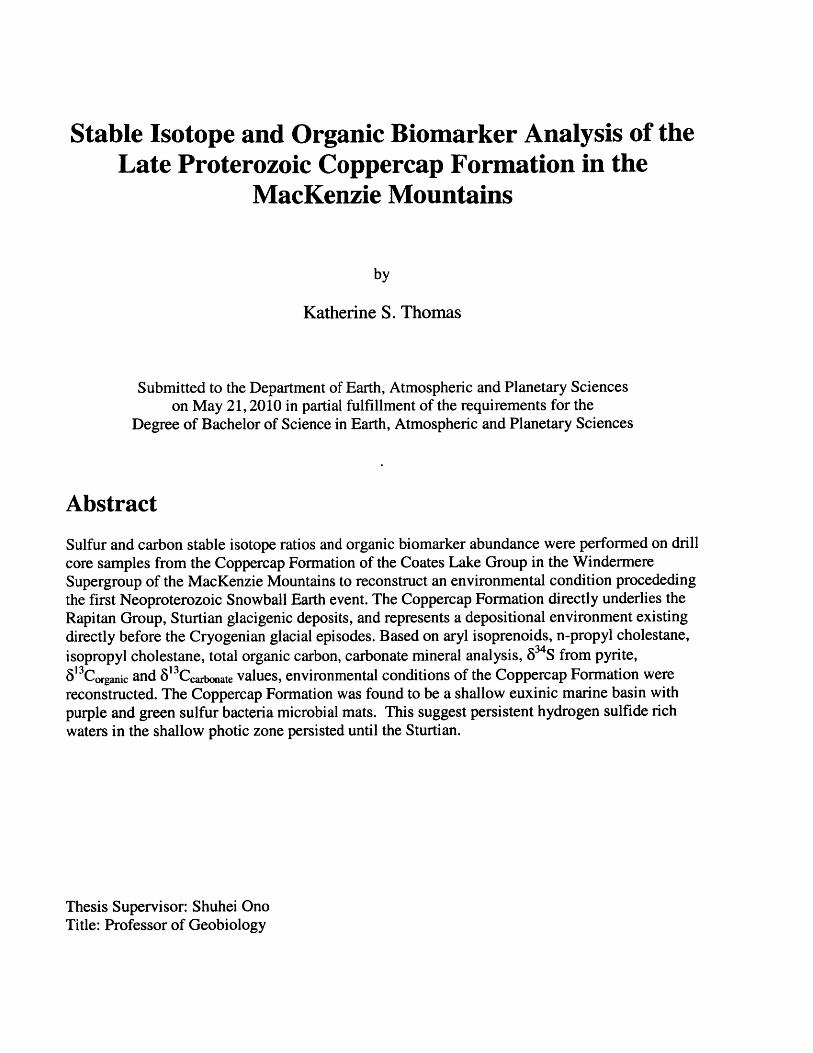
List of Figure and TablesEquation 2.1 Definition of Delta value (Sulfur).......................................................15
Equation 2.2 Definition of Delta value (Carbon).......................................................16
Figure 2.1 Pristane and Phytane Structure.............................................................19
Figure 2.2 Breakdown of Chlorophyll to Pristane and Phytane....................................20
Figure 2.3 Hydrogen Sulfide Rich Ocean Waters.....................................................21
Figure 2.4 Map of the Copper Cap Formation........................................................23
Figure 2.5 Stratigraphic Column for the MacKenzie and the Windermere Supergroup.........23
Figure 2.6 Photograph of the Transition from the MacKenzie to Windermere Supergroup.......24
Equation 3.1 Definition of delta value (Sulfur)...................................................... 30
Equation 3.4 Definition of delta value (Carbon)..........................................................1
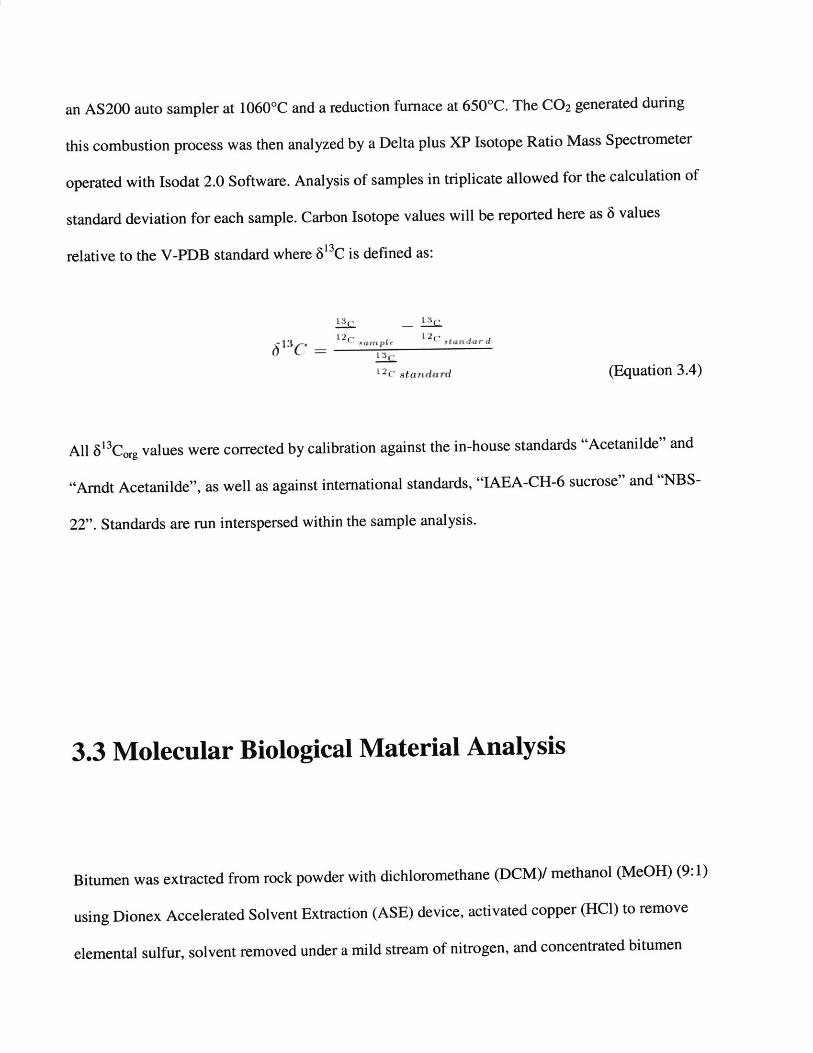
Figure 4.1 Results for carbonate (%), total organic carbon (%), 613C organic (%C), 634Spyrite(%o) and biomarker analysis for pristane/ phytane (pr/ph), 12,3,4/ Y2,36, of aryl isoprenoids and613C carbonate (% )..................................................................................... 36
Table 4.1 Measured results for carbonate (%), total organic carbon (%), 6' 3 Corganic (%C), 634Spyrite(%o) and biomarker analysis for Pristane/ Phytane (Pr/ph), Y234/ E236 of Aryl Isoprenoids and
'3 Ccarbonate (% 0).......................................................................................... . 37
Figure 4.2 C2 7 chromatograph for Coppercap Sample 132.............................................40
Table 4.2 Compound names and classes for diasterane and sterane peaks in MRMchrom atographs........................................................................................... 40
Figure 4.3 C 30 chromatograph showing individual peaks for diasterane and sterane peaks........41
Figure 5.1 Pristane/ phytane ratios, carbonate content (%) and 534S values.........................47
Figure 5.2 Pristane/phytane ratios, 6 3 Corganic and the 6 'Ccarlbnate values........................49

THIS PAGE IS INTENTIONALLY LEFT BLANK
1. Introduction
The Earth experienced great geologic and biological change during the Late Neoproterozoic.
One aspect is the break up of the super-continent Rodinia and the subsequent opening of the
proto-Pacific Ocean that occurred during the Late Neoproterozoic (James, 2001). Additionally,
large possibly global-glacial events, known as the Snowball Earths events took place during the
Cryogenia period (850 Ma to 635 Ma). The sediment record after the Snowball Earth events
documents a significant increase in the diversity and complexity of life on the planet during the
Ediacaran period (Hoffman, 1998). Due to the dearth of correlated age constraints on the records
of paleoclimate and biological conditions, there are still many questions to ask about the
environmental conditions during the Late Neoproterozoic (MacDonald, 2010).
The two major glacial events, the Sturtian (635 Ma) and the Marinoan (710 Ma), had
severe impacts on global carbon and sulfur geochemical cycles which are recorded as isotopic
excursions of carbon and sulfur isotope ratios of seawater carbonate and sulfate, respectively
(Hurtgen, 2005). These anomalies within the carbon and sulfur cycle are related to changes
within environmental conditions and biological activity. The time period that starts directly
before the Sturtian glacial event in the Middle Cryogenian (780 Ma) and lasts in to the to
Ediacaran periods (620 Ma) is an important time period of interest to gain insights into the

widespread development and populations of multi-cellular life and to gain understanding of the
environmental conditions at the time. By determining the links between chemostratigraphical
records, elemental cycling, and biological diversification, the environmental changes during the
Late Neoproterozoic can be better understood.
The goal of this thesis is to reconstruct environmental conditions and to constrain
linkages to evolutionary changes that occurred during the deposition of the pre-Sturtian
Coppercap Formation. The stable carbon isotope ratios of sedimentary organic matter (kerogen)
and carbonates, as well as the stable sulfur isotope ratios of iron sulfide are measured to provide
new insights into changes in the sulfur and carbon cycles prior to the first major Snowball Earth
event. Lipid biomarkers from the same set of samples provide important constraints on past biota
and the chemistry of the basin, in particular, the extent of euxinia. The new insights gained from
this study would have significant implications into the series of events that led to the extreme
climate change during the Sturtian glaciation, and the later Neoproterozoic major diversification
of life of Earth.

THIS PAGE IS INTENTIONALL LEFT BLANK

2. Background
2.1 Stable Isotope Geochemistry and Lipid Biomarker
Analysis
The Snowball Earth events have been documented in the rock record in several ways. Analysis
of low latitude glacial deposits, paleolocation analysis of sedimentary rocks, banded iron
formations, open water deposits and cap carbonates, the use of carbon isotope ratios have all
been used to show the drastic environmental changes during the Cryogenian (Hoffman et al.,
1998). In this study we are concerned with the environment and biogeochemical cycling of sulfur
and carbon during the Cryogenian Era that are recorded as stable isotope ratios of sulfur and
carbon as well as in the form of molecular biological material in sediments.

2.1.1 Sulfur Isotopes Analysis
Sulfur isotope analysis has been used to measure the extent of sulfur cycling that occurred during
the depositional time period of the rocks. Sulfur cycling is a result of various processes in the
oceans and by bacteria. The sulfur isotope ratios of pyrite (FeS2) is mainly related to the
microbial sulfate reduction that is responsible for remineralizing carbon in anoxic water bodies
and below sediment-water interfaces where the supply of oxygen is limited. Because microbial
sulfate reduction produces amongst the largest isotope effect in the isotopic ration of 34S to 32S,
sulfur isotope ratios of sulfide minerals would record the involvement of microbial sulfate
reduction. The sulfur isotope ratio of 34S and 32S is reported in the form of a 6 value, where 6 34S
is defined as:
634S =- 32'r sarif 2 f sadard
34.,3 2 s standard (Equation 2.1)
and is usually reported as per mil notation, achieved by multiplying by 1000. Sulfate
measurements, done through carbonate-associated sulfur, on the other hand, reveal isotopic
compositions of oceanic sulfate when carbonate rocks are deposited. The extent of sulfate
present in the ocean during carbonic acid deposition into sedimentary rocks.
Stable isotopes geochemistry is a powerful method used in order to reconstruct ancient
environment, correlate rock samples from different parts of the world, and study metabolic
pathways. Biological processes generally prefer the use of lighter isotopes since their bonds are
weaker leading to an accumulation of lighter isotopes in the resulting biomass. Physical
processes, such as evaporation, will use the lighter isotopes first leading to an accumulation of
heavier isotopes in residual materials. The ratios of isotopic information are reported in delta

values that are compared to a standard. For sulfur, the standard is the Canyon Diablo Triolite
(CDT).
2.1.2 Carbon Isotopes Analysis
Autotrophic carbon fixation processes preferentially incorporate lighter isotopes of elements into
biomass, thus, biomass is usually depleted in the heavy isotope of carbon, 13 C. The ratio of 13C to
1C is reported in the form of a 8 value, where 6 1C is defined as:
1 3C- __ ___
13 12C [ a2(7 it 12c xartdar d
12C standard (Equation 2.2)
and conventionally reported as per mil notation by multiplying by 1000. These values are
measured against the Vienna PeeDee Belemite (VPDB). During the Snowball Earths cycling
periods high negative excursions of 6 13C in carbonate are documented from before and after the
Snowball Earth Events across the rocks record, demonstrating a decrease in biological activity
during the correlated glacial periods and increase during the interglacial periods (Halverson,
2006). Kaufman et al. (1997) found several positive to negative 81 3C anomaly cycles occurring
within the Windermere Supergroup, starting with above the Rapitan Group. Stratigraphic
variations were correlated to reflect temporal changes in environment by the co-variation of
61 3C carbonate and coexisting organic carbon values. Parallel trends are seen in the carbonate

and organic carbon values, which is reflective of geological environmental changes and not
diagenetic or metamorphic alterations to the area (Kaufman et al, 1997).
2.1.3 Lipid Biomarker Analysis
Molecular fossils, or biomarkers, are natural products that can survive in sediments with only
slight alteration of the original structure so that one can trace a specific biological origin. The
biomarkers that are most effective are organic compounds with specific biological origin whose
structure has been preserved through sedimentological processes. The biological markers that are
preserved within sedimentary structures can be studied by looking at organic chemical make up
of the compounds. Under the appropriate diagenetic conditions, hydrocarbon chains of specific
compounds will remain intact, leaving enough biological information to individually correlate
with a specific taxa (Brocks et al., 2003).
Diagenetic processes involving chemical conversion or microbial degradation are critical in
the preservation of organic matter (Eglinton, 1973). In oxic sedimentary environments, biolipids
such as sterols, carotenoids and chlorines will be degraded and will be poorly preserved (Didyk,
1978). Anoxic sedimentation conditions allow for the preservation of biolipids by preventing the
bacterial degradation of biolipids and predation in the water column. In anoxic conditions more
organic biomass will be deposited alongside sediments in thin laminations showing depositional

cycles and leading to higher values of total organic carbon (TOC) in the sediment. Higher values
of TOC, above 10%, are therefore often attributed to anoxic conditions of sedimentation (Thiede,
1977).
Oceanic chemical conditions can be reconstructed by examining the ratios of specific
biomarkers. The pristane to phytane ratio is used to determine the redox state of depositional
environment. Pristane (2,6,10, 14- tetramethylpentadecane) and phytane (2,6,10,14-
tetramethylhexadecane) is a natural saturated isoprenoid alkanes (Figure 1) that derive from the
alkyl side chain of chlorophyll a. During, this hydrocarbon tail (the phytyl chain) is cleaved from
the molecule to form the alcohol phytol. Phytol is converted to pristane and phytane in different
ratios depending on the redox conditions. Pristane is produced through oxidative pathways, while
phytane is generated in reductive pathways (Didyk,1978).
Figure 2.1 Pristane (above) and Phytane (below). The ratio of pristane and phytane recordsthe redox state of the sediment. Phytane is preferentially produced in oxic conditions, leadingto pr/ ph values less than unity. In anoxic conditions, Pristane is preferentially produced andthe pr/h ratio is greater than unity.
Under anoxic conditions the phytol is degraded to phytane , yielding low Pr/ Ph values. In oxic
conditions, on the other hand phytol is degraded to phylenic acid, which then is degraded to

pristane. This leads to higher Pr/ Ph ratios in oxic sediments. The breakdown of chlorophyll to
pristine and phytane is illustrated in Figure 2.2.
There are several specific biomarkers to differentiate between marine and lacustrine
environments. Elevated concentrations of C30 tetracyclicpolyprenoids (Holba et al., 2003) or
identifying Botryococcus (Metzger and Largeau, 1999) is indicative of lacustrine environments
ranging from fresh to brackish waters. Marine waters can be identified by the presence of n-
Propylcholestrane. The presence of n-propylcholestrane is representative of the remains of
marine pelagophytes (Heterokont Algae). The most commonly studied biomarker of marine
environments is 24-n-propylcholestrane, a widely occurring sterol that is biochemically
synthesized by chrysophyte algae (Moldowan, 1990). The presence of n-propylcholestrane will
indicate the sediments were of marine nature.
The specificity of biomarkers allows for very specific environmental reconstruction.
Diagnostic and geologically stable hydrocarbon biomarkers can be found for Chromatiaceae
(purple sulfur bacteria) and Chlorobiaceae (green sulfur bacteria). Purple sulfur bacteria and
green sulfur bacteria are unique in that they require reduced sulfur species and light (Brocks et
al., 2003). Thus, green and purple sulfur bacteria are paleoenvironment indicators for euxinic
conditions in the photic zone within ancient lacustrine and marine environments. Chromatiaceae
and Chlorobiaceae are thus representative of two possible conditions in a marine environment: 1)
shallow environments where the sediment-water interface is located in the euphotic zone 2)
photic zone euxinia where H2S plumes rose into the photic zone.

Oxic
R OH
70 400
Oxic
N. OH
Chlorophyll ai
0 01 g
Cr2Figure 2.2 Breakdown of Chlorophyll in to pristane and phytane. The breakdown of Chlorophyll
to phytol is shown above. In oxic ocean conditions phytol is broken down into phylenic acid and
then pristine. In anoxic ocean conditions phytol is degraded to phytane. The ratio of pristine to
phytane, thus, reveals the redox state of the ocean (Image from: C. Hallmann)
2.2 Late Proterozoic Ocean Chemistry and
Environment Leading into the Sturtian Event
Atmospheric oxygen began to rise from 2.3 to 2.0 Ga, and by 1.8 Ga, banded iron formations,
which had previously been prevalent, began to disappear (Holland, 1984). The transfer away
from an iron rich ocean was initially attributed to the First Oxygenation event. However,

Canfield (1998) proposed instead that a hydrogen sulfide rich ocean replaced the iron rich ocean,
and that anoxic conditions remained in the bottom waters until the Neoproterozoic (Canfield,
1998). Between 2.3 to 2.0 Ga, there was a gradual rise in atmospheric oxygen levels (Holland,
1984), which lead to higher rates of silicate weathering. This consequently led to a decrease in
atmospheric carbon dioxide. The rising levels of atmospheric oxygen, however, did not affect the
ocean oxygen concentrations until the Neoproterozoic. This is because the mechanism of oxygen
mixing in the ocean requires higher atmospheric oxygen levels at almost present day
concentrations (Canfield, 2002). Figure 2.3 illustrates the oceanic conditions that would have
been present in the hydrogen sulfide rich ocean. The deep bottom waters are hydrogen sulfide
rich with sulfur and sulfate reducing bacteria. Inside the photic zone, purple and green sulfur
bacteria are present. On top, there is a thin oxic zone (Anbar, 2002).
Intenseweathering
Figure 2.3. Hydrogen sulfide rich ocean waters. SRB, sulfur reducing bacteria, are present in thehypoxic sulfuric deep ocean waters. PSB, purple sulfur bacteria, and GSB, green sulfur bacteria,are present in a hypoxic sulfuric photic zone representing photic zone euxinia. The top waters areoxic.

The removal of the iron rich ocean, instead of being a result of oxygenation, is attributed to the
advent of hydrogen sulfide rich bottom waters, due to the growing communities of sulfur
bacteria (Cameron, 1982). The transfer from iron rich bottom waters to sulfide rich bottom
waters is consistent with the sulfate to sulfide isotopic fractionation that began starting at around
2.2 to 2.0 Ga that is attributed to sulfate reducing bacteria (Cameron, 1982). The transfer from
sulfide rich bottom waters to oxygen rich bottom waters is now attributed to the Second Great
Oxygenation, which occurred during the Neoproterozoic (Canfield, 1998). The Second Great
Oxygenation Event and the transition from euxinic to oxic deep ocean are followed by
eukaryotic radiation leading to the diverse forms of life during the Ediacaran Period. Placing
constraints on environmental conditions and molecular fossils can provide insights into the
relationship between oceanic and atmospheric oxygenation and eukaryotic radiation.
2.3 Geologic Setting of the Coppercap Formation inthe Mackenzie Mountains
The Coppercap Formation is located within the Coates Lake Group of the Windermere
Supergroup in the Northwest Territories of Canada (Figure 2.4). The Windermere Supergroup
spans the Sturtian and Marinoan in age with the Coppercap Formation dating to the Middle
Cryogenian. The Coppercap Formation lies directly above the Redstone River Formation and
below the Sayunei Formation in the Rapitan Group, separated by a few meters of siltstone

(Figure 2.5 and 2.6). The Rapitan Group, above the Coates Lake Group, has been studied in
depth (Hoffman, 2002, Park, 1997, Narbonne et al, 1994) due to its cap carbonates and
glacigenic nature.
Figure 2.4. Map of the Coppercap Formation. The Coppercap Formation is located in theMacKenzie Mountains near the border of the Northwest Territories and Yukon (Image: GoogleEarth).
E
0
IL0M:0.
I-
2U
zz0I-
0.
0D:Ofa:wI-
9C
20
Z 0.
BACKBONE RANGES FM(LOWER AND MIDDLE MEMBERS)
SHEEPBED FM
KEELE FM
TWITYA FM
TL SHEAL FM
8 COPPERCAP FM
LITTLE DAL GROUP - upper-
LITTLE DAL GROUP - hower
(KATHERINE GROUP)
TSEZOTENE FM
- a - a
Figure 2.5. Stratigraphic Column for the MacKenzie Mountain Supergroup and the WindermereSupergroup. The Coppercap Formation is located in the Windermere Supergroup in the CoatesLake Group. (Image Modified from Northwest Territories Geoscience, www.nwtgeoscience.ca)
Rephtan Group
h ate Lake Group
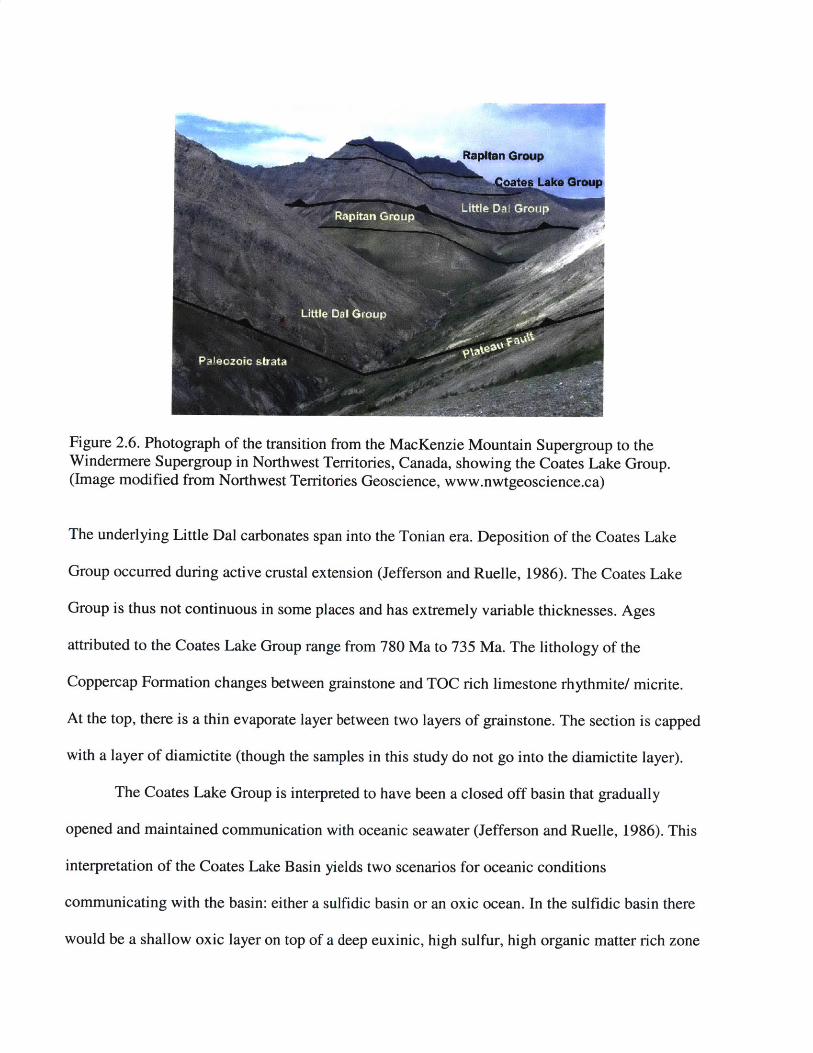
Figure 2.6. Photograph of the transition from the MacKenzie Mountain Supergroup to theWindermere Supergroup in Northwest Territories, Canada, showing the Coates Lake Group.(Image modified from Northwest Territories Geoscience, www.nwtgeoscience.ca)
The underlying Little Dal carbonates span into the Tonian era. Deposition of the Coates Lake
Group occurred during active crustal extension (Jefferson and Ruelle, 1986). The Coates Lake
Group is thus not continuous in some places and has extremely variable thicknesses. Ages
attributed to the Coates Lake Group range from 780 Ma to 735 Ma. The lithology of the
Coppercap Formation changes between grainstone and TOC rich limestone rhythmite/ micrite.
At the top, there is a thin evaporate layer between two layers of grainstone. The section is capped
with a layer of diamictite (though the samples in this study do not go into the diamictite layer).
The Coates Lake Group is interpreted to have been a closed off basin that gradually
opened and maintained communication with oceanic seawater (Jefferson and Ruelle, 1986). This
interpretation of the Coates Lake Basin yields two scenarios for oceanic conditions
communicating with the basin: either a sulfidic basin or an oxic ocean. In the sulfidic basin there
would be a shallow oxic layer on top of a deep euxinic, high sulfur, high organic matter rich zone

that possibly penetrated into the photic zone. Within the photic zone, purple sulfur reducing
bacteria and green sulfur bacteria would oxidize H2S to S042. Organic carbon burial would be
taking place in the lower sulfidic zone, where sulfur reducing bacteria would reduce SO4 2 into
H 2S. This would be representative of a largely closed euxinic basin. In the oxic ocean scenario,
the oxygenated layer would extend far past the photic zone, leaving a sulfate rich upper ocean
layer. H2S would be plentiful in the lowest depths of the ocean. In the oxic ocean scenario, the
sulfur reducing bacteria would preferably exists amongst the sediments within the lower shelf,
reducing SO4 -2 into H2S. The oxic ocean scenario would be representative of an open basin with
influx. Evidence of these scenarios can be noted by the presence of biomarkers, anomalies
within the values of 8'C and 834S
2.4 Hypothesis to be tested
Previous studies of lipid biomarkers in Cryogenian sediments (Kelly, 2009) suggest photic zone
euxinia during the deposition during Neoproterozoic to Cambrian transition. The main
hypothesis to be tested in this study is if pre- Snowball Earth oceanic conditions were largely
euxinic. One of the hypotheses is that the strong photic zone euxinia, caused by sulfate reduction
in the water column would leave sulfur isotope signatures that are different from the sulfur cycle
operating under a largely oxic body of water. Under a fully oxygenated body of water, sulfate
reduction would take place below the sediment water interface. A potential, and likely result of
photic zone euxinia is a relative enrichment of 34S compared to the euxinic case due to the closed
system effect (e.g., Ohmoto and Goldhaber, 1997; Canfield, 2001) Water column sulfate
reduction also affects carbonate compensation depth (Logan et al., 1997) such that there would
be a link between carbon and sulfur isotope records and the deposition of carbonate rocks. Other
factors that maybe affected are the total organic carbon content (TOC), relative concentration
and presence of lipid biomarkers. Lipid biomarkers for purple sulfur bacteria, green sulfur
bacteria and marine pelagophytes coupled with stable isotope ratios are presented to provide
linkages between biogeochemical cycling and environmental biology.
It is generally thought that the increase of atmospheric oxygen to -10% of present day
values (PAL) would have lead to biodiversification during the Ediacaran (Canfield and Teske,
1994). This study of the Coppercap Formation may provide new insights into geochemical
changing ocean chemistry from largely euxinic to largely oxic during the Late Neoproterozoic.

THIS PAGE IS INTENTIONALLY LEFT BLANK
3. Methods
All samples examined in this study were drill cores from the Coppercap Formation in the Coates
Lake group of the Northwestern Territories, Canada. The core was originally drilled for mineral
exploration purposes. All outside parts of the core samples were removed with a diamond- tip
blade saw. The rationale behind this separation is to only analyze the core insides that are less
prone to contamination during and after drilling. After cutting, the core insides that were
ultrasonicated in distilled deionized (DI) water, methanol (MeOH), and dicholomethane (DCM)
to remove any contamination induced during handling. Samples were then crushed with a
hammer into chips and subsequently powdered using a SPEX 8510 Shatterbox equipped with an
alumina ceramic puck mill.
All solvents used for extractions in this study were high purity grade (EMD OmniSolv).
Reagents were purchased from Sigma-Aldrich and are of reagent-grade. All water used in the
following procedures has been filtered and distilled through a Milli-system. Water used on the
carbon isotope analysis and lipid analysis has been additionally cleaned by five liquid- liquid
extractions with dichloromethane before use on samples. All glassware used in carbon isotope
analysis and lipid analysis was pre-combusted at 550'C for >8 hours prior to use. All glassware
used in sulfur isotope analysis has been rinsed with Milli- system DI water after normal washing
procedure prior to use.
3.1 Sulfur Extraction and Isotope Analysis
Pyrite (FeS2), which contains inorganic sulfur, was measured using the methods outlined in
Canfield (1986) "The use of chromium reduction in the analysis of reduced inorganic sulfur in
sediments and shales". The removal of inorganic sulfur was achieved through a process using
chromium chloride solution. Approximately 30mL of chromium chloride and 3g of zinc metal
were used per sample. Sample amounts used in pyrite extraction were adjusted depending on the
pyrite content of the rock. 2 mg of pyrite were used in each extraction. Zinc metals reduce
chromium chloride; the reduced chromium chloride subsequently reduces pyrite within the
sample into hydrogen sulfide gas. This gas was then bubbled through a 100 mL water trap and
collected in a 50 mL Zinc Acetate trap. Approximately 5 mL of silver nitrate was added to the
zinc acetate solution. The hydrogen sulfide reacted with silver nitrate to form silver sulfide,
which was precipitated out. The sample was placed in a chemical oven at 60'C overnight to
accelerate the precipitation process. The silver sulfide precipitate was rinsed, dried and 2 mg of it
is weighed into aluminum cups for isotope- ratio mass spectrometric (IRMS) analysis. Sulfur

isotope values are reported as 8 values relative to the Vienna Canyon Diablo Triolite Standard
(V-CDT) by defining the 634 S of IAEA S-I to be -0.3%o with respect to the V-CDT scale. The
834S pyfiw values were calculated as follows:
3 4 34_%63S 32c. 32,,
-34 ' 34 -
3 2S standiard (Equation 3.1)
All values for 834 Spyri were calculated from replicate analyses of samples and laboratory
standards. One standard is run for every 9 samples.
3.2 Carbon Extraction and Isotope Analysis
Carbonate carbon was be measured according to the methods described in Ostermann & Curry
(2000). Samples were additionally measured and analyzed for their total organic carbon (TOC).
To measure TOC, bulk powdered rock samples were acidified in purified 6N HCl to remove
carbonate minerals. The samples were then rinsed to neutrality in pre-cleaned DI water, filtered,
and dried. Approximately 2 mg of dried samples was loaded into tin cups for isotopic analysis.
The samples were then flash combusted in a Carlo Erba NA1500 Elemental Analyzer fitted with
an AS200 auto sampler at 10601C and a reduction furnace at 650'C. The CO 2 generated during
this combustion process was then analyzed by a Delta plus XP Isotope Ratio Mass Spectrometer
operated with Isodat 2.0 Software. Analysis of samples in triplicate allowed for the calculation of
standard deviation for each sample. Carbon Isotope values will be reported here as 6 values
relative to the V-PDB standard where 813 C is defined as:
=13 _ 2 arnpir 12 !rtnar d
13CL 2C mtandard (qain34
All 61 Corg values were corrected by calibration against the in-house standards "Acetanilde" and
"Arndt Acetanilde", as well as against international standards, "IAEA-CH-6 sucrose" and "NBS-
22". Standards are run interspersed within the sample analysis.
3.3 Molecular Biological Material Analysis
Bitumen was extracted from rock powder with dichloromethane (DCM)/ methanol (MeOH) (9:1)
using Dionex Accelerated Solvent Extraction (ASE) device, activated copper (HCl) to remove
elemental sulfur, solvent removed under a mild stream of nitrogen, and concentrated bitumen
(Equation 3.4)

fractionated into saturated hydrocarbons, aromatic hydrocarbons, and polar non-hydrocarbon
compounds using small- scaleopen column liquid chromatography; protocol was modified after
Bastow et al (Bastow et al "Rapid small-scale separation of saturate, aromatic and polar
compounds in petroleum", 2007). Samples were re-suspended in dichloromethane and activated
copper was added to remove elemental sulfur from the samples. Copper beads were activated
using a weak HCl solution and then rinsed with de-ionized water until the pH neutralized.
Activated copper was added to the TLE and left for 30 minutes. The elemental sulfur reacted
with the activated copper forming black copper sulfide. This process was repeated until there
was no change in the color of the copper.
The bitumen samples were subsequently transferred to the top of an open silica gel-
packed Pasteur pipette column. When the TLE sample had dried, another rinsing was added on
top of the column. This process was repeated 4 times. Using Three-Fraction Column
Chromatography the aromatics, saturates and polars fractions are extracted in sequence. This was
done by adding solvents, in series, to the column (eluting the column). Saturates are extracted
first by eluting with hexane. Aromatics are collected using a 1:1 ratio of hexane and DCM. The
samples are collected in 4ml vials and then aliquots were transferred to 2ml vials with adapters
for gas chromatography mass spectrometry (GC-MS) analysis.
Following the extraction of bitumen, approximately 40g of the residual rock powders
were decalcified with 6N HCl. Upon cessation of the reaction, the samples were rinsed with DI
water to neutrality, dried and again extracted with hexane to recover bitumen that was previous
inaccessible due to occlusion within the minerals (bitumen-2). The samples were extracted three
times by ultra-sonication and the solvent extracts were transferred to 60 mL vials. The bitumen-2

total lipid extracts (TLE) were evaporated under constant N2 flow in a Turbovap device and
treated like described earlier for the first bitumen extraction.
Aliquots of 1 tL of the saturated and aromatic, respectively, hydrocarbon fractions were
analyzed by an Agilent 5971 mass-selective detector (MSD) coupled to an Agilent 5975C gas
chromatograph (GC). The GC was equipped with a DB-1 MS column (60m, 0.25mm, 0.25pm)
for the analysis of saturated hydrocarbons and with a DB-5 MS column (60m, 0.25mm, 0.25 m)
for the analysis of aromatic hydrocarbons. Saturates and aromatic hydrocarbons were analyzed in
single ion monitoring (SIM) modes and quantified in relation to internal standards. No
corrections were made for different response factors.
For the analysis of steranes, aliquots of 1 ptL of the saturated hydrocarbon fraction were
analyzed by the Autospec Ultima magnetic sector MS, couples to a gas chromatograph that was
fitted with a DB-1 MS column (60m, 0.25mm, 0.25 pm). The MS was operated in a metastable
reaction monitoring (MRM), scanning the transitions: 372-217, 386-217, 400-217, 414-217, 414-
231, 404-221. Target compounds were quantified by comparison to internal standards assuming
a uniform response.

THIS PAGE IS INTENTIONALL LEFT BLANK

4 Results
Results for carbonate content (%), total organic carbon (%), 6'Corganic (%), 634 Spyrite (%o) and
biomarker analysis for pristane and phytane (pr/ph), aryl Isoprenoids and 61 Caronate (%) are
shown along side the lithology for the Coppercap Formation (Figure 4.1). The 613 CCarbtate values
for this section are credited to F. MacDonald (unpublished). The lithology of the Coppercap
Formation is dominated by carbonates. The basal part of the formation is composed of limestone
rhythmite/ micrite. This is overlain by a section of grainstone. Subsequently, a 5 m thick section
of the TOC rich limestone rhythmite/ micrite underlies a 10 m section of grainstone. Above the
grainstone, a 3 m section of evaporities can be found, followed by a renewed deposition of
grainstone, that is capped by the diamictite of the Sturtian glacial.
The relative carbonate content changes with the lithology. A lower percentage of
carbonate is observed in the TOC rich limestone relative to the grainstone. Even so, the
rhythmite is composed of up to 75% calcite. At the grainstone- evaporate transition, a distinct
decrease to 30% in the carbonate composition is observed. The carbonate values rise again in the
upper grainstone and fall off towards the top section of the grainstone.
C-)0
0
t-4
I I
1234 T236T
1: xD ePth N4
E zi~Carbnate (%) VSV~t (%0) TOC (%)
TOC zidiihinakum Eli idtdz,3it nicite F
Figure 4.1. Results for carbonate (%), total organic carbon (%), 613C organic (%o), 634Spyrite (%) and biomarker analysis for
pristane/ phytane (pr/ph), Y2,3,4/ 12,36, of aryl isoprenoids and 613C carbonate (%o). t E2,3,4/ E2,3,6 values are the sum of the 2,3,4
and 2,3,6 peaks from chromatography analysis of biolipids. Peaks represent the presence of green sulfur bacteria and purple sulfur
bacteria, respectively. t pr/ph value are the ratio of pristane to phytane; pr/ph >1 represents oxic conditions, pr/ph <1 represents
anoxic conditions *81 3 Ccarbonate values for this section are credited to F. MacDonald (unpublished).
/PC.3(%o &IICt=M(%O)*

Table 4.1. Measured results for carbonate (%), total organic carbon (%), jCorganic (%), S 1pyite (%e) and biomarker analysis forPristane/ Phytane (Pr/ph), 1234/ 1236 of Aryl Isoprenoids and 13 Ccronate (%V). (%)an_______anlsio
Sample Z 234/ 2:236 Pr/ph Redox State Depositional Environment Carbonate Content (%)
131 0 1.02 Oxidative Marine 32.85%132 0.19 0.26 Reducing Marine 73.36%133 0.42 1.92 Oxidative Marine 33.16%136 0.36 0.29 Reducing Marine 72.18%141 0.21 0.50 Reducing Marine 98.12%144 0.21 0.47 Reducing Marine 98.26%146 0.21 0.45 Reducing Marine 96.77%149 0.29 0.64 Reducing Marine 77.68%153 0.22 0.74 Reducing Marine 76.09%156 0.14 1.54 Oxidative Marine 56.43%162 0.13 1.08 Oxidative Marine 55.84%
166 0.20 1.76 Oxidative Marine 36.92%
169 0.31 0.49 Reducing Marine 75.13%
Sample 6 3Spyrite (%) A 33 (%o) A 36 (%o) TOC (%) 6 13Corg (%o) Stnd. Dev. 6 13COra (%o)
131 -22.88 0.16 -1.23 - -18.98 5.73
132 -14.88 0.054 -0.35 - -16.47 0.29
133 -21.13 0.071 -0.74 - -22.847 0.26
136 -6.69 -0.011 -1.47 - -19.75 1.16
141 -1.00 -0.5297 1.83 0.20 -21.46 0.43144 -7.78 -0.026 0.044 0.17 -21.25 0.035146 -2.24 -0.028 -0.29 0.25 -22.68 0.24149 -20.50 0.071 -1.67 0.27 -23.80 0.63153 -16.16 -0.028 -0.055 0.12 -34.01 0.98156 -15.94 0.059 -0.41 0.42 -31.78 2.4162 -21.99 0.066 0.47 0.22 -24.67 0.96166 -3.81 0.0052 -0.27 0.27 -27.51 0.48
169 -17.81 0.0039 -0.024 0.099 -24.04 1.16

There is a strong positive correlation between the carbonate composition and the S3 4Spyrite
(%o), where increasing carbonate content is related to positive excursions in the 83 4S1pyite (%0)
values. The 834Spyite values get higher within the limestone rhythmite sections and lower within
the grainstone layers. 34S pyite increase slightly within the evaporate layer and decrease again in
the grainstone top layer. There is a 20 %o difference from the lightest 34S pyrite value, in the top
grainstone layer, and the highest 834 Spyite values, in the middle limestone rythmite section.
Total organic carbon values are relatively low throughout the section. In general, TOC
values were higher in the limestone rhythmite sections. However, at sample 156 the highest TOC
value was observed. This depth is also correlated with a lightening of the MSpyrite and a sudden
increase in the value of 3 Ccarbonate .
813 Corg values increase within the initial limestone rhythmite section and then start to
decrease at 162. The negative excursion continues until the top of the TOC rich limestone
rhythmite. In the second grainstone layer, the 61 3Corg continues to get heavier at the same slope as
the initial increase in the first limestone rhythmite sections. The increasing 13 COrg values
continue until the evaporite, where a slight lightening of the 813 Corg is observed and in the
grainstone top layer, the 61 3COrg returns again to the initial slope.
813 Carbonate , overall, experiences a steady increase throughout the section with values
beginning at -8 %c and rising to near 8 %. Smaller 2 %o fluctuations occur within each
lithographic section.
The analysis of biomarkers yields correlating information regarding the environments
where this cycling appears. The pristane to phytane ratio yields a curve inversely related to the
63Spyrite. The pristane to phytane ratio represents the redox state of the depositional environment.
Values above 1 represent rather oxic conditions in which pristane is preferentially produced from
the phytyl tail of chlorophyll a. Values below 1 indicate the presence of a more reducing
environment. A sharp transition from reducing chemistry to oxidative conditions is observed in
the first section of limestone rhythmite. Reducing oceanic chemistry is noted in throughout the
first grainstone into the second layer of limestone rhythmite. Strong oxidative conditions are
noted in the evaporite section with reducing conditions in the final section of grainstone.

The ratio of the sum of 2,3,4-substituted over the sum of 2,3,6- substituted aryl-
isoprenoids (E2,3,4/ E2,3,6) indicates the relative prominence of purple sulfur bacteria over
green sulfur bacteria. In the studied samples both series of aryl isoprenoids are present in
significant amounts, suggesting the presence of reduced sulfur species in the shallow photic zone,
as purple sulfur bacteria thrive at slightly lower depths than green sulfur bacteria due to their
requirement for more sunlight. In the studied settings these values probably indicate a shallow
basin in which the sediment-water interface was well lit and allowed green and purple sulfur
bacteria to thrive as part of a bacterial mat. The values for E234/ E236 indicate largely
concentrations of purple sulfur bacteria, indicative of shallower depths. The ratio increases
throughout the second grainstone section and then sharply decreases in the evaporite section,
correlated with shallower depths. In sample 131, 2,3,4- aryl isoprencoids were not found to be
present indicating a dearth of purple sulfur bacteria at the top of the section.
The mass spectrometer was run in meta-stable reaction monitoring (MRM) mode
scanning for compounds present in 372-217 (C27), 386-217 (C2 8), 400-217 (C2 9), 414-217 (C3 0).
The chromatographs for (C2 7 ), (C2 8), (C29), and (C3 0) are displayed below with the relevant peaks
labeled for sample Coppercap Sample 132. The first four peaks (Table 4.2) are: Pa 20S, Pa 20R,
a4 20R, ap 20S. These peaks are representative of diasteranes, which are sterols that are
converted during diagenesis. It is assumed that this conversion takes place when acidic sites on
clay catalyze the sterols. This saturates a double bond in the sterols during catagenesis leads
results in diasteranes. The second set of peaks (Table 4.2) are: aa S, app R, ap S and aa R,
respectively. These peaks are representative of steranes.
Diasterane to sterane ratios are examined to the degree of catagenesis and temperature
degradation that has occurred to the steranes. The low diasterane/ sterane ratios are commonly

associated with carbonate source rock. There is better preservation in environments with lower
diasterane/ sterane ratios since it is representative of a higher pH, anoxic environment. The high
diasterane/sterane ratios are commonly associated with abundant clays and organic lean
carbonates. There is poor preservation in environments with high diasterane/ sterane ratios since
it is representative of a lower pH, oxic environment.
2500000 -A C 77
2000000 -
1500000 - B H
EFG1000000 -
C D500000
0 -
Figure 4.2 C 27 chromatograph for Coppercap Sample 132 with labeled peaks. Diasterane peaksand sterane peaks come out clearly for all samples and for all ranges evaluated in MRM modeanalysis.
Peak Label Compound Name Compound Class
A Pa 20S DiasteraneB Pa 20R Diasterane
C a4 20R DiasteraneD a 20S Diasterane
E aa S SteraneF ap R Sterane
G app S Sterane
H aa R Sterane
Table 4.2 Compound names and classes for diasterane and sterane peaks in MRMchromatographs. Each represents a broken down part of the hydrocarbon chain.

For all samples, very clear individual peaks for diasteranes and steranes were observed. This
shows that the samples have not been heavily biodegraded. The C30 plot (Figure 4.3) is specific
interest since C30 n- propyl cholestane sterances are representative of marine pelegophytes.
120000 -
G C30100000 -
H80000 - B C
F,60000 -
40000
20000 E F
0I,,..
Figure 4.3 C 30 chromatograph showing individual peaks for diasterane and sterane peaksindicating minimal biodegradation and presence of marine pelogophytes.
Isopropyl C 30 steranes are representative on sponges. In all samples C3 0 peaks were found to be
present with unique sterane peaks. This is indicative of marine pelagophytes being present
throughout the Coppercap Formation indicating a marine depositional environment for all
samples.

THIS PAGE IS INTENTIONALLY LEFT BLANK

5. Discussion
5.1 Geologic and Environmental Setting of the Coppercap
Formation
The transition from platform to opening basin in the MacKenzie Mountains is marked by
lithospheric stretching, rifting, glaciation and upward increasing iron-rich sediments (Jefferson
and Ruelle, 1986). After the Rapitan glaciation major transgressions occur, the continental
margin subsides yielding a passive margin. The Coates Lake Group was deposited during the
initial lithospheric stretching of the platform (Jefferson and Ruelle, 1986). Thick carbonate rich
platforms were deposited during this section. The contact between the Coates Lake Group and
the Rapitan Group is marked by an uncomformity representative of a rifting event (Young et al.,
1979). The Coppercap Formation, just underlying the Rapitan glacigenic sediments, was
deposited in extremely variable water depths due to the MacKenzie Mountain rifting event. As

the Coppercap Formation represents the last depositional environment prior to the Coates Lake-
Rapitan unconformity and the Rapitan glaciation, it serves as an important marker for pre-
Sturtian environmental conditions.
The transition into the Snowball Earth events are frequently correlated to decreased
quantities of atmospheric carbon dioxide (C02) and methane (CH4 ). CO 2 in enters the ocean and
atmospheric reservoir through igneous and metamorphic sources. Subsequently, precipitation of
limestone by calcifying organisms and of organic matter removes CO 2 from the reservoir. The
accelerated silicate weathering as a result of the break up of Rodinia are thought to have caused
lowering of carbon dioxide levels and consequent global cooling that lead to Snowball Earth.
The atmospheric and oceanic conditions of the Neoproterozoic Era are of special interest in
understanding the mechanisms and environmental conditions that lead to the Snowball Earths.
Despite the advent of atmospheric oxygen from 2.3 to 2.0 Ga, and the disappearance of
banded iron formations around 1.8 Ga (Holland, 1984), it is likely that anoxic conditions
remained in the oceanic bottom waters until the Neoproterozoic (Canfield, 1998). A gradual rise
in atmospheric oxygen levels (Holland, 1984), would first lead to an alteration in weathering due
to oxygenated accelerated weathering processes. However, the mechanisms for the oxygen to
reach the deep ocean depths was not available until higher, near present day levels of
atmospheric oxygen were reached. This lead to a sulfide rich deep ocean (Cameron, 1982). The
transition from iron rich bottom waters to sulfide rich bottom waters is consistent with the sulfate
to sulfide isotopic fractionation that began starting at around 2.2 to 2.0 Ga that is attributed to
sulfur reducing bacteria (Cameron, 1982). Oxic bottom waters are not assumed to have occurred
until the Second Great Oxygenation during the Neoproterozoic (Canfield, 1998). The transition
from euxinic to oxic deep ocean composition is representative of the Second Great Oxygenation

occurring in the atmosphere, which in turn allowed for the evolution of diverse eukaryotic life
and eukaryotic radiation.
5.2 Evidence of Euxinia and EnvironmentalConditions of the Coppercap Formation
The Coppercap Formation shows diagnostic molecular evidence for photic zone euxinia
throughout the section. The presence of n-propyl cholestane throughout the Coppercap
Formation indicate that marine pelagophytes were present throughout the section. The presence
of marine pelagophytes indicates a marine depositional environment. The correlates with the
theory of the Coppercap Formation being representative of lithographic stretching and an area of
intracratonic seas. Lower portions of the Windermere Supergroup include siliciclastic sandstone,
indicative of the transition from land and shore depositional environments into the marine
environment where the Coppercap Formation was deposited.
The pristane/ phytane ratio of the Coppercap Formation sediment shows an oscillation
from anoxic to oxic conditions in the section. The deeper TOC rich limestone rhythmite/micrite
section shows higher pristane values and represents relatively oxic diagenetic environments. The
two grainstone layers and the second limestone rhythmite layer have pristane/phytane values less
than unity, representing relatively reducing conditions. The upper evaporate was deposited under
oxic conditions. However, directly, overlying the evaporates is another layer of grainstone,
deposited under anoxic conditions. The oscillation between anoxic to oxic conditions during the

deposition of the Coppercap Formation represent changes in the depositional environment due to
transgressions and regression or changes in the amount of oxygen in the ocean waters. Since the
Coppercap Formation were deposited in a shallow marine environment, these changes are likely
in part related to transgressions and regressions. This may suggest heterogeneous ocean
chemistry and redox gradients in the ocean chemistry. However, the last grainstone layer at the
top of the section has a slightly oxic depositional environment.
The pristane/ phytane ratios are correlated to the carbonate (%) and 6 34S values (Figure
5.1). Carbonate content of the samples were found to be highest in anoxic oceanic conditions and
lowest in oxic oceanic conditions. This is likely related to the amount of carbon available to be
precipitated as calcium carbonate as opposed to be precipitated to buried as organic mass. As
expected, the lowest carbonate values are felt during the first layer of limestone rhythmite/
micrite and the largest concentrations are in the large layer of grainstone.
6 34S values correlate with the carbonate values. Heavier isotopes of sulfur were able to
precipitate with iron when there was less calcium carbonate precipitating. The higher amounts of
calcium carbonate and a lower isotope 6 34S indicate that sulfur-reducing bacteria were unable to
preferentially fractionate in lighter isotopes during the time periods of altered oceanic chemistry.
This could be a result of sulfate reducing bacteria not being present as prolific in carbonate rich
waters, or related to the relative sulfate ocean concentration. In the limestone rhythmite/micrite
layers, the heaviest sulfur isotope ratios were found. The high sulfur isotope values maybe
related to the relative sea level changes that would cause environmental constraints on the sulfur
reducing bacteria communities. Carbonate associated sulfur studies were not conducted for this
study, but would aid in the understanding of sulfur burial relative to sulfate concentration of the
ocean.

The presence or absence of green and purple sulfur bacteria can be used to explain some
of the sulfur cycling that is occurring in the Coppercap Formation. Additionally, it aids in
determining the depositional environments for sulfur. By looking at the sum of 2,3,4-substituted
0 1 2 C% 50% 100% -25 -15 -5 5
Pr/ Ph Carbonate (%) 8SS, (%o)
Figure 5.1 Pristane/ phytane ratios, carbonate content (%) and 8 34 S values are shown. Pr/ph
ratios below one are correlated with higher carbonate content values and higher 6 34S values. This
shows enrichment of 6 34S in reducing environments.

aryl-isoprenoids over the sum of 2,3,6-substituted aryl-isoprenoids, the prominence of purple
sulfur bacteria over green sulfur bacteria can be analyzed. The presence of green and sulfur
bacteria indicate photic zone euxinia. This is because green and purple sulfur bacteria need a
reduced sulfur course (mainly hydrogen sulfide) for its chemical energy, redox processes. The
hydrogen sulfide generated by sulfate reducing bacteria. The hydrogen sulfide plume must have
reached the photic zone for green and purple bacteria to be present since they require sunlight for
photosynthesis. In the studied setting these values indicate a shallow basin in which the sediment
to water interface was well lit, probably allowing for purple and green bacteria to thrive as part
of a microbial mat or in a planktonic setting.
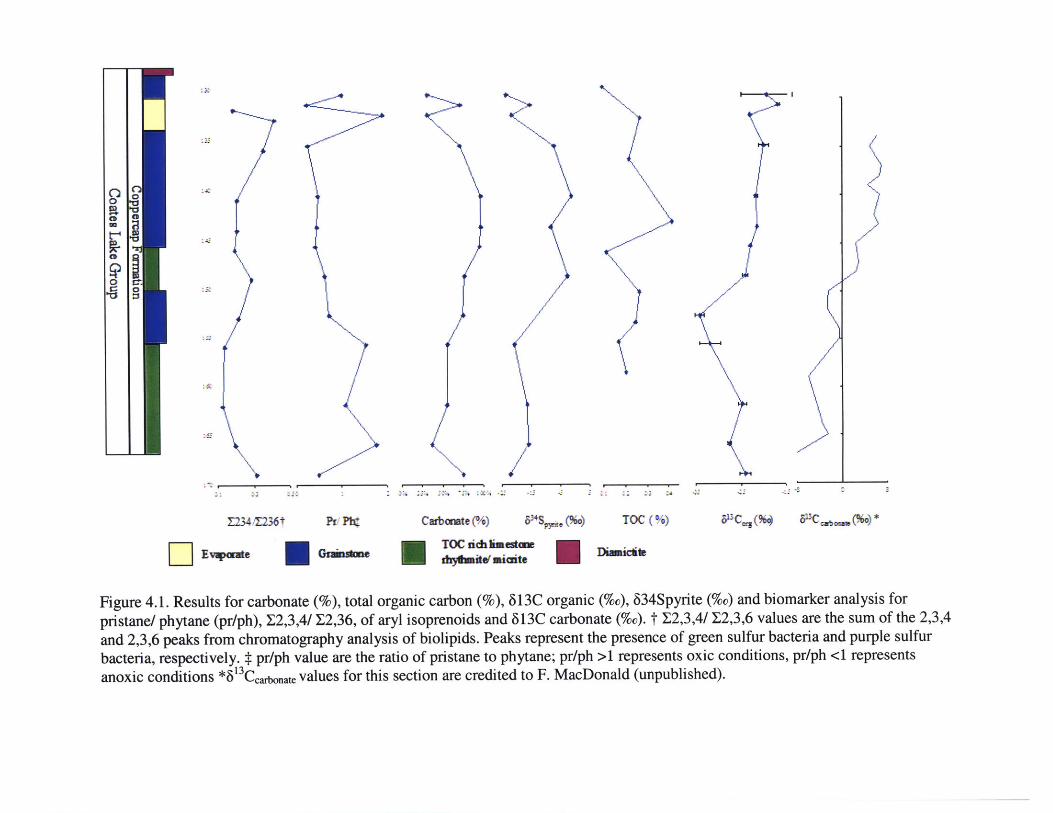
Carbon burial can be analyzed through the ratios and correlations of the 6 'Coganic values
and the 6 'Ccarbonate curve (Figure 5.2). Variations in the 6 13 Corganic and the 6 13Ccarbonate are
correlated with the amount of biological cycling of organic material taking place in the
depositional environment. If the carbon isotopic ratio of carbonate is different from that of
organic carbon, this shows that there is biogeochemical fraction occurring.
The 6 '3 Corganic and the 6 13Ccarbonate follow a similar over all increasing of 6 13C values.
However, there is a slight negative excursion in the 6 13 Corganic that is not shown in the 6
13Ccarbonate. The corresponding excursion in the 6 13 Corganic between Samples 162 to Samples 146
correlate with the oxidative section of the pristane/ phytane ratio (>1). While there was a
negative excursion in the 6 13 Corganic , the values of pristane/ phytane show an oxic ocean
chemistry. Of the organic carbon material, more biological cycling and recycling was taking
place during this section leading to a negative excursion. This correlation between a negative 6
13Corganic and oxic ocean conditions demonstrates the presence of microbes degrading organic
material and fractionating the isotopes of organic material that already has been fractionated.

0 1 2 -35 -25 -15 -8 0 8
Pr/ Ph 013Corg (%o) 013 Corbon~te (%0) *
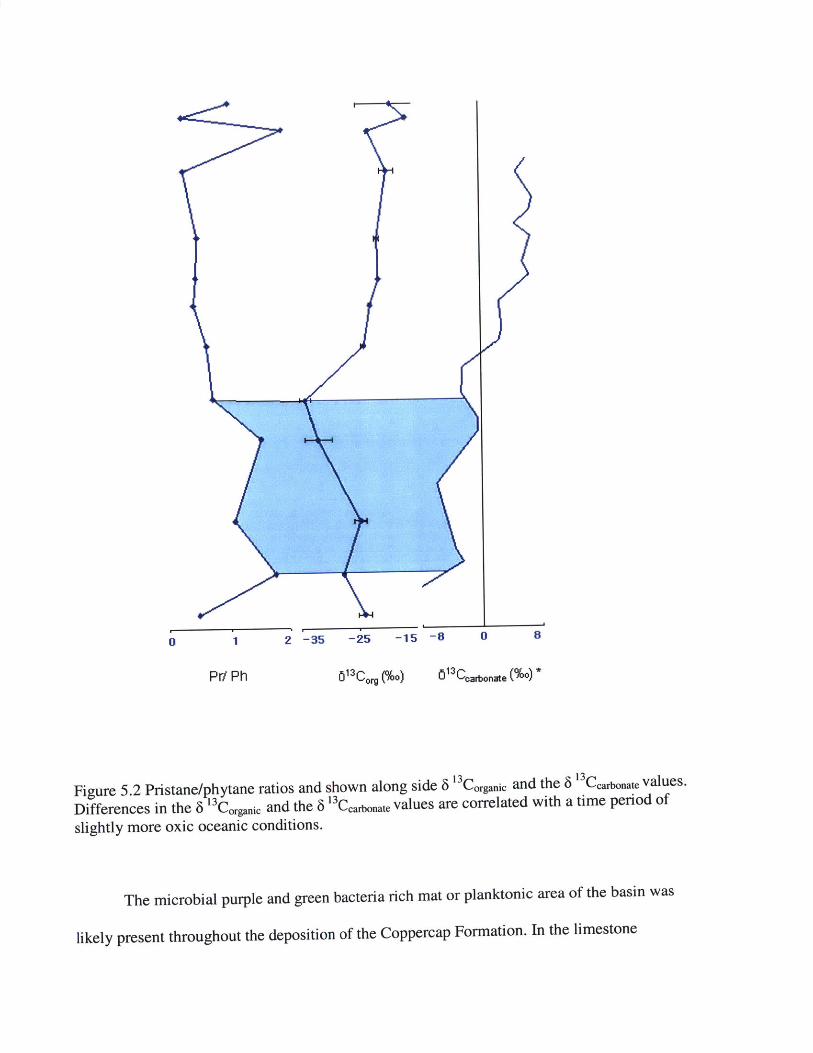
Figure 5.2 Pristane/phytane ratios and shown along side 6 3 Corganic and the 6 13Carbonate values.
Differences in the 6 13Corganic and the 6 '3 Ccarbonate values are correlated with a time period of
slightly more oxic oceanic conditions.
The microbial purple and green bacteria rich mat or planktonic area of the basin was
likely present throughout the deposition of the Coppercap Formation. In the limestone
aryl-isoprenoids over the sum of 2,3,6-substituted aryl-isoprenoids, the prominence of purple
sulfur bacteria over green sulfur bacteria can be analyzed. The presence of green and sulfur
bacteria indicate photic zone euxinia. This is because green and purple sulfur bacteria need a
reduced sulfur course (mainly hydrogen sulfide) for its chemical energy, redox processes. The
hydrogen sulfide generated by sulfate reducing bacteria. The hydrogen sulfide plume must have
reached the photic zone for green and purple bacteria to be present since they require sunlight for
photosynthesis. In the studied setting these values indicate a shallow basin in which the sediment
to water interface was well lit, probably allowing for purple and green bacteria to thrive as part
of a microbial mat or in a planktonic setting.
Carbon burial can be analyzed through the ratios and correlations of the 6 "Corganic values
and the 6 'Ccarbonate curve (Figure 5.2). Variations in the 6 13 Corganic and the 6 'Ccarbonate are
correlated with the amount of biological cycling of organic material taking place in the
depositional environment. If the carbon isotopic ratio of carbonate is different from that of
organic carbon, this shows that there is biogeochemical fraction occurring.
The 6 "Corganic and the 6 ' 3 Ccafonate follow a similar over all increasing of 6 13C values.
However, there is a slight negative excursion in the 6 13Corganic that is not shown in the 6
13Ccarbonate. The corresponding excursion in the 6 13Corganic between Samples 162 to Samples 146
correlate with the oxidative section of the pristane/ phytane ratio (>1). While there was a
negative excursion in the 6 '3 Corgamic , the values of pristane/ phytane show an oxic ocean
chemistry. Of the organic carbon material, more biological cycling and recycling was taking
place during this section leading to a negative excursion. This correlation between a negative 6
13Corganic and oxic ocean conditions demonstrates the presence of microbes degrading organic
material and fractionating the isotopes of organic material that already has been fractionated.
0 1 2
Pr/ Ph
-35 -25 -15 -8 0 8
813 Co (%o) 01 3 Coarbonate (%0)*
Figure 5.2 Pristane/phytane ratios and shown along side 6 '3 Corgaic and the 8 a3 Ceante values.
Differences in the 6 13Corganic and the 6 13Ccarbonate values are correlated with a time period of
slightly more oxic oceanic conditions.
The microbial purple and green bacteria rich mat or planktonic area of the basin was
likely present throughout the deposition of the Coppercap Formation. In the limestone

rhythmite/micrite sections show larger relative populations of purple sulfur bacteria. Purple
sulfur bacteria prefer shallower water depths and requires more light than green sulfur bacteria.
In time periods of tides or oscillating sea level that would cause the deposition of rhythmites,
purple sulfur bacteria at shallower depths would be more prominent than green sulfur bacteria.

THIS PAGE IS INTENTIONALLY LEFT BLANK

6. Conclusions and Further Studies
The upper section of the Coppercap Formation represents a lithospheric stretching event leading
to the creation intracratonic oceans. These oceans, as they open to the marine waters represent
global signals in oceanic chemistry. The deposition of the Coppercap Formation shows some
signals of the pre-glacial events of the Sturtian that can be representative of a global marine
signal.
The Coppercap Formation was deposited under largely euxinic environment evidenced
by the presence of purple and green sulfur bacteria (aryl isoprenoids) and the relative enrichment
of 6 34S values. Higher 8 34S are correlated to reducing oceanic conditions and increased
carbonate deposition. Hydrogen sulfide rich waters in the deposition of the Coppercap Formation
follow Canfield's prediction of hydrogen sulfide rich waters persisted until later into the
Cryogenian and the Second Great Oxygenation Event. Somewhat more oxic conditions are
present in the record of the Coppercap Formation and correlated with higher microbe activity and
stable carbon isotope fractionation, but these situations are still the irregularity.
Purple and green sulfur bacterial mats in the Coppercap Formation demonstrate the
possibility for global euxinic conditions during the Late Proterozoic. Further studies should
investigate the relationship between biogeochemical cycling and the lipid biological material of
samples of comparable pre-glacial rock formations to determine the geographical extent of

euxinia in the Late Proterozoic. Investigation into the carbonate associated sulfur (CAS) will
help determine the water level at deposition and oceanic chemistry. CAS analysis could also help
determine the sulfur cycling that is occurring in the Coppercap Formation and the nature of the
microbes present in the formation. These studies should ideally start by examining the
connections between samples in Northwest Canada in the pre- Sturtian era to determine the
connectivity of the oceans during the time period.

References:
Aitken, J.D. (1991) "Two Late Proterozoic glaciations, Mackenzie Mountains, northwesternCanada" Geology; May 1991; v. 19; no. 5; p. 445-448
Aitken, J.D., Long, D.G.F. (1978) "Mackenzie tectonic arc-Reflection of early basinconfiguration" Geology; October 1978; v. 6; no. 10; p. 626-629
Anbar, A., Knoll, A. (2002)"Proterozoic Ocean Chemistry and Evolution: A BioinorganicBridge?" Science 16 August 2002:Vol. 297. no. 5584, pp. 1137 - 1142
Bastow, T.P., van Aarssen, B.G.K., Lang, D. (2007) "Rapid small - scale separation of saturate,aromatic and polar components in petroleum" Organic Geochemistry
Brocks, J. J.; Summons, R. E. (2003) Sedimentary Hydrocarbons, Biomarkers for Early LifeTreatise on Geochemistry, Volume 8. Editor: William H. Schlesinger. Executive Editors:Heinrich D. Holland and Karl K. Turekian. pp. 682 Elsevier, 2003., p.6 3 -1 15
Cameron, E.M. (1982)"Sulphate and sulphate reduction in early Precambrian oceans"Nature 296 pp. 117 - 140
Canfield, D. E. and Teske, A., (1996) "Late Proterozoic rise in atmospheric oxygenconcentration inferred from phylogenetic and sulphur-isotope studies" Nature 382, 127-132.
Canfield, D.E. (1998) A new model for Proterozoic ocean chemistry Nature. 396:450-453
Canfield, D.E., Poulton, S.W., & Narbonne, G.M., (2006) "Late-Neoproterozoic deep-oceanoxygenation and the rise of animal life." Science 000, 000-000.
Chu, Xuelei, Zhang, Qirui, Zhang, Tonggang, Feng, Lianjun (2003) "Sulfur and carbon isotopicvariations in Neoproterozoic sedimentary rocks from Southern China" Progress in NaturalScience, Volume 13, Number 11, November 2003, pp. 875-880(6)
Didyk, B., Simoneit' T., Brassel, S., Eglinton, G (1978) "Organic geochemical indicators ofpalaeoenvironmental conditions of sedimentation" Nature 272, 216 - 222
Eglinton, G. (1973) "Chemical fossils: a combined organic geochemical and environmentalapproach" Pure and Applied Chemistry 34 pp. 611 - 632.
Freeman, K., Hayes, J., Trendel, J., and Albrecht, P. (1990) "Evidence from carbon isotopemeasurements for diverse origins of sedimentary hydrocarbons" Nature 343 pp. 254 - 256
Freeman, K, Wakeham, S., Hayes, J. (2003) "Predictive isotopic biogeochemistry: Hydrocrabonsfrom anoxic marine basins" Organic Geochemistry Volume 21, Issues 6-7, June-July 1994,Pages 629-644
Halverson, G.(2006) "A Neoproterozoic chronology". In: S. Xiao and A. Kaufman, Editors,Neoproterozoic Geobiology and Paleobiology, Topics in Geobiology vol. 27, Springer, NewYork pp. 231 - 271.
Hoffman, P.F., Kaufman, J.A. & Halverson, G.P., (1998),,Comings and goings of globalglaciations on a Neoproterozoic carbonate platform in Namibia" GSA Today 8,1-9.
Hoffman, P.F., Kaufman, A.J., Halverson, G.P. & Schrag, D.P., (1998) "A Neoproterozoicsnowball Earth". Science 281, 1342-46.
Hoffman, P.F. & Maloof, A.C., (2001) "Tilting at snowballs"http://www.eps.harvard.edu/people/faculty/hoffman/TAG.html
Hoffman, P.F. & Schrag, D.P., (2002) "The snowball Earth hypothesis: testing the limits ofglobal change" Terra Nova 14, 129-155.
Holba, A., Dzou,L', Wood, G*, Ellis, L., Adam, P., Schaeffer, P., Albrecht, P., Greene, T.,Hughes, W. (2003) "Application of tetracyclic polyprenoids as indicators of input from fresh-brackish water environments" Organic Geochemistry Volume 34, Issue 3, March 2003, Pages441-469
Holland, HD (1984) "The Chemical Evolution of the Atmosphere and Oceans"Princeton Univ. Press
Hurtgen, M.T., Arthur, M.A., and Halverson, G.P., (2005) "Neoproterozoic sulfur isotopes, theevolution of microbial sulfur species, and the burial efficiency of sulfide as sedimentary pyrite."Geology 33, 41-44
Hurtgen, M.T., Halverson, G.P., Arthur, M.A., and Hoffman, P.F., (2006) "Sulfur cycling in the
aftermath of a 635-Ma snowball glaciation: Evidence for a syn-glacial sulfidic deep ocean"Earth and Planetary Science Letters 245, 551-570.
James, N.P., Narbonne, G.M. & Kyser, T.K., (2001) "Late Neoproterozoic cap carbonates:Mackenzie Mountains, northwestern Canada: precipitation and global glacial meltdown"Canadian Journal of Earth Science 38, 1229-1262.
Jefferson, C. and Ruelle, J. (1986) "The Late Proterozoic Redstone Copper Belt, MackenzieMountains, Northwest Territories". In: J. Morin, Editor, Mineral Deposits of Northern Cordillera,Special Volume vol. 37, The Canadian Institute of Mining and Metallurgy pp. 154 - 168.Kaufman, A., Knoll, A. and Narbonne, G. (1997) "Isotopes, ice ages, and terminal ProterozoicEarth history", Proceedings of the National Academy of Sciences 95 (1997), pp. 6600 - 6605.
Kelly, A. (2009) "Hydrocarbon biomarkers for biotic and environmental evolution through theNeoproterozoic-Cambrian transition" Massachusetts Institute of Technology Ph.D. Thesis
Logan G.A., Summons R.E., Hayes J.M. (1997) "An isotopic biogeochemical study ofNeoproterozoic and Early Cambrian sediments from the Centralian Superbasin". Geochimica etCosmochimica Acta 61: 5391-5409.
Love, G.D., Grosjean, E., Stalvies, C., Fike, D.A., Grotzinger, J.P., Bradley, A.S., Kelly, A.E.,Bhatia, M., Meredith, W., Snape, C.E., Bowring, S.A., Condon, D.J. & Summons, R.E., (2009)"Fossil steroids record the appearance of Demospongiae during the Cryogenian period"Nature 457, 718-722.
Macdonald, F.A., Schmitz, M.D., Crowley, J.L., Roots, C.F., Jones, D.S., Maloof, A.C., Strauss,J.V., Cohen, P.A., Johnston, D.T., and Schrag, D.P., (2010) "Calibrating the Cryogenian",Science. 327. no. 5970, pp. 1241 - 1243
Metzger P, Largeau C (1999) Chemicals of Botryococcus braunii. In: Cohen Z (ed) Chemicalsfrom microalgae. Taylor & Francis, London, pp 205 - 260
Moldowan, J., Fago, J., Lee, F., Jacobson, S., Watt, D., Slougui, N., Jeganathan, A., and Young,D (1990) "Sedimentary 24-n-propylcholestanes, molecular fossils diagnostic of marine algae"Science 247 pp. 309 - 312
Morris, W.A. (1977) "Paleolatitude of glaciogenic upper Precambrian Rapitan Group and the useof tillites as chronostratigraphic marker horizons" Geology; February 1977, v. 5; no. 2; p. 85-88
Narbonnne, G., Kaufman. A., and Knoll, A. (1994)"Integrated chemostratigraphy andbiostratigraphy of the Windermere Supergroup, northwest Canada: implications forNeoproterozoic correlations and the early evolution of animals" Geological Society ofAmericaBulletin 106 pp. 1281 - 1292.
Ohmoto, H. Kakegawa, T., Lowe, R., (1993) "3.4-Billion-year-old biogenic pyrites fromBarberton, South Africa: sulfur isotope evidence" Science 262, 555
Ostermann, Curry (2000) "Calibration of stable isotopic data: An enriched 3180 standard usedfor source gas mixing detection and correction" Paleoceanography 15 pp. 353-360
Rothman D. H., Hayes J. M., and Summons R. E. (2003) Dynamics of the Neoproterozoiccarbon cycle. Proc. Natl. Acad. Sci. (USA) 100: 8124-8129.

Shen, Y., Buick, R., and Canfield, D. E., 2001. Isotopic evidence for microbial sulphatereduction in the early Archaean era. Nature 410, 77-8 1.
Thiede, J., and Van Andel, T. (1977) "The paleoenvironment of anaerobic sediments in the lateMesosoic South Atlantic Ocean" Earth Planet. Sci. Lett. v. 33 pp. 301 - 309.
Young, G. (1992) "Late Proterozoic stratigraphy and the Canada-Australia connection " Geology;March 1992; v. 20; no. 3; p. 215-218