Embed Size (px)
Citation preview
1
Stabilization of Flow Boiling in a Micro Tube with air injection
Youngbae Han and Naoki Shikazono Institute of Industrial Science, The University of Tokyo
Komaba 4-6-1, Meguro-ku, Tokyo 151-0041, Japan Tel: +81-3-5452-6777; Fax: +81-3-5452-6777
Email address: [email protected] (Youngbae Han),
[email protected] (Naoki Shikazono).
Abstract Air injection as a stabilization method is evaluated for flow boiling in a micro tube. Pyrex glass tube coated by ITO film is employed as a test tube for flow visualization with water as a working fluid. Air bubble and liquid slug lengths are controlled by changing air and liquid mass velocities. Wall temperatures and inlet/outlet pressures show very large fluctuations during flow boiling without air injection. Severe reverse flow is also observed from flow visualization. On the other hand, wall temperature and inlet/outlet pressures as well as visualized flow patterns become very stable with air injection. In addition, much higher heat transfer coefficients are obtained for air injected cases. It is observed from the flow visualization that the flow becomes much stable and shows regular patterns. Key words Micro tube, Flow boiling, Stabilization, Air injection, Liquid film Nomenclature Symbol Description Unit Cp specific heat kJ/kg⋅K D tube diameter m Dh hydraulic diameter m f friction factor - G mass velocity kg/m2s h convection heat transfer coefficient W/m2K hfg latent heat kJ/kg I current A k thermal conductivty W/mK L heating length m Nu Nusselt number -
2
P pressure N/m2 Q volume flow rate ml/min qʺ″ heat flux W/m2 R tube radius m x vapor quality - T temperature °C V voltage V z distance from the measuring point m Greek Symbols µ viscosity Pa⋅s ρ density kg/m3 Subscripts a air e exit f working fluid in inner out outer sat saturated sub subcooled 1. Introduction Flow boiling in micro channels attracts great attention as an effective method to effectively transfer heat (Barber et al., 2009). Independence on gravity and high volume density are also notable advantages of micro tube heat transfer. Due to these advantages, flow boiling in micro channels has been investigated extensively in the past few years (Bao et al., 2000; Yen et al., 2003; Kandlikar, 2004; Wojtan et al., 2006). However, it is reported that large pressure and temperature fluctuations occurred without a valve or orifice. (Brutin et al., 2003; Wu and Cheng, 2003). These instabilities caused by severe reverse flow makes it difficult to adopt micro channel boiling in real systems. In order to take full advantage of micro channel boiling, stable flow pattern should be obtained. Hetsroni et al. (2005) investigated flow boiling of water in parallel micro channels. It was observed that rapid bubble growth pushed the vapor-liquid interface toward both upstream and downstream. It was attributed to the sudden expansion of vapor bubble after nucleation. The flow pattern observed through visualization was different from normal annular flows with intermitted liquid slugs. It was described as explosive boiling with periodic wetting and dryout. Heat transfer coefficient showed strong dependence on vapor quality. Huh et al. (2007) conducted flow boiling experiments in a single micro channel with a hydraulic diameter of Dh = 103.5 μm. Both pressure and temperature showed long period
3
and large amplitude fluctuations. The periodic flow pattern transition between bubbly/slug and elongated slug/semi-annular flows completely corresponded to the fluctuations in pressure and temperature. It was reported that the flow pattern transition instability is the reason for the periodic fluctuations. As the heat flux and vapor quality increased, both frequency and amplitude of the fluctuations also increased. Wang and Cheng (2008) conducted flow boiling instability experiments in a single micro channel with a hydraulic diameter of Dh = 155 μm. The cycles of pressure and temperature oscillations were longer than 100 s. Exit quality was introduced as the evaluation parameter for stable and unstable flow boiling. Critical value of exit quality was set to xe = 0.013. At xe > 0.013, flow became unstable and different flow patterns e.g., bubbly flow, elongated bubbly/slug flow, semi-annular flow and annular/mist flow were observed at the outlet. Several stabilization methods have been proposed for flow boiling in micro channels. Kandlikar et al. (2006) evaluated two stabilization methods i.e., pressure drop element and artificial nucleation sites. Six parallel channels with an average dimension of 1054 × 197 μm were used as a test conduit. In their experiments, flow instability was evaluated from pressure drop and pressure fluctuation. Test results were compared with the case without pressure drop element and artificial nucleation sites. Combination of pressure drop element and artificial nucleation sites was recommended for the stabilization of flow boiling in micro channels. Bergles and Kandlikar (2005) suggested that installing the inlet orifices could stabilize both upstream compressible volume instability and excursive instability. Individual inlet orifices are demonstrated to work well in multi-channels (Agostini et al., 2008; Wang et al., 2008;). Wang et al. (2008) investigated pressure and temperature fluctuations in multi-microchannels with three types of inlet/outlet geometries. In the case of individual inlet orificies, perfect stabilization with no temperature and pressure fluctuation was achieved. Agostini et al. (2008) conducted flow boiling experiments in multi-microchannels to investigate critical heat flux and two-phase pressure drop. In their experiments, an orifice at each inlet was installed and stable flow could be obtained. Lu and Pan (2008) fabricated parallel micro channels heat sink with a diverging cross-section for flow boiling stabilization. Flow instability was determined from the pressure drop oscillation. Stability characteristics were compared with those in micro channels with uniform cross-sectional area. It was confirmed that the flow boiling in the parallel micro channels with a diverging cross-section is superior to that with a uniform cross-section. Xu et al. (2009) used seed vapor bubbles as stabililzation method which was originally proposed by Thome and Dupont (2007). Five parallel channels with hydraulic diameter of Dh = 100 μm was used as a test conduit. Seed vapor bubbles were generated by micro
4
heaters near the inlet. Pulse voltage signal was applied on micro heaters. Vapor bubble generation was controlled by changing voltage signal frequency. As signal frequency increased, fluctuations in pressure and temperature decreased. Flow instability was completely restricted at signal frequencies higher than 100 Hz. Decreases in surface temperature and its variation were achieved by introducing seed vapor bubbles. In micro channels, onset of vapor bubble nucleation does not take place until wall superheat becomes high. Once a vapor bubble is generated, it expands explosively due to high wall superheat, and then severe reverse flow makes the system unstable. In order to stabilize the flow boiling in micro channels, bubble generation should be controlled to occur under low superheat. In the present study, air injection is evaluated as a stabilization method for micro tube boiling. With air injection, flow regime becomes air-liquid slug flow before entering the heated section. Gas and water two-phase flow withour phase change in a micro channel has been investigated by several research groups (Hayashi et al.,2007; He et al., 2010). It was reported that heat transfer coefficient was enhanced due to the circulation in liquid slug. However, experimental research on gas and water two-phase flow with phase change is very limited. Since thermal capacitance of air is lower than that of liquid, local liquid film temperature becomes much higher than the bulk temperature of the single phase liquid flow. Thus, liquid film can evaporate even from the subcooled region and explosive evaporation under high superheat can be avoded. There are different methods to make small bubbles other than bubble seeding. For example, Agostini et al. (2008) installed an orifice at the inlet to create samll bubbles by flashing which can initiate bubble nucleation at lower superheat and leads to flow stabilization. However, it is difficult to control air bubble length and liquid slug length with flashing. Air injection method, on the other hand, has a possibility of controlling flow patterns actively under various operating conditions which can be considered as a important advantage of air injection. Air injection has also several disadvantages. For example, air becomes a non-condensable gas in the condenser. Additional gas-liquid separator is necessary for phase separation. Fouling, oxidation and organic growth may also occur. To avoid this, it is necessary to introduce filters and use inert gas instead of air. In the present study, flow stabilization effect of air injection in a single micro tube during flow boiling is investigated. Pressure and wall temperature measurements as well as flow visualization are conducted. The obtained results with and without air injection are compared, and the effectiveness of air injection for micro tube boiling stabilization is investigated.

5
2. Experimental setup and procedures 2.1 Experimental setup Figure 1 shows the schematic diagram of the experimental setup. Degassed water is pumped at a uniform flow rate with the plunge pump. In the preheater, water is heated up to the desired temperature. Pyrex glass tube with inner diameter of D = 0.5 mm is used as a test tube. Dry air from the compressor is introduced to the T-junction at the inlet of the test section. Mass velocity of air is controlled by mass flow controller. Flow pattern and vapor bubble expansion in the test tube are observed using the high-speed camera (Photron SA1.1). Figure 2 shows the schematic diagram of the test section. Flow direction is horizontal. Acryl blocks are used for connection and thermal insulation. T-junction is employed for mixing water and air. Total length of the test tube is 100 mm and heating length is 87 mm. Silicon paste is used to connect the test tube to acryl blocks. As shown in Fig. 2, inlet block is designed to remove sudden contraction effect when liquid flow and air bubble are introduced to the test tube. Test tube is coated by ITO, which is a transparent conductive film for Joule heating. ITO film is connected to the DC power supply. Outer wall temperatures at nine positions are measured by K-type thermocouples calibrated within ±0.2°C error. Two thermocouple probes and two pressure sensors are used to measure the temperatures and pressures at the inlet and the outlet. 2.2 Experimental procedures Experiments are conducted under various heat fluxes and mass velocities of water and air. Volume flow rates of water are Qf = 2.0 and 3.0 ml/min, which correspond to Gf = 169 and 254 kg/m2s in mass velocity. Volume flow rates of air are Qa = 0, 0.5 and 2.0 ml/min. Inlet temperature Tinlet is maintained at 80°C using temperature controller. Heat flux qʺ″ is ranged from 72 to 584 kW/m2 according to the mass velocities of water. The experimental conditions are summarized in Table 1. After inlet temperature reaches 80°C, voltage is applied on the test tube and increased to the desired value with DC power supply. After the system reaches steady state, pressure and temperature measurements and visualization are conducted. When no air is injected, i.e., Qa = 0 ml/min, the air injection channel is filled with water to remove compressibility effects during flow boiling. Inlet and outlet pressures are measured at 1 kHz frequency and pressure measurement is synchronized with the high-speed camera visualization so that relationship between pressure fluctuation and flow pattern variation can be studied. Signals of measured pressures are sent to PC through GPIB interface and recorded with LabVIEW. Image size captured by high-speed camera is 1024 × 96 pixels. Frame rate was set to 2000 fps in the present study.
6
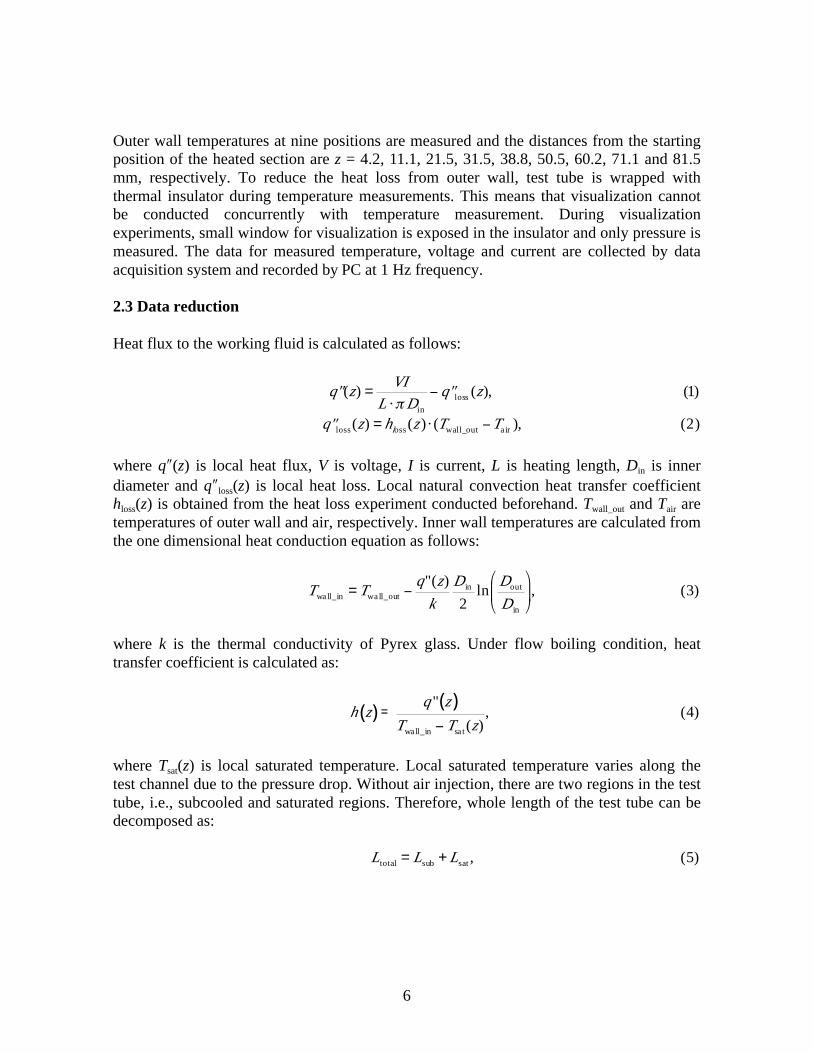
Outer wall temperatures at nine positions are measured and the distances from the starting position of the heated section are z = 4.2, 11.1, 21.5, 31.5, 38.8, 50.5, 60.2, 71.1 and 81.5 mm, respectively. To reduce the heat loss from outer wall, test tube is wrapped with thermal insulator during temperature measurements. This means that visualization cannot be conducted concurrently with temperature measurement. During visualization experiments, small window for visualization is exposed in the insulator and only pressure is measured. The data for measured temperature, voltage and current are collected by data acquisition system and recorded by PC at 1 Hz frequency. 2.3 Data reduction Heat flux to the working fluid is calculated as follows:
q"(z) =VI
L ! "Din
# q"loss (z), (1)
q"loss (z) = hloss (z ) ! (Twall_out "Ta ir ), (2) where qʺ″(z) is local heat flux, V is voltage, I is current, L is heating length, Din is inner diameter and qʺ″loss(z) is local heat loss. Local natural convection heat transfer coefficient hloss(z) is obtained from the heat loss experiment conducted beforehand. Twall_out and Tair are temperatures of outer wall and air, respectively. Inner wall temperatures are calculated from the one dimensional heat conduction equation as follows:
Twall_in = Twall_out !q"(z)
kDin
2ln Dout
Din
"
#$
%
&', (3)
where k is the thermal conductivity of Pyrex glass. Under flow boiling condition, heat transfer coefficient is calculated as:
h z( )=q " z( )
Twall_in ! Tsa t (z), (4)
where Tsat(z) is local saturated temperature. Local saturated temperature varies along the test channel due to the pressure drop. Without air injection, there are two regions in the test tube, i.e., subcooled and saturated regions. Therefore, whole length of the test tube can be decomposed as:
Ltotal = Lsub + Lsat , (5)

7
The subcooled length Lsub is calculated by iteration procedure as follows. Initially, the value of saturated temperature at z = Lsub, Tsat (Lsub) is assumed. Then, Lsub is calculated from the energy balance equation as:
Lsub =Cp !Gf !Din
4q "Tsat Lsub( )"Tinlet( ), (6)
where
!
q " is averaged heat flux in the subcooled region. The pressure loss ΔPsub can be calculated from Lsub as follows:
!Psub = f 12"U 2 Lsub
Din
, (7)
where f, ρ and U are the friction factor of the laminar Poiseuille flow, the liquid density and the bulk mean velocity, respectively. The saturation pressure at z = Lsub is then given as follows:
P Lsub( )= Pinle t !"Psub, (8) where Pinlet is the inlet pressure. Saturated temperature Tsat calculated from Eq. (8) is then compared with the initially assumed value in Eq. (6). Equations (5)-(8) are repeated until saturated temperature Tsat converges. For the saturated region, linear pressure distribution is assumed. Finally, local saturated pressure is calculated as follows:
P z( )= Pinle t ! "Psub !z ! Lsub
L ! Lsub
Pinle t ! "Psub ! Poutle t( ), (9)
Local saturated temperature is obtained from local saturated pressure, and then heat transfer coefficient is calculated using Eq. (4). Local vapor quality x(z) is obtained as follows:
x(z) =4 q"(L)dL
L su b
z!Gf "D "hfg
, (10)
where Gf is mass velocity of liquid and hfg is latent heat of liquid. In the case of air injection, flow regime is two-phase flow from the inlet and liquid film evaporation may occur even from the inlet because of low partial pressure of water. Thus, local pressure is simply assumed to decrease linearly from the inlet to the outlet. The saturated temperature wth air injection is lower than that of pure water according to partial pressure. However, vapor volume becomes much larger than air volume as evaporation

8
continues. For example, volume ratio of air to vapor becomes only 1.2 % at x = 0.1 for Qa = 2.0 ml/min and Qf = 2.0 ml/min case. Volume ratio of air is much smaller for Qa = 0.5 ml/min. Thus, partial pressure of air is neglected and local saturated temperature with air injection is assumed to be the same with that of pure water. On the calculation of local quality x(z), mass velocity G and heat capacity ρCp of air are very small compared to those of water. Thus, air property is neglected. Local quality x(z) is obtained as Eq. (10) also for the air injection case. 3. Experimental results and discussion 3.1 Single-phase experiment The present experimental setup is validated by the single-phase heat transfer and pressure drop experiments. Single phase Nusselt number is calculated as follows:
Nu =h !Din
k=
Din
kq"(z)
Twall_in "Tbulk( ), (11)
Tbulk = Tinle t +4 !!q (L)dL
0
z"Cp #Gf #D
, (12)
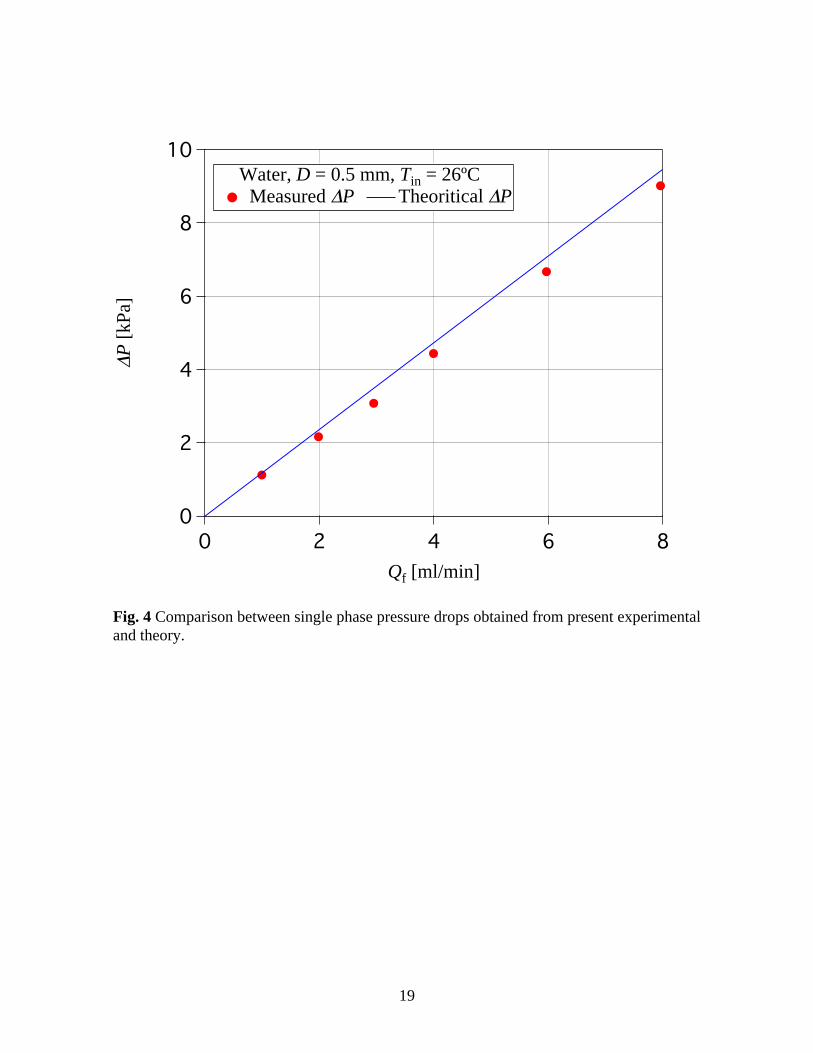
where Cp is specific heat. Figure 3 shows the comparison between Nusselt number obtained from the measured outer wall temperature and theoretical Nusselt number (Kays and Crawford, 1994). Experimental data are in good accordance with the theoretical line. Figure 4 shows the comparison between pressure drop obtained from the present experimental setup and theoretical pressure drop. The effect of sudden expansion at the end of the test tube is neglected. The distance from the inlet pressure tap to the end of the test tube is 105 mm and fully developed flow is assumed. Pressure drop of fully developed laminar flow in a circular tube is calculated theoretically as follows:
!P =128µLQf
"D 4, (12)
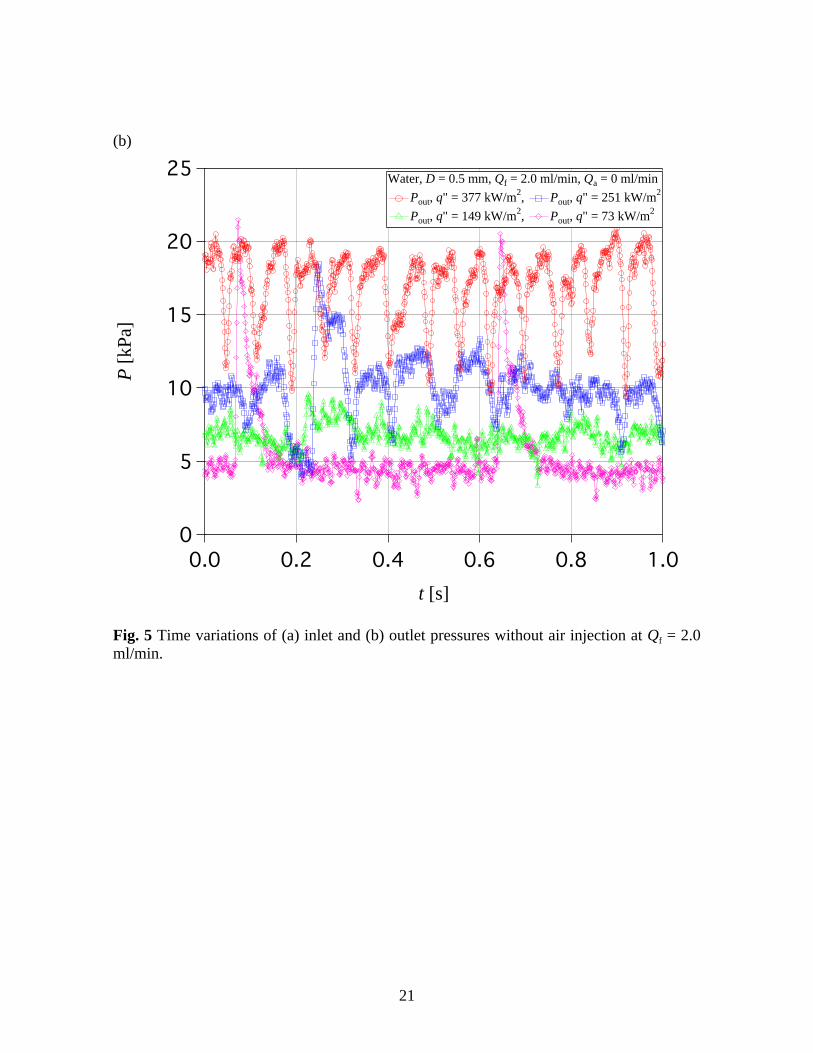
where L is tube length and Qf is liquid volume flow rate. The inlet temperature of water is 26°C. In Fig. 4, measured pressure drop shows good agreement with the theoretical value. 3.2 Pressure fluctuation without air injection Figures 5 (a) and (b) show time variations of inlet and outlet pressures without air injection at Qf = 2.0 ml/min. In Fig. 5 (a), inlet pressures show periodic fluctuations with large
9
amplitudes. Outlet pressures also show periodic fluctuations and correspond directly to the inlet pressure fluctuations. Fluctuation frequency increases with heat flux.
At qʺ″ = 73 kW/m2, inlet pressure initially remains at a low value. However, it suddenly increases and then decreases at a frequency of approximately 1.5 Hz. At the same time, outlet pressure also suddenly increases with large amplitude. Although heat flux is the smallest, the amplitude of outlet pressure fluctuation becomes the largest. At qʺ″ = 73 kW/m2, flow initially becomes superheated liquid flow and pressure drop remains quite small. As liquid flow is further superheated, vapor bubble is generated and expands explosively due to sudden energy release of superheated liquid. This explosive vapor bubble expansion results in reverse flow and blocks the liquid flow entering the test tube. Blocking of liquid flow causes increase of inlet pressure. Due to high vapor-liquid interface acceleration caused by explosive boiling, liquid film formed on the wall is quite thin (Han and Shikazono, 2010) and dryout area appears in a short time. As liquid film dries out, liquid flow is recovered and inlet pressure decreases. Thus, flow pattern in the test tube becomes an alternative flow between single-phase liquid flow and explosive annular flow.
As heat flux further increases, required superheat for vapor bubble generation is reached in shorter time and fluctuation frequency increases. At qʺ″ = 377 kW/m2, the trend of pressure fluctuation is different from that at qʺ″ = 73 kW/m2. After sudden increase, inlet and outlet pressures remain high for a certain time and then tend to decrease. This trend of pressure fluctuation can be related to the flow pattern in the test tube. At qʺ″ = 377 kW/m2, annular-slug flow becomes the main flow regime. Inlet and outlet pressures remain high unless liquid film dries out. Next vapor bubble is generated before the liquid film completely dries out and liquid film is formed again by this subsequent vapor bubble expansion. For qʺ″ = 149 kW/m2 and 251 kW/m2, two different modes of pressure fluctuations which dominated in qʺ″ = 73 and 377 kW/m2 cases appear alternatively. Each mode of pressure fluctuation corresponds to characteristic flow pattern as described above.
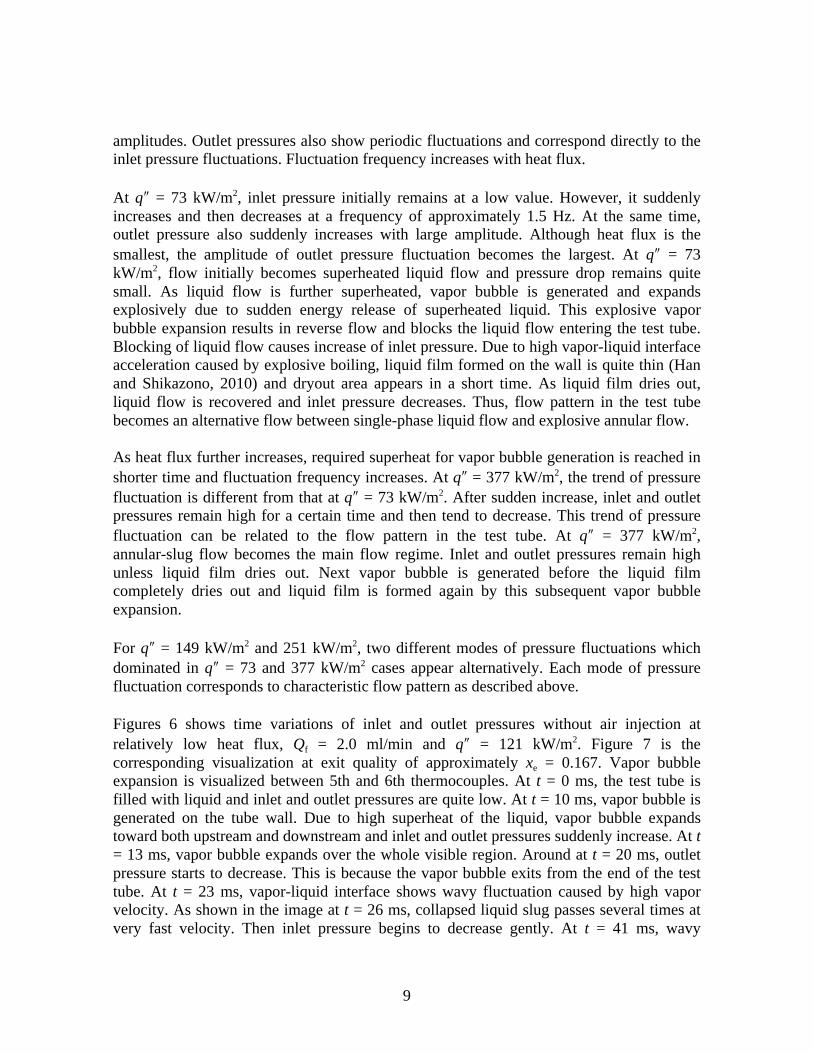
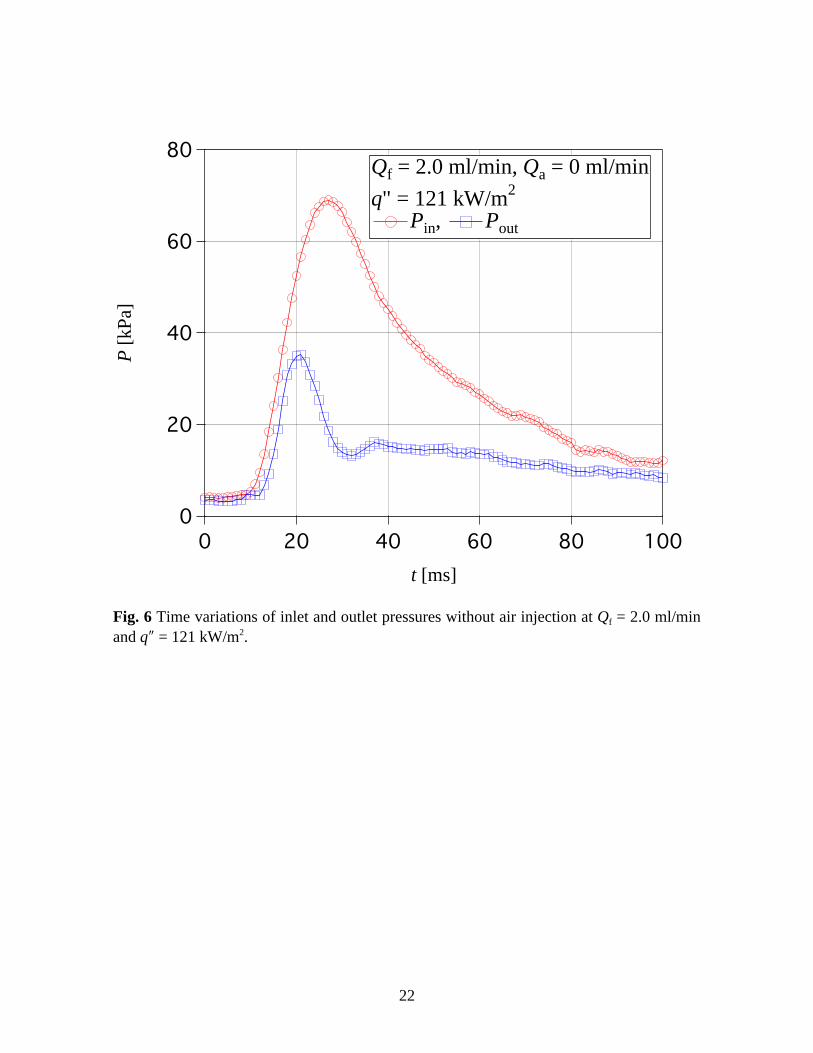
Figures 6 shows time variations of inlet and outlet pressures without air injection at relatively low heat flux, Qf = 2.0 ml/min and qʺ″ = 121 kW/m2. Figure 7 is the corresponding visualization at exit quality of approximately xe = 0.167. Vapor bubble expansion is visualized between 5th and 6th thermocouples. At t = 0 ms, the test tube is filled with liquid and inlet and outlet pressures are quite low. At t = 10 ms, vapor bubble is generated on the tube wall. Due to high superheat of the liquid, vapor bubble expands toward both upstream and downstream and inlet and outlet pressures suddenly increase. At t = 13 ms, vapor bubble expands over the whole visible region. Around at t = 20 ms, outlet pressure starts to decrease. This is because the vapor bubble exits from the end of the test tube. At t = 23 ms, vapor-liquid interface shows wavy fluctuation caused by high vapor velocity. As shown in the image at t = 26 ms, collapsed liquid slug passes several times at very fast velocity. Then inlet pressure begins to decrease gently. At t = 41 ms, wavy
10
fluctuation of the vapor-liquid interface decreases as liquid film becomes thinner. As time passes, inlet pressure decreases and liquid flow rate is recovered. As shown in the images at t = 81 and 91 ms, vapor-liquid interface moves at the liquid flow velocity and the test tube is again filled with liquid.
Figures 8 and 9 show time variations of inlet and outlet pressures and corresponding visualization images without air injection at relatively high heat flux. Vapor bubble expansion is visualized between 2nd and 3rd thermocouples. Volume flow rate of liquid is Qf = 2.0 ml/min and heat flux is 251 kW/m2. Exit vapor quality is xe = 0.394. At t = 77 ms, liquid flow is superheated in a short time because of high heat flux, and vapor bubble is generated at the point close to the former vapor bubble nucleation site. Subsequent vapor bubble is generated upstream at t = 92 ms. Vapor bubble expands explosively due to large superheat, and inlet pressure increases quickly. Liquid film is formed on the tube wall and then starts to evaporate. As dryout region is enlarged, inlet pressure decreases. At t = 140 ms, liquid flow recovered and this cycle is repeated. On the other hand, outlet pressure is almost constant. At high heat flux, flow regime at the outlet is always annular flow and bubble expansion disappears. Constant pressure is attributed to the change of flow regime.
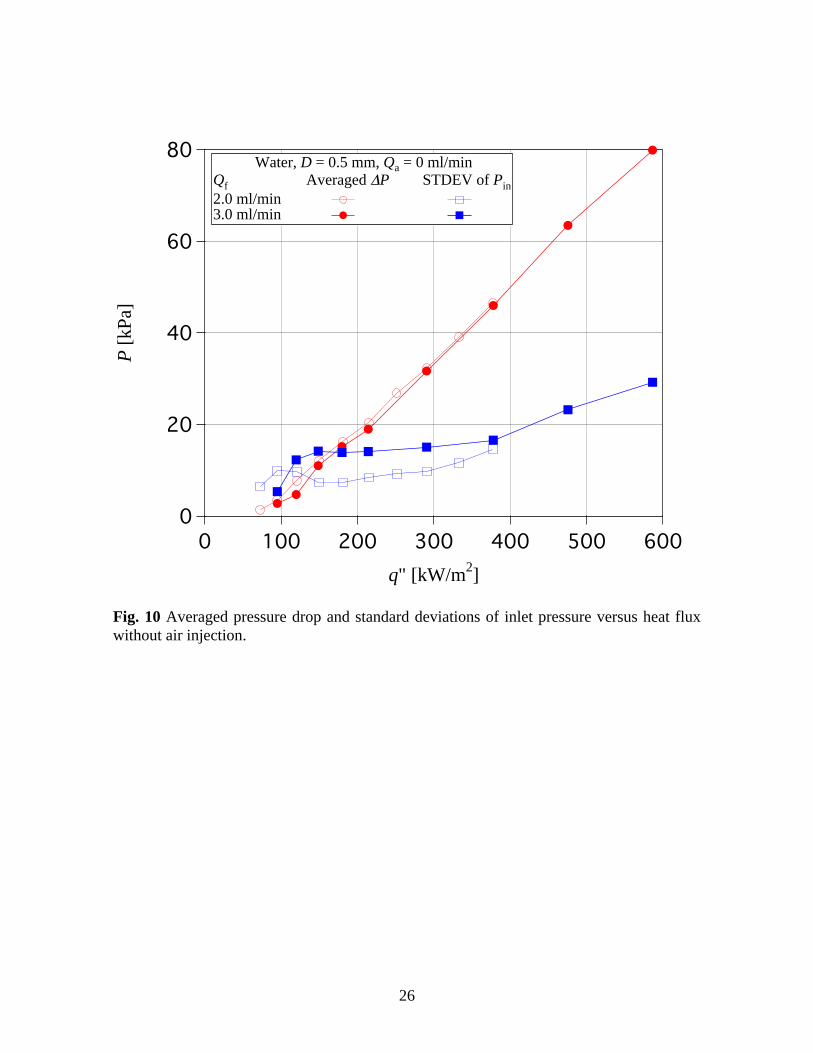
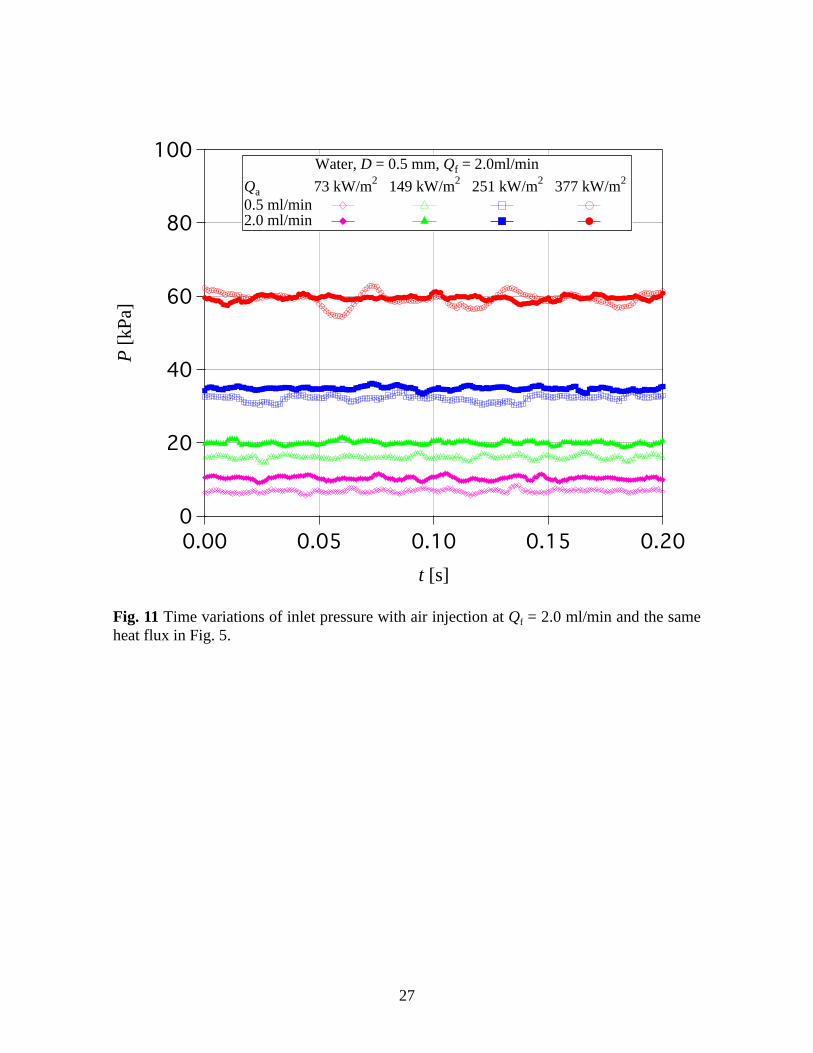
Figure 10 shows averaged pressure drop and standard deviation of inlet pressure without air injection. Averaged pressure drop linearly increases with heat flux. Interestingly, averaged pressure drop is almost identical for two different flow rates. Without air injection, reverse flow takes place and liquid film evaporates on the entire tube wall. The amount of vapor generated is identical for the same heat flux conditions regardless of mass velocities. It is considered that pressure drop of flow boiling in a micro tube is mostly dominated by vigorous vapor generation. Thus, averaged pressure drop is almost identical even for different mass velocities. Standard deviation of inlet pressure also increases with heat flux. With the same heat flux, standard deviation at volume flow rate Qf = 3.0 ml/min is larger than that at Qf = 2.0 ml/min. Superheat becomes larger at volume flow rate of Qf = 3.0 ml/min and this results in larger fluctuation. 3.3 Pressure fluctuation with air injection Figure 11 shows time variations of inlet pressure with air injection at Qf = 2.0 ml/min. Heat fluxes are the same with the experiments without air injection shown in Fig. 5. Compared with large fluctuation found in Fig. 5, inlet pressure is almost constant. Even at high heat flux qʺ″ = 377 kW/m2, inlet pressure fluctuates only slightly with air injection.
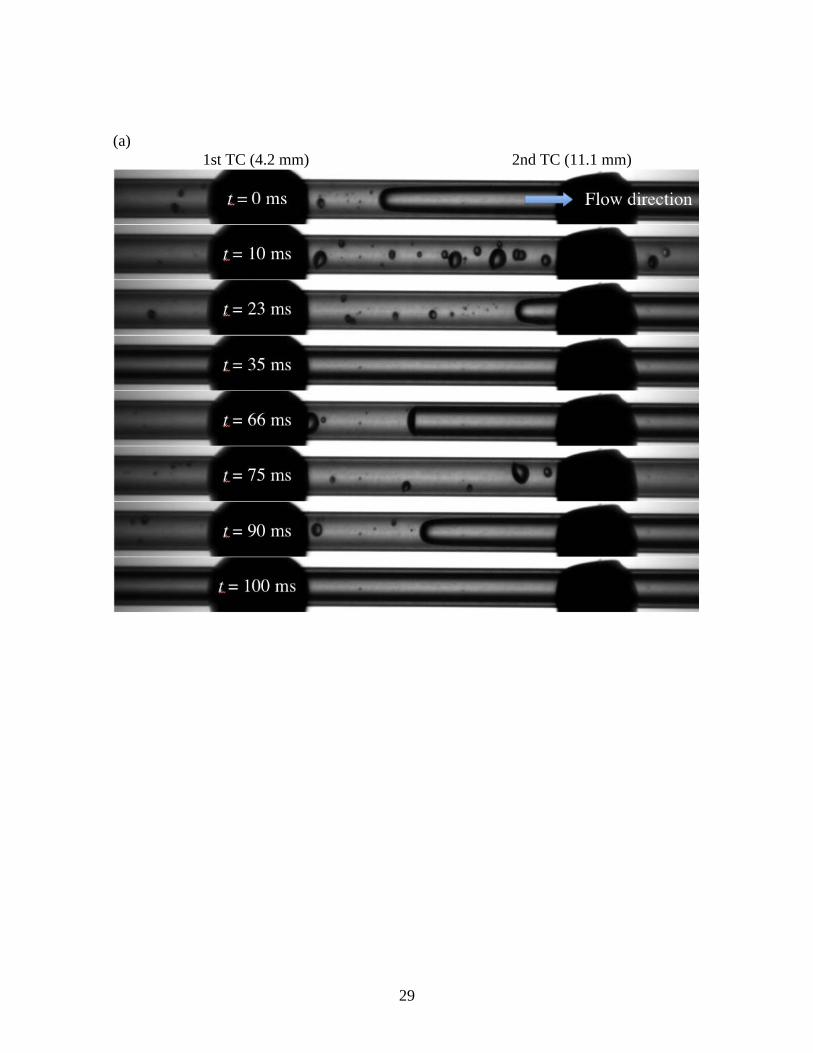
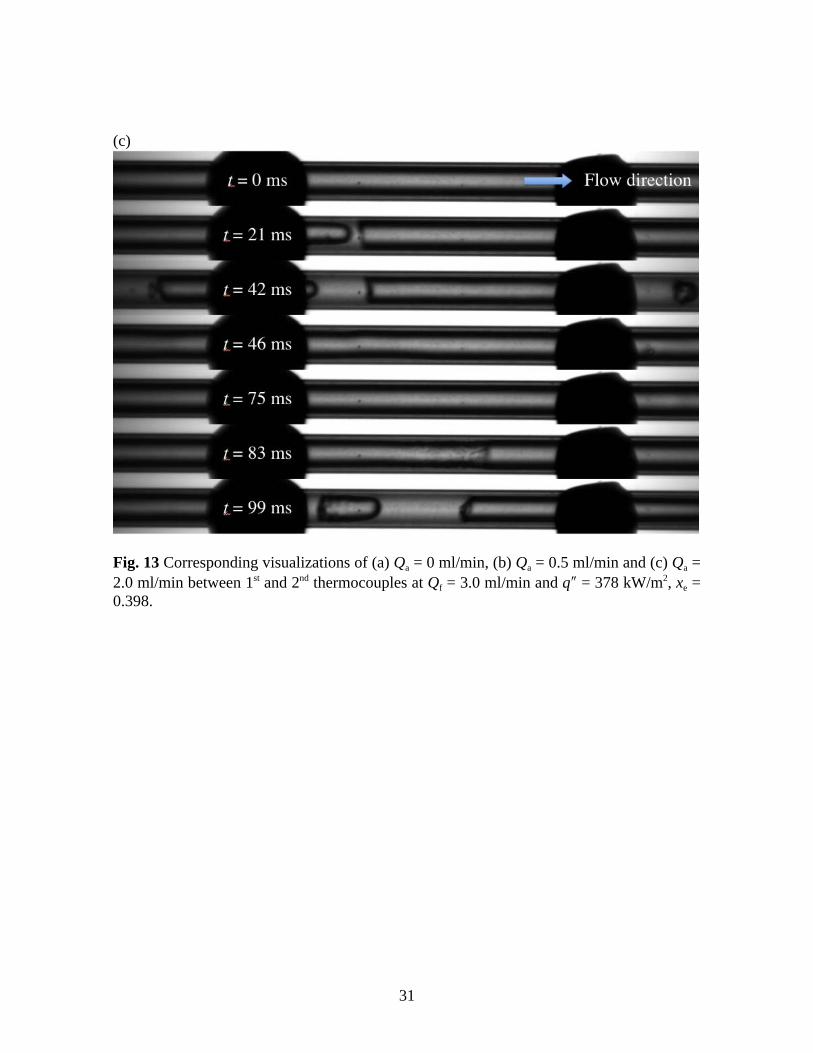
Figures 12 and 13 show time variations of inlet pressures and corresponding visualization images between 1st and 2nd thermocouples at air volume flow rates Qa = 0, 0.5 and 2.0 ml/min and liquid volume flow rate Qf = 3.0 ml/min. Heat flux and exit quality are qʺ″ = 378 kW/m2 and xe = 0.398. Fig. 13 (a) is the case without air injection, which is used as a reference case for comparing air injected cases shown in Figs. 13 (b) and (c). In Fig. 13 (a), vapor-liquid interface moves to the outlet at t = 0 ms followed by small vapor bubbles.

11
Vapor bubbles grow or shrink depending on local pressure fluctuation. One vapor bubble expands explosively at t = 23 ms and liquid film is formed on the entire tube wall. At t = 66 ms, liquid flow is recovered and vapor-liquid interface moves to the outlet. This pattern is repeated.
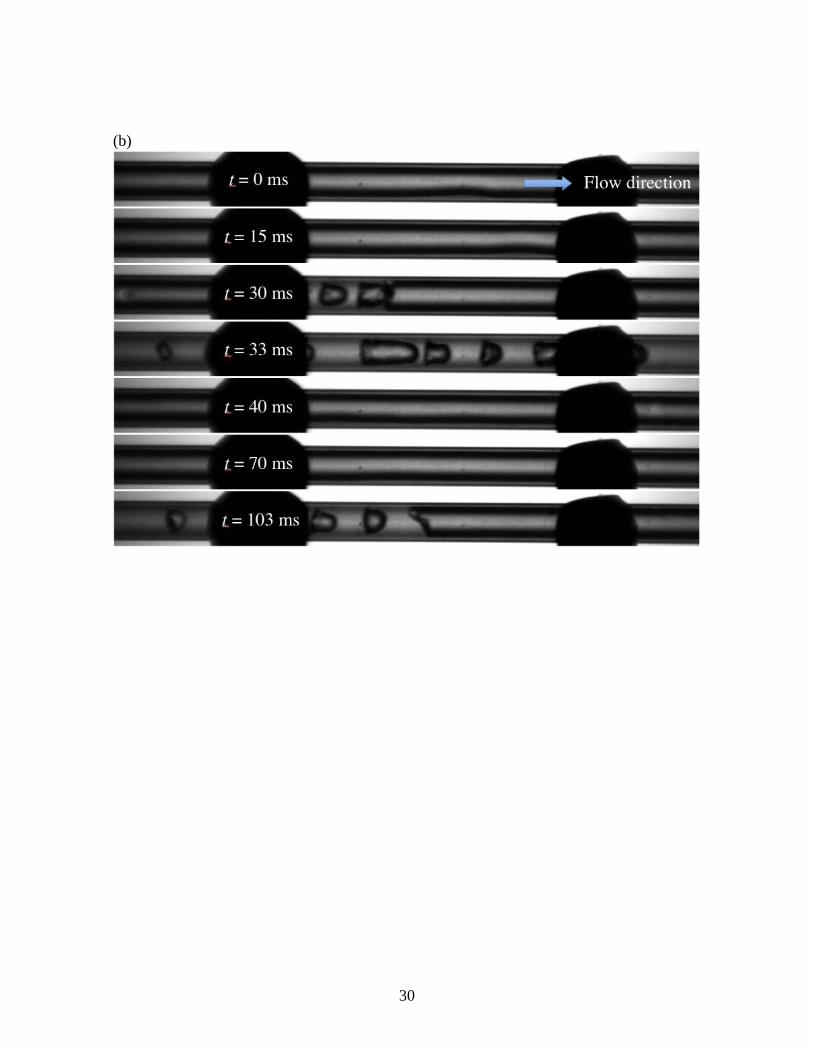
On the other hand, flow pattern becomes different with air injection. In Fig. 13 (b), liquid film evaporates on the entire tube wall at t = 0 ms and flow regime becomes annular. For several milliseconds, vapor-liquid interface does not appear and liquid film thickness decreases due to evaporation. At t = 30 ms, vapor-liquid interface appears followed by air-vapor mixed bubbles. Then, flow regime becomes slug flow. At t = 40 ms, liquid film is formed again on the entire tube wall. No severe reverse flow is observed. Since the flow is already two-phase before entering the heating section in the case of air injection, liquid film evaporation can take place under low superheat. Figure 13 (c) shows the flow pattern at air volume flow rate of Qa = 2.0 ml/min. Flow pattern is similar to that in Fig. 13 (b). Liquid slug length in Qa = 2.0 ml/min case is shorter than that in Qa = 0.5 ml/min. The alternation of flow regimes from annular flow to slug flow occurs at higher frequency.
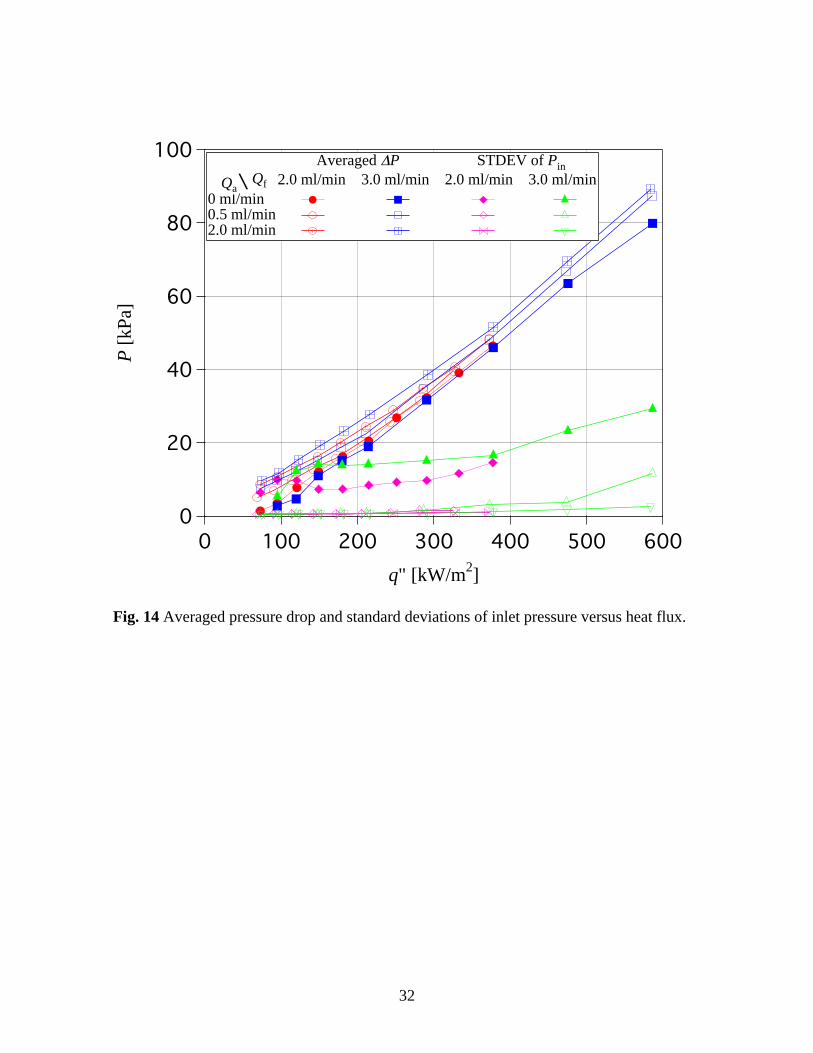
Figure 14 shows averages and standard deviations of pressure drop for different heat fluxes. Averaged pressure drops with air injection also increases linearly with heat flux and they are slightly larger than those without air injection. Averaged pressure drop of Qa = 2.0 ml/min is larger than that of Qa = 0.5 ml/min. Standard deviations of inlet pressure with air injection are much smaller than those without air injection.
At very high heat flux qʺ″ = 586 kW/m2, standard deviation of inlet pressure with air injection of Qa = 0.5 ml/min becomes larger. As shown in Fig. 10 (c), air bubble length is not long enough to make thin liquid film on the tube wall. Thus, liquid may be superheated and causes pressure fluctuation. However, in the case of Qa = 2.0 ml/min, standard deviation of inlet pressure is still low even at very high heat flux of qʺ″ = 586 kW/m2. This is due to the evaporation of liquid film under low liquid superheat at the inlet.
As described above, pressure fluctuation is reduced by air injection and stabilization of flow boiling in a micro channel is achieved. It is confirmed that air injection is an effective method for flow stabilization. More parametric studies are necessary to obtain optimal air volume flow rate for reducing pressure drop and fluctuation. 3.4 Wall temperatures and heat transfer coefficients Figure 15 shows time variation of outer wall temperatures at 9th thermocouple position. Volume flow rate of water is Qf = 3.0 ml/min. Heat fluxes are qʺ″ = 95, 181, 290 and 475 kW/m2, and exit qualities are xe = 0.069, 0.168, 0.296 and 0.516, respectively.
12
Measurement frequency of outer wall temperature is just 1 Hz. However, actual fluctuation frequency of inner wall temperatures estimated from pressure fluctuations and visualization results should be very high. Outer wall temperature fluctuation is moderated by conduction through low thermal conductivity Pyrex glass tube. Thus, outer wall temperatures in Fig. 12 cannot represent the instantaneous fluctuations of inner wall temperatures. However, it is informative to discuss qualitative trends of wall temperature fluctuations using minimum, mean and maximum values.
As shown in Fig. 15, outer wall temperatures without air injection show larger fluctuations. Without air injection, vapor bubble is not generated even at x > 0 and liquid flow is superheated. Once vapor bubble is generated, severe reverse flow occurs and then tube wall temperature decreases due to liquid film evaporation. Tube wall dries out and wall temperature increases quickly. This phenomenon is repeated and results in large temperature fluctuation.
In contrast, wall temperatures with air injection are almost constant within ± 0.5°C. Although liquid slug and air bubble lengths are different at different air volume flow rates, outer wall temperatures at Qa = 0.5 ml/min and Qa = 2.0 ml/min are almost identical. This is because liquid film evaporation occurs from the inlet and liquid flow is not superheated regardless of air flow rates. Thus, liquid superheat is considered to be an important factor which determines flow boiling pattern in a micro tube.
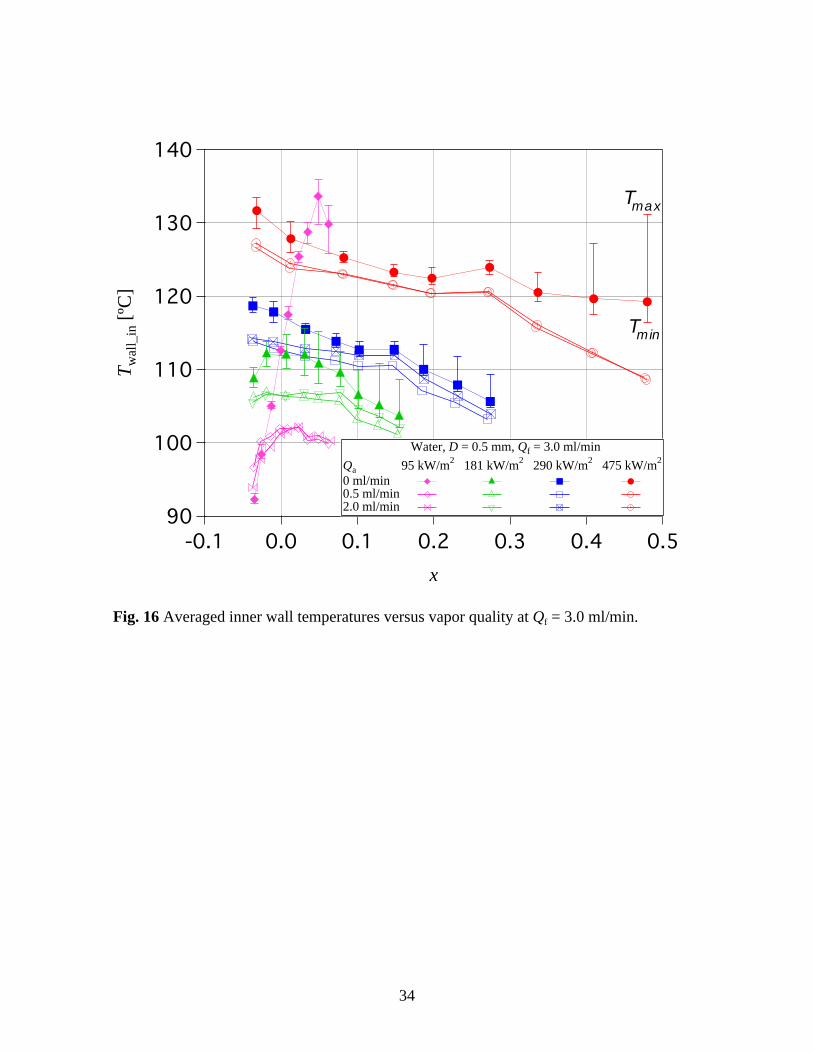
Figure 16 shows averaged inner wall temperature plotted against vapor quality at Qf = 3.0 ml/min. Solid symbols are averaged inner wall temperatures without air injection. Upper and lower bars represent maximum and minimum temperatures of the measured data. Open symbols are averaged inner wall temperatures with air injection. Temperature fluctuations with air injection are much smaller than those without air injection.
Without air injection, maximum temperature becomes larger near the outlet, while minimum temperature remains constant or shows only a slight increase. It is attributed to the dryout near the outlet. It takes longer time for rewetting as the position gets farther from the inlet. At qʺ″ = 95 kW/m2, inner wall temperatures increases to very high temperature due to liquid superheat.
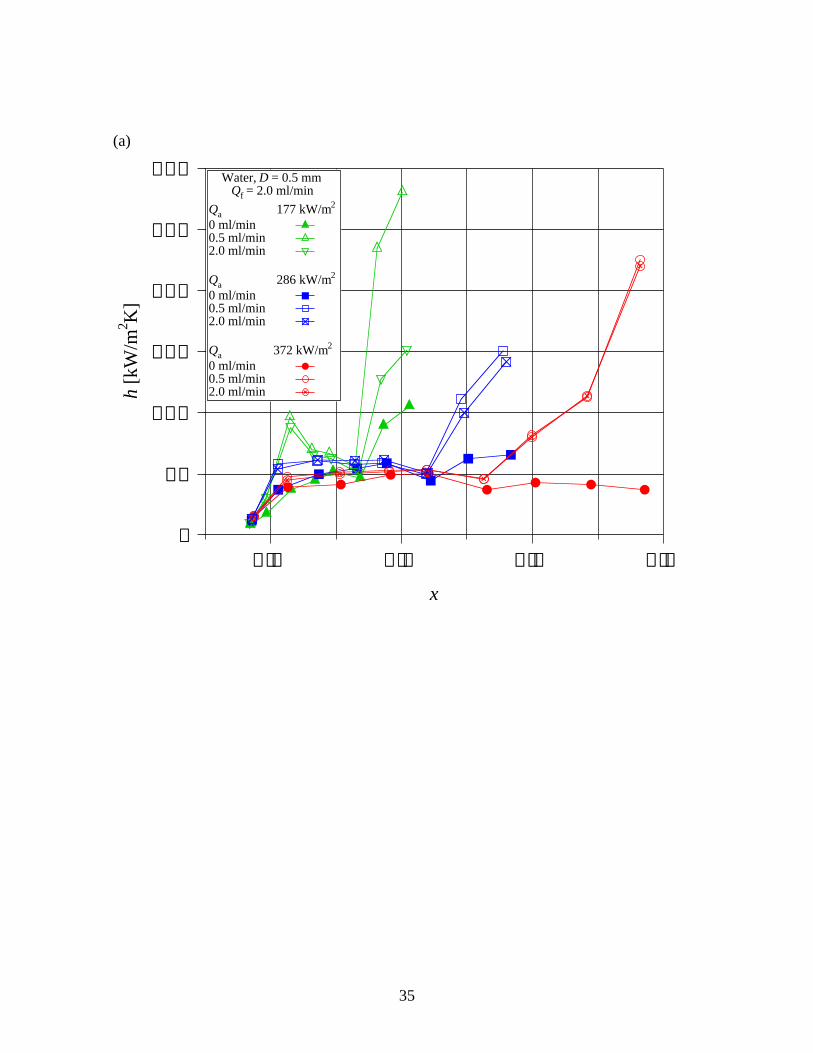
Figure 17 (a) and (b) show heat transfer coefficient versus vapor quality at Qf = 2.0 ml/min and Qf = 3.0 ml/min. Solid symbols are heat transfer coefficients without air injection. Heat transfer coefficients shows simillar trends both at Qf = 2.0 ml/min and Qf = 3.0 ml/min. In Fig. 17 (b), at qʺ″ = 181 and 290 kW/m2, heat transfer coefficients show rapid increase as vapor quality exceeds zero. Then, they remain constant and then increases drastically with vapor quality. Liquid film thickness becomes thinner due to evaporation along the flow direction and dryout is not so severe near the outlet. In contrast, heat transfer coefficient at qʺ″ = 475 kW/m2 remains nearly constant to the outlet. It is attributed to the dryout caused by very high heat flux near the outlet.

13
On the other hand, heat transfer coefficient with air injection is much higher than those without air injection at low vapor qualities. It is attributed to the liquid film evaporation of air-liquid two-phase flow. It initially remains constant or decreases slightly with the increase of quality. As vapor quality further increases, heat transfer coefficient increases drastically. Even at very high heat flux qʺ″ = 475 kW/m2 in Fig. 17 (b), heat transfer coefficient still increases with vapor quality. Without air injection, liquid flow is blocked by explosive vapor bubble expansion and it takes longer time to rewet the wall. On the other hand, liquid can be supplied to the outlet more effectively in the case of air injection. Thus, stabilization and higher heat transfer coefficient can be obtained by air injection. It is confirmed that air injection is an effective method for stabilization and enhancing heat transfer.
4. Conclusions Air injection is evaluated as a stabilization method for flow boiling in a micro tube. Flow pattern at the inlet becomes air-liquid two-phase flow with air injection. Thus, liquid film evaporation can take place even from the subcooled region. Without air injection, inlet and outlet pressures fluctuate with very large amplitude. As heat flux increases, fluctuation amplitude further increases. With air injection, inlet and outlet pressures become almost constant and stabilization can be achieved. Explosive vapor bubble expansion is avoided by the evaporation of liquid film under low superheat. Averaged pressure drop slightly increases with air injection. However, pressure fluctuation can be drastically reduced. Without air injection, wall temperature becomes quite high due to superheated liquid flow. It also fluctuates with large amplitude due to periodic dryout near the outlet. Due to air injection, liquid film evaporates stably on the entire tube wall. This results in almost constant wall temperature. Much higher heat transfer coefficient can be obtained with air injection. Acknowledgements This work is supported through Grant in Aid for Scientific Research (No. 20560179) by MEXT, Japan and GCOE Mechanical System Innovation program, The University of Tokyo, Japan. References Agostini B, Revellin R, Thome JR, Fabbri M, Michel B, Calmi D, Kloter U (2008) High heat flux flow boiling in silicon multi-microchannels – Part I: Heat transfer characteristics of refrigerant R236fa. Int. J. Heat Mass Transfer 51:5426-5442 Bao ZY, Fletcher DF and Haynes BS (2000) Flow boiling heat transfer of Freon R11 and HCFC123 in narrow passage. Int. J. Heat Mass Transfer 43:3347-3358

14
Barber J, Sefiane K, Brutin D, Tadrist L (2009) Hydrodynamics and heat transfer during flow boiling instabilities in a single microchannel. Appl. Therm. Eng. 29:1299-1308 Bergles AE and Kandlikar SG (2005) On the nature of critical heat flux in microchannels. J. Heat Transfer 127:101-107 Brutin D, Topin F, Tadrist, L (2003) Experimental study of unsteady convective boiling in heated minichannels. Int. J. Heat Mass Transfer 46: 2957-2965 Han Y, Shikazono N (2010) The effect of bubble acceleration on the liquid film thickness in micro tubes. Int. J. Heat Fluid Flow 31:630-639 Hayashi S, Kasagi N, Suzuki Y. (2007) The effect of inlet flow conditions on gas-liquid two-phase flow in a micro tube. ASME/JSME 2007 Thermal Engineering Heat Transfer Summer Conference 3:707-714 He Q, Hasegawa Y, Kasagi N (2010) Heat transfer modelling of gas-liquid slug flow without phase change in a micro tube. Int. J. Heat Fluid Flow 31:126-136 Hetsroni G, Mosyak A, Pogrebnyak E, Segal Z (2005) Explosive boiling of water in parallel micro-channels. Int. J. Multiphase Flow 31:371-392 Huh C, Kim J, Kim MH (2007) Flow pattern transition instability during flow boiling in a microchannel. Int. J. Heat Mass Transfer 50:1049-1060 Kandlikar SG (2004) Heat transfer mechanisms during flow boiling micro channels. J. Heat Transfer 126:8-16 Kandlikar SG, Kuan WK, Willistein DA, Borrelli J (2006) Stabilization of flow boiling in microchannels using pressure drop elements and fabricated nucleation sites. J. Heat Transfer 128:389-396 Kays WM, Crawford ME (1994) Convective heat and mass transfer 3rd ed., McGraw-Hill , New York Lu CT, Pan C (2008) Stabilization of flow boiling in microchannel heat sinks with a diverging cross-section design. J. Micromech. Microeng 18:075035 Thome JR, Dupont V (2007) Heat transfer assembly. European Patent EP 1779052 B1 Wang G, Cheng P (2008) An experimental study of flow boiling instability in a single microchannel. Int. Comm. Heat Mass Transfer 35:1229-1234
15
Wang G, Cheng P, Bergles AE (2008) Effects of inlet/outlet configurations on flow boiling instability in parallel microchannels. Int. J. Heat Mass Transfer 51:2267-2281 Wojtan L, Revellin R, Thome JR (2006) Investigation of saturated ciritical heat flux in a single uniformly heated microchannel. Exp. Therm. Fluid Sci. 30:765-774 Wu HY, Cheng P (2003) Visualization and measurements of periodic boiling in silicon microchannels. Int. J. Heat Mass Transfer 46:2603-2614 Xu J, Liu G, Zhang W, Li Q, Wang B (2009) Seed bubbles stabilize flow and heat transfer in parallel microchannels. Int. J. Multiphase Flow 35:773-790 Yen TH, Kasagi N, Suzuki Y (2003) Forced convective boiling heat transfer in microtubes at low mass and heat fluxes. Int. J. Multiphase Flow 29:1771-1792
16
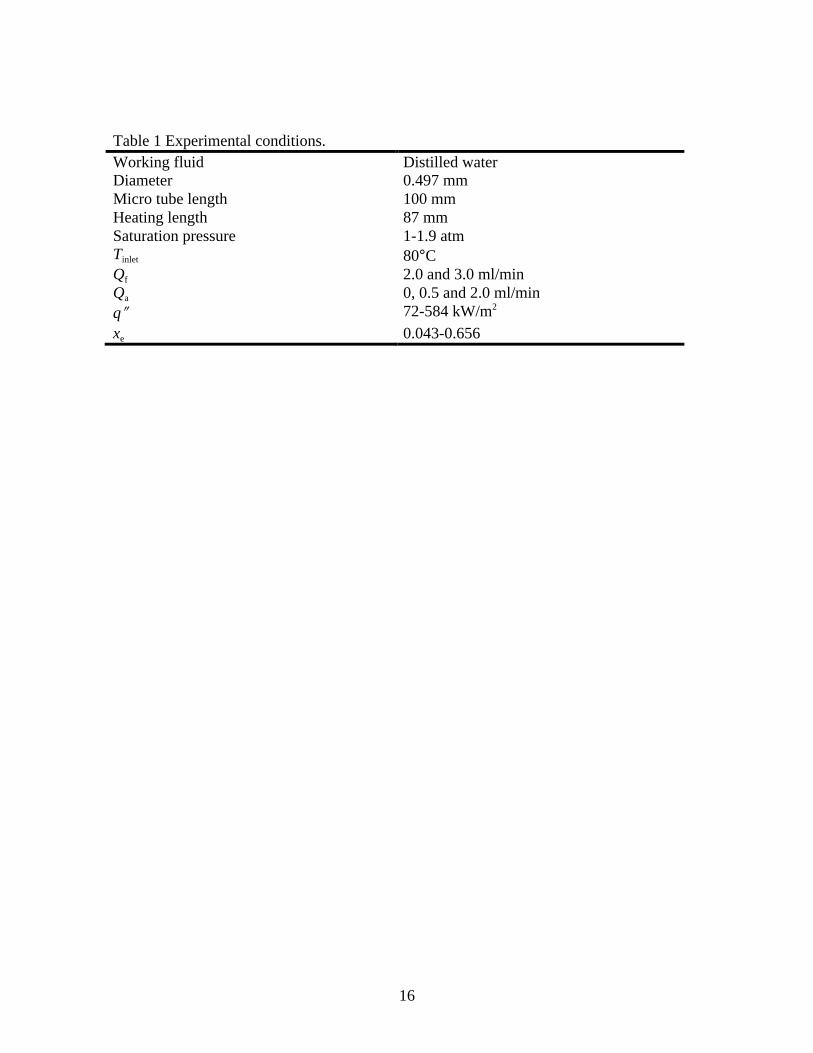
Table 1 Experimental conditions. Working fluid Distilled water Diameter 0.497 mm Micro tube length 100 mm Heating length Saturation pressure
87 mm 1-1.9 atm
Tinlet 80°C Qf 2.0 and 3.0 ml/min Qa 0, 0.5 and 2.0 ml/min qʺ″ 72-584 kW/m2 xe 0.043-0.656

17
Fig. 1 Schematic diagram of the experimental setup.
Fig. 2 Schematic diagram of the mixing geometry and the test tube.

18
Nu
x+
Water, D = 0.5 mmQf = 2 ml/min, q = 14.4 kW/m2
Qf = 2 ml/min, q = 25.3 kW/m2
Qf = 3 ml/min, q = 19.5 kW/m2
Qf = 3 ml/min, q = 32.0 kW/m2
Qf = 4 ml/min, q = 25.3 kW/m2
Qf = 4 ml/min, q = 39.5 kW/m2
Analytic Nusselt number
Fig. 3 Comparison between single phase Nusselt numbers obtained from present experimental and theory.
19
P [k
Pa]
Qf [ml/min]
Water, D = 0.5 mm, Tin = 26ºC Measured P Theoritical P
Fig. 4 Comparison between single phase pressure drops obtained from present experimental and theory.

20
(a) P
[kPa
]
t [s]
Water, D = 0.5 mm, Qf = 2.0 ml/min, Qa = 0 ml/minPin, q" = 377 kW/m2, Pin, q" = 251 kW/m2
Pin, q" = 149 kW/m2, Pin, q" = 73 kW/m2
21
(b) P
[kPa
]
t [s]
Water, D = 0.5 mm, Qf = 2.0 ml/min, Qa = 0 ml/minPout, q" = 377 kW/m2, Pout, q" = 251 kW/m2
Pout, q" = 149 kW/m2, Pout, q" = 73 kW/m2
Fig. 5 Time variations of (a) inlet and (b) outlet pressures without air injection at Qf = 2.0 ml/min.
22
P [k
Pa]
t [ms]
Qf = 2.0 ml/min, Qa = 0 ml/minq" = 121 kW/m2
Pin, Pout
Fig. 6 Time variations of inlet and outlet pressures without air injection at Qf = 2.0 ml/min and qʺ″ = 121 kW/m2.

23
5th TC (38.8 mm) 6th TC (50.5 mm)
Fig. 7 Corresponding visualization between 5th and 6th thermocouples without air injection at Qf = 2.0 ml/min and qʺ″ = 121 kW/m2, xe = 0.167.

24
P [k
Pa]
t [ms]
Qf = 2.0 ml/min, Qa = 0 ml/minq" = 251 kW/m2
Pin, Pout
Fig. 8 Time variations of inlet and outlet pressures between 2nd and 3rd thermocouples without air injection at Qf = 2.0 ml/min and qʺ″ = 251 kW/m2, xe = 0.394.

25
2nd TC (11.1 mm) 3rd TC (21.5 mm)
Fig. 9 Corresponding visualization between 2nd and 3rd thermocouples without air injection at Qf = 2.0 ml/min and qʺ″ = 251 kW/m2, xe = 0.394.
26
P [k
Pa]
q" [kW/m2]
Water, D = 0.5 mm, Qa = 0 ml/minQf Averaged P STDEV of Pin2.0 ml/min3.0 ml/min
Fig. 10 Averaged pressure drop and standard deviations of inlet pressure versus heat flux without air injection.
27
P [k
Pa]
t [s]
Water, D = 0.5 mm, Qf = 2.0ml/minQa 73 kW/m2 149 kW/m2 251 kW/m2 377 kW/m2 0.5 ml/min 2.0 ml/min
Fig. 11 Time variations of inlet pressure with air injection at Qf = 2.0 ml/min and the same heat flux in Fig. 5.

28
P [k
Pa]
t [ms]
Qf = 3.0 ml/min, q" = 378 kW/m2
Pin, Qa = 0 ml/minPin, Qa = 0.5 ml/minPin, Qa = 2.0 ml/min
Fig. 12 Time variations of inlet pressures at Qa = 0, 0.5 and 2.0 ml/min between 1st and 2nd thermocouples at Qf = 3.0 ml/min and qʺ″ = 378 kW/m2, xe = 0.398.
29
(a) 1st TC (4.2 mm) 2nd TC (11.1 mm)
30
(b)
31
(c)
Fig. 13 Corresponding visualizations of (a) Qa = 0 ml/min, (b) Qa = 0.5 ml/min and (c) Qa = 2.0 ml/min between 1st and 2nd thermocouples at Qf = 3.0 ml/min and qʺ″ = 378 kW/m2, xe = 0.398.
32
P [k
Pa]
q" [kW/m2]
Averaged P STDEV of Pin2.0 ml/min 3.0 ml/min 2.0 ml/min 3.0 ml/min
0 ml/min 0.5 ml/min 2.0 ml/min
QaQf
Fig. 14 Averaged pressure drop and standard deviations of inlet pressure versus heat flux.

33
T wal
l_ou
t [ºC
]
t [s]
Qf = 3.0 ml/min, Twall_out, 9th TC
Qa 95 kW/m2 181 kW/m2 290 kW/m2 475 kW/m2
0 ml/min 0.5 ml/min 2.0 ml/min
Fig. 15 Time variations of outer wall temperatures at 9th thermocouple position at Qf = 3.0 ml/min.
34
T wal
l_in
[ºC]
x
Water, D = 0.5 mm, Qf = 3.0 ml/minQa 95 kW/m2 181 kW/m2 290 kW/m2 475 kW/m2
0 ml/min 0.5 ml/min 2.0 ml/min
Tmax
Tmin
Fig. 16 Averaged inner wall temperatures versus vapor quality at Qf = 3.0 ml/min.
35
(a)
300
250
200
150
100
50
0
h [k
W/m
2 K]
0.60.40.20.0
x
Water, D = 0.5 mm Qf = 2.0 ml/minQa 177 kW/m2 0 ml/min 0.5 ml/min 2.0 ml/min Qa 286 kW/m2 0 ml/min 0.5 ml/min 2.0 ml/min Qa 372 kW/m2 0 ml/min 0.5 ml/min 2.0 ml/min

36
(b)
250
200
150
100
50
0
h [k
W/m
2 K]
0.50.40.30.20.10.0-0.1
x
Water, D = 0.5 mm Qf = 3.0 ml/minQa 181 kW/m2 0 ml/min 0.5 ml/min 2.0 ml/min Qa 290 kW/m2 0 ml/min 0.5 ml/min 2.0 ml/min
Water, D = 0.5 mm Qf = 3.0 ml/minQa 475 kW/m2 0 ml/min 0.5 ml/min 2.0 ml/min
Fig. 17 Heat transfer coefficient versus vapor quality at (a) Qf = 2.0 ml/min and (b) Qf = 3.0 ml/min.