Embed Size (px)
Citation preview
J PharmSciBioscientific Res. 2016 6(3):338-346 ISSN NO. 2271-3681
Patel S. N. et al 338
Stability Study of Gemigliptin and Simultaneous Estimation of Gemigliptin
and its Degradation Product by RP-HPLC Method
Shailesh V. Luhar1, Kajal R. Patel
2, Dr. G.K.Jani
3, Dr. Sachin B.Narkhede
2
1. R.K. University, Rajkot, India
2. Smt. B.N.B Swaminarayan Phramacy College, Salvav, Vapi –396191, Gujarat, India
3. SSR Pharmacy College, Sayli, Silvasa, Gujarat, India
ABSTRACT: To develop simple, accurate, precise, rapid and economical Stability Indicating RP-HPLC method for the Gemigliptin. In
RP- HPLC, estimation of Gemigliptin was carried out by using Shimadzu LC-2010, using Sheisdo C18 (250 * 4.6 mm,
5µm) column and with mobile phase composition of Acetonitrile : Methanol : water (40:40:20 % v/v/v), at a flow rate
of 1.0 ml/min was used. Detection was carried out at 280 nm. Retention time of Gemigliptin was found to be 2.735
min. The force degradation of Gemigliptin was carried out by using acid hydrolysis, alkaline hydrolysis, oxidative
degradation and thermal degradation.The force degradation study for Gemigliptin indicates that the drug significantly
degrade under Alkaline and oxidative conditions. All the method was found to be simple, accurate, economical, robust
and reproducible. The proposed method was successfully applied for the simultaneous estimation of Gemigliptin and
its degradation product.RP-HPLC method was found to be linear over the range of 50-300 µg/ml for Gemigliptin. The
method has been validated for linearity, accuracy and precision, LOD, LOQ and system suitability according to ICH
guideline.
KEY WORDS: Gemigliptin, RP-HPLC method, forced degradation, validation.
Article history:
Received 01 April 2016
Revised 14 April 2016
Accepted 16 April 2016
Available online 20 April 2016
Citation:
Luhar S. V., Patel K. R., Jani G. K., Narkhede
S. B. Stability Study of Gemigliptin and
Simultaneous Estimation of Gemigliptin
and its Degradation Product by RP-HPLC
Method. J Pharm SciBioscientific Res.
2016, 6(3): 338-346
*For Correspondence:
Shailesh V. Luhar
R.K. University, Rajkot, Gujarat, India.
(www.jpsbr.org)
1. INTRODUCTION [1-5]
Gemigliptin is an anti-diabetic drug in the class of DPP-4 inhibitors. It’s a
prescription medicine used along with diet and exercise to improve blood
sugar (glucose) control in adults with type 2 diabetes. IUPAC name of the
drug is (3S) 3-amino-4-(5,5-difluoro-2-oxopiperidino)[2,4-di(trifluoromethyl)-
5,6,7,8-tetrahydro[3,4-d]pyrimidin-7-yl] butan-1-one. The molecular formula
of the drug is C18H19F8N5O2. The dug is having a molecular weight
of489.36g/mol.
Gemigliptin is an oral anti hyperglycemic agent (anti diabetic drug) of the
new dipeptidyl peptidase4 (DPP4) inhibitor class of drugs. It is well known
that glucose lowering effects of DPP4 inhibitors are mainly mediated by
GLP1 and gastric inhibitory polypeptide (GIP) incretin hormones which are
inactivated by DPP4. DPP4 is a serine protease located on the cell surfaces
throughout the body. In plasma, DPP4 enzyme rapidly inactivates incretins
including GLP1 and GIP which are produced in the intestine depending on
the blood glucose level and contribute to the physiological regulation of
glucose homeostatis. Active GLP1 and GIP increase the production and
release of insulin by pancreatic beta cells.
J PharmSciBioscientific Res. 2016 6(3):338-346 ISSN NO. 2271-3681
Patel S. N. et al 339
GLP1 also reduces the secretion of glucagon by
pancreatic alpha cells, thereby resulting in a decreased
hepatic glucose production.
However these incretins are rapidly cleaved by DPP4 and
their effects last only for a few minutes. DPP4 inhibitors
block the cleavage of the gliptins and thus lead to an
increase insulin level and a reduced glucagon level in a
glucose dependent way. This results in a decrease of
fasting and postprandial glycemia, as well as HbA1c levels
The drug is administered orally. Clinical trials analysis
stated that the drug shows its action, without depending
on the dietary habits and body mass index (BMI). Stability
indicating method gives the better idea about the drug
and its degradation product it is affected to the potency
of drug. There is a need of developing a new simple
analytical method for the estimation of Gemigliptin.
Hence a simple stability indicating analytical method is
developed for the estimation of Gemigliptin and its
degradation product and the results are reported here.
2. MATERIALS AND METHOD:
2.1. RP-HPLC METHOD DEVELOPMENT [9-12]
Method development
2.1.1 Instrumentation:
To develop a High Pressure Liquid Chromatographic
method for quantitative estimation of Gemigliptin
anHPLC – [Shimadzu-LC-2010] instrument with
shisedoC18(250mm x 4.6mm, 5 μm) column was used.
The instrument is equipped pump with autosampler and
a detector running on Peak LC Solution Software.The
mobile phase consists of Methanol: Acetonitrile: Water in
40:40:20 (v/v) with pH 3and the flow rate was
maintained at 1.0 ml/min. The mobile phase was freshly
prepared and passed through nylon membrane filter of
pore size of 0.45µm and it was degassed by sonicating for
5 min before it was used. The elution was monitored at
wavelength of 280 nm with UV detector and the injection
volume was 10µl.
2.1.2 Chemicals and Solvents:
The pure drug form ofGemigliptin is collected from
Manus Akkteva Biopharma LLP, Ellisbridge, Ahmedabad-
380006; Gujarat, India.Impurities would be synthesized in
house by forced degradation at various conditions.
Methanol, acetonitrile, orthophosphoric acid, water
(HPLC grade) were purchased from S D fine-CHEM
Limited, Mumbai and Sodium hydroxide, hydrochloric
acid and hydrogen peroxide also purchased from S D
fine-CHEM Limited, Mumbai, and Trifluoro acetic acid
purchased from – SIGMA-ALDRICH CHEMIE GmbH,
Germany.
2.1.3 Determination of maximum absorbance
Standard solution of Gemigliptin (100 μg/ml) were
scanned between 200-400 nm using UV-visible
spectrophotometer. Wavelength was selected from the
overlap spectra of standard solutions.
2.1.4 Preparation of stock and standard solution:
100mg of the standard drug was weighed accurately and
was dissolved in 100ml of solvent. The stock solution of
concentration 1000µg/ml was obtained. The solution was
filtered through 0.45micron meter nylon membrane filter
paper. Working standard solution of Gemigliptin was
prepared by making various dilutions of the drug solution
from the stock solution. six sets of the drug solution were
prepared in the mobile phase containing Gemigliptin at a
concentration of 50-300µg/ml. Each of this drug solution
(10µl) was injected into the column and the peak area
and retention time was recorded.
2.1.5 Assay of Gemigliptin tablets (in house prepared
tablets):
Ten tablets of Gemiligliptin were weighed and average
weight of a single tablet was calculated. Tablets were
crushed and mixed using a mortar and pestle. Then drug
sample equivalent to 25 mg of Gemigliptin is accurately
weighed and transferred into a 25 ml volumetric flask
and mixed with known amount of methanol and the
active pharmaceutical ingredients were extracted into
the methanol by vortex mixing followed by
ultrasonication and then filtered through a nylon
membrane of pore size 0.45µm. The drug sample was
diluted by adding methanol to obtain a stock solution of
100µg/ml
METHOD VALIDATION [6]
The method was validated according to International
Conference on Harmonization guidelines for validation of
analyticalprocedure.The Proposed method was validated
according to ICH guidelines. The parameters assessed
were linearity, precision, accuracy, stability, LOD and
LOQ.
J PharmSciBioscientific Res. 2016 6(3):338-346 ISSN NO. 2271-3681
Patel S. N. et al 340
2.1.6 Linearity:
Linearity of the proposed method was evaluated
according to the ICH guidelines by the analysis of working
solutions of Gemiligliptin at different concentrations
ranging from 50-300 µg/ml. The linearity of an analytical
procedure is the ability to obtain test results that are
directly proportional to the concentration (amount) of an
analyte in the sample within a given range. Linearity was
evaluated by linear-regression analysis. Corresponding
peak area values of different concentrations were
determined and graph was plotted between
concentration on x-axis and peak area values on y-axis.
2.1.7 Precision:
The precision of the analytical method expresses the
closeness of agreement between a series of
measurements obtained from multiple sampling of the
same homogeneous sample under the prescribed
conditions. The precision is usually expressed in variance,
standard deviation or coefficient of variance of a series of
measurements.
2.1.8 Recovery:
The accuracy of method was determined by recovery, by
spiking of standard drug solution to pre analyzed sample
at three different levels i.e., at 80, 100, and 120%. The
resultant solutions were then re-analyzed by the
developed method. At each concentration, sample was
injected thrice to check repeatability and from the data it
was analyzed that the method was accurate.
2.1.9 Robustness:
Robustness is the measure of analytical method to
remain unaffected by small, deliberate variations in the
method parameters. It provides its reliability during
normal usage.
2.1.10 Limit of detection:
Limit of detection of the individual analytical method is
the lowest concentration of analyte in the sample that
the method can detect but not necessarily quantify
under stated experimental conditions. LOD not only
depend on procedure of analysis but also on type of
instrument.LOD is calculated using the formulae,
LOD=S/N,Where Average Baseline Noise obtained from
Blank was named as (S), Signal Obtained from LOD
solution (0.25% of target assay concentration) was
named (N).
2.1.11 Limit of Quantification:
Limit of quantification of the individual analytical method
is the lowest concentration of analyte in the sample,
which can be quantitatively determined with suitable
precision and accuracy under stated experimental
conditions. The quantification limit is used particularly for
the determination of impurities and degraded products.
LOQ is calculated by the formula , LOQ= S/N,where S
was Average Baseline Noise obtained from Blank, N was
Signal Obtained from LOD solution (0.75% of target assay
concentration).
2.2 FORCE DEGRADATION STUDY [7, 8]
Stresstesting of the drug substance can help identify
thelikely degradation products, which can in turn helpto
establish the degradation pathways and theintrinsic
stability of the molecule and to developand validate the
stability indicating method. Stress studies were
performedon API solutions. Considering good solubility of
Gemigliptin, all stress study solutions were preparedin
methanol.Samples were withdrawn from stress study
sample
2.2.1 Preparation of standard stock solution of
Gemigliptin
Accurately weighed 10 mg of standard Gemigliptin was
transferred to 10 ml volumetric flask, dissolved in 5 ml
methanol and diluted up to the mark with same solvent
to get stock solution having strength 1000 μg/ml.
2.2.2 Preparation of working standard solution of
Gemigliptin
Working standard solution (50 μg/ml) was prepared by
diluting of 0.5 ml of stock solution of Gemigliptin to 10 ml
with methanol.
2.2.3 Preparation of 0.1m sodium hydroxide solution
(0.1M NaOH)
Sodium hydroxide (0.4 gm) was transferred to a 100 ml
volumetric flask, dissolved in and diluted up to mark with
water.
J PharmSciBioscientific Res. 2016 6(3):338-346 ISSN NO. 2271-3681
Patel S. N. et al 341
2.2.4 Preparation of 0.1M hydrochloric acid solution
(1M HCL)
Hydrochloric acid (0.85 ml) was transferred to a 100 ml
volumetric flask and diluted up to mark with water.
2.2.5 Preparation of solutions for forced degradation
Forced degradation of Gemigliptin was carried out under
acidic, alkaline, oxidative and Thermal conditions.
2.2.6 Acid degradation:
Accurately weighed 10 mg of Gemigliptin was transferred
to a 10 ml volumetric flask, dissolved in and diluted to
mark with methanol. To 1 ml aliquot of the solution, 2 ml
of 0.1M HCl was added. The solution was heated for 1 hr
at 60⁰C and transferred to a 10 ml volumetric flask,
cooled, neutralized by 0.1M NaOH and diluted up to
mark with methanol to get final concentration 100
µg/ml.
2.2.7 Alkali degradation:
Accurately weighed 10 mg of Gemigliptin was transferred
to a 10 ml volumetric flask, dissolved in and diluted to
mark with methanol. To 1 ml aliquot of the solution, 2 ml
of 0.1M NaOH was added. The solution was heated for 1
hr at 60⁰C and transferred to a 10 ml volumetric flask,
cooled, neutralized by 0.1M HCl and diluted up to mark
with methanol to get final concentration 100 µg/ml.
2.2.8 Oxidation:
Accurately weighed 10 mg of Gemigliptin was transferred
to a 10 ml volumetric flask, dissolved in and diluted to
mark with methanol. To 1 ml aliquot of the solution, 2 ml
3 % H2O2 was added. The solution was heated for 4 hours
at room temperature and transferred to a 10 ml
volumetric flask, cooled diluted up to mark with
methanol to get final concentration 100 µg/ml.
2.2.9 Thermal degradation:
Accurately weighed 10 mg of Gemigliptin was transferred
to a 10 ml volumetric flask, dissolved in and diluted to
mark with methanol. To 1 ml aliquot of the solution
heated for 2 hours at 80⁰C and transferred to a 10 ml
volumetric flask, cooled diluted up to mark with
methanol to get final concentration 100 µg/ml.
3. RESULT AND DISCUSSION
3.1 RP-HPLC METHOD DEVELOPMENT AND VALIDATION
OF GEMIGLIPTIN IN BULK FORM.
1.1.1 Selection of Wavelength
The standard solution of Gemigliptin (50 μg/ml) was
scanned in the range of 200-400 nm against methanol as
blank in UV-Visible Spectrophotometer. The UV spectrum
of Gemigliptin was recorded at 280 nm
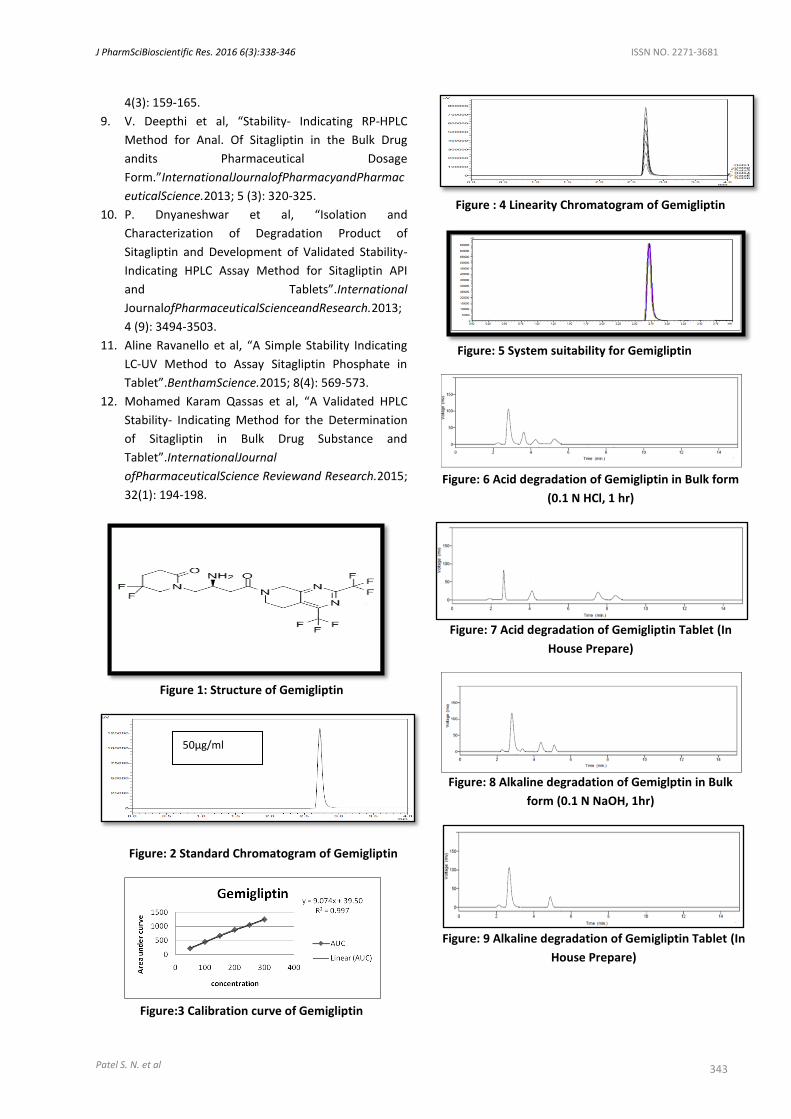
3.1.2 Linearity
The calibration curve showed (Fig.3) good linearity in the
range of 50-300μg/ml, for Gemigliptin with correlation
coefficient (r2) of 0.997. A typical calibration curve has
the regression equation of y = 9.074x + 39.50. Results are
given in Table 4.
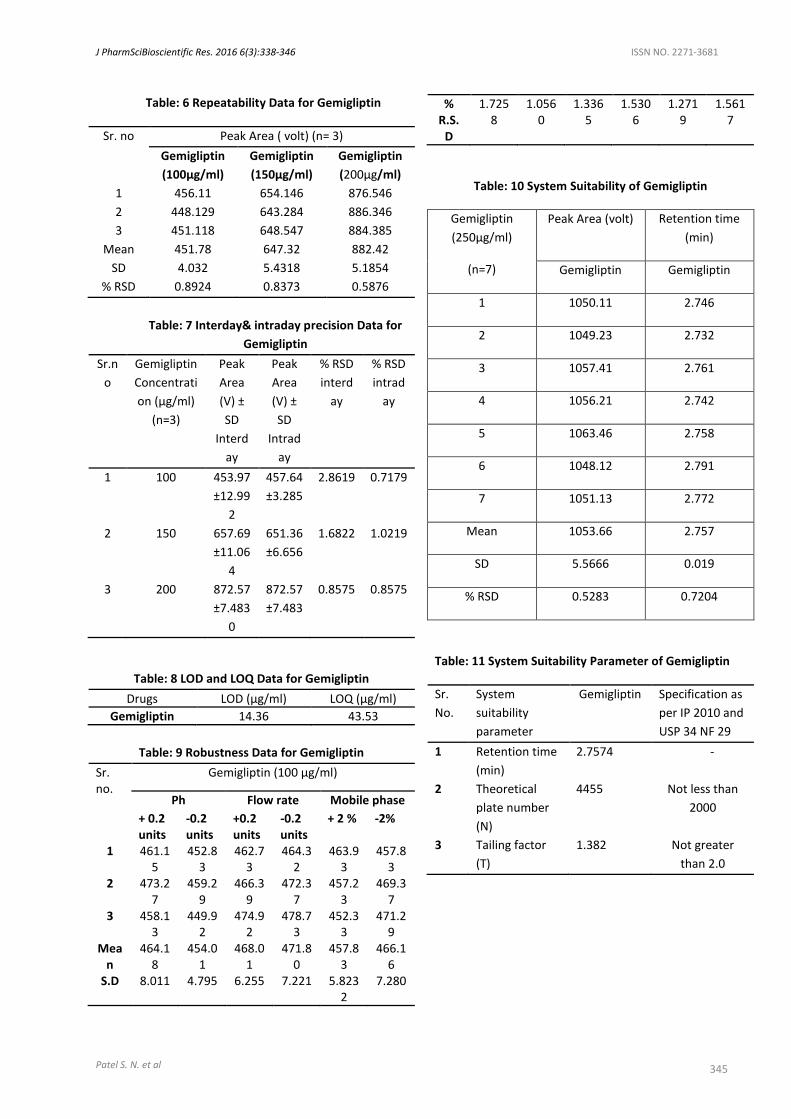
3.1.3 Precision
Intraday precision was carried out using test samples
prepared and analyzed on the same day. Interday
precision was assessed by analysis of the same solutions
on consecutive days. The low % RSD values below 2
indicate that the method is precise. Repeatabilty also
performed. The results are given in table 6 & 7.
3.1.4 Recovery
At each concentration, sample was injected thrice to
check repeatability and from the RSD values it was
analyzed that the method was accurate as % recovery
values found to be in the range of 99.71% to 100.8 % at
three different concentration, the result are given in
table 5.
3.1.5 Robustness
Small deliberate changes in chromatographic conditions
such as change in mobile phase ratio (+ 2 %), change in
pH (±2 units) and flow rate (± 2 units) were studied to
determine the robustness of the method. The results
were in favor of (% RSD< 2%) the developed RP-HPLC
method for the analysis of Gemigliptin. The results are
given in table 9.
3.1.6 Limit of Detection (LOD) and Limit of
Quantification (LOQ)
The LOD of was found to be 14.36 µg/ml and the LOQ
43.53 µg/ml estimated by using the standard formulas.
The low values of LOD and LOQ illustrate that the
developed method was sensitive, accurate and precise as
J PharmSciBioscientific Res. 2016 6(3):338-346 ISSN NO. 2271-3681
Patel S. N. et al 342
it can detected and quantify with very low concentration.
The results are given in table 8.
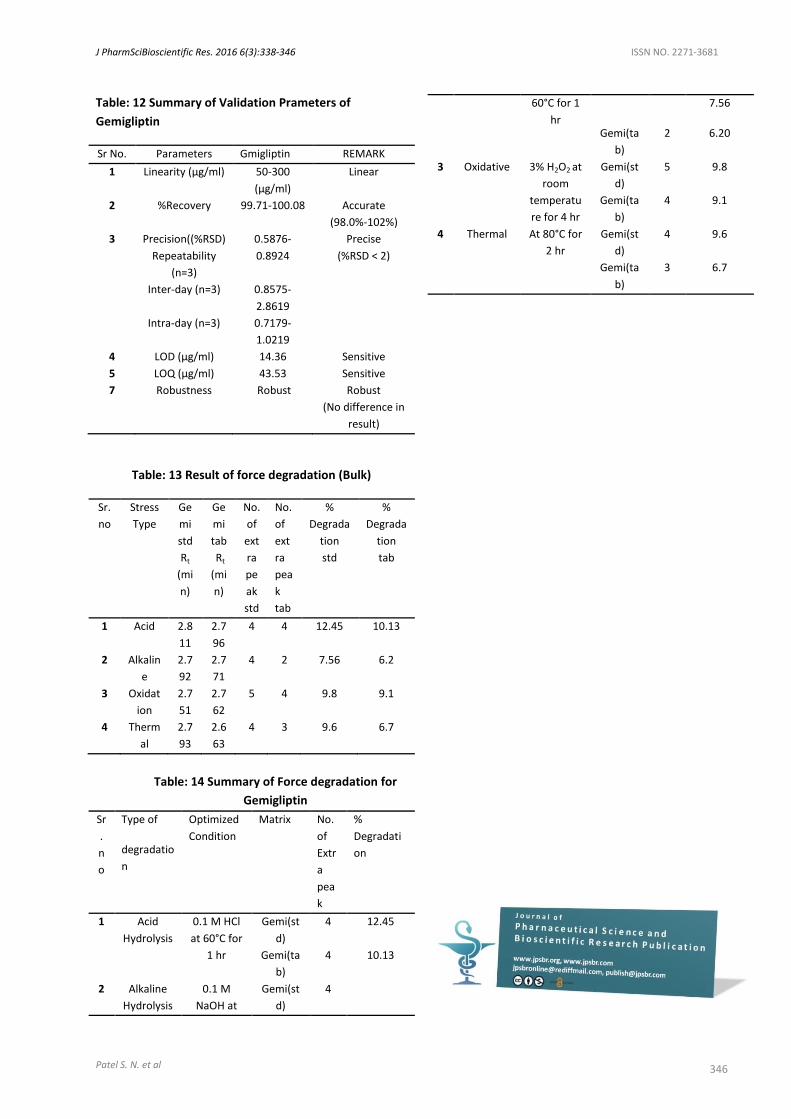
3.2. FORCE DEGRADATION STUDIES
RP-HPLC study of samples obtained on stress testing of
Gemigliptin under different conditions using mixture of
methanol, acetonitrile and water in the ratio 40:40:20
(v/v) with pH 3.0 as a mobile solvent system suggested
the following degradation behavior.
The chromatograms obtained on stress degradation,
like Acid degradation and similarly other conditions
were shown in figure.6-13.
3.3. DISCUSSION
A simple, accurate and precise RP-HPLC method for
the Gemigliptin in Bulk form has been developed
and validated.
Separation of drugs was carried out using methanol:
acetonitrile: water (pH-3.0) (%V/V) (40: 40: 20 :)
mobile phases at 5 min. run time and 280 nm. The
Rtvalue for Gemigliptin were found to be 2.735 min.
The %RSD values for intra-day precision study were
≤ 2.0% and inter-day study were ≥ 2.0%, confirming
that the method was sufficiently precise The %RSD
values of Robustness study were ≤ 2.0%, confirming
that the proposed method was found to be robust
enough to withstand such deliberate changes and
allow routine analysis of the sample
The Forced degradation was carried out in various
stress condition like acid, alkali, oxidative and
thermal. Maximum degradation in Gemigliptin was
observed in a Acidic condition i.e. 12.45% in
standard and 10.13% in Acid condition in Tablet.
The peak of degraded component were in resolved
from the peak of main component and do not
interfere with the API peak.
4. CONCLUSION
A simple, rapid, accurate and precise RP-HPLC
method was developed and validated for estimation
of Gemigliptin in Bulk form.
For RP-HPLC method linearity range was found in
range of 50-300 μg/ml for Gemigliptin, Limit of
detection and Limit of Quantification was found to
be 14.36 μg/mL and 43.53 μg/mL respectively.
% RSD for intraday ≤ 2 and interday precision was
found to be ≥ 2.
% Recovery greater than 98 but less than 102 for
this method shows that the method is accurate
and free from the interference of excipients used in
formulation.
So, the developed method can be used for routine
analysis and quality control test for Gemigliptin
The stability-indicating method resolved the drug
peak and also the peaks of degradation products
formed under variety of conditions.
After exposure of Gemigliptin to stress conditions, it
was concluded that the drug is susceptible to Acid,
Alkaline hydrolysis, oxidation degradation, and
Thermal degradation.
Therefore this method can be employed for
monitoring the stability of Gemigliptin and can be
used for the routine analysis of the drug in pure and
tablet dosage forms.
The maximum degradation of Gemigliptin was
observed in Acidicdegradation i.e.12.45 % for
standard and 10.13 % for Tablet formulation.
RP-HPLC method was able to estimate Gemigliptin
accurately in presence of its degradation products.
The method was validated as per ICH guidelines.
5 REFERENCES
1. Tripathi. KD. “Essential of Medical Pharmacology”.
6th
Edition; New Delhi, Jaypee Brothers Medical
Publishers; 539-54.
2. Ravisankar. P. et al,“A Review on Analytical Method
Development”. Indian Journal Of Research In
Pharmacy and Bio Technology.2014; 2(3): 1183-
1186.
3. Skoog Da et al,“Fundamental of Analytical
Chmistry”. Homson Rooks/ Cole Publication, 8th
Editin; 2005; 973-979.
4. Swarbric james et al,“Encyclopediaof Pharm.
Technology”. Vol-1:423-426.
5. Gemigliptin:Http://Pubchem.Ncbi.Nlm.Nih.Gov/Ge
migliptin
6. ICH Harmonized Tripartite Guideline. Validation of
Analytical Procedures: Text and Methodology Q2
(R1), International Conference on Harmonization,
Geneva: Switzerland; 2005.
7. ICH Harmonised Tripartite Guideline. Stability
Testing Of New Drug Substances And Products Q1a
(R2). International Conference on Harmonisation.
Geneva: Switzerland; 2003; 1-24.
8. M. Blessy et al, “Development of Forced
Degradation and Stability Indicating Studies of
Drugs”.Journal of PharmaceuticalAnalysis. 2014;
J PharmSciBioscientific Res. 2016 6(3):338-346 ISSN NO. 2271-3681
Patel S. N. et al 343
4(3): 159-165.
9. V. Deepthi et al, “Stability- Indicating RP-HPLC
Method for Anal. Of Sitagliptin in the Bulk Drug
andits Pharmaceutical Dosage
Form.”InternationalJournalofPharmacyandPharmac
euticalScience.2013; 5 (3): 320-325.
10. P. Dnyaneshwar et al, “Isolation and
Characterization of Degradation Product of
Sitagliptin and Development of Validated Stability-
Indicating HPLC Assay Method for Sitagliptin API
and Tablets”.International
JournalofPharmaceuticalScienceandResearch.2013;
4 (9): 3494-3503.
11. Aline Ravanello et al, “A Simple Stability Indicating
LC-UV Method to Assay Sitagliptin Phosphate in
Tablet”.BenthamScience.2015; 8(4): 569-573.
12. Mohamed Karam Qassas et al, “A Validated HPLC
Stability- Indicating Method for the Determination
of Sitagliptin in Bulk Drug Substance and
Tablet”.InternationalJournal
ofPharmaceuticalScience Reviewand Research.2015;
32(1): 194-198.
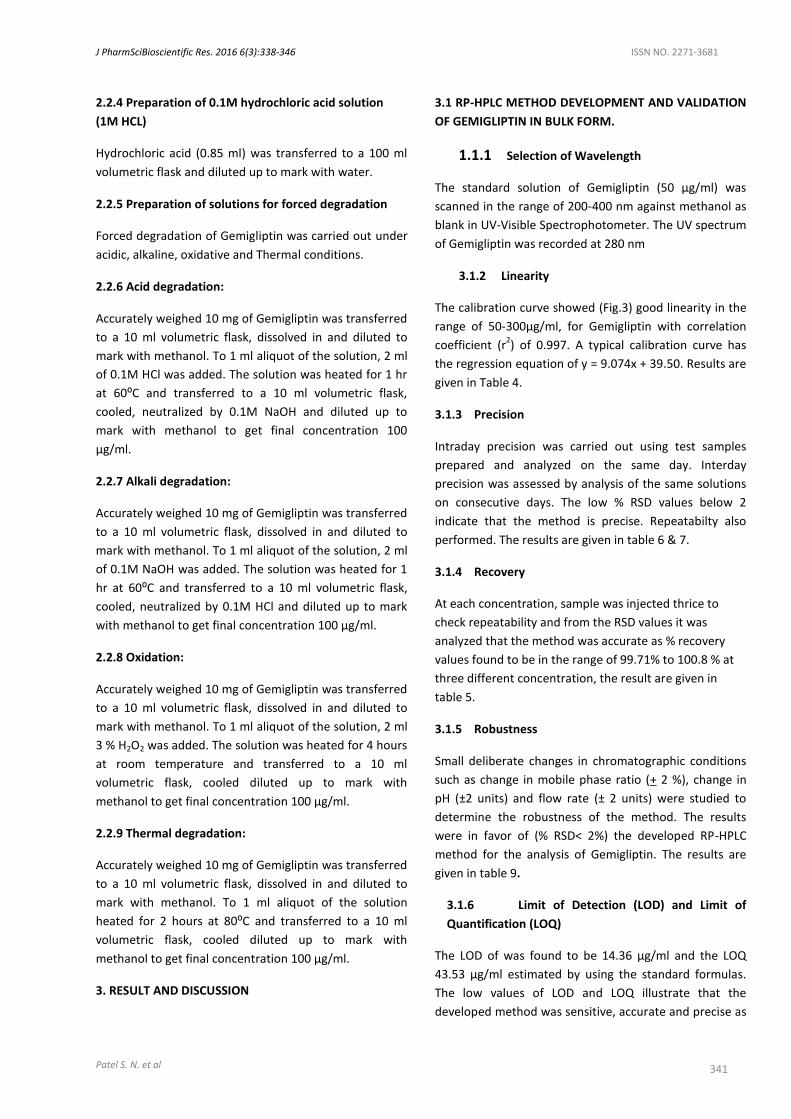
Figure 1: Structure of Gemigliptin
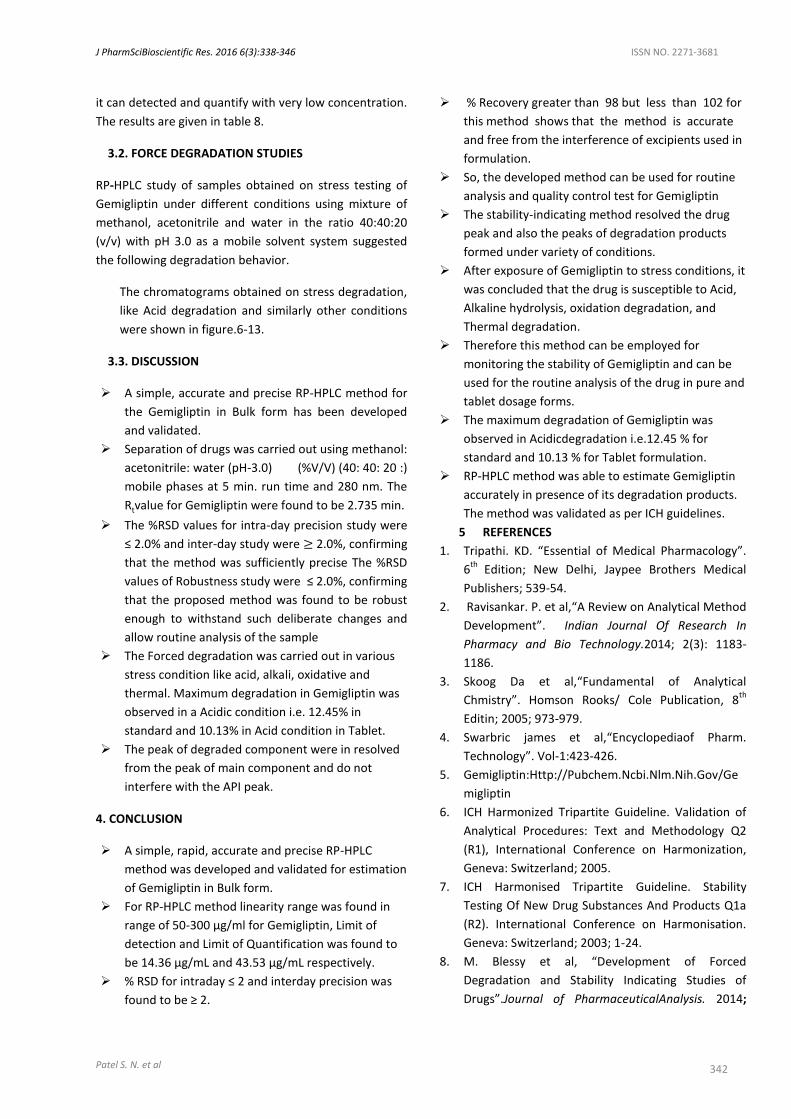
Figure: 2 Standard Chromatogram of Gemigliptin
Figure:3 Calibration curve of Gemigliptin
Figure : 4 Linearity Chromatogram of Gemigliptin
Figure: 5 System suitability for Gemigliptin
Figure: 6 Acid degradation of Gemigliptin in Bulk form
(0.1 N HCl, 1 hr)
Figure: 7 Acid degradation of Gemigliptin Tablet (In
House Prepare)
Figure: 8 Alkaline degradation of Gemiglptin in Bulk
form (0.1 N NaOH, 1hr)
Figure: 9 Alkaline degradation of Gemigliptin Tablet (In
House Prepare)
50µg/ml
J PharmSciBioscientific Res. 2016 6(3):338-346 ISSN NO. 2271-3681
Patel S. N. et al 344
Figure: 10Oxidative Degradation of Gemigliptin in Bulk
form Oxidative (3%H2O2, 4hr)
Figure: 11 Oxidative degradation of Gemigliptin Tablet
(In House Prepare)
Figure: 12 Thermal degradation of Gemigliptin in Bulk
form
Figure: 13 Thermal degradation of Gemigliptin Tablet (In
House Prepare)
Table: 1 Chromatograpic condition for
Gemigliptin
Parameters Specifications
Column Shisedo C18 (250mm * 4.6mm, 5 µm)
Mobile phase Acetonitrile : Methanol : Water (pH-3.0) (40:40:20 %V/V/V)
Flow rate 1 ml/min Run time 5 min Detection
wavelength 280 nm
Retention time
2.735 min for Gemigliptin
Table: 2 Calibration Data of Gemigliptin
Conc. (μg/ml) Area±SD
50 218.92±1.919 100 455.82±4.422 150 650.43±6.464 200 874.22±5.850 250 1048.78±6.870 300 1253.18±7.465
Table: 3 Assay Data of Gemigliptin
Brand name Label Claim % Mean Recovery ±
SDn = 5
Gemigliptin
Tablet (In
house
prepared)
Gemigliptin
(mg)
Gemigliptin
50 100.43±0.9817
Table: 4 Linearity Data of Gemigliptin
Sr.
No
Gemigliptin
concentration
(µg/ml) (n=3)
Peak Area (v) ±
SD
%RSD
1 50 220.21 ±1.058 0.4807
2 100 453.62 ±4.097 0.9033
3 150 650.03 ±4.361 0.6709
4 200 875.89±3.986 0.4551
5 250 1046.32±6.429 0.6144
6 300 1252.12±7.216 0.5762
Table: 5 Accuracy Data of Gemigliptin
%
Recov
ery
Tar
get
Con
c.
Spik
ed
Con
c.
Fin
al
Co
nc.
Conc.
obtai
ned
%
Assa
y
Mean±S
D
%
R.S.
D
80 %
100 80 180 180.6
2
100.
44
99.93±0.
372
0.37
25 100 80 180 179.3
1
99.6
1
100 80 180 179.7
2
100.
84
100 %
100 100 200 199.8
6
99.9
3
100.06±
0.127
0.12
70 100 100 200 200.1
9
100.
09
100 100 200 200.3
6
100.
18
120%
100 120 220 220.1
3
100.
05
99.96±0.
081
0.08
16 100 120 220 219.8
6
99.9
3
100 120 220 219.7
9
99.9
0
J PharmSciBioscientific Res. 2016 6(3):338-346 ISSN NO. 2271-3681
Patel S. N. et al 345
Table: 6 Repeatability Data for Gemigliptin
Sr. no Peak Area ( volt) (n= 3)
Gemigliptin
(100µg/ml)
Gemigliptin
(150µg/ml)
Gemigliptin
(200µg/ml)
1 456.11 654.146 876.546
2 448.129 643.284 886.346
3 451.118 648.547 884.385
Mean 451.78 647.32 882.42
SD 4.032 5.4318 5.1854
% RSD 0.8924 0.8373 0.5876
Table: 7 Interday& intraday precision Data for
Gemigliptin
Sr.n
o
Gemigliptin
Concentrati
on (µg/ml)
(n=3)
Peak
Area
(V) ±
SD
Interd
ay
Peak
Area
(V) ±
SD
Intrad
ay
% RSD
interd
ay
% RSD
intrad
ay
1 100 453.97
±12.99
2
457.64
±3.285
2.8619 0.7179
2 150 657.69
±11.06
4
651.36
±6.656
1.6822 1.0219
3 200 872.57
±7.483
0
872.57
±7.483
0.8575 0.8575
Table: 8 LOD and LOQ Data for Gemigliptin
Drugs LOD (μg/ml) LOQ (μg/ml)
Gemigliptin 14.36 43.53
Table: 9 Robustness Data for Gemigliptin
Sr. no.
Gemigliptin (100 µg/ml)
Ph Flow rate Mobile phase
+ 0.2 units
-0.2 units
+0.2 units
-0.2 units
+ 2 % -2%
1 461.15
452.83
462.73
464.32
463.93
457.83
2 473.27
459.29
466.39
472.37
457.23
469.37
3 458.13
449.92
474.92
478.73
452.33
471.29
Mean
464.18
454.01
468.01
471.80
457.83
466.16
S.D 8.011 4.795 6.255 7.221 5.8232
7.280
% R.S.
D
1.7258
1.0560
1.3365
1.5306
1.2719
1.5617
Table: 10 System Suitability of Gemigliptin
Gemigliptin
(250µg/ml)
(n=7)
Peak Area (volt) Retention time
(min)
Gemigliptin Gemigliptin
1 1050.11 2.746
2 1049.23 2.732
3 1057.41 2.761
4 1056.21 2.742
5 1063.46 2.758
6 1048.12 2.791
7 1051.13 2.772
Mean 1053.66 2.757
SD 5.5666 0.019
% RSD 0.5283 0.7204
Table: 11 System Suitability Parameter of Gemigliptin
Sr.
No.
System
suitability
parameter
Gemigliptin Specification as
per IP 2010 and
USP 34 NF 29
1 Retention time
(min)
2.7574 -
2 Theoretical
plate number
(N)
4455 Not less than
2000
3 Tailing factor
(T)
1.382 Not greater
than 2.0
J PharmSciBioscientific Res. 2016 6(3):338-346 ISSN NO. 2271-3681
Patel S. N. et al 346
Table: 12 Summary of Validation Prameters of
Gemigliptin
Sr No. Parameters Gmigliptin REMARK
1 Linearity (μg/ml) 50-300
(µg/ml)
Linear
2 %Recovery 99.71-100.08 Accurate
(98.0%-102%)
3 Precision((%RSD) 0.5876-
0.8924
Precise
(%RSD < 2) Repeatability
(n=3)
Inter-day (n=3) 0.8575-
2.8619
Intra-day (n=3) 0.7179-
1.0219
4 LOD (μg/ml) 14.36 Sensitive
5 LOQ (μg/ml) 43.53 Sensitive
7 Robustness Robust
Robust
(No difference in
result)
Table: 13 Result of force degradation (Bulk)
Sr.
no
Stress
Type
Ge
mi
std
Rt
(mi
n)
Ge
mi
tab
Rt
(mi
n)
No.
of
ext
ra
pe
ak
std
No.
of
ext
ra
pea
k
tab
%
Degrada
tion
std
%
Degrada
tion
tab
1 Acid 2.8
11
2.7
96
4 4 12.45 10.13
2 Alkalin
e
2.7
92
2.7
71
4 2 7.56 6.2
3 Oxidat
ion
2.7
51
2.7
62
5 4 9.8 9.1
4 Therm
al
2.7
93
2.6
63
4 3 9.6 6.7
Table: 14 Summary of Force degradation for
Gemigliptin
Sr
.
n
o
Type of
degradatio
n
Optimized
Condition
Matrix No.
of
Extr
a
pea
k
%
Degradati
on
1 Acid
Hydrolysis
0.1 M HCl
at 60°C for
1 hr
Gemi(st
d)
4 12.45
Gemi(ta
b)
4 10.13
2 Alkaline
Hydrolysis
0.1 M
NaOH at
Gemi(st
d)
4
60°C for 1
hr
7.56
Gemi(ta
b)
2 6.20
3 Oxidative 3% H2O2 at
room
temperatu
re for 4 hr
Gemi(st
d)
5 9.8
Gemi(ta
b)
4 9.1
4 Thermal At 80°C for
2 hr
Gemi(st
d)
4 9.6
Gemi(ta
b)
3 6.7