Embed Size (px)
Citation preview
Stability of Helix-Rich Proteins at High Concentrations
Jianxin Guo,‡ Nicholas Harn,‡ Aaron Robbins,§ Ron Dougherty,§ and C. Russell Middaugh*,‡
Department of Pharmaceutical Chemistry and Department of Mechanical Engineering, The UniVersity of Kansas,2030 Becker DriVe, Lawrence, Kansas 66047
ReceiVed March 15, 2006; ReVised Manuscript ReceiVed May 19, 2006
ABSTRACT: A number of techniques, including circular dichroism, FTIR, front face fluorescence, and UVabsorption spectrophotometries, dynamic light scattering, and DSC, were used to directly measure thecolloidal and conformational stability of proteins in highly concentrated solutions. Using bovine serumalbumin (BSA), chicken egg white lysozyme, human hemoglobin A0, and bovine fibrinogen as modelproteins, the thermal transition temperatures of proteins in dilute and concentrated solutions were compared.At 10 °C, no significant differences in both secondary and tertiary structures were detected for proteinsat different concentrations. When temperature was introduced as a variable, however, hemoglobin andfibrinogen demonstrated higher transition midpoints (Tms) in concentrated rather than in dilute solutions(∆Tm ∼ 2-10 °C). In contrast, lysozyme and BSA in concentrated solutions exhibit a lowerTm than indilute solutions (∆Tm ∼ 2-20 °C). From these studies, it appears that a variety of factors determine theeffect of high concentrations on the colloidal and conformational stability of a particular protein. Whilethe prediction of excluded volume theory is that high concentrations should conformationally stabilizeproteins, other factors such as pH, kinetics, protein dynamics, and intermolecular charge-charge effectsmay affect the overall stability of proteins at high concentrations under certain conditions.
Proteins often exist in their physiological environment athigh concentrations or in crowded environments. Hemoglo-bin, for example, is found in erythrocytes at concentrationsexceeding 300 g/L, and serum albumin is present in bloodin the range of 35-55 g/L. In addition, the development ofrecombinant proteins as therapeutic agents has led to the needfor protein formulations with reduced dosing volumes andsubsequently high concentrations (1). Despite the increasingrelevance of highly concentrated protein solutions, theunfolding and aggregation of proteins at high concentrationsare incompletely understood. In 1977, Ross and Mintondemonstrated that dramatic nonideality arises in the ther-modynamic activity of hemoglobin in salt solutions withincreasing protein concentrations (2). Activity coefficientsof highly concentrated hemoglobin solutions were shown tobe more than 2 orders of magnitude greater than the actualconcentration. The question therefore of the impact of suchdramatic increases in activity on the structure, function, andstability of protein molecules arises.
Stability at high concentrations needs to be viewed inseveral different contexts. For example, changes in thesecondary and tertiary structure of a protein reflect thedelicate balance of forces that control conformational stabil-ity. In contrast, colloidal stability results from the nature ofthe interactions between proteins and their interaction withthe solvent, with aggregation the most well described
manifestation of such phenomena. The two are often coupledwith conformational change leading to protein association.
Significant effort to better understand the effect of macro-molecular crowding on protein stability has been expended(3-11). Excluded volume theory predicts that high concen-trations of inert macromolecular cosolutes will shift theequilibrium toward compact native states and away from lesscompact unfolded or partially folded forms (e.g., conforma-tional stabilization) (3, 12-14). Inert cosolutes refer tospecies of macromolecules that do not interact specificallywith proteins. Excluded volume effects are derived from themutual impenetrability of macromolecules, steric repulsion.Tellam et al. reported that the addition of the inert water-soluble polymer polyethylene glycol 6000 to a concentrationof 100 g/L increased the unfolding temperature of G-actinby more than 5°C. They attributed this effect to astabilization of the native state by the excluded volume (15).Moreover, excluded volume theory predicts that self-association and hetero-association reactions will be facilitatedin crowded fluids (4). Several reports have documented theenhancement of homo-oligomer formation by inert macro-molecules (10, 16, 17). Thus, in light of excluded volumetheory, the conformation stability of proteins at high con-centration is thought to increase while colloidal stabilitydecreases.
Proteins, however, are not inert macromolecules. Bystressing a protein, we find the compact native conformation,with its well-defined secondary and tertiary structures, maybecome altered (e.g., more flexible) and potentially moreinteractive with other proteins. The degree to which thisoccurs is both concentration- and temperature-dependent,among other relevant variables. In dilute solutions, thestability of a protein is largely dictated by intramolecular
* To whom correspondence should be addressed: Department ofPharmaceutical Chemistry, The University of Kansas, 2030 Becker Dr.,Lawrence, KS 66047. Telephone: (785) 864-5813. Fax: (785) 864-5814. E-mail: [email protected].
‡ Department of Pharmaceutical Chemistry.§ Department of Mechanical Engineering.
8686 Biochemistry2006,45, 8686-8696
10.1021/bi060525p CCC: $33.50 © 2006 American Chemical SocietyPublished on Web 06/21/2006
interactions and hydration effects. At high concentrations,however, protein-protein interactions begin to contribute toprotein stability. It is also possible that intramolecularinteractions, including apolar and electrostatic effects, hy-drogen bonds, and van der Waals forces, might be altered athigher protein concentrations. In addition, covalent alter-ations, including deamidation and oxidation, rupture ofpeptide bonds, and cleavage of disulfide bonds, are alsoconcentration-dependent. All such phenomena potentiallycomplicate our understanding of the colloidal and confor-mational stability of proteins at high concentrations whenexternal stress is applied.
The effect of concentration on protein stability is not wellunderstood partially because detailed studies of proteinunfolding and aggregation mechanisms have traditionallybeen performed at low concentrations (<1 mg/mL). Theextent to which such studies can be extrapolated to moreconcentrated conditions, however, remains to be clearlyestablished. Methods that can directly probe the stability ofproteins at high concentration are thus necessary, becauseany change in concentration as a result of dilution may altera protein’s physical state in a way that no longer representsthe original physiological environment or the high concentra-tions necessary for certain technological and pharmaceuticalapplications.
In this work, a variety of biophysical approaches areadapted to characterize the comformational and colloidalstability of proteins directly in highly concentrated solutions.Using bovine serum albumin, chicken egg white lysozyme,human hemoglobin A0, and bovine fibrinogen as modelproteins, the thermal transition temperatures of proteins indilute and concentrated solutions are compared. Tertiarystructure changes are probed by front face fluorescence andshort path length UV1 absorption spectrophotometry. Sec-ondary structure changes are investigated by short path lengthcircular dichroism and attenuated total reflectance Fouriertransform infrared spectroscopy (ATR-FTIR). Differentialscanning calorimetry (DSC) is also employed to directlyexamine thermal transitions. In addition, colloidal stabilityis assessed by turbidity changes and dynamic light scattering.The method employed here suggests that the stability ofproteins at high concentrations is as predicted driven at leastpartially by excluded volume effects. Excluded volume doesnot, however, explain some of the observed behavior, andtherefore, other factors such as kinetics, dynamics, (non)specific interactions, and chemical degradation may beinvolved to varying degrees (18, 19).
MATERIALS AND METHODS
Materials.Chicken egg white lysozyme (L7651), bovineserum albumin [A0281 (99% pure) and A4503 (96% pure)],human hemoglobin A0 (H0267), and bovine fibrinogen(F4753) were purchased from Sigma Chemical Co. (St.Louis, MO). Lysozyme and bovine serum albumin (BSA)were supplied as essentially salt-free lyophilized powdersand were used without further purification. Hemoglobin andfibrinogen contained large amounts of salts and stabilizers.
They were therefore extensively dialyzed against the indi-cated buffer before being used. Dialysis cassettes (molecularweight cutoff of 10,000) were obtained from Pierce Bio-technology Inc. (Rockford, IL). A syringe-driven filter unit(0.22 and 0.45µm) was obtained from Millipore (Bedford,MA). All reagents and chemicals (sodium phosphate monoba-sic, sodium phosphate dibasic, and sodium chloride) wereACS-grade or higher. Solutions were prepared using distilled,deionized water.
Preparation of Protein Solutions.Concentrated lysozymesolutions were prepared in phosphate buffer (10 mM, pH7.4) and filtered. Because the buffering capacity of the proteinbecame significant at high protein concentrations, the finalpH of lysozyme at 350 mg/mL was 4.2. Fibrinogen stockwas prepared in distilled, deionized water and dialyzedagainst NaCl-containing phosphate buffer [10 mM sodiumphosphate and 0.5 M NaCl (pH 7.4)]. Hemoglobin and BSAstock solutions were prepared in distilled, deionized waterand dialyzed against 10 mM phosphate buffer at pH 7.4 and5.6, respectively. Although 99% pure BSA was used in theexperiments reported here, in some cases, a less pure formwas explored as discussed in the text. Nitrogen was bubbledduring the dialysis process to prevent the oxidation ofhemoglobin. Fibrinogen, hemoglobin, and BSA were filteredand concentrated by centrifugation after dialysis. To prepareproteins at low concentrations, the concentrated lysozymesolution was diluted with phosphate buffer (10 mM, pH 4.2)to match the apparent pH of the concentrated solutions. Sincethe pH of the solutions remained the same after dialysis,concentrated fibrinogen, hemoglobin, and BSA solutionswere all diluted with the dialysis buffers. Potential pHchanges of the protein solutions with temperature weremeasured. In all four concentrated solutions, the pH valuesdropped approximately 0.1-0.2 pH unit during the meltingprocess, while the pH did not change in dilute solutions. Theconcentrations of the proteins were determined using dilutedsolutions, the published extinction coefficients, andA280
measurements. As specified below, all dilute conditionstudies were performed with a protein concentration of<1mg/mL. The high concentrations that were used were thehighest that could be attained without visible aggregation ofthe protein.
Dynamic Light Scattering.Experiments were conductedusing a custom-built system utilizing the one-beam methodfor multiple scattering suppression (20, 21). A Spectra-Physics argon ion laser, which was set to a wavelength of514.5 nm, was employed and powered around 0.1 W. ThePMTs and correlator were purchased from correlator.comand use the real-time program Flex 5000 to acquire thescattering data. All studies were conducted at a temperatureof 15 °C which was maintained using a cooled water bath.
The samples were tested for multiple scattering using theone-beam method by adjusting the tilt angle up to 3-4 mradbetween two detectors and cross correlating the two scatteringsignals. Each protein was tested at varying concentrations,and data were acquired for 60-500 s depending on the tiltangle of the detector (a longer time for a longer tilt angle).The data were analyzed using two programs: Flex 5000 andCONTIN. Flex 5000 uses a cumulant method to solve forthe diameter, while CONTIN uses a method that involvestaking the inverse Laplace transform of the data. TwoCONTIN solutions are provided; the first CONTIN solution
1 Abbreviations: ATR-FTIR, attenuated total reflectance Fouriertransform infrared spectroscopy; UV, ultraviolet; DSC, differentialscanning calorimetry;Tm, transition midpoint; BSA, bovine serumalbumin; OD, optical density; CD, circular dichroism.
Stability of Helix-Rich Proteins at High Concentrations Biochemistry, Vol. 45, No. 28, 20068687
is a least-squares fit to the correlation function, while thesecond solution is considered to be the best possible solutionto the data. This “best possible fit” is determined by adjustinga regularization parameter so that the size distributions arenot overly narrowed or widened upon fitting (22-24). Thesecond solution is reported here because of experience withthe quality of the solution and because the determined valueswere closest to those previously reported for these proteinsin dilute solutions (25, 26). All measurements are the averageof at least three trials( the standard deviation.
DeriVatiVe UV Absorbance Spectroscopy and Turbidity.UV absorbance temperature perturbation studies were con-ducted with an Agilent (Palo Alto, CA) 8453 diode arrayUV-visible spectrophotometer. Spectra were collected overa temperature range of 10-85 °C at 2.5°C intervals. Theeffect of temperature on protein aggregation was studied bymonitoring the turbidity at 350 nm (OD350). A 1 cm pathlength cuvette was used with a total sample volume of 0.2mL for proteins at dilute concentrations. A 0.01 cm pathlength cuvette was used for concentrated fibrinogen (59 mg/mL), and a 0.001 cm path length cuvette was used forconcentrated lysozyme (350 mg/mL), hemoglobin (245 mg/mL), and BSA (330 mg/mL). Since no significant differencesin spectral changes were seen at equilibrium times between1 and 5 min, a 1 min equilibrium period was employed beforecollection of data at each temperature. Spectral analysis wasconducted using Chem-station (Agilent). Second-derivativespectra were calculated using a nine-point data filter, fifth-degree Savitzky-Golay polynomial and were subsequentlyfitted to a cubic function with 99 interpolated points per rawdata point. The calculation of the second-derivative spectrumin this manner permitted 0.01 nm resolution, as describedpreviously (27). Peak positions were determined from theinterpolated curves using Microcal Origin 7.0. Transitionmidpoints were determined with a fit to a sigmoidal functionor by first derivatives of the transitions for nonsigmoidal fitsusing Microcal Origin 7.0.
Fluorescence Spectroscopy.Fluorescence spectroscopyemploying front face sampling geometry was used to probechanges in the tertiary structure of the proteins at highconcentrations as a function of temperature. The use of aright angle triangular cuvette was necessary because of theextreme inner filter effect present at high concentrations (28,29). A rectangular cuvette, on the other hand, was used indilute solutions. The only exception was fibrinogen, whichwas examined at low concentrations in the triangular cuvettedue to its high extinction coefficient. An excitation wave-length of 295 nm was employed (>95% Trp emission), andemission spectra were recorded from 310 to 450 nm using aQuantaMaster spectrofluorometer equipped with a Peltierthermostated cuvette holder (Photon Technologies Interna-tional, Lawrenceville, NJ). Data were collected every 0.5nm at a scanning rate of 1 nm/s. Full spectra were obtainedevery 2.5°C from 10 to 85°C with a 5 minute thermalequilibration at each temperature. The data were processed,and peak positions were determined using Microcal Origin7.0.
Circular Dichroism. CD spectra were recorded with aJasco (Tokyo, Japan) J-720 spectrophotometer equipped witha Peltier temperature controller. Far-UV spectra were col-lected with 1 mm path length cuvettes sealed with a Teflonstopper for dilute protein solutions. An extremely short path
length (0.5-5 µm) cell was made for proteins at highconcentrations by dropping a small volume of proteinsolution (1-10 µL) on a quartz plate and sliding a secondplate across its surface in a manner that allowed capillaryaction to fill the space between the plates. The path lengthwas then determined by UV absorbance measurements. Theellipticity at 222 nm was simultaneously monitored at 0.1°Cintervals at a thermal ramp rate of 1°C/min. Completespectra were also collected at 10°C and at the end of themelting process (i.e., 85°C for lysozyme, BSA, andhemoglobin and 65°C for fibrinogen). A data pitch of 0.5 nmand a scanning speed of 10 nm/min with a 2 sresponse timewere used to acquire each spectrum. Data analysis wasperformed using Standard Analysis and Temperature/Wavelength Analysis (Jasco) and MicroCal Origin 7.0.
FTIR Spectroscopy. BSA (12 and 330 mg/ml), lysozyme(10 and 400 mg/mL), human hemoglobin A0 (8 and 245 mg/mL), and fibrinogen (11 and 59 mg/mL) were used in thisstudy. Higher concentrations were employed for the dilutecomparison in this case due to the lower sensitivity of FTIRspectroscopy. Lysozyme was dissolved in 10 mM deuteratedphosphate buffer, and the final pD was 4.2. Protein solutionsin D2O were placed at room temperature overnight to ensureextensive H-D exchanges. Because fibrinogen, BSA, andhemoglobin had to be dialyzed before use, they wereexamined by FTIR in aqueous solution. An ATR (attenuatedtotal reflectance) cell equipped with a 45° ZnSe trough plateand sealed liquid cover was employed. Data were collectedusing 256 scans at a resolution of 4 cm-1 with a NicoletMagna 560 FTIR spectrometer that was equipped with anMCT/A detector. A thermal ARK temperature controller(Spectra-Tech, Inc., Shelton, CT) was used to vary thetemperature every 5°C from 30 to 80°C. The samples wereequilibrated for 7 min at each temperature. Thermal meltspectra were acquired for the proteins and buffer solutions.Buffer spectra at each temperature were subtracted from theprotein spectra using Grams AI version 7.0 (ThermoGalactic). The resulting data were copied into MicrosoftExcel, and a ratio of the absorbance at two frequencies wascalculated and plotted versus temperature.
Differential Scanning Calorimetry. Differential scanningcalorimetry (DSC) was employed to determine the thermaltransition temperatures (Tms) of the proteins at differentconcentrations. A high-throughput capillary differential scan-ning calorimeter (MicroCal LLC, Northampton, MA) wasused for proteins at lower concentrations. A scan rate of60 °C/h was used to obtain data from 10 to 90°C. ADSCQ100 (TA Instruments, New Castle, DE) was employedto measureTm values for proteins at high concentrations.The modulated DSC mode was applied with a 60 smodulation period and a 60°C/h ramp rate. Even thoughthe MicroCal LLC measures heat capacity (kilocalories permole per degree Celsius) and the DSCQ100 device monitorsheat flow (milliwatts), the identical scanning rates that wereemployed permit direct comparison between the two calo-rimetric methods. In some cases, experiments were conductedat the same concentration (e.g., 10 mg/mL in the two differentinstruments) and gave essentially identicalTm values.
8688 Biochemistry, Vol. 45, No. 28, 2006 Guo et al.
RESULTS
DLS
The hydrodynamic diameter of BSA, lysozyme, andfibrinogen was determined at low and high concentrations.Because only a weak scattering signal was observed in theconcentrated hemoglobin solution due to absorption of theincident light even after the laser was adjusted to 1 W, resultswere not further analyzed. The size of BSA was determinedto be 6.00( 0.43 nm at 10 mg/mL and 6.70( 0.29 nm at280 mg/mL by employing a CONTIN analysis of thecorrelation function at zero tilt angle. The presence ofmultiple scattering can be identified by an approximate 10-20% increase in diameter with an increasing tilt angle ofthe detectors (20). BSA demonstrates an approximate 17%increase in diameter with an increasing tilt angle, but due tothe uncertainty in the size measurement versus tilt angle evenafter evaluation of intermediate concentrations, the observedincrease at higher concentrations cannot definitely be at-tributed to either multiple scattering or an increase inhydrodynamic diameter (data not illustrated). Fibrinogen, thelargest of the four proteins that were tested, shows the mostsignificant increase in diameter (∼5 nm) with an increasingtilt angle. Again, due to the uncertainty of the data obtainedwhen the tilt angle is changed, it is not clear whether thesample exhibits multiple scattering. The sizes measured forfibrinogen were 22.81( 2.13 nm at 2 mg/mL and 34.45(5.20 nm at 42 mg/mL. Lysozyme, the smallest of the proteinsthat were tested, did not exhibit any significant increase indiameter with an increasing tilt angle. Lysozyme at 10 mg/mL exhibited a diameter of 3.22( 0.63 nm and a diameterof 2.46 ( 0.21 nm at 350 mg/mL. Other intermediateconcentrations produced size estimates that are between thesetwo values but demonstrated no discernible trend. The sizesof all the proteins measured in dilute solutions are close tothose previously reported (25, 26).
UV Absorbance Spectroscopy
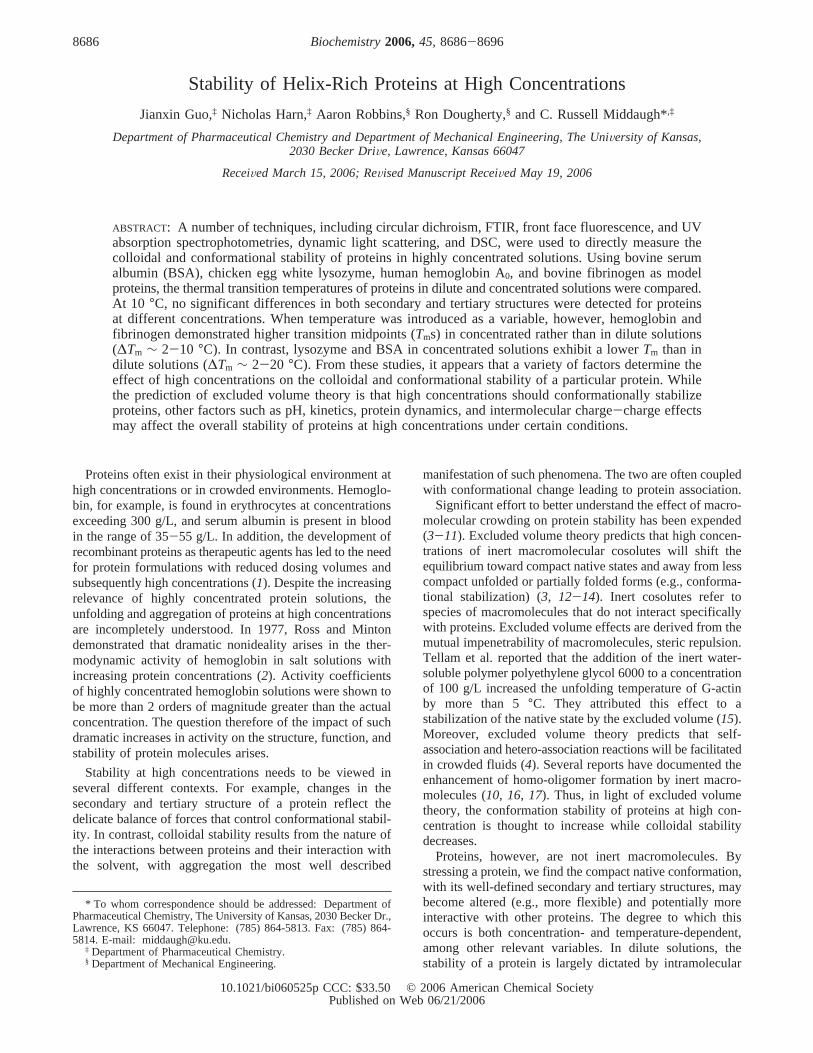
Aggregation of Proteins.Temperature-induced aggregationwas studied by turbidity measurements (OD350) acquiredsimultaneously with the absorbance data. Both concentratedlysozyme and fibrinogen aggregate more extensively thanin dilute solutions as indicated by a large increase in OD350
with an increase in temperature (Figure 1A,C). Little or noaggregation is observed for lysozyme in dilute solutions. Thetemperature at which aggregation occurs for fibrinogen isthe same at low and high concentrations (53°C). Theincrease in the OD350 of hemoglobin at high concentrationsis smaller than that in dilute solutions and occurs at a muchhigher temperature (∼10°C higher, Figure 1B). ConcentratedBSA forms a transparent gel when heated. Nevertheless, asmall transition is still evident (inset of Figure 1D) which is15 °C lower than that seen in dilute solutions. This resultcorrelates well with the transitions seen in UV derivativeabsorbance spectroscopy (discussed below).
High-Resolution DeriVatiVe Absorbance Spectroscopy.Thesecond-derivative UV absorbance spectrum of the fourproteins that were studied exhibits four to six distinct negativepeaks. At 10°C, the six most common negative peaks ofmodel aromatic amino acids occur at approximately 252.7(peak 1, Phe), 258.8 (peak 2, Phe), 265.5 (peak 3, Phe), 277.6(peak 4, Tyr), 283.9 (peak 5, Trp/Tyr), and 290.6 nm (peak
6, Trp) (27). The changes in peak positions with temperatureat both a low and high concentration for the four proteinsare summarized in Figures 2-5.
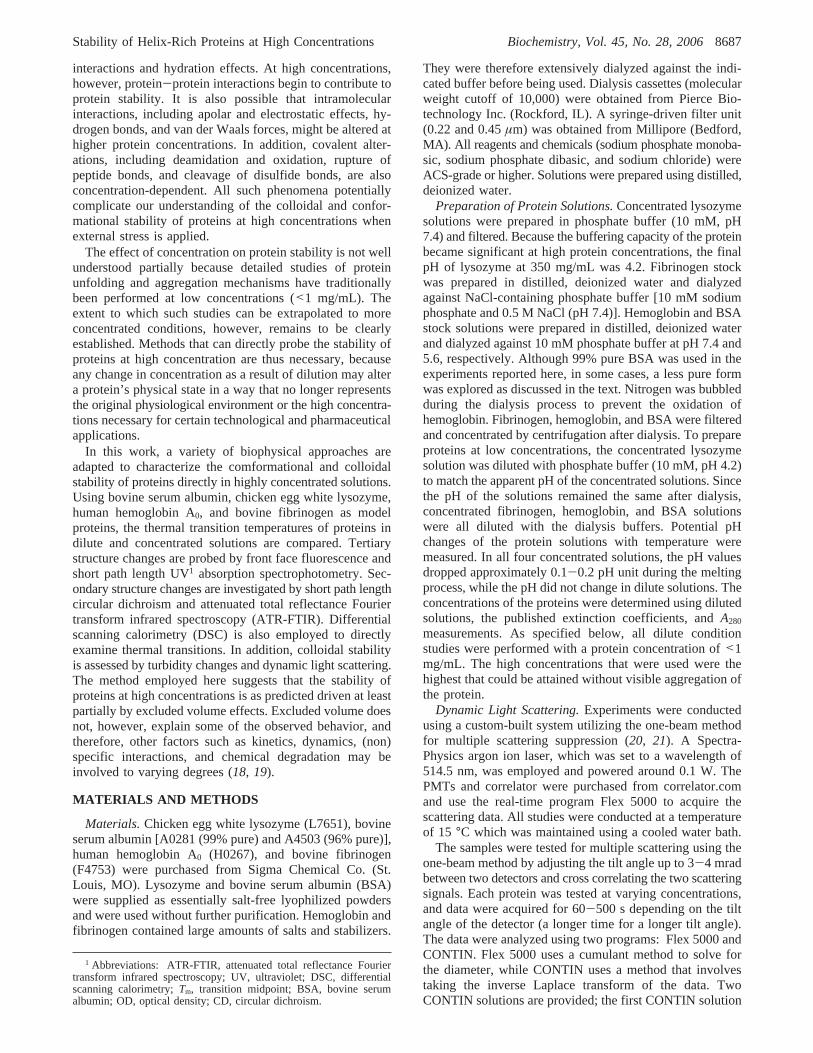
Lysozyme. Only four peaks were resolved for lysozyme(Figure 2), arising from Phe, Tyr, Tyr/Trp, and Trp residues.Plots of peak position versus temperature exhibit clearlydefined transitions induced by increases in temperature. Thedirections of the transitions were similar at both high andlow concentrations, shifting to a lower wavelength at highertemperatures. Studies with model compounds in varioussolvents indicate that shifts to lower wavelengths correspondto movement into more polar environments (the opposite ofthat seen in fluorescence spectra) and vice versa (30). Thus,on the basis of shifts in peak positions, tyrosine andtryptophan residues become more exposed but to differentextents upon heating (Figure 2B-D). In general, transitionmidpoints of lysozyme at high concentrations calculated fromthe individual peaks are∼2 °C lower than those seen in dilutesolutions (Table 1).
FIGURE 1: Comparison of thermal aggregation determined byoptical density measurements at 350 nm in dilute (9) andconcentrated (O) solutions: (A) lysozyme [(9) 0.41 and (O) 350mg/mL], (B) hemoglobin [(9) 0.3 and (O) 245 mg/mL], (C)fibrinogen [(9) 0.17 and (O) 59 mg/mL], and (D) BSA [(9) 0.27and (O) 330 mg/mL]. The inset shows an amplification of the datafrom 330 mg/mL protein. The error bars represent the standard error(n ) 3). Error bars that are not visible are hidden within the symbol.
FIGURE 2: Derivative UV absorbance studies of lysozyme in dilute(9, 0.41 mg/mL) and concentrated (O, 350 mg/mL) solutions as afunction of temperature: (A) Phe, (B) Tyr, (C) Tyr/Trp, and (D)Trp. The error bars represent the standard error (n ) 3). Error barsthat are not visible are hidden within the symbol.
Stability of Helix-Rich Proteins at High Concentrations Biochemistry, Vol. 45, No. 28, 20068689
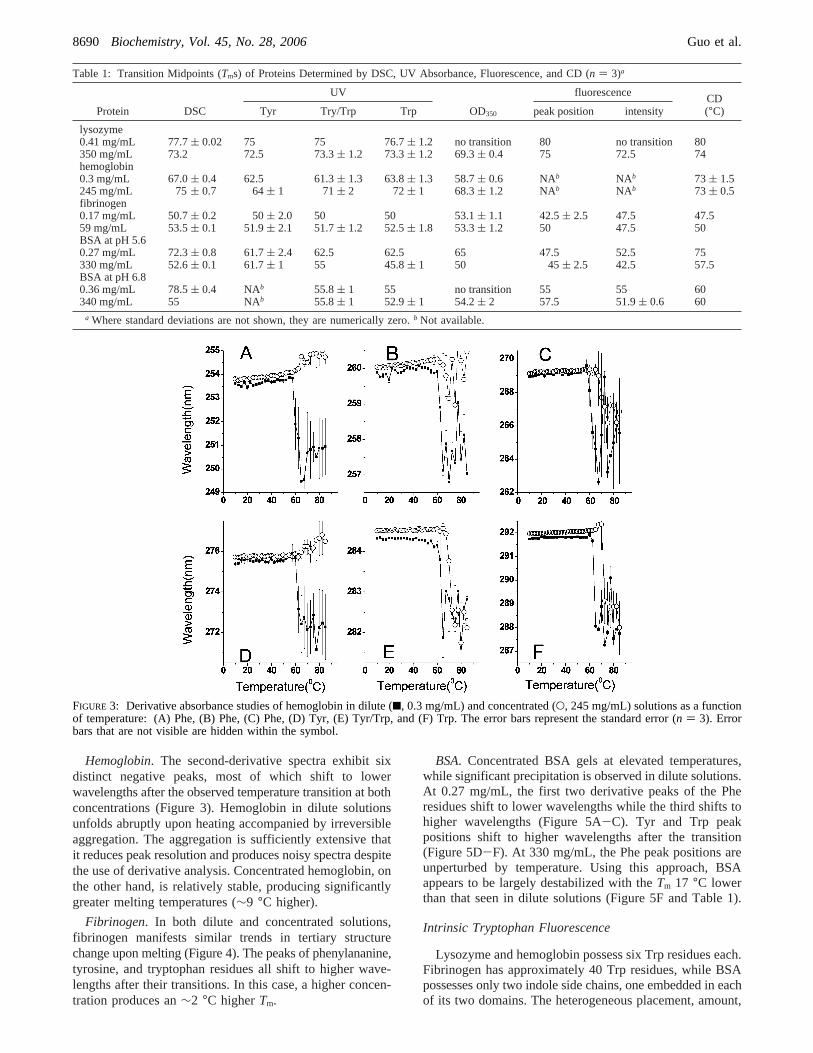
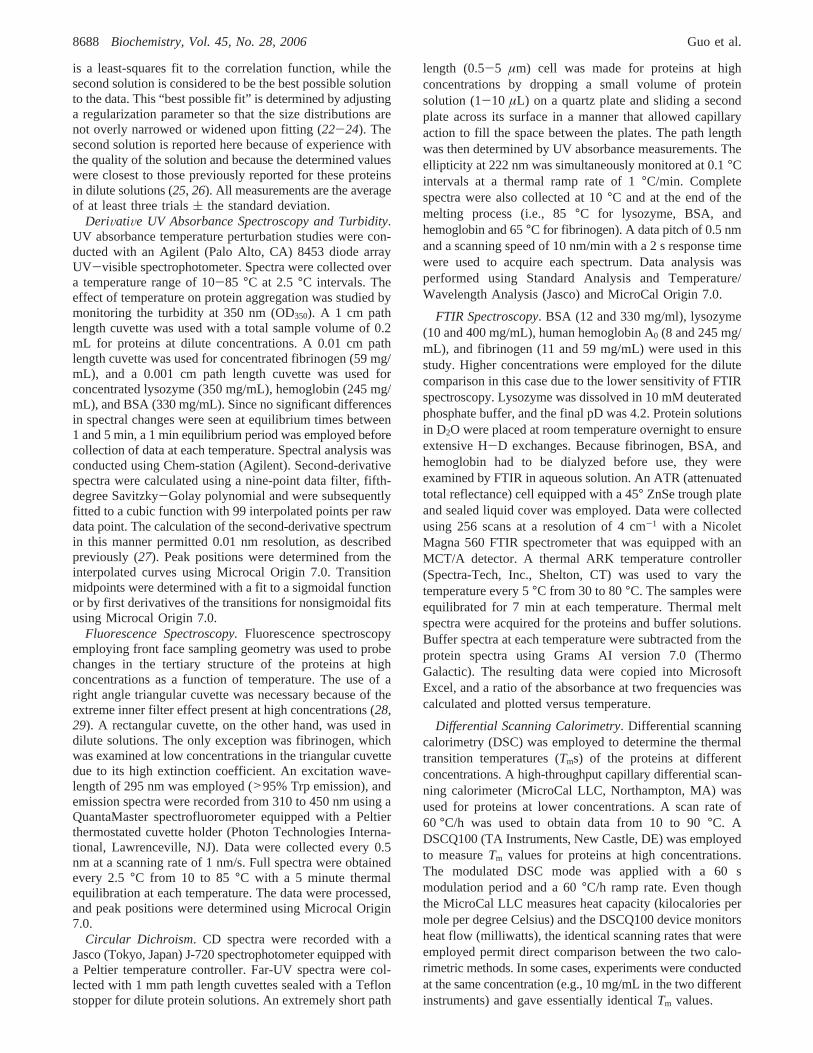
Hemoglobin. The second-derivative spectra exhibit sixdistinct negative peaks, most of which shift to lowerwavelengths after the observed temperature transition at bothconcentrations (Figure 3). Hemoglobin in dilute solutionsunfolds abruptly upon heating accompanied by irreversibleaggregation. The aggregation is sufficiently extensive thatit reduces peak resolution and produces noisy spectra despitethe use of derivative analysis. Concentrated hemoglobin, onthe other hand, is relatively stable, producing significantlygreater melting temperatures (∼9 °C higher).
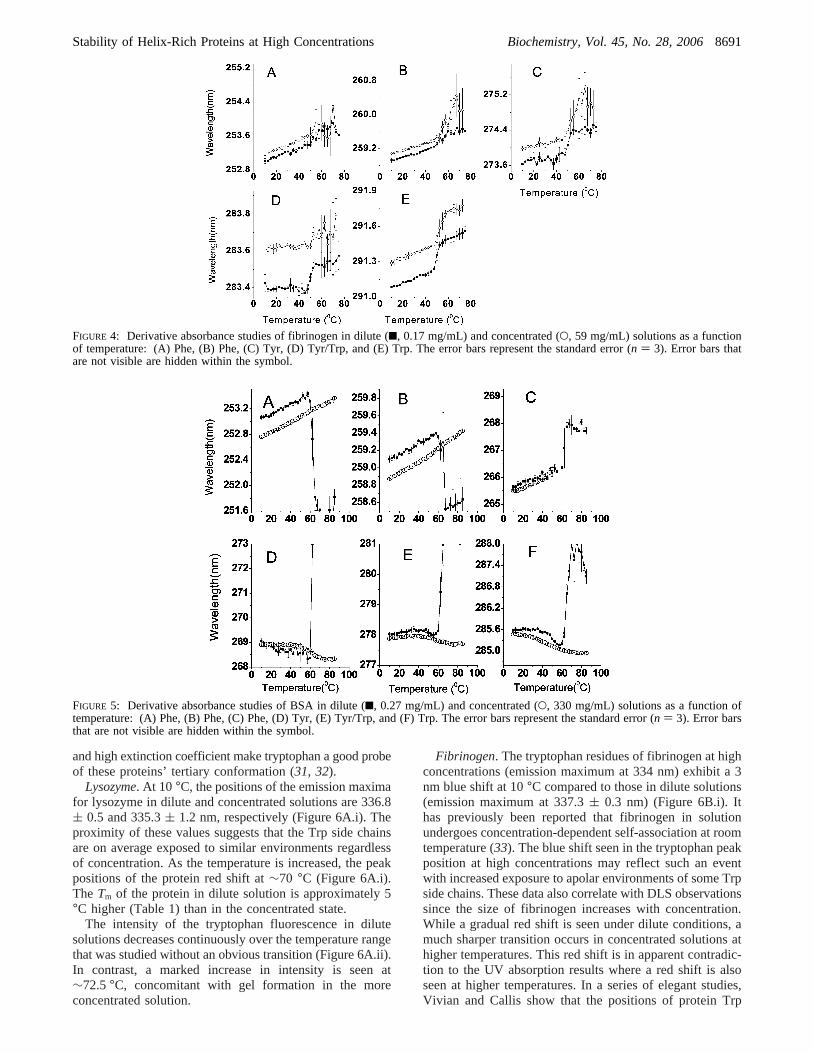
Fibrinogen. In both dilute and concentrated solutions,fibrinogen manifests similar trends in tertiary structurechange upon melting (Figure 4). The peaks of phenylananine,tyrosine, and tryptophan residues all shift to higher wave-lengths after their transitions. In this case, a higher concen-tration produces an∼2 °C higherTm.
BSA. Concentrated BSA gels at elevated temperatures,while significant precipitation is observed in dilute solutions.At 0.27 mg/mL, the first two derivative peaks of the Pheresidues shift to lower wavelengths while the third shifts tohigher wavelengths (Figure 5A-C). Tyr and Trp peakpositions shift to higher wavelengths after the transition(Figure 5D-F). At 330 mg/mL, the Phe peak positions areunperturbed by temperature. Using this approach, BSAappears to be largely destabilized with theTm 17 °C lowerthan that seen in dilute solutions (Figure 5F and Table 1).
Intrinsic Tryptophan Fluorescence
Lysozyme and hemoglobin possess six Trp residues each.Fibrinogen has approximately 40 Trp residues, while BSApossesses only two indole side chains, one embedded in eachof its two domains. The heterogeneous placement, amount,
Table 1: Transition Midpoints (Tms) of Proteins Determined by DSC, UV Absorbance, Fluorescence, and CD (n ) 3)a
UV fluorescence
Protein DSC Tyr Try/Trp Trp OD350 peak position intensityCD(°C)
lysozyme0.41 mg/mL 77.7( 0.02 75 75 76.7( 1.2 no transition 80 no transition 80350 mg/mL 73.2 72.5 73.3( 1.2 73.3( 1.2 69.3( 0.4 75 72.5 74hemoglobin0.3 mg/mL 67.0( 0.4 62.5 61.3( 1.3 63.8( 1.3 58.7( 0.6 NAb NAb 73 ( 1.5245 mg/mL 75( 0.7 64( 1 71( 2 72( 1 68.3( 1.2 NAb NAb 73 ( 0.5fibrinogen0.17 mg/mL 50.7( 0.2 50( 2.0 50 50 53.1( 1.1 42.5( 2.5 47.5 47.559 mg/mL 53.5( 0.1 51.9( 2.1 51.7( 1.2 52.5( 1.8 53.3( 1.2 50 47.5 50BSA at pH 5.60.27 mg/mL 72.3( 0.8 61.7( 2.4 62.5 62.5 65 47.5 52.5 75330 mg/mL 52.6( 0.1 61.7( 1 55 45.8( 1 50 45( 2.5 42.5 57.5BSA at pH 6.80.36 mg/mL 78.5( 0.4 NAb 55.8( 1 55 no transition 55 55 60340 mg/mL 55 NAb 55.8( 1 52.9( 1 54.2( 2 57.5 51.9( 0.6 60
a Where standard deviations are not shown, they are numerically zero.b Not available.
FIGURE 3: Derivative absorbance studies of hemoglobin in dilute (9, 0.3 mg/mL) and concentrated (O, 245 mg/mL) solutions as a functionof temperature: (A) Phe, (B) Phe, (C) Phe, (D) Tyr, (E) Tyr/Trp, and (F) Trp. The error bars represent the standard error (n ) 3). Errorbars that are not visible are hidden within the symbol.
8690 Biochemistry, Vol. 45, No. 28, 2006 Guo et al.
and high extinction coefficient make tryptophan a good probeof these proteins’ tertiary conformation (31, 32).
Lysozyme. At 10 °C, the positions of the emission maximafor lysozyme in dilute and concentrated solutions are 336.8( 0.5 and 335.3( 1.2 nm, respectively (Figure 6A.i). Theproximity of these values suggests that the Trp side chainsare on average exposed to similar environments regardlessof concentration. As the temperature is increased, the peakpositions of the protein red shift at∼70 °C (Figure 6A.i).The Tm of the protein in dilute solution is approximately 5°C higher (Table 1) than in the concentrated state.
The intensity of the tryptophan fluorescence in dilutesolutions decreases continuously over the temperature rangethat was studied without an obvious transition (Figure 6A.ii).In contrast, a marked increase in intensity is seen at∼72.5°C, concomitant with gel formation in the moreconcentrated solution.
Fibrinogen. The tryptophan residues of fibrinogen at highconcentrations (emission maximum at 334 nm) exhibit a 3nm blue shift at 10°C compared to those in dilute solutions(emission maximum at 337.3( 0.3 nm) (Figure 6B.i). Ithas previously been reported that fibrinogen in solutionundergoes concentration-dependent self-association at roomtemperature (33). The blue shift seen in the tryptophan peakposition at high concentrations may reflect such an eventwith increased exposure to apolar environments of some Trpside chains. These data also correlate with DLS observationssince the size of fibrinogen increases with concentration.While a gradual red shift is seen under dilute conditions, amuch sharper transition occurs in concentrated solutions athigher temperatures. This red shift is in apparent contradic-tion to the UV absorption results where a red shift is alsoseen at higher temperatures. In a series of elegant studies,Vivian and Callis show that the positions of protein Trp
FIGURE 4: Derivative absorbance studies of fibrinogen in dilute (9, 0.17 mg/mL) and concentrated (O, 59 mg/mL) solutions as a functionof temperature: (A) Phe, (B) Phe, (C) Tyr, (D) Tyr/Trp, and (E) Trp. The error bars represent the standard error (n ) 3). Error bars thatare not visible are hidden within the symbol.
FIGURE 5: Derivative absorbance studies of BSA in dilute (9, 0.27 mg/mL) and concentrated (O, 330 mg/mL) solutions as a function oftemperature: (A) Phe, (B) Phe, (C) Phe, (D) Tyr, (E) Tyr/Trp, and (F) Trp. The error bars represent the standard error (n ) 3). Error barsthat are not visible are hidden within the symbol.
Stability of Helix-Rich Proteins at High Concentrations Biochemistry, Vol. 45, No. 28, 20068691
fluorescence emission peaks are a product of contributionsfrom both the solvent and the protein matrix (31). In fact,the contribution from the protein itself can often be thedominating effect (see Figure 3 in ref31), resulting in eitherblue or red shifts depending on the nature of any change inthe immediate electrostatic environment of each indolechromophore. Thus, the apparent contradiction between thedirection of the shifts seen by UV absorption and fluores-cence may reflect specific changes in the interaction of thefibrinogen protein backbone and side chains with their Trpfluorophores rather than be an immediate consequence ofchanges in solvent exposure.
Although theTm value determined from intensity versustemperature plots occurs at the same temperature in diluteand concentrated solutions (48°C), the intensity increasesdramatically at high concentrations rather than decreasingas seen in dilute solution (Figure 6B.ii). This difference inintensity change may reflect the different properties of thesample upon heating, because fibrinogen forms heteroge-neous precipitates in dilute solutions but homogeneous gelsat high concentrations.
BSA. At 10 °C, BSA in dilute solution possesses anemission maximum at 342 nm, close to the value of 343 nmobserved in concentrated solutions (Figure 6C.i). With anincrease in temperature, the fluorescence emission peak ofBSA in dilute solutions exhibits a transition at 47.5°C tolower wavelengths. This transition occurs at 45( 2 °C forBSA at high concentrations. The fluorescence intensitydecreases with temperature at both concentrations with aTm
of 52.5°C in dilute solutions and 42.5°C at high concentra-tions (Figure 6C.ii).
Hemoglobin. The fluorescence of hemoglobin at bothconcentrations could not be detected, despite the use of frontsurface geometry. This is probably due an extreme inner filtereffect at high concentrations. We were also unable to obtaingood fluorescence data from hemoglobin at 0.3 mg/mLpresumably because of the reduced sensitivity of the frontface geometry. Since very strong nonideality arises in the
thermodynamic activity of hemoglobin with an increase inconcentration, the extrapolation from two or three low-endconcentrations to higher concentrations is not possible. Thus,comparative hemoglobin fluorescence results are unavailable.
Far-UV Circular Dichroism
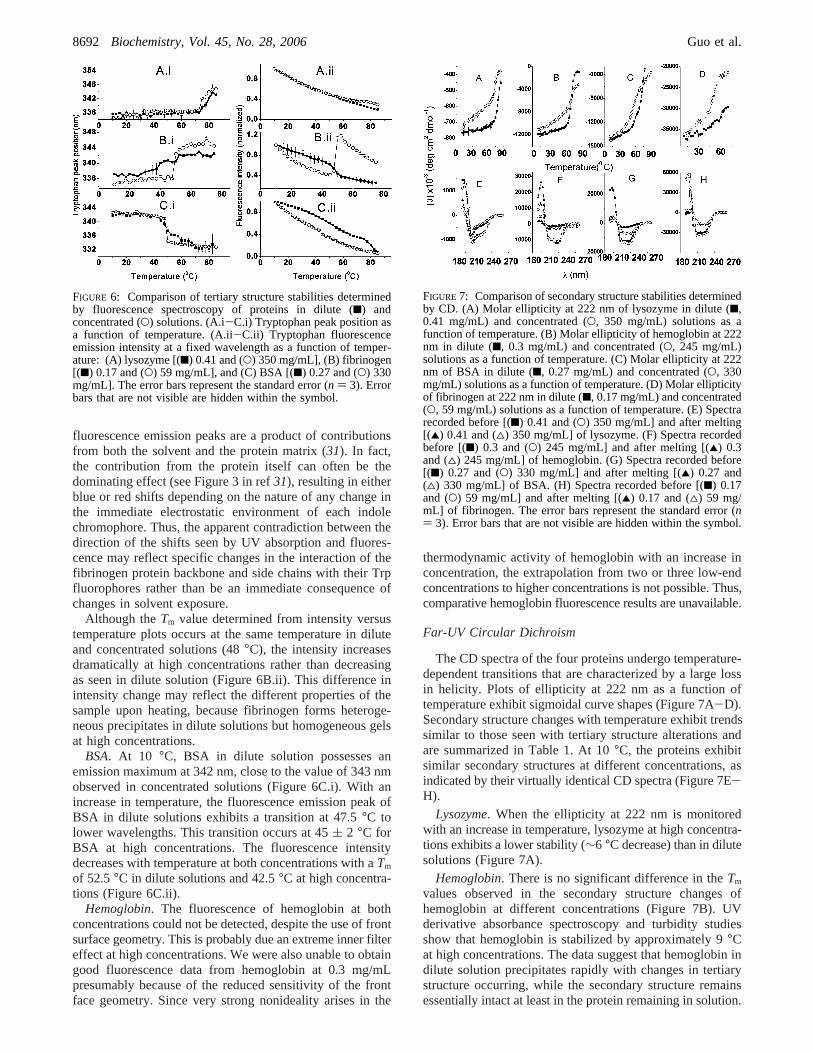
The CD spectra of the four proteins undergo temperature-dependent transitions that are characterized by a large lossin helicity. Plots of ellipticity at 222 nm as a function oftemperature exhibit sigmoidal curve shapes (Figure 7A-D).Secondary structure changes with temperature exhibit trendssimilar to those seen with tertiary structure alterations andare summarized in Table 1. At 10°C, the proteins exhibitsimilar secondary structures at different concentrations, asindicated by their virtually identical CD spectra (Figure 7E-H).
Lysozyme. When the ellipticity at 222 nm is monitoredwith an increase in temperature, lysozyme at high concentra-tions exhibits a lower stability (∼6 °C decrease) than in dilutesolutions (Figure 7A).
Hemoglobin. There is no significant difference in theTm
values observed in the secondary structure changes ofhemoglobin at different concentrations (Figure 7B). UVderivative absorbance spectroscopy and turbidity studiesshow that hemoglobin is stabilized by approximately 9°Cat high concentrations. The data suggest that hemoglobin indilute solution precipitates rapidly with changes in tertiarystructure occurring, while the secondary structure remainsessentially intact at least in the protein remaining in solution.
FIGURE 6: Comparison of tertiary structure stabilities determinedby fluorescence spectroscopy of proteins in dilute (9) andconcentrated (O) solutions. (A.i-C.i) Tryptophan peak position asa function of temperature. (A.ii-C.ii) Tryptophan fluorescenceemission intensity at a fixed wavelength as a function of temper-ature: (A) lysozyme [(9) 0.41 and (O) 350 mg/mL], (B) fibrinogen[(9) 0.17 and (O) 59 mg/mL], and (C) BSA [(9) 0.27 and (O) 330mg/mL]. The error bars represent the standard error (n ) 3). Errorbars that are not visible are hidden within the symbol.
FIGURE 7: Comparison of secondary structure stabilities determinedby CD. (A) Molar ellipticity at 222 nm of lysozyme in dilute (9,0.41 mg/mL) and concentrated (O, 350 mg/mL) solutions as afunction of temperature. (B) Molar ellipticity of hemoglobin at 222nm in dilute (9, 0.3 mg/mL) and concentrated (O, 245 mg/mL)solutions as a function of temperature. (C) Molar ellipticity at 222nm of BSA in dilute (9, 0.27 mg/mL) and concentrated (O, 330mg/mL) solutions as a function of temperature. (D) Molar ellipticityof fibrinogen at 222 nm in dilute (9, 0.17 mg/mL) and concentrated(O, 59 mg/mL) solutions as a function of temperature. (E) Spectrarecorded before [(9) 0.41 and (O) 350 mg/mL] and after melting[(2) 0.41 and (4) 350 mg/mL] of lysozyme. (F) Spectra recordedbefore [(9) 0.3 and (O) 245 mg/mL] and after melting [(2) 0.3and (4) 245 mg/mL] of hemoglobin. (G) Spectra recorded before[(9) 0.27 and (O) 330 mg/mL] and after melting [(2) 0.27 and(4) 330 mg/mL] of BSA. (H) Spectra recorded before [(9) 0.17and (O) 59 mg/mL] and after melting [(2) 0.17 and (4) 59 mg/mL] of fibrinogen. The error bars represent the standard error (n) 3). Error bars that are not visible are hidden within the symbol.
8692 Biochemistry, Vol. 45, No. 28, 2006 Guo et al.
Both secondary and tertiary structure changes, however,occur at similar temperatures at high concentrations.
BSA. Concentrated BSA is destabilized by∼18 °Ccompared to that in dilute solutions (Figure 7C). Althoughprecipitation complicated interpretation of these data at highertemperatures, it was still possible to obtain an undistortedsignal at lower temperatures sufficient to reach this conclu-sion.
Fibrinogen. The CD-derivedTm of fibrinogen at 0.17 mg/mL is 47.5°C, while that of fibrinogen at 59 mg/mL is 50°C (Figure 7D). These data suggest that fibrinogen at highconcentrations alters its secondary structure at slightly highertemperatures than in dilute solution.
CD Spectral Analysis
Although spectra of these proteins taken before heatingsuggest no direct effect of high protein concentration onsecondary structure, CD spectra taken during thermal per-turbation experiments exhibit very different signatures.Lysozyme in dilute solutions after thermal stress exhibits apeak minimum at 204 nm and a shoulder at 222 nm,indicating large increases in the amount of random coil mixedwith residual helical structure (Figure 7E). At high concen-trations, lysozyme has a single minimum that occurs at 210nm. After their thermal transitions, spectra of hemoglobin,albumin, and fibrinogen in dilute solutions display peakminima at ∼208 nm and shoulders at∼220 nm, a trendsimilar to that seen in dilute lysozyme solutions althoughwith less disordered content (Figure 7F-H). At highconcentrations and temperatures, spectra of hemoglobin,albumin, and fibrinogen display their peak minima at 221nm (Figure 7F-H). These spectra suggest that, whenthermally perturbed, the proteins in dilute solutions exhibitmore disordered structures, while those in a more concen-trated state manifest an increase inâ-sheet structure content,probably intermolecular in nature (see below).
ATR-FTIR
FTIR spectroscopy was also employed in analyzingchanges in secondary structure. The lowest concentration at
which high-resolution spectra from all four proteins couldbe obtained was approximately 10 mg/mL. While thisconcentration is 50-fold higher than that used for the othertechniques, it was still employed as the comparative low-concentration sample to provide another technique forprobing the effect of concentration on secondary structurethermal stability. Potential alterations to the secondarystructure of the proteins were monitored in the amide I or I′region (1600-1700 cm-1) of the IR spectra.
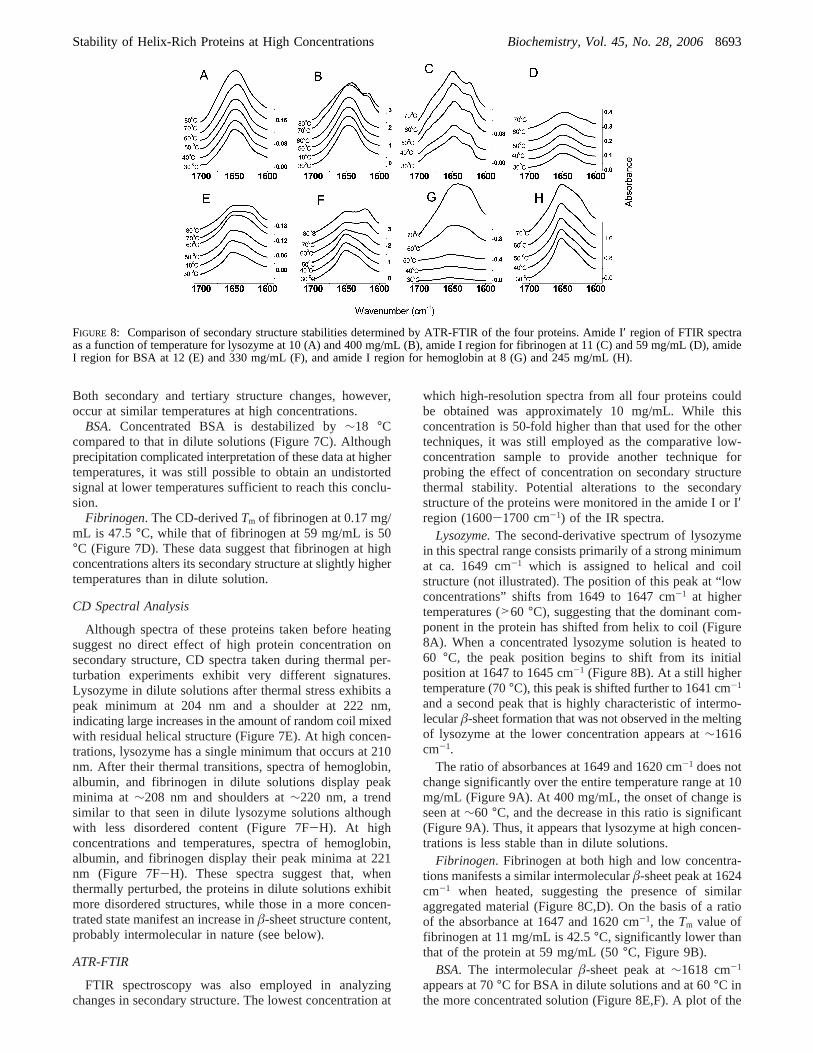
Lysozyme.The second-derivative spectrum of lysozymein this spectral range consists primarily of a strong minimumat ca. 1649 cm-1 which is assigned to helical and coilstructure (not illustrated). The position of this peak at “lowconcentrations” shifts from 1649 to 1647 cm-1 at highertemperatures (>60 °C), suggesting that the dominant com-ponent in the protein has shifted from helix to coil (Figure8A). When a concentrated lysozyme solution is heated to60 °C, the peak position begins to shift from its initialposition at 1647 to 1645 cm-1 (Figure 8B). At a still highertemperature (70°C), this peak is shifted further to 1641 cm-1
and a second peak that is highly characteristic of intermo-lecularâ-sheet formation that was not observed in the meltingof lysozyme at the lower concentration appears at∼1616cm-1.
The ratio of absorbances at 1649 and 1620 cm-1 does notchange significantly over the entire temperature range at 10mg/mL (Figure 9A). At 400 mg/mL, the onset of change isseen at∼60 °C, and the decrease in this ratio is significant(Figure 9A). Thus, it appears that lysozyme at high concen-trations is less stable than in dilute solutions.
Fibrinogen. Fibrinogen at both high and low concentra-tions manifests a similar intermolecularâ-sheet peak at 1624cm-1 when heated, suggesting the presence of similaraggregated material (Figure 8C,D). On the basis of a ratioof the absorbance at 1647 and 1620 cm-1, the Tm value offibrinogen at 11 mg/mL is 42.5°C, significantly lower thanthat of the protein at 59 mg/mL (50°C, Figure 9B).
BSA. The intermolecularâ-sheet peak at∼1618 cm-1
appears at 70°C for BSA in dilute solutions and at 60°C inthe more concentrated solution (Figure 8E,F). A plot of the
FIGURE 8: Comparison of secondary structure stabilities determined by ATR-FTIR of the four proteins. Amide I′ region of FTIR spectraas a function of temperature for lysozyme at 10 (A) and 400 mg/mL (B), amide I region for fibrinogen at 11 (C) and 59 mg/mL (D), amideI region for BSA at 12 (E) and 330 mg/mL (F), and amide I region for hemoglobin at 8 (G) and 245 mg/mL (H).
Stability of Helix-Rich Proteins at High Concentrations Biochemistry, Vol. 45, No. 28, 20068693
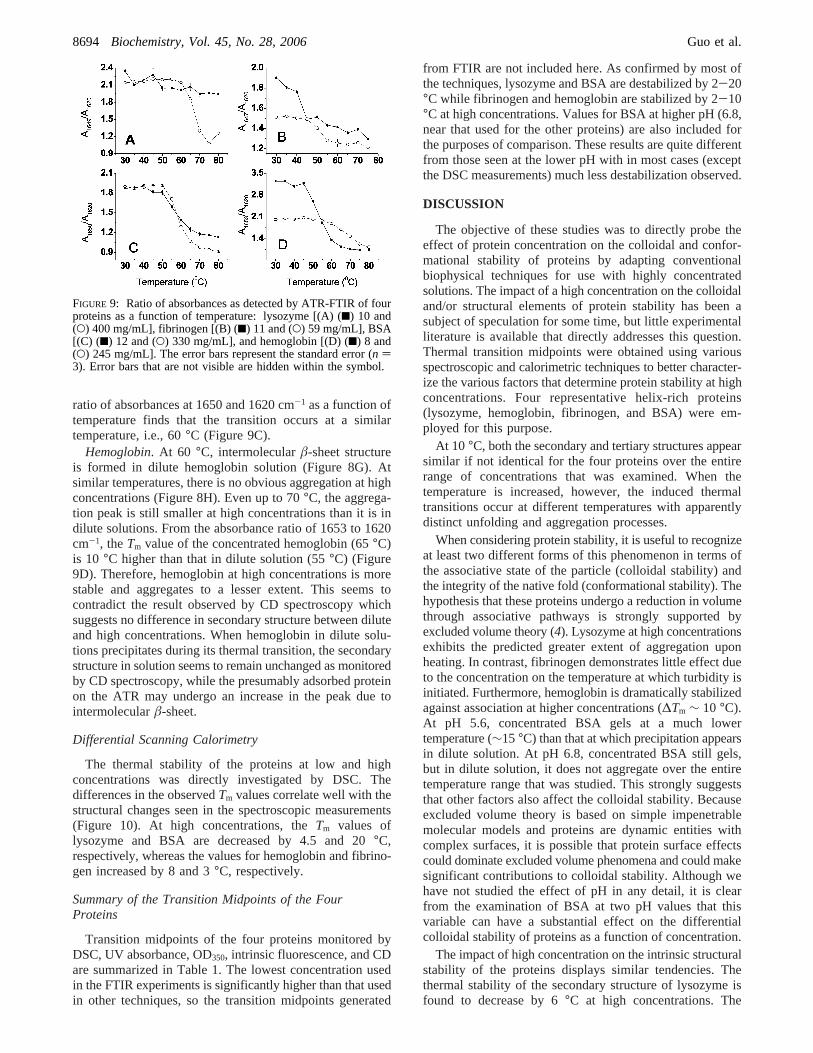
ratio of absorbances at 1650 and 1620 cm-1 as a function oftemperature finds that the transition occurs at a similartemperature, i.e., 60°C (Figure 9C).
Hemoglobin. At 60 °C, intermolecularâ-sheet structureis formed in dilute hemoglobin solution (Figure 8G). Atsimilar temperatures, there is no obvious aggregation at highconcentrations (Figure 8H). Even up to 70°C, the aggrega-tion peak is still smaller at high concentrations than it is indilute solutions. From the absorbance ratio of 1653 to 1620cm-1, theTm value of the concentrated hemoglobin (65°C)is 10 °C higher than that in dilute solution (55°C) (Figure9D). Therefore, hemoglobin at high concentrations is morestable and aggregates to a lesser extent. This seems tocontradict the result observed by CD spectroscopy whichsuggests no difference in secondary structure between diluteand high concentrations. When hemoglobin in dilute solu-tions precipitates during its thermal transition, the secondarystructure in solution seems to remain unchanged as monitoredby CD spectroscopy, while the presumably adsorbed proteinon the ATR may undergo an increase in the peak due tointermolecularâ-sheet.
Differential Scanning Calorimetry
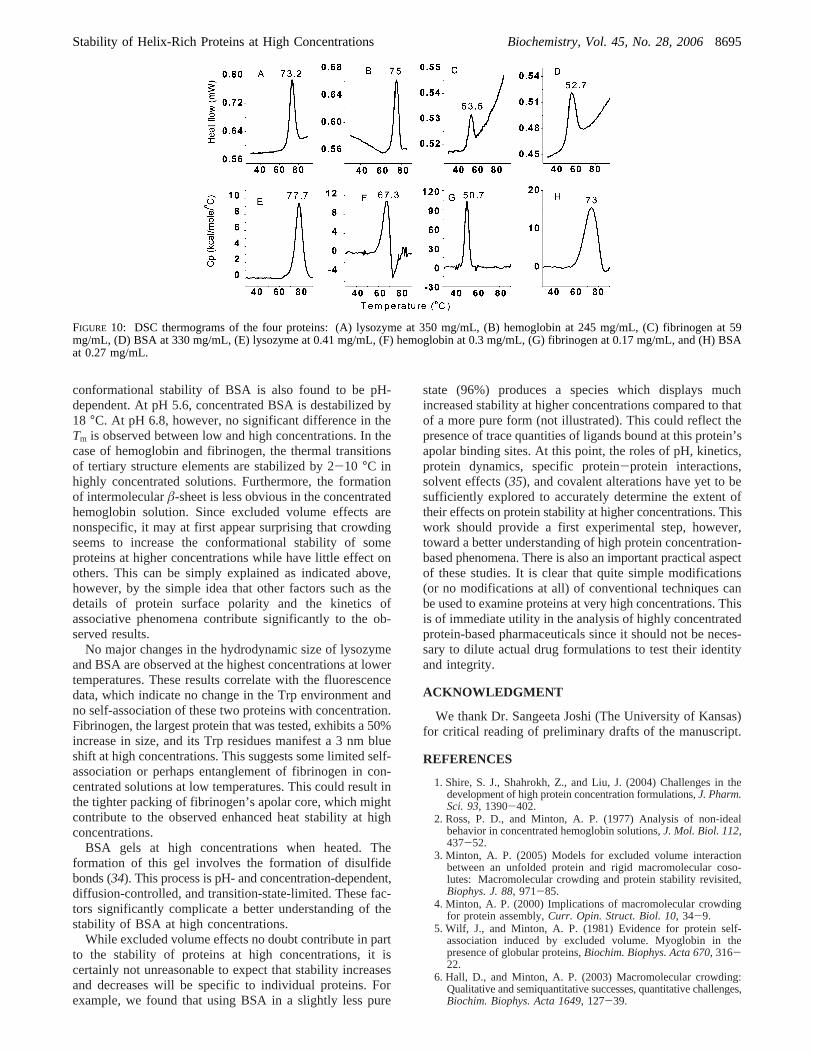
The thermal stability of the proteins at low and highconcentrations was directly investigated by DSC. Thedifferences in the observedTm values correlate well with thestructural changes seen in the spectroscopic measurements(Figure 10). At high concentrations, theTm values oflysozyme and BSA are decreased by 4.5 and 20°C,respectively, whereas the values for hemoglobin and fibrino-gen increased by 8 and 3°C, respectively.
Summary of the Transition Midpoints of the FourProteins
Transition midpoints of the four proteins monitored byDSC, UV absorbance, OD350, intrinsic fluorescence, and CDare summarized in Table 1. The lowest concentration usedin the FTIR experiments is significantly higher than that usedin other techniques, so the transition midpoints generated
from FTIR are not included here. As confirmed by most ofthe techniques, lysozyme and BSA are destabilized by 2-20°C while fibrinogen and hemoglobin are stabilized by 2-10°C at high concentrations. Values for BSA at higher pH (6.8,near that used for the other proteins) are also included forthe purposes of comparison. These results are quite differentfrom those seen at the lower pH with in most cases (exceptthe DSC measurements) much less destabilization observed.
DISCUSSION
The objective of these studies was to directly probe theeffect of protein concentration on the colloidal and confor-mational stability of proteins by adapting conventionalbiophysical techniques for use with highly concentratedsolutions. The impact of a high concentration on the colloidaland/or structural elements of protein stability has been asubject of speculation for some time, but little experimentalliterature is available that directly addresses this question.Thermal transition midpoints were obtained using variousspectroscopic and calorimetric techniques to better character-ize the various factors that determine protein stability at highconcentrations. Four representative helix-rich proteins(lysozyme, hemoglobin, fibrinogen, and BSA) were em-ployed for this purpose.
At 10 °C, both the secondary and tertiary structures appearsimilar if not identical for the four proteins over the entirerange of concentrations that was examined. When thetemperature is increased, however, the induced thermaltransitions occur at different temperatures with apparentlydistinct unfolding and aggregation processes.
When considering protein stability, it is useful to recognizeat least two different forms of this phenomenon in terms ofthe associative state of the particle (colloidal stability) andthe integrity of the native fold (conformational stability). Thehypothesis that these proteins undergo a reduction in volumethrough associative pathways is strongly supported byexcluded volume theory (4). Lysozyme at high concentrationsexhibits the predicted greater extent of aggregation uponheating. In contrast, fibrinogen demonstrates little effect dueto the concentration on the temperature at which turbidity isinitiated. Furthermore, hemoglobin is dramatically stabilizedagainst association at higher concentrations (∆Tm ∼ 10 °C).At pH 5.6, concentrated BSA gels at a much lowertemperature (∼15°C) than that at which precipitation appearsin dilute solution. At pH 6.8, concentrated BSA still gels,but in dilute solution, it does not aggregate over the entiretemperature range that was studied. This strongly suggeststhat other factors also affect the colloidal stability. Becauseexcluded volume theory is based on simple impenetrablemolecular models and proteins are dynamic entities withcomplex surfaces, it is possible that protein surface effectscould dominate excluded volume phenomena and could makesignificant contributions to colloidal stability. Although wehave not studied the effect of pH in any detail, it is clearfrom the examination of BSA at two pH values that thisvariable can have a substantial effect on the differentialcolloidal stability of proteins as a function of concentration.
The impact of high concentration on the intrinsic structuralstability of the proteins displays similar tendencies. Thethermal stability of the secondary structure of lysozyme isfound to decrease by 6°C at high concentrations. The
FIGURE 9: Ratio of absorbances as detected by ATR-FTIR of fourproteins as a function of temperature: lysozyme [(A) (9) 10 and(O) 400 mg/mL], fibrinogen [(B) (9) 11 and (O) 59 mg/mL], BSA[(C) (9) 12 and (O) 330 mg/mL], and hemoglobin [(D) (9) 8 and(O) 245 mg/mL]. The error bars represent the standard error (n )3). Error bars that are not visible are hidden within the symbol.
8694 Biochemistry, Vol. 45, No. 28, 2006 Guo et al.
conformational stability of BSA is also found to be pH-dependent. At pH 5.6, concentrated BSA is destabilized by18 °C. At pH 6.8, however, no significant difference in theTm is observed between low and high concentrations. In thecase of hemoglobin and fibrinogen, the thermal transitionsof tertiary structure elements are stabilized by 2-10 °C inhighly concentrated solutions. Furthermore, the formationof intermolecularâ-sheet is less obvious in the concentratedhemoglobin solution. Since excluded volume effects arenonspecific, it may at first appear surprising that crowdingseems to increase the conformational stability of someproteins at higher concentrations while have little effect onothers. This can be simply explained as indicated above,however, by the simple idea that other factors such as thedetails of protein surface polarity and the kinetics ofassociative phenomena contribute significantly to the ob-served results.
No major changes in the hydrodynamic size of lysozymeand BSA are observed at the highest concentrations at lowertemperatures. These results correlate with the fluorescencedata, which indicate no change in the Trp environment andno self-association of these two proteins with concentration.Fibrinogen, the largest protein that was tested, exhibits a 50%increase in size, and its Trp residues manifest a 3 nmblueshift at high concentrations. This suggests some limited self-association or perhaps entanglement of fibrinogen in con-centrated solutions at low temperatures. This could result inthe tighter packing of fibrinogen’s apolar core, which mightcontribute to the observed enhanced heat stability at highconcentrations.
BSA gels at high concentrations when heated. Theformation of this gel involves the formation of disulfidebonds (34). This process is pH- and concentration-dependent,diffusion-controlled, and transition-state-limited. These fac-tors significantly complicate a better understanding of thestability of BSA at high concentrations.
While excluded volume effects no doubt contribute in partto the stability of proteins at high concentrations, it iscertainly not unreasonable to expect that stability increasesand decreases will be specific to individual proteins. Forexample, we found that using BSA in a slightly less pure
state (96%) produces a species which displays muchincreased stability at higher concentrations compared to thatof a more pure form (not illustrated). This could reflect thepresence of trace quantities of ligands bound at this protein’sapolar binding sites. At this point, the roles of pH, kinetics,protein dynamics, specific protein-protein interactions,solvent effects (35), and covalent alterations have yet to besufficiently explored to accurately determine the extent oftheir effects on protein stability at higher concentrations. Thiswork should provide a first experimental step, however,toward a better understanding of high protein concentration-based phenomena. There is also an important practical aspectof these studies. It is clear that quite simple modifications(or no modifications at all) of conventional techniques canbe used to examine proteins at very high concentrations. Thisis of immediate utility in the analysis of highly concentratedprotein-based pharmaceuticals since it should not be neces-sary to dilute actual drug formulations to test their identityand integrity.
ACKNOWLEDGMENT
We thank Dr. Sangeeta Joshi (The University of Kansas)for critical reading of preliminary drafts of the manuscript.
REFERENCES
1. Shire, S. J., Shahrokh, Z., and Liu, J. (2004) Challenges in thedevelopment of high protein concentration formulations,J. Pharm.Sci. 93, 1390-402.
2. Ross, P. D., and Minton, A. P. (1977) Analysis of non-idealbehavior in concentrated hemoglobin solutions,J. Mol. Biol. 112,437-52.
3. Minton, A. P. (2005) Models for excluded volume interactionbetween an unfolded protein and rigid macromolecular coso-lutes: Macromolecular crowding and protein stability revisited,Biophys. J. 88, 971-85.
4. Minton, A. P. (2000) Implications of macromolecular crowdingfor protein assembly,Curr. Opin. Struct. Biol. 10, 34-9.
5. Wilf, J., and Minton, A. P. (1981) Evidence for protein self-association induced by excluded volume. Myoglobin in thepresence of globular proteins,Biochim. Biophys. Acta 670, 316-22.
6. Hall, D., and Minton, A. P. (2003) Macromolecular crowding:Qualitative and semiquantitative successes, quantitative challenges,Biochim. Biophys. Acta 1649, 127-39.
FIGURE 10: DSC thermograms of the four proteins: (A) lysozyme at 350 mg/mL, (B) hemoglobin at 245 mg/mL, (C) fibrinogen at 59mg/mL, (D) BSA at 330 mg/mL, (E) lysozyme at 0.41 mg/mL, (F) hemoglobin at 0.3 mg/mL, (G) fibrinogen at 0.17 mg/mL, and (H) BSAat 0.27 mg/mL.
Stability of Helix-Rich Proteins at High Concentrations Biochemistry, Vol. 45, No. 28, 20068695
7. Sasahara, K., McPhie, P., and Minton, A. P. (2003) Effect ofdextran on protein stability and conformation attributed tomacromolecular crowding,J. Mol. Biol. 326, 1227-37.
8. Hatters, D. M., Minton, A. P., and Howlett, G. J. (2002)Macromolecular crowding accelerates amyloid formation byhuman apolipoprotein C-II,J. Biol. Chem. 277, 7824-30.
9. Rivas, G., Fernandez, J. A., and Minton, A. P. (2001) Directobservation of the enhancement of noncooperative protein self-assembly by macromolecular crowding: Indefinite linear self-association of bacterial cell division protein FtsZ,Proc. Natl. Acad.Sci. U.S.A. 98, 3150-5.
10. Zimmerman, S. B., and Minton, A. P. (1993) Macromolecularcrowding: Biochemical, biophysical, and physiological conse-quences,Annu. ReV. Biophys. Biomol. Struct. 22, 27-65.
11. Minton, A. P., and Wilf, J. (1981) Effect of macromolecularcrowding upon the structure and function of an enzyme: Glyc-eraldehyde-3-phosphate dehydrogenase,Biochemistry 20, 4821-6.
12. Minton, A. P. (1997) Influence of excluded volume upon mac-romolecular structure and associations in ‘crowded’ media,Curr.Opin. Biotechnol. 8, 65-9.
13. Minton, A. P. (2000) Effect of a concentrated “inert” macromo-lecular cosolute on the stability of a globular protein with respectto denaturation by heat and by chaotropes: A statistical-thermodynamic model,Biophys. J. 78, 101-9.
14. Tokuriki, N., Kinjo, M., Negi, S., Hoshino, M., Goto, Y., Urabe,I., and Yomo, T. (2004) Protein folding by the effects ofmacromolecular crowding,Protein Sci. 13, 125-33.
15. Tellam, R. L., Sculley, M. J., Nichol, L. W., and Wills, P. R.(1983) The influence of poly(ethylene glycol) 6000 on theproperties of skeletal-muscle actin,Biochem. J. 213, 651-9.
16. Cole, N., and Ralston, G. B. (1994) Enhancement of self-association of human spectrin by polyethylene glycol,Int. J.Biochem. 26, 799-804.
17. Lindner, R., and Ralston, G. (1995) Effects of dextran on the self-association of human spectrin,Biophys. Chem. 57, 15-25.
18. Bryant, J. E., Lecomte, J. T., Lee, A. L., Young, G. B., and Pielak,G. J. (2005) Protein dynamics in living cells,Biochemistry 44,9275-9.
19. Wang, D., Kreutzer, U., Chung, Y., and Jue, T. (1997) Myoglobinand hemoglobin rotational diffusion in the cell,Biophys. J. 73,2764-70.
20. Nobbmann, U., Jones, S. W., and Ackerson, B. J. (1997) Multiple-Scattering Suppression: Cross Correlation with Tilted Single-Mode Fibers,Appl. Opt. 36, 7571-6.
21. Meyer, W. V., Cannell, D. S., Smart, A. E., Taylor, T. W., andTin, P. (1997) Multiple-Scattering Suppresison by Cross Correla-tion, Appl. Opt. 36, 7551-8.
22. Provencher, S. W. (1979) Inverse Problems in Polymer Charac-terization: Direct Analysis of Polydispersity with Photon Cor-relation Spectroscopy,Makromol. Chem. 180, 201-9.
23. Provencher, S. W. (1982) A Constrained Regularization Methodfor Inverting Data Represented By Linear Algebraic or IntegralEquations,Comput. Phys. Commun. 27, 229-42.
24. Provencher, S. W. (1982) Contin: A General Purpose ConstrainedRegularization Program for Inverting Noisy Linear Algebraic andIntegral Equations,Comput. Phys. Commun. 27, 229-42.
25. Armstrong, J. K., Wenby, R. B., Meiselman, H. J., and Fisher, T.C. (2004) The hydrodynamic radii of macromolecules and theireffect on red blood cell aggregation,Biophys. J. 87, 4259-70.
26. Liu, W., Cellmer, T., Keerl, D., Prausnitz, J. M., and Blanch, H.W. (2005) Interactions of lysozyme in guanidinium chloridesolutions from static and dynamic light-scattering measurements,Biotechnol. Bioeng. 90, 482-90.
27. Kueltzo, L. A., Ersoy, B., Ralston, J. P., and Middaugh, C. R.(2003) Derivative absorbance spectroscopy and protein phasediagrams as tools for comprehensive protein characterization: AbGCSF case study,J. Pharm. Sci. 92, 1805-20.
28. Abugo, O. O., Nair, R., and Lakowicz, J. R. (2000) Fluorescenceproperties of rhodamine 800 in whole blood and plasma,Anal.Biochem. 279, 142-50.
29. Eisenger, J., and Flores, J. (1979) Front-face fluorometry of liquidsamples,Anal. Biochem. 94, 15-21.
30. Kueltzo, L. A., and Middaugh, C. R. (2003) Structural character-ization of bovine granulocyte colony stimulating factor: Effectof temperature and pH,J. Pharm. Sci. 92, 1793-804.
31. Vivian, J. T., and Callis, P. R. (2001) Mechanisms of tryptophanfluorescence shifts in proteins,Biophys. J. 80, 2093-109.
32. Lakowicz, J. R. (1999)Principles of fluorescence spectroscopy,2nd ed., Kluwer Academic/Plenum Publishers, New York.
33. Schwinte, P., Voegel, J. C., Picart, C., Haikel, Y., Schaaf, P., andSzalontai, B. (2001) Stabilizing effects of various polyelectrolytemultilayer films on the structure of adsorbed/embedded fibrinogenmolecules: An ATR-FTIR study,J. Phys. Chem. B 105, 11906-16.
34. Vaiana, S. M., Emanuele, A., Palma-Vittorelli, M. B., and Palma,M. U. (2004) Irreversible formation of intermediate BSA oligo-mers requires and induces conformational changes,Proteins 55,1053-62.
35. Sorin, E. J., and Pande, V. S. (2006) Nanotube confinementdenatures protein helices,J. Am. Chem. Soc. 128, 6316-7.
BI060525P
8696 Biochemistry, Vol. 45, No. 28, 2006 Guo et al.


![Tomato R2R3-MYB Proteins SlANT1 and SlAN2: Same Protein ...€¦ · R2R3-MYB family, including P.hybridaAN2(PhAN2) [5],twodifferentbasichelix-loop-helix (bHLH) proteins,P.hybridaAN1(PhAN1)[6]and](https://img.pdfslide.us/doc/110x75/601257a21c17c501452fed45/tomato-r2r3-myb-proteins-slant1-and-slan2-same-protein-r2r3-myb-family-including.jpg)