Embed Size (px)
Citation preview
RESEARCH Open Access
Stability indicating thin-layerchromatographic method for estimation ofantidiabetic drug Remogliflozin etabonateDimal A. Shah1* , Ishita I. Gondalia1, Vandana B. Patel1, Ashok Mahajan1, Usmangani Chhalotiya2 andDhruti C. Nagda3
Abstract
Background: A sensitive, precise, and stability-indicating high-performance thin-layer chromatographic (HPTLC)method has been developed for the analysis of Remogliflozin etabonate in tablet formulation. HPTLC platesprecoated with silica gel 60 F254 were used as the stationary phase; methanol: ethyl acetate: toluene: NH3 (2:4:4:0.1,v/v/v) was used as mobile phase, and densitometry was used for the quantitative estimation of the drug. Theproposed method was validated with respect to linearity, accuracy, precision, and robustness and applied for theestimation of drug in tablet dosage form.
Results: The Rf value of Remogliflozin etabonate was observed to be 0.61. The densitometric estimation wasperformed in reflectance mode at 229 nm. The method was found to be linear in the range of 500–8000 ng/bandfor Remogliflozin etabonate. The possible degradation pathway was estimated by performing forced degradationstudies. The degradant peaks were well resolved from the drug peak with acceptable resolution in their Rf value.
Conclusion: An accurate and precise high-performance thin-layer chromatographic method has been developedfor the quantification of Remogliflozin etabonate in tablets. Forced degradation studies were performed, and drugwas found to be highly susceptible to acid, base hydrolysis, and oxidative stress degradation and gets convertedinto active drug Remogliflozin. Both Remogliflozin etabonate and Remogliflozin bands were well resolved. Themethod was applied for the analysis of drug in tablet formulation, and it can be used for routine quality controlanalysis, as well as for the analysis of stability samples.
Keywords: Remogliflozin etabonate, HPTLC, Validation, Forced degradation studies
© The Author(s). 2021 Open Access This article is licensed under a Creative Commons Attribution 4.0 International License,which permits use, sharing, adaptation, distribution and reproduction in any medium or format, as long as you giveappropriate credit to the original author(s) and the source, provide a link to the Creative Commons licence, and indicate ifchanges were made. The images or other third party material in this article are included in the article's Creative Commonslicence, unless indicated otherwise in a credit line to the material. If material is not included in the article's Creative Commonslicence and your intended use is not permitted by statutory regulation or exceeds the permitted use, you will need to obtainpermission directly from the copyright holder. To view a copy of this licence, visit http://creativecommons.org/licenses/by/4.0/.
* Correspondence: [email protected] Institute of Pharmacy, BITS Edu Campus, Vadodara-Mumbai NH#8,Varnama, Vadodara, Gujarat 391240, IndiaFull list of author information is available at the end of the article
Future Journal ofPharmaceutical Sciences
Shah et al. Future Journal of Pharmaceutical Sciences (2021) 7:83 https://doi.org/10.1186/s43094-021-00230-6
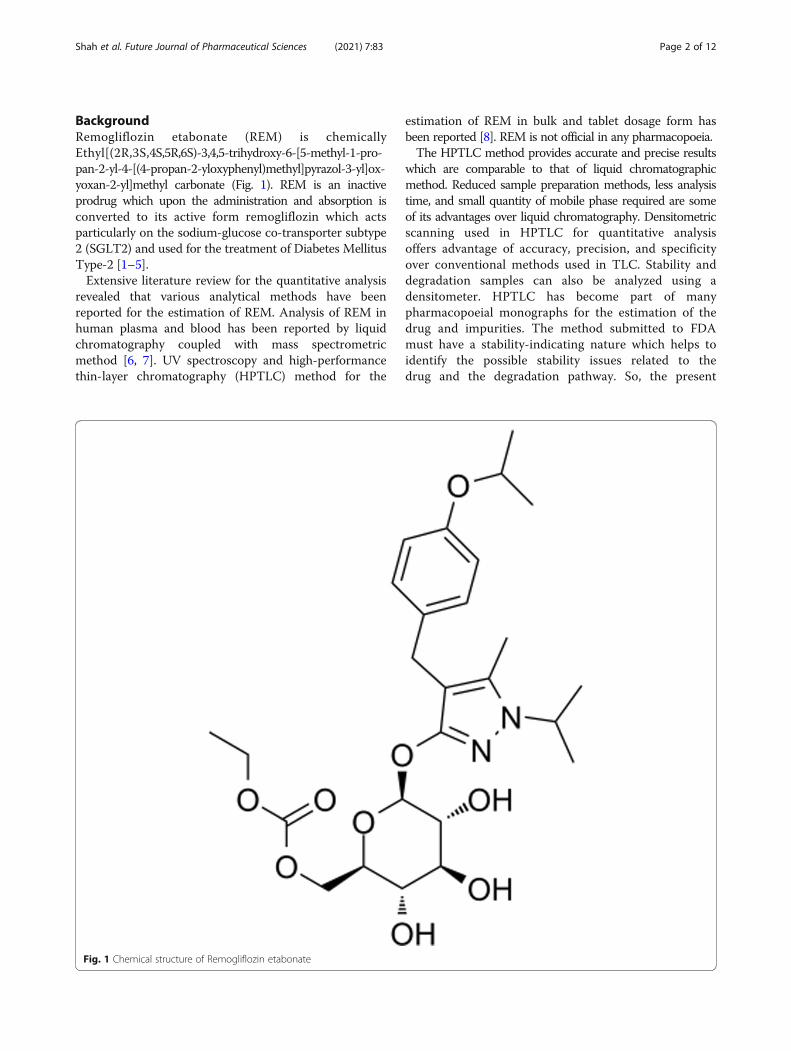
BackgroundRemogliflozin etabonate (REM) is chemicallyEthyl[(2R,3S,4S,5R,6S)-3,4,5-trihydroxy-6-[5-methyl-1-pro-pan-2-yl-4-[(4-propan-2-yloxyphenyl)methyl]pyrazol-3-yl]ox-yoxan-2-yl]methyl carbonate (Fig. 1). REM is an inactiveprodrug which upon the administration and absorption isconverted to its active form remogliflozin which actsparticularly on the sodium-glucose co-transporter subtype2 (SGLT2) and used for the treatment of Diabetes MellitusType-2 [1–5].Extensive literature review for the quantitative analysis
revealed that various analytical methods have beenreported for the estimation of REM. Analysis of REM inhuman plasma and blood has been reported by liquidchromatography coupled with mass spectrometricmethod [6, 7]. UV spectroscopy and high-performancethin-layer chromatography (HPTLC) method for the
estimation of REM in bulk and tablet dosage form hasbeen reported [8]. REM is not official in any pharmacopoeia.The HPTLC method provides accurate and precise results
which are comparable to that of liquid chromatographicmethod. Reduced sample preparation methods, less analysistime, and small quantity of mobile phase required are someof its advantages over liquid chromatography. Densitometricscanning used in HPTLC for quantitative analysisoffers advantage of accuracy, precision, and specificityover conventional methods used in TLC. Stability anddegradation samples can also be analyzed using adensitometer. HPTLC has become part of manypharmacopoeial monographs for the estimation of thedrug and impurities. The method submitted to FDAmust have a stability-indicating nature which helps toidentify the possible stability issues related to thedrug and the degradation pathway. So, the present
Fig. 1 Chemical structure of Remogliflozin etabonate
Shah et al. Future Journal of Pharmaceutical Sciences (2021) 7:83 Page 2 of 12
study involves development and validation of thestability-indicating high-performance thin-layer chro-matographic method for the estimation of REM intablet formulation.
MethodsHPTLC instrumentsCAMAG (Muttenz, Switzerland) HPTLC instrumentcontaining Linomat V sample applicator was used forthe study (Hamilton, Bonadauz, Switzerland). AluminumHPTLC plates (10 cm × 10 cm), precoated with silica gelF254 were used as stationary phase (E. Merck, Darmstadt,Germany; supplied by Anchrom Technologists, Mumbai,India). Densitometric scanning of developed densitogramswere performed using Camag TLC scanner. Shimadzuelectronic balance was used for weighing drugs andchemicals (AX 200, Shimadzu Corp., Japan).
Chemicals and reagentsAnalytically pure REM (99.23% w/w as per the certificateof analysis provided by company) was obtained as giftsample from Reputed Pharmaceutical company. Metha-nol (HPLC grade) was procured from Avantor Perform-ance Materials India Ltd.; Ethyl acetate (AR grade) andtoluene (HPLC grade) were procured from Loba ChemiePvt. Ltd., and Ammonia solution (25%) was purchasedfrom Aatur Instru Chem. Pvt. Ltd., India. Marketedformulation with a brand name Remo-Zen (each film-coated tablet contains Remogliflozin etabonate 100 mgby Glenmark Pharmaceuticals Ltd., Mumbai, India) wasprocured from the local pharmacist.
Chromatographic systemSample applicationStandard and formulation samples of REM were appliedon stationary phase (precoated plates containing silicagel F254 ) in the form of narrow band (6 mm) with thehelp of sample applicator and distance of 9 mm was keptbetween two bands. The bands were applied using con-tinuous drying stream of nitrogen gas.
Mobile phase and developmentLinear ascending chromatographic development wasperformed using mobile phase methanol: ethyl acetate:toluene: NH3 (2:4:4:0.1, v/v/v). The development wascarried out in twin-trough glass chamber previouslyequilibrated with the mobile phase for 30 min. The mo-bile phase was allowed to migrate a distance of 80 mm,and after development, plates were removed and dried.
Densitometric analysisThe developed TLC plates were scanned in the reflect-ance mode using winCATS software. The light sourceused was deuterium lamp, and bands were scanned at
229 nm. The dimension of the slit was 5 mm in lengthand 0.45 mm in width. Peak area and peak height datawere obtained for each developed band, and regressionequation was developed by plotting peak areas versusconcentration.
Preparation of standard stock solutionREM (10 mg) was weighed accurately and transferred to10-mL volumetric flasks and dissolved in a few milliliterof methanol and sonicated for 5 min. Solution wasdiluted up to the mark with methanol which gave aconcentration of 1000 μg/mL. The above solution wasfurther diluted in another volumetric flask to obtain aworking standard of 500 μg/mL REM.
ValidationInternational Conference on Harmonization (ICH) pub-lished a guideline Q2 (R1) for the validation of analyticalmethod [9]. The developed method was validated withrespect to linearity, accuracy, precision, specificity, androbustness.
Linearity of calibration curvesLinearity of the method was studied by plotting calibra-tion curves over a range of 500–8000 ng/band. Peak areaversus concentration data were used to plot calibrationcurve (n = 6).
AccuracyThe accuracy is the closeness of test result to the truevalue. To perform accuracy, recovery studies werecarried out. Known amount of REM was spiked at threeconcentration levels (50, 100, and 150%) to a prequantified formulation. The solutions were diluted andanalyzed by developing densitograms using optimizedchromatographic conditions. The peak area was noted,and the amount of REM was estimated with the help ofregression equation.
Intermediate precisionIntermediate precision study was performed usingintraday and interday precisions. Intraday precision wascarried out by estimating drug solutions of REM (500,4000, 8000 ng/band) at three levels covering low,medium, and high concentrations of the calibrationcurve. The study was performed three times on the sameday. Inter-day precision was determined by estimatingdrug solutions of REM (500, 4000, 8000 ng/band) atthree levels covering low, medium, and high concentra-tions, and the study was conducted for 3 days. Developeddensitograms were analyzed, peak area was obtained, andvariability of data was calculated in terms of percentage ofrelative standard deviation (%RSD).
Shah et al. Future Journal of Pharmaceutical Sciences (2021) 7:83 Page 3 of 12
RepeatabilityRepeatability of the method was assessed by applyingband of REM (4000 ng/band) six times on an HPTLCplate. The plates were developed, and peak areas weredetermined. To study the scanner repeatability, the samespot was scanned six times, peak area was determined,and variability in the result was analyzed.
SpecificityTo check the interference of impurities, degradants, andmatrix in the estimation of drug, specificity study wasperformed by preparing synthetic mixture. Syntheticmixture was prepared using formula REM (30%), Talc10%, microcrystalline cellulose 20%, Starch 20%, andLactose 20% [10–12]. Synthetic mixture was analyzed forthe drug using the optimized chromatographic method,and interference due to exipients were noted.
SensitivityThe lowest amount of analyte that can be detected in amethod is called limit of detection (LOD), and the lowestamount of anlayte that can be quantified is called limit ofquantification (LOQ). LOD and LOQ were calculatedusing the following equation as per ICH guidelines.
LOD ¼ 3:3� σ=S
LOQ ¼ 10� σ=S
where σ is the standard deviation of y-intercepts of re-gression lines, and S is the slope of the calibration curve.
RobustnessSmall deliberate changes were introduced in the methodto assess the robustness of the method. Changes inmobile phase ratio and chamber saturation time wereintroduced, and the effects on densitogram wereanalyzed. The study was performed triplicate and %RSDwas calculated.
Forced degradation studyTo find out the intrinsic stability of the drug moleculeand possible degradation pathway, forced degradationstudies were performed as per ICH guideline Q1A (R2)and Q1B using different stress conditions [13, 14]. Stressstudies were performed using acid and base hydrolysis,oxidative hydrolysis, thermal degradation, and UV lightexposure conditions.
Alkali hydrolysisTo perform base hydrolysis, 2 mL stock solution (500μg/mL) of REM was taken in 10 mL volumetric flasks,and 2.5 mL of 0.1N NaOH was added to it. Solution waskept at room temperature for 30 min, neutralized anddiluted with methanol up to the mark. The solution wasanalyzed and developed; densitogram showed completedegradation of REM. Hence, the same study was re-peated by keeping solution for 5 min. The solution wasneutralized and diluted up to the mark with methanol.
Acid hydrolysisTo perform acid hydrolysis, 2 mL of stock solution of REM(500 μg/mL) was taken in 10-mL volumetric flasks, and 2.5
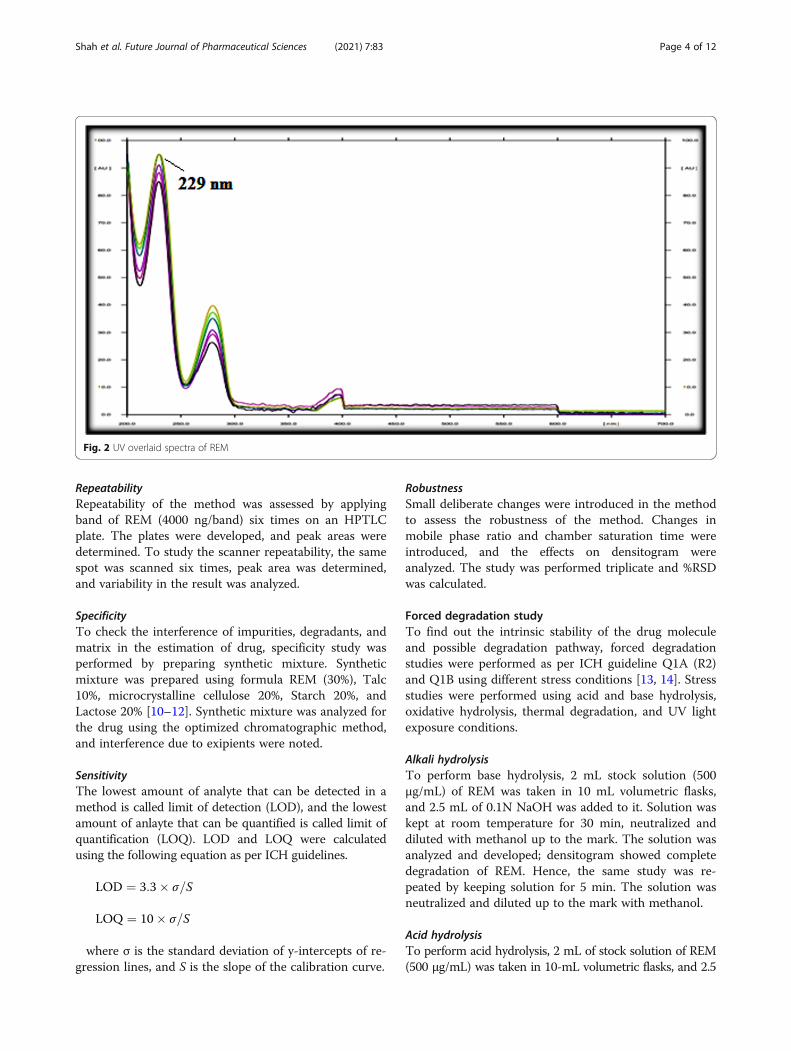
Fig. 2 UV overlaid spectra of REM
Shah et al. Future Journal of Pharmaceutical Sciences (2021) 7:83 Page 4 of 12
mL of 0.1N HCl was added. Then the mixture was heatedin a water bath at 70 °C for 30 min and allowed to cool toroom temperature. The solution was neutralized with 0.1 NNaOH, and it was diluted up to the mark with methanol.
Oxidative stress degradationTo perform oxidative stress degradation, 2 mL stocksolution (500 μg/mL) of REM was taken in 10-mLvolumetric flasks, and 2.5 mL of 3% hydrogen peroxidewas added. Then the mixture was heated in a water bathat 70 °C for 30 min and allowed to cool to roomtemperature and diluted up to the mark with methanol.
Thermal degradationTo perform dry heat degradation study, pure drugsamples of REM was exposed in the oven at 70 °C for 2h. It was cooled, and drug was weighed (10 mg) and
transferred to 10-mL volumetric flask. It was dissolvedand diluted up to the mark using methanol.
Photo degradationAnalytically pure samples of REM were exposed to UVlight for 24 h. A 10 mg of drug was weighed and trans-ferred to a 10-mL volumetric flask. It was dissolved anddiluted up to the mark using methanol.All the reaction solutions were applied using applica-
tor microliter syringe on TLC plates. Plates were devel-oped using optimized chromatographic conditions, anddensitograms were recorded.
Solution stabilityThe stock solutions of REM was stored at room temperaturefor 24 h and analyzed at 0, 4-, 8-, and 24-h intervals.
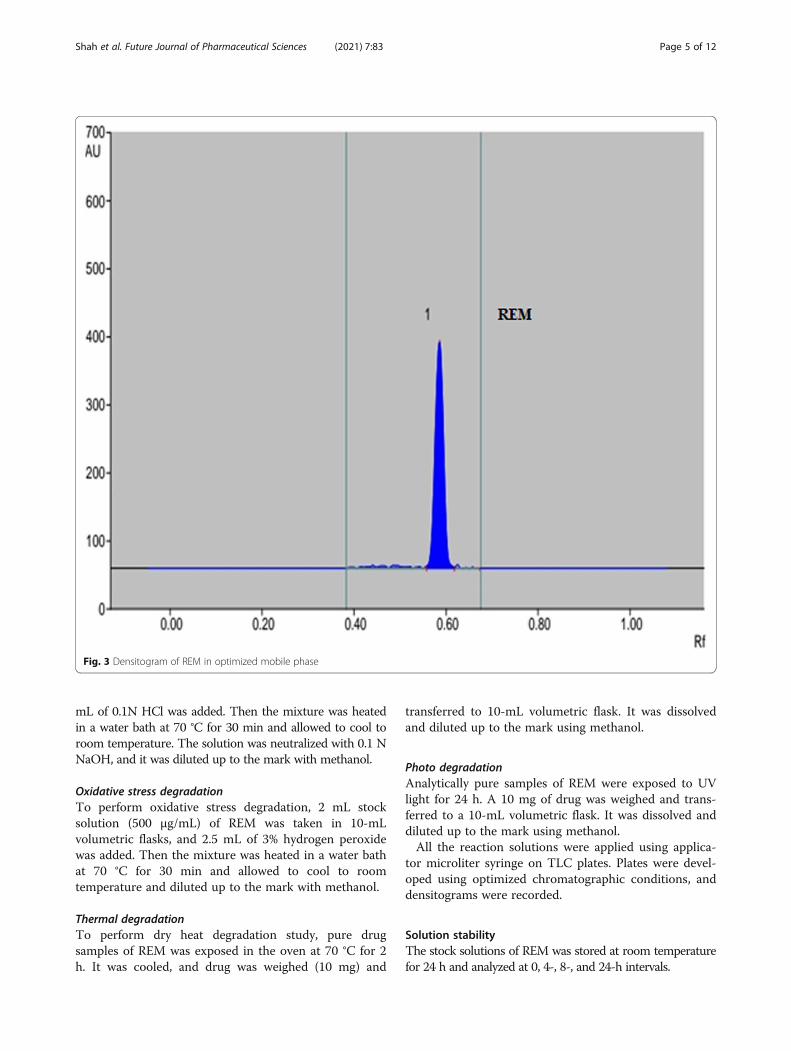
Fig. 3 Densitogram of REM in optimized mobile phase
Shah et al. Future Journal of Pharmaceutical Sciences (2021) 7:83 Page 5 of 12
Analysis of marketed formulationTwenty tablets were weighed and powdered. The powderequivalent to the 25 mg of REM was weighed and trans-ferred to the 50-mL volumetric flask. A small amount of(10 mL) methanol was added to the above volumetric flaskand sonicated for 10 min. The solution was filtered usingWhatman filter paper No. 45, and the volume was madeup to the mark with methanol (500 μg/mL).Using a sample applicator, 8 μl of sample was
applied on the stationary phase which gave 4000 ng/band concentration of REM. The stationary phaseplates were developed as per optimized chromato-graphic conditions and scanned. The areas were
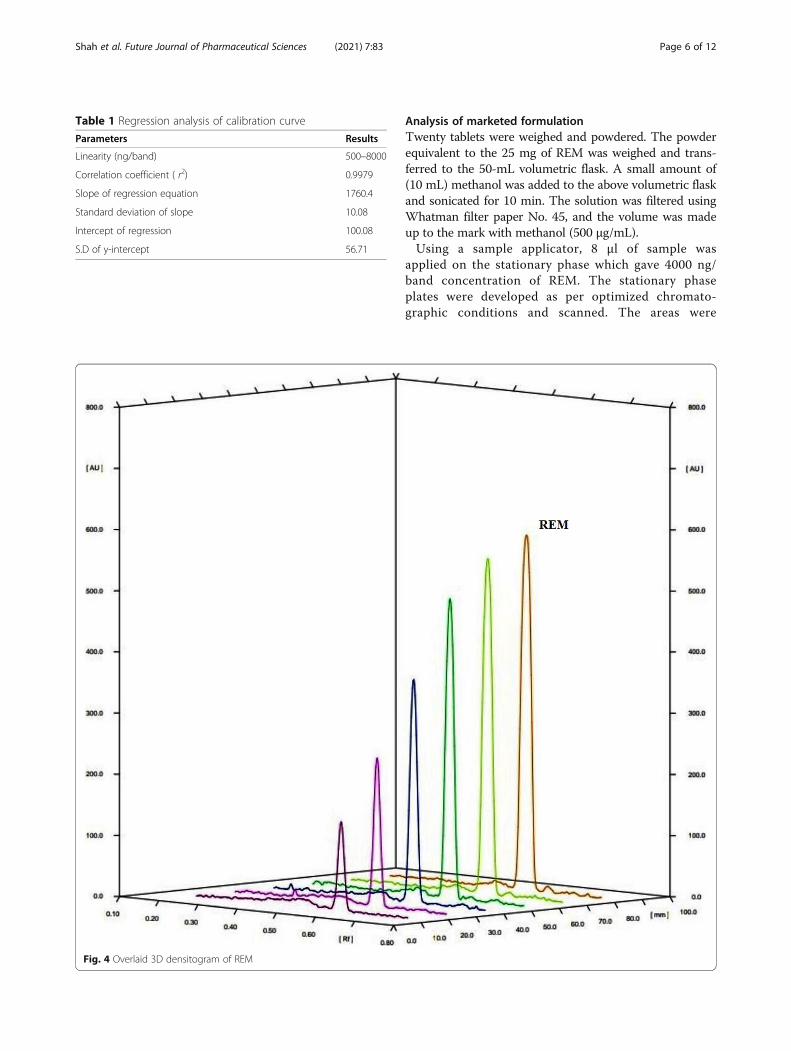
Fig. 4 Overlaid 3D densitogram of REM
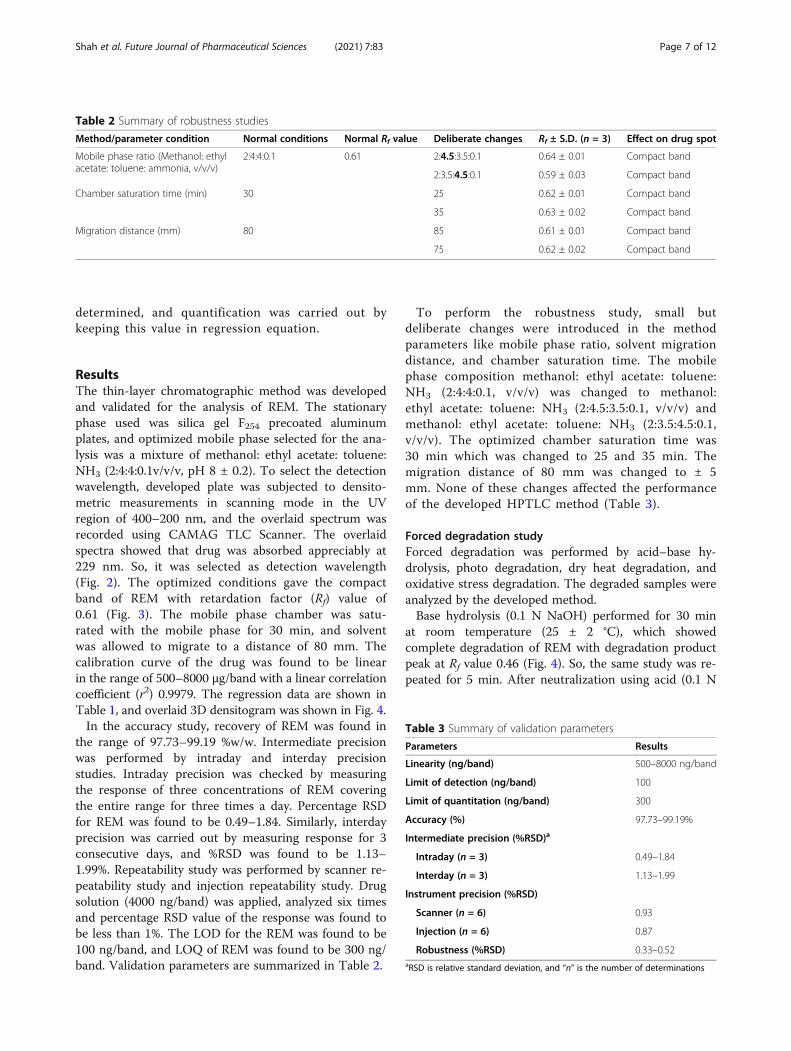
Table 1 Regression analysis of calibration curve
Parameters Results
Linearity (ng/band) 500–8000
Correlation coefficient ( r2) 0.9979
Slope of regression equation 1760.4
Standard deviation of slope 10.08
Intercept of regression 100.08
S.D of y-intercept 56.71
Shah et al. Future Journal of Pharmaceutical Sciences (2021) 7:83 Page 6 of 12
determined, and quantification was carried out bykeeping this value in regression equation.
ResultsThe thin-layer chromatographic method was developedand validated for the analysis of REM. The stationaryphase used was silica gel F254 precoated aluminumplates, and optimized mobile phase selected for the ana-lysis was a mixture of methanol: ethyl acetate: toluene:NH3 (2:4:4:0.1v/v/v, pH 8 ± 0.2). To select the detectionwavelength, developed plate was subjected to densito-metric measurements in scanning mode in the UVregion of 400–200 nm, and the overlaid spectrum wasrecorded using CAMAG TLC Scanner. The overlaidspectra showed that drug was absorbed appreciably at229 nm. So, it was selected as detection wavelength(Fig. 2). The optimized conditions gave the compactband of REM with retardation factor (Rf) value of0.61 (Fig. 3). The mobile phase chamber was satu-rated with the mobile phase for 30 min, and solventwas allowed to migrate to a distance of 80 mm. Thecalibration curve of the drug was found to be linearin the range of 500–8000 μg/band with a linear correlationcoefficient (r2) 0.9979. The regression data are shown inTable 1, and overlaid 3D densitogram was shown in Fig. 4.In the accuracy study, recovery of REM was found in
the range of 97.73–99.19 %w/w. Intermediate precisionwas performed by intraday and interday precisionstudies. Intraday precision was checked by measuringthe response of three concentrations of REM coveringthe entire range for three times a day. Percentage RSDfor REM was found to be 0.49–1.84. Similarly, interdayprecision was carried out by measuring response for 3consecutive days, and %RSD was found to be 1.13–1.99%. Repeatability study was performed by scanner re-peatability study and injection repeatability study. Drugsolution (4000 ng/band) was applied, analyzed six timesand percentage RSD value of the response was found tobe less than 1%. The LOD for the REM was found to be100 ng/band, and LOQ of REM was found to be 300 ng/band. Validation parameters are summarized in Table 2.
To perform the robustness study, small butdeliberate changes were introduced in the methodparameters like mobile phase ratio, solvent migrationdistance, and chamber saturation time. The mobilephase composition methanol: ethyl acetate: toluene:NH3 (2:4:4:0.1, v/v/v) was changed to methanol:ethyl acetate: toluene: NH3 (2:4.5:3.5:0.1, v/v/v) andmethanol: ethyl acetate: toluene: NH3 (2:3.5:4.5:0.1,v/v/v). The optimized chamber saturation time was30 min which was changed to 25 and 35 min. Themigration distance of 80 mm was changed to ± 5mm. None of these changes affected the performanceof the developed HPTLC method (Table 3).
Forced degradation studyForced degradation was performed by acid–base hy-drolysis, photo degradation, dry heat degradation, andoxidative stress degradation. The degraded samples wereanalyzed by the developed method.Base hydrolysis (0.1 N NaOH) performed for 30 min
at room temperature (25 ± 2 °C), which showedcomplete degradation of REM with degradation productpeak at Rf value 0.46 (Fig. 4). So, the same study was re-peated for 5 min. After neutralization using acid (0.1 N
Table 3 Summary of validation parameters
Parameters Results
Linearity (ng/band) 500–8000 ng/band
Limit of detection (ng/band) 100
Limit of quantitation (ng/band) 300
Accuracy (%) 97.73–99.19%
Intermediate precision (%RSD)a
Intraday (n = 3) 0.49–1.84
Interday (n = 3) 1.13–1.99
Instrument precision (%RSD)
Scanner (n = 6) 0.93
Injection (n = 6) 0.87
Robustness (%RSD) 0.33–0.52aRSD is relative standard deviation, and “n” is the number of determinations
Table 2 Summary of robustness studies
Method/parameter condition Normal conditions Normal Rf value Deliberate changes Rf ± S.D. (n = 3) Effect on drug spot
Mobile phase ratio (Methanol: ethylacetate: toluene: ammonia, v/v/v)
2:4:4:0.1 0.61 2:4.5:3.5:0.1 0.64 ± 0.01 Compact band
2:3.5:4.5:0.1 0.59 ± 0.03 Compact band
Chamber saturation time (min) 30 25 0.62 ± 0.01 Compact band
35 0.63 ± 0.02 Compact band
Migration distance (mm) 80 85 0.61 ± 0.01 Compact band
75 0.62 ± 0.02 Compact band
Shah et al. Future Journal of Pharmaceutical Sciences (2021) 7:83 Page 7 of 12
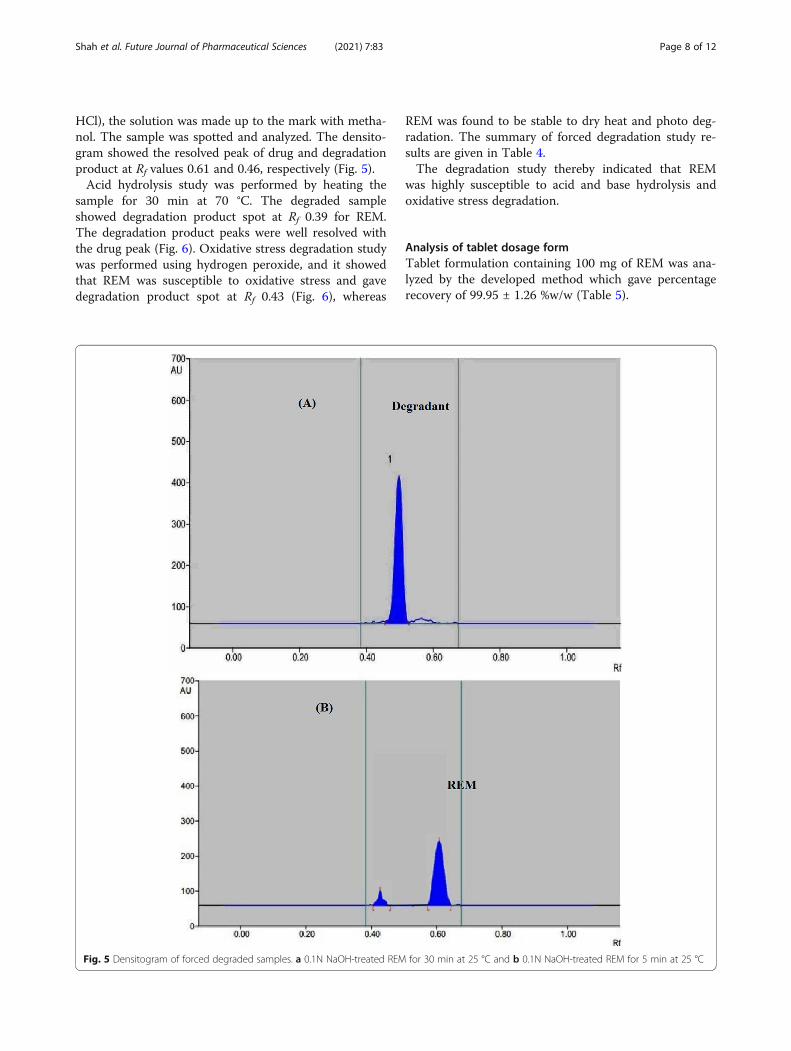
HCl), the solution was made up to the mark with metha-nol. The sample was spotted and analyzed. The densito-gram showed the resolved peak of drug and degradationproduct at Rf values 0.61 and 0.46, respectively (Fig. 5).Acid hydrolysis study was performed by heating the
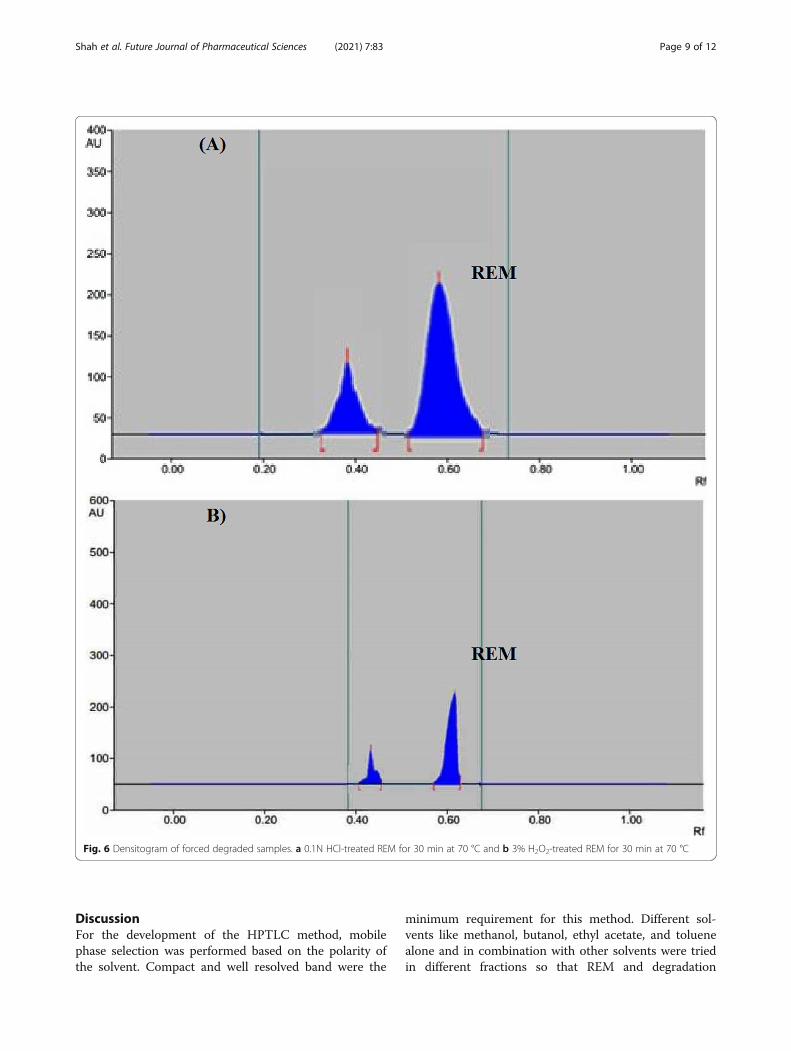
sample for 30 min at 70 °C. The degraded sampleshowed degradation product spot at Rf 0.39 for REM.The degradation product peaks were well resolved withthe drug peak (Fig. 6). Oxidative stress degradation studywas performed using hydrogen peroxide, and it showedthat REM was susceptible to oxidative stress and gavedegradation product spot at Rf 0.43 (Fig. 6), whereas
REM was found to be stable to dry heat and photo deg-radation. The summary of forced degradation study re-sults are given in Table 4.The degradation study thereby indicated that REM
was highly susceptible to acid and base hydrolysis andoxidative stress degradation.
Analysis of tablet dosage formTablet formulation containing 100 mg of REM was ana-lyzed by the developed method which gave percentagerecovery of 99.95 ± 1.26 %w/w (Table 5).
Fig. 5 Densitogram of forced degraded samples. a 0.1N NaOH-treated REM for 30 min at 25 °C and b 0.1N NaOH-treated REM for 5 min at 25 °C
Shah et al. Future Journal of Pharmaceutical Sciences (2021) 7:83 Page 8 of 12
DiscussionFor the development of the HPTLC method, mobilephase selection was performed based on the polarity ofthe solvent. Compact and well resolved band were the
minimum requirement for this method. Different sol-vents like methanol, butanol, ethyl acetate, and toluenealone and in combination with other solvents were triedin different fractions so that REM and degradation
Fig. 6 Densitogram of forced degraded samples. a 0.1N HCl-treated REM for 30 min at 70 °C and b 3% H2O2-treated REM for 30 min at 70 °C
Shah et al. Future Journal of Pharmaceutical Sciences (2021) 7:83 Page 9 of 12
products can be well resolved. Mobile phases like metha-nol, isopropyl alcohol, toluene, hexane, methanol: ethylacetate, methanol: toluene, and methanol: toluene: ethylacetate in different proportions were tried which gave atailed spot. A mixture of methanol: ethyl acetate: tolu-ene: NH3 (2:4:4:0.1 v/v/v, pH 8 ± 0.2) was selected andoptimized as mobile phase which gave a compact bandof REM with an Rf value of 0.61.The method showed linearity in the range of 500–
8000 μg/band, and the regression data shows good linearrelationship over the concentration range studied, dem-onstrating the suitability of the method for analysis. Theresults of the accuracy studies were near to the truevalue (100%) which indicates that the method is accur-ate. The method was found to be precise as the % RSDfor the intermediate precision was found to be less than2%, and for repeatability, it was found to be less than1%. The low LOQ value indicates the sensitivity ofmethod, and nanogram quantity of drug can be esti-mated accurately and precisely. The method was foundto be robust and none of the deliberate changes affectedthe method’s performance.Forced degradation studies were carried out to find
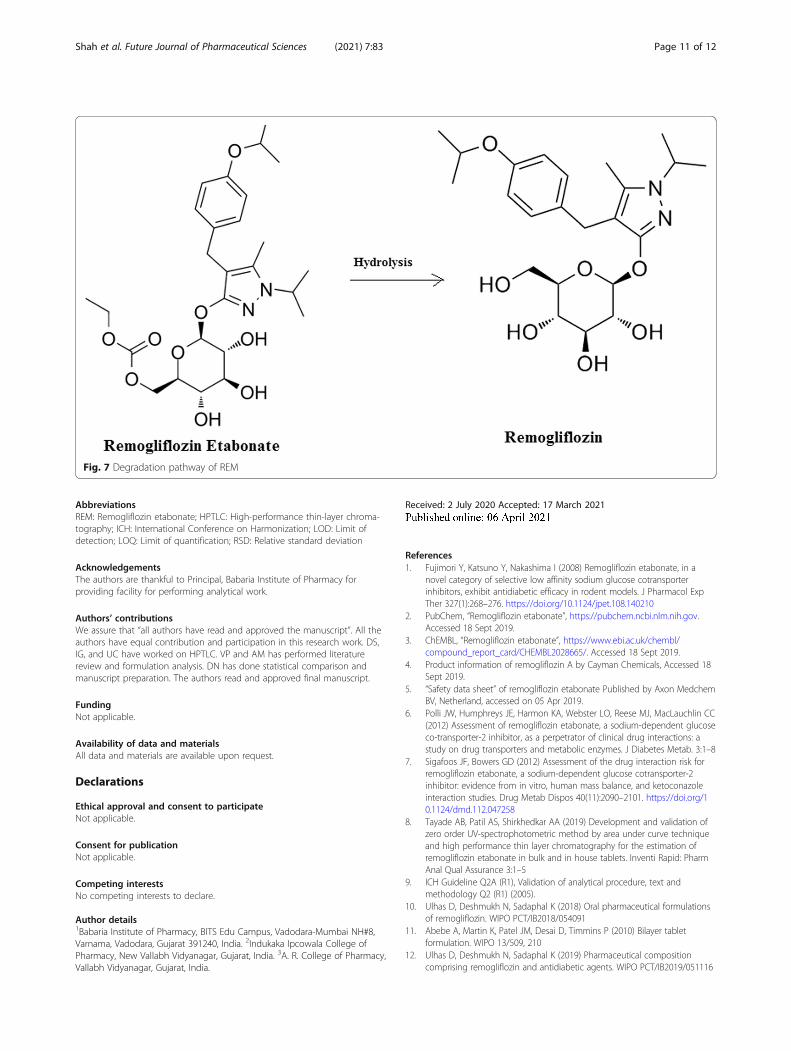
out a likely degradation pathway. The degradation studyindicated that REM was highly susceptible to acid andbase hydrolysis and oxidative stress degradation. Remo-gliflozin etabonate undergoes extensive ester hydrolysisin the presence of acid, base, and hydrogen peroxide andgets converted into an active drug Remogliflozin with Rf
value of 0.45. HPTLC is not an adequate method to con-firm the structure of degradants. Other methods likemass spectroscopy and NMR should be used to provethat the degradation product is remogliflozin. The
degradation pathway is depicted in Fig. 7. Dry heat andphoto degradation was performed using the powderform of the drug instead of stock solution which is alimitation of this method. The drug was stable to dryheat and photolytic degradation conditions used in themethod. Degradation products did not affect the quanti-fication of the drug.
ConclusionAccurate and precise thin-layer chromatographicmethod has been developed and validated for the esti-mation of REM. The method was developed usingmobile phase methanol: ethyl acetate: toluene: NH3
(2:4:4:0.1, v/v/v). The Rf value of the drug was 0.61,and the method was linear in the range of 500–8000ng/band. The method was validated in accordancewith ICH guidelines Q2 (R1). Forced degradationstudies were carried out, and the drug was found tobe highly susceptible to acid–base hydrolysis and oxi-dative stress degradation and gets converted into theactive drug Remogliflozin. Both REM and Remogliflo-zin spots were well resolved. Compared with the re-ported HPTLC method [8], the developed method ismore sensitive and has a stability-indicating nature.The range for the developed method starts from 500ng/band, while for reported method, range starts from1500 ng/band. The assay results of both the methodswere statistically compared using F test. No statisti-cally significant difference was observed at 95% confi-dence interval. The method can be used for routinequality control evaluation of bulk drug and formula-tion, as well as for the analysis of stability samples.
Table 5 Analysis of tablet dosage form
Amount of drugapplied (ng/band)a
Amount of drugfound (ng/band)
% Amount of drug ±S.D. (n = 3)
4000 3998.12 99.95 ± 1.26a Each film-coated tablet contains Remogliflozin etabonate 100 mg
Table 4 Forced degradation studies
Type of degradation Stress condition Time Percentage amountof drug (%)
Rf values ofdegradationproduct
Base degradation 0.1 N NaOH, 25 °C 30 min 0 0.46
Base degradation 0.1 N NaOH, 25 °C 5 min 75.45 0.46
Acid degradation 0.1 N HCl, 70 °C 30 min 64.84 0.39
Oxidative stress degradation 3% H2O2, 70 °C 30 min 81.08 0.43
Dry heat degradation 70 °C 2 h 98.62 -
Photolytic degradation UV light 24 h 99.03 -
Shah et al. Future Journal of Pharmaceutical Sciences (2021) 7:83 Page 10 of 12
AbbreviationsREM: Remogliflozin etabonate; HPTLC: High-performance thin-layer chroma-tography; ICH: International Conference on Harmonization; LOD: Limit ofdetection; LOQ: Limit of quantification; RSD: Relative standard deviation
AcknowledgementsThe authors are thankful to Principal, Babaria Institute of Pharmacy forproviding facility for performing analytical work.
Authors’ contributionsWe assure that “all authors have read and approved the manuscript”. All theauthors have equal contribution and participation in this research work. DS,IG, and UC have worked on HPTLC. VP and AM has performed literaturereview and formulation analysis. DN has done statistical comparison andmanuscript preparation. The authors read and approved final manuscript.
FundingNot applicable.
Availability of data and materialsAll data and materials are available upon request.
Declarations
Ethical approval and consent to participateNot applicable.
Consent for publicationNot applicable.
Competing interestsNo competing interests to declare.
Author details1Babaria Institute of Pharmacy, BITS Edu Campus, Vadodara-Mumbai NH#8,Varnama, Vadodara, Gujarat 391240, India. 2Indukaka Ipcowala College ofPharmacy, New Vallabh Vidyanagar, Gujarat, India. 3A. R. College of Pharmacy,Vallabh Vidyanagar, Gujarat, India.
Received: 2 July 2020 Accepted: 17 March 2021
References1. Fujimori Y, Katsuno Y, Nakashima I (2008) Remogliflozin etabonate, in a
novel category of selective low affinity sodium glucose cotransporterinhibitors, exhibit antidiabetic efficacy in rodent models. J Pharmacol ExpTher 327(1):268–276. https://doi.org/10.1124/jpet.108.140210
2. PubChem, “Remogliflozin etabonate”, https://pubchem.ncbi.nlm.nih.gov.Accessed 18 Sept 2019.
3. ChEMBL, “Remogliflozin etabonate”, https://www.ebi.ac.uk/chembl/compound_report_card/CHEMBL2028665/. Accessed 18 Sept 2019.
4. Product information of remogliflozin A by Cayman Chemicals, Accessed 18Sept 2019.
5. “Safety data sheet” of remogliflozin etabonate Published by Axon MedchemBV, Netherland, accessed on 05 Apr 2019.
6. Polli JW, Humphreys JE, Harmon KA, Webster LO, Reese MJ, MacLauchlin CC(2012) Assessment of remogliflozin etabonate, a sodium-dependent glucoseco-transporter-2 inhibitor, as a perpetrator of clinical drug interactions: astudy on drug transporters and metabolic enzymes. J Diabetes Metab. 3:1–8
7. Sigafoos JF, Bowers GD (2012) Assessment of the drug interaction risk forremogliflozin etabonate, a sodium-dependent glucose cotransporter-2inhibitor: evidence from in vitro, human mass balance, and ketoconazoleinteraction studies. Drug Metab Dispos 40(11):2090–2101. https://doi.org/10.1124/dmd.112.047258
8. Tayade AB, Patil AS, Shirkhedkar AA (2019) Development and validation ofzero order UV-spectrophotometric method by area under curve techniqueand high performance thin layer chromatography for the estimation ofremogliflozin etabonate in bulk and in house tablets. Inventi Rapid: PharmAnal Qual Assurance 3:1–5
9. ICH Guideline Q2A (R1), Validation of analytical procedure, text andmethodology Q2 (R1) (2005).
10. Ulhas D, Deshmukh N, Sadaphal K (2018) Oral pharmaceutical formulationsof remogliflozin. WIPO PCT/IB2018/054091
11. Abebe A, Martin K, Patel JM, Desai D, Timmins P (2010) Bilayer tabletformulation. WIPO 13/509, 210
12. Ulhas D, Deshmukh N, Sadaphal K (2019) Pharmaceutical compositioncomprising remogliflozin and antidiabetic agents. WIPO PCT/IB2019/051116
Fig. 7 Degradation pathway of REM
Shah et al. Future Journal of Pharmaceutical Sciences (2021) 7:83 Page 11 of 12
13. ICH Guideline Q1A (R2), Stability testing of new drug substances andproducts Q1A (R2) (2003).
14. ICH Guideline Q1B, Stability testing: photostability testing of new drugsubstances and products Q1B (1996).
Publisher’s NoteSpringer Nature remains neutral with regard to jurisdictional claims inpublished maps and institutional affiliations.
Shah et al. Future Journal of Pharmaceutical Sciences (2021) 7:83 Page 12 of 12