Embed Size (px)
Citation preview
Vol. 8 | No. 3 |287 - 297 | July - September | 2015
ISSN: 0974-1496 | e-ISSN: 0976-0083 | CODEN: RJCABP
http://www.rasayanjournal.com
http://www.rasayanjournal.co.in
ANTI-DIABETIC AND ANTI-HYPERTENSIVE DRUGS Gopal Ji Baranwal et. al
STABILITY INDICATING RP-HPLC METHOD FOR
SIMULTANEOUS ESTIMATION OF ANTI-DIABETIC AND
ANTI-HYPERTENSIVE DRUGS
Gopal Ji Baranwal, Savita Upadhyay, Avinash C. Tripathi
and Shailendra K. Saraf* Department of Pharmaceutical Chemistry, Faculty of Pharmacy, Babu Banarasi Das Northern
India Institute of Technology, Lucknow-226028, U.P., India. *E-mail: [email protected]
ABSTRACT A new simple, selective, accurate, rapid, stability indicating High Performance Liquid Chromatographic (HPLC) method was developed and validated for the analysis of such a combination of losartan potassium, glimepiride and metformin. Chromatographic separation was achieved isocratically on C18 column [PRINCETON SPHER – 100, (100 A0- 5µm, 150 mm x 4.6 i.d.).] utilizing a mobile phase composition of 10 mM disodium hydrogen phosphate and 10 mM sodium dodecyl sulphate buffer and acetonitrile (68:32, v/v), with a pH of 7.5 (adjusted with orthophosphoric acid) at a flow rate of 1.0 mL/min, with UV detection at 230 nm. The calibration graphs were linear with r2 >0.999 and % RSD> 3 for intra-day and inter-day precision. The retention time of losartan, glimepiride and metformin was 1.39, 4.27, 9.36 min., respectively. The limit of detection and limit of quantitation for losartan, glimepiride and metformin was 0.0382, 0.00473, 0.09331 and 0.1273, 0.0157, 0.31104 respectively. The drugs were subjected to various stress conditions, as per ICH guidelines. The stability indicating studies showed that neither the degradation products nor the excipients interfered in the estimation of drugs. Hence, this method was specific and can be successfully used for the estimation of these drugs in combined dosage forms. Keywords: RP-HPLC, Stability studies, Sulfonyl urea, Angiotensin receptor blockers. Antihyperglycemic agent, Losartan, Glimepiride and Metformin.
©2015 RASĀYAN. All rights reserved
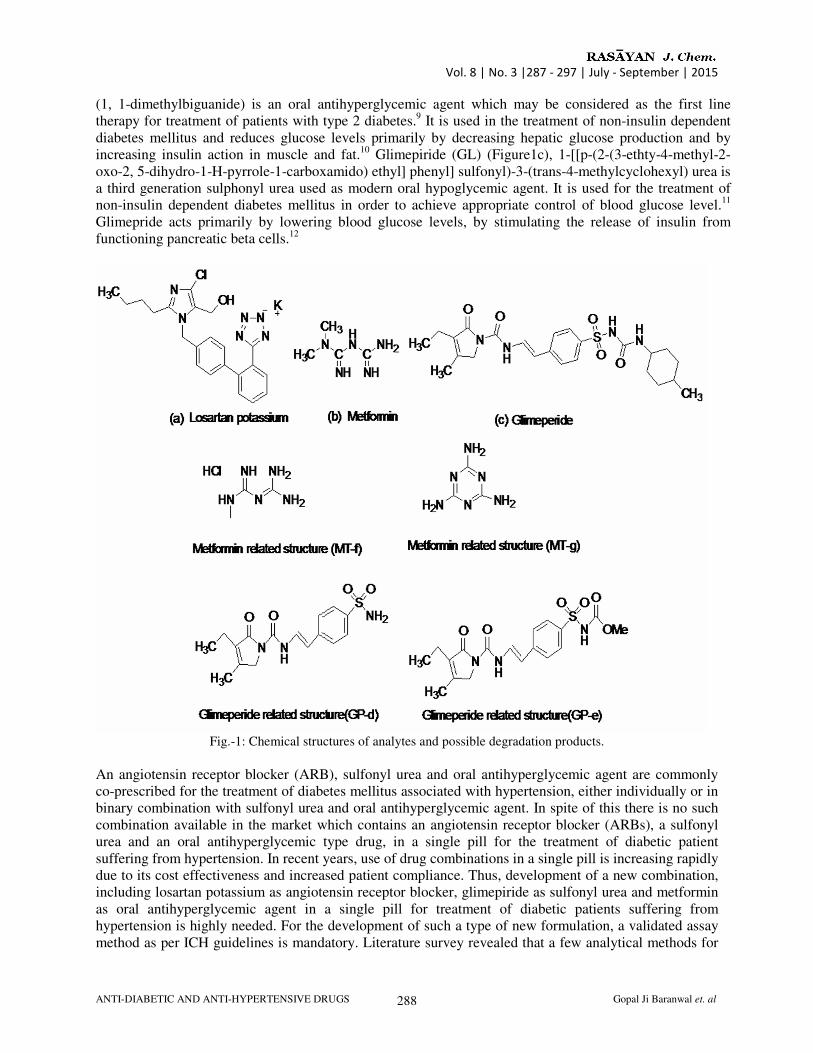
INTRODUCTION Diabetes mellitus is a global disease and the epidemic of type 2 diabetes in the United States and the rest of the world continue to grow rapidly; an estimated 285 million people had diabetes worldwide and more than 1 billion adults are currently affected from hypertension.1,2 Patients with diabetes have a much higher rate of hypertension than would be expected in the general population. In a diabetic person, microvascular [renal disease, sexual dysfunction, orthostatic hypotension, eye disease] and macrovascular [cardiac disease, cerebrovascular disease, peripheral vascular disease] complications are contributed by elevated blood pressure and the presence of these binary complications, such as diabetes with hypertension, result in a high risk for the development of cardiovascular disease (CVD), renal impairment and diabetic retinopathy. A wide range of medications is currently used in the treatment of diabetic patients suffering from hypertension, included from the different class of drugs, such as angiotensin receptor blockers (ARBs), sulfonylurea and an oral antihyperglycemic agent.3-5 ARBs may be considered as the first line therapy for treatment of hypertension, associated with diabetes, in the absence of contraindications. ARBs have been shown to reduce microalbuminuria in diabetic patients independent of their effect on blood pressure. 6 Losartan Potassium (LP) (Fig.-1a), Monopotassium salt of 4-butyl-4-chloro-1- [[2'-(1H- tetrazol-5-yl)[1,1'-biphenyl]-4-yl]methyl]-1H-imidazol-5-methanol, an antihypertensive drug is a competitive antagonist of the angiotensin II type 1 (AT1) receptor. It decreases daytime and nighttime blood pressure without affecting the autonomic nervous activity and also decreases urinary albumin excretion in type 2 diabetes with macroalbuminuria.7 It is also approved for diabetic nephropathy and renoprotective in type 2 diabetes associated with hypertension.8 Metformin (MT) (Fig.-1b)
Vol. 8 | No. 3 |287 - 297 | July - September | 2015
ANTI-DIABETIC AND ANTI-HYPERTENSIVE DRUGS Gopal Ji Baranwal et. al 288
(1, 1-dimethylbiguanide) is an oral antihyperglycemic agent which may be considered as the first line therapy for treatment of patients with type 2 diabetes.9 It is used in the treatment of non-insulin dependent diabetes mellitus and reduces glucose levels primarily by decreasing hepatic glucose production and by increasing insulin action in muscle and fat.10 Glimepiride (GL) (Figure1c), 1-[[p-(2-(3-ethty-4-methyl-2-oxo-2, 5-dihydro-1-H-pyrrole-1-carboxamido) ethyl] phenyl] sulfonyl)-3-(trans-4-methylcyclohexyl) urea is a third generation sulphonyl urea used as modern oral hypoglycemic agent. It is used for the treatment of non-insulin dependent diabetes mellitus in order to achieve appropriate control of blood glucose level.11 Glimepride acts primarily by lowering blood glucose levels, by stimulating the release of insulin from functioning pancreatic beta cells.12
Fig.-1: Chemical structures of analytes and possible degradation products.
An angiotensin receptor blocker (ARB), sulfonyl urea and oral antihyperglycemic agent are commonly co-prescribed for the treatment of diabetes mellitus associated with hypertension, either individually or in binary combination with sulfonyl urea and oral antihyperglycemic agent. In spite of this there is no such combination available in the market which contains an angiotensin receptor blocker (ARBs), a sulfonyl urea and an oral antihyperglycemic type drug, in a single pill for the treatment of diabetic patient suffering from hypertension. In recent years, use of drug combinations in a single pill is increasing rapidly due to its cost effectiveness and increased patient compliance. Thus, development of a new combination, including losartan potassium as angiotensin receptor blocker, glimepiride as sulfonyl urea and metformin as oral antihyperglycemic agent in a single pill for treatment of diabetic patients suffering from hypertension is highly needed. For the development of such a type of new formulation, a validated assay method as per ICH guidelines is mandatory. Literature survey revealed that a few analytical methods for
Vol. 8 | No. 3 |287 - 297 | July - September | 2015
ANTI-DIABETIC AND ANTI-HYPERTENSIVE DRUGS Gopal Ji Baranwal et. al 289
the analysis of these drugs had been reported individually or with other combinations.13-27 Since there is no well documented chromatographic method for the simultaneous estimation and quantitation of the above selected drugs by RP-HPLC, therefore as pre requisite to develop a new formulation, a stability indicating HPLC assay was developed and validated as per ICH guidelines.28 The stability indicating method exhibited excellent chromatographic performance and was simple, precise, accurate, selective, sensitive and showed good resolution. Further, stress degradation of these three drugs was done by hydrolysis under acidic, basic and neutral conditions, oxidation with H2O2, dry heat degradation, and photo degradation. Stress degradation studies may help facilitate the pharmaceutical development, manufacturing, and packaging, in which knowledge of chemical behavior can be used to improve a drug product.
EXPERIMENTAL Instrumentation and chromatographic conditions The development and validation of the assay method was performed on a Shimadzu Liquid Chromatographic System (Japan) consisting of LC-20 AD pump, a SPD-20A UV- Visible detector, a universal loop injector (Rheodyne Model No. 7725i) of injection capacity of 20µL. The analytical reverse phase SD’s Millenium C-18 column (PRINCETON SPHER – 100 A0-5µm, 150 mm x 4.6 i.d.) equipped with a guard column (PRINCETON SPHER C18,100 A0- 5µ),was used to achieve chromatographic separation. Data acquisition was done with Shimadzu High Performance Liquid Chromatography Workstation 21 CFR version 1.25, New York. The mobile phase was a mixture of aqueous buffer and acetonitrile (68:32, v/v), degassed by sonication (Ultrasonic Cleaner Toshan Industries PVT Ltd Hardwar India). The buffer consisted of 10 mM/L disodium hydrogen orthophosphate dihydrate and 10 mM/L Sodium dodecyl sulphate in Millipore Direct Q3 filtered water at pH-7.5, adjusted with 10 % orthophosphoric acid. Injection were carried out using a 20 µl loop at room temperature and the flow rate was 1.0 mL/min. Detection of the analytes was performed at 230 nm.
Chemicals and reagents Losartan potassium was procured from Jubiliant Organosys Ltd, Noida, Uttar Pradesh, India as a gift sample. Metformin HCl and glimepiride were procured similarly as a gift samples from Samson Laboratories, Barotiwali, Solan, Himachal Pradesh, India. Sodium dodecyl sulphate (SDS) and disodium hydrogen orthophosphate dihydrate were procured from S. D. Fine Chem Limited. HPLC grade acetonitrile was supplied by RFCL Limited and S. D. Fine Chem Limited. Millipore Direct Q3 filtered water was used to prepare the mobile phase and the standard solutions. All the chemicals were of analytical or HPLC grade.
Preparation of standard stock solution
Standard stock solutions, at concentrations of 100µg/mL each of losartan, glimepiride and metformin, were prepared separately in acetonitrile. The solutions were kept in a refrigerator at 50C.
Preparation of working solutions A mixed standard working solution was prepared from the standard stock solutions, which contained 160 µg/mL of metformin, 16 µg/mL of losartan and 4 µg/mL of glimepiride. Mixtures of losartan, glimepiride and metformin were prepared, having concentration ranges of 0.25-16 µg/mL for losartan, 0.0625-4 µg/mL for glimepiride and 2.5-160 µg/mL for metformin, by serial dilution.
Assay of marketed formulation Ten tablets each of Losar-50 (losartan), Glypride 2 (glimepiride) and Metfor (metformin) were weighed separately and crushed to form a fine homogeneous powder. Quantity equivalent to 50 mg losartan, 2 mg glimepiride, 500 mg metformin were weighed and transferred into a 100 mL volumetric flask and dissolved in 50 mL of mobile phase and sonicated for 20 minutes. Then 50 mL of mobile phase was added and centrifuged at 8000 rpm for 20 minutes to get the mixture stock solution of 500 µg/mL of losartan, 20 µg/mL of glimepiride and 5000 µg/mL of metformin. Supernatant was collected and further
Vol. 8 | No. 3 |287 - 297 | July - September | 2015
ANTI-DIABETIC AND ANTI-HYPERTENSIVE DRUGS Gopal Ji Baranwal et. al 290
diluted with the mobile phase to obtain working mixture stock solution, which contained 50 µg/mL of losartan, 2 µg/mL of glimepiride and 500 µg/mL of metformin. Finally, test solutions of different concentrations were prepared.
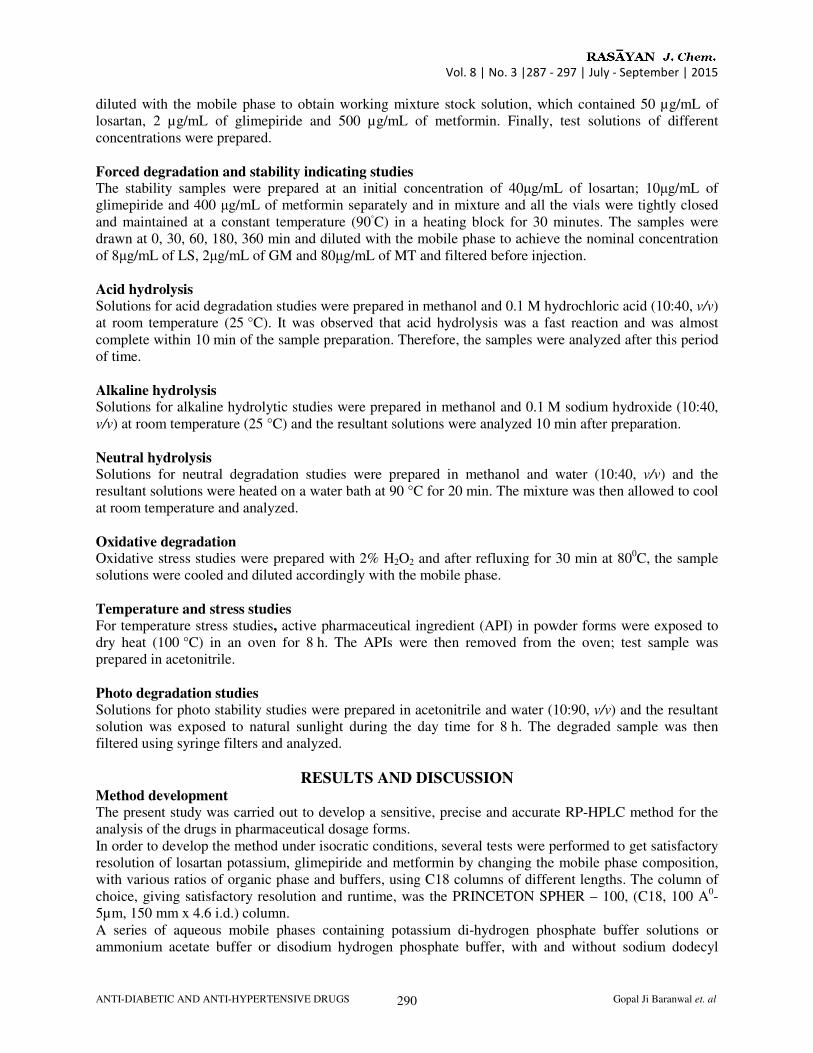
Forced degradation and stability indicating studies The stability samples were prepared at an initial concentration of 40µg/mL of losartan; 10µg/mL of glimepiride and 400 µg/mL of metformin separately and in mixture and all the vials were tightly closed and maintained at a constant temperature (90◦C) in a heating block for 30 minutes. The samples were drawn at 0, 30, 60, 180, 360 min and diluted with the mobile phase to achieve the nominal concentration of 8µg/mL of LS, 2µg/mL of GM and 80µg/mL of MT and filtered before injection.
Acid hydrolysis
Solutions for acid degradation studies were prepared in methanol and 0.1 M hydrochloric acid (10:40, v/v) at room temperature (25 °C). It was observed that acid hydrolysis was a fast reaction and was almost complete within 10 min of the sample preparation. Therefore, the samples were analyzed after this period of time.
Alkaline hydrolysis Solutions for alkaline hydrolytic studies were prepared in methanol and 0.1 M sodium hydroxide (10:40, v/v) at room temperature (25 °C) and the resultant solutions were analyzed 10 min after preparation.
Neutral hydrolysis Solutions for neutral degradation studies were prepared in methanol and water (10:40, v/v) and the resultant solutions were heated on a water bath at 90 °C for 20 min. The mixture was then allowed to cool at room temperature and analyzed.
Oxidative degradation Oxidative stress studies were prepared with 2% H2O2 and after refluxing for 30 min at 800C, the sample solutions were cooled and diluted accordingly with the mobile phase.
Temperature and stress studies
For temperature stress studies, active pharmaceutical ingredient (API) in powder forms were exposed to dry heat (100 °C) in an oven for 8 h. The APIs were then removed from the oven; test sample was prepared in acetonitrile.
Photo degradation studies
Solutions for photo stability studies were prepared in acetonitrile and water (10:90, v/v) and the resultant solution was exposed to natural sunlight during the day time for 8 h. The degraded sample was then filtered using syringe filters and analyzed.
RESULTS AND DISCUSSION Method development The present study was carried out to develop a sensitive, precise and accurate RP-HPLC method for the analysis of the drugs in pharmaceutical dosage forms. In order to develop the method under isocratic conditions, several tests were performed to get satisfactory resolution of losartan potassium, glimepiride and metformin by changing the mobile phase composition, with various ratios of organic phase and buffers, using C18 columns of different lengths. The column of choice, giving satisfactory resolution and runtime, was the PRINCETON SPHER – 100, (C18, 100 A0- 5µm, 150 mm x 4.6 i.d.) column. A series of aqueous mobile phases containing potassium di-hydrogen phosphate buffer solutions or ammonium acetate buffer or disodium hydrogen phosphate buffer, with and without sodium dodecyl
Vol. 8 | No. 3 |287 - 297 | July - September | 2015
ANTI-DIABETIC AND ANTI-HYPERTENSIVE DRUGS Gopal Ji Baranwal et. al 291
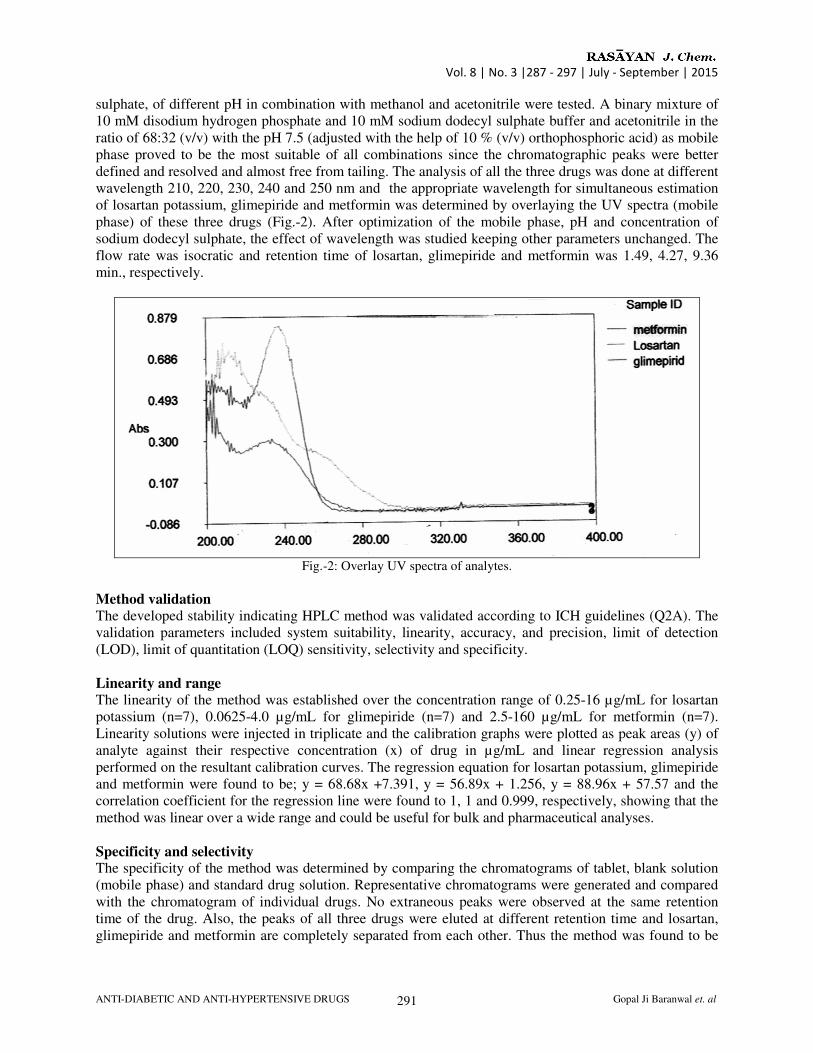
sulphate, of different pH in combination with methanol and acetonitrile were tested. A binary mixture of 10 mM disodium hydrogen phosphate and 10 mM sodium dodecyl sulphate buffer and acetonitrile in the ratio of 68:32 (v/v) with the pH 7.5 (adjusted with the help of 10 % (v/v) orthophosphoric acid) as mobile phase proved to be the most suitable of all combinations since the chromatographic peaks were better defined and resolved and almost free from tailing. The analysis of all the three drugs was done at different wavelength 210, 220, 230, 240 and 250 nm and the appropriate wavelength for simultaneous estimation of losartan potassium, glimepiride and metformin was determined by overlaying the UV spectra (mobile phase) of these three drugs (Fig.-2). After optimization of the mobile phase, pH and concentration of sodium dodecyl sulphate, the effect of wavelength was studied keeping other parameters unchanged. The flow rate was isocratic and retention time of losartan, glimepiride and metformin was 1.49, 4.27, 9.36 min., respectively.
Fig.-2: Overlay UV spectra of analytes.
Method validation
The developed stability indicating HPLC method was validated according to ICH guidelines (Q2A). The validation parameters included system suitability, linearity, accuracy, and precision, limit of detection (LOD), limit of quantitation (LOQ) sensitivity, selectivity and specificity.
Linearity and range
The linearity of the method was established over the concentration range of 0.25-16 µg/mL for losartan potassium (n=7), 0.0625-4.0 µg/mL for glimepiride (n=7) and 2.5-160 µg/mL for metformin (n=7). Linearity solutions were injected in triplicate and the calibration graphs were plotted as peak areas (y) of analyte against their respective concentration (x) of drug in µg/mL and linear regression analysis performed on the resultant calibration curves. The regression equation for losartan potassium, glimepiride and metformin were found to be; y = 68.68x +7.391, y = 56.89x + 1.256, y = 88.96x + 57.57 and the correlation coefficient for the regression line were found to 1, 1 and 0.999, respectively, showing that the method was linear over a wide range and could be useful for bulk and pharmaceutical analyses.
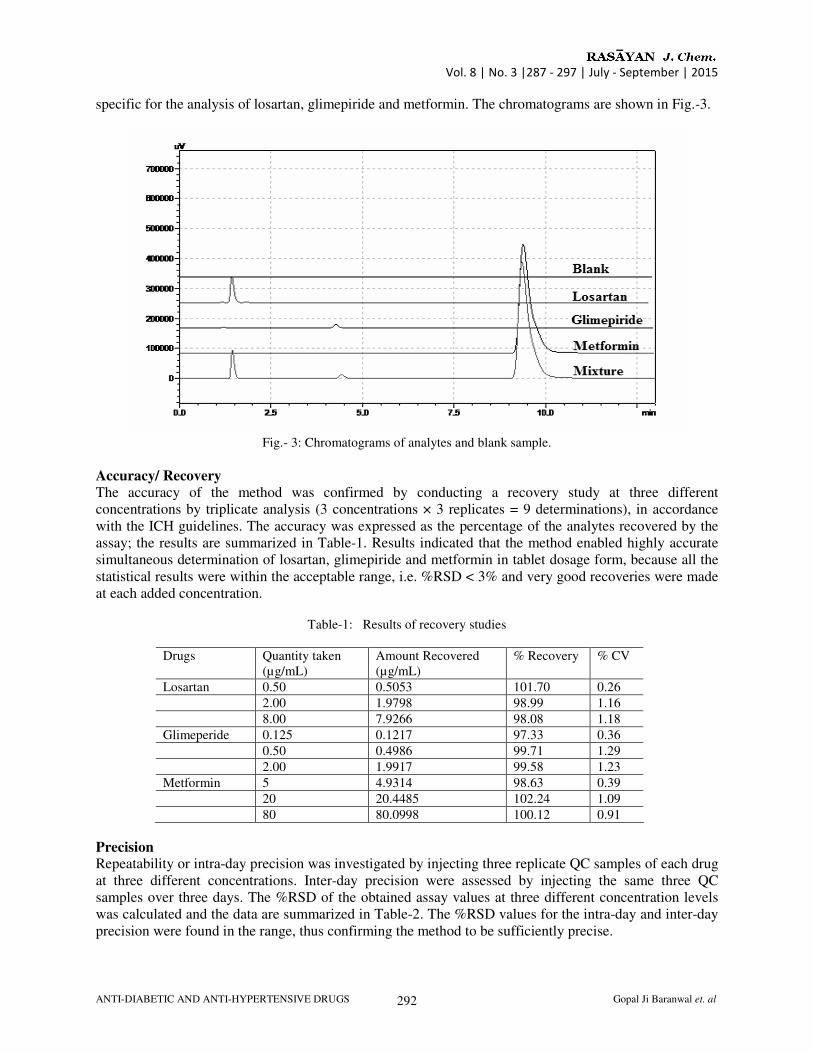
Specificity and selectivity The specificity of the method was determined by comparing the chromatograms of tablet, blank solution (mobile phase) and standard drug solution. Representative chromatograms were generated and compared with the chromatogram of individual drugs. No extraneous peaks were observed at the same retention time of the drug. Also, the peaks of all three drugs were eluted at different retention time and losartan, glimepiride and metformin are completely separated from each other. Thus the method was found to be
Vol. 8 | No. 3 |287 - 297 | July - September | 2015
ANTI-DIABETIC AND ANTI-HYPERTENSIVE DRUGS Gopal Ji Baranwal et. al 292
specific for the analysis of losartan, glimepiride and metformin. The chromatograms are shown in Fig.-3.
Fig.- 3: Chromatograms of analytes and blank sample.
Accuracy/ Recovery
The accuracy of the method was confirmed by conducting a recovery study at three different concentrations by triplicate analysis (3 concentrations × 3 replicates = 9 determinations), in accordance with the ICH guidelines. The accuracy was expressed as the percentage of the analytes recovered by the assay; the results are summarized in Table-1. Results indicated that the method enabled highly accurate simultaneous determination of losartan, glimepiride and metformin in tablet dosage form, because all the statistical results were within the acceptable range, i.e. %RSD < 3% and very good recoveries were made at each added concentration.
Table-1: Results of recovery studies
Drugs Quantity taken (µg/mL)
Amount Recovered (µg/mL)
% Recovery % CV
Losartan 0.50 0.5053 101.70 0.26
2.00 1.9798 98.99 1.16
8.00 7.9266 98.08 1.18
Glimeperide 0.125 0.1217 97.33 0.36
0.50 0.4986 99.71 1.29
2.00 1.9917 99.58 1.23
Metformin 5 4.9314 98.63 0.39
20 20.4485 102.24 1.09
80 80.0998 100.12 0.91
Precision Repeatability or intra-day precision was investigated by injecting three replicate QC samples of each drug at three different concentrations. Inter-day precision were assessed by injecting the same three QC samples over three days. The %RSD of the obtained assay values at three different concentration levels was calculated and the data are summarized in Table-2. The %RSD values for the intra-day and inter-day precision were found in the range, thus confirming the method to be sufficiently precise.
Vol. 8 | No. 3 |287 - 297 | July - September | 2015
ANTI-DIABETIC AND ANTI-HYPERTENSIVE DRUGS Gopal Ji Baranwal et. al 293
Table-2: Results of precision
Measured Concentration (µg/mL), Std. Dev., %CV Drugs Actual concentration (µg/mL) Intra-day Precision (n=3) Inter-day Precision (n=9)
0.50 0.5053, 0.0095, 1.606 0.5012, 0.0157, 2.57
2.00 1.9798, 0.0385, 1.863 1.9861, 0.0645, 1.748
Losartan
8.00 7.9266, 0.1699, 2.120 7.9785, 0.1977, 1.869
0.125 0.1217, 0.0024, 1.722 0.1205, 0.0038, 2.639
0.50 0.4986, 0.0108, 2.097 0.5062, 0.0110, 2.078
Glimepiride
2.00 1.9917, 0.0388, 1.929 2.0041, 0.0535, 2.641
5 4.9314, 0.0194, 0.357 4.7241, 0.1314, 1.680
20 20.4485, 0.4238, 2.023 20.0884, 0.4226, 1.890
Metformin
80 80.0998, 1.7412, 2.160 79.4648, 1.9413, 1.895
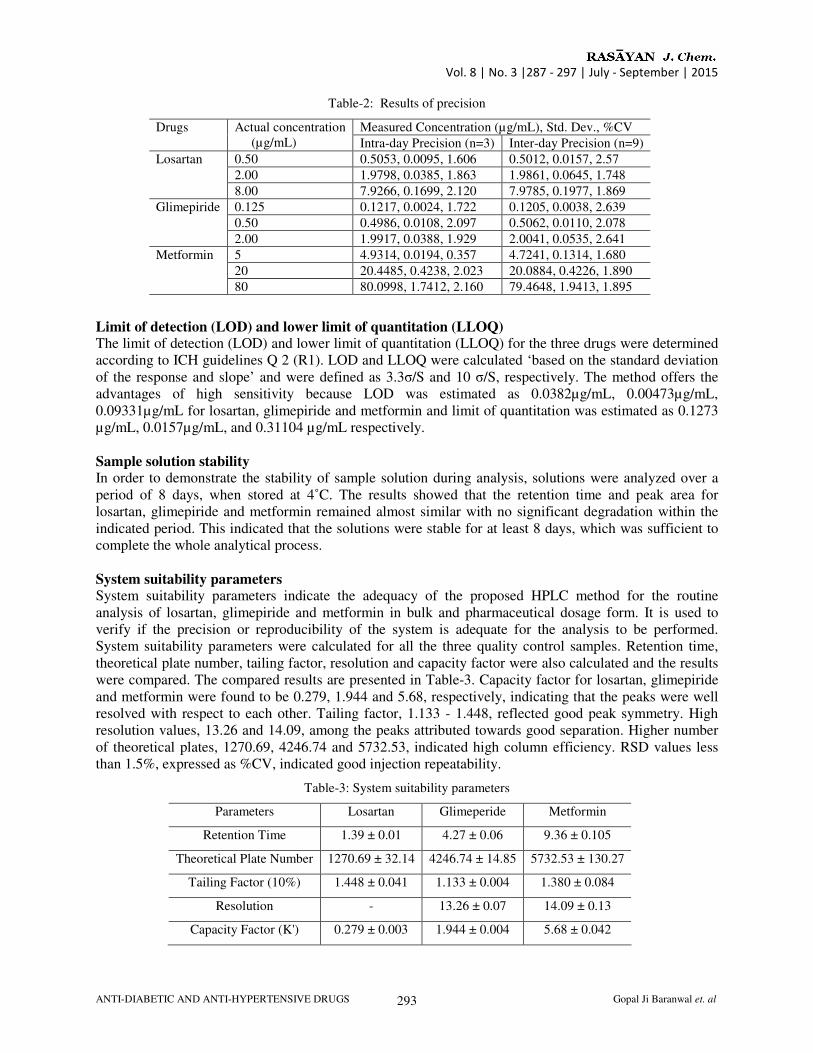
Limit of detection (LOD) and lower limit of quantitation (LLOQ) The limit of detection (LOD) and lower limit of quantitation (LLOQ) for the three drugs were determined according to ICH guidelines Q 2 (R1). LOD and LLOQ were calculated ‘based on the standard deviation of the response and slope’ and were defined as 3.3σ/S and 10 σ/S, respectively. The method offers the advantages of high sensitivity because LOD was estimated as 0.0382µg/mL, 0.00473µg/mL, 0.09331µg/mL for losartan, glimepiride and metformin and limit of quantitation was estimated as 0.1273 µg/mL, 0.0157µg/mL, and 0.31104 µg/mL respectively.
Sample solution stability In order to demonstrate the stability of sample solution during analysis, solutions were analyzed over a period of 8 days, when stored at 4˚C. The results showed that the retention time and peak area for losartan, glimepiride and metformin remained almost similar with no significant degradation within the indicated period. This indicated that the solutions were stable for at least 8 days, which was sufficient to complete the whole analytical process.
System suitability parameters System suitability parameters indicate the adequacy of the proposed HPLC method for the routine analysis of losartan, glimepiride and metformin in bulk and pharmaceutical dosage form. It is used to verify if the precision or reproducibility of the system is adequate for the analysis to be performed. System suitability parameters were calculated for all the three quality control samples. Retention time, theoretical plate number, tailing factor, resolution and capacity factor were also calculated and the results were compared. The compared results are presented in Table-3. Capacity factor for losartan, glimepiride and metformin were found to be 0.279, 1.944 and 5.68, respectively, indicating that the peaks were well resolved with respect to each other. Tailing factor, 1.133 - 1.448, reflected good peak symmetry. High resolution values, 13.26 and 14.09, among the peaks attributed towards good separation. Higher number of theoretical plates, 1270.69, 4246.74 and 5732.53, indicated high column efficiency. RSD values less than 1.5%, expressed as %CV, indicated good injection repeatability.
Table-3: System suitability parameters
Parameters Losartan Glimeperide Metformin
Retention Time 1.39 ± 0.01 4.27 ± 0.06 9.36 ± 0.105
Theoretical Plate Number 1270.69 ± 32.14 4246.74 ± 14.85 5732.53 ± 130.27
Tailing Factor (10%) 1.448 ± 0.041 1.133 ± 0.004 1.380 ± 0.084
Resolution - 13.26 ± 0.07 14.09 ± 0.13
Capacity Factor (K') 0.279 ± 0.003 1.944 ± 0.004 5.68 ± 0.042
Vol. 8 | No. 3 |287 - 297 | July - September | 2015
ANTI-DIABETIC AND ANTI-HYPERTENSIVE DRUGS Gopal Ji Baranwal et. al 294
Assay of tablet formulation The formulation solution (20µL) was injected under the conditions specified. The peak area obtained was related to slope and intercept values from the calibration data to calculate the concentration of the drugs. The mean of losartan, glimepiride and metformin content was obtained from triplicate injection of three dilutions of different concentration range prepared from tablet stock solutions. The results are summarized in Table-4. The mean retention time (±SD) of losartan, glimepiride and metformin were 1.49, 4.27and 9.36 min, respectively. The results indicate that the method is selective for the routine analysis of losartan, glimepiride and metformin in industry.
Table-4: Results from assay of tablet formulation
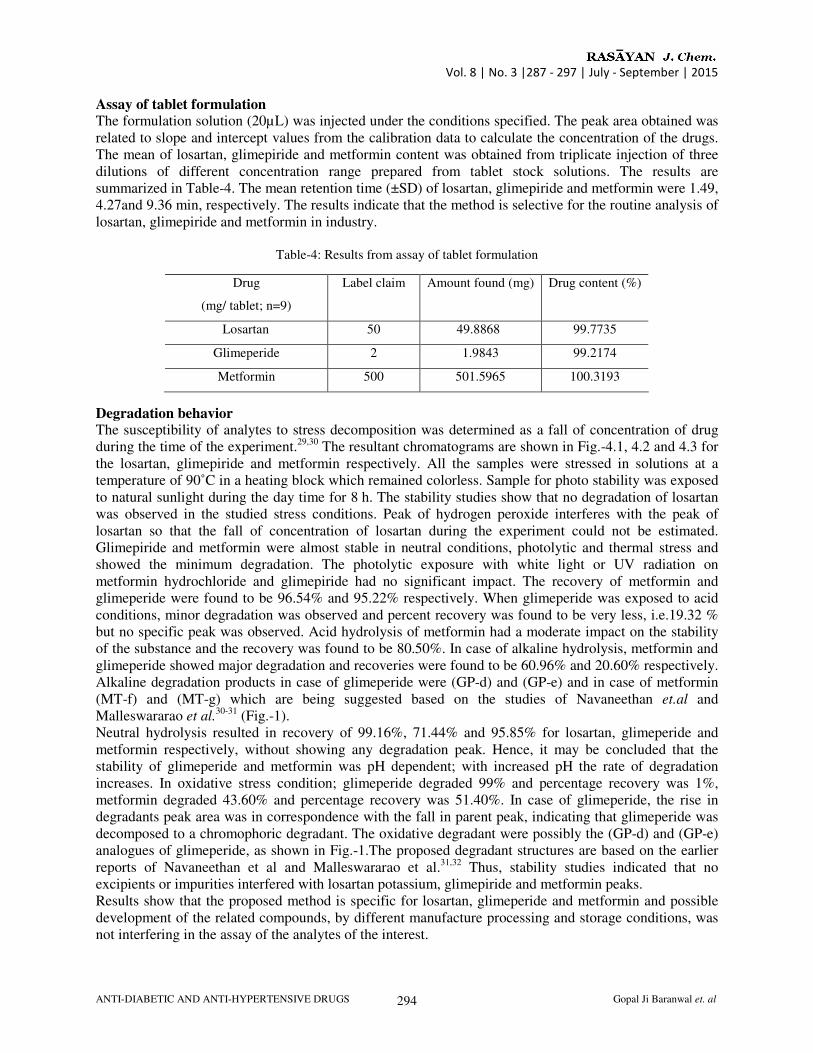
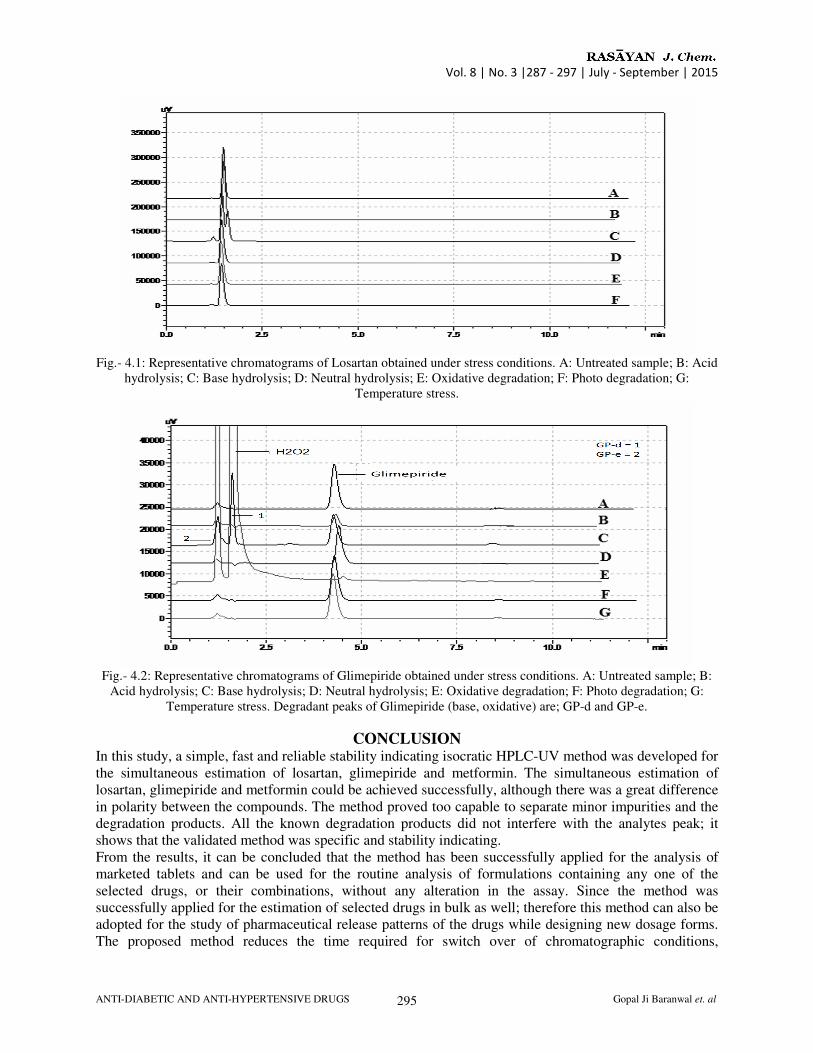
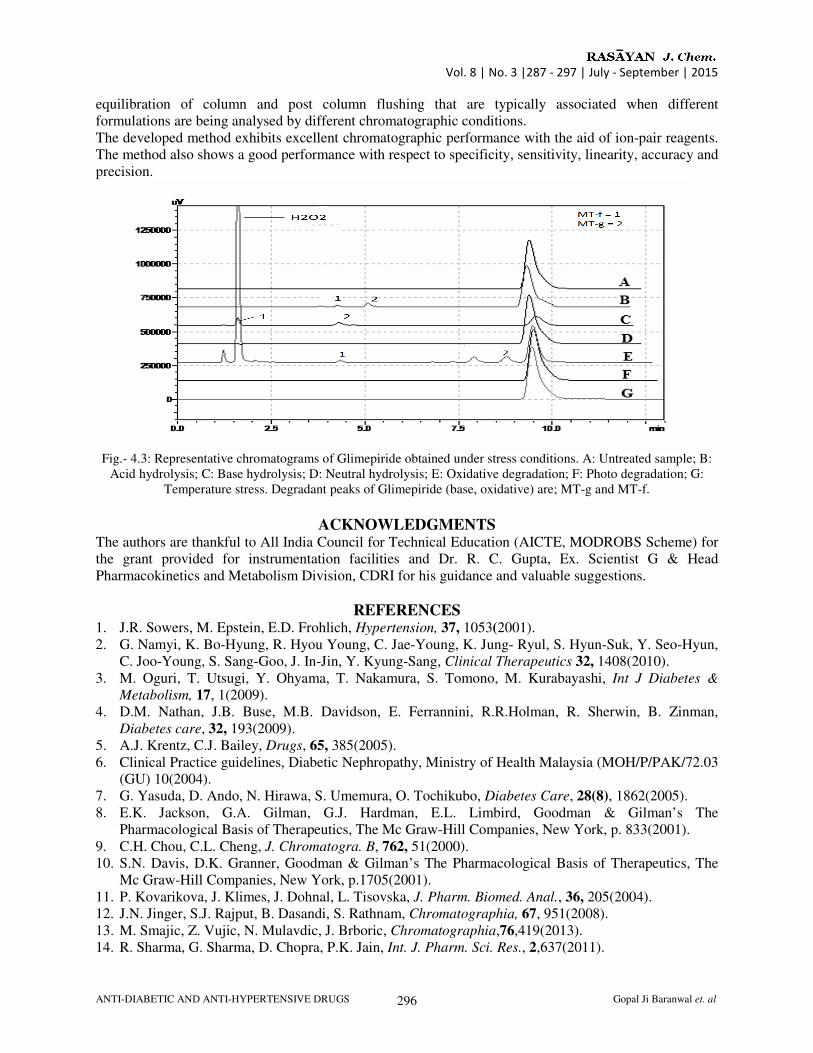
Degradation behavior The susceptibility of analytes to stress decomposition was determined as a fall of concentration of drug during the time of the experiment.29,30 The resultant chromatograms are shown in Fig.-4.1, 4.2 and 4.3 for the losartan, glimepiride and metformin respectively. All the samples were stressed in solutions at a temperature of 90˚C in a heating block which remained colorless. Sample for photo stability was exposed to natural sunlight during the day time for 8 h. The stability studies show that no degradation of losartan was observed in the studied stress conditions. Peak of hydrogen peroxide interferes with the peak of losartan so that the fall of concentration of losartan during the experiment could not be estimated. Glimepiride and metformin were almost stable in neutral conditions, photolytic and thermal stress and showed the minimum degradation. The photolytic exposure with white light or UV radiation on metformin hydrochloride and glimepiride had no significant impact. The recovery of metformin and glimeperide were found to be 96.54% and 95.22% respectively. When glimeperide was exposed to acid conditions, minor degradation was observed and percent recovery was found to be very less, i.e.19.32 % but no specific peak was observed. Acid hydrolysis of metformin had a moderate impact on the stability of the substance and the recovery was found to be 80.50%. In case of alkaline hydrolysis, metformin and glimeperide showed major degradation and recoveries were found to be 60.96% and 20.60% respectively. Alkaline degradation products in case of glimeperide were (GP-d) and (GP-e) and in case of metformin (MT-f) and (MT-g) which are being suggested based on the studies of Navaneethan et.al and Malleswararao et al.
30-31 (Fig.-1). Neutral hydrolysis resulted in recovery of 99.16%, 71.44% and 95.85% for losartan, glimeperide and metformin respectively, without showing any degradation peak. Hence, it may be concluded that the stability of glimeperide and metformin was pH dependent; with increased pH the rate of degradation increases. In oxidative stress condition; glimeperide degraded 99% and percentage recovery was 1%, metformin degraded 43.60% and percentage recovery was 51.40%. In case of glimeperide, the rise in degradants peak area was in correspondence with the fall in parent peak, indicating that glimeperide was decomposed to a chromophoric degradant. The oxidative degradant were possibly the (GP-d) and (GP-e) analogues of glimeperide, as shown in Fig.-1.The proposed degradant structures are based on the earlier reports of Navaneethan et al and Malleswararao et al.31,32 Thus, stability studies indicated that no excipients or impurities interfered with losartan potassium, glimepiride and metformin peaks. Results show that the proposed method is specific for losartan, glimeperide and metformin and possible development of the related compounds, by different manufacture processing and storage conditions, was not interfering in the assay of the analytes of the interest.
Drug
(mg/ tablet; n=9)
Label claim Amount found (mg) Drug content (%)
Losartan 50 49.8868 99.7735
Glimeperide 2 1.9843 99.2174
Metformin 500 501.5965 100.3193
Vol. 8 | No. 3 |287 - 297 | July - September | 2015
ANTI-DIABETIC AND ANTI-HYPERTENSIVE DRUGS Gopal Ji Baranwal et. al 295
Fig.- 4.1: Representative chromatograms of Losartan obtained under stress conditions. A: Untreated sample; B: Acid
hydrolysis; C: Base hydrolysis; D: Neutral hydrolysis; E: Oxidative degradation; F: Photo degradation; G: Temperature stress.
Fig.- 4.2: Representative chromatograms of Glimepiride obtained under stress conditions. A: Untreated sample; B:
Acid hydrolysis; C: Base hydrolysis; D: Neutral hydrolysis; E: Oxidative degradation; F: Photo degradation; G: Temperature stress. Degradant peaks of Glimepiride (base, oxidative) are; GP-d and GP-e.
CONCLUSION In this study, a simple, fast and reliable stability indicating isocratic HPLC-UV method was developed for the simultaneous estimation of losartan, glimepiride and metformin. The simultaneous estimation of losartan, glimepiride and metformin could be achieved successfully, although there was a great difference in polarity between the compounds. The method proved too capable to separate minor impurities and the degradation products. All the known degradation products did not interfere with the analytes peak; it shows that the validated method was specific and stability indicating. From the results, it can be concluded that the method has been successfully applied for the analysis of marketed tablets and can be used for the routine analysis of formulations containing any one of the selected drugs, or their combinations, without any alteration in the assay. Since the method was successfully applied for the estimation of selected drugs in bulk as well; therefore this method can also be adopted for the study of pharmaceutical release patterns of the drugs while designing new dosage forms. The proposed method reduces the time required for switch over of chromatographic conditions,
Vol. 8 | No. 3 |287 - 297 | July - September | 2015
ANTI-DIABETIC AND ANTI-HYPERTENSIVE DRUGS Gopal Ji Baranwal et. al 296
equilibration of column and post column flushing that are typically associated when different formulations are being analysed by different chromatographic conditions. The developed method exhibits excellent chromatographic performance with the aid of ion-pair reagents. The method also shows a good performance with respect to specificity, sensitivity, linearity, accuracy and precision.
Fig.- 4.3: Representative chromatograms of Glimepiride obtained under stress conditions. A: Untreated sample; B:
Acid hydrolysis; C: Base hydrolysis; D: Neutral hydrolysis; E: Oxidative degradation; F: Photo degradation; G: Temperature stress. Degradant peaks of Glimepiride (base, oxidative) are; MT-g and MT-f.
ACKNOWLEDGMENTS The authors are thankful to All India Council for Technical Education (AICTE, MODROBS Scheme) for the grant provided for instrumentation facilities and Dr. R. C. Gupta, Ex. Scientist G & Head Pharmacokinetics and Metabolism Division, CDRI for his guidance and valuable suggestions.
REFERENCES 1. J.R. Sowers, M. Epstein, E.D. Frohlich, Hypertension, 37, 1053(2001). 2. G. Namyi, K. Bo-Hyung, R. Hyou Young, C. Jae-Young, K. Jung- Ryul, S. Hyun-Suk, Y. Seo-Hyun,
C. Joo-Young, S. Sang-Goo, J. In-Jin, Y. Kyung-Sang, Clinical Therapeutics 32, 1408(2010). 3. M. Oguri, T. Utsugi, Y. Ohyama, T. Nakamura, S. Tomono, M. Kurabayashi, Int J Diabetes &
Metabolism, 17, 1(2009). 4. D.M. Nathan, J.B. Buse, M.B. Davidson, E. Ferrannini, R.R.Holman, R. Sherwin, B. Zinman,
Diabetes care, 32, 193(2009). 5. A.J. Krentz, C.J. Bailey, Drugs, 65, 385(2005). 6. Clinical Practice guidelines, Diabetic Nephropathy, Ministry of Health Malaysia (MOH/P/PAK/72.03
(GU) 10(2004). 7. G. Yasuda, D. Ando, N. Hirawa, S. Umemura, O. Tochikubo, Diabetes Care, 28(8), 1862(2005). 8. E.K. Jackson, G.A. Gilman, G.J. Hardman, E.L. Limbird, Goodman & Gilman’s The
Pharmacological Basis of Therapeutics, The Mc Graw-Hill Companies, New York, p. 833(2001). 9. C.H. Chou, C.L. Cheng, J. Chromatogra. B, 762, 51(2000). 10. S.N. Davis, D.K. Granner, Goodman & Gilman’s The Pharmacological Basis of Therapeutics, The
Mc Graw-Hill Companies, New York, p.1705(2001). 11. P. Kovarikova, J. Klimes, J. Dohnal, L. Tisovska, J. Pharm. Biomed. Anal., 36, 205(2004). 12. J.N. Jinger, S.J. Rajput, B. Dasandi, S. Rathnam, Chromatographia, 67, 951(2008). 13. M. Smajic, Z. Vujic, N. Mulavdic, J. Brboric, Chromatographia,76,419(2013). 14. R. Sharma, G. Sharma, D. Chopra, P.K. Jain, Int. J. Pharm. Sci. Res., 2,637(2011).
Vol. 8 | No. 3 |287 - 297 | July - September | 2015
ANTI-DIABETIC AND ANTI-HYPERTENSIVE DRUGS Gopal Ji Baranwal et. al 297
15. A. Madhukar, A. Prince, Y. Sanjeeva, K. Jagdeeshwar, D. Raghupratap, Int.J. Pharm. Pharm. Sci., 3,117(2011).
16. S.K. Gandipalli, B. Rajkamal, Int. J. Pharm. Technol., 3, 2452(2011). 17. K. Mishra, H. Soni, G. Nayak, S.S. Patel, A.K. Singhai, E-J. Chem., 8, 139(2011). 18. P.B. Khedekar, S.M. Dhole, K.P. Bhusari, Digest Journal of Nanomaterial and Biostructures, 5,
77(2010). 19. C. Georgita, I. Sora, F. Albu, C.M. Monciu, Farmacia, 58,158(2010). 20. S.P. Pawar, G.A. Meshram, M.U. Phadke, Chromatographia, 68, 1063(2008). 21. D. Boopathy, B.P. Reddy, B. Mathew, M. Prakash, P. Perumal, Int. J. Chem. Tech. Res, 2,50(2010). 22. T.M. Kalyankar, M.R. Badgujar, R.B. Kakde, J. Pharm. Res., 3, 3078(2010). 23. M.C. Ranetti, M. Ionescu, L. Hinescu, E. Ionica, V. Anuta, A.E. Ranetti, C.E. Stecoza, C. Mircioiu,
Farmacia, 57,728(2009). 24. P.R. Patil, S.U. Rakesh, P.N. Dhabale, K.B. Burade, Int. J. Chem. Tech. Res., 1,464(2009). 25. D. Jain, S. Jain, D. Jain, M. Amin, J. Chromatogr. Sci., 46,501(2008). 26. C. Yardimci, N. Ozalthin, Chromatographia, 66,589(2007). 27. A. Varaprasad, K.E.V. Nagoji, V.G. Sastry, Rasayan J. Chem., 6, 315(2013) 28. International conference on harmonization topic Q 2 (R1), validation of analytical procedures: text
and methodology (CPMP/ICH/381.95), June 1995. 29. K. Ramulu, B.M. Rao, N. Someswara Rao, Rasayan J. Chem., 6, 274(2013). 30. K. Ramulu, B.M. Rao, N. Someswara Rao, Rasayan J. Chem., 6, 324(2013). 31. G. Navaneethan, K. Karunakaran, K.P. Elango, J. Chil. Chem. Soc., 56, 815(2011). 32. C.S.N. Malleswararao, M.V. Suryanarayana, K. Mukkanti, Sci.Pharm., 80,139(2012).
[RJC-1289/2015]