Embed Size (px)
Citation preview
“Every great advance in science has issued from a new audacity of imagination”
.........John Dewey
Chapter 4
Stability & Human bioavailability of
novel rifampicin and isoniazid FDC
Stability & Human bioavailability of novel rifampicin and isoniazid FDC
130
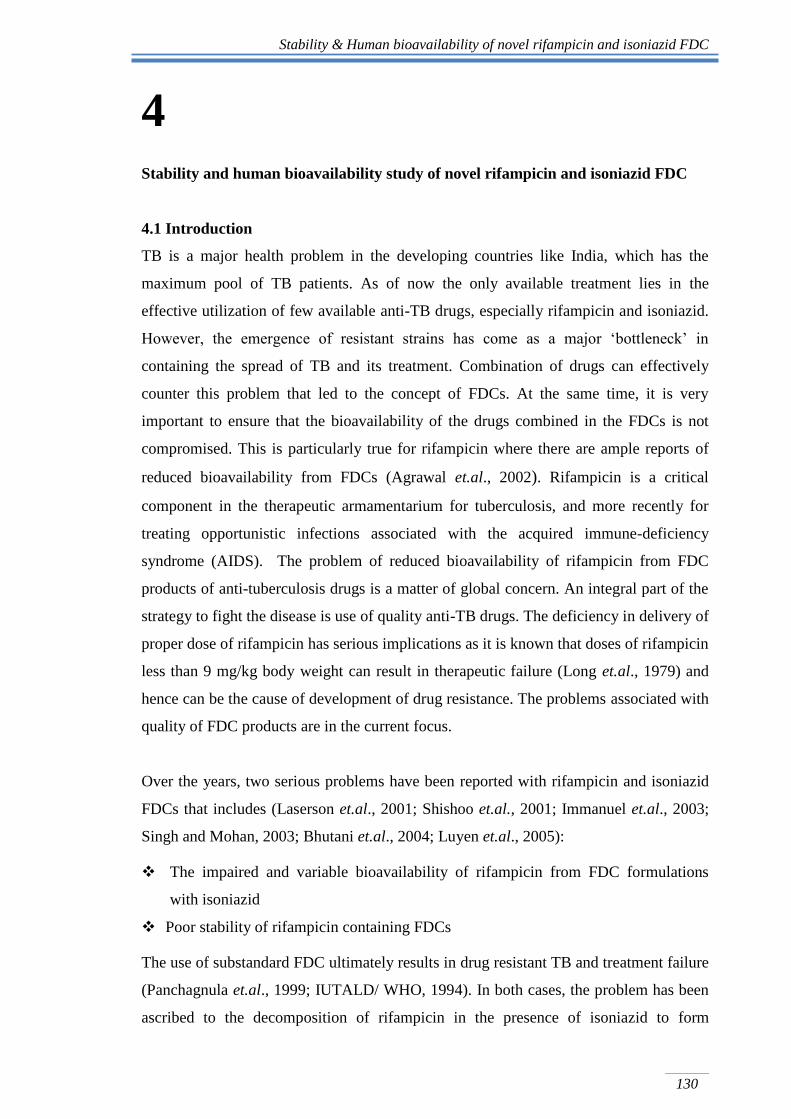
4
Stability and human bioavailability study of novel rifampicin and isoniazid FDC
4.1 Introduction
TB is a major health problem in the developing countries like India, which has the
maximum pool of TB patients. As of now the only available treatment lies in the
effective utilization of few available anti-TB drugs, especially rifampicin and isoniazid.
However, the emergence of resistant strains has come as a major „bottleneck‟ in
containing the spread of TB and its treatment. Combination of drugs can effectively
counter this problem that led to the concept of FDCs. At the same time, it is very
important to ensure that the bioavailability of the drugs combined in the FDCs is not
compromised. This is particularly true for rifampicin where there are ample reports of
reduced bioavailability from FDCs (Agrawal et.al., 2002). Rifampicin is a critical
component in the therapeutic armamentarium for tuberculosis, and more recently for
treating opportunistic infections associated with the acquired immune-deficiency
syndrome (AIDS). The problem of reduced bioavailability of rifampicin from FDC
products of anti-tuberculosis drugs is a matter of global concern. An integral part of the
strategy to fight the disease is use of quality anti-TB drugs. The deficiency in delivery of
proper dose of rifampicin has serious implications as it is known that doses of rifampicin
less than 9 mg/kg body weight can result in therapeutic failure (Long et.al., 1979) and
hence can be the cause of development of drug resistance. The problems associated with
quality of FDC products are in the current focus.
Over the years, two serious problems have been reported with rifampicin and isoniazid
FDCs that includes (Laserson et.al., 2001; Shishoo et.al., 2001; Immanuel et.al., 2003;
Singh and Mohan, 2003; Bhutani et.al., 2004; Luyen et.al., 2005):
The impaired and variable bioavailability of rifampicin from FDC formulations
with isoniazid
Poor stability of rifampicin containing FDCs
The use of substandard FDC ultimately results in drug resistant TB and treatment failure
(Panchagnula et.al., 1999; IUTALD/ WHO, 1994). In both cases, the problem has been
ascribed to the decomposition of rifampicin in the presence of isoniazid to form
Stability & Human bioavailability of novel rifampicin and isoniazid FDC
131
isonicotinyl hydrazone (Singh et.al., 2000; Shishoo et.al., 2001). In this backdrop, both
WHO and IUATLD recommend the use of FDCs proven bioavailability of rifampicin
(IUTALD/WHO, 1999; Panchagnula et.al., 2003).
It is thus expected that bioavailability concerns associated with rifampicin could be
overcome by developing a system that attains segregated delivery of the two drugs, with
rifampicin released immediately in the stomach and isoniazid in the small intestine
(through development of an enteric-release system), thus targeting them to their
respective absorption windows (Mariappan and Singh, 2003). This strategy would also
preclude physical interaction of these drugs within the dosage form during storage. In
view of that, in the present study a novel formulation was designed and developed to
incorporate the following components of anti-TB FDC in a capsule:
Rifampicin: Total dose of rifampicin was subdivided into two components
(i) Immediate release pellets of rifampicin- Loading dose of rifampicin
(ii) Gastroretentive floating pellets of rifampicin- Maintenance dose of rifampicin
Isoniazid: Delayed release pellets of isoniazid
The present chapter will cover the stability studies of the developed novel anti-TB FDC
at room temperature and accelerated conditions. The oral bioavailability of novel
rifampicin and isoniazid FDC, using a commercially available rifampicin and isoniazid
FDC tablet as reference will also be covered in this chapter.
4.2 Stability studies of rifampicin and isoniazid FDC
4.2.1 Methods
The weighed amount of rifampicin pellets, a rifampicin tablet and weighed amount of
isoniazid was filled an empty hard gelatine capsule. The capsules prepared were
subjected for stability studies at room temperature and at accelerated stability condition.
The capsules were stored in a tightly closed HDPE container and aluminium (Alu.)
packs. The stability studies were carried out at room temperature and accelerated
relative humidity conditions as per ICH guidelines. The accelerated relative humidity
conditions were 40°C ± 2°C/75% RH ± 5% RH (ICH, 2003). The stability samples were
withdrawn and analysed at 1, 2, 3 and 6 M for drug content, water content and release
profile. The assay, water content and dissolution studies of the floating rifampicin tablet
Stability & Human bioavailability of novel rifampicin and isoniazid FDC
132
were carried as per the methods described earlier. To ensure the equivalence in release
profile of the stability samples with that of initial samples, the fit factor, f2, was
calculated. The formula used for calculating f2 values is shown in Eq. (27):
f2 = 50 log{[1+ 1/n∑(Rt-Tt)]0.5 X 100} --(27)
t=1
4.3 Bioavailability studies of rifampicin and isoniazid FDC in human volunteers
4.3.1 Materials
R-Cinex tablets (Lupin Pharmaceuicals Limited, Pune, India) were procured from the
market and were used as a reference product. Novel rifampicin isoniazid FDC capsules
were prepared as previously described and packed in aluminum bags, sealed and
labelled with full composition, batch number. Papaverine hydrochloride and
pyrizinamide was kindly gifted by Biologicals E. Ltd, India and Macleods
Pharmaceuticals, India. Dichloromethane, methanol, potassium dihydrogen
orthophosphate and acetonitrile were obtained from Qualigens (Delhi, India). All
reagents were of analytical or high performance liquid chromatography (HPLC) grade
and are enlisted in Annexure 1.
4.3.2 Methods
4.3.2.1 Clinical protocol
An open label, balanced, randomised, three-treatment, three-sequence, three period,
crossover, single centre bioavailability study of single oral dose of fixed dose
combination of rifampicin and isoniazid in twelve healthy, adult, male, human subjects
under fasting conditions was carried out. The study was performed at the B. V. Patel
PERD Centre, Ahmedabad. The study protocol was approved by the Insitutional Ethics
Committee of B. V. Patel PERD Centre. The study was conducted in accordance with
the Declaration of Helsinki ethical principles (WMA, October 2008).
Subjects underwent a screening 14 days prior to the day of first dosing. Volunteers gave
a written informed consent after receiving a detailed explanation of the investigational
nature of the study. They were non-smokers, and were judged healthy on the basis of
medical history, physical examination, electrocardiogram and investigation of
biochemical, immunological, parasitological and haematological parameters in blood
and urine.
Stability & Human bioavailability of novel rifampicin and isoniazid FDC
133
Upon entering into the study, the subjects were housed in the clinical facility of the trial
site for 10-12 h, prior to dosing till 24 h post dose in each of the three periods. All the
subjects were fasted overnight, at least 12 h, before scheduled time for the dose
administration. A standardised meal was given at 4 h and 12 h post dose in each period.
During housing, meal plans for all the periods was same.
Prior and concomitant therapy
All the subjects were abstained from intake of medication from two weeks prior and
during the study. They were asked to abstain from beverages containing alcohol or
quinine between 24 h before and 48 h after drug dosing per experimental period.
Drinking of water was allowed up to 2 h before drug administration. The subjects
fasted for at least 10 h before administration of the medication.
Procedure
Before drug administration, an intravenous canula was placed in an antecubital vein
and kept patent by use of a saline solution. The drug was administered with a glass of
water (about 240 ml). From 2 h after dosing, intake of water was allowed. A standard
lunch and dinner were served at 4 and 10 h post-dosing, respectively.
Blood sampling
Venous blood samples (6 ml) were taken before and 0.5, 1, 1.5, 2, 2.5, 3, 3.5, 4, 6, 8,
10, 12 and 24 h after drug intake. Exact times of blood sampling were noted in the
case report Form. Blood samples were collected in prelabelled heparinised tubes and
centrifuged for 7 min., at 4000±100 rpm, at a temperature below 4ºC within 2 h after
collection for collecting the plasma. Separated plasma was aspirated with a
disposable pipette and transferred to plastic plasma vials containing ascorbic acid.
The plasma vials were sealed and labelled with the mentioning project number,
subject number, period, sampling time point, and sample number and stored at -20°C
for interim storage and at -80°C until assay of rifampicin and isoniazid by HPLC.
Randomisation
The study was conducted in a randomized crossover design. Subjects were randomly
assigned to receive a single dose of 450mg rifampicin and 300 mg isoniazid. A
washout period of 1 week separated both drug intakes. Subjects entering the study
were allocated a number from 1 to 12 and were administered medication as per the
randomization schedule.
Stability & Human bioavailability of novel rifampicin and isoniazid FDC
134
4.3.3 Determination of rifampicin in plasma
Rifampicin concentrations were determined by a validated HPLC method: 0.5 ml
plasma was spiked with 50 µl aqueous ascorbic acid solution (10 µg/ml) and 9 µg
internal standard, papaverine HCl in methanol. Samples were then buffered with 0.5 ml
of 0.005M K2HPO4 containing 1 µg/ml ascorbic acid (pH 7), and extracted with 6 ml of
dichloromethane. The organic layer was transferred to conical centrifuge tubes and
evaporated until dry, under a gentle nitrogen stream. The residue was redissolved in 100
µl mobile phase containing ascorbic acid (50 mg/l), and a 50 µl aliquot was injected
onto a 5 µm particle size, reverse phase, C-18, Qualisil column (250 X 3.9 mm).
Chromatographic conditions
The HPLC equipment consisted of a solvent pump (Jasco PU 980, Tokyo, Japan) set
at a constant flow rate of 1.00 ml/min, a UV detector (Jasco UV 875, Jasco, Tokyo,
Japan) set at 320nm wavelength, a C-18 reversed phase precolumn and Base
deactivated (BDS) column Kromasil (LCGC, USA) and an automatic integration
system (Borwin, Japan). The mobile phase was based on the composition described
by Pargal and Rani (2001). It consisted of a filtered and degassed mixture of 45%
acetonitrile and 55% of 0.01M KH2PO4 (pH 6.5). The method was validated as per
ICH guidelines and was found to be specific, accurate, linear in the concentration
range of 20 to 0.5 µg/ml, limit of quantitation was 0.5 µg/ml and limit of detection
was 0.1 µg/ml (Pund, 2010).
4.3.4 Determination of isoniazid in plasma
Isoniazid concentrations were determined by a validated HPLC method: 200µl of
pyrazinamide (Internal standard) solution in acetonitrile was added to 20 µl plasma and
centrifuged for 10 min at 10,000 rpm. The supernatant was collected and
dichloromethane was added to it. This mixture was then centrifuged for 10 min at
10,000 rpm and 100 µl of aqueous phase was collected. 50 µl of the sample was then
diluted with an equal amount of mobile phase and injected onto 5 µm particle size,
reverse phase, C-18 BDS column (250 X 3.9 mm).
Chromatographic conditions
The HPLC equipment consisted of a solvent pump (Jasco PU 980, Jasco, Tokyo,
Japan) set at a constant flow rate of 1.00 ml/min, a variable wavelength detector
(Jasco UV 875, Jasco, Tokyo, Japan) set at 264 nm wavelength, a C-18 reversed
Stability & Human bioavailability of novel rifampicin and isoniazid FDC
135
phase precolumn and Base deactivated (BDS) column Kromasil (LCGC, USA) and
an automatic integration system (Borwin, Japan). Mobile phase consisted of a filtered
and degassed mixture of 3.5% acetonitrile and 97.5% of 0.01M KH2PO4 buffer. The
method was validated as per ICH guidelines and was found to be specific, accurate,
linear in the concentration range of 20 to 0.5 µg/ml, limit of quantitation was 0.5
µg/ml and limit of detection was 0.1 µg/ml (Pund, 2010).
4.3.5 Statistical analysis
4.3.5.1 Pharmacokinetic Analysis
Maximal plasma concentration (Cmax) and time to reach the peak concentration (Tmax)
were obtained directly by the visual inspection of each subject's plasma concentration-
time profile. The slope of the terminal log-linear portion of the concentration-time
profile was determined by least-squares regression analysis and used as the elimination
rate constant (Kel). The elimination half-life was obtained from the formula,
t1/2 =ln(2)/ Kel --(28)
Where „ln‟ is the natural logarithm.
The Area Under Curve (AUC)0-t from time zero to the last quantifiable point (Ct) was
calculated using the trapezoidal rule. The area under the plasma concentration-time from
0 to infinity (AUC 0-) was calculated as the sum of the AUC0-t plus the ratio of the last
measurable concentration to the elimination rate constant.
For any AUC computation, concentration at time point„t‟ (Ct) values below limit of
quantification (LOQ) was set to zero. (Ct) values below (LOQ) were to be ignored in the
linear regression analysis. Statistical analysis for evaluating bioequivalence were carried
out on logarithmically (natural) transformed pharmacokinetic parameters of rifampicin
and isoniazid (Cmax and AUC0-t). The parameter Tmax was analyzed on untransformed
data.
4.3.5.2 Descriptive statistics
Descriptive statistics of Cmax and AUC0-t for test (novel rifampicin isoniazid FDC) and
reference (marketed rifampicin isoniazid FDC) products were calculated. The individual
Stability & Human bioavailability of novel rifampicin and isoniazid FDC
136
values of these endpoints together with descriptive statistics and ratios B/A were
tabulated for test and reference formulations of rifampicin and isoniazid.
4.3.5.3 Analysis of variance
The ln-transformed pharmacokinetic parameters (Cmax, AUC0-t, and AUC0-) were
analyzed using an ANOVA model with the main effects of sequence, subject nested
within sequence, period and formulation.
4.3.5.4 90% Confidence interval
For the pharmacokinetic parameters Cmax and AUC0-t, 90% confidence intervals for the
ratios of test and reference product averages were calculated using the ANOVA of the
In-transformed data. Consistent with the two one sided test for bioequivalence, 90%
confidence interval for the ratio of both the products averages were calculated by first
calculating the 90% confidence interval for the differences in the averages of the ln-
transformed data and then taking the antilogarithms of the obtained confidence limits.
4.3.5.5 Bioequivalence criteria
Bioequivalence was evaluated using average bioequivalence approach; this is based on
the ratio of average In-transformed responses. The 90% confidence interval for ratio of
average In-transformed Cmax, AUC0-t of rifampicin and isoniazid was the basis for
concluding the equivalence of product A and B. The 90% CI should hence lie within the
bioequivalence limit (80.00-125.00).
4.4 Results and discussion
4.4.1 Stability studies of rifampicin and isoniazid FDC
The rifampicin and isoniazid FDC capsules were subjected to stability studies at room
temperature and at the accelerated stability conditions (40°C ± 2°C/75% RH ± 5%) for
the duration of 6 M. The samples were withdrawn at 1 M, 2 M, 3 M and 6 M and
analysed for their water content, drug content and the dissolution profile. The water
content and drug content in rifampicin isoniazid FDC on stability are shown in Table 30.
The drug content of the rifampicin and isoniazid from the FDC on stability was found to
be in the range between 98.99-100.65% and 98.55-100.05%, respectively. While, the
water content of rifampicin –isoniazid FDC ranged between 4.05- 4.52% w/w.
According to the ICH guidelines on stability testing, if „significant change‟ occurs at any
Stability & Human bioavailability of novel rifampicin and isoniazid FDC
137
time during 6 M of testing at the accelerated storage conditions of 40°C ± 2°C/75% RH
± 5%. The „significant change‟ for a solid drug product is defined as: a 5% change in
assay from its initial value; or failure to meet the acceptance criteria for appearance,
physical attributes and dissolution test (ICH, 2003). Hence, it can be concluded that no
significant change was observed in FDC after 6 M with respect to its water content and
drug content.
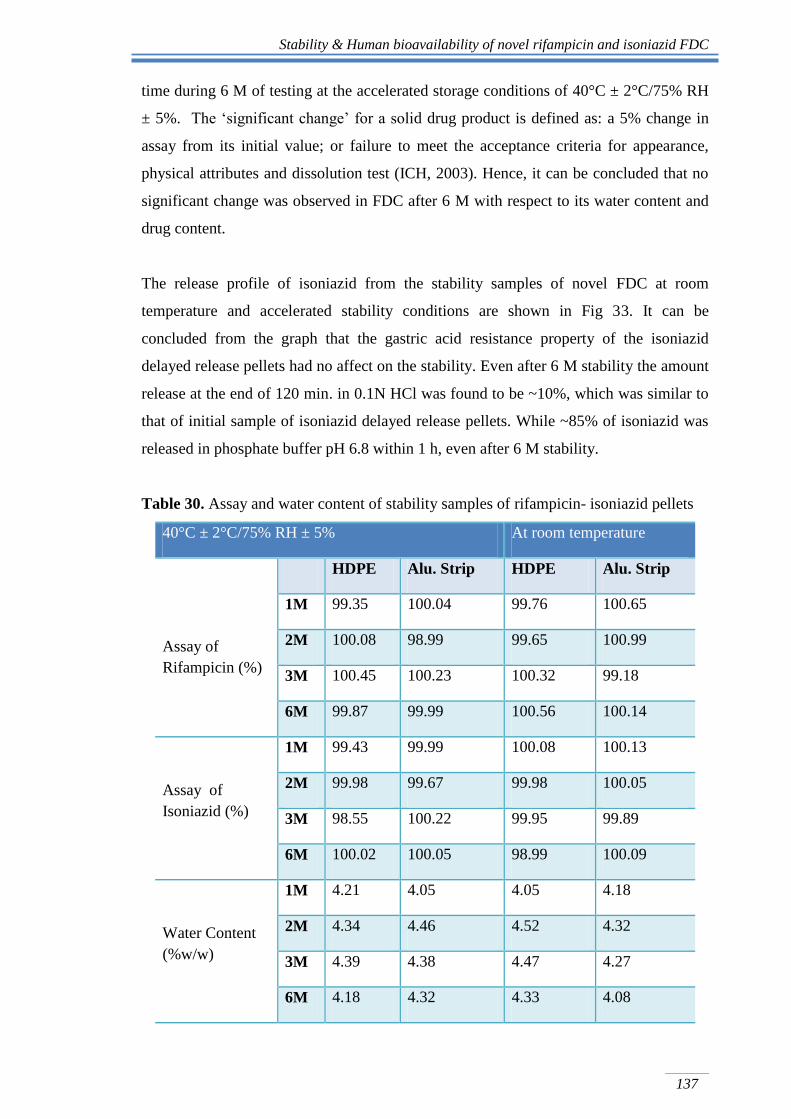
The release profile of isoniazid from the stability samples of novel FDC at room
temperature and accelerated stability conditions are shown in Fig 33. It can be
concluded from the graph that the gastric acid resistance property of the isoniazid
delayed release pellets had no affect on the stability. Even after 6 M stability the amount
release at the end of 120 min. in 0.1N HCl was found to be ~10%, which was similar to
that of initial sample of isoniazid delayed release pellets. While ~85% of isoniazid was
released in phosphate buffer pH 6.8 within 1 h, even after 6 M stability.
Table 30. Assay and water content of stability samples of rifampicin- isoniazid pellets
40°C ± 2°C/75% RH ± 5% At room temperature
Assay of
Rifampicin (%)
HDPE Alu. Strip HDPE Alu. Strip
1M 99.35 100.04 99.76 100.65
2M 100.08 98.99 99.65 100.99
3M 100.45 100.23 100.32 99.18
6M 99.87 99.99 100.56 100.14
Assay of
Isoniazid (%)
1M 99.43 99.99 100.08 100.13
2M 99.98 99.67 99.98 100.05
3M 98.55 100.22 99.95 99.89
6M 100.02 100.05 98.99 100.09
Water Content
(%w/w)
1M 4.21 4.05 4.05 4.18
2M 4.34 4.46 4.52 4.32
3M 4.39 4.38 4.47 4.27
6M 4.18 4.32 4.33 4.08
Stability & Human bioavailability of novel rifampicin and isoniazid FDC
138
Fig 33. Dissolution profile of initial, 3 M and 6 M stability sample of isoniazid from
rifampicin-isoniazid FDC
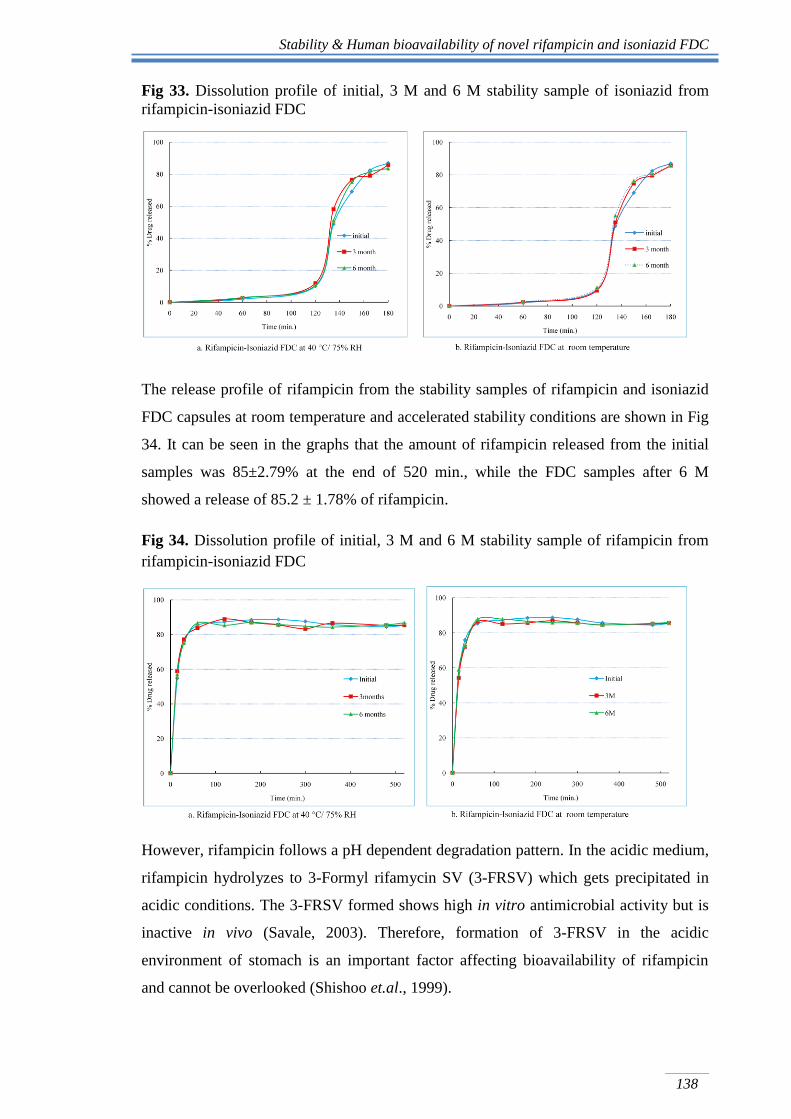
The release profile of rifampicin from the stability samples of rifampicin and isoniazid
FDC capsules at room temperature and accelerated stability conditions are shown in Fig
34. It can be seen in the graphs that the amount of rifampicin released from the initial
samples was 85±2.79% at the end of 520 min., while the FDC samples after 6 M
showed a release of 85.2 ± 1.78% of rifampicin.
Fig 34. Dissolution profile of initial, 3 M and 6 M stability sample of rifampicin from
rifampicin-isoniazid FDC
However, rifampicin follows a pH dependent degradation pattern. In the acidic medium,
rifampicin hydrolyzes to 3-Formyl rifamycin SV (3-FRSV) which gets precipitated in
acidic conditions. The 3-FRSV formed shows high in vitro antimicrobial activity but is
inactive in vivo (Savale, 2003). Therefore, formation of 3-FRSV in the acidic
environment of stomach is an important factor affecting bioavailability of rifampicin
and cannot be overlooked (Shishoo et.al., 1999).
Stability & Human bioavailability of novel rifampicin and isoniazid FDC
139
Shishoo et.al., 1999, evaluated various marketed FDCs of rifampicin isoniazid and
found that there is a significant increase in formation of 3-FRSV in presence of
isoniazid. This indicates that the presence of isoniazid catalyzes degradation of
rifampicin to 3-FRSV in 0.1 N HCl. Also, with the increase in time the formation of 3-
FRSV increases. Hence, it was essential to estimate the amount of 3-FRSV formed from
the novel FDC of rifampicin and isoniazid. The amount of 3-FRSV formed from novel
FDC was compared with the market sample of rifampicin and isoniazid FDC.
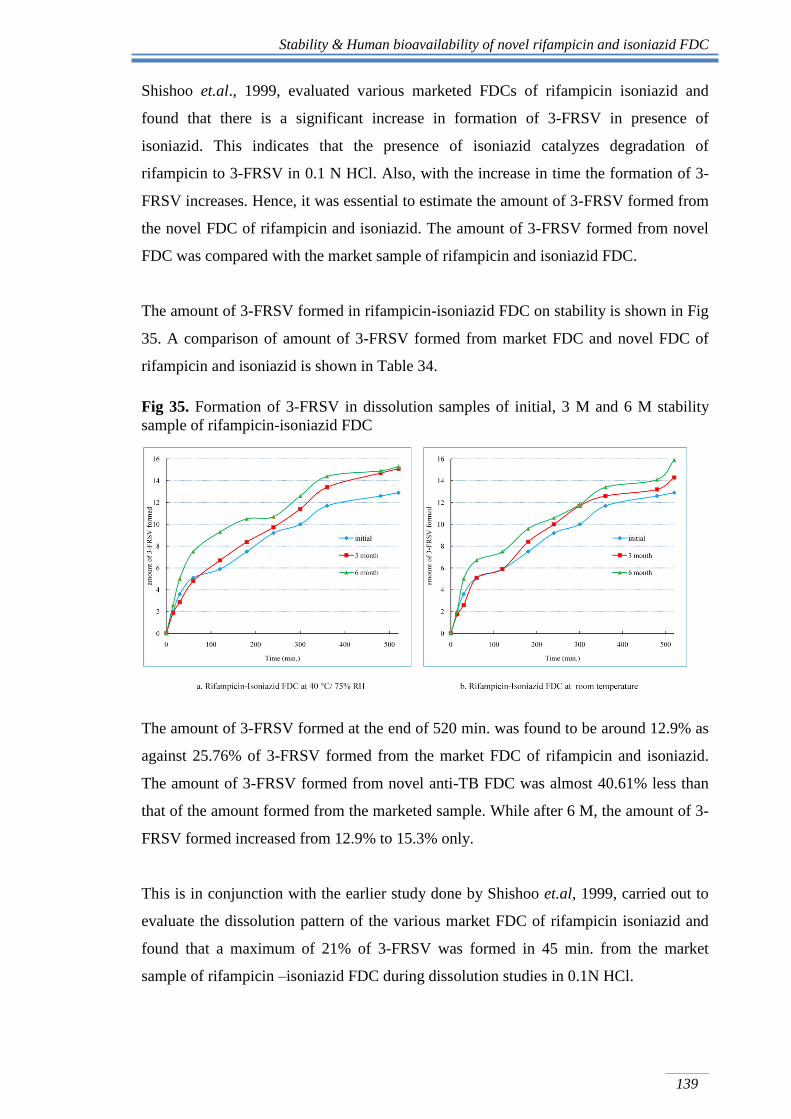
The amount of 3-FRSV formed in rifampicin-isoniazid FDC on stability is shown in Fig
35. A comparison of amount of 3-FRSV formed from market FDC and novel FDC of
rifampicin and isoniazid is shown in Table 34.
Fig 35. Formation of 3-FRSV in dissolution samples of initial, 3 M and 6 M stability
sample of rifampicin-isoniazid FDC
The amount of 3-FRSV formed at the end of 520 min. was found to be around 12.9% as
against 25.76% of 3-FRSV formed from the market FDC of rifampicin and isoniazid.
The amount of 3-FRSV formed from novel anti-TB FDC was almost 40.61% less than
that of the amount formed from the marketed sample. While after 6 M, the amount of 3-
FRSV formed increased from 12.9% to 15.3% only.
This is in conjunction with the earlier study done by Shishoo et.al, 1999, carried out to
evaluate the dissolution pattern of the various market FDC of rifampicin isoniazid and
found that a maximum of 21% of 3-FRSV was formed in 45 min. from the market
sample of rifampicin –isoniazid FDC during dissolution studies in 0.1N HCl.
Stability & Human bioavailability of novel rifampicin and isoniazid FDC
140
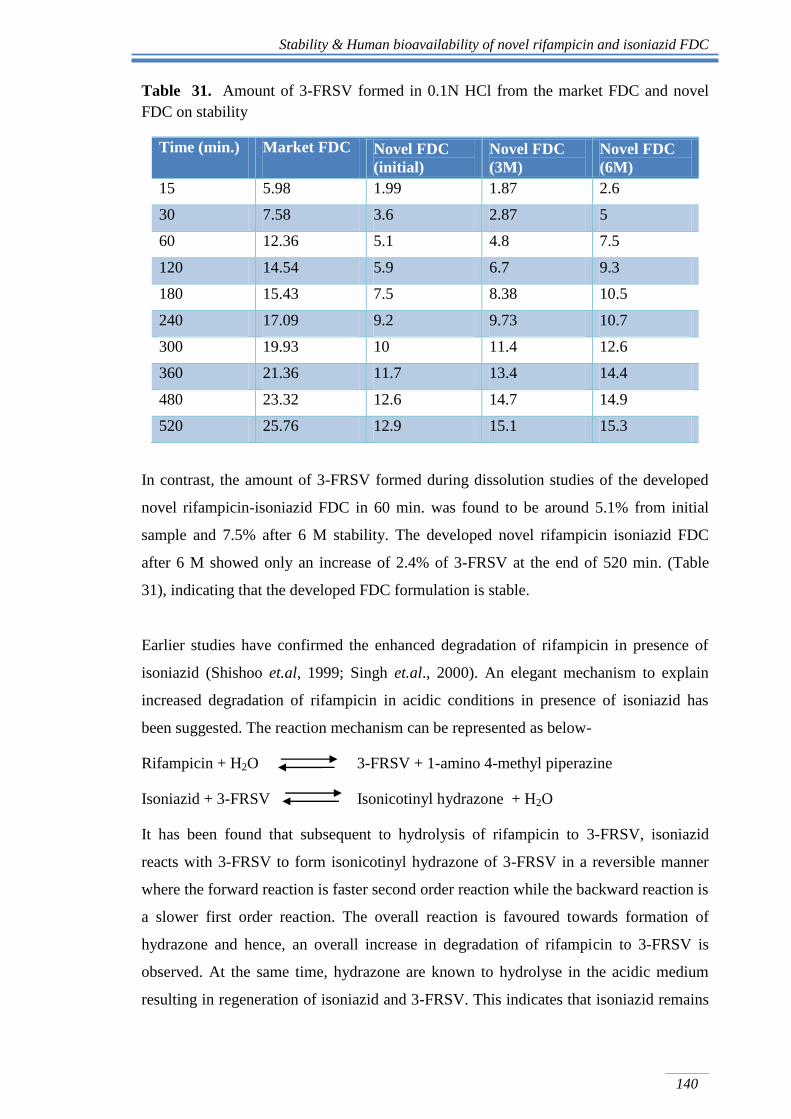
Table 31. Amount of 3-FRSV formed in 0.1N HCl from the market FDC and novel
FDC on stability
Time (min.) Market FDC Novel FDC
(initial)
Novel FDC
(3M)
Novel FDC
(6M)
15 5.98 1.99 1.87 2.6
30 7.58 3.6 2.87 5
60 12.36 5.1 4.8 7.5
120 14.54 5.9 6.7 9.3
180 15.43 7.5 8.38 10.5
240 17.09 9.2 9.73 10.7
300 19.93 10 11.4 12.6
360 21.36 11.7 13.4 14.4
480 23.32 12.6 14.7 14.9
520 25.76 12.9 15.1 15.3
In contrast, the amount of 3-FRSV formed during dissolution studies of the developed
novel rifampicin-isoniazid FDC in 60 min. was found to be around 5.1% from initial
sample and 7.5% after 6 M stability. The developed novel rifampicin isoniazid FDC
after 6 M showed only an increase of 2.4% of 3-FRSV at the end of 520 min. (Table
31), indicating that the developed FDC formulation is stable.
Earlier studies have confirmed the enhanced degradation of rifampicin in presence of
isoniazid (Shishoo et.al, 1999; Singh et.al., 2000). An elegant mechanism to explain
increased degradation of rifampicin in acidic conditions in presence of isoniazid has
been suggested. The reaction mechanism can be represented as below-
Rifampicin + H2O 3-FRSV + 1-amino 4-methyl piperazine
Isoniazid + 3-FRSV Isonicotinyl hydrazone + H2O
It has been found that subsequent to hydrolysis of rifampicin to 3-FRSV, isoniazid
reacts with 3-FRSV to form isonicotinyl hydrazone of 3-FRSV in a reversible manner
where the forward reaction is faster second order reaction while the backward reaction is
a slower first order reaction. The overall reaction is favoured towards formation of
hydrazone and hence, an overall increase in degradation of rifampicin to 3-FRSV is
observed. At the same time, hydrazone are known to hydrolyse in the acidic medium
resulting in regeneration of isoniazid and 3-FRSV. This indicates that isoniazid remains
Stability & Human bioavailability of novel rifampicin and isoniazid FDC
141
unaffected and plays a role of a “catalyst” in the degradation of rifampicin in acidic
conditions to 3-FRSV (Savale, 2003; Singh, et.al., 2006). And hence a higher
degradation or formation of 3-FRSV was found in the case of market samples, wherein
both rifampicin and isoniazid are released together in the acidic medium and facilitate
the formation of hydrazone via formation of 3-FRSV.
While in case of novel FDC, 41% reduction in the formation of 3-FRSV can be
attributed to the segregated release of rifampicin and isoniazid. In acidic medium, only
rifampicin is released and not the isoniazid. The isoniazid is not released in acidic
medium since it has been coated with enteric polymers, which provide the protection to
isoniazid from being released in acidic medium. As a result of the absence of isoniazid
in the acidic medium, the degradation of rifampicin is not favoured in the forward
direction and hence there is a reduced formation of 3-FRSV in acidic medium. Here it is
worthwhile to note that, the amount and profile of formation of 3-FRSV from the novel
FDC of rifampicin isoniazid is not affected at accelerated stability conditions, even after
6 M (as shown in Fig 35 and Table 31).
It can be hence concluded that even after 6 M, rifampicin and isoniazid are found to be
stable in the developed novel FDC. Also, minimal decomposition of rifampicin in vitro,
thus provides a proof of the concept that formulating FDC rifampicin and isoniazid with
segregated site of drug delivery results in improved stability of rifampicin in the FDC.
Additionally, to asses change in release profile statistically, similarity factor (f2) was
also calculated. To statistically confirm the similarity between the release profiles, f2,
factor was calculated. The f2 factor for rifampicin release profile was found to be >85,
while, for isoniazid f2> 90. The f2 value above, 50 is indicative of similarity between the
two release profiles compared.
Thus, it can be concluded that the release of rifampicin and isoniazid from the novel
developed rifampicin isoniazid FDC is similar and is not significantly affected by the
higher humidity and temperature conditions and are stable at accelerated stability
conditions.
Based on non-significant change in uptake of water and drug content and f2 values
indicates that novel FDC of rifampicin and isoniazid is stable till 6 M at room
Stability & Human bioavailability of novel rifampicin and isoniazid FDC
142
temperature and at accelerated stability conditions. Such formulations would rule out the
possibility of failure in the performance of formulations due to stability-related
problems during distribution and handling and especially in region IV countries. Region
IV countries experience high temperature and humidity and are mainly categorised as
TB high-burden countries like India, South Africa etc.
4.4.2 Bioavailability studies
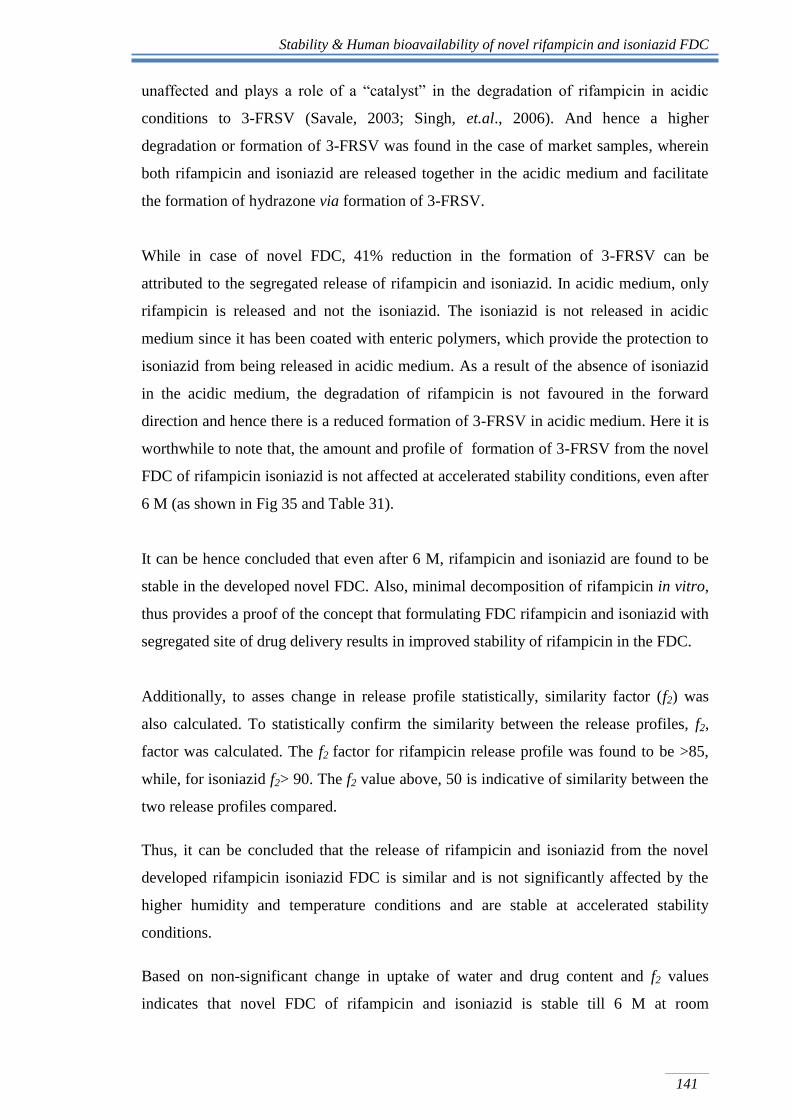
Using the proposed sensitive and specific HPLC method, plasma levels of rifampicin
and isoniazid were monitored after administration of rifampicin and isoniazid FDC
formulation to human volunteers. Typical chromatograms showing peaks for rifampicin
and isoniazid in human plasma samples of a volunteer collected at various time points
after administration of rifampicin and isoniazid FDC are shown in Fig 36 and 37,
respectively.
Fig 36. A typical chromatogram of rifampicin analysed in human plasma along with
papaverine hydrochloride (internal standard)
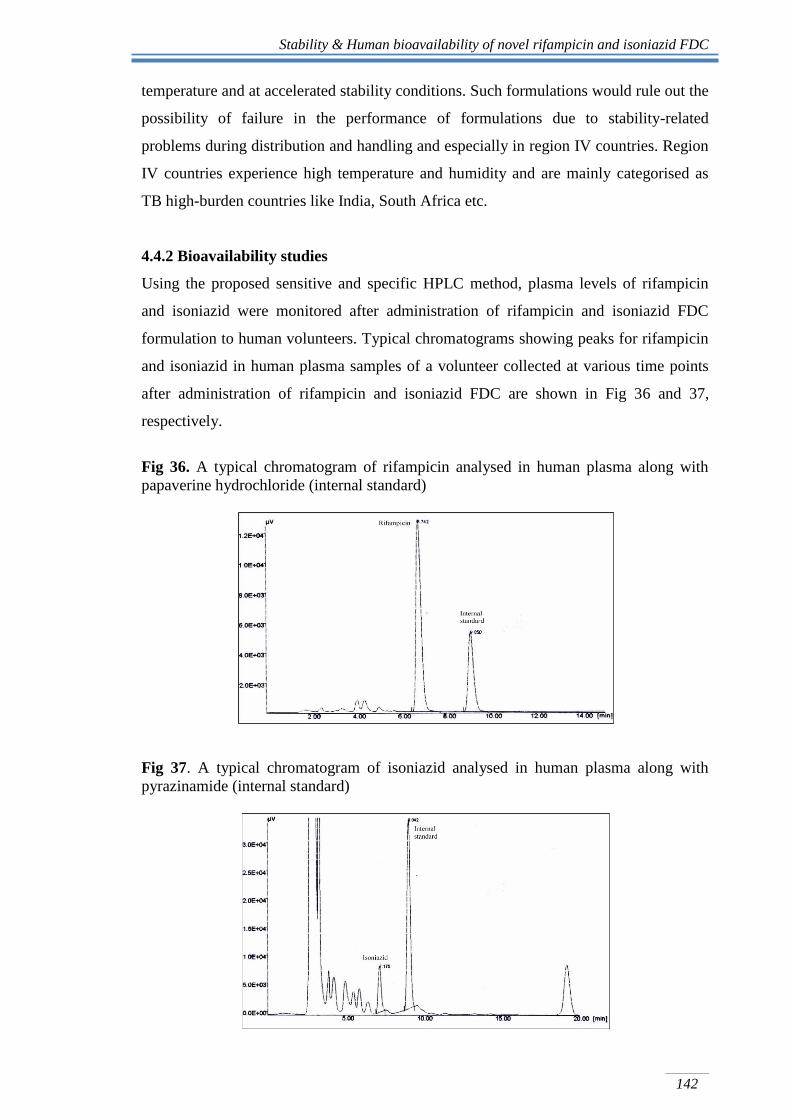
Fig 37. A typical chromatogram of isoniazid analysed in human plasma along with
pyrazinamide (internal standard)
Stability & Human bioavailability of novel rifampicin and isoniazid FDC
143
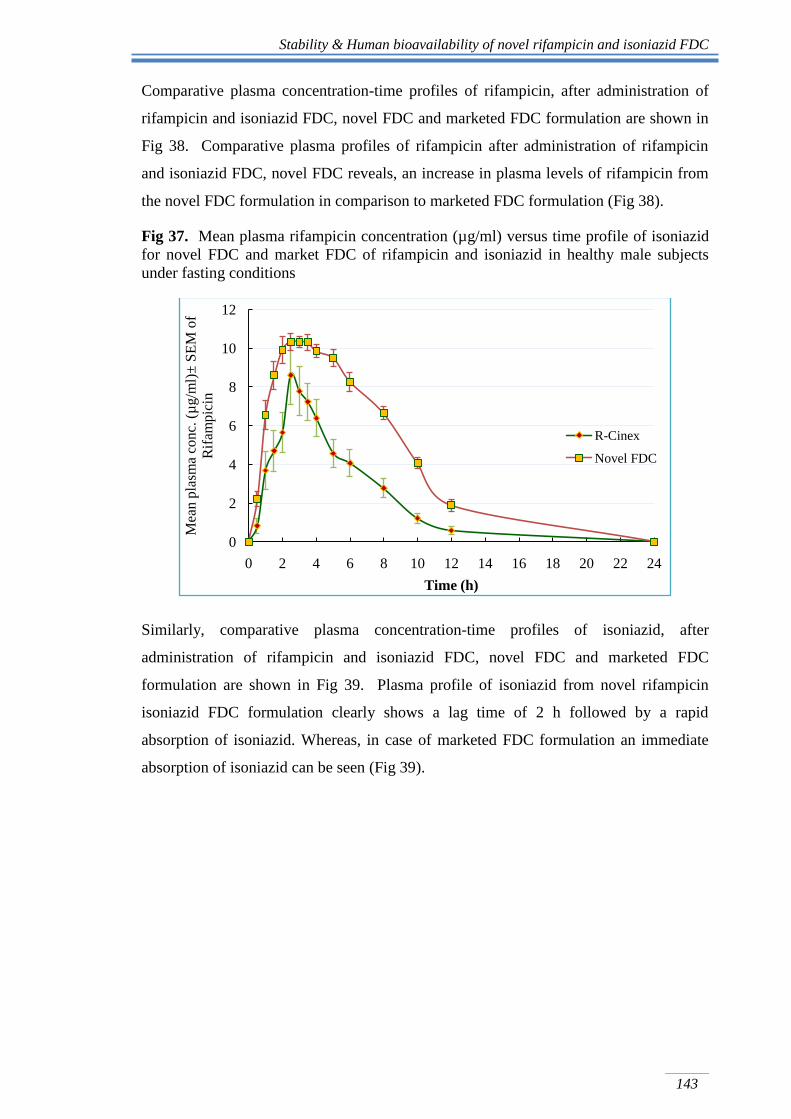
Comparative plasma concentration-time profiles of rifampicin, after administration of
rifampicin and isoniazid FDC, novel FDC and marketed FDC formulation are shown in
Fig 38. Comparative plasma profiles of rifampicin after administration of rifampicin
and isoniazid FDC, novel FDC reveals, an increase in plasma levels of rifampicin from
the novel FDC formulation in comparison to marketed FDC formulation (Fig 38).
Fig 37. Mean plasma rifampicin concentration (µg/ml) versus time profile of isoniazid
for novel FDC and market FDC of rifampicin and isoniazid in healthy male subjects
under fasting conditions
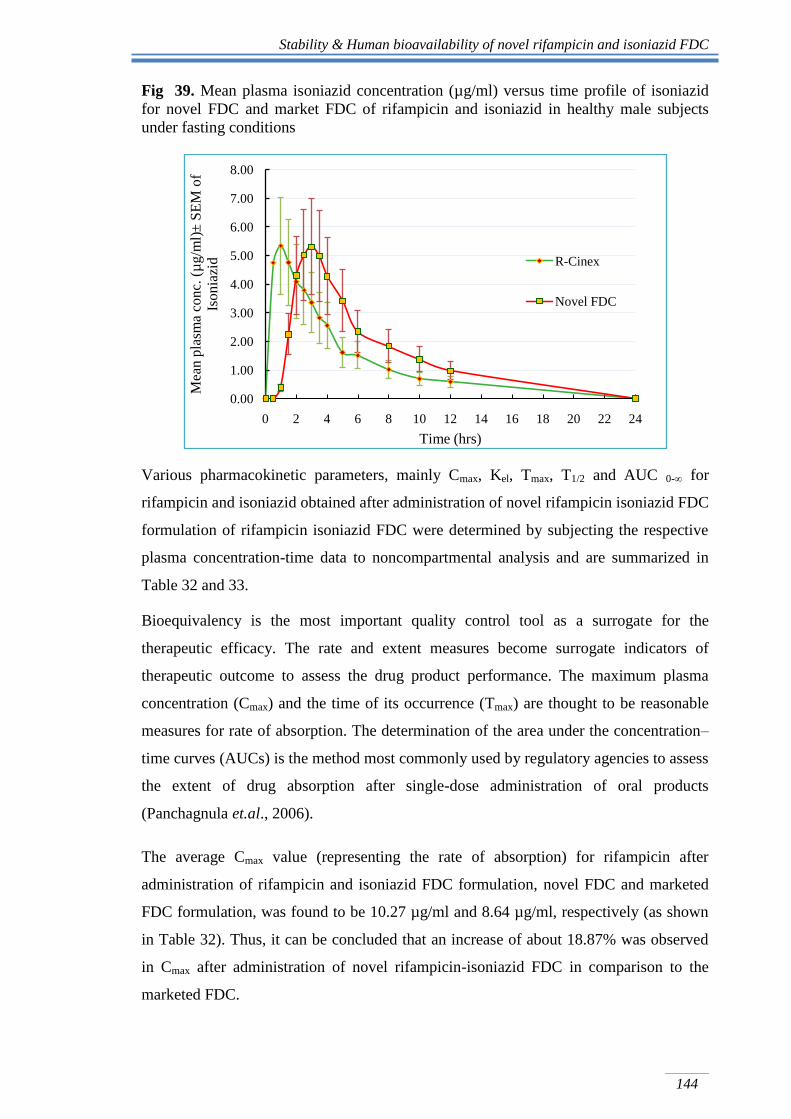
Similarly, comparative plasma concentration-time profiles of isoniazid, after
administration of rifampicin and isoniazid FDC, novel FDC and marketed FDC
formulation are shown in Fig 39. Plasma profile of isoniazid from novel rifampicin
isoniazid FDC formulation clearly shows a lag time of 2 h followed by a rapid
absorption of isoniazid. Whereas, in case of marketed FDC formulation an immediate
absorption of isoniazid can be seen (Fig 39).
0
2
4
6
8
10
12
0 2 4 6 8 10 12 14 16 18 20 22 24
Mea
n p
lasm
a co
nc.
(µ
g/m
l)±
SE
M o
f
Rif
amp
icin
Time (h)
R-Cinex
Novel FDC
Stability & Human bioavailability of novel rifampicin and isoniazid FDC
144
Fig 39. Mean plasma isoniazid concentration (µg/ml) versus time profile of isoniazid
for novel FDC and market FDC of rifampicin and isoniazid in healthy male subjects
under fasting conditions
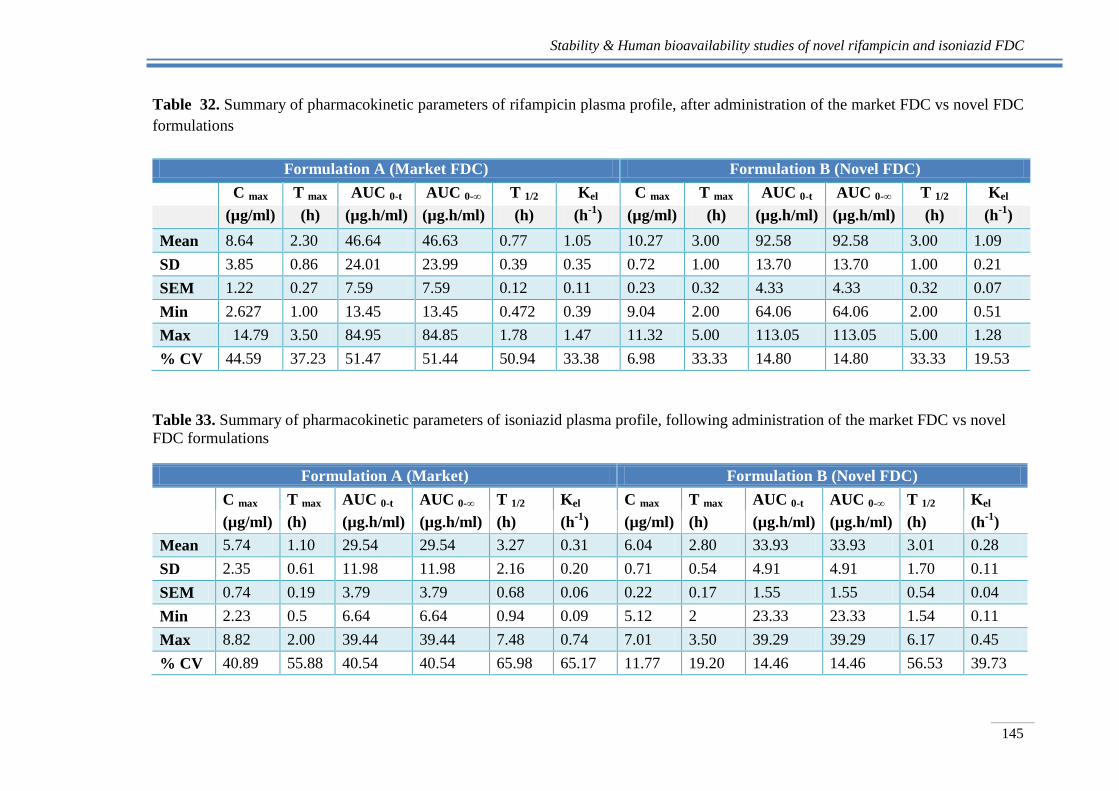
Various pharmacokinetic parameters, mainly Cmax, Kel, Tmax, T1/2 and AUC 0-∞ for
rifampicin and isoniazid obtained after administration of novel rifampicin isoniazid FDC
formulation of rifampicin isoniazid FDC were determined by subjecting the respective
plasma concentration-time data to noncompartmental analysis and are summarized in
Table 32 and 33.
Bioequivalency is the most important quality control tool as a surrogate for the
therapeutic efficacy. The rate and extent measures become surrogate indicators of
therapeutic outcome to assess the drug product performance. The maximum plasma
concentration (Cmax) and the time of its occurrence (Tmax) are thought to be reasonable
measures for rate of absorption. The determination of the area under the concentration–
time curves (AUCs) is the method most commonly used by regulatory agencies to assess
the extent of drug absorption after single-dose administration of oral products
(Panchagnula et.al., 2006).
The average Cmax value (representing the rate of absorption) for rifampicin after
administration of rifampicin and isoniazid FDC formulation, novel FDC and marketed
FDC formulation, was found to be 10.27 µg/ml and 8.64 µg/ml, respectively (as shown
in Table 32). Thus, it can be concluded that an increase of about 18.87% was observed
in Cmax after administration of novel rifampicin-isoniazid FDC in comparison to the
marketed FDC.
0.00
1.00
2.00
3.00
4.00
5.00
6.00
7.00
8.00
0 2 4 6 8 10 12 14 16 18 20 22 24
Mea
n p
lasm
a co
nc.
(µ
g/m
l)±
SE
M o
f
Iso
nia
zid
Time (hrs)
R-Cinex
Novel FDC
Stability & Human bioavailability studies of novel rifampicin and isoniazid FDC
145
Table 32. Summary of pharmacokinetic parameters of rifampicin plasma profile, after administration of the market FDC vs novel FDC
formulations
Formulation A (Market FDC) Formulation B (Novel FDC)
C max T max AUC 0-t AUC 0-∞ T 1/2 Kel C max T max AUC 0-t AUC 0-∞ T 1/2 Kel
(µg/ml) (h) (µg.h/ml) (µg.h/ml) (h) (h-1
) (µg/ml) (h) (µg.h/ml) (µg.h/ml) (h) (h-1
)
Mean 8.64 2.30 46.64 46.63 0.77 1.05 10.27 3.00 92.58 92.58 3.00 1.09
SD 3.85 0.86 24.01 23.99 0.39 0.35 0.72 1.00 13.70 13.70 1.00 0.21
SEM 1.22 0.27 7.59 7.59 0.12 0.11 0.23 0.32 4.33 4.33 0.32 0.07
Min 2.627 1.00 13.45 13.45 0.472 0.39 9.04 2.00 64.06 64.06 2.00 0.51
Max 14.79 3.50 84.95 84.85 1.78 1.47 11.32 5.00 113.05 113.05 5.00 1.28
% CV 44.59 37.23 51.47 51.44 50.94 33.38 6.98 33.33 14.80 14.80 33.33 19.53
Table 33. Summary of pharmacokinetic parameters of isoniazid plasma profile, following administration of the market FDC vs novel
FDC formulations
Formulation A (Market) Formulation B (Novel FDC)
C max T max AUC 0-t AUC 0-∞ T 1/2 Kel C max T max AUC 0-t AUC 0-∞ T 1/2 Kel
(µg/ml) (h) (µg.h/ml) (µg.h/ml) (h) (h-1
) (µg/ml) (h) (µg.h/ml) (µg.h/ml) (h) (h-1
)
Mean 5.74 1.10 29.54 29.54 3.27 0.31 6.04 2.80 33.93 33.93 3.01 0.28
SD 2.35 0.61 11.98 11.98 2.16 0.20 0.71 0.54 4.91 4.91 1.70 0.11
SEM 0.74 0.19 3.79 3.79 0.68 0.06 0.22 0.17 1.55 1.55 0.54 0.04
Min 2.23 0.5 6.64 6.64 0.94 0.09 5.12 2 23.33 23.33 1.54 0.11
Max 8.82 2.00 39.44 39.44 7.48 0.74 7.01 3.50 39.29 39.29 6.17 0.45
% CV 40.89 55.88 40.54 40.54 65.98 65.17 11.77 19.20 14.46 14.46 56.53 39.73
Stability & Human bioavailability of novel rifampicin and isoniazid FDC
146
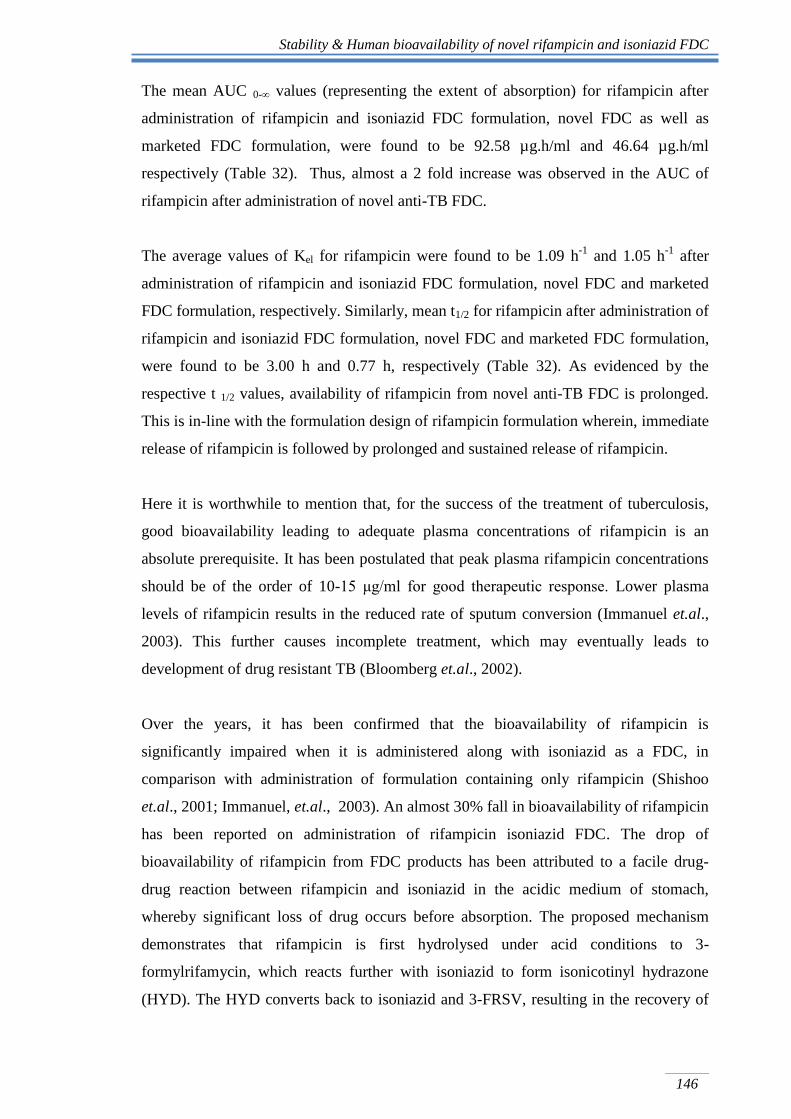
The mean AUC 0-∞ values (representing the extent of absorption) for rifampicin after
administration of rifampicin and isoniazid FDC formulation, novel FDC as well as
marketed FDC formulation, were found to be 92.58 µg.h/ml and 46.64 µg.h/ml
respectively (Table 32). Thus, almost a 2 fold increase was observed in the AUC of
rifampicin after administration of novel anti-TB FDC.
The average values of Kel for rifampicin were found to be 1.09 h-1
and 1.05 h-1
after
administration of rifampicin and isoniazid FDC formulation, novel FDC and marketed
FDC formulation, respectively. Similarly, mean t1/2 for rifampicin after administration of
rifampicin and isoniazid FDC formulation, novel FDC and marketed FDC formulation,
were found to be 3.00 h and 0.77 h, respectively (Table 32). As evidenced by the
respective t 1/2 values, availability of rifampicin from novel anti-TB FDC is prolonged.
This is in-line with the formulation design of rifampicin formulation wherein, immediate
release of rifampicin is followed by prolonged and sustained release of rifampicin.
Here it is worthwhile to mention that, for the success of the treatment of tuberculosis,
good bioavailability leading to adequate plasma concentrations of rifampicin is an
absolute prerequisite. It has been postulated that peak plasma rifampicin concentrations
should be of the order of 10-15 μg/ml for good therapeutic response. Lower plasma
levels of rifampicin results in the reduced rate of sputum conversion (Immanuel et.al.,
2003). This further causes incomplete treatment, which may eventually leads to
development of drug resistant TB (Bloomberg et.al., 2002).
Over the years, it has been confirmed that the bioavailability of rifampicin is
significantly impaired when it is administered along with isoniazid as a FDC, in
comparison with administration of formulation containing only rifampicin (Shishoo
et.al., 2001; Immanuel, et.al., 2003). An almost 30% fall in bioavailability of rifampicin
has been reported on administration of rifampicin isoniazid FDC. The drop of
bioavailability of rifampicin from FDC products has been attributed to a facile drug-
drug reaction between rifampicin and isoniazid in the acidic medium of stomach,
whereby significant loss of drug occurs before absorption. The proposed mechanism
demonstrates that rifampicin is first hydrolysed under acid conditions to 3-
formylrifamycin, which reacts further with isoniazid to form isonicotinyl hydrazone
(HYD). The HYD converts back to isoniazid and 3-FRSV, resulting in the recovery of
Stability & Human bioavailability of novel rifampicin and isoniazid FDC
147
isoniazid, but does cause the loss of rifampicin. This explains why the bioavailability
problem is confined to rifampicin alone and not to isoniazid (Shishoo et.al., 2001; Singh
et.al., 2001; Singh et.al., 2006). This is reflected in the poor bioavailability from the
rifampicin isoniazid FDC formulation. This reaction has been ascribed to be responsible
for the reduced bioavailability of rifampicin from FDC products (Immanuel et.al., 2003;
Shishoo et.al., 2001). The deficiency in delivery of proper dose of rifampicin has serious
implications as it is known that doses of rifampicin less than 9 mg/kg body weight can
result in therapeutic failure (Long et.al., 1979) and hence can result in the development
of drug resistance.
As a result, the IUATLD and the WHO issued a joint statement advising tuberculosis
control programme managers intending to use FDC drugs to purchase only products
with demonstrated rifampicin bioavailability (IUTALD/ WHO, 1999).
Thus, a 2 fold increase in AUC and 18.87% increase in Cmax of rifampicin on oral
administration of novel developed FDC is an indicator of better therapeutic efficacy of
rifampicin from novel anti-TB FDC.
While for isoniazid the average Cmax values (representing the rate of absorption) after
administration of rifampicin and isoniazid FDC formulation, novel FDC and marketed
FDC formulation was found to be 6.04 µg/ml and 5.74 µg/ml (Table 33). The average
Tmax values for rifampicin after administration of rifampicin and isoniazid FDC
formulation, novel FDC and marketed FDC formulation were 3.00 h and 2.30 h,
respectively. While corresponding values of the average Tmax for isoniazid after
administration of rifampicin and isoniazid FDC formulation, novel FDC and marketed
FDC formulation were 2.80 h and 1.10 h, respectively (Table 33). Delay in Tmax value
indicates a delay in absorption of isoniazid from novel anti-TB FDC. This confirms the
hypothesis that the delayed release isoniazid pellets releases isoniazid at the site of
maximum absorption i.e. in intestine
The average values of Kel for isoniazid were 0.28 h-1
and 0.31 h-1
after administration of
rifampicin and isoniazid FDC formulation, novel FDC and formulation, respectively.
While, mean t1/2 for isoniazid after administration of rifampicin and isoniazid FDC
Stability & Human bioavailability of novel rifampicin and isoniazid FDC
148
formulation, novel FDC and marketed FDC formulation, were 3.27 h and 3.01 h,
respectively (Table 33).
The mean AUC 0-∞ values (representing the extent of absorption) for isoniazid after
administration of rifampicin and isoniazid FDC formulation, novel FDC as well as
marketed FDC formulation, are 33.93 µg.h/ml and 29.54 µg.h/ml respectively (Table
33). Thus, it can be concluded that the extent of absorption is not affected by the delay
in absorption of isoniazid from novel anti-TB FDC. This may be attributed to the fact
that the HYD formed due to interaction between rifampicin and isoniazid gets converted
back to isoniazid and 3-formylrifamycin, resulting in recovery of isoniazid, but
eventually causing the loss of rifampicin. Thus, not affecting the extent of absorption i.e.
bioavailability of isoniazid (Shishoo et.al., 2001; Singh et.al., 2001; Singh et.al., 2006).
Statistical analysis of the human bioavailability data
Bioavailability parameters (Cmax and AUC0-∞) for both rifampicin and isoniazid from
novel FDC formulation of rifampicin and isoniazid FDC were compared with that of
market FDC formulation of rifampicin and isoniazid FDC by applying ANOVA test. A
summary statistics of rifampicin and isoniazid on administration of rifampicin isoniazid
FDC to healthy male subjects under fasting conditions are given Table 34.
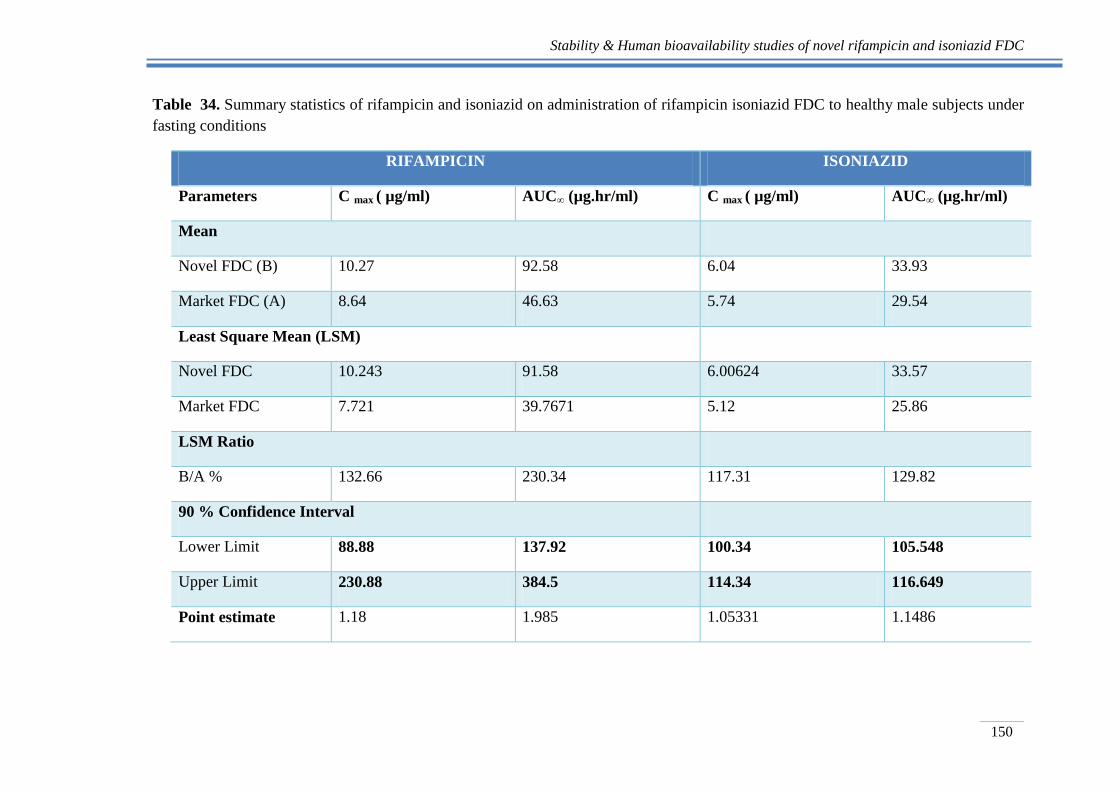
The current USFDA criteria for average bioequivalence of the dosage forms requires
that the mean pharmacokinetic parameters (Cmax and AUC0-∞) for novel rifampicin and
isoniazid FDC) should be within 80-125% of the marketed FDC formulation) using the
90% CI.
In the present study for rifampicin, it was observed that the mean pharmacokinetic
parameters (Cmax and AUC0-∞) did not fall within 90% CI (Table 34). Thus, the results
clearly demonstrate that the two product compared are not bioequivalent. The average
Cmax and AUC 0-∞ indicates that there is significant improvement in bioavailability of
rifampicin from reference formulation as compared to that of novel FDC formulation of
rifampicin and isoniazid, which is an indicator of its better therapeutic effectiveness.
This is in confirmation to earlier observation made by Shishoo et.al., 2001 and Singh
et.al., 2001, that segregated release of rifampicin and isoniazid in different parts of GIT
tract, will prevent the two drugs coming into contact with each other in the stomach and
thereby improving the bioavailability of rifampicin.
Stability & Human bioavailability of novel rifampicin and isoniazid FDC
149
In case of isoniazid, it was observed that the mean pharmacokinetic parameters (Cmax
and AUC0-∞) for novel rifampicin isoniazid FDC dosage form were well within 80-
125%, indicating that the two products were bioequivalent. . This is in line with the fact
stated in earlier independent findings by Shishoo et.al., 2001 and Singh et.al., 2001, that
the bioavailability problem is confined to rifampicin alone and not isoniazid. This has
been attributed to the fact that HYD formed due to a facile interaction between
rifampicin and isoniazid, is converted back to isoniazid and 3-formylrifamycin, resulting
in recovery of isoniazid.
On the other hand, Tmax value of 2.80 ± 0.17 clearly indicates a delay of approximately
3h in absorption of isoniazid (Table 34). This is in agreement with the formulation
design, wherein the isoniazid is formulated in a delayed release formulation. Thus the
bioavailability study provides the direct confirmation to the concept that segregated
delivery of rifampicin and isoniazid from anti-TB FDC should result in improved
bioavailability of rifampicin from FDC‟s.
Stability & Human bioavailability studies of novel rifampicin and isoniazid FDC
150
Table 34. Summary statistics of rifampicin and isoniazid on administration of rifampicin isoniazid FDC to healthy male subjects under
fasting conditions
RIFAMPICIN ISONIAZID
Parameters C max ( µg/ml) AUC∞ (µg.hr/ml) C max ( µg/ml) AUC∞ (µg.hr/ml)
Mean
Novel FDC (B) 10.27 92.58 6.04 33.93
Market FDC (A) 8.64 46.63 5.74 29.54
Least Square Mean (LSM)
Novel FDC 10.243 91.58 6.00624 33.57
Market FDC 7.721 39.7671 5.12 25.86
LSM Ratio
B/A % 132.66 230.34 117.31 129.82
90 % Confidence Interval
Lower Limit 88.88 137.92 100.34 105.548
Upper Limit 230.88 384.5 114.34 116.649
Point estimate 1.18 1.985 1.05331 1.1486
Stability & Human bioavailability of novel rifampicin and isoniazid FDC
151
4.5 Conclusions
The novel rifampicin isoniazid FDC capsules was prepared and evaluated for:
a. Stability studies
b. Human bioavailability studies
Based on the study the following conclusions could be drawn-
The stability study of rifampicin-isoniazid FDC capsules was carried out at room
temperature and at the accelerated stability conditions. The drug content within
pharmacopoeial limits and constant water uptake indicates non significant influence
of higher humidity and temperature on the novel anti-TB FDC.
The samples of 6 M of novel FDC showed a release of 85.2 ± 1.78% of rifampicin
and formation of 6.7 ± 1.12% in 60 of 3-FRSV along with 85% of release of
isoniazid. The amount of 3-FRSV formed from the novel anti-TB FDC was almost
37.22% less than that of the amount formed from the marketed sample. The similarity
factor, f2 factor, of all the release profiles for the stability samples with respect to
their initial values was > 50, indicative that release of rifampicin and isoniazid from
the novel developed rifampicin isoniazid FDC is similar and is not affected by the
higher humidity and temperature conditions. Minimal decomposition in vitro, thus
provide a proof of concept that formulating FDC rifampicin and isoniazid with
segregated site of drug delivery results in improved stability of rifampicin in the
FDC.
The novel rifampicin- isoniazid was evaluated for bioavailability of rifampicin and
isoniazid in comparison to the marketed rifampicin-isoniazid FDC sample. The 90%
CI for the pharmacokinetic parameter Cmax and AUC0- of rifampicin was well
outside the bioequivalence criteria. This indicates that the two products compared
are not bioequivalent. However, the average Cmax values for rifampicin after
administration of rifampicin and isoniazid FDC formulation, novel FDC and
marketed formulation, were 10.27µg/ml and 8.64 µg/ml, corresponding to an increase
of about 18.87%. Thus, a 2 fold increase in AUC and 18.87% increase in Cmax of
rifampicin on oral administration of novel developed FDC is an indicator of better
therapeutic efficacy of rifampicin from novel anti-TB FDC.
Also, as evidenced by the respective t 1/2 values, novel rifampicin and isoniazid FDC
offers an immediate release of rifampicin followed by prolonged and the sustained
release of rifampicin. This is in agreement with the formulation design of rifampicin
Stability & Human bioavailability of novel rifampicin and isoniazid FDC
152
formulation wherein, immediate release of rifampicin is followed by prolonged and
sustained release of rifampicin.
The 90% CI for the pharmacokinetic parameter Cmax and AUC0- of isoniazid was
well within the bioequivalence criteria. This indicates that the two products compared
are bioequivalent. However, Tmax value of 2.80 ± 0.17 clearly indicates a delay of
approximately 3h in absorption of isoniazid. This indicates that the extent of
absorption is not affected by the delay in absorption of isoniazid from novel anti-TB
FDC. This is in agreement with the formulation design, wherein the isoniazid is
formulated in a delayed release formulation.
The bioavailability study provides the confirmation to the concept that segregated
delivery of rifampicin and isoniazid from anti-TB FDC will result in improvement of
bioavailability of rifampicin from FDC‟s without affecting the bioavailability of
isoniazid. Such formulations would rule out any possibility of performance failure of
the formulations due to stability-related problems during distribution and handling
and especially in the climatic region IV countries.
Finally, it can be concluded that the developed novel FDC formulation is a stable
formulation with improved bioavailability. Thus, this formulation could have better
therapeutic efficacy.
Stability & Human bioavailability of novel rifampicin and isoniazid FDC
153
References
Agrawal, S., Kaur, K.J., Singh, I., Bhade, S.R., Kaul, C.L., Panchagnula, R., 2002. Assessment
of bioequivalence of rifampicin, isoniazid and pyrazinamide in a four drug fixed dose
combination with separate formulations at the same dose levels. Int. J. Pharm. 233, 169–177.
Bhutani, H., Mariappan, T.T., Singh, S., 2004. A study on the physical and chemical stability of
anti-tuberculosis fixed-dose combination (FDC) products under accelerated climatic
conditions. Int. J. Tuber. Lung Dis. 8, 1073-1080.
Blomberg, B., Evans, P., Phanouvong, S., Nunn, P., 2002. Informal consultation on
4‐drug fixed‐dose combinations (4FDCs) compliant with the WHO model list of
essential drugs. Geneva: World Health Organization. WHO/CDS/TB/2002.299.
ICH, 2003. Stability testing of the new drug substances and products, Q1A(R2). Geneva,
Switzerland.
Immanuel, C., Gurumurthy, P., Ramachandran, G., Venkatesan, P., Chandrasekaran, V.,
Prabhakar, P., 2003. Bioavailability of Rifampicin following concomitant administration of
Ethambutol or Isoniazid or Pyrazinamide or a combination of the three drugs. Indian J. Med.
Res. 118, 109-114.
IUTALD/WHO, 1994. The promise and reality of fixed dose combinations with rifampicin. A
joint statement of international union against Tuberculosis and Lung diseases and
tuberculosis programme of the WHO. Tuber. Lung Dis. 75, 180-181.
IUTALD/ WHO A joint statement, 1999. Assuring bioavailability of fixed-dose combinations of
anti-tuberculosis medications. Int. J. Tuber. Lung Dis. 3(11), S282–S283.
Laserson, K.F., Kenyon, A.S., Kenyon, T.A., Layloff, T., Binkin, N.J., 2001. Substandard
tuberculosis drugs on the global market and their simple detection. Int. J. Tuber. Lung Dis. 5,
448-454.
Long, M.W., Snider, D.R., Farer, L.S., 1979. US Public Health Service Cooperative Trial of
Three RIF INH Regimens in the treatment of pulmonary tuberculosis. Am. Rev. Respir. Dis.
1979, 119, 879–894.
Luyen, L.T., Huyen, H.T.K., Sang, T.V., Huong, N.T.L., 2005. Effects of Isoniazid and
Pyrazinamide on bioavailability of Rifampicin when co-administered Rifampicin-Isoniazid-
Pyrazinamide. TCNCYH. 36, 12-17.
Mariappan, T.T., Singh, S., 2003. Regional gastrointestinal permeability of Rifampicin and
Isoniazid (alone and their combination) in the rat. Int. J. Tuber. Lung Dis. 7, 797-803.
Stability & Human bioavailability of novel rifampicin and isoniazid FDC
154
Panchagnula, R., Kaur, K.J., Singh, I., Kaul, C.L., 1999. The WHO simplified study protocol in
practice: investigation of combined formulations supplied by the WHO. Int. J. Tuber. Lung
Dis. 3, S336– S342.
Panchagnula R., Sharma A., Agrawal S., 2003. Plasma pooling methodology as a faster and
cheaper tool to evaluate bioequivalence of rifampicin component of FDCs of antitubercular
drugs. Pharm. Res. 48, 655–663.
Panchagnula, R., Parmar, J., Kaur, K., Singh, I., Bade, S.R., Ashokraj, Y., 2006. Statistical
evaluation of physiological variability of rifampicin in fixed dose combinations. Int. J.
Pharm. 313, 5–13.
Pund, S., 2010. Formulation and Characterization of Fixed Dose Combination of Rifampicin and
Isoniazid – A novel approach to improve stability and bioavailability. Ph.D. Thesis, Nirma
University, Ahmedabad.
Pargal A., and Rani S., 2001. Non- linear Pharmacokinetics of rifampicin in healthy asian Indian
volunteers. Int. J. Tuber. Lung Dis. 5 (1): 70-79.
Savale, S.S., 2003. Dissolution study and its correlation with bioavailability of the drugs. Ph.D.
Thesis, Gujarat University, Ahmedabad.
Singh, S., Bhutani, H., Mariappan, T.T., 2006. Quality problems of anti-tuberculosis fixed-dose
combinations (FDCs): A way forward. Indian J. Tuberc. 53, 201-205.
Singh, S., Mariappan, T.T., Sharda, N., Kumar, S., Chakraborti, A.K., 2000. The reason for an
increase in decomposition of Rifampicin in the presence of Isoniazid under acid conditions.
Pharm. Pharmacol. Commun. 6, 405- 410.
Singh, S., Mohan, B., 2003. A pilot stability study on anti-tuberculosis four drug fixed dose
combination products. Int. J. Tuber. Lung Dis. 7, 298-303.
Shishoo, C.J., Shah, S.A., Rathod, I.S., Savale, S.S., Kotecha, J.S., Shah, P.B., 1999. Stability of
rifampicin in dissolution medium in presence of isoniazid. Int. J. Pharm. 190, 109-23.
Shishoo C. J., Shah S.A., Rathod I.S., and Savale S.S., 2001. Impaired bioavailability of
rifampicin from fixed dose combination (FDC) formulations with Isoniazid. Indian J. Pharm.
Sci. 63 (6), 443-449.
Singh S., Mariapan T. T., Sharda N., Kumar S., and Chakraborti A. K., 2000. The reason for an
increse in decomposition of rifampicin in the presence of Isoniazid under acid conditions.
Pharm. Pharmacol.6, 405-410.
Singh, S., Mariappan, T.T., Sankar, R., Sarda, N., Singh, B., 2001. A critical review of the
probable reasons for the poor/variable bioavailability of rifampicin from anti-tubercular
fixed-dose combination (FDC) products, and the likely solutions to the problem. Int. J.
Pharm. 228, 5–17.
Stability & Human bioavailability of novel rifampicin and isoniazid FDC
155
Singh, S., Bhutani, H., Mariappan, T.T., 2006. Quality problems of anti-tuberculosis fixed-dose
combinations (FDCs): A way forward. Indian J. Tuberc. 53, 201-205.
WMA (World medical association), 2008. Declaration of Helsinki Ethical principles for medical
research involving human subjects. 59th WMA General Assembly, Seoul.