Embed Size (px)
Citation preview

-.altiu a ,u a . • , , - lif ' l i i l It. i l l ,lh lik^killll i
STABILISATION OF A HIGHLY PLASTIC
CLAY SOIL FOR THE PRODUCTION OF
COMPRESSED EARTH BLOCKS
Carl Gunther Rix
A dissertation submitted to the faculty of Architecture, University of the
Witwatersrand, Johannesburg, in fulfillment of the requirements for the degree
Master of Science in Building Management.
Johannesburg, 1998.
i

Declaration
1 declare that this dissertation is my own, unaided work. It is being submitted for
the Degree of Master of Science in Building Management in the University of the
Witwatersrand, Johannesburg. It has not been submitted before for any degree
or examination in any other university.
Carl Gunther Rix
$ ______ day of 1998

Abstract
Clay plays an important role in the suitability of soil for use in construction. The
affinity of a clay for moisture makes it susceptible to shrinkage and swelling on
drying and wetting and therefore problematic in terms of construction, where
stability is required for the integrity of a structure to remain intact. It is therefore
important to have methods of dealing with problematic clays in order to allow
clays to be used as a construction material. One of the methods is known as soil
stabilisation, where the properties of a soil and mainly the clay fraction are
altered to make it more suitable for its intended purpose.
The thesis investigates the use of a highly plastic clayey soil for the production
of building blocks. Due to the clayey nature and its associated properties the soil
it is not suitable in its natural state. Soil stabilisation is investigated as a method
to alter the properties of the soil. The principles of soil stabilisation are presented
as an introduction to the laboratory testing programme.
Combinations of lime, cement and fly ash are investigated as a stabilising agent.
They are investigated to determine which combination alters the properties of the
soil to such an extent, that a compressed soil block produced using the
combination and the clayey soil, would perform satisfactorily according to
accepted standards. Combinations were designed so that comparisons could be
made between blocks to determine what effect the addition of a certain stabilising
agent would have on the performance of the block in terms of the tests
conducted.
The engineering properties of the untreated soil which are not considered
suitable for use in compressed soil blocks, are significantly enhanced by he
addition of the stabilising agents. The test conducted on the blocks indicate that
the addition of 4% lime, 20% fly ash and 7% cement added to the soil produces a

block that satisfies the criteria adopted for the research and that are generally in
accord with international standards.
A mineralogical analysis was also undertaken in an attempt to identify changes in
the mineralogy of the soil, and particularly the clay, as a result of the addition of
the three stabilising agents. This analysis was done using x-ray diffraction. Due
to the nature of the clay mineral and possibly the poor crystal structure thereof,
the results were disappointing. No significant change in the clay was observed to
correlate with the results of the improved performance as indicated by the
physical tests.

ACKNOWLEDGEMENTS
I would like to express my appreciation to the following :
The Foundation for Research and Development,
The Senior Bursaries Committee of the University of the Witwatersrand,
Rand Water,
Professor R. Schloss and the department,
for financial assistance during this project.
The Department of Building and Quantity Surveying and the Department of Civil
Engineering, University of the Witwatersrand, for support, assistance and the use
of laboratory and administrative facilities.
My mother .father and my girlfriend Heidi for all their encouragement and support
throughout my academic career.
My supervisor Professor John Morris whose support and sincere guidance in all
matters is deeply appreciated.
Joachim Kofahl ,Quintin Booysen ^nd Chris Carter of Hydraform for the loan of
their blockmaking machine and advice.
Dr. Dieter Buhman and Maria Atansova of the Council for Geoscience for their
help and explanations.
PPC cement for their kind donation of cement.
My family, friends and colleagues who have been supportive of me during this
project.

CONTENTS Page
DECLARATION i
ABSTRACT ii
ACKNOWLEDGEMENTS tv
CONTENTS v
LIST OF FIGURES x
LIST OF TABLES xiii
CHAPTER ONE
1.0 Introduction
1.1 Need for housing 1
1.2 Need for alternative construction methods and materials. 2
1.3 History of earth as a construction material 2
1.4 Earth as a construction material 5
1.5 Soil stabilisation 5
1.6 SOIL
1.6.1 Formation of soil 7
1.6.2 Physical weathering 8
1.6.3 Chemical weathering 8
1.7 CONSTITUENTS OF SOIL
1.7.1 Gaseous constituents 9
1.7.2 Liquid constituents 10
1.7.3 Solid constituents 10

1.8 STRUCTURE OF THE BASIC CLAY MINERAL GROUPS 14
1.8.1 Basic layer types 18
1.8.2 Clay mineral groups 21
1.8.3 Mixed layer clay minerals 25
1.9 PROPERTIES OF SOILS 31
1.10 SOIL CLASSIFICATION 35
CHAPTER TWO
2.0 SOIL STABILISATION
2.1 Definition 41
2.1.1 Effect of soil stabilisation on the properties of
soil 41
2.2 Soil stabilisation methods 43
2.2.1 Mechanical stabilisation 44
2.2.2 Physical stabilisation 46
2.2.3 Chemical stabilisation 47
2.3 SOIL SUITABILITY 65
2.3.1 Guidelines for soil suitability 66
2.4 The need for and practice of soil stabilisation 68
2.5 Earth construction techniques 69
2.5.1 Rammed earth 69
2.5.2 Adobe 70
2.5.3 Compressed earth block 71
vi

CHAPTER THREE
3.0 SOIL SPECIFIC TO RESEARCH
3.1 Origin of the soil 78
3.1.1 Reasons for choice of soil 78
3.2 Laboratory analysis of soil 79
3.2. Atterberg Limits 79
3.2.1 Results of Atterberg Limits 80
3.2.2 Particle size distribution 80
3.2.3 Results of particle size distribution 81
3.2.4 Mineralogical analysis of the soil 83
3.2.5 Results of mineralogical analysis 84
3.3 Classification of Panfontein soil 85
3.4 Problematic properties of the soil 85
3.4.1 Modification of problematic properties 86
3.5 Initial consumption of lime test 88
3.5.1 ICL test results 88
3.5.2 Atterberg limits of the lime-modified soil 89
3.5.3 Mineralogical changes due to addition of lime 91
CHAPTER FOUR
4.0 Materials preparation and test block manufacturing
4.1 Stabilising agents 95
4.1.1 Ordinary Portland Cement 95
4.1.2 Hydrated Lime 95
4.1.3 Fly-Ash 97
vii
98
100100101
102
102
105
106
108
112
114
119
122
124
130
132
134
137
141
144
4.2 Stabiliser contents
4.3 Production of test blocks
4.3.1 Pre-processing of sludge
4.3.2 Pre-conditioning soil with lime
4.3.3 Determination of the optimum moisture content
4.3.4 Test block manufacturing process
CHAPTER FIVE
5.0 Tests conducted on the blocks
5.1 Introduction
5.1.1 Standards adopted for assessment of blocks
5.2 Unconfined compressive strength test
5.2.1 Test results
5.2.2 Discussion of test results
5.3 Drying shrinkage test
5.3.1 Test resu' '•
5.3.2 Discussion of test results
5.4 Water absorption test
5.4.1 Test results
5.4.2 Discussion of test results
5.5 Accelerated water erosion test
5.5.1 Test results
5.5.2 Discussion of test results
viii

5.6 Expansion due to water absorption
5.6.1 Test results
5.6.2 Discussion of test results
146
148
150
5.7 Mineralogical analysis of changes due to stabilisation 153
5.7.1 Results of mineralogical analysis 157
5.7.2 Discussion of results 159
5.7.3 Conclusion 169
CHAPTER SIX
6.0 General conclusions 170
APPENDICES 174
REFERENCES 189
ix

LIST OF FIGURES
Figure 1.1 : A single silica tetrahedron 15
Figure 1.2 : Silica tetrahedrons arranged in a hexagonal network 15
Figure 1.3 : Three hexagons joined into a double chain 15
Figure 1.4: A single octahedral unit 17
Figure 1.5 : Several octahedral units joined into an octahedral sheet
Structure 17
Figure 1.6 : Sketch Of Kaolinite 18
Figure 1,7 : Sketch of Muscovite 20
Figure 1.8 : Difference between external and internal surface areas of
clay minerals 24
Figure 1.9: Mixed-layer lliite/smectite 29
Figure 1.10: Graphical representation of stacking arrangements in mixed-
layered clays 30
Figure 1.11: Gravelly soil 31
Figure 1.12: Sandy soil 32
Figure 1.13: Silty soil 32
Figure 1.14: Clayey soil 32
Figure 1.15: Plasticity chart for the Unified Soil Classification System 36
Figure 1,16: Gradation curves for soil classification example, 37
Figure 2.1: Dispersed and Flocculated structure 45
Figure 2.2: Structure 45
Figure 2.3: Ideal particle distribution curve for stabilised soil and its
limit* of tolerance 46
Figure 2.4: Flue units in random orientation 51
Figure 2.5: Mechanism of lime stabilisation of clay soil 55
Figure 2.6: Recommended particle size distribution 67
Figure 2.7: Recommended plasticity limits 67
X
N

Figure 3.1: Liquid limit device 81
Figure 3.2: Grooving Tool 81
Figure 3.3: Example of a flow curve 85
Figure 3.4: Graphical representation of the particle size distribution
curve of the Panfontein soil. 98
Figure 3.5: Diffraction spectrum of the unstabilised Panfontein soil 100
Figure 3.6: ICL test results 106
Figure 3.7: Changes in the Atterberg limits after addition of 4% lime 107
Figure 3.8: Change in the linear shrinkage after addition of 4% lime 108
Figure 3.9: . Diffraction pattern of 4% lime stabilised soil. 110
Figure 3.10: Diffraction pattern of 7% lime stabilised soil. 111
Figure 4.1: Hydraform block in elevation 121
Figure 5.1: Preparation of block for UCS test 128
Figure 5.2: UCS test results for lime-stabilised blocks 134
Figure 5.3: UCS test results for lime-cement-fly ash stabilised blocks 134
Figure 5,4: Wet UCS of lime-cement-fly ash stabilised blocks 135
Figure 5.5: Shrinkage reduction achieved by lime stabilisation 142
Figure 5.6: Reduction in shrinkage achieved by lime-cement
stabilisation 142
Figure 5.7: Drying shrinkage of lime and lime-cement stabilised
blocks (7% lime) 144
Figure 5.8: Drying shrinkage of lime and lime-cement stabilised
blocks (9% lime) 144
Figure 5.9: Drying shrinkage of lime and lime-cement and lime-cement-
Fly ash stabilised blocks. 145
Figure 5.10 Water absorption for lime-cement stabilised blocks 151
Figure 5.11: Water absorption for lime-cement-fly ash stabilised blocks 152
xi

Figure 5.12: Cumulative affect of various stabilisation combinations on
water absorptivity 153
Figure 5.13: Diagram of the accelerated erosion test rig 157
Figure 5.14: Effect of lime and cement content on expansion due to
water absorption 167
Figure 5.15: Effect of fly ash content on expansion due to water
absorption 168
Figure 5.16: XRD spectrum of the unstabilised Panfontein soil 175
Figure 5.17: XRD spectrum of B1 176
Figure 5.18: XRD spectrum of 82 176
Figure 5.19: XRD spectrum of C1 177
Figure 5.20; XRD spectrum of C2 178
Figure 5.21: XRD spectrum of D1 179
Figure 5.22: XRD spectrum of D2 179
Figure 5.23: XRD spectrum of D3 180
Figure 5.24: XRD spectrum of D4 180
Figure 5.25: XRD spectrum of K1 181
Figure 5.26: XRD spectrum of N1 182
Figure 5.27: XRD spectrum of 01 182
Figure 5.28: XRD spectrum of K4 183
Figure 5.29: XRD spectrum of N4 183
Figure 5.30: XRD spectrum of 04 • 184
xii

LIST OF TABLES PAGE
Table 1.1 : USOS symbols used to classify soils 35
Table 1.2: Unified Soil Classification System Chart 39
Table 2.1 : Compound composition of South African Portland cement 56
Table 2 .2 : Common cement types v 60
Table 3.1 : Results of particle size distribution analysis 97
Table 4.1 : Chemical analysis of hydrated lime 113
Table 4.2: Chemical analysis of fly ash 114
Table 4.3 : Lime content for lime-stabilised blocks 115
Table 4 .4 : Stabiliser contents for lime-cement stabilised blocks 115
Table 4.5 : Stabiliser contents for lime-cement stabilised blocks 116
Table 4.6 : Stabiliser contents for lime-cement-fly ash stabilised blocks 116
Table 5.1 : UCS for unstabilised and lime-stabilised blocks 129
Table 5.2: UCS for mix K 129
Table 5 .3 : UCS for mix N 130
Table 5.4: UCS for mix 0 130
Table 5.5 : UCS for mix I 130
Table 5.6: UCS for mix H 130
Table 5.7: UCS for mix J 131
Table 5 .8 : Drying shrinkage for mix M & L 139
Table 5.9 : Drying shrinkage for mix K 139
Table 5.10 : Drying shrinkage for mix N 139
Table 5.11: Drying shrinkage for mix O 140
Table 5.12: Drying shrinkage for mix I 140
Table 5.13: Drying shrinkage for mix H 140
Table 5,14 : Drying shrinkage for mix J 141
Table 5.15: Water absorption of mix K 149
Table 5.16: Water absorption of mix N 149
Table 5.17: Water absorption of mix O 149
Table 5.18: Water absorption of mix I - 150
x iii

Table 5.19 : Water absorption of mix H 150
Table 5.20 : Water absorption of mix J 150
Table 5.21 : Results of the accelerated erosion test for mix L 158
Table 5.22 : Results of the accelerated erosion test for mix K 158
Table 5.23 : Results of the accelerated erosion test for mix N 159
Table 5.24: Results of the accelerated erosion test for mix 0 159
Table 5.25 : Results of the accelerated erosion test for mix I 160
Table 5.26 : Results of the accelerated erosion test for mix H 160
Table 5.27 : Expansion due to water absorption (mix K) 165
Table 5.28 : Expansion due to water absorption (mix N) 165
Table 5.29-: Expansion due to water absorption (mix 0) 165
Table 5.30: Expansion due to water absorption (mix I) 166
Table 5.31 : Expansion due to water absorption (mix H) 166
Table 5.32: Expansion due to water absorption (mix J) 166
Table 5.33 : Mix design parameters used in x-ray diffraction analysis 172
Table 5.34: Results of XRD quantitative analysis 174

CHAPTER ONE

1.0 INTRODUCTION
Thirty percent of the world's population, or nearly 1 500 000 000 human beings,
live in a home of unbaked earth. Roughly 50% of the population of developing
countries, the majority of rural populations, and at least 20% of urban and sub
urban populations live in earth homes. Confronted with a twin crisis of economy
and energy the industrialised countries have started a dialogue on the revival of
earth as a building material and are backing research programmes and
developing applications. The United States have officially recognised the use of
adobe and rammed earth by integrating these construction techniques into
national and regional standards. France has outlined the areas in which research
into earth as a building material should be concentrated in the coming years. The
budget devoted to research into these priority areas is close to 24 million francs,
83% of which will go into operational research and training. Programm e of
research have also been started in Germany, Switzerland, and Belgium.
In the developing countries, construction in earth appears to be an effective
means of building homes in the short term so that the greatest number of people
can be housed, while at the same time encouraging the use of local resources for
building materials, the training of building technicians and craftsmen, and the
creation of jobs. A material is not attractive in itself but rather in terms of what it
can do for society as a whole. [45]
1.1 Need fo r housing
The demand for homes in the developing countries at the present time is
immense. Recent statistics ( U.N. housing conference 1994 ) show that no less
than 36 000 000 homes must be built by the year 2000 for the urban population
of Africa alone. The backlog of housing in South Africa has been variously
estimated as more than one million units.
i

1.2 Need for alternative construction methods and materials.
In this age, where the natural resources are being consumed at an increasing
rate, it is important to consider alternative materials and processes for the
production of building materials. To solve the problem of supplying adequate
housing in South Africa in order to solve the housing shortage new construction
materials must also be considered, to determine if these materials can provide a
cheaper alternative to conventional building materials. The use of earth and by
products from manufacturing processes must also be considered. The use of by
products, can be particularly advantageous, as the materials will not require
'mining', quarrying and processing as is the case in many of the conventional
building materials. This will also alleviate the need for disposal of these materials,
which also has economic ramifications.
The use of earth as a construction material is in no way a new idea and has been
used extensively throughout the history of mankind. However, it is regarded as
an inferior building material by many who have no experience of using it but who
favour more "modern" and "sophisticated" materials such as kiln-fired clay bricks,
or concrete masonry units. The reason for the distrust of soil as a building
material is possibly humanity's slavish adherence to fashion on the one hand and
the ad hoc approach that has been adopted to the use of soil-based building
materials on the other. [60]
1.3 History of earth as a construction material
Ever since man first congregated in villages almost 10 000 years ago, unbaked
earth has.been one of the principal building materials used in every continent.
Over one third of the world's population still lives in earth houses today. In
ancient times, unbaked earth was widely used in Mesopotamia and Egypt, while
later on, Romans and the Muslims built in earth in Europe, Africa and the Middle
East - as did the peoples of the Indus civilizations, Buddhist monks and Chinese
2

emperors. During the Middle Ages, construction in unbaked earth was practiced
not only in Europe, but in North America by the Indians, in Mexico by the Toltecs
and the Aztecs, and in the Andes by the Mochica. The Spanish conquerors of
America took with them European techniques of earth architecture and grafted
them onto traditions already established there. In Africa, this art was mastered in
cultures as diverse as those of the Berbers, the Dogons, and Ashanti, the
Bamilikes or the Haoussas, in the kingdoms of Ife and the Dahomey and in the
Empires of Ghana and Mali. [16]
Throughout the world, archaeological remains survive of cities built entirely of
raw earth [62] : history's earliest city, Jericho, begun almost 10 000 years ago;
Catal Huyuk in Turkey; Harappa and Mohenjo-Daro in Pakistan; Akhlet-Aton in
Egypt; Chan-Chan in Peru; Babylon in Iraq; Zucheros near Cordoba in Spain;
and Khirokitia in Cyprus. Very often, modern cities have been established on the
sites of these ancient towns, and many recent buildings are also constructed out
o f raw earth. Examples of this include ‘Lugdunum’, the capital of Roman Gaul
which later became the city of Lyon, and many of the cities born out of the
Spanish conquest of the Americas, such as Santa Fe, the capital of New Mexico,
and Bogota, the capital of Columbia. This tradition has been maintained in a
number of cities in Africa and the Middle East: Kano in Nigeria, Agadez in Niger,
Tombouctou in Mali, Oualata in Mauritania, Marakesh in Morocco, Adar in
Algeria, Ghadames in Libya, Sa'dah in North Yemen, Shibah in South Yemen
and Yazd in Iran. Earth architecture in rural communities has been still more
widespread and varied. Many familiar examples are to be found in Asia, Africa,
and the Middle East and Latin America, while those in Europe and the USA are
less well known. There are thousands of earth buildings both in the dry regions
such as Spain and Italy and in the rainy countries like England, Germany,
Denmark and Sweden. In France, at least 15 percent of rural buildings are still
made of raw earth, and numerous examples survive near Lyons, Reims,
Grenoble, Toulouse, Rennes, Avignon and even Chartres, close to Paris.

Unbaked earth has been used for thousands of years not only in rural housing,
but also for the vast prestigious monuments that reflect the material and spiritual
development of communities - warehouses and aqueducts, ziggurats and
pyramids, monasteries, churches and mosques. In these, mankind's creative
drive seemed to reach its full expression. In the 7th century BC even the famous
Tower of Babylon was built of earth, its seventh level teetering at 90m -
mankind's first skyscraper. That record breaking creation succumbed to the
social chaos for which it has become the symbol, but the Great Wall of China, of
which large parts are of unbaked earth, has managed to survive since the 3rd
century BC, and testifies - as do many other monuments - to the enduring
strength of this material. It is on account of these qualities that cities throughout
the world have been protected by unbaked earth defences - from as early as the
walls of Jericho, until 1882, when Tiznit, in Morocco, became perhaps the last
city to be provided with earth ramparts.
Milita y strategists, too, have from ancient times recognized the virtues of earth
as a strong and resistant building material. The Roman historian Pliny the Elder
relates how in Spain, in about 219 BC, Hannibal constructed buildings out of
unbaked earth; just as the American army used it during the Second World War
fo r the erection of dams, military camps and airstrips.
It is not only the world's decision-makers who appreciate the architectural
qualities of unbaked earth, for the greater majority of earth buildings have been,
and still are, residential houses. These buildings come in a surprising variety of
forms, each indicative of the cultural characteristics of their builders. All over the
world, from Scandinavia to South Africa, earth constructions have been adapted
to suit the most diverse types of climate. [15]
4
j

1.4 Earth as a construction material
The success of soil construction is in the material itself. Soil is a building material,
which is abundant throughout the world and available on most potential building
sites. Soil, having proved itself as a successful building material throughout the
world [1,21,29,39,46,53] may therefore offer a cheap alternative, which can be
supplied at a rate equal to consumption. An essential component in soil is clay.
Clay is a cohesive material that serves to bind sand particles together. Not every
soil has sufficient clay content for construction purposes and some soils may
contain no clay. These soils can therefore not be used in manufacturing rammed
earth or soil bricks. [66]
On the opposite extreme, a soil with a high clay content also creates certain
problems in the manufacture of soil based building materials. Clays tend to have
a high affinity for water, which causes them to expand and contract with changes
in moisture content (ibid.). Soils containing too much clay tend to fragment when
dry because of the close pattern of cracking they develop. [53]
Soils contain various combinations of the components which make up a soil (i.e.
gravel, sand, silt and clay). These components provide soils with the varying
properties which they posses. A thorough understanding of a soil based on its
properties is therefore required when considering it as a construction material to
ensure a quality end-product.
1.5 Soil stabilisation
The properties of a soil determine its suitability as a construction material.
Depending on the type of soil and its intended use as a construction material, a
soil may have properties which make it suitable as a construction material.
However a soil will often have properties which do not make it suitable as a
construction material in this case, a technique known as soil stabilisation can be
applied to the soil. Soil stabilisation involves the modification of those properties
5

of a soil, which may make it unsuitable for construction purposes. The
modification of the properties is due to changes in the mineralogy and structure
of the soil brought about by the addition of stabilsers.
Therefore with a thorough understanding of a soil and its properties, combined
with soil stabilisation techniques, a soil can be successfully used as a
construction material.
This report considers the use of a clayey soil, which is a by-product of a water
purification process as a potential construction material. The objectives of the
research are:
I. By application of soil science and soil stabilisation principles to produce
compressed earth blocks which can be used in the construction of a
building.
II. A study of the mineralogical changes which take place in the soil as a
result of the stabilisation process.
6

1.6 SOIL
Soil is a stage in a long process of deterioration of the parent rock and its
physico-chemical evolution. Depending on the parent rock and climatic
conditions soil appears in a myriad of forms possessing a myriad of
characteristics.
1.6.1 Formation of Soils
In general, in-situ soils may be regarded as the uncemented mantle of
disintegrated and decomposed rock material differentiated into horizons from the
parent rock material below, in morphology and physical properties, in a broad
sense, soil formation is the result of a vast geological cycle occurring
continuously and relentlessly throughout the geological time scale. The three
principal phases of the cycle are erosion, transportation and deposition, and
earth movement. [54]
1.6.2 Physical and chemical weathering
Exposed rocks are eroded and degraded by the physical and chemical process
of weathering. The weathered material is transported to new locations by wind,
water and glaciers. It may, finally, be deposited as soil material in various
landforms. The atmosphere, biosphere and hydrosphere are the reactors in a
vast chemical process with the surface of the lithosphere to produce the earth's
crust. [46]
Each reactor consists of a complex chemical process that is intimately
associated with the physical process. The reaction is cited as: [75]
(Atmosphere + Biosphere + Hydrosphere) + Lithosphere
i = > Weathered lithosphere + residual materials
+ dissolved chemical elements.
7

Weathering is at its highest intensity where the interfaces between the
hydrosphere, biosphere and lithosphere overlap, e.g. upper soil zones in the
temperate humid climatic regions and deeper soil zones in the humid tropics.[75]
The factors controlling the process of weathering of rock are the characteristics
of parent rock, topography, climatic conditions, vegetation and time. The
processes involved in the formation of soil by weathering of rocks include
oxidation, carbonation, hydrolysis and hydration. Weathering is a spontaneous
reaction involving geologic material and energy and is a change towards the
decrease of the free energy of the system. [46]
Physical weathering
Physical weathering takes place when solid rocks are broken into fragments with
little or no chemical change in the rock itself. Mechanical disintegration yields
mineral components of soils. Temperature change, by itself, independently can
disintegrate rocks into fragments by exfoliation. Rocks may also be broken and
degraded by wedging action of ice and spreading roots. Water, wind and moving
ice (glaciers), although they play their primary role in the transport of soil material
from one location to another, are powerful agents in scouring and eroding rock
formations. The size and shape of fragmented products are influenced by
structure as well as texture of the parent rock material and cementing agents[63].
In igneous and metamorphic rocks the grain size and packing influence the
disintegration process. Due to the thermal expansion of the constituent minerals,
in coarse-grained granular rock, disintegration is more rapid than in one of finer
grains.
Chemical weathering
Apart from the physical degradation, surface chemical reactions between rocks
and environment might take place. In chemical weathering, original rock minerals
are transformed into new minerals by chemical reactions. There are two types of

chemical weathering. If chemical reactions are inorganic, it is regarded as
geochemical. Another type is pedochemica! weathering, reflecting the biological
activity as a result of organisms and organic solutions reacting with rocks [63].
The magnitude cf chemical weathering is dependent on the amount of water with
or without electrolytes that is available to leach rocks and on the drainage
characteristics of the resultant soil minerals. Silica is slightly soluble at all pH
values, whereas alumina is soluble only below pH 4 and above 8.5. Water with
its content of cations and anions is the reagent that causes hydrolysis, a reaction
between a salt and water to give an acid and a base. Clays, laterites and
bauxites are formed by hydrolysis. Other chemical processes of decomposition
are carbonation in which minerals are attacked by carbonic acid, and oxidation in
which oxygen combines with the minerals of rock.
The climate of any region conditions the flora that grows there. The growth and
decay of flora provides raw organic matter. This, through the action of micro-flora
and chemical processes, produces soil humus. The presence of flora and the
reaction of its products reacting with the mineral particles of weathered rocks
changes geochemical weathering in to pedochemical weathering and affects the
consequent development of soils.
1.7 CONSTITUENTS OF SOIL
Soil is made up of three main constituents, namely gaseous, liquid and solid
phases. The gas constituents being primarily air, the liquid mainly water and the
solids primarily mineral and organic materials.
1.7.1 Gaseous constituents
These form the internal atmosphere of the soil. They fill the voids in the soil and
come from the outside atmosphere, organic life in the soil and the decomposition
o f organic material. Air's components include nitrogen, oxygen, and carbon
dioxide. Gases resulting from organic decay, and respiration of living creatures
9

include carbon dioxide, carbon monoxide, hydrogen, and methane. There may
also be traces of sulphur dioxide, hydrogen sulphide and a range of other organic
gases and vapours.
1.7.2 Liquid constituents
These are basically aqueous solutions of salts. These constituents are soluble in
water and come from the rain and atmospheric conditions (mist, relative
humidity), mankind, the weathering of rock and decay of organic material. The
liquid constituents are water, soluble substances dissolved in this water such as
organic compounds (sugars, alcohols, organic acids) and mineral compounds
(acids, bases and salts partly dissociated into ions Ca% Mg'"', K+, Na+, PO43",
S042',C032', NO32', etc.).
1.7.3 Solid constituents
The solid fraction of soil is made up of minerals resulting from the physical
dissociation and chemical alteration of the parent rock material, and organic
materials, which are basically the more or less decomposed remains of plant and
animal organisms, [75]
Organic matter
Usually, organic matter is concentrated in the surface horizon of the soil, over a
depth of between 5 and 35cm. Sometimes organic matter may contain visible
plant components. Elsewhere the decomposition of the plant structure is so
advanced that a black material is encountered. This is called humus.
Recently decomposed organic matter has different properties than humus. It
consists of macrograins or fibres that are relatively inert from the physical or
chemical point of view.
10

Humus is colloidal and acidic, with a very high cation exchange capacity and the
ability to absorb water, which increases its volume.
Organic matter has an open and spongy structure and has only low mechanical
strength. The moisture content may be very high (from 100 to 500%) eliminating
all mechanical stability. The acidity of the organic components tends to trigger
acid reactions in the soil, which may lead to the corrosive attack on materials with
which it comes into contact. The concentration and type of organic matter has
marked effects on the characteristics of a natural soil once it exceeds 2 to 4%.
[39]
Mineral matter
The mineral or inorganic components of a soil usually represent by far the
greatest part of the soil.
Two groups of minerals may be distinguished: [63]
Unweathered minerals or incompletely weathered minerals. These minerals are
identical in composition to the parent rock from which they derive. They include
pebbles and gravels and fine and coarse sands . These are the sandy elements.
Weathered minerals are the result of the chemical weathering of the minerals of
the parent rock and are characteristed by their extreme fineness (less than 2pm).
Because of their smallness these grains of weathered mineral have the
appearance of a sticky paste if they are wet. They are called colloids, which
derives from the French coile (glue) and means ‘glue-like’. They were given this
name because they form the binder in the soil. The main binders are the clays
and for this reason engineering geology refers to them as the clayey fraction
rather than the colloidal fraction.
l l

Sandy elements
These may be silicas, silicates, or limestones.
Silicas These are grains of quartz resulting from the disintegration of
sandstone and crystalline rocks. They are found in both the larger and finer
fractions.
Silicates The chemical weathering of these proceeds continuously but is
very slo’ . They are made of grains of mica, feldspar and other free minerals
resulting from the disintegration of crystalline rocks such as granite and volcanic
rocks. The weathering of these elements is increasingly effective as grain size is
reduced.
Limestones This is the part of those sandy soils which are made from calcium
carbonate. A distinction must be made between soils created on a limestone
parent rock and the soils formed on a non-limestone parent rock. Limestone L
not always present in the soil but all soils contain calcium fixed on clay in the
form of calcium ions or in soil solution in the form of soluble calcium salts.
Classification of mineral components
In order to facilitate their identification, the mineral components have been
divided into grain fractions.
Pebbles
Pebbles range in size from 20-200mm. They form a rough material which is the
result of the disintegration of the parent rock from which they draw their basic
characteristics. They may also have been carried from elsewhere. Young
12

pebbles still have sharp corners. Severely weathered pebbles, as well as those
that have been carried by watercourses or glaciers are rounded.
Gravel
Grave! ranges in size from 2 to 20mm. It is made up of small grains of rough
material, which are the result of the disintegration of the parent rock and pebbles.
They may also have been carried by watercourses and thus be rounded, though
angular gravel also exists. Gravel constitutes the skeleton of the soil and
imposes a limit to its capillarity and shrinkage.
Sands ..
Sand ranges in size from 0.06 to 2mm. It is often made up of particles of silica or
quartz. Its high internal friction marks the sandy component of a soil. The low
adsorption of these surfaces limits swell and shrinkage. The open structure and
permeability are typical of sands.
Silt
The grain size of the silt ranges from 0.002mm (2pm) to 0.06mm. From the
physical and chemical point of view the silt component is virtually identical to the
sand component, the only difference being one of size. Silt gives soil stability by
increasing its internal friction. Because of their high degree of permeability silty
soils are very sensitive to frost. They are subject to small-scale swell and
shrinkage.
Clays
Clay grains are smaller than 2pm. They differ from sand and silt particles not only
in size but also in their chemical composition and physical properties. In chemical
terms they are hydrated alumino-silicates formed by the leaching process acting
on the primary minerals in rock. The key to clay mineralogy is the small diameter
of the mineral grains and their crystallographic habit, which is sheet-like. These
two factors give clays a very high surface area relative to the mass of material in
13

the clay mineral crystal grains. Their specific surface is infinitely greater than that
of rougher round or angular particles. This large surface area gives the properties
of water absorption common to all hydrophilic materials. [39] The surface residual
charges on the mineral structure attract and adsorb water in layers. Clays are
very susceptible to swell and shrinkage due to their affinity for moisture which
when adsorbed causes swelling and when the water evaporates shrinkage
occurs.
Large clay molecules (or micelles) are fine crystals of an irregular or hexagonal
shape. The latter is the most common, but there are others. These include
pseudo-hexagonal wafers, cylindrical or hollow tubular fibers, thick tablets or
discs. Clay .micelles are made up of thin sheets or leaves, which is why
argillaceous minerals (minerals composed of very fine-grained material) are
referred to as phyllite ('phyllon' = leaf in Greek). Each micelle is made up. of
several tens or even hundreds of sheets, the structure of which determines that
of the minerals as well the immediate properties of the crystal, including
adsorbent properties analogous to those of colloids. These sheets have a
chemical make-up which varies according to the type of clay and the degree of
hydration as well as their thickness and spacing, namely from 7 to 20 Angstrom
(1A = 10 millionth of a mm). Some sheets are made of silica (atoms of silicon
surrounded by oxygen atoms), and others are made of alumina (aluminium
atoms surrounded by oxygen atoms and OH groups)
1.8 STRUCTURE OF BASIC CLAY MINERAL GROUPS
Clay minerals as a group are largely phyllosilicates. Silicates are made of SiOT4
ionic groups in combination with metallic cations (positively charged ions).
Oxygen is much larger in size than most of the cations, so volumetrically oxygen
makes up the bulk of the silicates. Silicate minerals, as well as the earth's entire
crust, can be visualised as being made up of close-packed oxygens with smaller
cations filling the interstices. [20]
14

The Silica Tetrahedron
Silicate minerals have as their basic building block the SiOV silica tetrahedron
consisting of a silicon surrounded by four oxygens’ in a tetrahedral configuration.
(a)O O x y g e n s
Figure 1.1: A single silica tetrahedron.
(b )
O 9 Silicons
Figure 1.2: Silica tetrahedrons arranged in a hexagonal network.
Figure 1.3: Three hexagons joined into a double chain
15

The tetrahedral sheet
The great number and variety of silicate minerals result in part from the ability of
silica tetrahedra to link together in various ways by sharing apical oxygens,
(figure 1.2)
Tetrahedron faces and edges are rarely shared because this brings the highly
charged silicons too close to each other. Note that in figure 1.1-1.5, the oxygens
are shown as much too small, actually they are all touching. Phyllosilicates are
characterised by silica tetrahedra linked to form sheets, and in clay minerals
these sheets consist of six membered rings of tetrahedra each of which shares 3
of 4 oxygens. The unshared oxygens in one sheet all point in the same direction.
Note that the sheet consists of two planes of oxygens, but there are more
oxygens in the lower than the upper plane. The formula for a tetrahedral sheet is
Si40io’4, and since it has negative charge, it can only exist in combination with
cations and additional oxygens in actual mineral structures. Tetrahedral
coordination can accommodate only the smaller cations. These are silicon, less
commonly aluminum, and rarely Fe3*.
The octahedral sheet
In phyllosilicate clay minerals, the tetrahedral sheet is always combined in one of
several ways with an octahedral sheet consisting of cations surrounded by 6
nearest neighbors (figure 1.4). This configuration accommodates the larger
cations such as Al+3, Mg+2 , Fe+2 , Fe+3 , but not Ca+2 , Na+1 , or K+1 which are
too large.[24] The octahedral sheet consists of two planes of hexagonally close-
packed oxygens or hydroxyls (which are nearly the same size as oxygens). If we
visualise the first of these planes we will see that between every 3 balls there is a
low point or hollow, this is alternately occupied by the cations, or by the oxygens
(or OH") of the upper plane. The octahedral designation stems from the fact that
connecting the 6 nearest neighbor oxygens or hydroxyls forms an eight sided
solid: an octahedron. In the octahedral sheet, the octahedron is lying on one of
its faces (figure 1.4).
16

o H y d r o x y l s
Figure 1.4: A single octahedral unit.
Unlike the tetrahedral sheet, the octahedral sheet can exist by itself. The
minerals brucite, Mg3(OH)6 and gibbsite, AbCOHje are composed entirely of
octahedral sheets. The structure shown in figure 1.5 is brucite; note that ail the
cation positions are filled. In the gibbsite structure only 2/3 of these positions
contain cations. This gives rise to an important pair of structural terms: brucite is
trioctahedral (3/3 of positions filled), and gibbsite is dioctahedral (2/3 of positions
filled).
Figure 1.5: Several octahedral units joined into an octahedral sheet structure.[25]
Q A l u m i n u m s , M a g n e s i u m s , e t c .
17

1.8.1 Basic layer types
The 1:1 layer
The simplest phyllosilicate clay mineral structure combines one octahedral and
one tetrahedral sheet to form a 1:1 layer. The layer can be either dioctahedral or
trioctahedral. [72]
Assuming that the tetrahedral and octahedral sheets can be assembled to form a
1:1 layer the unshared apical oxygens in the tetrahedral sheet become part of the
octahedral sheet, substituting for hydroxyls (figure 1.6 below). Thus, a 1:1 layer
consists of three planes of large anions (OH", or 0 =) within which are a plane of
octahedral cations and a plane of silicons. If the octahedral sheet is on the
bottom, then the first plane is all OH", then come the octahedral cations, then a
plane of both OH" and (OH", or 0 =) (the tips of the tetrahedra), then silicons,
then a plane entirely of 0 = . The middle plane of large anions (OH", 0 =) is part of
both the tetrahedral and octahedral sheets. In figure 1.6 the incomplete layer of
the top is part of the next 1:1 layer identical to the first.
O O x y g e n s
@ H y d r o x y l s
A l u m i n u m s
@ O S i l i c o n s
Figure 1.6: Sketch of kaolinite, 1:1 dioctahedral phyllosilicate.
(25]
18

The 2:1 layer
The other major layer type consists of two tetrahedral and one octahedral sheet,
which together form the 2:1 layer. This can be visualised figure 1.7) as similar to
the 1:1, but with another tetrahedral sheet inverted with respect to the first. In
figure 1.7, the lowermost tetrahedral sheet is an incomplete part of the next 2:1
layer. The whole layer consists of 4 planes of large anions (OH", 0 = ) and 3
planes of cations. The bottom is all oxygens, then a plane of silicons, then a
plane of mixed OH" and 0 =, then the octahedral cations, then another mixed
plane, then another plane of silicons and finally a plane of oxygens. The
octahedral sheet is made, in part, of the oxygens from the inward pointing
tetrahedra above and below. The 2:1 layer can be either dioctahedral or
trioctahedral.
Individual 1:1 or 2:1 layers (neglecting broken bonds on the edges) can be either
neutral or bear a negative charge, balanced by cations between the layers in the
interlayer space. The layer charge is controlled by the substitution of cations in
the tetrahedral or the octahedral sheets. Layer charge arising from tetrahedral
substitution is called tetrahedral charge; charge arising from octahedral
substitution is called octahedral charge. Different ways of stacking identical
layers produces various polytypes (a variety of polymorph or isomer). Stacking
individual layers of different type, composition, or charge produces mixed layered
clays. The mixed layered can be ordered or random/irregular.
19

I\
r )
O Oxygens © H ydroxy ls ® Alum inum (^ P o ta s s iu mO 6 Silicons (on e fourth rep laced by alum inum s)
Figure 1.7: Sketch of Muscovite, a 2:1 dioctahedral phyllosilicate.
[25]
20

Cation exchange capacity (CEC)
The cation exchange capacity is a measure of the capacity of a clay to exchange
cations. Units of measure are milliequivaients per 100 grams of clay (meq/100g;
an "equivalent” of an ion is its molecular weight divided by its valence; thus, an
equivalent of N H / is 18/1 = 18, an equivalent of Na+ is 23/1 = 23, and an
equivalent of Ca+2 is 40/2 = 20). The CEC is a measure of the concentration of
unfixed cations in the diffuse layer (interlayers and surface layers), which, as
described above, depends on the magnitude of the total (structural plus surface)
layer charge, which in turn varies with pH. The CEC is usually measured at a pH
of 7. •
1.8.2 Clay mineral groups
Each clay mineral group is characterized by a particular type of layer structure
and interlayer material. There are three major clay groups, these are the kaolinite
group, the il,. .e/mica group and the smectite/montmorillonite groups.
Mineralogically, clay may contain a variety of components such as kaolinite,
vermiculite, illite, chlorite and montmorillonite. [49]
T E T R A H E D R O N O F S I L i C A O C T A H E D R O N O r A L U M I N A N e g a t i v e c h a r g e s L A Y E R SA l u m i n a
Q S i + + * + S i l i c o n
O O ' " O x y g e nA l u m i n i u m
S i l i c a0 O H - H y d r o x i d eV e r y n e g a t i v e c h a r g e s
21

Kaolinites
Kaolinites fall into the 1:1 layer group. The sheets found in kaolinite clays are
made up of a layer of oxygen tetrahedrons with a silicon centre and a layer of
oxygen (or hydroxide) octahedrons with an aluminium centre. A kaolinite sheet
has the following general formula:
In kaolinites, bonding between successive layers is both by van der Waals
forces and hydrogen bonds. This bonding is of sufficient strength that layers will
not separate in the presence of water (i.e. swell). Often other elements replace
the silicon and aluminium ions in the crystal. This does not effect the crystal as
long as they have the same valence electrons (e.g. Fe3+ replacing Ai3+). If they
are of a lower valency (e.g. Al3+ replacing Si41' or Mg2* replacing Al3+), the crystal
will be left with a net negative charge which will result in a positively charged ion
from the soil water being attracted to the crystal surface. Kaolinites undergo little
isomorphous substitution if any. Minerals of this group are therefore nearly inert,
but cation exchange capacities of 1 to 10 meq/100g have been measured.
Kaolinite is negatively charged only at the edge of the sheets and its ion fixing
capacity is low when compared to the other clay groups. The distance between
the sheets is constant, being 7A. The thickness of the crystals is between 0.005
and 2pm. The outer area (OA) is approximately 15m2 per gram. The internal area
(IA) = 0. Kaolinite is generally stable in contact with water. [39]
n (A l2 S i2 0 5 [0 H ]4 )
A d s o r b e n t o u t e r s u r f a c e K A O L I N I T E
7 L i t t l e oV n o i n t r a l a m e l l a r a d s o r p t i o n
T y p e 1 - 1 s t r u c t u r e ( 1 s i l i c o n l a y e r )
{1 a f u m t n t u m l a y e r )
S t r o n g i n t r a l a m e l l d r y b o n d - f i x e d d i s t a n c e
22
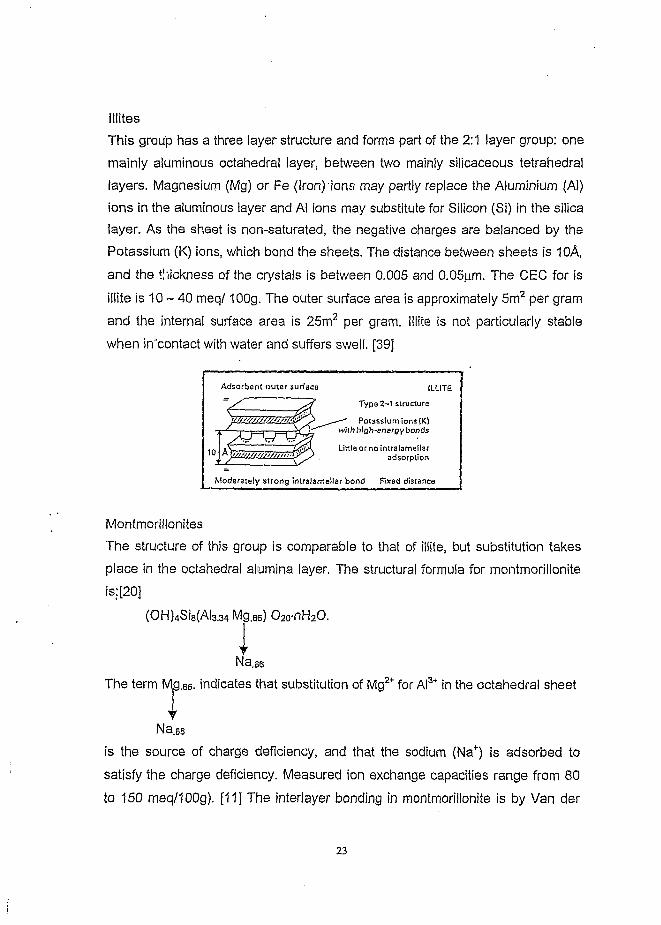
Illites
This group has a three layer structure and forms part of the 2:1 layer group: one
mainly aluminous octahedral layer, between two mainly silicaceous tetrahedral
layers. Magnesium (Mg) or Fe (Iron) ions may partly replace the Aluminium (Al)
ions in the aluminous layer and Al ions may substitute for Silicon (Si) in the silica
layer. As the sheet is non-saturated, the negative charges are balanced by the
Potassium (K) ions, which bond the sheets. The distance between sheets is 10A,
and the thickness of the crystals is between 0.005 and 0.05pm. The CEC for is
illite is 10 - 40 meq/ 100g. The outer surface area is approximately 5m2 per gram
and the internal surface area is 25m2 per gram. Illite is not particularly stable
when in'contact with water and suffers swell, [39]
A d s o r b e n t o u t e r s u r f a c e ( L U T ET y p e 2 - 1 s t r u c t u r eP o t a s s l u m i o n s I K )
b t g h - e n e z g y b o n d s
o r n o i n t r a l a m e l l a r a d s o r p t i o n
M o d e r a t e l y s t r o n g i n t r a l a m e l l a r b o n d F i x e d d i s t a n c e
w/ss//r//J7s/;t/'
10 / / / / / , . .
Montmorillonites
The structure of this group is comparable to that of illite, but substitution takes
place in the octahedral alumina layer. The structural formula for montmorillonite
is: [20]
(OH)4Sis(Al3.34 Mg.eie) Oao-nHaO.
VNa.es
The term Mg.ee. indicates that substitution of Mg2* for Al3* in the octahedral sheet
Na.es
is the source of charge deficiency, and that the sodium (Na+) is adsorbed to
satisfy the charge deficiency. Measured ion exchange capacities range from 80
to 150 meq/100g). [11] The interlayer bonding in montmorillonite is by Van der
23
|
Waals forces and by exchangeable cations that may be present to balance
charge deficiencies in the structure. These bonds are weak and can easily be
separated by cleavage or adsorption of water, and balancing cations take up
positions between the unit cell layers as well as on the surface of the particles.
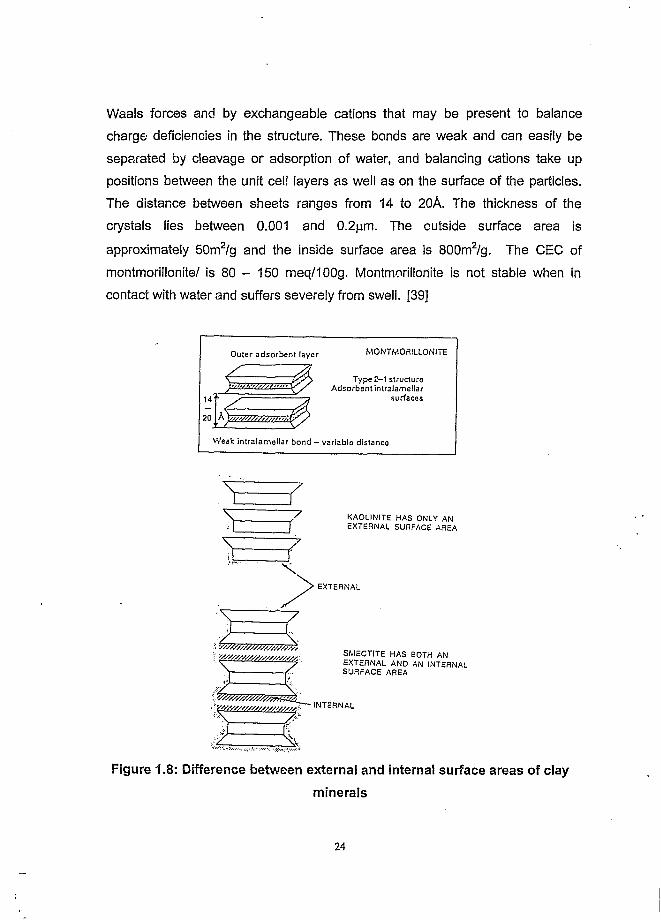
The distance between sheets ranges from 14 to 20A. The thickness of the
crystals lies between 0.001 and 0.2pm. The outside surface area is
approximately 50m2/g and the inside surface area is 800m2/g. The CEC of
montmorillonite/ is 80 - 150 meq/100g. Montmorillonite is not stable when in
contact with water and suffers severely from swell. [39]
O u t e r a d s o r b e n t l a y e r M O N T M O R I L L O N I T E
T y p e 2 - 1 s t r u c t u r e A d s o r b e n t l n t r a l a m e l l a r
s u r f a c e s
W e a k i n t r a l a m e l l a r b o n d - v a r i a b l e d i s t a n c e
K A O L I N I T E H A S O N L Y A N E X T E R N A L S U R F A C E A R E A
E X T E R N A L
S M E C T I T E H A S B O T H A N E X T E R N A L A N D A N I N T E R N A L S U R F A C E A R E A
I N T E R N A L
Figure 1.8: Difference between external and internal surface areas of clay
minerals
24

1.8.3 Mixed-layer clay minerals
Mixed-layered (ML) clay minerals (also called interstratified or interlayered) are
phyllosilicates in which two or more layer-types are intermixed in a vertical
stacking sequence within a single crystal. [75] They are not simple physical
mixtures of the component layers. Mixed-layering results from the fact that
bonding is strong within individual layers, but weak between layers, and different
types of layers have nearly identical configurations of tetrahedral oxygens
bounding their outer surfaces, so can fit together relatively well. Mixed-layer
clays are widespread in nature.
Layer Types
Most of the 1:1 and 2:1 layer-type minerals have been identified in ML clays. The
most commonly encountered layer minerals are illite, smectite, vermiculite and
chlorite. [11] Most natural ML clays in sedimentary rocks are composed of 2:1
layers; those involving 1:1 layers are rare. The 2:1 layers are fundamentally
similar, and differ only with respect to layer charge and interlayer materials. This
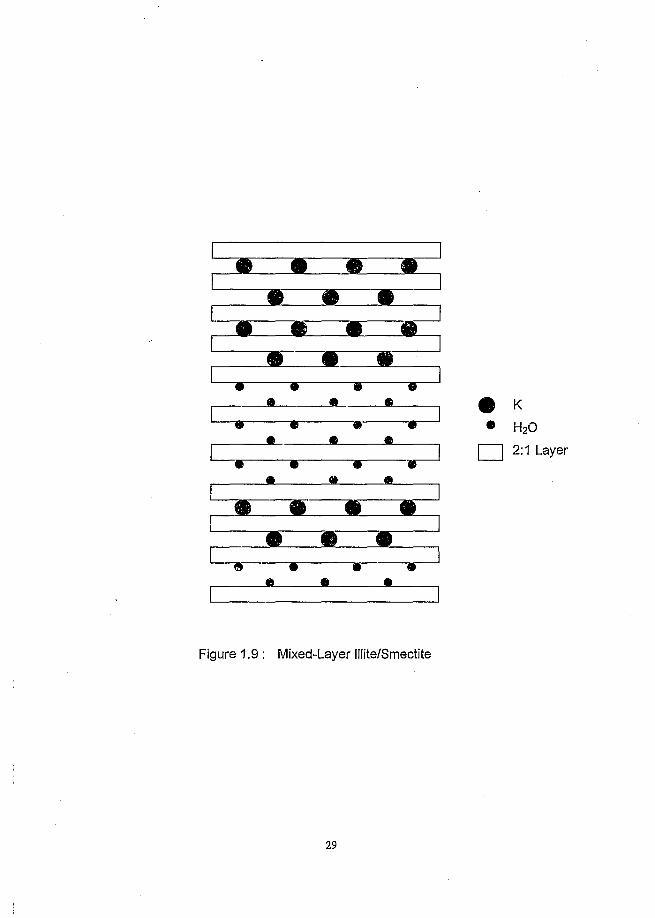
is illustrated in Figure 1.8 where the 2:1 layers are shown with a diagonally ruled
pattern. If the interlayer contains potassium it is a mica or illite layer with a 10 A
spacing and if it contains 2 water layers it is a smectite or vermiculite, and if it
contains a hydroxide sheet it is a chlorite layer; the latter two types have a 14 A
spacing. The 10 A, potassium-containing layers have been referred to as both
mica and illite, so that generally the following terms should be considered
synonymous: mica/smectite, illite/smectite, mica/montmoriilonite and
iilite/montmorillonite.[20]
25

Stacking Arrangement [19]
There are four basic ways of stacking the component layers(figure 1.10):
1. Regular interstratification of two components, each of which is present in
nearly equal amounts (figure. 1.10a).
2. Segregation into crystallites (figure 1.10b)
3. Random Mixed-Layering (figure 1.10c)
4. Regular Mixed-Layering (figure 1.10d)
The first two of these are important, but not common on nature, and the other two
describe the arrangements typical of ML clays.
1) Regular interstratification of two components, each of which is present in
nearly equal amounts (Fig. 1.10a).
Minerals in this category have layers which are repeated regularly (figure 1.9a).
Minerals in this category, because of their regularity, are given legitimate mineral
names, some of which are:
Rectorite - dioctahedral mica/smectito
Hydrobiotite - trioctahedral biotite/vermiculite
Corrensite - trioctathedral chlorite/smectite or chlorite/vermiculite
Tosudite- dioctahedral chlorite/smectite
Aliettite - talc/saponite
The layers do not necessarily follow each other in equal number of layers as
shown in figure 1.9a. Highly regular arrangements can be conceived in which the
proportions of layers are not equal, such as the AB BAB BABB with 33% "A"
layers. Some of these have been described in natural samples, but regularity is
insufficient to v/arrant a mineral name. Minerals such as rectorite are sometimes
described as "1:1 regular interstratification" where the prefix "1:1" refers to the
26

50-50 proportions of layers and not to a 1:1 layer type. The ABBABBA....
Sequence given above would then be a "1:2 regular interstratification".
The stacking arrangement of ML clay minerals can be stated in probability terms.
For the case of perfect 1:1 order (50-50) of A and B component layers, PA is the
probability (or proportion) of an A layer and PB of a B layer such that
PA + PB = 1
The probability of an A following a B is given by PA.B, and since in this example
A always follows B:
PA.B = PB.A = 1;
And, since AA and BB pairs are never found,
PA.A = PB.B = 0
2. Segregation into crystallites (figure 1.1 Ob)
Where stacks of identical layer-types are many layers thick they simply become
physical mixtures of the two components. Stacks just a few layers thick mixed in
various ways show XRD patterns unlike either of the components, but stacks of
identical layers perhaps 10 or more layers thick begin to show XRD peaks
characteristic of two separate phases. The probability expressions for this are:
PA.A = PB.B = 1, and
PB.A = PB.A = 0.
These expressions are based on the stacks being large, and do not consider the
A-B junction in the middle of figure 1.9b.
27

3. Random Mixed-Layering (figure 1.10c)
This type of interstratification is wide spread in nature. The components are
simply randomly mixed like the red and black cards in a shuffled deck. The XRD
peaks are characteristic of neither of the component phases. The probability
expressions for this are:
RA.A = PB.A = PA, and
PB.B = PA.B = PB.
That is, the probability of occurrence of an A following an A or a B, or of a B
following an A or a B simply depends on their abundance ( % of component
layers ) in the crystal, and does not depend on what preceded it. Random mixed-
layering is common in illite/smectites that have less than 50% illite layers.
4. Regular Mixed-Layering (figure 1.10d)
Interstratification can be perfectly ordered on an ABAB scheme even where the
proportion of component layers is not 1:1. This type of ordered mixed-layering is
very common, particularly with illite/smectites. If PA > 0.5 (greater than 50% A
layers), this ordering is given by the expression:
PB.B = 0
This means that the probability of a B being followed by a B is zero; that is there
are no BB pairs in the crystal. Such a clay would consist of perfect ABABAB....
ordering with the excess A randomly distributed such that there would be some
AA pairs or AAA triads, etc., but no BB pairs. Such a scheme is shown in figure
1.9d.
28
w ~ m # m
# # #mz j : : #
| 8 ^
1 -------- * ---------------- B--------- Wa_________m_____@
»---c------ e--- r a_____ e____e_■B---------B------------------B----------B~ • _________« #
# # ~ # m~
:: #z__#L_zsrzB ---------B------------------B----------B" a a____e
e k
• h 2o
I I 2:1 Layer
Figure 1.9 : Mixed-Layer Illite/Smectite
29

L",
a. regular interstratificationb. segregation into crystallitesc. random mixed layeringd. regular mixed layering
Figure 1.10: Graphical representations of stacking arrangements in
mixed-layered clays.
30

1.9 PROPERTIES OF SOILS
The properties of soils may vary considerably from one soil to another. They
depend on the complex nature of the mix of the various granular fractions. The
characteristics of the soil depend on the proportions of pebbles, gravel, sana, silt,
clays, colloids, organic matter, water and gas. It is often the predominant fraction
in the soil, which governs the fundamental properties of a material.[40]
Physical properties
These properties fall into four main categories: [7]
1. Texture or grain (particle) size distribution of the soil in percentages of pebbles,
gravel, sands, silts, clays and colloids. The grain size distribution of a soil is
measured by particle size analysis for the coarse fraction (gravels, sands and
silts) and by sedimentation analysis for the fine fraction (clays). Gravels and
sands give the material its strength, whilst the clays bind it together; silts fulfil a
less clear intermediate function. The texture of a soil is usually presented in the
form of a particle size distribution curve. Figure 1 .11 -1 .14 are examples of the
particle size distribution curves of typical soils with varying percentages of
constituent materials.
I C OFigure 1.11:
Gravelly Soil;0 '/.
25'/,SAND'
CLAYSTONES GRAVEL COARSE FINE SAN'D SILT SAND
31

Figure 1.12:
Sandy Soil
' 1 0 0
70V.SAND
20 V.SILT
CLAYSTONES GnAV'SL COAnSS FINE SAND STT SAND
Silty Soil
100
SILT
iCLAY
S iONzS Gr.AVbL COARSE FINE SAND glLT SAND
■̂LAY
Figure 1.14:
Clayey Soil.
too
SAND
SILT
20 CLAY
'STONsS UHAVcL ' COARSE FINE SAND SiCT SAND
CLAY
32

Atterberg limits
Plasticity defines the extent to which a soil can be distorted without any
significant inelastic reaction, typically cracking or crumbling, occurring. The
plasticity of the soil, as well as the limits between different states of consistency,
are defined by measuring the "Atterberg Limits". These are carried out on the
finer fraction of the soil (particle size diameter less than 0.4 mm). The amount of
water expressed in percentage terms, corresponding to the point at which the
material passes from a liquid to a plastic state is known as the Liquid Limit (LL).
The point, at which it passes from a plastic to a solid state, is known as the
Plastic Limit (PL). At the Liquid limit, the soil begins to display some resistance to
shearing.. At the Plastic limit, the soil ceases to be plastic and becomes crumbly.
The Plasticity Index (PI), determines the extent of the plastic behaviour of the
soil, where:
Plasticity Index (PI) = Liquid Limit - Plastic Limit
The Atterberg Limits also include:
• Shrinkage limit
• Adsorption Limit
• Limit of adhesion
The most important of the limits are the Plastic limit and the Liquid limit, while the
other three are only rarely used.
3. Compressibility
The compressibility of a soil defines its maximum capacity to be compressed for
a given amount o, compaction energy and at a given moisture content. When a
force is applied to a quantity of soil, the material is compressed and the
33

proportion of voids decreases. The more the density of a soil can be increased,
the lower its porosity will be and the more difficult it will be for water to penetrate.
This property results from the tighter overlapping of the particles, which lowers
the risk of the structure being modified in the presence of water. The moisture
content must be high enough to lubricate the particles and enable them to move
around in such a way as to occupy as little space as possible. At the same time,
the moisture content must not be too high, or the voids would be full of water,
and therefore impossible to compress.
4. Cohesion or the ability of the soil grains to remain in association.
The cohesion of a soil is an expression of the capacity of its grains to remain
together when a tensile stress is imposed on the material. The cohesion of the
soil depends on the adhesive or cementation properties of its coarse mortar
(grain size of diameter larger then 2mm) which binds the inert grains together.
This property thus contributes to the quantity and adhesive quality of the clays.
34
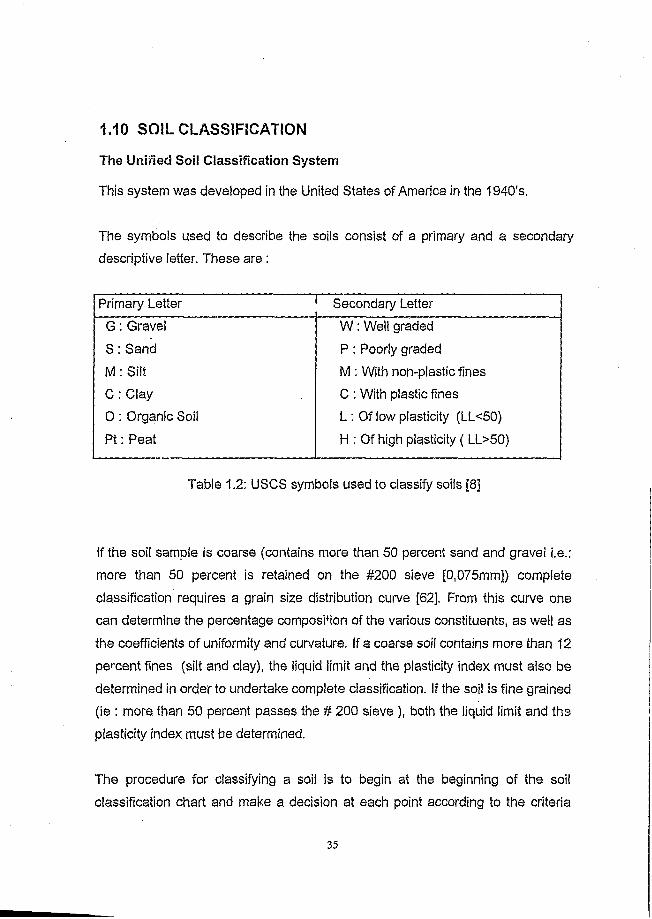
1.10 SOIL CLASSIFICATION
The Urti/ied Soil Classification System
This system was developed in the United States of America in the 1940's.
The symbols used to describe the soils consist of a primary and a secondary
descriptive letter. These are :
Primary Letter Secondary Letter
G : Gravel
S : Sand
M : Silt
C : Clay
O : Organic Soil
P t: Peat
W : Well graded
P : Poorly graded
M : With non-plastic fines
C : With plastic fines
L : Of low plasticity (LL<50)
H : Of high plasticity ( LL>50)
Table 1.2: USCS symbols used to classify soils [8]
If the soil sample is coarse (contains more than 50 percent sand and gravel i.e.:
more than 50 percent is retained on the #200 sieve [0,075mm]) complete
classification requires a grain size distribution curve [62]. From this curve one
can determine the percentage composiMon of the various constituents, as well as
the coefficients of uniformity and curvature. If a coarse soil contains more than 12
percent fines (silt and clay), the liquid limit and the plasticity index must also be
determined in order to undertake complete classification. If the soil is fine grained
(ie : more than 50 percent passes the # 200 sieve ), both the liquid limit and the
plasticity index must be determined.
The procedure for classifying a soil is to begin at the beginning of the soil
classification chart and make a decision at each point according to the criteria
35

presented. At the conclusion of the process an appropriate group symbol is
obtained.
For fine soils, a distinction is made between silts, clays, high plasticity and low
plasticity and low compressibility based on the plasticity chart.
Figure 1.15 : Plasticity chart for the Unified Soil Classification System [8]
Primary Letter Secondary Letter
M : Silt L : Of low plasticity (LL<50)
C : Clay H : Of high plasticity (LL>50)
O : Organic Soil
36

The following example will illustrate how the Unified Soil Classification System
works: Assume there is a soil A with a gradation curve as illustrated in Figure
1.16: [62]
iss a
•~T1 i l l
Figure 1.16 : Gradation curves for Soil Classification example [62]
Look at the sieve on the top of the graph and find the #200 sieve. Read down the
200 sieve line until it intercepts with the gradation curve for soil A. Read the
corresponding "percentage finer by weight" reading from the left hand side of the
graph. This reading for soil A is approximately 10 percent i.e.: approximately 10
percent of soil A is smaller than the #200 sieve. Looking at the gravel part of the
curve, (that which is greater than the # 4 sieve [4,75mm]), only about 10 percent
of soil A falls into the gravel category (this is approximately 11 percent of the total
coarse fraction). From the classification table, if more than 50 percent of the
37

coarse fraction passes the #4 sieve the soil is sand. As the fines fraction was
about 10 percent of the sample by weight, the soil is regarded as a borderline
case requiring a dual classification (borderline cases are those soils with fines
between 5 and 12 percent). Because of the dual dassification, the soil needs to
be further classified using the gradation curve. By determining the percentage
finer by weight at 60 percent, 10 percent and 30 percent and finding the
corresponding grain size from the gradation curve for soil A, the uniformity and
curvature coefficients can be calculated.
This is done as follows:
D6o = 0,6mm
Dio = 0,074mm
D3o = 0,2mm
Coefficient of Uniformity: Cu = Deo = 0,6mm
D10 0,074mm
= 8,1
Coefficient of Concavity: Cv = ( D3o )2 = (0 ,2 )2
Deo x Dio ( 0,6 x 0,074 )
= 0,9
According to the Unified Soil Classification Chart (Table 1.2) the soil does not
meet the requirements for a well graded soil.
38

B ii id on W ip icr,A .A .(1957) Procctiings o f ih t F c - jr ih In lc rnz tlonc l Ccr.fcrincc SM FE, Ur-Jon, VoL 1, Reprcxiucxd by permission of Buucr^-onh &. Co. ____________________________________________________
CroupSvmbab
L ib o n io r ) - c riten i
Description F jn o r . } G n i i f t j p t u i l n w S o lc t
C o irv t su ined i» o ;e $h»A .*0‘ , U fp tr th ir i 6Jp-*n BS or S o . 2COVS
G n v c ltun o rr Ih m o f
W cli p id t d jr iv e J i. u n d y fn > 6 lt , whh Jisiin o r no fin s i
C W 0-5 Cv > <I < Cr < >
D u i l tym bo lt i f5 -1 2 \ ftnn . Dve) tym bo)i i f
ia d < < P f < 7p i v e l r is } Poorly p id t d g r jv c lt , u n d y
p tv tU , Uulc o f no, fir.esGP 0 -5 K o t o tiifv - ia t
GW
Silty Fxve lt, l i l iv u n ify j r iv c U C M > 12 X - lin e
cr / / < X
G t »sy p n * : ! i , c ! j j - c v u n d y fA 's J i
G C > 12 A S jv j A'Vmc m i F I > 7
S m d ii r a c r t i - i s of
WtV ( n i s i t i r . i i , f.-< vcJJy y jtd t . v - iih V u lt or no f i n o
S W C v > 6 1 < C; < 3
Pccrf» c r u e l ly u h d L Ih ile or r.c Aset
SP S 'itSW r t^v ir tn ttr .u
Siht S M > !2 W f / ' ( i r e
: r , '• / < ^
O i > i ) u n d i SC > l i
'
A b r » : A . l ih i u > i .» / > 7
f in e piL-ted ( ro s r t the-. 5 0 V
i.T .U Icr >k»a
Sv’u m i d i \ t fitqyid L i i t 'c a uSia 50)
Z o o r/ is k t i lu , t i l ty c r s l4 ; ty .*.&< u s d i, v -;b tUfcht p lm id ty
M L L 'x p Z u iic ty c h m
N o. US u ^ t u n )
fn o r p c i: c lty t , r ilty d iy i . u > i j c i? i o f Jc* p U n ic ity
C L U w pZuik-it) c>.»r.
O r f is ic n lu in d o rc ir . i ; r i l iy d i n of Ie * p (v J r ity
O L L’ w plu'Jci'.x c h in
SUu lad r i i j i ( liqu id lirr.it p ta ;« l i i a X )
In o rp ii ic r2 u o f W j i p iu t ir ity
M H U « p lu t is ty eh irt
I f ta f j j i r je d i y i o f h ijh p tu i ir i ty CH U « p l i i t t s ty A m
O rju ttlc d iy i o f higX p tu i id ty O H Uve P t it t in iy eh irt
Kic>.;* V ( t r . i ; « t h P u t cvd c i i s r c r j t d c w l ’ t Pi
Table 1.2 : Unified Soil Classification System Chart [8]
39

This is because soil A has a Cu greater than 6 and a Cc of less than 1. The soil is
therefore poorly graded sand. Limits according to figure 2.6 for a well graded
sand is where Cu is greater than 6 and 1 < Cc < 3. Because fines content (that
which is smaller than 0,075mm) is between 5 and 12 percent, it is necessary to
determine v/hether the fines are clayey or silty. The laboratory tests indicated that
the liquid limit (LL) was 63, the plastic limit (PL) was 42 and that the plasticity
index (PI) therefore was 21. From the plasticity chart it is found that the point at
which the. plasticity index of 21 and the liquid limit of 63 for soil A cross, falls
below the A- line and would therefore be classified as a silty sand.
The total description for soil A would therefore be SP- SM.
If the same exercise is followed for soil B, it is found that the appropriate
description for soil B is SP.
The same process used to illustrate the example has been used in section 3.5 to
classify the soil used in this research.
40

CHAPTER TWO

2. SOIL STABILISATION.
2.1 Definition.
The term soil stabilisation is applied to any process which improves the
properties of a soil and which enables it to perform and sustain its intended
engineering use. [74] Soil stabilisation is not a recent discovery. The use of
stabilisers to improve the performance of soil as a construction material dates
back to ancient Egypt where the discovery of lime and gypsum as binding agents
aided the construction of structures like the pyramids.
The Romans used the knowledge they had gained from the Greeks and the
Etruscans on cementing materials to construct many buildings in the Roman
Empire, in the America’s the Spaniards first introduced adobe mixed with pigs’
blood and other ingredients to produce more durable (when compared with pure
adobe) building materials. [66]
in the early nineteenth century, the development of “Portland cement” by Joseph
Aspdin, led to its use in soil stabilisation in a similar way to its use for binding
aggregates in concrete. [53]
2.1.2 Effect of soil stabilisation on the properties of the soil.
The action of soil stabilisation can be directed at only two characteristics of the
soil itself, i.e. its texture and structure [2,33,40,49]. There are three courses of
action, which can be aimed at texture and structure:
• Reducing the volume of interstitial voids: acts on porosity
• Filling the voids which cannot be eliminated: acts on permeability
• improvement of the bonding between grains: acts on mechanical strength
41

The main objectives aimed at are: [16]
• Achieving better mechanical characteristics: improving dry and wet
compressive strength;
« Achieving better cohesion;
» Reducing porosity and changes in volume: shrink and swell due to water.
• improvement of resistance to wind and rain erosion: reduction of surface
abrasion and increasing waterproofing.
These objectives can be achieved in the following ways: [39]
1. Increasing density by creating a dense environment which blocks pores
and capillary channels.
2. Reinforcing, where the soil is reinforced by the addition of various types of
fibres of organic origin, (straw), animal origin (hair, wool), mineral or
synthetic origin (synthetic fibres). This approach creates a network of
omni-directional fibres, which notably improves tensile and shearing
strengths and helps to reduce shrinkage.
3. Cementation: a strong, inert, three-dimensional matrix is introduced into
the soil. This causes consolidation by cementation, which coats the
particles and resists movement within the material. The main consolidation
reactions occur within the stabiliser itself and between the stabiliser and
the sandy fraction of the soil. Secondary reactions, however, can be
observed between the stabiliser and the clay fraction. Clay affects the
efficiency of the stabiliser and can modify the mechanical behaviour of the
material.
4. Bonding: an inert matrix is introduced into the soil in the form of clays. Two
mechanisms giving the same results are known. The first is an inert matrix
formed by the clays where the negative and positive charges of the plate
like clay particles, or their chemical composition, are used to bind them
together through the intermediary of a stabiliser, which acts as a binding
42

agent or catalyst in this binding effect. Certain chemical stabilisers work in
this way, including certain acids, polymers and flocculants. The second is
where an inert matrix is formed with the clays. A stabiliser reacts with the
clay and precipitates a new, insoluble, inert material: ~ kind of cement.
This pozzolanic reaction, notably is obtained with lime. This slow reaction
depends essentially on the quantity and quality of the clay present.
5. Water-proofing
Water-proofing involves the reduction of water erosion and of the swelling
and shrinkage that might occur as a result of repeated alternate wet-dry
cycles. There are two known ways of waterproofing. The first involves the
filling of all voids, cracks and crazing with a material which is not water
sensitive. This method of stabilisation is particularly well-suited to sandy
soils which display good volume stability and which are little affected by
water, it can also be used for silty and clayey soils, which demand more
stabiliser because their specific surface area is greater. The second
method is where a material which expands and seals off access to pores,
as soon as it comes into the slightest contact with water, is dispersed
throughout the soil. An example of such a material is bentonite.
6. Water dispersal
The state of the interstitial water is modified and the sensitivity of the
plate-like clay particles to water is reduced. This process uses chemical
products (calcium chloride, acids, quartenary amines or resins) or Ion
exchange resins to eliminate as much absorption of water as possible.
2.2 SOIL STABILISATION METHODS
Soil stabilisation can be achieved by a variety of methods, which include
mechanical stabilisation, physical stabilisation and chemical stabilisation. [33,52]
43

2.2.1 Mechanical Stabilisation
The strength and durability of a soil can be increased by mechanical means. The
mechanical method of stabilisation involves soil compaction and densification by
application of mechanical energy. A clear relationship exists between dry density
and mechanical length. The more compact a material, the higher its
mechanical strength [27,49,52]. For example, given the same composition and
dosags, the denser concrete is, the stronger it will be. Similarly, the densest
stones have the highest mechanical resistance. The same applies to earth, onl,?
the densities achievable remain relatively low.
The main effect of compaction is to tighten up the soil particles which results in:
[27]
e An increase in the number of points of contact between soil particles;
o A reduction in the proportion of spaces, that is in the porosity of the
soil.
For clay soils, the small size of the particles and their wide specific surface area
make them behave in a particular way. Depending on the relative importance of
the forces of attraction and repulsion, two fundamental types of structure can be
observed: [16]
« A dispersed structure indicating predominantly repulsive forces: the
clay plates, which are separated one from the other, tend to be parallel
to each other.
e A flocculated structure indicating predominantly attractive forces: the
clay plates draw together and form sharp angles between themselves
(figure 2.1).
44

Figure 2.1: Dispersed structure Flocculated structure
In these conditions, the effects of compaction differ widely according to the
structure: a flocculated state- generally corresponds to lower water contents,
whereas a dispersed state is characteristic of high water contents [12]. In
particular along the compaction curve the structure could be more dispersed to
the right of the optimum and more flocculated to the left (figure 2.2).
I E x a m p leW a t e r c o n te n t %
Figure 2.2: Structure
In A, the particles come together and tend to flocculate: as the water content
increases they disperse and adopt more regular patterns (B and C). The
optimum compaction thus appears to be at a state when the forces of attraction
remain sufficient to allow good compaction whilst the lorces of repulsion facilitate
a certain ordered arrangement of the particles. [16]

The effects of compaction carried out under good conditions can be observed in
a reduction in permeability, compressibility, water absorption and swelling, as a
result of water in humid conditions and in an increase in mechanical strength.
2.2.2 Physical Stabilisation
Physical stabilisation involves the controlled mixing of various fractions of soil to
obtain a soil with a particular grain size distribution. Limits have been established
which indicate optimum particle size distribution for soils for specific uses. [19]
These limits are intended to act as a guide to the amount of each constituent of
the soil that should be present, i.e. the amount of sand, silt and clay. These limits
are presented in the form of two curves on a graph. [16] If the soil is considered
suitable, its particle size distribution curve will fall in between the curves.
Therefore if the curve of a soil is not partly or totally within these limits it is
possible to mix it with another which has a high content of the elements in which
it is deficient in order to obtain a satisfactory product.
C la ySlones Fine sandC o a r s e s a n dLimons
(Sill)Gravel Sand C l a yc o a r s e } m e d iu r n 't m ey *r
o 90j
7 0
307Q
60
50
70 5
80 uS ?0kka l curve 90
100~cji o T o p s a 0C10 00",O 0005 0C02 0,001
) SED IM EN TA TIO N A N A L Y S IS I
Figure 2.3: The ideal curve for stabilised soil and its limits of tolerance[16]
46

2.2.3 Chemical Stabilisation
Chemical stabilisation is the addition of various chemicals to a soil to modify its
properties, either by a physico-chemical reaction between the grains of the soil
and the added product, or by creating a matrix which binds or coats the grains.
[24] A physico-chemical reaction can lead to the formation of a new compound:
for example a pozzolana resulting from a reaction between clay and lime.
Whereas the changes, which are effected as a result of mechanical stabilisation,
can be undone by moisture i.e. mechanical strength, the effects of chemical
stabilisation are permanent. [40]
Chemical Stabilisers
As described there are various effects, which can be achieved by the addition of
various chemicals to a soil. The following are the stabilisers which may be used:
Lime
There are three main types of lime: high calcium limes (referred to hereafter as
"limes"), hydraulic limes and dolomitic limes.
High calcium lime is obtained by calcination at 900°C to 1000°C of a relatively
pure, clay-free calcareous rock. A calcium carbonate content of 97% would
normally be considered the minimum for production of high calcium limes. During
baking, this carbonate dissociates and part of it escapes in the form of carbon
dioxide. This leaves only calcium oxide, known as quicklime, the proportion of
which determines the quality of the final product. Pure high calcium lime will
contain more than 97% CaO; fat lime, more than 85%; and lean lime, less than
85%. When it is placed once more in contact with the carbon dioxide present in
the atmosphere, the lime again becomes calcium carbonate.
47

Hydraulic limes gain greater strength, and at a faster rate, than high calcium
limes. They also set under water and produce a generally more durable product.
Their behaviour, the way they work and their characteristics closely resemble
those of lower strength Portland cements. [55]
Dolomitic lime is similar to a high calcium lime except that it contains a proportion
of magnesium oxide (MgO) combined with calcium oxide (CaO). This lime needs
more care in usage compared with a high calcium lime. It is particularly important
to ensure that it has been properly burned and slaked, that is, it is burned at a
lower part of the temperature range for lime production and a longer time is
allowed for slaking it. [5]
There are two main forms of lime:
Quicklime (CaO): quicklime is produced directly by firing limestone (CaCOa) or
Dolomite [CaMg (C03) 2] in a kiln;
CaC03 heatin® CaO + C02 - limestone -----
CaMg (C03)2 MgC03 + CaO + C02 - dolomite
Quicklime is extremely nygroscopic (i.e. it attracts water) and must be protected
from moisture. The sensitive conditions of storage and maintenance it requires
can limit its use. It is a material which is highly exothermic in its reaction with
water reaching temperatures of up to 150°C during the hydration stage.
48

Hydrated lime [Ca(OH) 2] : Hydrated lime is obtained by combining quicklime
(calcium oxide) with water under controlled conditions;
CaO + HaO — ► Ca(OH)z
The hydration reaction, also known as ‘slaking’, is exothermic and is
accompanied by an increase in volume. Hydrated lime has less available CaO
per unit mass than unslaked lime and is therefore less reactive and easier to
store. [2]
Lime-clay Reactions
When lime is mixed with a moist clay soil, two basic though complex reactions
apparently take place: [2,5,17,69]
• Cation exchange reactions and flocculation of the clay which begin almost
instantaneously and produce rapid changes in the soil’s plasticity and
workability - referred to as modification reactions.
e Depending on the characteristics of the soil being stabilised, a clay-lime
pozzolanic reaction may occur. The pozzolanic reaction, which is time
dependent, results in the formation of various cementing agents, which
increase the strength, and durability of the material - called cementation.
Ion exchange and flocculation
Clay particles adsorb cations to neutralise the negative charge resulting from
isomorphous substitution. The adsorbed cations, together with other influences
such as pH and electrolyte concentration, influence the amount of water attracted
to a clay particle, and thus the interaction between clay particles. [18]
49

These adsorbed cations are exchangeable, i.e. they can be replaced by other
cations with the general rule for replaceability being that multivalent cations are
adsorbed in preference to monovalent cations. By replacing adsorbed cations
with cations of another type, the properties and amount of water surrounding a
clay particle can be altered and therefore replacing adsorbed cations with cations
of another type can modify the properties of the clay.
A simplified explanation for the modification of clay by lime [13] suggests that:
• The Ca2+ ions from the lime water solution replace the H+ ions and other
monovalent ions such as Na+ ions adsorbed to the clay.
• The Na+ ions each 'hold' 89 molecules of water when hydrated while the Ca2+
ions only hold 2 molecules each, and thus the quantity of water attracted to
the clay particle is vastly reduced.
• if sufficient lime is added to the clay, overcrowding of the Ca2* cations onto
the clay particle surfaces results in the particles becoming flocculated forming
silt sized agglomerations within which clay particles adhere to one another.
The ion exchange and flocculation processes materially change the number of
electrical charges on the surface of the clay particle. Because the bond between
the clay particles is dependent on the charge and the size of the ions, the
preponderance of the diva'snt calcium ions that have replaced the univalent ions
attract the soil particles together. The ion exchange reactions and the flocculation
of the clay begin almost immediately, resulting in most cases in an increase in
the plastic limit, at the same ‘in -situ' water content. [40] Generally, the plastic limit
increases, while the liquid limit either remains unchanged or increases or
decreases slightly. The lime treatment makes the soil more open textured and
the material becomes more friable and more workable. [24]
50
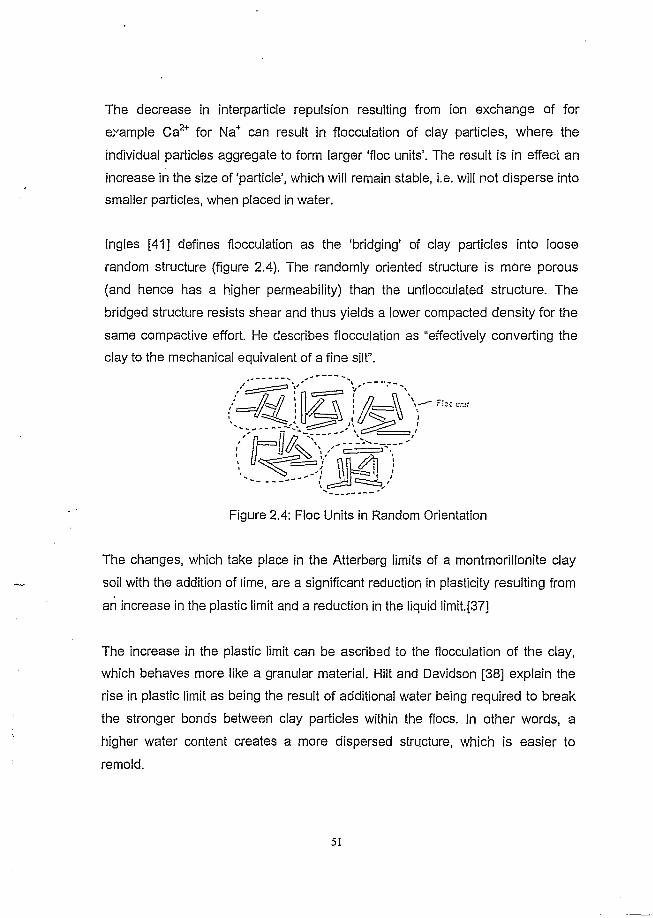
The decrease in interparticle repulsion resulting from ion exchange of for
example Ca2+ for Na+ can result in flocculation of clay particles, where the
individual particles aggregate to form larger ‘floe units'. The result is in effect an
increase in the size of ‘particle’, which will remain stable, i.e. will not disperse into
smaller particles, when placed in water.
Ingles [41] defines flocculation as the ‘bridging’ of clay particles into loose
random structure (figure 2.4). The randomly oriented structure is more porous
(and hence has a higher permeability) than the unflocculated structure. The
bridged structure resists shear and thus yields a lower compacted density for the
same compactive effort. He describes flocculation as “effectively converting the
clay to the mechanical equivalent of a fine silt”.
Figure 2.4: Floe Units in Random Orientation
The changes, which take place in the Atterberg limits of a montmorillonite clay
soil with the addition of lime, are a significant reduction in plasticity resulting from
an increase in the plastic limit and a reduction in the liquid limit.[37]
The increase in the plastic limit can be ascribed to the flocculation of the clay,
which behaves more like a granular material. Hilt and Davidson [38] explain the
rise in plastic limit as being the result of additional water being required to break
the stronger bonds between clay particles within the floes. In other words, a
higher water content creates a more dispersed structure, which is easier to
remold.
51

The stabilised material still exhibits a liquid limit i.e. some cohesive strength, but
will exhibit little plasticity because of the overriding influence of weakly attracted
silt size floes. Although the soil may appear to be non-plastie, this does not mean
that the plastie limit is zero, but that the plastie limit is very close to the liqu d limit
or cannot be measured. The higher the clay content (untreated), the further the
plastic and liquid limits diverge from one another because of the increasing
influence of the clay.
Thus as the lime content is increased, more clay becomes flocculated, reducing
the range of water over which the soil will behave plastically. The lime itself may
also contribute to some extent to the raising of the plastie limit when it hydrates,
i.e. additional water is required for the hydration of the lime.
The same trend cannot be expected for all soils, and laboratory determinations of
the Atterberg limits must be conducted to confirm any assumed changes.
Kaolinitic clays often show increases in the liquid limit with increasing lime
content, sometimes showing increased plasticity. [40] However, the increased
plasticity can be shown to result when the liquid limit increases by a greater
amount than the plastic limit, i.e. the liquid and plastic limit curves diverge with
increasing lime content.
The quantity of lime required to complete the ion exchange and flocculation
reactions (known as the ‘initial line demand’ or 'lime fixation capacity’), the rate
of the reaction and the extent to which the properties of the clay are altered by
the reaction, are dependent on the clay type. [61]
Kaolinites have low cation exchange capacities and thus low initial lime demands
(1 to 2% lime by dry weight). The ion exchange and flocculation reactions are
normally completed fairly rapidly i.e. in less than 24 hours. Montmorillonite clays
have high cation exchange capacities and the initial lime demands may range
from 5% to as high as 12%. The ion exchange and flocculation reactions occur at
a slower rate and may take some days to complete. [18]
5 2

Because of its small particle size and the expanding lattice structure of these
particles, montmorillonite is notorious for the large volume changes which, occur
when it is wet or dried. On the other hand, kaolinite is relatively insensitive to
changes in water content and does not swell and shrink very much.
Cementation
After the short term ion exchange and flocculation reactions have occurred, any
excess or 'free' lime reacts chemically with the clay minerals or with any other
fine pozzolanic component such as hydrous silica or alumina. These reactions
produce "tough, water insoluble" hydrated calcium silicate and aluminate gels,
which cement the soil particles. [17,18,37,40,69]
The reaction products are similar to those present in Hydrated Portland cement
(i.e. calcium silicate hydrates). However, the hydration of cement is independent
of the soil type, while with lime the gel is formed only after attack and removal of
silica from the clay minerals of the soil. [40,69]
The type and amount of minerals in the soil that react with the lime (known as
pozzolans) vary for different soil types and determine the long term properties of
the soil-lime. Possible sources of silica and alumina include clay minerals, quartz,
feldspars, micas and other similar silicate or alumino-silicate minerals.
In addition to the formation of calcium and aluminium silicates, it is also believed
that the lime reacts chemically with surfaces of the clay minerals [69]. The same
reference suggests the possibility that cementation occurs as a combination of
the two processes.
These reactions occur only under a condition of high alkalinity (pH > 11)
[2,19,38,49,69,74] at which the solubilities of silica and alumina are greatly
increased, his condition is achieved by adding sufficient lime (the pH of lime
53
saturated water is approximately 12.4) to ensure that the pore water remains
calcium saturated for the projected duration of the pozzolanic reactions. Ingles
and Metcalf [40] note that the reactions proceed only whilst water is present and
able to carry calcium and hydroxyl ions to the clay surface. The reaction thus
ceases on drying (just as cement hydration would cease on drying), and very dry
soils will not react with lima. Ingles and Metcalf [40] describe the cementing
mechanism as shown in figure 2.5 whereby the gel immediately begins to coat
clay lumps in the soil and to block off the soil pores. In time the gel crystallizes on
the sides of the clay lumps into calcium silicate and aluminium hydrates. Water
for the reactions is 'withdrawn' from the soil pores until there is insufficient water
in the voids and the reaction ceases. Correct emphasis is placed on the fact that
clay lumps are stabilised on their outside surfaces only. Thus together with the
unused lime and the weaker uncrystallized gel, the interior of the lumps
represents local weaknesses in the ‘matrix’ of stabilised soil. Natural soils contain
both granular (silt, sand and gravel) and clay materials. Some of the granular
particles may be capable of reacting with the lime to form cementitious gel. It
follows logically that there must be sufficient lime reactive clay or other materials
to produce sufficient cementing material to both encase the clay lumps and to
bind granular particles together at points of contact. [41]
Although the cementing reactions may begin immediately, the rate of reaction is
very slow, and it may take some years before sufficient crystalline products form
to produce strengths comparable with soil cement.
54

• yp icst f r t c V j r t J u r fc c u ( i t f i i / c n i
ecc '.icn c r r r i t t j v c t t r M t.-.dn:vcl
• i ir < l ly vsid ; e r r , — "rc c c tw n ; c u i ; le
CCS4O 1 j t i l l ;e !c t tn o u i
CsfCH)
CsSi'Oj e r y i t c i l i z t *
Ci^sctL-rcUd hq-id phssr.m *3 c:cy ,
S:Cj c i f f u jc j ou t t3 l iq u id . zr . i y t c e . t s i n cs C s S iO ,.vSJSA :cvty s ry jt-H iitj
5A $ 'd r v i t . ic r c v t r ^v c : t r f r c a l.- .r p o - t o r .n f r t z i x i z n h c r m t t d . * *
Figure 2.5: Mechanism of Lime Stabilisation of Clay soils. [40]

Portland Cement
Ordinary Portland Cement (OPC) is manufactured by burning a mixture of
calcareous, argillaceous and/or other silica, alumina or iron oxide bearing
materials at a temperature of some 1450°C. The clinker (material leaving the
burning zone) is then interground with small proportions of gypsum. [22] Many
other materials can be used in the manufacture of Portland cement but the
addition of these materials is restricted by economic and physical requirements
set by various specifications.
Compound Formula Abbrev
iation
% by mass
in cement
Tricalcium silicate 3Ca0.Si02 C3S 3 5 -5 5
Dicalcium silicate 2CaO.SiOa CzS 2 0 -4 0
Tricalcium aluminate SCaO.AIaOs C3A 5 - 1 2
Tetracaicium Aluminoferrite 4CaO. AlaOa.FeaOs C4AF 5 - 1 0
Magnesia MgO ■ M 0 .3 -0 .4
Gypsum Raw material - 4 - 7
Free lime CaO - 0 .5 -2 .5
Table 2.1 - Compound Composition of South African Portland Cement. [22]
Portland cement is an extremely complex mixture of compounds.
These are:
a) Tricak" n silicate: this contains all the essential properties of Portland
cemenx. It is chiefly responsible for the early strength build up of cement-
water pastes.
5 6

b) Dicalcium silicate: this hardens slowly and is responsible for most of the
strength build up of Portland cement after 28 days.
c) Tricalcium aluminate (C3A): this liberates large amounts of heat during the
first few days of hardening. It accounts for the initial set of the material and
contributes slightly towards the initial strength of the material. It is largely
responsible for the susceptibility of the matrix to sulphate attack because the
greater the tricalcium aluminate content (C3A) in the cement, the lower the
sulphate resistance.
d) Tetracaicium aluminoferrite (C4AF) : this hydrates rapidly and helps in
developing a little strength in the material. It is mainly used as a flux during
manufacture.
e) Magnesia: this is a minor constituent of most cementitious material's. If it is
present in excessive quantities and the structure is exposed to moist
conditions, it may cause expansion of the cement paste and therefore lead to
deterioration of the structure of the concrete after it has hardened. The
magnesia reacts with water but will only be deleterious if the magnesia is
present in the crystalline form. [22]
f) Gypsum: This is added to the clinker to control the rate of setting of the
cement. “ When gypsum (CaS04.2H20 ) is present, some of this gypsum
dissolves in the gauging water and reacts with the hydration products of C3A
forming an insoluble calcium sulphate aluminate called ettringite. This forms a
skin around the individual C3A crystals, but as it is formed, it tends to trap a
little water between itself and the C3A. This water reacts with the C3A giving
an increase in volume. This results in the bursting of the skin, which is then
again sealed off, by a new skin but again trapping some water. In this manner
the hydration of the C3A is controlled, giving the user a chance to work with
the cement before it sets." [76] When this happens in hardened concrete
damage can occur, (see above)
g) Free lime: this is present due to an incomplete reaction in the kiln, if it is
present in excess of four percent, it can cause the cement to be unsound
( e x c e s s i v e volume changes) and lead to a deterioration of the structure, This
57

however is only relevant if the volume changes take place after the concrete
is no longer plastic. If it is present as calcium hydroxide, it has no deleterious
effect. Free lime is regarded as an undesirable constituent of cement as it
contributes to the susceptibility of the matrix to attack by aggressive agents
such as acid and pure water, (ibid.)
Types of cements
The specifications for cement have recently been changed in South Africa to fall
in line with the specifications being used in Europe. The table 2.2 details the new
types of cements in the specification and their equivalents in the old
specifications. The most common cement used in soil stabilisation is ordinary
Portland cement although other cements such as sulphate resisting cement,
Portland blastfurnace cement or masonry cement are used to stabilise soils [2],
Rapid hardening cements are not readily used as they do not produce a
particular improvement when compared to ordinary portland cements and are
more expensive. [2,39]
Cement Stabilisation
Soil-cement reactions
When water is added to the soil-cement mix the cement starts to hydrate, the
reactions, which occur are similar to those presented in the case of clay-lime:
[64]
• The hydration of the calcium silicates and aluminates release lime as
Ca(OH)2. This lime and the free lime (as CaO) present in the cement react
with the clay in plastic soils as described in clay-lime reactions resulting in a
fairly rapid reduction in plasticity and an increase in strength (ability to resist
external forces, stress or pressure exerted on it).
5 8

The major contribution to the strength of soil-cement comes however from the
hardened cement which bonds the soil particles together providing early and
long-term strength, and thus determining the engineering properties of cement
treated materials.
Ingles [41] notes that granular soils require cementation at points of contact to
maintain their dense state after compaction, while clay lumps must be encased
by a ‘shell’ of cement which provides a moisture barrier and restricts volume
changes. He also points out however that a disadvantage of the early strength
type of structure is that once the structure has been ruptured it does not readily
reform. This implies that high cement contents may be required to effectively
stabilise expansive or shrii (kabie clays.
Nearly all soils except those containing an excessive amount of organic material
can be treated with cement, which significantly improves their properties
[2,33,39,40,49,66]. Salt-rich soils are also difficult to stabilise with cement, but
increasing the proportion cement can often yield good results. Soils with high
percentages of clay ('>30%) are often difficult to mix and therefore high
percentages of cement are required to ensure good distribution of the cement
throughout the soil. The addition of a small percent of lime causes the clay to
flocculate and become more friable, thereby making mixing easier. Therefore by
pre-treating a soil which has a high percentage of clay with lime, the quantity of
cement required for stabilisation can be reduced as the addition of lime make the
clay soil more friable and better mixing is achieved. [24]
Soils which contain sulphate contents in excess of 2 to 3% are also not suitable
for cement stabilisation as the sulphates have very harmful side-effects. Calcium
sulphate (anhydrite and gypsum) in particular reacts with the hydration products
of C3A to form ettringite which is expansive and results in the destruction of the
hardened cement from the inside of the eement-soii resulting in an increase in
the sensitivity of the clay to moisture. [25]
59

Cement
typeDescription
Old product
nomenclature
New product
nomenclature
1
Portland cement OPC CEM I 32.5
CEM I 32.5R
Rapid hardening RHPC CEM I 42.5 or
cement CEM I 42.5R
Portland slag cement PC15SL
RH30SL
CEM ll/A-S 32.5 or
CEM ll/A-S 32.5R
CEM ll/A-S 42.5
CEM ll/B-S 32.5R
CEM ll/B-S 42.5
Portland fly ash RH15FA CEM ll/A-V 42.5 or
cement CEM ll/A-V 42.5R
II CEM ll/A-W 421. or
PFAC
PC15FA
CEM ll/A-W 42.5R
CEM ll/B-V 32.5 or
CEM ll/B-W 32.5
CEM ll/A-V 32.5 or
CEM ll/A-V 32.5R
CEM ll/A-W 32.5 or
CEM ll/A-W 32.5R
III Blastfurnace cement
PBFC
RH40SL
CEM Ill/A 32.5 or
CEM Ill/A 32.5R
CEM Ill/A 32.5R or
CEM Ill/A 42.5R
Table 2.2: Common cement types
60

Bitumen
Bitumen is a product made up of a filler and at least 40% heavy hydrocarbons, in
its natural state, bitumen is too thick to be usable. It is either heated, or a
“cutback” or emulsion is prepared. For stabilisation purposes, these two methods
are used. [25]
“Cutback” is obtained by mixing the bitumen with a volatile solvent such as diesel
fuel, kerosene, or naphta. Emulsions are obtained by dispersing bitumen in water
with the help of an emulsifier, which is either of anionic or cationic. The
emulsions from the latter are more common and are compatible with many soil
types.[25] Emulsions are very fluid and are easily mixed with pre-moistened soils.
Cutback and emulsions come in the form of microscopic droplets in suspension
in a solvent or water. The stabiliser is mixed into the soil. And when the water or
solvent evaporates the droplets of bitumen spread out to form strong, very thin
films, which adhere to and coat the soil particles. Bitumen improves the water-
resistant properties of ♦he soil (less absorption by clays) because it is intrinsically
hydrophobic and can improve the cohesion of naturally non-cohesive soils [25].
Organic matter and sulphates in the soil hinders the efficiency of bitumen
stabilisation as their adhesion to the grains prevents the adhesion of the bitumen.
Mineral salts are very harmful. When bitumen-stabilisation is carried out on an
industrial scale, salt contents of more than 0.2% are not accepted, an exception
is sodium chloride (NaCI), where up to 6% can be accepted. [55]
Synthetic Products
Certain synthetic products can also be used for soil stabilisation for earth
construction. They consist of either synthetic products, or of by products. They
are also often industrial wastes.
61

The following are some of the products which are used: [25]
1. Acids : Acids modify the pH of the soil resulting in flocculation, the effects of
which are often reversible. Some acids act as catalysts to form insoluble
phosphates. Hydrochloric acid and nitric acid result in moderate stabilisation.
Hydrofluoric acid is very effective in all soils except those with a high
aluminium contents, inducing a reaction which brings about the formation of
insoluble and strong silica fluorides, if phosphoric acid is incorporated, a
hydration reaction is set off with the formation of phosphoric anhydrides which
reacts with clayey minerals, and the creation of an insoluble gel of aluminium
and iron phosphates, which cement the grains together.
2. Sodas: Sodas induce cementation by reacting with minerals, which produce
insoluble silicates and aluminates. Caustic soda acts as a dispersant by
degrading the minerals by alkaline attack. Barium hydroxide, calcium
hydroxide, potassium hydroxide and lithium hydroxide are often used. [78]
3. Salts: Salts acting on soils induce colloidal reactions, alter the characteristics
of the water and lead to flocculation. By increasing the attraction between fine
soil grains, salts help to create larger particles. This flocculation reaction
leads to a reduction in density and an increase in optimum moisture content,
in permeability and strength, but also to a reduction in plasticity. Salts act on
pore water and reduce the loss of water from the soil, slowing evaporation,
and reducing water absorption of soil treated. The effectiveness of treating
soil with salt depends on the extent of moisture movements in the stabilised
soil. The treatment is not always permanent as the salts may be leached out
and dissolved when the soil is moistened. The four main salts used are:
a. sodium chloride: flocculant and compaction aid; effective in
non-saline soils
b. calcium chloride: impermeabilizing agent;
c. ferric- chloride: powerful coagulant and flocculant;
62

d. aluminium chloride: electrolytic coagulant, electrochemical
consolidation of soil.
Salts should never be used in conjunction with'cement. [32]
Silicates: Sodium silicate acts as an impermeabilizing agent, particularly
where a surface treatment of the materials is required. Silicates are
generally used with soils which lack cohesion. Sodium silicates are highly
soluble, but can be rendered insoluble by allowing them to react with
slaked lime. Other silicates, which can be used, are potassium silicate and
calcium silicate.
Stearates: Stearates are salts or esters of the strearic acid contained in
animal fats. They act as impermeabilizing agents. Aluminium and
magnesium stearates as well as zinc stearate may be suitable.
Paraffins: Paraffins are a mixture of solid saturated hydrocarbons
characterised by their inertness in the presence of chemical agents. They
can be v ,ed as a compaction agent but must first be dissolved in a fatty
medium.
Waxes: Industrial waxes can be used as an aid to compaction. They are
often added to other stabilisers.
Latexes: Industrial latex emulsified in water and added at the rate o f 3 to
15% can give good results. These products are binders and
impermeabilizing agents.
Industrial wastes:
a) Blastfurnace slag - these are siliceous/aluminous slags
which can approach Portland cement in composition.
They are often used with ordinary Portland cement as an
additive in the form of a latent hydraulic binder as an
extender for the cement.
b) Lignin and Lignosulphates - these are by-products of the
paper pulp industry. Soluble in water, they can be
rendered insoluble by mixing with chrome salts (sodium

or potassium bichromate) resulting in a thick gel, known
as chromolignin. They are good water proofing agents.
c) Molasses - a product of the sugar industry, this improves
compressive strength and reduces water sensitivity but
cannot be used with cement.
d) Pozzolanas: These are materials, which contain silica,
and/or alumina, e.g. fly ash (from power generating
plants using coal), burnt clay (rejects from brick
production) and rice husk ash. They are not cementitious
themselves, but when finely ground and mixed with lime,
the mixture will set and harden at ordinary temperatures
in the presence of water, like cement.
The use of these products often depends on their local availability. The majority
of these products usually have a high unit cost, which limits their extensive use.
The most commonly used stabilisers are cement and lime, due to their availability
and to a lesser extent bitumen. [39]
64

2.3 Soil Suitability
“ immense experience has been acquired with building with earth in recent times.
It is, however, far from being complete. The criteria for the suitability of a soil
currently in use are far from final and should not be too literally interpreted.” [39]
The suitability of a soil as a raw material for earth construction is a function of a
number of factors. As discussed in chapter one, soils have a number of
properties, which affect their behaviour and therefore their performance as a
construction material. To successfully stabilise a soil, proper understanding and
knowledge of the soil sample must be sought. Due to variations in soil types,
various soils will require different quantities of stabilizer (cement, lime etc.) to
achieve a satisfactory building material. Therefore, before using a specific soil as
a building material a comprehensive study must be conducted to determine these
properties and enable the prospective user to understand the material and to
predict its behaviour in the final product.
As a result of extensive work originally done in the field of road construction,
procedures to determine these properties have been established. Although
stabilised soil in road construction differs in its application to its use in the
construction of buildings, many of the testing procedures performed on stabilised
soil, for road construction, are relevant to the material used for building
construction for example grading analysis, liquid limits and plastic limits. [60]
Relevant research undertaken in road construction has therefore in addition to
more specific research conducted in the field of earth constructed buildings been
used to produce suitability criteria and reference nomograms which act as
guidelines. These guidelines enable the user to make a decision with respect to
the suitability of a soil as a construction material, based on its properties.
65

The laboratory tests conducted on the soil to determine the properties of the soil
investigated in this report are detailed in chapter 3.
The general guidelines, which have been set out for the suitability of a soil
according to its properties have been suggested by CRATerre-EAG, the
International Centre for Earth Construction and School of Architecture at
Grenoble, which has accumulated a vast knowledge of earth construction
through experience over twenty years in more than fifty countries and is
considered to be the world leader in earth related construction. These guidelines
have also been incorporated into a standard known as the CIB W90 document,
which has been established for use with compressed earth blocks. The
standards are the fruit of the work of committee W90 (Compressed Earth Block
Technology) of the International Council for Building Research Studies and
Documentation (CIB). The guidelines indicate what the particle size distribution
and plasticity of the soi) should be for the soil to be considered a suitable soil.
Guidelines for soil suitability (CIB W 90)
The particle size distribution and plasticity of the soil should preferably fall within
the limits of the shaded area on the appropriate diagram which follows, (figure
2.6 and figure 2.7).
“The limits of the recommended zones are approximate. Acceptable tolerances
may vary widely. The current state of knowledge does not permit precise limits to
be applied. It is generally agreed that many soils which do not fall within the
recommended zones, give acceptable results in practice. However, soils which
do conform to these, in most cases give satisfactory results. The zones indicated
are intended to guide the user and not be applied as rigid specifications." [39]
66

TEXTURE
100 D *» 20m m n = 0.25
5 5
20
203 20 0.020.2 0.002
SIZE OF PARTICLES PASSING SIEVE (mm)
Figure 2.6: Recommended Particle size distribution
10
LIQUID LIMIT L I (V.)
Figure 2.7: Recommended Plasticity Limits
67

n a The need for and practice of soil stabilisation
Soli stabilisation as a science started to evolve about 60 years ago. [24] The
growth of soil stabilisation has economic roots, its economic importance arises
fi'om the possibility of improving soils at a site of construction for use as
I n u n d a t io n s or as materials of construction. If an unstable soil has to be removed
rind replaced with other foundation material such as grave! or crushed rock the
{;ost can be high owing to the weight and bulk of the materials involved. Similarly
If soil or stabilised soil can be used as a construction material transportation
costs are greatly reduced as fewer building materials have to be transported to
t| 10 site. Soil stabilisation has been used in the building of roads and aircraft
runways, earth dams and embankments, in erosion control, in the reduction of
frost hoaving and for the construction of buildings.
V V I i o n a project is encountered which involves the use of soil as a construction
nintorial and the soil on the site is considered unsuitable, possible alternatives
aro: [33]
•) Avoid the particular site. Relocate a planned highway or development site.
2 Design the planned structure accordingly.
3 Remove and replace unsuitable soils.
4 Attempt to modify the existii ig ground, (soil stabilisation)
Aa more end more land becomes subject to urban or industrial, development,
good construction sites and borrow areas are difficult to find and the soil
Improvement alternative more frequently becomes the best option, technically
and economically.
goll stabilisation techniques are also increasingly being applied in the
(’ohsbllitation of hazardous-waste disposal areas. There emphasis may be on the
fixation of dangerous pollutants, but at the same time a geotechnically

engineered design should impart a minimum strength and volume stability to the
waste mass. Of increasing concern to environmentally conscious engineers is
the constructive use of high-energy waste materials such as slag and fly ash.
Part of this concern arises from the estimated increase in ash production in the
years to come. Current costs of fly ash disposal are staggering, considering that
fly ash could be used in combination with lime or cement, as a stabilising agent
for use with soils and as a cement extender in concrete construction.
The current housing backlog in South Africa is an area which may benefit from
the application of soil stabilisation techniques. This is especially true in the more
rural areas where the inhabitants often live a distance away from suppliers of
conventional building materials. The ability to use soil from the site on which
these people live, as a reliable construction material could be a suitable solution
to so.,ie of the housing problem. The popular use of corrugated iron roof sheets
as a walling material provides these homes with highly undesirable thermal
conditions due to a lack of adequate thermal insulation in both summer and
winter conditions.
2.5 Earth construction techniques
There are numerous methods which have been used and are currently being
used for the construction of buildings using earth. Among the most widely known
and practical construction methods are rammed earth in formwork, bricks
moulded in raw earth and baked by the sun or 'adobe' as it is known, and
compressed earth blocks [39]. The rammed earth and adobe methods are
discussed briefly with a more in depth discussion of compressed earth block
technology, as it is the technique adopted in this research.
2.5.1 Rammed earth
Pise or rammed earth construction makes use of formwork in a similar way to
that for casting in-situ concrete. Two shutter boards are erected parallel to each
69

other, with a gap of approximately 300mm between them (this gap may vary
depending on the wall strength required). Hollow spacers are placed between the
panels to ensure that the required gap is maintained. Steel rods are placed
through these spacers, connected and clamped up against the formwork from
both sides. This prevents the formwork from bulging. The moistened soil or soil-
stabilizer mix is then placed between the formwork in layers of approximately
100mm loose material and rammed either manually or mechanically. [53] It has
been found that if layers of greater depth than 100mm are rammed, the lower
part of each layer is insufficiently compacted, (ibid.) As each short length is
completed, the shutters are undamped, advanced and reclamped until a
complete layer, the length of the wall being constructed, has been formed.
Shutters are then raised to cast the following layer. This form of construction was
investigated by Roberg. [60] Roberg investigated the construction of walls using
three soils found In the Witwatersrand area. He showed, using a scientific
investigation, that the soils stabilised with cement could be used to produce
rammed earth walls which exhibited sufficient strength and durability to
confidently be used in the construction of a single storey building.
2.5.2 Adobe construction
Adobe construction is a technique which uses sun dried clay bricks in the
construction of buildings. To manufacture adobe bricks, small amounts of water
are added to the soil which is mixed with the aid of a shovel and by treading on
the material with bare feet until a homogenous dough-like consistency is
obtained. Often short pieces of straw are added to increase the tensile strength
of the bricks and to avoid excessive cracking of the bricks on drying out (If straw
or other fibres are added it is known as cob, whereas if just soil is used it is
known as adobe). Once the material is thoroughly mixed, the mixture is tamped
into v/ooden moulds and the excess material removed from the top surface of the
mould. The mould is then removed and the bricks are left to dry. To avoid
excessive cracking of the bricks due to rapid drying of the material, various
mafai nr,. - be placed over the bricks to reduce the rate of drying, for example
70

straw, canvas or plastic sheets. Once the blocks have dried they are then laid in
a simiiar way to fired clay bricks using mud as the mortar.
2.5.3 Compressed earth block technology.
The compressed earth block is the modern descendent of the adobe block. The
idea of compacting earth to improve the quality and performance of moulded
earth blocks is, however, far from new, and it was with wooden tamps that the
first compressed earth blocks were produced. This process is still used in some
parts of the world. The first machines for compressing earth probably date from
the 18th century. In France, Francois Cointeraux, inventor and fervent advocate
o f “new pise" designed the “crecise”, a device derived from the wine-press. But it
was not until the beginning of the 20th century that the first mechanical presses,
using heavy lids forced down into moulds, were designed. Some examples of this
kind of press were even motor-driven. The fired brick industry went on to use
static compression presses in which the earth is compressed between two
converging plates. But the turning point in the use of presses and in the way in
which compressed earth blocks were used for building purposes came only with
effect from 1952, following the invention of the famous CINVA-RAM press
designed by engineer Paul Ramirez at the CINVA centre in Bogota, Columbia.
This was used throughout the world. With the 70s and '80s there appeared a
new generation of manual, mechanical and motor-driven presses, leading to the
emergence today of a genuine market for the production and application of the
compressed earth block. [6]
Since its emergence in the '50s compressed earth block (CEB) production
technology and its application in building has continued to progress and to prove
its scientific as well as its technical worth. Research centres, industrialists,
entrepreneurs and builders have developed an extensive body of knowledge,
making this technology the equal today of competing construction technologies.
CEB production meets scientific requirements for product quality control, from
identification, selection and extraction of the earth used, to quality assessment of
71

the finished block. This scientific body of knowledge ensures the quality of the
material.
The setting up of compressed earth block production units, whether on a small
scale or at industrial level, in rural or urban context, is linked to the creation of
employment generating activities at each production stage, from earth extraction
in the quarries to building work itself. The use of the material for social housing
programmes, for educational, cultural or medical facilities, and for administrative
buildings, helps develop societies' economies and well being. CEB production
can form part of development strategies for the public and the private sector
which underline the need for training and new enterprise and thus contributes to
economic and social development. This was the case in the context of a
programme on the island of Mayotte, in the Comoros archipelago, for the
construction of housing and public buildings, a programme today regarded as an
international reference. [6] The use of compressed earth blocks, which followed
the setting up of an island production industry proved pivotal in Mayotte's
development, founded on a building economy generating employment and local
added value in monetary, economic and social terms, Compressed earth blocks
represent a considerable improvement over traditional earth building techniques.
When guaranteed by quality control compressed earth blocks products can very
easily bear comparison with other materials such as the sand-cement blocks or
the fired bricks. .
Compressed earth block technology has made great progress thanks to scientific
research, to experimentation, and to architectural achievements which form the
basis of a wide range of technical. documents and academic and professional
courses'. A major effort is now being devoted to the question of norms and this
should help to confer ultimate legitimacy upon the technique in the coming years..

Production of compressed earth blocks
The production of compressed earth blocks can be regarded as similar to that of
fired earth blocks produced by compaction, except that there is no firing stage.
The following flow diagram describes the production of stabilised soil blocks:
PREPARATION
MIXING
COMPRESSION
CURING
COMPRESSION
WET MIXING
DRY MIXING
DRYING OUT
WET CURING
MEASURING OUT
STOCKING
PULVERISING
EXTRACTION
SCREENING
DRYING
REMOVING FROM
MOULD
MEASURING OUT
DRY MATERIALS
7 3

Excavation
This is the starting point of the compressed earth block production cycle. The soil
is excavated from a suitable site either manually or by machine.
Drying
After excavation the soil is dried by spreading it in thin layers or passing through
a hot-air cyclone.
Pulverising
It is sometimes desirable to break up, crush or pulverise a fragmented or
consolidated soil. Pulverisation is often indinspensable in the case of
compressed, cement or lime stabilised blocks and is largely responsible for
ensuring the quality of the product. [39] When a soil is well graded into required
distinct grain fractions and sieved, the grains, water and powder stabiliser will be
evenly distributed and the product will be of good quality.
Screening
This operation is absolutely essential when:
I. the removal of excessively large elements or organic matter is required,
II. after pulverising there are still particles larger than that required.
Measuring out dry materials
The soil, stabiliser and water are measured out by weight or volume according to
design parameters.
Dry mixing
This is a particularly important stage in order to maximise the effectiveness of a
stabilizer in powdered form by ensuring even distribution throughout the soil. The
importance of obtaining a good mix cannot be overstated.
L
74

Wet mixing
The optimum amount of water is added to the soil-stabilizer mix by either
sprinkler, or a mist spray, or by means of pressurised steam.
Measuring out
The correct amount of the moist stabilised soil is measured out to ensure the
dimensions of the blocks remain the same throughout production.
Compression
The mixed material is then compacted using human energy (the manual press)
or mechanical energy (motorised presses). The moulding pressure or compactive
effort in measured in megapascals (MPa) and is the theoretical pressure applied
to the soil expressed as a ratio between the effective force and the area over
which it is applied.
Wet and dry curing
The concept of curing is discussed in the following section.
7 5

Curing of stabilised soil blocks
The curing of stabilised soil blocks is one of the factors which contribute to the
strength and durability of the finished product. Curing is the period after the soil
and stabiliser mix has been compacted .during which principally two types of
phenomena occur: [6]
® Physicochemical reactions between the various components of the mix
and above all the soil and the additives resulting in the stabilisation of
the block: during this phase, humidity and temperature of the curing
environment are crucial.
• • Drying which consists of the gradual removal, by evaporation, of the
moisture needed for the manufacture of the blocks.
For cement or lime stabilised blocks, the presence of water within the block is
crucial for the soil-stabiliser mix to attain its maximum strength. Cement
stabilised blocks must be kept in a humid environment for at least seven days. [7]
The surface of the blocks must not be allowed to dry out too quickly, as this may
lead to shrinkage cracks. The blocks must be sheltered from direct sun and wind
and kept in conditions approaching 100% relative humidity by covering them with
waterproof plastic sheets. The humidity and temperature of the curing
environment plays an important role in the rate of curing and strength obtained.
For example, compared with 14 days' curing at 100% relative humidity, blocks
cured for 7 days at 100% relative humidity and 7 days at 95% relative humidity
blocks will achieve 25% less strength. Blocks cured for 7 days at 40°C will be 1.5
to 2 times stronger than blocks cured for 7 days at 20°C. [6]
After curing, a drying period should be allowed so that the water is allowed to
evaporate and the clay fraction to shrink. This drying period is to allow the block
to shrink before it is built into a structure. To prevent shrinkage occurring too
quickly, exposure to wind and direct sun must be reduced.
76

Curing conditions for blocks stabilised with lime are identical to those stabilised
with cement, i.e. hot humid conditions. The period of time, which is suggested,
for curing is different, blocks stabilised with cement are cured for a minimum of
seven days whereas a block stabilised with lime should be cured for a minimum
of twenty-eight days. [16,39]
77

CHAPTER THREE

3.0 THE SOIL SPECIFIC TO THIS INVESTIGATION
To successfully stabilise a soil a thorough knowledge of the nature and
properties of that soil must be gained. By knowing the properties of the soil, it is
possible to make a decision as to its suitability for the production of compressed
earth blocks. Chapter 3 details the nature and properties of the soil which was
investigated in this report.
3.1 Origin of the soil.
The soil, which was investigated in this research, is a by-product of the water
purification process used at Rand Water’s Panfontein purification plant. The
water, which is pumped out of the Vaal River has to be purified to make it fit for
human consumption. The raw water has silt and clay particles in suspension.
These particles have to be removed. The purification process involves the
flocculation of these particles by the addition of calcium hydroxide to the water.
The calcium ions attach themselves to the silt and clay particles making these
particles heavy and causing them to sink forming a “sludge". The clean water and
the sludge are then separated. The sludge is pumped out to settling ponds where
it dries out to foi m a soil material. The sludge is produced at about 600 tons per
day. At present, there is no use for the sludge and it is simply being stockpiled.
3.1.1 Reasons for the choice of the soil
The soil is a by-product and is not presently being utilised. As discussed, the
sludge from the purification process is pumped into settling ponds where it dries
out. Once the water has evaporated from the sludge the settling ponds are filled
up with more sludge and allowed to dry, eventually the settling ponds are filled
with the dry material. Once a pond is full of dry material it can no longer be used
and new ponds are built to accommodate the production of sludge. This requires
that new land be purchased to build the new ponds on. The land surrounding the
Panfontein plant is agricultural land and as a result of settling ponds being built
78
!

on it, it is not being used productively. By finding a use for the dried sludge a
number of advantages can be realised. Firstly, the use of a by-product from one
process as a raw material for another will eliminate the need for disposal which is
often costly and the use of agricultural land for waste management will also be
stopped. Secondly, a material, which can potentially be used for the production of
compressed earth blocks, is readily available and does not have to be 'mined' as
do the materials for fired clay bricks. If a block production plant can be set up to
utilise the sludge, jobs will also be created in the local community.
Research has been conducted into the possible use of the dry sludge for the
production of fired-clay bricks. However this was not successful as the clay is
difficult to extrude and the blocks crack during the initial drying period before
firing in the kiln.
3.2 Laboratory analysis of the soil
A laboratory analysis was conducted on the Panfontein soil to determine some of
the soil's properties and its mineralogy. The mineralogical analysis was
conducted to determine the type of clay mineral present in the soil. The physical
properties of the soil were analysed according to standard procedures used in
the field of soil science as described in “Technical Methods for Highways 1.”
Properties that were determined included:
1. Atterberg limits, which consists of the
liquid limit,
plastic limit,
plasticity index
and the linear shrinkage of the soil.
2. Particle size distribution, which consists of the determination of the grain
size of the soil by means of sieve and hydrometer analysis.
79

Description of the testing procedures for the determination of the Atterberg Limits
and the particle size distribution are detailed in Appendix 1.
The mineralogy of the soil was examined using x-ray diffraction analysis.
The results from these analyses were used to determine the suitability of the soil
as a material for the production of compressed earth blocks and to classify the
soil.
3.2.1 Results of the Atterberg Limits tests
The following table shows the results of the Atterberg Limits tests of the soil used
in this report.
LIQUID LIMIT 64PLASTIC LIMIT 29PLASTICITY INDEX 35LINEAR SHRINKAGE 15.5PI OF THE WHOLE SAMPLE 35
The values obtained from the Atterberg Limits are used to classify the soil.
3.2.2 Particle size analysis
A combined analysis was used to determine the soil grain size distribution. Such
an analysis is a routine way of classifying soils, but grain size is not as useful as
it was once believed it may be. [26]. The grain size curves of coarser grained
soils provide more useful information than those of fine-grained soils.
The analysis is carried out by shaking the soil through a stack of sieves with
known opening sizes - in order to classify the larger particles and by using a
hydrometer and Stoke's equation for the velocity of a free falling sphere to
determine the range of fine particles.
iL
80

3.2.3 Particle size analysis results
The following table and graph represent the results of the particle size analysis.
Particle Size % Passing Description %
(mm) (by mass) Type
37 50 100
26.50 100
19.00 100
13.20 100 GRAVEL 0
4.75 100
2.00 100
0.850 100
0.425 100
0.250 99SAND 18
0.150 98
0.075 97
0.060 82
0.046 64SILT 59
0,022 52
0.007 36
0.002 23 CLAY 23
Total % passing = 100
Table 3.1: Results from the particle size analysis of the sieve andhydrometer methods
81

)o FI
NER
BY M
AS
S
PARTICLE SIZE DISTRIBUTION
PARTICLE SIZE (mm)
CLAY S I L T S A N D G R A V E L
- S - X 638
Figure 3.4: Graphical representation of the particle size distribution
82

3.2.4 Mineralogical analysis of the soil
In addition to determining the physical properties of the soil, the soil was also
subjected to x-ray diffraction (XRD) analysis. X-ray diffraction is the analytical
tool most commonly used to identify clay types in terms of their mineralogy. [72]
In x-ray diffraction analysis two parameters are determined. These are: [24]
a) the spacings between the planes of atoms in the crystals (basal spacing), and
b) the intensities of the x-ray reflections from the corresponding planes.
X-ray diffraction produces diffraction patterns or spectra, which are used to
identify minerals. These spectra are graphical representations of peaks, with the
intensity of the peaks on the y-axis and the angle of diffraction on the x-axis. The
position of these peaks in relation to the x-axis indicates the spacing between
successive sheet layers of atoms (known as the basal spacing or 00L spacing) in
a crystal structure.
The spacing is used to determine the nature of the crystal structure and thereby
the nature of the material undergoing x-ray diffraction analysis. [11] The soil
samples were analyzed specifically to determine what the type of clay mineral
makes up the clay fraction of the soil. This is important as the type of clay mineral
in soil plays an important role in the effectiveness of the different stabilising agents used.
The XRD analysis was performed at the Council for Geoscience by Dr. Dieter
Buhman, a renowned scientist in the field of clay mineralogy in South Africa. The
results of the XRD are mainly qualitative, where the spectra produced during the
analysis are used to identify clay minerals, although the introduction of computer
software packages enables semi-quantitative analyses to be conducted.
83
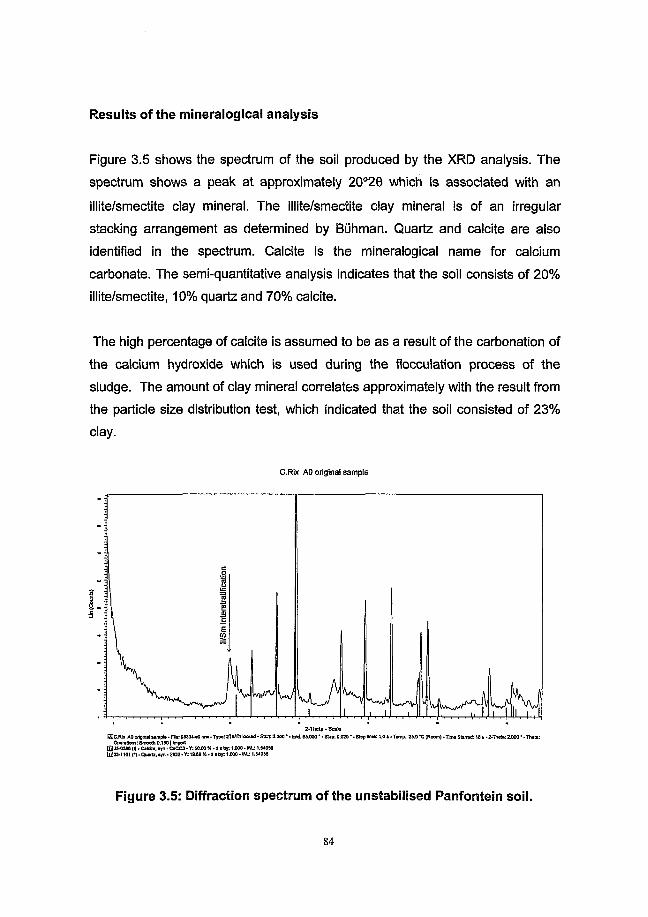
Results of the mineralogical analysis
Figure 3.5 shows the spectrum of the soil produced by the XRD analysis. The
spectrum shows a peak at approximately 20°26 which is associated with an
illite/smectite clay mineral. The illite/smeciite clay mineral is of an irregular
stacking arrangement as determined by Buhman. Quartz and calcite are also
identified in the spectrum. Calcite is the mineralogical name for calcium
carbonate. The semi-quantitative analysis indicates that the soil consists of 20%
illite/smectite, 10% quartz and 70% calcite.
The high percentage of calcite is assumed to be as a result of the carbonation of
the calcium hydroxide which is used during the flocculation process of the
sludge. The amount of clay mineral correlates approximately with the result from
the particle size distribution test, which indicated that the soil consisted of 23%
clay.
C.Rix AO original sample
t .5
Z-Ttieta • ScaleS1C.R1X AO original u-Tvpie. FBa: 983)440jiw - Type: ZThmi leexed • St*.t 2.000' • End: 65.000' - Slap: 0.020'. Step time: t .0 • • Temp.: 25.0 *0 (Room) • Time Started: IS e . 2-Tbeta: 2.000 * . Theta:
OpersSona: Smooth 0.1501 Import E3 054568 (I) • Catena, *yn-CeCG3-Y: 50.00 %-d x by. 1.000 »WL 1.54050 Q33-1161 n*Qu*rtx,eyn-SI02»Y: 19.69 K»d a by: 1.000-Wt: 1.54056
Figure 3.5: Diffraction spectrum of the unstabilised Panfontein soil.
84

3.3 Classification of the Panfontein soil
The physical properties of the soil as determined by the laboratory tests were
used to classify the soil according to the Unified Soil Classification System. The
procedure used is explained in section 1.6.
From the particle size distribution curve (figure 3.4) and Table 3.1 :
Approximately 97 percent of the soil passes the 0,075mm sieve. Therefore as
can be seen on the classification chart (figure 2.6) the soil is fine grained and can
be classified as MH, OH, or CH.
Because the fine fraction is greater than 12 percent, the soil is not subject to dual
classification and the secondary symbol can be obtained using the plasticity
chart. The plasticity index (liquid limit - plastic limit) for the soil is 35 and the liquid
limit is 64. If the relevant point is plotted on the plasticity chart (figure 2.4), it is
seen that the point falls above the A-line in the CH zone with the C indicating the
soil is a clay and the H indicating a liquid limit of higher than 50 percent. The
classification for this soil is thus CH, which on the classification chart (figure 2.6)
is described as an inorganic clay of high plasticity.
3.4 Problems associated with the soil according to its properties
As discussed in chapter 2, the suitability of a soil as a raw material is dependent
on its properties. The particle size distribution of a soil, which is suited for use in
the production of soil blocks, is shown in figure 2.5. When comparing the results
of the particle size distribution curve of the sludge to the recommended limits, it is
evident that the grading does not fall within the limits. The sludge has a narrow
grading curve, which means it is lacking in one or more of the components which,
make up a soil. In this case it is the sand fraction that is missing.
The plasticity index and the liquid limit of the sludge also fall outside the limits
proposed in figure 2.6. This high plasticity index of the soil indicates that the soil
85

is highly susceptible to volume changes in the presence of moisture. This is
obviously undesirable if the soil is to be used for the production of compressed
earth blocks, as volume changes can destroy the bonds between soil particles
and may lead to eventual disintegration of the block. This was confirmed when
the blocks were made of the unstabilised soil.
Although the amount of clay in the soil falls within the recommended limits, the
actual nature of the clay mineral is the problem i.e. the smectite in the
illite/smectite interstratification. Smectite is a highly expansive clay, whereas illite
does not expand much when exposed to moisture. The inclusion of the smectite
therefore makes the sludge unsuitable as a construction material. If the soil
consisted of 20% kaolinite or 20% illite , the soil would not be problematic.
3.4.1 Modification of problematic properties.
The objective of soil stabilisation in this case is therefore to alter the problematic
properties of the sludge detailed above. The particle size distribution not being
ideal should be corrected to fall within the limits recommended. If however it is
calculated how much of the sandy fraction is to be added, bearing in mind that
the optimum mix would also have to be economic, a large amount of sand would
have to be imported as a minimum of 50% of the mass of the dry sludge in the
form of sand between 5mm and 0.075mm will have to be added to the sludge. It
was decided not to correct the grain size distribution. The ideal solution however
would be to correct the texture with the addition of sand.
The plasticity of the soil, if not altered, would have a detrimental affect on the
mechanical properties of the compressed block due to volume changes when
exposed to moisture. The plasticity of the soil is related to the percentage of and
type of clay mineral present in the soil. Therefore by reducing or modifying the
clay fraction the plasticity of the soil could be reduced. The plasticity can be
modified by treatment with lime resulting in a reduction of the liquid limit and an

increase in the plastic limit can be achieved through the reactions detailed in
chapter 1 (lime-clay reactions). As discussed the addition of lime to a clayey soil
results in a modification reaction and if sufficient lime is added, cementation of
the clay particles will occur. The objective of the addition of the lime was
therefore to achieve the modification reaction. This reaction is expected to result
in changes in the plasticity index. The lime was added to bring the plasticity index
and liquid limit of the soil within the limits recommended for soils for compressed
earth blocks that are to be stabilised with cement.
To achieve these changes in the properties of the sludge further tests involving
the addition of lime to the sludge were conducted. The tests conducted were
undertaken to determine the following:
1. The amount of lime required by the soil in order for modification of the clay
fraction to take place :
This is determined using a test known as the initial consumption of lime (ICL)
test, which gives an indication of the amount of lime required by a soil to
satisfy the soil’s affinity for calcium. The result indicated by the test will be the
amount of lime required for modification of the clay (see section 2.3) and the
quantity of lime indicated by the ICL test is also known as the soil’s lime
fixation point. This quantity of lime is considered to be the optimum quantity.
The testing procedure used for the ICL test is detailed in Appendix 2.
2. The effect that the optimum quantity of lime has on the Atterberg limits of the
soil:
This was conducted to determine if the optimum quantity of lime would reduce
the plasticity index of the soil sufficiently to bring it within the limits
recommended for soils to be stabilised with cement. The time period required
for the change in the plasticity index of the sludge was also determined.
These two characteristics were determined by adding the optimum quantity of
87
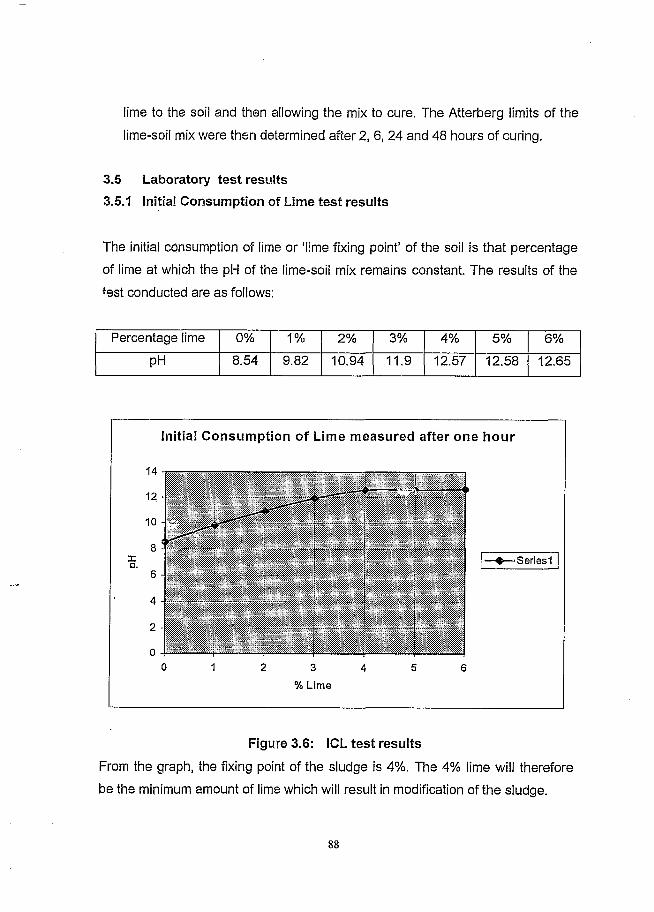
lime to the soil and then allowing the mix to cure. The Atterberg limits of the
lime-soil mix were then determined after 2, 6, 24 and 48 hours of curing.
3.5 Laboratory test results3.5.1 Initial Consumption of Lime test results
The initial consumption of lime or ‘lime fixing point’ of the soil is that percentage
of lime at which the pH of the lime-soil mix remains constant. The results of the
test conducted are as follows:
Percentage lime 0% 1% 2% 3% 4% 5% 6%
pH 8.54 9.82 10.94 11.9 12.57 12.58 12.65
Initial Consumption of Lime measured after one hour
xo.
14
12 i l l i l s ie s is s i* !
10
8
6
4
2
010 2 3
-Seriesl
% Lime
Figure 3.6: ICL test results
From the graph, the fixing point of the sludge is 4%. The 4% lime will therefore
be the minimum amount of lime which will result in modification of the sludge.
88

Samples of soil were then treated with 4% of lime and their liquid limit and plastic
limit determined after different time intervals.
3.5.2 Results of the effect of curing period on the Atterberg Limits of the
lime modified sludge
MODIFICATION PERIOD Ohr 2hr 6hr 24hr 48hr
LIQUID LIMIT 64 59 57 55 55
PLASTIC LIMIT 29 38 41 41 42
PLASTICITY INDEX 35 21 16 14 13
Plasticity Index vs Time
Hours
— ♦ — Liquid Limit
—@— Plastic Limit
—A Plasticity Index
Figure 3.7: Changes in the Atterberg Lim its after addition o f 4% lime.
The results show that the addition of 4% lime reduces the Plasticity index of the
soil from 35 to 16 in 6 hours after which it only reduces to 13 after an additional
42 hours. The modification of the day, as indicated by the changes in the
89

plasticity index and liquid limit, proceeds rapidly within the first 6 hours of curing
after which the changes are relatively small.
The table below shows the change in the linear shrinkage with the addition of 4%
lime as a function of curing time. The linear shrinkage of the unstabilised sludge
is 15.5 %. The linear shrinkage of the soil is also reduced markedly after the
addition of 4% lime with the linear shrinkage of the material being reduced from
15.5 to 8.5 in 6 hours and a further reduction to 6.5 in a further 42 hours. Linear
shrinkage results:
Modification period Ohr 2hr 6hr 24hr 48hr
Linear Shrinkage 15.5 9.5 8 '. 7.5 6.5
Linear shrinkage vs Curing time
O)21w2C
--------------------- ----
12 18 24
Hours30 3 6 43 48
Figure 3.8: Change in Linear shrinkage after addition of 4% lime.
90

3.5.3 Mineralogical changes due to addition of lime.
In order to gain a fuller understanding of the modification of the soil by lime, x-ray diffraction analysis was conducted on the soil treated with 4% lime, in an attempt to correlate the changes in the physical properties with a change in the mineralogy of the soil. As described in chapter 1 the modification reaction results in the exchange of cations. A question often asked in this research was why the modification of the clay does not occur when lime is added during the water purification process. After the lime is added, the pH of the water is corrected by bubbling carbon dioxide through the water. The author believes that this results in the carbonation of the calcium ions and thereby not allowing the ions to take part in the modification reactions. The time period between the addition of the lime and the correction of the pH is not sufficient for the required reactions to take place. The cations which are exchanged are those which are in the interlayer space. Kaolinite therefore does not undergo significant modification as there are no interlayer cations in kaolinite and it has a low cation exchange capacity (1-10 meq/100g). Illite has potassium ions in the interlayer space and these are not readily replaced by the calcium cations, the cation exchange capacity of illite is oetween 10 and 40 meq/100g. Smectite minera's have a high cation exchange capacity as the bond between the layers in the minerals is weak and the cations are loosely held and therefore easily exchanged. The cation exchange capacity may range from 80 to 150 meq/100g.
In an illite/smectite clay mineral cation exchange would take place in the interlayer space between smectite layers. Therefore, if the sodium cations are replaced by larger calcium cations the interlayer space which is determined by the cation adsorbed intc it would increase. The peak in the XRD diffraction pattern would then shift to the left (basal spacings decrease from left to right on the x-axis). The result hoped for was a decrease in the intensity (height) of illite/smectite peak, indicating that modification had taken place by cation exchange. The results of the XRD analysis were then compared with the XRD results of the unstabilised soil (figure 3.5) with the XRD spectrum of the soil after a 4% addition of lime.
Work done by Croft [10], Hilt and Davidson [37], Eades and Grim [18] included
the x-ray diffraa.on of illite and montmorillonite(smectite) which had been treated
with lime. They concluded that the reaction of lime begins with a replacement of
existing cations between the silicate sheets with Ca++. Following the saturation
91

of the interlayer positions with Ca H' the whole clay mineral structure deteriorates
with an accompanied reduction in the peak intensity related to the clay mineral.
This reduction in peak height was not evident in this research. However the
changes which take place in the physical properties are evidence of distinct
changes which take place in the clay.
The XRD was conducted on the lime-stablised soil after the mix had been
allowed to 'cure' for 6 hours. Six hours was chosen as the curing period as the
change in the Atterberg limits slowed markedly after 6 hours of curing and it was
assumed that the majority of the modification had taken place in this period of
time.
C.Rix B1
5
EBC-fte 81 - Fie: 86334-bl.faw • Type: 2BVTti tockad - Start 2.000' - End: 65.000 * • Step: 0.020 * • Step time: 1.0 a - Temp.: 25.0 ‘ C (Room) - Ttne Started: 17 s • 2-Theta: Z000 * 0305-0536 ( I) . Catefle, ayn - CaC03 - Y: 55.15 S • d x by: 1.000 - W L 1.54056 0333.1161 C) - Otiartt, eyn - 5X32 - Y: 21.30 % - d x by: 1.000 - WU 1.54056
Figure 3.9 XRD spectrum of 4% lime stabilised sludge
92

To determine what affect a lime addition higher than indicated by the ICL test
would have on the clay a XRD analysis was conducted on a sample stabilised
with 7% lime. Figure 3.10 shows the spectrum.
The presence of Portlandite {Ca(OH)2} indicates that there is excess lime which
was not used up in the modification reaction. The semi-quantitative analysis
showed the concentration of the Portlandite to be 3%. This reinforces the findings
of the ICL test which indicated a lime fixing point of 4% for this soil.
C.Rix B2B
Qc.Rix BIB - File: 9a334-S2B,RAW - Type. ZTtvTh locked » Start 2.000' - End: 65.000" - Step: 0.020 * - Step time: 1.0 s -Tempu 25.0 ’ C (Room) • Time Started: 11333-1161 H - Quartz, syn-SI02-Y: 29.29 % - d x by: 1.000-W U 1.54056 IQ05O5S6 (I) - Caldte, syn • CaC03 - Y: 51.17 % • d x by: 1.000 - WU 1.54056 £204-0733 (1) - Portlandite. syn - Ca(OH)2 - Y: 9.49 % - d x by. 1.000 ♦ W L 1.54056
Figure 3.10: Diffraction pattern of Panfontein soil stabilised with 7% lime.
93

Conclusions
The changes which have occurred in the physical properties are not shown by
the XRD spectra. The author believes this is due to the clay mineral having a
poor crystalline structure. The change in the physical properties as indicated by
the Atterberg limits are therefore assumed a more reliable source of evidence of
the modification reactions associated with lime stabilisation in this particular soil.
94

CHAPTER FOUR

4.0 MATERIALS PREPARATION AND TEST BLOCK MANUFACTURING
PROCESS
4.1 STABILISING AGENTS
4.1.1 Cement
Ordinary Portland cement (GEM I 42.5) was used throughout the project.
Sufficient cement for the entire project was sealed in plastic bags, which were
placed together in airtight containers. Cement retains its properties over fairly
long periods of time if correctly sealed from the ingress of carbon dioxide and
water vapour. [80]
Compound %
S i02 22.9
AI2O3 4.2
FegOs 3.8
MnaOa 0.4
TiOz -
CaO 65.0
MgO 3.3
P20
SOa 0.2
Na20 0.1
KzO 0.6
Table 4.1: Chemical analysis o f Ordinary Portland cement
95

4.1.2 Lime
A lime commonly used for soil stabilisation was selected for this project. The lime
is described as a "super air-separated dry hydrated lime”. The chemical analysis
of the lime is shown in table 4.1. To prevent carbonation after opening the bag of
lime, the lime was divided into smaller quantities and stored with bags of
dessicant in airtight containers. In this way, the lime was minimally exposed
before use. In considering the type of lime to use, unslaked lime was rejected
because of its' caustic nature.
Available CaO 67%
Total Calcium as CaO 73.05%
Total Magnesium as MgO 0.63%
Silica + Insolubles as SiOz 2.08%
Other Metals as R2O3 0.94%
Carbon Dioxide at Works 0.25%
Loss on Ignition 23.23%
Residue on 0.075mm sieve 1.50%
Table 4.2: Chemical analysis of hydrated lime
4.1.3 Fly ash
The fly ash used in this research is known commercially as ‘pozzfif available
from ash resources. The particle size is sub 110 micron. Fly ash is not reactive
with the atmosphere as is the case with lime and cement, and was stored on
wooden palettes in the laboratory. The 'pozzfill' was delivered by special
arrangement with Ash Resources in 25 kg bags to facilitate storage. When a bag
was opened the total contents were usually used and therefore it was felt that
96

special storage considerations were not required. The chemical analysis of the fly
ash produced at the Lethabo and Matla power stations are shown in table 4.2 .
Fly ash from the Lethabo power station was used in this research.
Lethabo Fly Ash
Silicon -S i0 2 53.8%
Aluminium - Ai203 34.2%
Iron - Fe2Oa 3.6%
Manganese - Mn2C>3 0.1%
Calcium - CaO 4.4%
Magnesium -MgO 1.1%
Phosphorous - P2O5 0.3%
Potassium -KzO 0.5%
Sodium - Na20 0.4%
Titanium -T i0 2 1.6%
Sulphur -SO3 0.1%
Loss on Ignition - LOI 0.8%
Table 4.3: Chemical analysis of fly ash
97

4.2 STABILISER CONTENTS
4.2.1 Stabiliser combinations used for test blocks
The mix design parameters used in the research weie chosen to determine what
the optimum combinations of the various admixtures are to produce compressed
earth blocks with certain physical characteristics. The parameters were also
chosen to determine what affects the various admixtures would have on the
physical properties of the clay soil.
The mixtures used in the research are indicated in the tables below:
Soil-lime combinations
MIX SOIL LIME CEMENT FLY ASH OMC
M 100% 0% 0% 0% 24.6%
L1 96% 4% 0% 0% 25.4%
L2 93% 7% 0% 0% 25.6%
L3 91% 9% 0% 0% 25.9%
Table 4.3: Lime content for lime-stabilised blocks
Soii-lime-cement combinations
MIX SOIL LIME CEMENT FLY ASH OMC
K1 90% 4% 6% 0% 25.1%
K2 89% 4% 7% 0% 24.8%
K3 88% 4% 8% 0% 24.6%
K4 87% 4% 9% 0% 24,3%
Table 4.4: Stabiliser contents for lime-cement stabilised blocks.
98

Soil-fime-cement combinations
MIX SOIL LIME CEMENT FLY ASH OMC
N1 87% 7% 6% 0% 25.3%
N2 86% 7% 7% 0% 24.9%
N3 85% 7% 8% 0% 24.8%
N4 84% 7% 9% 0% 24.6%
01 85% 9% 6% 0% 25.7%
02 84% 9% 7% 0% 25.5%
03 83% 9% 8% 0% 25.4%
04 . 82% 9% 9% 0% 25.2%
Table 4.5: Stabiliser contents fo r lime-cement stabilised blocks.
Soil-iime-fly ash-cement combinations
MIX SOIL LIME CEMENT FLY ASH OMC
11 70% 4% 6% 20% 23.6%
12 69% 4% 7% 20% 23.4%
13 68% 4% 8% 20% 23.0%
14 67% 4% 9% 20% 22.7%
H1 60% 4% 6% 30% 21.3%
H2 59% 4% 7% 30% 21.1%
H3 58% 4% 8% 30% 20.8%
H4 57% 4% 9% 30% 20.6%
J1 50% 4% 6% 40% 19.1%
J2 49% 4% 7% 40% 18.6%
J3 48% 4% 8% 40% 18.4%
J4 47% 4% 9% 40% 18.2%
Table 4.6 : Stabiliser contents fo r lime-cement-fly ash blocks
99

4.3 PRODUCTION OF TEST BLOCKS
The test blocks, which were manufactured for the purpose of this study, were
made using a M5 Hydraform block-making machine. The machine consists of a
vertically orientated mould, which is filled with the soil-stabiliser mix by hand from
above. A hydraulically operated gate closes the top of the mould, before the
material is compacted from below using a hydraulic ram. Once the compaction
has taken place the top gate is retracted and the compacted soil block is pushed
up out of the mould and removed by the operator.
The unit is powered by a 10 kW diesel engine and is mounted on wheels which
makes it portable despite its 850kg mass. The nominal dimensions of the blocks
manufactured by the Hydraform block-making machine are 220mm wide by
115mm high. The length of the block is dependent on the amount of material put
in the mould as well as the compactive effort applied. The stress applied by the
ram during compaction of the block can be varied.
4.3.1 Pre-processing of the sludge
When the sludge dries out in the settling ponds it forms clods of various sizes.
These clods first had to be broken down into smaller particles to ensure that the
stabilisers could be mixed in well. The sludge clods were therefore crushed so
that the particles would pass through a sieve with 2mm openings. This resulted in
lumps of clay (maximum size 2.0mm) and clay ‘powder’. The decision to
pulverise the clods to a maximum size of 2.0mm was based on results achieved
during preliminary testing where the sludge received had been reduced to sub
2.0mm particles. The sludge samples were those which had been prepared for
an investigation of the possible use of sludge in the production of fired-clay
bricks. The blocks which were produced using the sub 2.0mm sludge proved to
have a good surface finish. This was compared with blocks produced by the
author during an undergraduate research report where the sludge was sieved
100

using a sieve with 5.0mm openings. The blocks produced had a poor surface
finish and did not compact well. Based on this obsr-vation it was decided to use
the sludge with a maximum particle sizes of 2.0mm. After the sludge had been
pulverised it was sieved, thoroughly mixed and placed in 25kg bags in the
laboratory.
4.3.2 Pre-conditioning the soil with lime
As discussed in chapter 3 the plasticity of the sludge had to be reduced. This
was achieved by pre-conditioning the sludge before the addition of cement and
fly ash. Before the cement and fly ash components of a mix were added, the
sludge was treated with 4% lime (as indicated by the results of the ICL test) to
allow the modification of the clay to take place. The lime and soil were weighed
out and placed in a pan mixer and dry mixed for 4 minutes. "Water was then
measured out using a measuring cylinder so that 10% moisture was added to the
lime-soil mix. The combination was then mixed for a further 6 minutes. The soil-
lime combination was then put into a plastic bag and sealed to prevent
carbonation and loss of moisture. The combination was left for a 6-hour period to
allow the modification reaction to take place. The test conducted into the effect of
the 4% lime addition on the Atterberg limits (section 3.7.2) showed that the
majority of the modification reaction takes place in the first 6 hours after mixing.
Further curing results in very small changes. From a production point of view,
therefore the modified soil can be used after 6 hours.
4.3.3 Determination of the optimum moisture content. (OMC)
The optimum moisture content of a soil or soil stabiliser combination can be
defined as the moisture content at a particular compactive effort which will result
in the highest density of the compacted material being achieved. The optimum
moisture contents for the various combinations used were determined by firstly
applying the 'drop' test and then refining this by producing blocks which could be
101
successfully handled without disintegrating. The drop test is a field test used in
the field of stabilised soil blocks to determine the optimum moisture content for a
particular combination of soil and stabiliser. Moisture is added to a soil-stabiliser
mix until a ball can be formed in the hand. This ball is dropped from a height of
one metre onto a hard sui ,ace. The soil-stabiliser mix is considered to be near its
optimum moisture content when the ball breaks up into 4 or 5 pieces and does
not shatter. The moisture content is too high if the ball remains fully intact.
Blocks are then produced using the moisture content indicated by the drop test.
These blocks were then examined to determine if the block could be handled
without the comers or any edges crumbling. The blocks were all compacted at a
compactive effort of 4 MPa as the blocks compacted at lower pressures
crumbled when handled and blocks produced at higher pressures showed
pressure cracks as a result of over compaction. These cracks formed as soon as
the block was removed from the mould. It was also desirable to keep the
compactive effort the same for all the combinations so compactive effort could be
eliminated as a variable when blocks produced using the various combinations
were compared. Once the author was satisfied with the degree of compaction
achieved, a sample of the soil was oven-dried at 110°C to determine the exact
moisture content. The moisture contents (OMC) used in the production of the
blocks are shown in table 4.3-4.6 where details of the combinations used are
given.
4.3.4 The manufacturing of the blocks
After the 6-hour modification period, the lime-soil combination was returned to
the pan mixer where the measured amounts of cement or the cement and fly ash
were added. These combinations were then mixed for approximately five minutes
until a mix with uniform colour was obtained. The balance of the water required to
bring the mix to its optimum moisture content was then added by sprinkling and
mixing for a further five minutes.
102

After the mixing the pan mixer was stopped and the soil-stabiliser combination
was poured into the compaction cylinder of the Hydraform machine. The mix was
then compressed and the block removed. This process was followed for all the
design mixes. After the blocks were produced, they were cured under plastic for
a period of fourteen days after which they were removed from the plastic, dry
cured for a further 14 days, and then removed to be tested.
For all the blocks manufactured for this research an applied stress of four MPa
was used.
A total of thirty test specimens were produced tor each mix. A total of 840
specimens were produced for the research.
Figure 4.1 shows the dimensions of a typical block produced in the Hydraform
block press. The key, which is provided to facilitate dry stacking of the blocks,
can also be seen.
103

115mm
SIDE ELEVATION
220mm
FRONT ELEVATION
variable
TOP ELEVATION
Figure 4.1 : The Hydraform Block in elevation
104

CHAPTER FIVE

5.0 Tests conducted on the blocks
5.1 Introduction
Chapter five covers the physical tests conducted on the blocks produced from
Panfontein soil and the three stabilising agents. XRD analysis was also
undertaken on samples taken from the test blocks in an attempt to evaluate the
changes in mineralogy as a result of the addition of fly ash and cement. This was
undertaken to correlate the changes in the performance of soil with changes in
mineralogy. The XRD analysis is discussed at the end of the chapter.
The physical tests conducted on the stabilised soil samples where chosen to
evaluate the effect various combinations of the three stabilising agents have on
the performance of the sludge when used as a raw material for the production of
building blocks. The tests chosen are those which were expected to be the most
likely indicators of the stabilised soil blocks’ performance as a material under field
conditions. The results of the tests are used to obtain an indication of the
effectiveness of a particular combination when compared with other
combinations and in some cases, generally accepted standards used in the field
of stabilised soil blocks. Another objective of the tests was to determine an
optimum combination of the stabilizers, which will satisfy the standards set, as
well as being economical in terms of m te ria l costs.
The blocks were tested to determine their physical properties with respect to the following:
1. Dry compressive strength2. Wet compressive strength3. Drying shrinkage4. Water absorption5. Resistance to water induced erosion.6. Expansion due to water absorption.
105

5.1.1 Standards adopted for assessment of blocks
As the field of compressed earth blocks is still a relatively new one in South
Africa, there are no standards by which the performance of the blocks can be
judged, it was therefore decided to use a standard developed by CRATerre and
the Center for Development of Industry in Europe known as CIB W 90. The
standards were developed as a framework for individual countries to adopt and
customise to local conditions. The standard suggests compressive strength and
water absorption limits for building blocks to be used in certain conditions.
CRATerre also suggests a limit for durability in terms of an accelerated water
erosion test. The standard has various requirements in terms of mechanical,
hygrometric and physical characteristics for ordinary blocks (intended to be
covered) and facing blocks (intended to remain visible). The standard used was
that applicable to ordinary blocks. The ordinary blocks are divided into 9 classes
each with different requirements. The criteria adopted was for a block which
would be used in a structural element resistant to small external live loads e.g. a
single-storey building made of load bearing structural elements. The
environmental category which the block falls into is structural elements resistant
to water damage by vertical penetration and lateral spraying e.g. walls exposed
to rain, external walls unprotected from capillary rise and internal walls
unprotected from water leaking through the roof. The block falls into the category
designated by the following number CEB OC2. Blocks in this category must have
the following physical properties:
Dry compressive strength >4 MPa
Wet compressive strength >2 MPa
Water absorption < 10%
The durability of the block is determined by the accelerated water erosion test.
The recommendation made by CRATerre as to the blocks’ performance with
106

regard to this test are that depth of the eroded pockets, which develop during the
accelerated erosion test, must not exceed 15mm in depth.[39]
The following table details the number of specimens tested for each of the mixes
produced:
TEST NO. OF SPECIMENS PER MIX
Compressive strength - dry
-wet
28 days - 5
7 days - 5 * 28 days - 5
Drying shrinkage 3
Water absorption 3
Water induced erosion 3
Expansion due to water absorption 3
TOTAL 27
* The 7 day compressive strength is designated “wet” as the block had only lost 15% of the manufacturing
moisture and the blocics were still moist after 7 days of curing under plastic.
107

r
5.2 UNCONFINED COMPRESSIVE STRENGTH
The objective of determining the unconfined compressive strength is to establish
the effect the various degrees of stabilisation have on the resistance of the
blocks to compressive loads. The stress at failure after 28 days is an important
indicator of a masonry unit’s structural usefulness.
The blocks were tested at 7 and 28 days after being produced. This was done f?
that an indication of the rate of strength build-up can be determined.
Scope
This method describes the procedure for determining the unconfined
compressive strength (wet and dry) of Hydraform stabilised soil blocks.
Apparatus
(i) A suitable location for curing the blocks. The area should consist of a
hard clean surface, which is not exposed to direct light or dramatic
temperature fluctuations.
(ii) A cube crushing machine with platens capable of accommodating the
longest side of the block (generally 200mm)
(ii) A measuring rule graduated in millimeters, at least 300 millimeters long.
(iii) Two metal plates measuring 15mm thick, 50mm wide and the same length
as the block.
Method
The specimens are standard Hydraform blocks manufactured using the designed
mixes and at the optimum moisture contents required to produce suitable blocks. .
108
I

Curing of specimens
The blocks are cured under plastic for the first fourteen days to allow the
hydration of the cement to take place in a moist environment (this is the minimum
period suggested in literature consulted). After the fourteen days the blocks were
removed from the plastic and allowed to “cure” for a further 14 days in the
laboratory. The temperature in the laboratory fluctuated between 21 °C and 26°C
and the relative humidity between 30% and 45%. These conditions were
monitored using a thermo-hygrograph.
Crushing the blocks
Five blocks from each design mix are removed from the curing area at seven and
twenty- eight days and brought to the crushing machine. The dimensions of the
shoulders of the blocks are measured and recorded in millimeters. The blocks
are then placed on the platens in the machine in the way that they are laid in a
wall and orientated so that they are in the center of the platens. A metal plate
measuring 50mm wide by 12 mm thick is then placed on each shoulder of the
block (see figure 5.1). The plate is placed on the shoulder of the block to simulate
the way the block will be loaded in a wall, as there is no contact between the
intrusion and protrusion of blocks laid in a wall. The crushing rate is set at 150
kN/minute. The force reading on the ( jbe crusher should be zeroed and the
block crushed in accordance with the operating instructions. The force at which
the block fails is recorded. The block is removed from the machine and the next
block crushed in the same manner.
109

Determination of the maximum applied stress
Calculations
Find the effective area resisting the compressive force as follows:
A = (L) x2(W )
where
A
L
W
the effective area in mm squared
the length of the block in mm
the width of the shoulder of the block in mm
Determine the stress at failure using the following formula :
F / Awhere:
a = the ultimate compressive stress in MPa
F = the ultimate compressive load in kN
A = the effective area in mm squared
These results are reported graphically against stabilizer content.
WET COMPRESSIVE STRENGTH
For the wet compressive strength, the blocks are cured for 14 days under plastic
and then cured for a further 13 days in the laboratory and then immersed in water
for a period of 24 hours before being subjected to the test.
no
!

PROTRUSION
METAL PLATE
. SHO ULDER
INTRUSION
TOP ELEVATION
FIGURE 5.1

5.2.1 Results of the unconfined compressive strength tests
For mix design parameters see section 4.2
Mix L
The 28 day wet compressive strength could not be tested for this design mix as the blocks disintegrated to various degrees when placed in water.
MIX 7 day UCS(MPa) 28 day wet UCS (MPa) 28 day dry UCS(MFa)
M 0.5 3.5LI 1.0 3.0L2 1.0 3.0L3 1.0 2.5
Table 5.1: Unconfined compressive strength for unstabilised and lime -stabilised blocks.
Mix K
MIX 7 day UCS (MPa) 28 day wet UCS(MPa) 28 day dry UCS(MPa)
K1 2.5 2.5 5.5K2 3.0 2.5 6.0K3 3.0 2.5 6.0K4 3.0 3.0 6.5
Table 5.2: Unconfined compressive strength (4% lime, variable cement)
Mix N
MIX 7 day UCS (MPa) 28 day wet UCS(MPa) 28 day dry UCS(MPa)
N1 2.5 2.5 6.0N2 2.5 2.5 6.0N3 3.0 2.5 6.5N4 3.0 3.0 6.5
Table 5.3: Unconfined compressive strength (7% lime, variable cement)
112
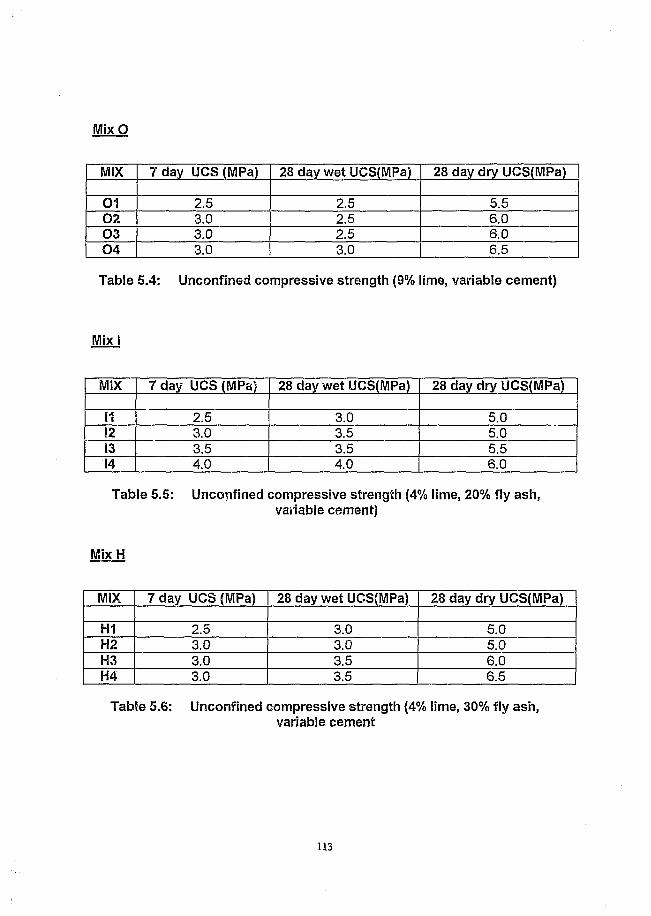
Mix O
MIX 7 day UCS (MPa) 28 day wet UCS(MPa) 28 day dry UCS(MPa)
01 2.5 2.5 5.502 3.0 2.5 6.003 3.0 2.5 6.004 3.0 3.0 6.5
Table 5.4: Unconfined compressive strength (9% lime, variable cement)
Mix I
MIX 7 day UCS (MPa) 28 day wet UCS(MPa) 28 day dry UCS(MPa)
11 2.5 3.0 5.0!2 3.0 3.5 5.013 3.5 3.5 5.514 4.0 4.0 6.0
Table 5.5: Unconfined compressive strength (4% lime, 20% fly ash,variable cement)
Mix H
MIX 7 day UCS (MPa) 28 day wet UCS(MPa) 28 day dry UCS(MPa)
HI 2.5 3.0 5.0H2 3.0 3.0 5.0H3 3.0 3.5 6.0H4 3.0 3.5 6.5
Table 5.6: Unconfined compressive strength (4% lime, 30% fly ash,variable cement
113
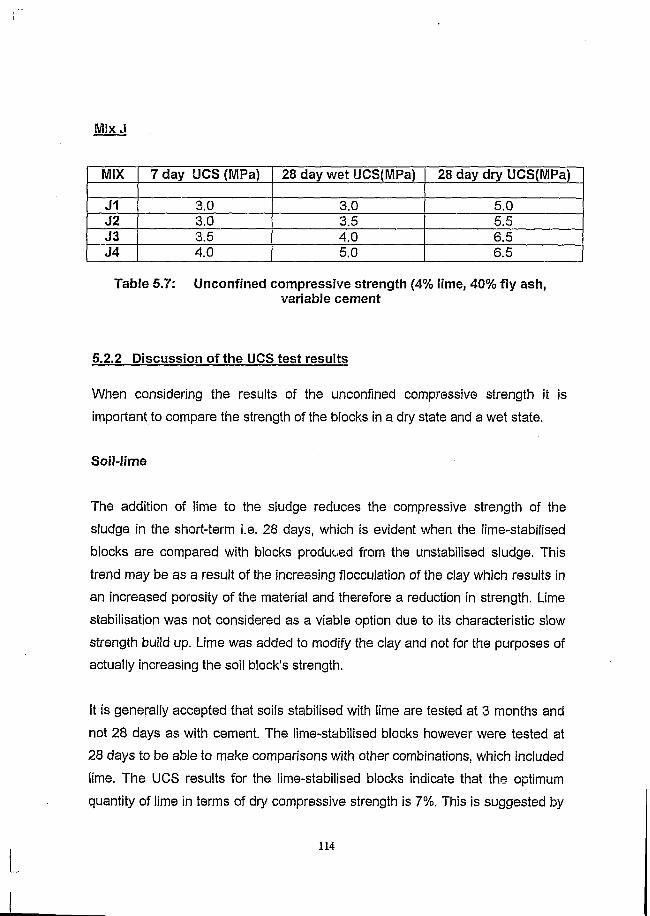
Mix J
MIX 7 day UCS (MPa) 28 day wet UCS(MPa) 28 day dry UCS(MPa)
J1 3.0 3.0 5.0J2 3.0 3.5 5.5J3 3.5 4.0 6.5J4 4.0 5.0 6.5
Table 5 .7 : Unconfined compressive strength (4% lime, 40% fly ash,variable cement
5.2.2 Discussion of the UCS test results
When considering the results of the unconfined compressive strength it is
important to compare the strength of the blocks in a dry state and a wet state.
Soil-lime
The addition of lime to the sludge reduces the compressive strength of the
sludge in the short-term i.e. 28 days, which is evident when the lime-stabilised
blocks are compared with blocks produced from the unstabilised sludge. This
trend may be as a result of the increasing flocculation of the clay which results in
an increased porosity of the material and therefore a reduction in strength. Lime
stabilisation was not considered as a viable option due to its characteristic slow
strength build up. Lime was added to modify the clay and not for the purposes of
actually increasing the soil block’s strength.
it is generally accepted that soils stabilised with lime are tested at 3 months and
not 28 days as with cement. The lime-stabilised blocks however were tested at
28 days to be able to make comparisons with other combinations, which included
lime. The UCS results for the lime-stabilised blocks indicate that the optimum
quantity of lime in terms of dry compressive strength is 7%. This is suggested by
114
the fact that the strength increases up to a point i.e. 7% lime addition after which,
increases in lime reduce the strength. The addition of 7% lime results in a
compressive strength of 3.0 MPa being achieved whereas with 9% lime, only 2.5
MPa is attained.
The wet compressive strength could not be determined as the test blocks
disintegrated when placed in the water. This indicates that sufficient cemetitious
bonds had not been created to increase the soils' wet strength. These bonds
however might increase if a longer curing period was allowed as the reactions
related to strength increase in lime stabilised soil only take place in the long term.
Soil-Iime-cement
A similar trend to that of the soil-lime combinations is apparent in the soil-lime-
cement combinations, with the exception of increased strength. The results show
that for a given amount of cement there exists an optimum amount of lime. An
increase in the amount of lime resulting in reduced strength. It is possible that
some of the added lime or the lime produced during hydration of the cement is
not used up in ion exchange and flocculation reactions and prevents the
cementing together of soil properties.
The results of these combinations show that the strength is highest with a 7%
addition of lime. An important indicator of the effect of the cement addition when
compared to the lime-stabilised blocks, is the fact that the lime stabilised blocks
disintegrate when placed in water and the blocks which included cement did not,
The wet strength of the lime-cement stabilised blocks is therefore evidence of an
improvement in mechanical performance when compared to lime stabilised
blocks. The increase in strength that the addition of cement to the soil-lime
combination brings about can clearly be seen when comparing mix L1 to K1, L2
to N1 and L3 to 01. The increase in dry strength is 50%, 49% and 52%
115

r
respectively. The increase in cement addition results in an increase in the wet
and dry compressive strength.
Soil-lime-cement-fly ash
The addition of fly ash to the soil-lime-cement combinations enabled
comparisons with combinations of soil-lime-cement to be made to determine
what affect the addition of fly ash has on the strength. The results show that an
increase in the percentage fly ash leads to a marginal increase in the
compressive strength. The increase in strength when comparing mixes with the
same percentage of cement is most likely as a result of a pozzolanic reaction
between the lime produced during hydration of the cement, and the fly ash.
If a comparison is made between the K series, which is identical to the I, H and J
series except for the fly ash component, the dry compressive strength of the K
series is higher. This is probably as a result of a higher sludge/clay content,
where the clay contributes to the strength in the dry state. However, if the wet
compressive strengths are compared, the effect of the sludge/clay is evident, and
the strength is reduced considerably. This is because clay has very low strength
in a wet state. The reduction in strength of the blocks when comparing dry and
wet strength gives an indication of the role day plays in the dry compressive
strength of the various combinations investigated. The reduction in strength for
the K series from a dry state to a wet state is 57% on average, whereas the
reduction for the I, H and J series is 40%, 37% and 34% respectively.
116

UNCC&FINED OCXVPRESSIVE STRENGTH
3.2.,
OL 29
2 28
27
263.5 4.5 5.5 6.5
%lime7.5 8.5 9,5
Figure 5.2: UCS results for lime-stabilised blocks
DRY UNCONFINED COMPRESSIVE STRENGTH
o% o p c
6%OPC
7% CPC
8%OPC
9%OPC
3.5 4.5 6.5
% lime
5.5 8.57.5 9.5
Figure 5.3: UCS results lime-cement stabilised blocks.
117

WET UNCONFINED COMPRESSIVE STRENGTH
4.5
2.5
5.5 6.5 7.5
% cement
8.5 9.5
Figure 5.4: Wet UCS of the lime-cement-fly ash stabilised blocks.
118

5.3 THE DRYING SHRINKAGE TEST
Objective
The objective of this test is to determine what effect the various stabilizers have
on the drying shrinkage of the block over a period of twenty-eight days.
Scope
This method covers the determination of the average drying shrinkage of the
block at a constant temperature as it dries or cures.
Apparatus
(I) A suitable location for curing blocks.
(ii) Two targets per block, consisting of 2mm thick aluminum rectangular
plates (15mm x 35mm).
(iii) An epoxy resin based adhesive capable of adhering aluminum to block
surfaces, mixing cups and mixing rods.
(iv) A digital vernier caliper.
Method
Preparation of the specimens
The specimens are standard Hydraform blocks manufactured using the designed
mixes and at the moisture contents required to produce suitable blocks.
Curing of specimens
The blocks are cured under plastic for the first fourteen days to allow the
hydration of the cement to take place in a moist environment (this is the minimum
period suggested in literature consulted). After the fourteen days the blocks were
removed from the plastic and allowed to “cure” for a further 14 days in the
laboratory. The temperature in the laboratory fluctuated between 21 °C and 26°C
and the relative humidity between 30% and 45%. These conditions were
monitored using a thermo-hygrograph which records temperature and relative
humidity.
Adhering the targets and using the Vernier caliper
Two blocks of each design mix are taken one hour after manufacture to be
prepared for the test. The block is placed on a hard clean surface in the curing
location. A fluid mix of the epoxy-based adhesive is applied in two areas slightly
larger ''han the targets dimensions, centered on the long axis of the block on
either end of the block. While these priming applications begin to set another
more viscous f yoxy mix is prepared. Just before the first applications harden,
the plastic slide is used to scrape the epoxy that has not been absorbed by the
block, from the block surface. The epoxy adhesive is then applied to the targets
which are attached to the block. Once the epoxy-based adhesive has hardened
preparations can be made for taking the initial readings. The vernier caliper is
then used to take the zero reading across the targets attached at the ends of the
block. Readings are taken at 24 hours intervals for the first seven curing days
and, then at seven day intervals for the remaining 21 days.
Determination of linear shrinkage
The linear shrinkage for a certain period of time is determined by subtracting the
reading on the vernier caliper from the zero reading and then dividing this value
by the zero reading taken at the beginning of the test period.
no
[

Calculations
The shrinkage for each block at each time interval is calculated as follows:
S = [ ( R o - R t ) /R o ] X 1 0 0
Where:
S = % shrinkage
Ro = zero reading (initial test reading)
T = test reading at time interval T
Calculate the average shrinkage for each type of block using the formula:
ES
S ave = n
Save = average shrinkage for each type of block at time interval
Z S = the sum of shrinkage readings for that type of block
n = the number of blocks of that type tested
The results are recorded graphically against time.
121
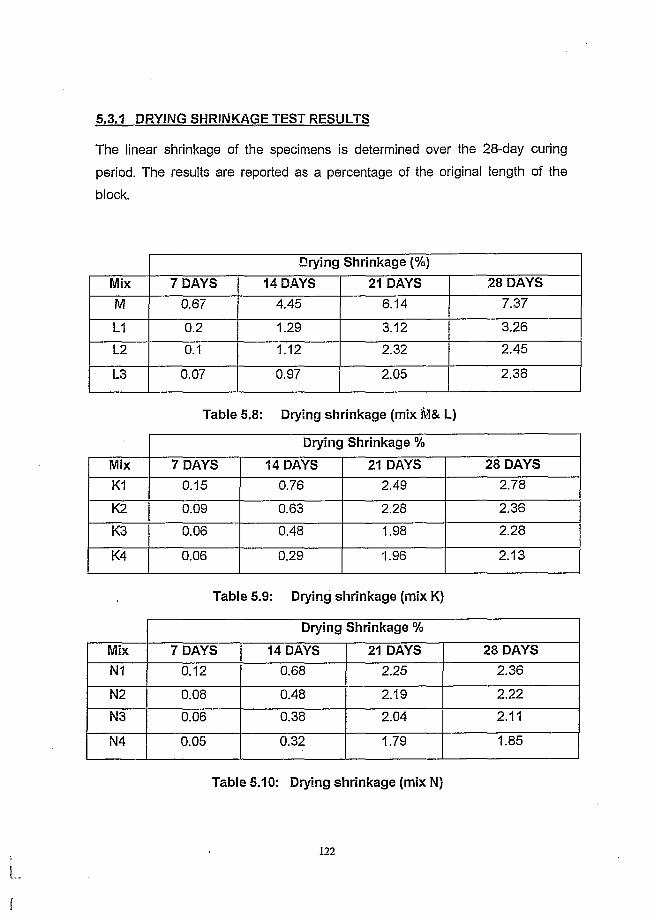
5.3.1 DRYING SHRINKAGE TEST RESULTS
The linear shrinkage of the specimens is determined over the 28-day curing
period. The results are reported as a percentage of the original length of the
block.
Drying Shrinkage (%)
Mix 7 DAYS 14 DAYS 21 DAYS 28 DAYS
M 0.67 4.45 6.14 7.37
LI 0.2 1.29 3.12 3.26
L2 0.1 1.12 2.32 2.45
L3 0.07 0.97 2.05 2.38
Table 5.8: Drying shrinkage (mix L)
Drying Shrinkage %
Mix 7 DAYS 14 DAYS 21 DAYS 28 DAYSK1 0.15 0.76 2.49 2.78
K2 0.09 0.63 2.28 2.36
K3 0.06 0.48 1.98 2.28
K4 0.06 0.29 1.96 2.13
Table 5.9: Drying shrinkage (mix K)
Drying Shrinkage %
Mix 7 DAYS 14 DAYS 21 DAYS 28 DAYS
N1 0.12 0.68 2.25 2.36
N2 0.08 0.48 2.19 2.22
N3 0.06 0.38 2.04 2.11
N4 0.05 0.32 1.79 1.85
Table 5.10: Drying shrinkage (mix N)
L
f
122

Drying Shrinkage %
Mix 7 DAYS 14 DAYS 21 DAYS 28 DAYS01 0.1 0.53 2.19 2.28
02 0.06 0.39 2.1 2.16
03 0.04 0.26 1.65 1.79
04 0.03 0.2 1.63 1.70
Table 5.11: Drying shrinkage mix O
Drying Shrinkage %
Mix 7 DAYS 14 DAYS 21 DAYS 28 DAYS
11 0.12 0.42 1.03 1.09
12 0.1 0.4 0.97 1.02
13 0.08 0.3 0.83 0.88
14 0.07 0.25 0.67 0.71
Table 5.12: Drying shrinkage mix I
• Drying Shrinkage %
Mix 7 DAYS 14 DAYS 21 DAYS 28 DAYSHI 0.08 0.32 0.39 0.43
H2 0.05 0.21 0.38 0.42
H3 0.05 0.17 0.36 0.4
H4 0.04 0.12 0.31 0.38
Table 5.13: Drying shrinkage mix H
123

Drying Shrinkage %
Mix 7 DAYS 14 DAYS 21 DAYS 28 DAYSJ1 0.06 0.1 0.23 0.29
J2 0.04 0.09 0.2 0.26
J3 0.04 0.06 0.2 0.25
J4 0.03 0.07 0.19 0.23
Table 5.14: Drying shrinkage mix J
5.3.2 Discussion of the drying shrinkage test results
Soil-lime
The major source of shrinkage in soils (and concrete [56]) is drying shrinkage
where water from the voids evaporates into the atmosphere. The reduction in
shrinkage with the addition of increasing amounts of lime is graphically
represented in figure 4.5. A substantial change is achieved with a 55% reduction
in shrinkage with the addition of 4% lime. 7% Lime yields a reduction of 67% and
9% lime reduces the shrinkage of the sludge by 68%. The reduction in shrinkage
is attributed to the ion exchange reactions, which take place between the clay
and the calcium ions in the lime, where the clay’s affinity for water is reduced.
Soil-lime-cement
The addition of cement to the soil-lime combination results in a further reduction
in shrinkage. This is as a result of the formation of a cementitious matrix in the
soil which resists volume changes. [64]
124

DRYING SHRINKAGE
87
65
43
210
14 2 80 7 21
— #—-4% lime
—ss—-7% lime9% lime
—X -
O1 lime
Days
Figure 5.5: Shrinkage reduction achieved by lime stabilisation
DRYING SHRINKAGE
3.5 n
S> 2.5- n
0.5
days
Figure 5.6: Reduction in shrinkage achieved by lime-cement stabilisation

The addition of 6% cement further reduces the amount of shrinkage achieved by
the addition of 4% lime from 3.26% to 2.78%. The reduction in shrinkage
achieved by an addition of 6% OPC to the 4% lime stabilised sludge is 15%,
further additions of cement yield only small changes to the amount of reduction.
This is probably as a result of more bonds forming increasing the strength of the
cementitious matrix.
The reduction in shrinkage achieved with the addition of cement to the 7 and 9%
lime-stabilised combinations are shown in figure 5.7 & 5.8.
[
126

DRYING SHRINKAGE
ro 1.5
7% lime
7%lime,6%OPC
7%lime,7%OPC
7%lime,8%CPC
7%lime,9%OPC
Figure 5.7: Drying shrinkage of lime and lime-cement stabilised blocks
( 7% lime, variable cement)
DRYING SHRINKAGE
2.5
2
1.5
10.5
0140 7 21 28
9%lime
_ *_ 9 % lim e ,6 % 0 P C
9%lime,7%OPC
9%lime,8%OPC
9%llme,9%OPC
Figure 5.8: Drying shrinkage of lime and lime-cement stabilised blocks
(9% lime, variable cement)
1 2 7

Soil-lime-cement-fly ash
Figure 5.9 shows the affect that fly ash has on the reduction of shrinkage when
compared to the similar combinations without fly ash. The addition of fly ash to
the soil-lime-cement combinations further reduces the shrinkage. This affect can
be attributed to two factors. The first is by adding fly ash, the total amount of the
clay fraction in the mix is reduced, thereby reducing the combinations potential to
shrink. The second is that the number of cementitious bonds may also be
increased by the pozzolanic reaction between lime and the fly ash.
DRYING SHRINKAGE
4%lime,6%OFC, 20%FA4%linre,6%OPC, 30%FA4%lime,6%OFC, 40%FA4%lime,6%OFC, 0%FA
0 7 14 21 28
da>5
Figure 5.9: Drying shrinkage of lime-cement and lime-cement-fly ash
stabilised blocks ( constant lime and cement contents with variable fly ash)
When comparing the K1 combination to the 11 combination the shrinkage
reduces from 2.78% to 1.09% with the addition of 20% fly ash. If the fly ash
content in the combination is increased to 30%(H1) the shrinkage is reduced
from 1.09 percent to 0.43 percent, a 40% fly ash content (J1), reduces the
shrinkage from 0.43 percent to 0.29 percent.
128
If the fly ash content in a combination is kept constant and the cement content
increased, the shrinkage is also reduced. The increase in cement however has a
smaller influence on the reduction in shrinkage than an increase in the fly ash
content.
Although drying shrinkage is not generally used to measure the success of
stabilisation. The appearance of shrinkage cracks associated with the loss of
moisture will often be an important indicator of whether a soil has been stabilised
sufficiently. Cracks often lead to a reduction in compressive strength and
durability of stabilised soil blocks.
The aim therefor of this test was to investigate to what extent the addition of the
various stabilisers affected the drying shrinkage. A general observation made by
the author was that above approximately 2-3% shrinkage the shrinkage cracks
seem to be more abundant. Based on this observation the author believes that
for this particular material ideally drying shrinkage should be kept below 3%.
129

5.4 THE WATER ABSORPTION TEST
Scope
This method describes the procedure for determining the rate at which a
stabilised soil block absorbs water under a constant head.
Apparatus
(i) A suitable location for curing the blocks. The area should consist of a
hard clean surface, which is not exposed to direct light or dramatic
temperature fluctuations.
(ii) A suitable bath of water with sufficient capacity so that all specimens can
be fully immersed simultaneously.
(iii) A balance to weigh up to 20kg and accurate to 0,5g„
(iv) An absorbent cloth.
Method
Preparation of specimens
The specimens are standard Hydraform blocks manufactured using the designed
mixes and at the moisture contents required to produce suitable blocks.
Curing of specimens
Cure the specimens for fourteen days under plastic in a suitable location. The
blocks are then removed from the plastic and allowed to cure for a further
fourteen days in the laboratory.
Method
After the 28-day curing period the mass of the block is determined and recorded
(initial mass). The block is then immersed in water for 24 hours. After the 24 hour
period the block is removed from the water, the surface dried with an absorbent
cloth. The mass of the 'wet' block is then determined and recorded.
I

Determining the absorption
After 24 hours the amount of water absorbed can be expressed as a percentage
of the initial mass of the block.
Calculations
The amount of water absorbed I is calculated as follows:
" M -N P
W = M X 100X. J
Where:
W
N
M
the mass of water absorbed during the time interval,
expressed as a percentage of the initial mass’ of the
block.
the initial mass of the block in grams
the mass of the block after 24 hours immersion in
grams
Notes
1. Blocks with similar initial dimensions should be chosen for this test.
2. Blocks, which have obvious surface cracks, should be avoided.
131

5.4/i Results of the water absorption test
Results for the L and M combinations could not be obtained as the blocks
disintegrated when placed in water.
Mjx ABSORPTIVITY (%)
K1 9.9
K2 9.7
K3 9.5
K4 9.2
Table 5.15: Water absorption o f mix K
Mix ABSORPTIVITY 1%)
N1 8.8
N2 8.6
N3 8.5
N4 8.2
Table 5.16: Water absorption o f mix N
Mix ABSORPTIVITY (%)
01 8.0
02 7.8
03 7.5
04 7.4
Table 5.17: Water absorption o f m ix O
132
I
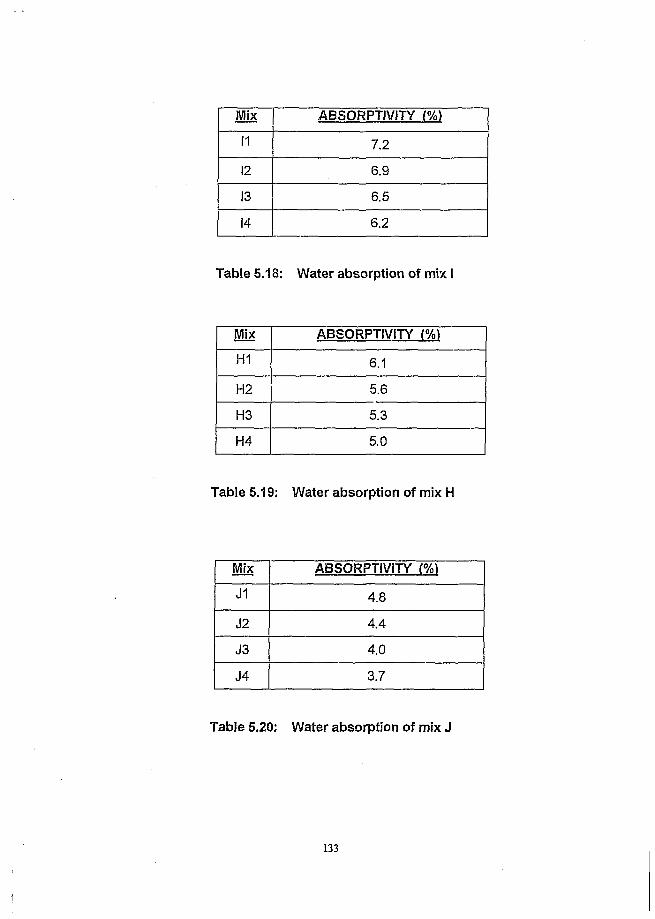
Mix ABSORPTIVITY 1%)
11 7.2
12 6.9
13 6.5
14 6.2
Table 5.18: Water absorption of mix I
Mix ABSORPTIVITY f%)
HI 6.1
H2 5.6
H3 5.3
H4 5.0
Table 5.19: Water absorption of mix H
Mix ABSORPTIVITY f%)
J1 4.8
J2 4.4
J3 4.0
J4 3.7
Table 5.20: Water absorption of mix J
133

5.4.2 Discussion of the water absorption test results
The lime-stabilised blocks could not be evaluated as they disintegrated when
placed in water. Comparisons however have been made between the blocks
which were stabilised with lime-cement combinations and those stabilised with
lime-cement-fly ash combinations. The results of the test are indicated
graphically in figure 5.10 - 5.12.
W A TE R ABSORPTION
I% lime
. 6%OPC
. 7%OPC
8%OPC
. 9% OPC
Figure 5.10: Water absorption results for lime-cement stabilisation.
The increase in the amount of cement in a combination reduces the amount of
water absorbed by the test blocks, this may be as a result of the hydration
products filling up the voids in the soil thereby reducing its porosity. The increase
in the cement content does not have as great affect on the water absorption
properties of the combinations as an increase in the lime content. The affect of
the lime is a reduction of the clays’ affinity for water, the reason for the increase
in lime being more significant than an equal increase in cement is that the lime is
the agent responsible for the reduction in water affinity and the amount of lime
produced during hydration of the cement is equal to approximately 25% [10] of
134

the amount of cement added and so there is less lime available to reduce the
clays affinity for water than if lime is added. For example, 6% cement added to
the soil will have less of an effect on the water absorption than if 6% lime is
added.
WATER ABSORPTION
10.59 .5 -- 8.5 -_7 .5 --6 .5 -5 .5 --4 .5 -3 .5 -
4%lilTB
4%litTB,20%FA
4%lime,30%FA
4%lirTB,40%FA
T 3
% cement
Figure 5.11: Water absorption results for lime-cement-fly ash combination
The fly ash addition has the greatest influence on the absorption properties when
the results of lime-cement combinations and lime-cement-fly ash combinations
are compared. The water absorbing properties of the blocks were reduced by
inclusion of fly ash into the soii-lime-cement combinations. The lime-cement
combinations flocculate the clay giving the soil a more open structure [14]
thereby Increasing the soils void content and therefore, porosity. The addition of
fly ash is postulated to fill these voids and therefore reduce the water absorbing
properties. It may therefore act as a filler between flocculated paiticles. By
increasing the fly ash content in a soil-iime-cement combination where the lime
and cement content is kept constant, the soil component and therefore the clay
fraction is also reduced, thereby reducing the potential to absorb water.
135

The affects of the various stabilisation combinations are illustrated in figure 12.
’iA&TER ABSORPTION
4%llrre
7%l!rre9%lirre4%lirrB,20%FA
4%iime,30%FA
4%lime,40%FA
5.5 6.5 7.5 8.5 9.5
% cement
Figure 5.12: Cumulative affect of various stabilisation combinations on
water absorptivity.
co
1
9.58.57.56.55.54.53.5
136

5.5 THE ACCELERATED EROSION TEST
Scope
This method covers the procedure for determining the rate of erosion of a soil or
stabilised soil block exposed to a water jet sprayed onto a fixed target area.
Objective
This test is essentially a test of durability of the stabilised soil blocks when
exposed to the action of driven water. It is conducted to give an idea of how well
the material would withstand driven rain when no protective coating has been
applied to the block’s surface.
Apparatus
(i) A suitable location for curing the blocks. The area should consist of a
hard clean surface, which is not exposed to direct light or dramatic
temperature fluctuations.
(ii) An accelerated erosion device consisting of a pump capable of delivering
a constant pressure of 70kPa of water through a perforated nozzle 50mm
in diameter set at a distance of 470mm from the test specimen.
(iii) A flexible waterproof material which is capable of adhering to the block to
mask the 100mm diameter portion the of block.
(iv) A measuring device which consists of a 300mm long straight edge and a
pin, graduated in millimeters and 100mm long, which moves at right
angles to the straight edge.
(v) A 100mm diameter stencil and marking pen.
(vi) A time keeping device.
137

Method
For the purpose of this test an apparatus and procedure developed by the
National Building Technology Centre in Australia was used. The apparatus
directs a spray of water onto a shielded target area. The test is run for one hour
or until the block is excessively eroded, and interrupted every fifteen minutes to
examine the condition of the block. Test results are recorded on the basis of the
average depth of penetration of the water jet after each fifteen-minute interval.
Preparation of specimens
The specimens are standard Hydraform blocks manufactured using the designed
mixes and at the moisture contents required to produce suitable blocks.
Curing of specimens
Cure the specimens for 14 days under plastic sheeting. The blocks are then
removed from the plastic and placed so that air is allowed to circulate freely
around the blocks allowing them to dry for a further fourteen days.
Eroding the specimens
The eroding device should be calibrated by starting the pump and directing the
spray into the target area. The pressure should be set at 70 kPa.
A 100mm-diameter circle is marked centrally on the face of the block to be
tested. The flexible waterproof material should be adhered around the outside of
the perimeter of the circle, to the specimen, to form a continuous seal. The
specimen is then mounted in front of the test rig. The pump is then started. After
15 minutes the test should be stopped, the block removed and examined for
signs of ercrion. A description of deterioration to the surface should be noted
and the average depth of erosion measured using the measuring device. The
specimen is then replaced and the procedure repeated three more times. If the
specimen becomes satu ated before one hour, the test should be stopped.
138
i

Determination of the rate of erosion
After being exposed to the water jet for a total of one hour the specimen is
removed and the final depth of erosion measured. From the data collected a rate
of erosion in millimeters per minute can be determined anti a descriptive table set
up.
Calculations
The rate of erosion can be calculated using the following formula:
D
R = T
Where:
R = the rate of erosion in mm/minute
D = the depth of erosion at time T in minutes
T = the time since commencement of the test in minutes.
139

PRESSURE GAUGE
70 kPaWATERPROOF GASKET
50mm <b SPRAY NOZZLE
100mm
PUMP
470mm
TEST SPECIMEN
Figure 5.13 : Diagram of the Accelerated Erosion test rig
f
140

5.5.1 Results of the accelerated water erosion test
TIME ELAPSED
15 min 30 min 45 min 60 min
DEGREE
OF
STABILISATION4%
20mm deep
pockets of
erosion
Stopped test
block
eroded
totally
- -
7%
14mm deep
pockets of
erosion
22mm deep
pockets
28mm deep
pockets
30m m deep
pockets
9%
11mm deep
pockets of
erosion
19mm
pockets
24mm
pockets
28m m
pockets
Table 5.21: Results of the accelerated erosion test for lime-stabilised
blocks
TIME ELAPSED
Mix 15 min 30 min 45 min 60 min
DEGREE
OF
STABILISATION
K19mm deep
pockets
12mm deep
pockets
13mm deep
pockets
15mm deep
pockets
K210mm deep
pockets
12mm deep
pockets
13mm deep
pockets
No further
erosion
K3
7mm deep
pockets
9mm deep
pockets
10mm deep
pockets
No further
erosion
K49mm deep
pockets
No further
erosion
No further
erosion
No further
erosion
Table 5.22: Results of the accelerated erosion test for lime-cement
stabilised blocks (4% lime, variable cement)
141
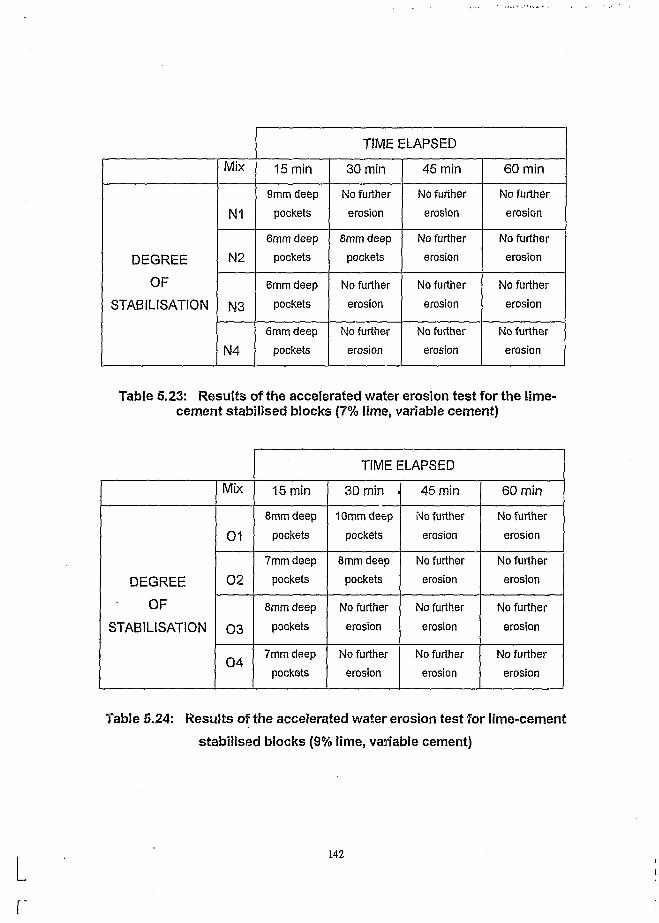
TIME ELAPSED
Mix 15 min 30 min 45 min 60 min
DEGREE
OF
STABILISATION
N19mm deep
pockets
No further
erosion
No further
erosion
No further
erosion
N26mm deep
pockets
8mm deep
pockets
No further
erosion
No further
erosion
N3
6mm deep
pockets
No further
erosion
No further
erosion
No further
erosion
N46mm deep
pockets
No further
erosion
No further
erosion
No further
erosion
Table 5.23: Results of the accelerated water erosion test for the lime- cement stabilised blocks (7% lime, variable cement)
TIME ELAPSED
Mix 15 min 30 min 45 min 60 min
DEGREE
OF
STABILISATION
01
8mm deep
pockets
10mm deep
pockets
No further
erosion
No further
erosion
027mm deep
pockets
8mm deep
pockets
No further
erosion
No further
erosion
03
8mm deep
pockets
No further
erosion
No further
erosion
No further
erosion
047mm deep
pockets
No further
erosion
No further
erosion
No further
erosion
Table 5.24: Results of the accelerated water erosion test for lime-cement
stabilised blocks (9% lime, variable cement)
142
r

r
TIME ELAPSED
Mix 15 min 30 min 45 min 60 min
DEGREE
OF
STABILISATION
114mm deep
pockets
No further
erosion
No further
erosion
No further
erosion
12
3mm deep
pockets
No further
erosion
No further
erosion
No further
erosion
13
3mm deep
pockets
No further
erosion
No further
erosion
No further
erosion
143mm deep
pockets
No further
erosion
No further
erosion
No further
erosion
Table 5.25: Results of the accelerated water erosion test for the lime- cement-fly ash stabilised blocks (4% lime, 20% fly ash, variable cement)
TIME ELAPSED
Mix 15 min 30 min 45 min 60 min
DEGREE
OF
STABILISATION
HI
Very slight roughening of the surface which could not
be accurately measured
H2Very slight roughening of the surface which could not
be accurately measured
H3
Very slight roughening of the surface which could not
be accurately measured
H4Very slight roughening of the surface which could not
be accurately measured
Table 5.26: Results of the accelerated water erosion test for the lime- cement-fly ash stabilised blocks (4% lime, 30% fly ash, variable cement)
143

5,5.2 Discussion of accelerated water erosion test results
The accelerated water erosion test is mainly a qualitative test, although semi-
quantitative results can also be extracted. The results of the test will indicate the
depth of erosion occurring over the test period and this can be used to compare
the results of the various combinations of stabilizers. A recommendation has also
been made that the stabilisation should reduce the depth of the erosion to less
than 15mm. [39]
Blocks from each of the mixes were subjected to the erosion test. The only
blocks which showed significant erosion, were the blocks which were stabilised
with only lime. The degree to which the erosion took place also decreased with
an increase in lime content.
The durability of stabilised soil blocks is dependent to a certain degree on the
porosity of the block and the bonds between soil particles. The soil
agglomerates, which are formed as a result of flocculation by the clay, increase
the porosity. When the water which is sprayed against the block, the water forces
its way through the voids in the compressed block and breaks the bonds
between the soil particles resulting in erosion. The cementitious bonds formed by
the reaction between the clay and the lime are not strong enough to 'hold' the soil
particles together.
The addition of cement to the lime-soil mix increased the durability of the test
specimen markedly, with only very small pockets of erosion being visible. An
increase of cement also reduced the number and depth of the eroded pockets.
The blocks which included fly ash, did however perform better than the test
specimens without. With the degree of erosion decreasing with an increase in fly
ash, the blocks which included forty percent fly ash showed no erosion
whatsoever. The inclusion of fly ash in a mix also ensured that the surface, which
was exposed to the test, was smoother than the surface of blocks which did not
144

include fly ash. Therefore, the cement has the largest influence In the increase in
durability of the block due obviously to its cementing action. The fly ash seems to
reduce the porosity of the blocks and therefore increases the blocks’ resistance
to erosion. The addition of lime to the clay soil results in flocculation of the clay
particles, which reduces the density of the block and increases the porosity. This
may lead to increased erosion when compared to a mix which includes fly ash,
as the fly ash will then act as filler.
ii
145

5.6 EXPANSION DUE TO ABSORPTION OF WATER
Scope
This method describes the procedure used to determine the amount of
expansion, which occurs if a stabilised soil block is soaked in water.
Apparatus
(i) A suitable location ! .r wring the blocks. The area should consist of a
hard clean surface, which is not exposed to direct light or dramatic
temperature fluctuations.
(ii) A suitable bath of water with sufficient capacity so that all specimens can
be fully immersed simultaneously.
(iii) A balance to weigh up to 20kg and accurate to 0,5g.
(iv) Two targets per block, consisting of 2mm thick aluminium rectangular
plates (15mm x 35mm).
(v) An epoxy resin based adhesive capable of adhering aluminium to block
surfaces, mixing cups and mixing rods.
(vi) A digital vernier caliper.
Method
Preparation of specimens
The specimens are standard Hydraform blocks manufactured using the designed
mixes and at the optimum moisture contents required to produce suitable blocks.
Targets are attached to the block using the same procedure described in the
drying shrinkage test.
Curing of specimens
Cure the specimens for fourteen days under plastic in a suitable location. The
blocks are then removed from the plastic and allowed to cure for a further
fourteen days in the laboratory.
146

The aluminium targets are attached as for the linear shrinkage test. A zero
reading is taken using the vernier caliper. The blocks are immersed in the tank of
water for 24 hours. After the 24 hour period the blocks are removed and the
reading across the aluminum targets taken using the vernier caliper. The blocks
are then left to air dry in the laboratory for a period of seven days. The reading
across the targets is then taken to determine the shrinkage.
Determining the expansion
After the block has been soaked for 24 hours the reading across the targets is
taken and the amount of expansion determined.
Calculations
The amount of expansion is calculated as follows:
Li - LojLo J X100
Where:
Lo
Li
The percentage expansion expressed as a
percentage of the zero reading.
zero reading across the targets in mm.
the reading taken after the block has been immersed
in water for 24 hours measured in mm.
147

5.6.1 Results of the test for expansion due to the absorption of water.
The expansion of blocks produced with mix L and M could not be determined as
the blocks disintegrated when placed in water.
Mix % Expansion
K1 0.81
K2 0.76
K3 0.74
K4 0.72
Table 5.27: Expansion of lime-cement stabilised blocks (4% lime, variablecement)
Mix % Expansion
N1 0.70
N2 0.68
N3 0.64
N4 0.61
Table 5.28: Expansion of lime-cement stabilised blocks (7% lime, variablecement)
Mix % Expansion
01 0.58
02 0.56
03 0.53
04 0.50
Table 5.29: Expansion of lime-cement stabilised blocks (9% lime, variablecement)
148

Mix % Expansion
11 0.43
12 0.37
IS 0.34
14 0.33
Table 5.30: Expansion of lime-cement stabilised blocks (4% lime, 20% flyash, variable cement)
Mix % Expansion
HI 0.30
H2 0.26
H3 0.22
H4 0.20
Table 5.31: Expansion of lime-cement stabilised biccks (4% lime, 30% flyash, variable cement)
Mix % Expansion
J1 0.17
J2 0.14
J3 0.10
J4 0.08
Table 5.32: Expansion o f lime-cement stabilised blocks (4% lime, 40% flyash, and variable cement)
149
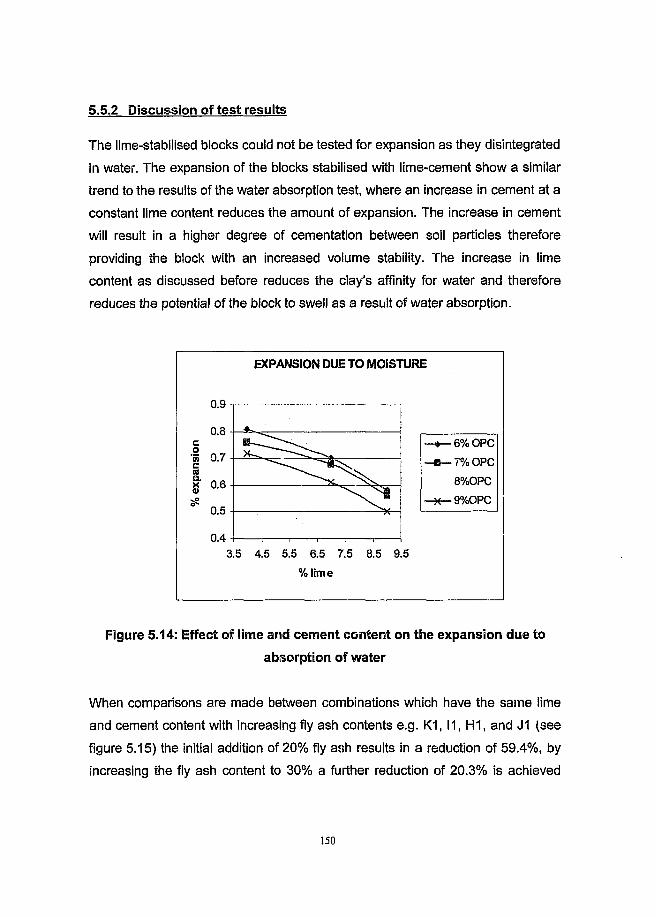
5.5.2 Discussion of test results
The lime-stabilised blocks could not be tested for expansion as they disintegrated
in water. The expansion of the blocks stabilised with lime-cement show a similar
trend to the results of the water absorption test, where an increase in cement at a
constant lime content reduces the amount of expansion. The increase in cement
will result in a higher degree of cementation between soil particles therefore
providing the block with an increased volume stability. The increase in lime
content as discussed before reduces the clay's affinity for water and therefore
reduces the potential of the block to swell as a result of water absorption.
EXPANSION DUE TO MOISTURE
0.9
0.8i« 0.7
! 06
0.5
0.43.5 4.5 5.5 6.5 7.5 8.5 9.5
■ 6% OPC
•7% OPC
8%OPC
■ 9%OPC
% lim e
Figure 5.14: Effect of lime and cement content on the expansion due to
absorption of water
When comparisons are made between combinations which have the same lime
and cement content with increasing fly ash contents e.g. K1, 11, H I, and J1 (see
figure 5.15) the initial addition of 20% fly ash results in a reduction of 59.4%, by
increasing the fly ash content to 30% a further reduction of 20.3% is achieved
150

and when the fly ash content is raised to 40% another 20.3% reduction in the
expansion is achieved. A similar trend is observed at higher cement contents.
The fly ash as is the case in the water absorption test, reduces the clay fraction
in the soil-lime-e&ment combination, thereby reducing the expansion. The
cementitious bonds are also increased as the pozzolanic reaction occurs
between the fly ash and lime produced during the hydration of the cement.
The results of the expansion test correlate with the results of the water
absorption test, where the mix with the highest water absorption result also has
the highest amount of expansion. As the amount of water absorbed decreases,
the expansion also decreases.
EXPANSION DUE TO MOISTURE
1
0.90.80.70.60.50.40.30.20.1
0
-a
5 6 .5 7.5 8.5 9
-#— 4%lirne, 0%FA
-» — 4%!ime, 20%FA 4%lime, 30%FA
-X— 4%lime, 40%FA
% cement
Figure 5.15: Effect of fly ash content on expansion due to absorption of
moisture
151

The expansion which took place in the specimens tested is low, for example over
the average length of the blocks i.e. 130mm the expansion ranged between
1.05mm and 0.1mm. The author believes that all the results of the expansion
test are acceptable, especially as the chance of a block becoming totally
saturated in a wall as in the test is unlikely and therefore the blocks will perform
even better in field conditions.
152

5.7 M1NERAL0GICAL ANALYSIS OF CHANGES DUE TO STABILISATION
The physical tests conducted on the blocks produced from the stabilised and
unstabilised soil provides evidence of the improved performance of the
Panfontein soil as a result of the stabilisation process.
A study using x-ray diffraction analysis was undertaken to determine the
mineralogical changes which occur in the Panfontein soil as a result of the
addition of the stabilising agents used in the production of the compressed earth
blocks. The objective of the study was to provide evidence of the theoretical
reactions, which take place in the compressed earth blocks and result in the
improved performance of the sludge, as indicated by the physical tests described
earlier in this chapter.
This improved performance is attributed to two reactions. The first is the
modification of the clay mineral in the soil by the addition of lime and secondly,
the formation of a cementitious matrix in the soil as a result of the addition of
cement-fly ash. A x-ray diffraction analysis was undertaken to provide evidence
of the two reactions having taken place in the soil.
The reduction in the height of a peak in an XRD diffraction pattern, associated
with a clay mineral is considered to be evidence of the modification of the clay
mineral by the addition of lime. [18] The changes in the physical properties and
the mineralogy of the soil with the addition of lime was investigated and reported
in chapter 3. The results are included here to enable comparisons with samples
which included lime, cement and fly ash.
To provide evidence of the formation of a cementitious matrix it was necessary to
identify the presence of hydration products of cement in the stabilised soil. The
cementitious products formed are identified by peaks formed at 6.32°20 - 7.37°20
(12 - 14A) and 29.79=28 - 29.O8°20 (3.0 - 3.07A), these are the peaks
153
I

associated with calcium silicate hydrate. The peaks associated with hydrated
calcium aluminates can be found at 10.78°26 (8.2A), 36.68°26 (2.45A) and
39.7°26 (2.2' A). [10] These are the peaks that would be associated with the
improved performance of the soil as a result of the formation of a cementitious
matrix.
Therefore the presence of the peaks associated with the hydration products of
cement and a reduction in the peaks associated with the clay minerals would be
considered to be evidence of the reactions assumed to be responsible for the
improved performance of the soil when stabilised.
Mix design for X-ray diffraction analysis.
To determine the mineralogical changes, samples prepared using the design
parameters shown in table 5.33 were used. Samples of the soil stabilised with
lime, lime-fly ash, lime-fly ash-cement and lime cement combinations were
investigated. Details of the stabiliser combinations are given in table 5.33.
The aim of the design mixes used in the XRD study was to investigate how the
addition of the different stabilisers would affect the mineralogy of the sludge
especially the clay fraction. It was hoped that by showing a reduction of the
peaks, which are associated with/indicative of the clay minerals, it would be
possible to explain the changes in physical jroperties of the sludge. This was
done by first looking at the effect the additio; of lime on its own would have on
the sludge in dosages of 4% and 7% by dry mass of the sludge, this was
discussed in chapter 3. The next investigation was to determine what effect fly
ash would have on a sludge-lime and fly ash mix. This was investigated using the
parameters detailed in the C1 and C2 series in table 5.33. The next step was to
determine the changes, which take place as a result of the addition of ordinary
Portland ce; ^nt. The effects of the addition of OPC to the sludge-lime-fly ash
mix were invet. w jted using the parameters detailed in the D1 to D4 series in
154

table 5.32. A study was also undertaken to try to identify the changes, which take
place with only the addition of lime and cement to the sludge. The lime content in
the sludge-lime-cement mix was varied. The parameters used are detailed by
samples K1, K4, N1, N4, 01 and 04.
In order for a change in the clay mineral to be detected, it was necessary to
obtain an XRD spectrum of an unstabilised sample of the sludge. This would
indicate the type or types of clay mineral/s present in the sludge. This spectrum
could then be compared to the spectra of samples where lime, cement and fly
ash had been added to the sludge to analyse the affect of each stabilising agent
on the sludge.
Preparation o f samples.
The samples, which were analysed by XRD were produced using the same
process as that used to manufacture the blocks for the physical tests. Once the
blocks were produced, they were individually sealed in plastic bags and left to
cure. The XRD was conducted on two samples from each mix design. The first
sample was analysed after seven days of curing and the second sample after
twenty-eight days curing. This was done to monitor the changes over the curing
period used in blocks produced for the physical tests. After the specific curing
period the samples were taken to the x-ray diffraction laboratories at The Council
for Geoscience for analysis.
155
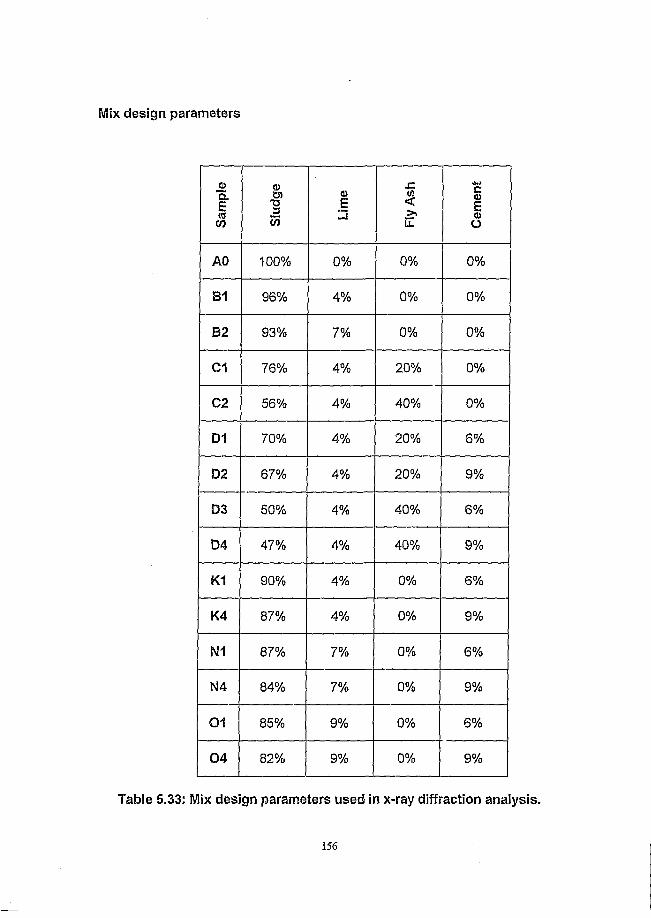
Mix design parameters
Sam
ple
i S
ludg
e
i
Lim
e
I
Fly
Ash
Cem
ent
AO 100% 0% 0% 0%
81 96% 4% 0% 0%
82 93% 7% 0% 0%
C1 76% 4% 20% 0%
02 56% 4% 40% 0%
D1 70% 4% 20% 6%
D2 67% 4% 20% 9%
D3 50% 4% 40% 6%
D4 47% 4% 40% 9%
K1 90% 4% 0% 6%
K4 87% 4% 0% 9%
N1 87% 7% 0% 6%
N4 84% 7% 0% 9%
01 85% 9% 0% 6%
04 82% 9% 0% 9%
Table 5,33: Mix design parameters used in x-ray diffraction analysis.
156

5.7.1 Results of the XRD analysis
The main objective of the analysis was to provide evidence of the changes
afforded by the addition of the stabilising agents. The results are presented in the
form of spectra to show qualitative changes in the peak intensity of the clay
mineral and the formation of peaks indicating the hydration products of the
cement to provide evidence of mineralogical changes to correlate with the
improvements in performance of the blocks in the physical tests. A quantitative
analysis was also done in order to facilitate explanation of the results. The
quantitative results are reported in table 5.34.
157

Sample
Cal
cite
Por
tland
ite
Mul
lite
Qua
rtz
10)
1
Inte
rstra
tific
atio
n
7 28 7 28 7 28 7 28 7 28days days days days days days days days days days
AO 70 70 - 10 10 20 20
B1 71 72 - 10 10 19 18
B2 68 70 3 2 - 10 10 19 18
C1 63 67 9 6 10 10 18 17
C2 54 57 20 18 10 10 16 15
01 59 61 5 3 10 11 10 10 16 15
02 58 61 6 5 8 9 10 10 18 15
03 53 55 4 3 18 19 10 10 15 13
04 46 54 11 4 19 19 10 10 14 13
K1 70 71 - 10 10 20 19
K4 69 71 3 - - 10 10 18 19
N1 66 65 5 7 - 10 10 19 18
N4 67 66 5 8 - - 10 10 18 16
01 67 64 6 9 - 10 10 17 17
0 4 6364 9 10 - 10 10 18 16
Table 5,34: Results of XRD quantitative analysis
158
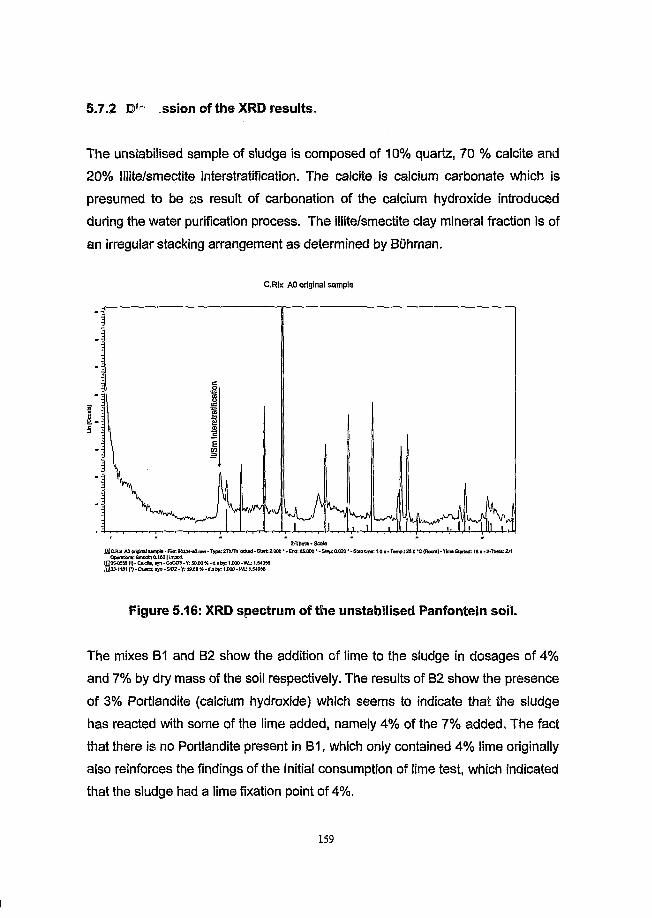
5.7.2 D|ir- ssion of the XRD results.
The unstabilised sample of sludge is composed of 10% quartz, 70 % calcite and
20% lllite/smectite interstratification. The calcite is calcium carbonate which is
presumed to be as result of carbonation of the calcium hydroxide introduced
during the water purification process. The iliite/smectite clay mineral fraction is of
an irregular stacking arrangement as determined by Buhman.
C.Rix AO original sample
$5
Otwetfom: Smoctti 0.1601 Imped [0 034655 (II •C*)dtel «yn-C«C03.Y: 50.0014- d * by: 1,000 •VAj IX O M 033-1181 n 'O y w tt • rn * 5102-7:16.59 % -d ib y : 1JOO-VM-11X050
Figure 5.16: XRD spectrum of the unstabilised Panfontein soil.
The mixes B1 and B2 show the addition of lime to the sludge in dosages of 4%
and 7% by dry mass of the soil respectively. The results of B2 show the presence
of 3% Portlandite (calcium hydroxide) which seems to indicate that the sludge
has reacted with some of the lime added, namely 4% of the 7% added. The fact
that there is no Portlandite present in B1, which only contained 4% lime originally
also reinforces the findings of the Initial consumption of lime test, which indicated
that the sludge had a lime fixation point of 4%.
159

Un(
Cou
nO)
C.Rix BIB
5
QjIl»0SMro-Cslde.«in.CeCO3-Y:56jf*.d*br:1A».W:1»«0$6
Figure 5.17: XRD spectrum of the Panfontein soil stabilised with 4% lime.
(mix B1)
C .R ix B 2 B
[tiwraro-PoriendW.eyn.CetOHp.YUtatt.dilyltiOa-WLI.SAOSA
Figure 5.18: The XRD spectrum for the soil stabilised with 7% lime.
(mix B2)
160

Lime-fly ash combinations
The spectra shown in figure 5.19 and 5.20 are the spectra of the soil stabilised
with 4% lime and fly ash. The change in spectra compared to B1 and B2 is the
formation of peaks indicative of Mullite. Mullite is the mineralogical name given to
a high temperature phase of aluminium silicate found in fly ash. The actual
decrease in the peak height of the clay mineral was very small.
C.Rix C18
5
0C.R1X C1B - File: 98334-C1B.RAW* Type: 2Th/Th locked • Start 2.000 • - End: 65.000 • - i^ep: 0.020 ■ - Step time: t.O s - Temp.: 25,0 *C (Room) - Tme Started: 18 s (033-1161 (*) - Quartz, eyn - S|02 • Y: 31.18 % - d x by; 1.000 * WL: 1.54056 (005-0580 (I) • Calcite, syn • CaC03 - Y: 54.43 % -dxby:1.000-VW 1.54056
154)770 (I) - Mullite, syn - A16S12013 - Y: 17.19 % - d X by: 1.000 • W L 1.54050
Figure 5.19: The XRD spectrum for the soil stabilised with 4% lime
and 20% fly ash. (mix C l)
161

C.Rix C2
5
2.Theta - SceioQlC.RU C2<Fttt:98U4<2jv«r*Typ«:2Th/TMoek*d-Suit2.000* ‘ £rd:(5.000*• SMp:0.030'.Si»pBm*'. t.0»-Tem pj25.0*0(Room)-tlfwSuried:65s-Z.TTi«»: 1000'•TfwU: I.OOC*..(13054566 (l>.Citi«,eim*CeCO3.Ytr4.89%-dKby:1.00a-Vtt:1A0ieQSJ-f M tP V O w fr 'ttn -S K H -Y ; 46.36 W-d*by:1.<XX)-Wt; 1.54058
1M778fiJ-Utai#,*rr!-A!6S«013.Y:35.45S - d x t y I.OOO-VNU 1X056
Figure 5.20: The XRD spectrum for the soil stabilised with 4% lime and 40%
fly ash. (mix C2)
Lime-fly ash-cement combinations
In the results of the 01 and D2-series Portlandite is picked up in the mixes, which
were tested after seven days of curing. Since it was shown in the 131 and C1-
series that no Portlandite is present after seven days the Portlandite which
appears can only be assumed to be a result of the hydration of the cement
added. The increase in the percentage of Portlandite identified in D1 and 02 as
well as in 03 and 04 is as a result of there being more cement in 02 than D1
originally (9% and 6% respectively), the same applies to 04 and 03. The
reduction in the percentage of clay mineral is the most significant in this series.
This is probably as a result of the substitution effect, with the addition of fly ash
replacing some of the clay in the mix, this can also be seen by the reduction in
the percentage of calcite, which reduces with an increase in the percentage fly
ash.
1 6 2

C.Rix D1B
I5
2>T?ieta> ScaleBJaRbi DIB-rareOStillBRAW-TypttZrtVThlockad.SUrf ZOCO* . Erd:6$.G00* -BteF6020*• Stepttmr 1.0i.Temti:2S.0"C(Btiom)-UmaStifled: 'et-Z.Thetr-.OOO'-Theta: 1000 [Q s n is i n ■ Qurtz. nrn • ace • Yz aaoi n • d X by. 1.000 • VM: 1.84056
( n o « m ( l ) ‘ Peni*rt»*eyn-Ca(OH)2»Y:10Z81t-dxbr: 1.000-W: 1.64066 160778 (I) • MJDM. syn - AB812013 . Y: 1607 W • d x by: 1.000 - Vtz 1.64066
Figure 5.21: XRD spectrum of soil satabilised with 4% lime, 20% fly ash and
6% cement, (mix D1)C.Rix D2B
a-Thelfl-ScaleB3c.RU U2B.FOe:06334^2fl.RAW»Type:ZTh/Thlocked-Start:2.000••End:65.000*•Step:0.020•-stay6me: 1.0*• Temp.:25.0*C(Room)•TVneStarted: 17e»2-Theta:2.000*• Theta: i.oOi " [Q33-I161 n -Q iw tt. »yn-SXi2-Y: 41.31 W -dxby: 1.000-IiMj 1.64056 [□060566(l)-C«ldte,eyn-CaC03-Y:64.15H-dxtiy: 1.000 1.64056G304-0733 (I) - PortUndita, syn • Ct(OHJ2 • Y: 10 65 % - d x by: 1.000 - WJ IJMOSa
160770 (I) • Mulrte, syn-A16SCQ13 . Yz 1863 S -d x by. 1.000 - IAU 1.64056
Figure 5.22: XRD spectrum of soil stabilised with 4% lime, 20% fly ash a n t i
9% cement, (mix D2)
163
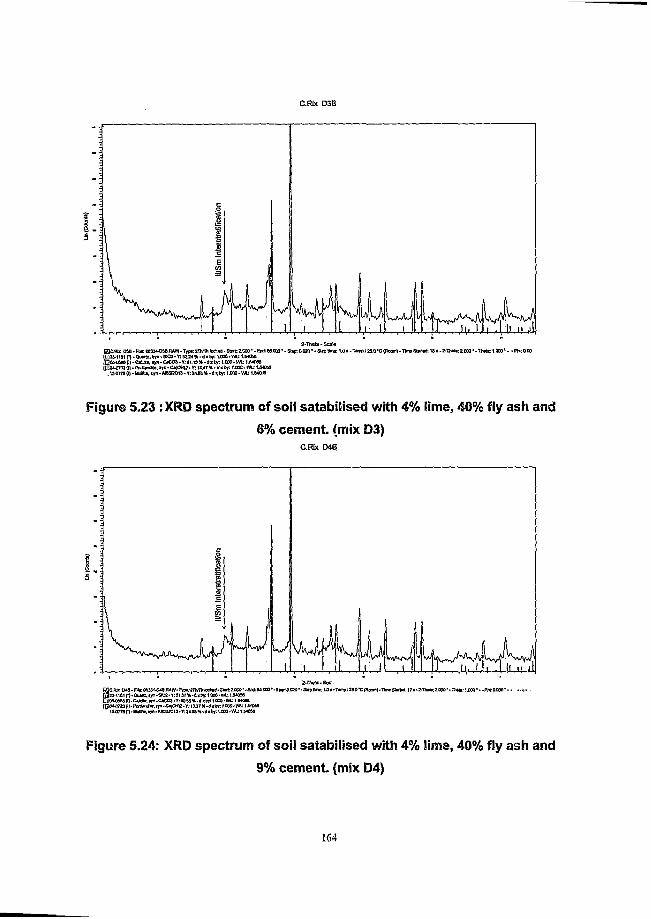
C.Rix 03B
taa.to OJB-RJc EeSM-tttttRAW-T^p* ZTVn5 toctrt - SWtlCCO'-En±8iQQ0* - Si?p;0.Q2a • - Sleo Bme: 1,0 «-Temp.; ISO'C (Boon) -TVrB Sartsct 18 »-2-Th«W:2.00Q • .The«»: I.OCO * - .phkatO 03 U -llB l n .Q u * tt.tyn '® 0 2 -V : 5124%-diby;1.000.WU 1.64056 (I2C »05e6 fl)'C < i*e.«yffC ja»-V i»f.)3% .d*tr;i.ao.v» ;iJ ti05e (Q O w m (1| * Astevfla. ayn . C^OHJ2. V; 13.47% . 4 x by: fXD3 . W : 1J499S
.160776 (I). lfc6te.ayn.AI6SSOI3.y! 84.83%-d*by:1.000-WU1.64<M6
Figure 5.23 :XRD spectrum of soil satabilised with 4% lime, 40% fly ash and
6% cement, (mix D3)C.Rix D4B
5
M W * . Sc*BQCJOr 0*8>flis;M334446iUiV.7yp*;77Vniiocatd.8tBtZC0l}*.E/Xt:63000**Sitp;0020*.S*rpC/n»:l4>*.Tamp.'930*0(Roam).TkMSiwltd: 17*.J.ThM;3X00*>77>M(;]XOO*..PM:6090*. •033.1161 n.Ou*rtS>*yi'.SH3a.Y:918r%.ditv1<100.VSU 164066B2oa«ae(i).c«k*,nii-c*co3.Y:ao36%.d*br-iooo.VA: 164066 Q30*4im(i/.P6W«nliir.«|H.C^CHp.y:iM7X.d*»!f:16C0.%L:f6#0i»
16O776P).UUn>>tyn.AI6SU013.V:34a6%.dxby:1oe0.Wj 16*066
Figure 5.24: XRD spectrum of soil satabilised with 4% lime, 40% fly ash and
9% cement, (mix 04)
164

The effect of combinations of only cement and lime on the sludge was also
investigated. The author decided to see what an effect an increasing percentage
of lime with a constant cement content would have on the sludge. The difference
in Portlandite levels when comparing K1, N1 and 01 which have the same
cement content, namely 6% but differ in lime content (4%, 7% and 9%
respectively) is assumed to be as a result of the combination of the calcium
hydroxide which is not consumed by the clay during the modification process and
the calcium hydroxide produced during the hydration of the cement.
The same trend is evident in the K4, N4 and 04 samples, which have a 9%
cement content instead of a 6% content, except the Portlandite levels are higher
as a result of there being more cement in the mix which will produce more
calcium hydroxide than the mixes with 6% cement.
I .5
Figure 5.25: XRD spectrum of soil stabilised with 4% l i r ' z) cement.
(mix K1)
C.RiX K1
2-TheU - ScaleQC-fiix K1 - Re: »63>«-k1 .few-Type: ZTlVTh locked-StutZOOO*-End: 63.000 •-Step: 0.020 •-Sfrpttme: 1.0 a-TemM 25.0‘ C (Room).Time Started: 18 6 •2-Tbots: 2.000 ••TheU: 1.000*- -Ph EQOSOHe (I) • Celeito, eyn - CaCOO • Y: 100.73 t t • d i by-1.000 - W l: 1.S40Se E lM -m t (*) - Querc, »yn • S«2 - Y: 22.67 * • d * by: 1.000 • v *2 1.5*038
1 6 5

Un (C
ount
s)
C.Rix N1B
2-Ttwta - ScaJaQ c.R tt NIB-Fie:ea334-N1B.RAW-TVpe:ZIhmileeked-Stsfc 1000‘ -End:6S.000, *St»p;0.020*.Sis?Bma:i.O».Tenw25.0*C(Room).TlmeSasfisd; 17s.a-TlwterZOOO'-Thets; 1.000‘(I30545«ro-Cey».»yn-C#C03.y:6a.M%.dxby;1.000-WU1A<055[Q33.116in.Qusi3.eyn-SK32.Y:2S22%.dxbv:1«)0.V1t: 1540560304^733 (I) • Pwtlsndits. eyn • C«(OH)2 • Y: 1558 % . d x by. 1.000-VM: 1.S4056
Figure 5.26: XRD spectrum of soil stabilised with 7% lime and 6% cement.
(mix N1)C.Rix 01
2-Thets. ScaleKC R b 01 - FBe: e633*<|j»iv Type; ZTtVTIlbdied.BUrt 2003‘ -E itt 65.000* .S1«F 0020 * • Stop time I.Ol-Temx: 250’ C (Room)-Time SW «t 181-2-ThXi:2Qon*-TTieti: 1.000*. .PN: 0.000*. tG tM TO (11. PorttohJle. *yn - Ca(0ty2 - Y: 1263 t t . d * by; 1.CIO . 1AU 1.84056 ZZ3flfrO5a6ro.Caba;#yff.C fC».Y:5M 9».dx4yr«to.M .>»5«0e6 [Q 31-1181 n.0veru.iyn-SiO2-Y : 24.00 %-i1*ty:1.0M-W^15<C6
Figure 5.27: XRD spectrum of soil stabilised with 9% lime and 6% cement.
(mix 01)
166

C.Rix K4B
2-Tt>eta - ScaleGQC-Rb M S • Fa*:6W34-4«BRAW-Typo:2Th/Th!oc*ad'Stare2.000".EmJ:65.000••Step:0.020* -StopHme; t.Os*T«<n|k:2S.0*C(Room) TtneStarted: 18•.2-Th*$s:Z000*.'ntet03 0WI588 W - C«Wa. *yn - C*C03 - Y: 60J9 S • « u by; t .000 • W j 1.M0S6(QS3-1l0tn*Q>»rt*.«r‘ *SfO2-Y:21.e2X.dxbr.1.000»vyL:t5405tt
Figure 5.28: XRD spectrum of soil stabilised with 4% lime and 9% cement.
(mix K4)C.Rix N4B
5
E]C.Rte tUO.Fa*:B833*waRAW.Type: ZThfthlodied.SteC 2000*-Era: eL tm ** Step: 0.020 • - Step Bn*: 1.0 i-Temp.: 2S0,C(Fctta)-Time Started:« ».2-TI«a: 2000 •♦Theta: 1 .0 0 0 -P [QOKtsae ([) • Cetdte. syn • CaCOS - Y: OMt S « d a by: 1,000 - WU1 {Q an 181 n - Qu*te. syn - S M - Y: n n W • d X by: 1.000 • tM: 1.8«68 EO aom (I) • Pan*!#*, syn • C«(OH)2 • Y: 1128 W - d * br. 1 .CM . W : 134066
Figure 5.29: XRD spectrum of soil stabilised with 7% lime and 9% cement.
(mix N4)
167

Un (C
ount
s)
C.Rix 0 4 8
2-Tiwta - SealsSJC.Rtt £Ma-Fa»:C4W-O<aF<AW-TVp«:2Th/Ttlkx*«l-Sart:ZJ00‘ -6xj;e5.0«I*'5J*p.'0.C20, -5t*SJt*Tw: t.O*-Tornfj--23.0 "C (Room) - Time Sitrtod: tSs-Z-TTwtcZOOO'-TTiet D305-6$ea(l)*Ctidte.syn.(^CO3.Y:6a.71%.dxbr. 1.000-W;1.$i056 [□3M 16in .Q w tr.«P *8 i02-Y :24 .9e% .dxby.1 .000 .W U t^40M (Q 044)733 (.)• Portsndltf. fyn • C»(OH)2 - Y: 16.07 %• d x by: 1.000 - WU1.54M6
Figure 5.30: XRD spectrum of soil stabilised with 9% lime and 9% cement.
(Mix 04)
168

Conclusions
The results of the analysis which were hoped for was a decrease in the intensity
of the clay mineral peak to indicate modification by the reaction between lime and
the clay fraction. The presence of peaks related to the hydration products of
cement namely calcium silicates would correlate with the improved strength and
durability characteristics of the stabilised soil blocks. The results however did not
provide proof of either of these changes having taken place as was suggested by
the results of the physical tests.
The only evidence of the hydration of the cement in the XRD results is the
presence of Portlandite. The x-ray traces for the samples which contained only
lime and cement showed a higher percentage Portlandite than the other mixes
subjected to x-ray diffraction. This is assumed to be as a result of the calcium
hydroxide being produced during the hydration of the cement. The percentage is
higher than those in the mixes which contained fly ash, because the excess
calcium hydroxide is not used up during the pozzolanic reaction with the fly ash.
The author believes that the clay mineral in addition to having an interstratified
stacking arrangement (see section 1.4), has a poorly crystallised structure. This
noorly crystallised structure does not give good reflections in the spectra and
therefore the peaks required to make a positive identification of the changes in
the clay mineral are not present.
The lack of evidence of the hydration products in the spectra may be accredited
to the fact that the products may be of an amorphous nature. Work done at the
Swedish Cement and. Concrete Research Institute [26] has shown that
carbonation of calcium hydroxide results in the formation of calcite, which covers
the silicate minerals. The high percentage of calcite (calcium carbonate)
therefore may also cover the silicate minerals.
169

CHAPTER SIX

6.0 GENERAL CONCLUSIONS
The objective of this research was to determine the properties and composition
of the 'sludge' from Rand Water and to explore ways in which the highly plastic
clayey soil could be stabilised to produce building blocks of an acceptable
standard. The standard used is discussed in section 2.5. Wet and dry
compressive strength, water absorption and durability in terms of water erosion
were used as the principal criteria to determine what combination of stabilisers
provided sufficient improvement in the performance of the blocks for them to
meet the required standards.
The results of the physical tests have shown that the addition of lime to the soil
does not provide the blocks with sufficient dry and wet strength after 28 days of
curing to be considered a suitable stabiliser used on its own. This however was
expected as the lime was added for it its clay modification properties and not its
cementing properties. The reduction in shrinkage when comparing the
unstabilised block and the block stabilised with lime is evidence of this
modification. Results for tests, which involved soaking, could not be obtained as
the blocks disintegrated when placed in water. The lack of durability of the lime-
stabilised blocks indicated by the accelerated water erosion test is also evidence
of the failure of lime as the sole stabilising agent for this soil.
The addition of cement permitted the full range of evaluation to be carried out
and yield results for all the tests conducted. By using lime-cement combinations
the physical properties of the blocks were improved significantly. The addition of
6% ordinary Portland cement with the 4% lime improved the dry compressive
strength from 2.84 MPa for the 4% lime-stabilised blocks, to 5.57 MPa for the
lime-cement stabilised blocks. The cement addition also provided the block with
a wet compressive strength of 2.44 MPa, where the lime-stabilised blocks
disintegrated in the water and are therefore assumed to have no wet strength. A
further increase (6-9%) in the cement content increased both the wet and dry
170

compressive strength. The drying shrinkage was improved by the addition of 6%
cement, although; not substantially (3.26% to 2.78%). A further increase in the
'--.i lent content reduced the shrinkage still further. The improvement in the
performance of the blocks as a result of the inclusion of cement in terms of the
water absorption and expansion tests could not be gauged as comparative
results for these tests of the lime-stabilised blocks could not be determined.
However, the fact that results were obtained for these tests is evidence of the
improved performance.
Although the properties of the lime-cement stabilised blocks exceed the
standards set, the flocculation of the clay minerals by the lime, give the surface of
the blocks a porous appearance, which the author believes is not ideal as this is
potentially a weakness in the durability of the block.
The addition of fly ash decreases the porosity of the block, resulting in the
surface of the block having a smoother finish. The results of the tests improved
with increases in the addition of fly ash, except for the dry compressive strength
which is probably as a result of the replacement of a percentage of the clay by
the fly ash, where the clay in the dry state has higher strength than the fly ash.
The effect of the fly ash is seen in the results of the wet compressive strength
test. The wet strength of the combinations with fly ash is higher than the
combinations which are identical (i.e. same percentage lime and cement) but
without fly ash.
The stabilisation reactions which take place as a result of the addition of lime and
cement as indicated by the results of the physical tests were not apparent in the
mineralogical analysis conducted. The changes in the mineralogy were not
shown in the XRD spectra of samples tested. This is probably as a result of The
clay mineral having a poorly crystallised structure. The only evidence of the
hydration products of the portland cement is the calcium hydroxide which is
found in samples stabilised with lime and cement, as the cement addition
171

increases so the amount of calcium hydroxide also increases. The addition of the
fly ash reduces the total amount of clay in a mix and probably reacts with the
excess calcium hydroxide to form cementitious products similar to those
produced during the hydration of the cement.
The results of the physical tests are therefore a more reliable indicator of the
reactions related to lime and cement stabilisation having taken place.
As discussed in 5.1.1 the results of the compressive strength test, water
absorption and accelerated water erosion test would be compared to limits for
these tests which have been suggested by various organisations worldwide.
These limits would be used to determine which combination of the stabilisers
would produce a block which could be used in the construction of single-storey
buildings. Based on the results achieved in the above tests and taking into
account the variance in performance between laboratory conditions and field
conditions the author believes that the mix which consists of 4% lime, 7% cement
and 20% fly ash (i.e 12) produces a block which performs well in the tests.
Although a number of the other mixes also produced blocks which have sufficient
compressive strength to qualify, the blocks general appearance, especially the
smoothness of the faces also influenced the final decision. It is suggested that
the more smooth the surface generally the more durable a block will be. The
mixes which did not contain fly ash had rougher surfaces than those which did.
The author believes that this will potentially be a weakness in the durability of the
block and the addition of even 20% fly ash provides the block with a smooth
surface capable of resisting erosion by driven water. As the percentage fly ash
increases so does the smoothness of the face of the block. The addition of 20%
fly ash is sufficient to produce a durable block.
Althoug:. uie compressive strength of the mix with 6% OPC (11) is above that
required, the author feels that with the difference in the laboratory and field
172

production conditions 7% OPC will assure that the standards set will be
achieved.
The results indicate that this clayey soil can be used to produce building blocks
using lime, cement and fly ash as stabilising agents. The author believes that a
combination of 4% lime, 7% cement and 20% fly ash added to the soil
compacted at an optimum moisture content of 23.4% produces a block which can
be used for construction of single storey buildings.
173

APPENDICES

A.1. Descriptions of the testing procedures used in the
laboratory tests to determine the physical properties of the
soil.
A.1.1 Atterberg Limits
The determination of the liquid limit of the soil
Definition
The liquid limit of a soil is the moisture content, expressed as a percentage of the
mass of the oven-dried soil, at the boundary betv/een the liquid and plastic
states. The moisture content at this boundary is arbitrarily defined as the liquid
limit and is the moisture content at which the two halves of a soil cake will flow
together for a distance of about 10 mm along the bottom of the groove separating
the two halves, when the cup of the liquid limit device is dropped 25 times
through a distance of 10mm at a rate of two drops per second.
Scope
This method covers the determination of the liquid limit of soils as defined above
, using the liquid limit device, based on the results of at least three trials.
Apparatus
i) A liquid limit device (figure 3.1). This device consists of a brass bowl
27mm deep, cut from a hollow sphere of 108mm internal diameter and 2mm
thick. This bowl is hinged at one end and a cam device enables it to be
172

tapped by being dropped exactly 10mm onto the base at a rate of 2 taps
per second.
ii) A grooving tool (figure 3.2) used in conjunction with the bowl consists of a
handle to which is attached one end of a blade in the form of a quadrant of
a machined ring, 44mm internal diameter, with a equilateral triangular
section having 13,5mm faces, one flat being on the inside of the ring , the
outer edge having been machined to produce a flat surface 2mm wide.
SECTION 9 - 8
65
P l a n
Figure 3.1 : Liquid Limit device
173
Figure 3.2 : Grooving tool

In addition, the apparatus includes:
iii) A calibrating plate with a thickness of 10 mm.
iv) Distilled water in a squeeze bottle.
v) A porcelain evaporating dish with a diameter of about 100mm.
vi) A spatula with a slightly flexible blade about 100mm long and 20mm wide.
vii) Suitable containers, such as weighing bottle with capacities of 30ml to
45ml.
viii) A balance to measure up to 10Og, sensitive to 0,01 g.
ix) A drying oven, thermostatically controlled, and capable of maintaining a
temperature of 105 to 110°C.
Method
Test procedure:
48g of the thoroughly mixed soil fines ( i.e. the material passing the 0,425mm
sieve), is measured out and transferred to a porcelain dish. Distilled v/ater is
added and the moist material is then thoroughly mixed for 10 minutes with
sufficient water to form a stiff consistency, approximately three-quarters of the
wet soil is transferred to the brass bowl of the liquid limit device, mixed slightly
and flattened out in the front portion of the bowl with the spatula. The material is
then divided into two equal portions with one cut of the grooving tool. The groove
should fall along the centerline drawn through the cam-follower attached to the
bowl. The device is then operated at a speed which results in two taps per
second being applied to the soil, until the lower parts of the faces of the two soil
portions have flowed together and made contact across a distance of about
10mm.
174

BOWL
DIVIDED SOIL CAKE BEFORE TEST
BOWL
SOIL CAKE AFTER TEST
The number of taps required to close the groove across the distance is recorded
and a sample of approximately 2 to 3g, representative of the total thickness of
the layer, is transferred to a tared weighing bottle for the determination of its
moisture content.
The procedure is repeated for additional determinations on the soil in the bowl of
the liquid limit device. However, before each test 2 to 3g of material from the
porcelain dish is added to the material in the bowl, to ensure that the quantity of
material in the bowl is approximately the same for all determinations. Sufficient
distilled water is added each time in order to obtain three samples of varying
consistencies, so that at least one determination will be made in preferably each
of the following range of taps: 28 to 35, 22 to 28, and 15 to 22. The test should
preferably proceed from the drier to the wetter condition of the soil.
The moist material, which has been left over in the porcelain dish, is set aside for
the determination of the plastic limit and the linear shrinkage. The masses of the
containers with the soil samples are measured, after which the samples are oven
dried (105 - 110°C) to a constant mass. As a rule the material is dried overnight.
175

When the containers are removed from the oven, the lids are replaced to prevent
the absorption of moisture, and after allowing them to cool, their masses are
obtained again. The loss in mass is the mass of water, which is expressed as a
percentage of the oven-dried mass of the soil.
Calculations
Moisture Content
The moisture content of the soil is expressed as a percentage of the mass of the
oven-dried soil and is calculated as follows:
mass of wet soil - mass of dried soil
Moisture content (%) = mass of dry soil X 100
The calculations should be carried out to the first decimal place.
Liquid Limit:
A "Flow curve” representing the relationship between moisture content and
corresponding number of taps is then drawn by plotting the moisture contents as
ordinates on a linear scale and the number of taps as abscissa on a logarithmic
scale. The flow curve should be a straight line drawn as nearly as possible
through the three plotted points (see example in figure 3.3).
The moisture content corresponding to 25 taps is then read off the curve and is
taken as the liquid limit of the soil and reported to the nearest whole number.
176
i

50
4 0 ,
10 2 515 20 20HUMBER OF TAPS
Figure 3.3 : Example of a flow curve ( TMH; 1986; p g 1 4 & 1 5 )
177

A1.2 The determination of the plastic limit and the plasticity index of the
soil.
Definition:
The plastic limit of the soil is the moisture content, expressed as a percentage of
the mass of the oven - dried soil, at the boundary between the plastic and semi -
solid states.
The plasticity index is the numerical difference between the liquid limit and the
plastic limit and indicates the magnitude of the range of the moisture contents
over which the soil is in a plastic condition.
Scope
This method covers the determination of the plastic limit of a soil, as defined
above by measuring the lowest moisture content at which a soil can be rolled into
threads 3mm in diameter without the threads crumbling. It also covers the
calculation of the plasticity index from the liquid limit and the plastic limit.
Apparatus:
(i) A ground - glass plate measuring some 150mm x 220mm.
(ii) Containers, such as weighing bottle with capacities of 30mm - 45mm.
(iii) A balance to measure up to 100g, sensitive to 0,01 g.
(iv) A drying oven, thermostatically controlled, and capable of maintaining a
temperature of 105 to 110°C.
Method:
Approximately 2-3 g of the moist soil set aside from the liquid limit determination
is kneaded with the fingers to an ellipsoidal shape. It is then rolled into a thread
of uniform diameter throughout its length. The rolling is done on the ground -
glass plate using either the fingers or the palm of the hand. When the diameter
of the thread has been reduced to about three mm, the thread is rolled up into a
178

ball and again kneaded to an ellipsoidal shape and rolled out. This process is
continued until the crumbling caused by drying out of the soil prevents the
formation of a thread 3mm in diameter. This means that the crumbling occurs
when the thread had a diameter slightly greater than 3 mm, but this is regarded
as a satisfactory end point, provided that just prior to that, the soil had been
rolled into a thread 3mm in diameter.
The operator should ensure that the thread is not broken up or crumbled by
applying excessive pressure, but crumbles because of a lack of elasticity. The
crumbled soil thread is transferred to a tared weighing bottle for the
determination of its moisture content. A duplicate determination should then be
ca-riec! out.
The masses of the containers with the soil samples are measured, after which
the samples are oven dried to a constant mass. As a rule the material is dried
overnight. When the containers are removed from the oven, the lids are replaced
to prevent the absorption of moisture, and after allowing them to cool, their
masses are obtained again. The loss in mass is the mass of water which is
expressed as a percentage of the oven-dried mass of the soil. Duplicate
determinations should not vary by more than 1.5 units.
Calculations:
Plastic Limit
The plastic limit is expressed as the percentage by mass of moisture contained in
the oven dried soil and is calculated as follows:
Mass of wet soil - Mass of dried soil
Plastic limit = Mass of dried soil x100
The calculation should be carried out to the first decimal place, and the average
of the two determinations is taken as the plastic limit.
179

Plasticity index
The plasticity index is obtained by subtracting the plastic limit from the liquid limit.
A1.3 The determination of the linear shrinkage of the soil.
Definition
The linear shrinkage of the soil for the moisture content equivalent to the liquid
limit, is the decrease in one dimension, expressed as a percentage of the original
dimension of the soil mass, when the moisture content is reduced from the liquid
limit to oven - dried.
Apparatus
(I) A shrinkage trough with inside dimensions of 150mm long x 10mm x
10mm and made of 16 gauge tinned copper or stainless steel.
(ii) Mould grease.
(iii) A spatula with a slightly flexible blade about a 100mm long and 20mm
wide.
(iv) A drying oven thermostatically controlled and capable of maintaining a
temperature of 105 to 110°C.
( v ) A vernier caliper.
Method
Waxing the trough
It is generally recommended that the inside of the trough be waxed with a layer of
paraffin wax before being filled in order iti prevent adhesion between the soil and
the trough, in practice this procedure is usually replaced by coating the inside of
the trough with a layer of shutter oil or a thin layer of Vaseline.
180

Filling the trough
The test should be run immediately after the liquid limit test so that the moist
material left over can be used for filling the trough without further mixing. If for
some reason it is required to carry out only the shrinkage test, about 40g of soil
fines would first have to be mixed with water and brought to the liquid limit.
Fill one half of the wax trough with the soil at its liquid limit by taking small pieces
of soil on the spatula and pressing the soil down against the one end of the
trough and working along the trough until the whole- side is filled and the soil
forms a diagonal surface from the top of one side to the bottom of the opposite
side.
The trough is now turned round and the other portion is filled in the same
manner. The hollow along the top of the soil in the trough is now filled so that the
soil is raised slightly above the sides of the trough. The excess material is
removed by drawing the blade of the spatula longitudinally once only from one
end of the trough to the other while exerting sufficient pressure with the forefinger
on the blade of the spatula to ensure that the blade moves along the sides of the
trough leaving it exactly full of the soil. During this operation the wet soil may fall
away from the end of the trough, in which case it should be pushed back gently
with the spatula.
Drying the wet material
The trough with wet material is placed in a drying oven and dried at a
temperature of between 105 and 110°C until all shrinkage has stopped. As a
rule the material is dried out over night - thvugh 3 hours should be sufficient time
in the oven. The trough with material is taken out and allowed to cool in the air.
181
I

Measuring the shrinkage
It will be found that the ends of the dried soil bar have a slight lip. These lips
must be removed by abrading with a sharp narrow spatula, so that the end of the
soil bar is parallel to the end of the trough. If the soil bar is curved, it should be
pressed back into the trough with the fingertips so as to make the top surface as
level as possible. The loose dust and sand removed from the ends, as well as
loose material between cracks, should be emptied out of the trough by carefully
inverting the trough whilst the material is being held in position with the fingers.
The soil bar is then pressed tightly against the end of the trough. It will be
noticed that the soil bar fits better at the one end than at the other end. The bar
should be pressed tightly against the end at which there is a better fit. The
distance between the other end of the soil bar and the respective end of the
trough is measured by means of a vernier caliper .
Calculation
The shrinkage is expressed as a percentage of the original wet length of 150mm
that is calculated as follows:
150 - length of dry soil (mm)
Linear shrinkage = 150 X 100
182

A1.4 The determination of the grain size distribution by means of a sieve
analysis.
Scope
This method describes the determination of the particie sizes of a soil by means
of shaking the soil through a nest of sieves. The nest consists of eleven sieves,
each sieve with a mesh with smaller opening sizes than that of the preceding
sieve.
Apparatus
(i) A set of nesting sieves with square openings of the following sizes in mm:
13.2
9.5
6.7
4.750
2.0
0.850
0.425
0.250
0.150
0.075
A pan and a lid
(ii) Brushes for cleaning the sieves
(iii) An electronic balance sensitive to 1g.
(iv) A thermostatically controlled oven capable of maintaining a temperature of
100°C.
(v) A galvanized pan 500mm in diameter.
(vi) A mortar and rubber tipped pestle.
(vii) A mechanical sieve shaker.
183

Method
Washing the soil
Make sure the sieves to be used are clean. The mass of each sieve should then
be determined to 0.1g, Select approximately 500g of soil, oven dry the soil over
night and determine its dry mass. Wash the soil, a little at a time through the
0.075 mm sieve being careful not to lose any of the soil retained on the sieve.
Collect the washed material in the pan, then oven dry the soil retained on the
sieves overnight. Determine the mass of the dry material to 0.1g.
Sieving the soil
Break down the dry material into its individual particles using the rubber tipped
pestle and mortar. Sieve the material through the nest of sieves by hand shaking,
using a motion of horizontal rotations for 10 minutes or use a mechanical shaker
for approximately half that time. Weigh each sieve with the material retained on
it to an accuracy of O.lg. The percentage passing is then calculated.
Calculations
(i) The mass of soil retained on each sieve is calculated as follows:
m = M - S
Where:
m = mass of soil retained in grams
M = mass of sieve and soil retained in grams
S = mass of sieve in grams
(ii) The percentage passing is calculated using the following formula:
A - 2 m
P = A x100
Where:
P = the percentage passing or the percentage finer by mass
A = the mass of the pan and dry material before washing in grams
184

2m = the cumulative sum of the mass of soil retained on the sieves in
grams, starting from the sieve with the largest opening and working downwards.
The results can then be reported graphically with the particle size in mm on a
logarithmic x - axis and the ‘percentage finer’ by mass on a linear y - axis.
185

A1.4.1 The determination of the grain size distribution in the soil by
means of a hydrometer.
Scope
The distribution of particles larger than 0,075 is determined by sieving, whilst the
distribution of particle sizes smaller than 0,075mm is determined by a
sedimentation process, based on Stokes’ Law defined hereunder, using a
specially calibrated hydrometer. This method does not give absolute results, but
gives data, which are comparable and consistent, if the method is followed in
detail.
Stokes’ Law:
Stokes’ Law states that: Maximum grain diameter
where:
n = viscosity of the suspending medium in Pascal - seconds.
The viscosity of distilled water at 20°C is 0,00105 Pa.s.
L = the distance in centimeters through which the grains settle
in a period of time, T.
T = time in minutes, period of sedimentation.
G = relative density of soil particles
G1 = relative density of suspending medium (which is 0,99823
980 (G - G1) T
300nL
for water at 20°C)
186
I

Apparatus
(i) A balance to weigh up to 2Q0g, accurate to 0,1 g.
(ii) A canning jar, wide mouth, about 1000 ml capacity.
(iii) A Bouyoucos cylinder graduated at .1130 and 1205 ml.
(iv) A Bouyoucos hydrometer
(v) A dispersing apparatus with paddle. The paddle is attached
to a 120 to 150mm shaft, which is rotated (by an electric
motor), at a rate of 1450 revolutions per minute.
If such a disperser is not available an egg whisk with 4
vanes may be used.
(vi) A tablespoon.
(vii) A stop-watch.
(viii) A wash-bottle
A dish or small basin approximately 150mm diameter.
A thermometer, measuring from 0 to 50oC, graduated in
0,2= C.
(ix) A pipette with a 10 ml capacity.
(x) Caigon solution.
Metl iOd
Preparation of sample
lOOg, accurate to O.lg (50g for samples containing a reasonably high
percentage of the silt and clay fractions) of the soil fines (finer than 0,425mm) is
weighed out. The weighed sample is transferred to a canning jar, and about
400ml of distilled water and 10ml of Caigon solution is added. The soii-water
mixture is stirred well with a glass rod and left to stand for at least two hours but
preferably overnight.
After the mixture has been allowed to stand, it is dispersed for 15 minutes with
the standard dispersing paddle or for five minutes with the egg whisk. The paddle
187

is washed clean with distilled water, allowing the wash water to run into the
container with the suspension.
Filling the cylinder and correcting the temperature
The suspension is poured into the Bouyoucos cylinder and the canning jar is
rinsed with distilled water from the wash bottle. All the suspension is transferred
quantitatively to the cylinder. The cylinder is then filled with distilled water to the
1000 ml mark.
Hydrometer readings
The cylinder is inverted a few times, using the palm of one hand as a stopper
over the mouth of the cylinder, until a homogenous suspension is obtained. It is
placed on a tabletop and the stopwatch started. At about 10 seconds the
hydrometer is inserted and a reading is taken at 18 seconds to give a percentage
of the sub 0.075mm particles (the fine sand, silt and clay fraction). A reading at
40 seconds gives the percentage of sub 0.05mm material (silt and clay fraction).
For the clay only fraction (sub 0.002 mm) and colloid frauJon (sub 0.001 mm)
readings after 7 hours and 24 hours respectively may be taken. The hydrometer
is removed from the cylinder after each reading and kept in a cylinder of distilled
water. Temperature readings of the water solution should be taken after every
hydrometer reading.
Calculations
The calculation to determine the particle size is fairly lengthy but programs do
exist which can be used to calculate the particle sizes. Alternative descriptions of
the calculations can be found. [26]
188

A.2. LABORATORY TESTS CONDUCTED TO DETERMINE CHANGES IN
THE PHYSICAL PROPERTIES AND MINERALOGY OF THE
PANFONTEIN SOIL AS A RESULT OF THE ADDITION OF LIME
A.2.1 THE INITIAL CONSUMPTION OF LIME TEST
Objective
The objective of the ICL test is the control of the pH in lime and cement stabilised
soil in order to allow the possible formation of cement minerals, calcium silicate
hydrate and for proper modification to take place.
Equipment
1. Balance accurate to 0.1 g.
2. pH meter accurate to 0.02 units
3. Six plastic beakers (150ml, tall)
4. Spatula or pallet knife
5. Soft tissues
6. Glass beaker (200ml)
7. Distilled water.
8. Lime to be used: This lime should be the poorest quality lime meeting SABS
824. If a high quality of lime is used in the test and a low quality lime is used
in the field the results which were achieved in the laboratory will not be
achieved in the field. Whereas if a low quality lime is used in the laboratory,
the use of a high quality lime in the field will not yield negative results.
9. Jet bottle for cleaning electrode
10. Drying oven capable of maintaining a temperature between 105 - 1 10°C.
11. Thermometer accurate to 0.5°C
12. Sample riffler or splitter (25mm openings approximately are sufficient).
189

Preparation of soil samples
a) The test is carried out on 2 kg of material finer than 19mm. Any oversize
material is crushed to pass 19mm.
b) Oven dry sample at 105 -110°C until constant mass is reached.
c) The sample is further reduced to 300g quantities by means of sample splitters
and placed into 150 ml (or larger) plastic containers.
Testing procedure
a) Since most materials require between 2 and 5 percent lime [2], it is advisable
to set up six beakers with lime percentages of 1; 2; 3; 4; 5 and 6 of the dry
soil mass, i.e. 200g soil + 2; 4; 6; 8; 10 and 12g of Ca(OH)2. This will ensure,
in most cases, that the percentage of lime required can be determined in one
hour. Measure out the lime to the nearest O.lg and add it to the soil. Mix soil
and dry lime.
b) Slightly over-saturate samples with distilled water. The material shall be
judged over-saturated when the pores of the material are water filled and free
water can be observed on the surface of the mix. The surface particles need
not be submerged completely.
c) Mix for 30 seconds every 10 minutes.
d) After one hour, measure the pH by inserting the pH electrode gently into a
hoik made in the material with the spatula to a depth of about 20 - 30 mm
and gently covering this part of the electrode with the material. Tap the
beaker gently for contact between electrode and material. The pH meter must
be equipped with an electrode standardised with a buffer solution having a pH
of 12.00.
e) Record the pH of each of the soil/lime/water mixtures. The lowest percentage
lime which causes the pH to remain constant, is the saturation lime content of
this particular gravel. It should be noted that as pH is temperature dependent
the actual saturation pH value will not be constant but at normal
temperatures, it will be of the order of 12.4.
190

Recording of results
The results are recorded to the nearest 0.5 percent lime required to produce the
maximum pH in the soil/lime/water mixtures as indicated by the pH of the mix.
Since the pH depends on the temperature, this is also recorded. This percentage
of lime is read as the ICL of the soil.
191

REFERENCES

References
[1] Agarwal. A., M ud, M ud, In The p o te n tia l o f earth b a s e d m a te r ia ls fo r
Third W o rld housing, Earthscan HED, London, 1981.
[2] Ballantine, R.W. and Rossouw, A.J. S tab ilisation o f S oils . PPG Lime Ltd,
Johannesburg, 1989.
[3] Bhatnagar.J.M., Goswami, N.L and Singh. S.M., S ta b ilis e d s o il b ric k
m aking . Building Research and Practice. 1988.
[4] Brandi, H. A ltera tion o f s o li p a ram eters b y s tab ilisa tion w ith lim e.
Proceedings of the the 10th International Conference on Soil Mechanics
and Foundation Engineering, Stockholm, 1981. Volume , pp. 587-594.
[5] British Aggregate Construction Materials industries. L im e S tab ilisa tio n
M anual, November, 1986.
[6] Compressed earth blocks. Volume 1 : M a n u a l o f p ro du ctio n , CRATerre
-BAG, Rigassi V. Friedrich Viewig & Sohn, Braunschweig, Allemagne,
1995.
[7] Compressed earth blocks. Volume 2: M a n u a l o f d e s ig n a n d
construction , CRATerre-EAG, Rigassi V. Friedrich Viewig & Sohn,
Braunschweig, Allemagne, 1995.
[8] Craig, R.T. S o il M echanics. Third Edition, University of Dundee,
Berkshire, van Nostrand Reinhoid & Co. Ltd., 1983.
[9] CRATerre. Earth C onstruction Technolog ies fo r D e v e lo p in g
C ountries . Intermediate Technology Publications, London, 1987.
189

[10] Croft, J.B. The in fluence o f s o il m inera io g ica l co m position on c em en t
stab ilisa tio n . Geotechnique, Volume 17,1967.
[11] C rysta l S tructu res o f C lay M in era ls and th e ir X -ra y id en tifica tio n
Edited by G.W. Brindley and G. Brown. Spottiswoode Baiiantyne Ltd.
Colchester and London. 1980.
[12] Davidson, D.T., Pitre, G.L., Mateos, M.T., and George, K.P. M o is tu re -
density , m o is ture - s trength a n d com paction c h a rac te ris tics o f
cem en t- tre a te d s o il m ixtures. Highway Research Board, Bulletin 353,
1962.
[13] Davidson, K.W. Lim e S tab ilisation fo r Roeid C onstruction . Lecture
notes, postgraduate course on 'Bound Materials', Johannesburg, 1987.
[14] de Sousa Pinto, C., Davidson, D.T. and Laguros, J.G. E ffe c t o f tim e on
c em en t stab ilisation o f m ontm orillon ite soi!s. Highway Research
Board, Bulletin 353, 1962, pp. 64-83.
[15] Dethier, J. D ow n to Earth. Thames and Hudson Ltd, London, 1982.
[16] Doat, P. Hays, A. Houben ,H. , Matik, S. & Vitoux, F. B u ild in g w ith
earth. The Mud Village Society, New Delhi, India.
[17] Draft TRH13. C em entitious S tab ilisers in R o ad C onstruction . National
Institute for Transport and Road Research of the Council for Scientific and
Industrial Research, Pretoria, 1986.
[18] Eades, J.L and Grim, R.E. R eactio n o f H ydra ted L im e w ith p u re c la y
m inera ls in s o il s tab ilisation . H ighway Research Board, Bulletin 304,
1961.
190
[19] Eades, J.L, Nichols, F.P.(Jnr) and Grim, R.E. F o rm a tio n o f n e w
m inera ls w ith lim e stab ilisation as p ro ven b y fie ld exp erim en ta tio n in
Virginia, H ighway Research Board, Bulletin 335, 1962.
[20] Eslinger, E and Pevear, D C lay m inera ls fo r P e tro le u m G eo lo g is ts
a n d E ng ineers , Short course notes no. 22 Society of Economic
Paleontologists and Mineralogists. Tulsa, U.S.A, 1988.
[21] Fathy, H. A rch itec tu re fo r the p oo r, Chicago, University of Chicago
Press, 1973.
[22] Fulton, F.S. C oncrete Technology. The Portland Cement Institute,
Johannesburg, 1994.
[23] George, K.P. S hrinkage charac teris tics o f s o il-c e m e n t m ixtures.
Highway Research Record, Number 255, 1968, pp. 42-58.
[24] Gillott, J.E. C la y in en g in eerin g geology. Elsevier Science Publishers
B.V. , Amsterdam, Netherlands, 1987.
[25] Grim, R.E. C/ay M ineralogy. Second Edition, McGraw-Hill Book
Company, New York, 1968.
[26] Grudemo, A. A n E lec tronograph S tu d y o f the M o rp h o lo g y a n d
C rysta llisa tion P roperties o f C a lc ium S ilica te H yd ra tes . Swedish
Cement and Concrete Research Institute, Royal Institute of Technology,
NR 26, Stockholm.
[27] G u ide to earthw ork construction . Transportation Research Board,
Washington D.C., 1990.
191

[28] Gutschick, K.A., Lim e-so il S tab ilisation. Proceedings of the 6th
International Lime Congress, London, June 1988.
[29] Hagan, E.B. The use o f s tab ilised so il to enhance ru ra l housing .
Building research and information, volume 25, number 4,1997.
[30] Hammond, A.A. A s tu d y o f fac tors in fluencing au to gen o u s h ea lin g in
lim e an d s o il s tab ilised ro ad bases. Proceedings of the 8th Regional
Conference for Africa on Soil Mechanics and Foundation Engineering,
Harare, 1984, pp. 371-379.
[31] Hammond, R. F oundations a n d S o il P roperties: A p ra c tic a l g u id e to
th e m ethods o f im proving the p h y s ic a l p ro perties o f g ro u n d to
in c rease its s trength . MacDonald, London, 1961.
[32] Handy, R.L., C em entation o f s o il m inera ls with P o rtla n d C em en t o r
A lk a lis HRB Bull. 198, 55 - 64 (1958).
[33] Hausmann, M.R. E ng ineering p rin c ip les o f g ro u n d m odification .
McGraw-Hill, Washington, U.S.A , 1990.
[34] Helmuth, R. F ly ash in cem ent an d concrete, Portland Cement
Association, Skokie, Illinois, 1987.
[35] Herrin, M and Mitchell, H. L im e-so il m ixtures. Highway Research Board,
Bulletin 304, 1961.
[36] Hill, L and Holmes, S. L im e a n d o th er a lte rn a tive cem ents,
Intermediate Technology, London, 1992.
192

[37] Hilt, G.H. and Davidson, D.T. Iso la tion a n d in vestig a tio n o f lim e
m o n tm o rillon ite crystalline reaction p roduct. H ighw ay R esearch
Board, Bulletin 304, 1961.
[38] Hilt, G.H. and Davidson, D.T. Lim e fixation in c la y e y so ils . H ighw ay
Research Board. Bulletin 262,1960.
[39] Houben, H. and Guiilaud, H. A com prehensive g u id e to E arth
C onstruction . Intermediate Technology Publications. London 1989.
[40] Ingles, O.G. and Metcalf, J.B. So/7 Stabilisation. Butterworths, Sydney,
1972.
[41] Ingles, O.G. S o il chem istry re levan t to the eng ineering b e h a v io u r o f
so ils . Soil Mechanics - Selected Topics. Edited by I.K. Lee. Butterworth
and Co., London, 1968.
[42] Labour Office International Labour Office Sm all-sca le m a n u fa c tu re o f
s ta b ilis e d s o il b locks. International and The United Nations Industrial
Development Organisation, Geneva, 1987.
[43] Kateregg, J.K., Im provem ent a n d u se o f Earth C on struc tio n P ro d u c ts
fo r L o w C os t H ousing. E & F,N Spon Ltd., London, 1983.
[44] Kennedy, T.W., Smith, R., Holmgreen, R.J. (Jnr), and Tahmoressi, M. A n
evaluation o f lim e and cem ent stab ilisa tion . Transportation Research
Board, National Research Council, Washington, D.C., 1987.
[45] Khalili, N. C eram ic H ouses - h o w to b u ild y o u r own. Harper & Row,
San Francisco. 1986.
193

[46] Lambe, T.E. and Whitman, R..V. S o il M echan ics. John Wiley and Sons,
Inc., New York, 1969.
[47] Lambe, T.W. , and Moh, Z.C. , Im pro vem en t o f s trength o f s o il-cem en t
w ith additives. HRB Bulletin 183, 38-47 (1957).
[48] L a te rite s o il eng ineering . Gidigasu, M.D. , Elsevier. Amsterdam, 1976.
[49] Lee, I.K., White, W. and ingles, O.G. G eo techn ica l E ng ineering .
Pitman Publishing Inc., Massachusetts, 1983.
[50] Lees, G., Abdelkater, M.O. and Hamdani, S.K. E ffect o f th e c la y fraction
on so m e m ech an ica l p ro perties o f s o iH im e m ixtures. The Journal of
the Institution of Highway Engineers, November 1982.
[51] Maclean, D.J., Robinson, P.J.M , and Webb, S.B. , “ A n in ves tig a tio n o f
the s tab ilisation o f a h e a v y d a y s o il with cem en t fo r ro a d
c o n s tru c tio n ” Roads and Road Construction 30: 287 - 292 (1952)
[52] M ech an ism s o f s o il s tab ilisation . Commonwealth Scientific and
Industrial Research Organisation Division of Soil Mechanics. Melbourne,
Australia, 1964.
[53] Middleton G.F. B u ild y o u r h o u se o f earth. Victoria, Angus and
Robertson, 1975.
[54] Mitchell, J.K. Fundam enta ls o f S o il B ehaviour. John Wiley and Sons,
New York, 1969.
[55] Mukerji, K. S tab ilisers a n d m ortars (fo r com p ressed earth b locks).
Product Information, CRATerre, Eschborn, Allemagne, 1994.
194

[56] Middleton, G.F., E arth -w a ll C onstruction. Bulletin no. 3, Department of
Housing and Construction, Canberra, 1987.
[57] Nelson, J.D. E xpansive so ils : p ro b lem s a n d practice. J Wiley Ltd,
New York, U.S.A, 1992.
[58] Norton, S. B uild ing with E arth: a H an d book. Intermediate Technology
Publications, London, 1986.
[59] Ozkan, E. and Al-Herbish, M.S., A n exp erim enta l s tu d y o f the c ritic a l
p ro p erties o f p ressed and s tab ilised earth bricks. Architectural
Science Review. 1995, 38.
[60] Roberg, C.W. The use o f so il-cem ent as a construction m ateria l. MSc
Thesis, University of the Witwatersrand, Johannesburg, 1994.
[61] Rowlands, G.O., Fiht, M.A., and Delpak, R. Lim e an d the p la s tic ity o f
clays. The Journal of the Institution of Highways and Transportation,
May 1987, Vol. 34 No. 5.
[62] Schroeder, W.L. S oils in C onstruction. John Wiley & sons, New York,
1984.
[63] Scott, C.R. A n in troduction to S o il M echan ics a n d F ou n d a tio n s .
Applied Science Publishers Ltd., London, 1974.
[64] S o il s tab ilisation w ith P ortland c e m e n t Highway Research Board,
Bulletin 292, 1961.
195

Author Rix C G
Name of thesis Stabilisation Of A Highly Plastic Clay Soil For The Production Of Compressed Earth Blocks Rix C G 1998
PUBLISHER: University of the Witwatersrand, Johannesburg
©2013
LEGAL NOTICES:
Copyright Notice: All materials on the Un i ve r s i t y o f the Wi twa te r s rand , Johannesbu rg L ib ra ry website are protected by South African copyright law and may not be distributed, transmitted, displayed, or otherwise published in any format, without the prior written permission of the copyright owner.
Disclaimer and Terms of Use: Provided that you maintain all copyright and other notices contained therein, you may download material (one machine readable copy and one print copy per page) for your personal and/or educational non-commercial use only.
The University of the Witwatersrand, Johannesburg, is not responsible for any errors or omissions and excludes any and all liability for any errors in or omissions from the information on the Library website.