Embed Size (px)
Citation preview
STA 256: Statistics and Probability I
Al Nosedal.University of Toronto.
Fall 2017
Al Nosedal. University of Toronto. STA 256: Statistics and Probability I
My momma always said: ”Life was like a box of chocolates. Younever know what you’re gonna get.”
Forrest Gump.
Al Nosedal. University of Toronto. STA 256: Statistics and Probability I
Experiment, outcome, sample space, and sample point
When you toss a coin. It comes up heads or tails. Those are theonly possibilities we allow. Tossing the coin is called anexperiment. The results, namely H (heads) and T (tails) arecalled outcomes. There are only two outcomes here and noneother. This set of outcomes namely, H, T is called a samplespace. Each of the outcomes H and T is called a sample point.
Al Nosedal. University of Toronto. STA 256: Statistics and Probability I
Sample space
Now suppose that you toss a coin twice in succession. Then thereare four possible outcomes, HH, HT, TH, TT. These are thesample points in the sample space HH, HT, TH, TT.We will denote the sample space by S.
Al Nosedal. University of Toronto. STA 256: Statistics and Probability I
Event
An event is a set of sample points. In the example of tossing acoin twice in succession, the event, ”the first toss results in heads”,is the set HH, HT.Let A and B be events. By A ⊂ B (read, ” A is a subset of B ”)we mean that every point that is in A is also in B. If A ⊂ B andB ⊂ A, then A and B have to consist of the same points. In thatcase we write A = B.
Al Nosedal. University of Toronto. STA 256: Statistics and Probability I
Definitions
An experiment is the process by which an observation ismade.
A simple event is an event that cannot be decomposed.Each simple event corresponds to one and only one samplepoint. The letter E with a subscript will be used to denote asimple event or the corresponding sample point.
The sample space associated with an experiment is the setconsisting of all possible sample points. A sample space willbe denoted by S.
Al Nosedal. University of Toronto. STA 256: Statistics and Probability I
Definitions
A discrete sample space is one that contains either a finiteor a countable number of distinct sample points.
An event in a discrete random sample space S is a collectionof sample points - that is, any subset of S.
Al Nosedal. University of Toronto. STA 256: Statistics and Probability I
Union of events
If A and B are events, then, ”A or B”, is also an event denoted byA ∪ B. For example, let A be: ”the first toss results in heads”, andB be: ”the second toss results in tails”, is the set HH, HT, TT.Thus A ∪ B consists of all points that are either in A or in B.
Al Nosedal. University of Toronto. STA 256: Statistics and Probability I
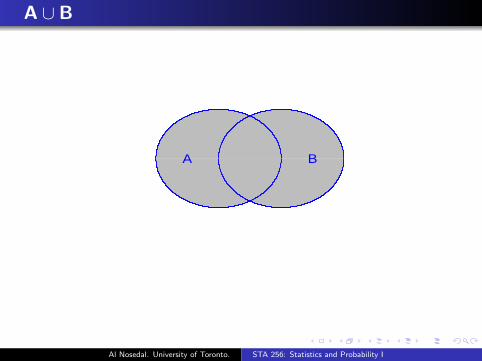
A ∪ B
BA
Al Nosedal. University of Toronto. STA 256: Statistics and Probability I
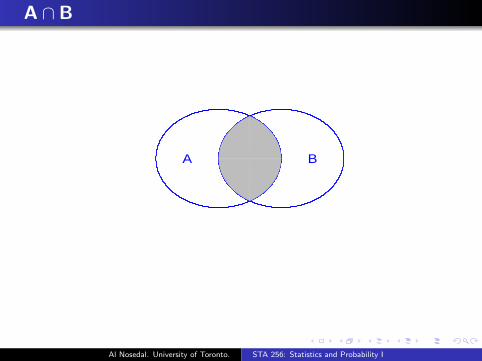
Intersection of events
The event ”A and B”, is denoted by A ∩ B. For example, if A andB are the events defined above, then A ∩ B is the event: ”the firsttoss results in heads and the second toss results in tails”, which isthe set HT. Thus A ∩ B consists of all points that belong toboth A and B.
Al Nosedal. University of Toronto. STA 256: Statistics and Probability I
A ∩ B
BA
Al Nosedal. University of Toronto. STA 256: Statistics and Probability I
Empty set
The empty set, denoted by ∅, contains no points. It is theimpossible event. For instance, if A is the event that the first tossresults in heads and C is the event that the first toss results intails, then A ∩ C is the event that ”the first toss results in headsand the first toss results in tails”. It is the empty set.If A ∩ C = ∅ we say that the events A and C are mutuallyexclusive. That means there are no sample points that arecommon to A and C. The events A and C in the last paragraphare mutually exclusive.
Al Nosedal. University of Toronto. STA 256: Statistics and Probability I

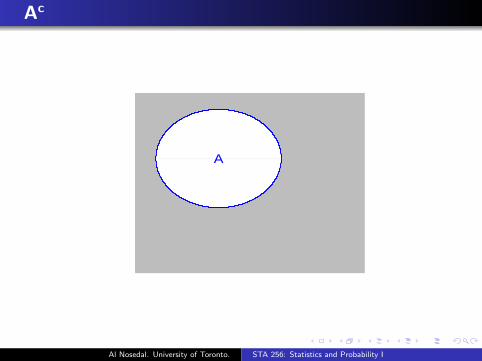
Complement
The event that ”A does not occur” is called the complement of Aand is denoted by Ac. It consists of all points that are not in A. IfA is the event that the first toss results in heads, then Ac is theevent that the first toss does not result in heads. It is the set:TH, TT.Note that A ∪ Ac = S and A ∩ Ac = ∅.
Al Nosedal. University of Toronto. STA 256: Statistics and Probability I
Ac
A
Al Nosedal. University of Toronto. STA 256: Statistics and Probability I
Example
A survey is made of a population to find out how many of themown a home, how many own a car and how many are married. LetH, C and M stand respectively for the events, owning a home,owning a car and being married. What do the following symbolsrepresent?1. H ∩Mc.2. (H ∪M)c.3. Hc ∩Mc.4. (H ∪M) ∩ C.
Al Nosedal. University of Toronto. STA 256: Statistics and Probability I
Solution
1. H ∩Mc corresponds to owning home and not married.2. The event (H ∪M)c it is the event of neither owning a homenor being married.3. This is the event of not owning home and not married. Notethat this is the same as the event (2). That is(H ∪M)c = Hc ∩Mc .4. (H ∪M) ∩ C corresponds to owning a home or married andowning car.
Al Nosedal. University of Toronto. STA 256: Statistics and Probability I
DeMorgan’s Laws
(A ∩ B)c = Ac ∪ Bc
(A ∪ B)c = Ac ∩ Bc
(Please, do Exercise 2.3.)
Al Nosedal. University of Toronto. STA 256: Statistics and Probability I

Probability: Colors of M & M’s
If you draw an M & M candy at random from a bag of the candies,the candy you draw will have one of the seven colors. Theprobability of drawing each color depends on the proportion ofeach color among all candies made. Here is the distribution formilk chocolate M & M’s:
Color Purple Yellow Red
Probability 0.2 0.2 0.2
Color Orange Brown Green Blue
Probability 0.1 0.1 0.1 ?
Al Nosedal. University of Toronto. STA 256: Statistics and Probability I
Colors of M & M’s (cont.)
a) What must be the probability of drawing a blue candy?b) What is the probability that you do not draw a brown candy?c) What is the probability that the candy you draw is either yellow,orange, or red?
Al Nosedal. University of Toronto. STA 256: Statistics and Probability I
Solution
a. Probability of Blue = P(Blue) = 1− 0.9 = 0.1b. P(Not Brown) = 1 - P(Brown) = 1− 0.1 = 0.9c. P(Yellow or Orange or Red) = 0.2 + 0.1 + 0.2 = 0.5
Al Nosedal. University of Toronto. STA 256: Statistics and Probability I
Definition 2.6
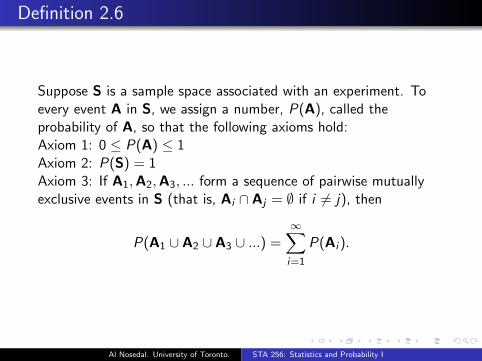
Suppose S is a sample space associated with an experiment. Toevery event A in S, we assign a number, P(A), called theprobability of A, so that the following axioms hold:Axiom 1: 0 ≤ P(A) ≤ 1Axiom 2: P(S) = 1Axiom 3: If A1,A2,A3, ... form a sequence of pairwise mutuallyexclusive events in S (that is, Ai ∩ Aj = ∅ if i 6= j), then
P(A1 ∪ A2 ∪ A3 ∪ ...) =∞∑i=1
P(Ai ).
Al Nosedal. University of Toronto. STA 256: Statistics and Probability I
Exercise 2.9
Every person’s blood type is A,B,AB, or O. In addition, eachindividual either has the Rhesus (Rh) factor (+) or does not (−).A medical technician records a person’s blood type and Rh factor.List the sample space for this experiment.
Al Nosedal. University of Toronto. STA 256: Statistics and Probability I

Solution
S = A+,B+,AB+,O+,A−,B−,AB−,O−
Al Nosedal. University of Toronto. STA 256: Statistics and Probability I
Exercise 2.11
A sample space consists of five simple events, E1, E2, E3, E4, andE5.a. If P(E1) = P(E2) = 0.15, P(E3) = 0.4, and P(E4) = 2P(E5),find the probabilities of E4 and E5.b. If P(E1) = 3P(E2) = 0.3, find the probabilities of the remainingsimple events if you know that the remaining simple events areequally probable.
Al Nosedal. University of Toronto. STA 256: Statistics and Probability I
Solution
a. P(S) = P(E1) + P(E2) + P(E3) + P(E4) + P(E5) = 10.15 + 0.15 + 0.40 + 3P(E5) = 1So, P(E5) = 0.10 and P(E4) = 0.20.
b. P(S) = P(E1) + P(E2) + P(E3) + P(E4) + P(E5) = 1If P(E1) = 3P(E2) = 0.3, then P(E2) = 0.10. Which implies thatP(E3) + P(E4) + P(E5) = 0.6. Thus, they are all equal to 0.2.
Al Nosedal. University of Toronto. STA 256: Statistics and Probability I
Exercise 2.29
Two additional jurors are needed to complete a jury for a criminaltrial. There are six prospective jurors, two women and four men.Two jurors are randomly selected from the six available.a. Define the experiment and describe one sample point. Assumethat you need describe only the two jurors chosen and not theorder in which they were selected.b. List the sample space associated with this experiment.c. What is the probability that both of the jurors selected arewomen?
Al Nosedal. University of Toronto. STA 256: Statistics and Probability I
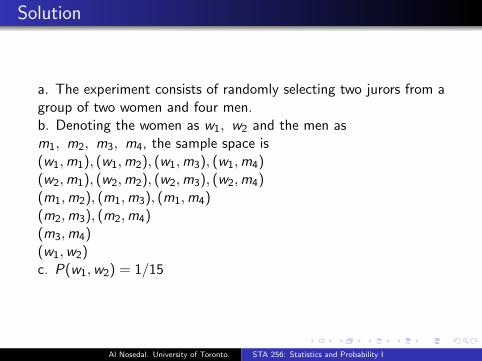
Solution
a. The experiment consists of randomly selecting two jurors from agroup of two women and four men.b. Denoting the women as w1, w2 and the men asm1, m2, m3, m4, the sample space is(w1,m1), (w1,m2), (w1,m3), (w1,m4)(w2,m1), (w2,m2), (w2,m3), (w2,m4)(m1,m2), (m1,m3), (m1,m4)(m2,m3), (m2,m4)(m3,m4)(w1,w2)c. P(w1,w2) = 1/15
Al Nosedal. University of Toronto. STA 256: Statistics and Probability I
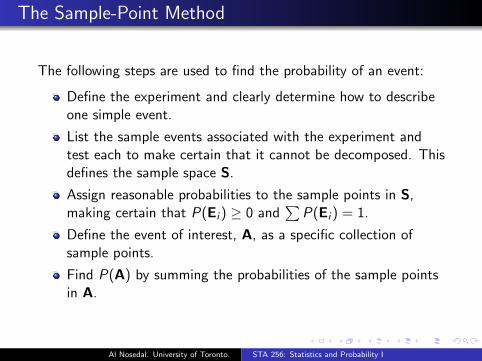
The Sample-Point Method
The following steps are used to find the probability of an event:
Define the experiment and clearly determine how to describeone simple event.
List the sample events associated with the experiment andtest each to make certain that it cannot be decomposed. Thisdefines the sample space S.
Assign reasonable probabilities to the sample points in S,making certain that P(Ei ) ≥ 0 and
∑P(Ei ) = 1.
Define the event of interest, A, as a specific collection ofsample points.
Find P(A) by summing the probabilities of the sample pointsin A.
Al Nosedal. University of Toronto. STA 256: Statistics and Probability I
Theorem 2.1
With m elements a1, a2, ..., am and n elements b1, b2, ..., bn, it ispossible to form mn = m × n pairs containing one element fromeach group.Proof.We can use a table or a tree diagram to verify this. Please, seepage 41.
Al Nosedal. University of Toronto. STA 256: Statistics and Probability I

Problem
How many different committees consisting of a president and asecretary can be selected from a group of five individuals?
Al Nosedal. University of Toronto. STA 256: Statistics and Probability I
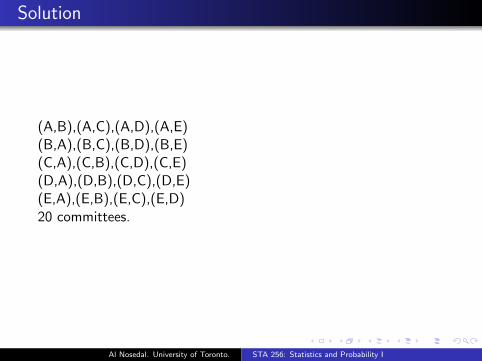
Solution
(A,B),(A,C),(A,D),(A,E)(B,A),(B,C),(B,D),(B,E)(C,A),(C,B),(C,D),(C,E)(D,A),(D,B),(D,C),(D,E)(E,A),(E,B),(E,C),(E,D)20 committees.
Al Nosedal. University of Toronto. STA 256: Statistics and Probability I
Definition
An ordered arrangement of r distinct objects is called apermutation. The number of ways of ordering n distinct objectstaken r at a time will be designated by the symbol Pn
r .
Al Nosedal. University of Toronto. STA 256: Statistics and Probability I
Theorem 2.2
Pnr = n(n − 1)(n − 2)...(n − r + 1) = n!
(n−r)! .
Al Nosedal. University of Toronto. STA 256: Statistics and Probability I

Example
Suppose that an assembly operation in a manufacturing plantinvolves four steps, which can be performed in any sequence. If themanufacturer wishes to compare the assembly time for each ofthese sequences, how many different sequences will be involved inthe experiment?
Al Nosedal. University of Toronto. STA 256: Statistics and Probability I
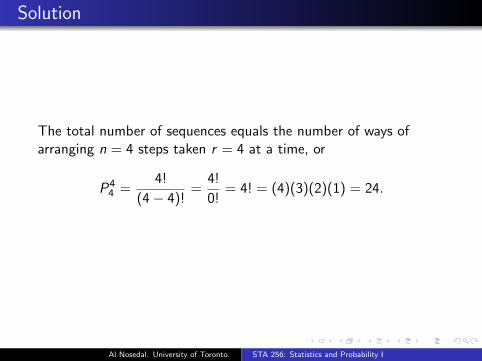
Solution
The total number of sequences equals the number of ways ofarranging n = 4 steps taken r = 4 at a time, or
P44 =
4!
(4− 4)!=
4!
0!= 4! = (4)(3)(2)(1) = 24.
Al Nosedal. University of Toronto. STA 256: Statistics and Probability I
Problem
How many teams consisting of two individuals can be selectedfrom a group of five individuals?
Al Nosedal. University of Toronto. STA 256: Statistics and Probability I
Solution
A,B,A,C,A,D,A,E, B,C,B,D,B,E, C,D,C,E,D,E.10 teams.
Al Nosedal. University of Toronto. STA 256: Statistics and Probability I
Definition
The number of combinations of n objects taken r at a time is thenumber of subsets, each of size r , that can be formed from the nobjects. This number will be denoted by Cn
r .
Al Nosedal. University of Toronto. STA 256: Statistics and Probability I
Theorem 2.4
The number of unordered subsets of size r chosen (withoutreplacement) from n available objects is
Cnr =
Pnr
r !=
n!
r !(n − r)!=
(n
r
).
Al Nosedal. University of Toronto. STA 256: Statistics and Probability I
Problem
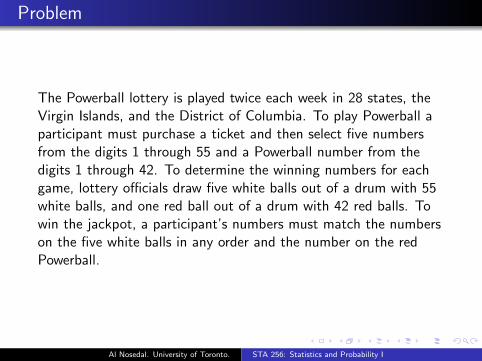
The Powerball lottery is played twice each week in 28 states, theVirgin Islands, and the District of Columbia. To play Powerball aparticipant must purchase a ticket and then select five numbersfrom the digits 1 through 55 and a Powerball number from thedigits 1 through 42. To determine the winning numbers for eachgame, lottery officials draw five white balls out of a drum with 55white balls, and one red ball out of a drum with 42 red balls. Towin the jackpot, a participant’s numbers must match the numberson the five white balls in any order and the number on the redPowerball.
Al Nosedal. University of Toronto. STA 256: Statistics and Probability I

Problem (cont.)
Eight coworkers at the ConAgra Foods plant in Lincoln, Nebraska,claimed the record $ 365 million jackpot on February 18, 2006, bymatching the numbers 15-17-43-44-49 and the Powerball number29. A variety of other cash prizes are awarded each time the gameis played. For instance, a prize of $ 200,000 is paid if theparticipant’s five numbers match the numbers on the five whiteballs.a. Compute the number of ways the first five numbers can beselected.b. What is the probability of winning a prize of $200,000 bymatching the numbers on the five white balls?c. What is the probability of winning the Powerball jackpot?
Al Nosedal. University of Toronto. STA 256: Statistics and Probability I
Solution
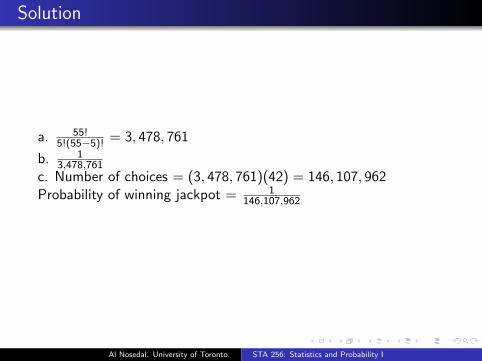
a. 55!5!(55−5)! = 3, 478, 761
b. 13,478,761
c. Number of choices = (3, 478, 761)(42) = 146, 107, 962Probability of winning jackpot = 1
146,107,962
Al Nosedal. University of Toronto. STA 256: Statistics and Probability I
Conditional Probability
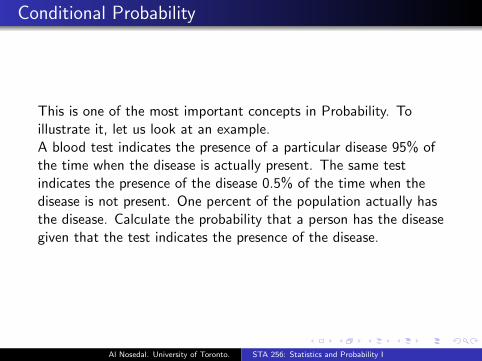
This is one of the most important concepts in Probability. Toillustrate it, let us look at an example.A blood test indicates the presence of a particular disease 95% ofthe time when the disease is actually present. The same testindicates the presence of the disease 0.5% of the time when thedisease is not present. One percent of the population actually hasthe disease. Calculate the probability that a person has the diseasegiven that the test indicates the presence of the disease.
Al Nosedal. University of Toronto. STA 256: Statistics and Probability I

Definition
The conditional probability of an event A, given that an event Bhas occurred, is equal to
P(A|B) =P(A ∩ B)
P(B),
provided P(B) > 0. The symbol P(A|B) is read ”probability of Agiven B”.
Al Nosedal. University of Toronto. STA 256: Statistics and Probability I
Exercise 2.71
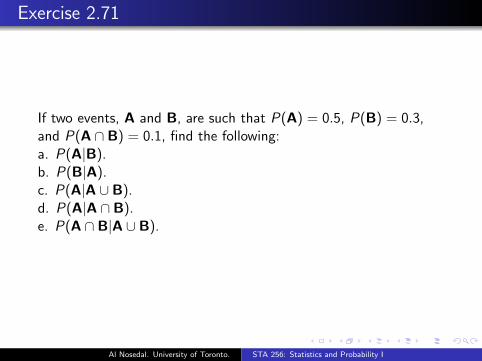
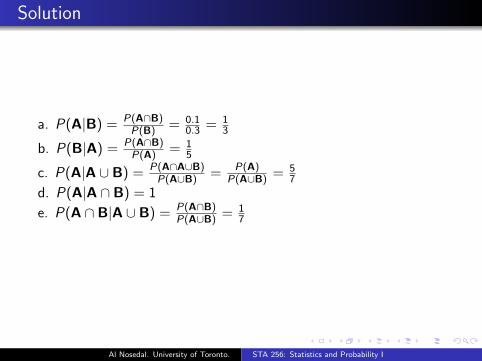
If two events, A and B, are such that P(A) = 0.5, P(B) = 0.3,and P(A ∩ B) = 0.1, find the following:a. P(A|B).b. P(B|A).c. P(A|A ∪ B).d. P(A|A ∩ B).e. P(A ∩ B|A ∪ B).
Al Nosedal. University of Toronto. STA 256: Statistics and Probability I
Solution
a. P(A|B) = P(A∩B)P(B) = 0.1
0.3 = 13
b. P(B|A) = P(A∩B)P(A) = 1
5
c. P(A|A ∪ B) = P(A∩A∪B)P(A∪B) = P(A)
P(A∪B) = 57
d. P(A|A ∩ B) = 1
e. P(A ∩ B|A ∪ B) = P(A∩B)P(A∪B) = 1
7
Al Nosedal. University of Toronto. STA 256: Statistics and Probability I
Example
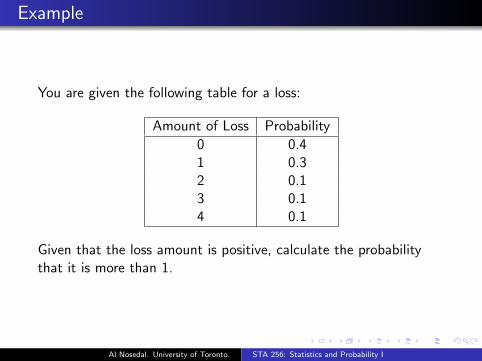
You are given the following table for a loss:
Amount of Loss Probability
0 0.41 0.32 0.13 0.14 0.1
Given that the loss amount is positive, calculate the probabilitythat it is more than 1.
Al Nosedal. University of Toronto. STA 256: Statistics and Probability I
Solution
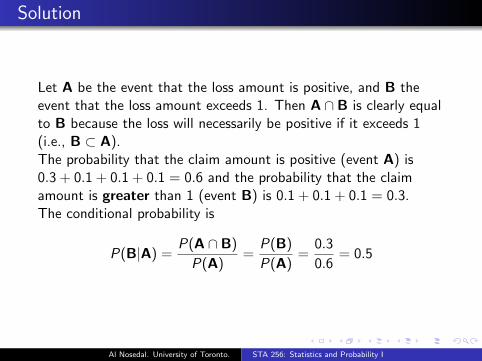
Let A be the event that the loss amount is positive, and B theevent that the loss amount exceeds 1. Then A ∩ B is clearly equalto B because the loss will necessarily be positive if it exceeds 1(i.e., B ⊂ A).The probability that the claim amount is positive (event A) is0.3 + 0.1 + 0.1 + 0.1 = 0.6 and the probability that the claimamount is greater than 1 (event B) is 0.1 + 0.1 + 0.1 = 0.3.The conditional probability is
P(B|A) =P(A ∩ B)
P(A)=
P(B)
P(A)=
0.3
0.6= 0.5
Al Nosedal. University of Toronto. STA 256: Statistics and Probability I
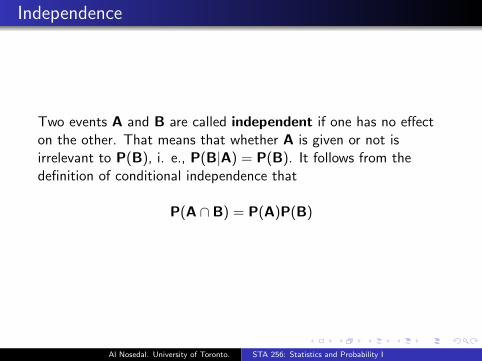
Independence
Two events A and B are called independent if one has no effecton the other. That means that whether A is given or not isirrelevant to P(B), i. e., P(B|A) = P(B). It follows from thedefinition of conditional independence that
P(A ∩ B) = P(A)P(B)
Al Nosedal. University of Toronto. STA 256: Statistics and Probability I

Definition
Two events A and B are said to be independent if any one of thefollowing holds:
P(A|B) = P(A),
P(B|A) = P(B),
P(A ∩ B) = P(A)P(B).
Otherwise, the events are said to be dependent.
Al Nosedal. University of Toronto. STA 256: Statistics and Probability I

Exercise 2.79
Suppose that A and B are mutually exclusive events, with0 < P(A) < 1 and 0 < P(B) < 1. Are A and B independent?Prove your answer.
Al Nosedal. University of Toronto. STA 256: Statistics and Probability I
Example
In a certain population, 60% own a car, 30% own a house and20% own a house and a car. Determine whether or not the eventsthat a person owns a car and that a person owns a house areindependent.
Al Nosedal. University of Toronto. STA 256: Statistics and Probability I
Solution
Let A be the event that the person owns a car and B the eventthat the person owns a house. P(A) = 0.6, P(B) = 0.3 andP(A ∩ B) = 0.2 6= 0.18 = P(A)P(B). Hence the two events arenot independent.
Al Nosedal. University of Toronto. STA 256: Statistics and Probability I
Example
Workplace accidents are categorized as minor, moderate andsevere. The probability that a given accident is minor is 0.5, that itis moderate is 0.4, and that it is severe is 0.1. Two accidents occurindependently in one month. Calculate the probability that neitheraccident is severe and at most one is moderate.
Al Nosedal. University of Toronto. STA 256: Statistics and Probability I
Solution
Let us denote by L1, M1 and S1 respectively the events that thefirst accident is minor (little), moderate and severe. Similarly forthe second accident denote with 2 as a subscript. Since neithershould be S and at most one should be M, the only possibilitiesare L1 ∩ L2 or L1 ∩M2 or M1 ∩ L2. Note that these possibilities aremutually exclusive. Since the two accidents are independent, therequired probability is
P(L1)P(L2) + P(L1)P(M2) + P(M1)P(L2)
= (0.5)(0.5) + (0.5)(0.4) + (0.4)(0.5) = 0.65
Al Nosedal. University of Toronto. STA 256: Statistics and Probability I
Example
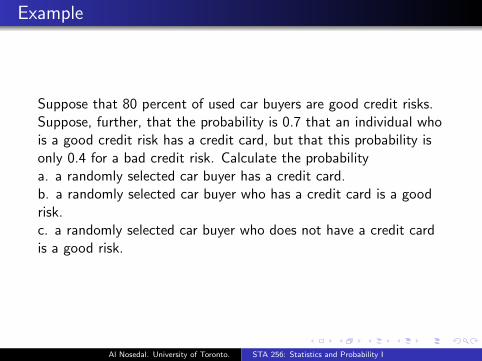
Suppose that 80 percent of used car buyers are good credit risks.Suppose, further, that the probability is 0.7 that an individual whois a good credit risk has a credit card, but that this probability isonly 0.4 for a bad credit risk. Calculate the probabilitya. a randomly selected car buyer has a credit card.b. a randomly selected car buyer who has a credit card is a goodrisk.c. a randomly selected car buyer who does not have a credit cardis a good risk.
Al Nosedal. University of Toronto. STA 256: Statistics and Probability I
Solution
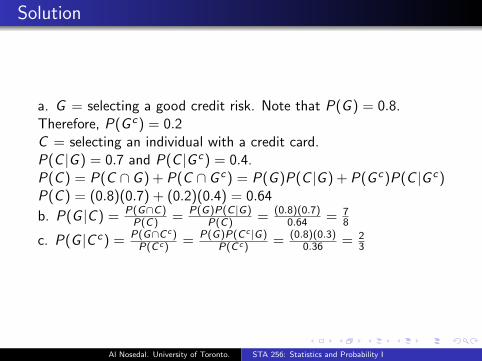
a. G = selecting a good credit risk. Note that P(G ) = 0.8.Therefore, P(G c) = 0.2C = selecting an individual with a credit card.P(C |G ) = 0.7 and P(C |G c) = 0.4.P(C ) = P(C ∩G ) + P(C ∩G c) = P(G )P(C |G ) + P(G c)P(C |G c)P(C ) = (0.8)(0.7) + (0.2)(0.4) = 0.64
b. P(G |C ) = P(G∩C)P(C) = P(G)P(C |G)
P(C) = (0.8)(0.7)0.64 = 7
8
c. P(G |C c) = P(G∩C c )P(C c ) = P(G)P(C c |G)
P(C c ) = (0.8)(0.3)0.36 = 2
3
Al Nosedal. University of Toronto. STA 256: Statistics and Probability I
Example
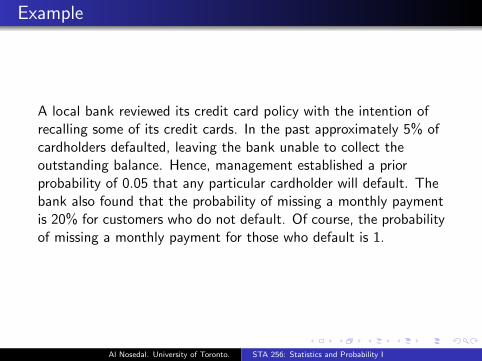
A local bank reviewed its credit card policy with the intention ofrecalling some of its credit cards. In the past approximately 5% ofcardholders defaulted, leaving the bank unable to collect theoutstanding balance. Hence, management established a priorprobability of 0.05 that any particular cardholder will default. Thebank also found that the probability of missing a monthly paymentis 20% for customers who do not default. Of course, the probabilityof missing a monthly payment for those who default is 1.
Al Nosedal. University of Toronto. STA 256: Statistics and Probability I
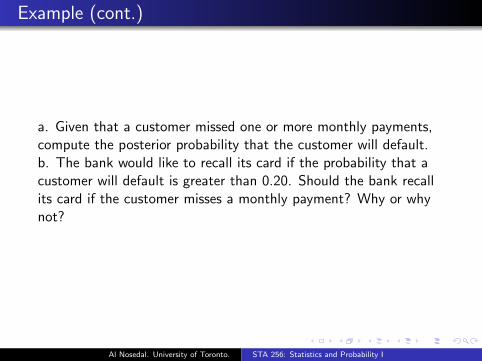
Example (cont.)
a. Given that a customer missed one or more monthly payments,compute the posterior probability that the customer will default.b. The bank would like to recall its card if the probability that acustomer will default is greater than 0.20. Should the bank recallits card if the customer misses a monthly payment? Why or whynot?
Al Nosedal. University of Toronto. STA 256: Statistics and Probability I
Solution
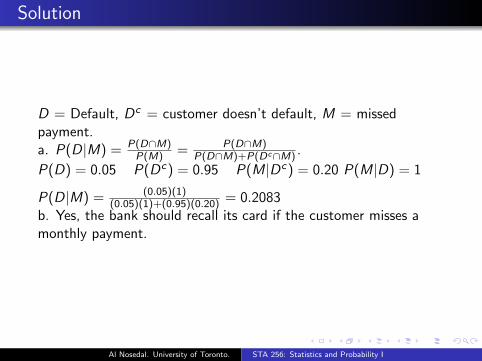
D = Default, Dc = customer doesn’t default, M = missedpayment.a. P(D|M) = P(D∩M)
P(M) = P(D∩M)P(D∩M)+P(Dc∩M) .
P(D) = 0.05 P(Dc) = 0.95 P(M|Dc) = 0.20 P(M|D) = 1
P(D|M) = (0.05)(1)(0.05)(1)+(0.95)(0.20) = 0.2083
b. Yes, the bank should recall its card if the customer misses amonthly payment.
Al Nosedal. University of Toronto. STA 256: Statistics and Probability I
The Multiplicative Law of Probability
The probability of the intersection of two events A and B is
P(A ∩ B) = P(A)P(B|A) = P(B)P(A|B).
If A and B are independent, then
P(A ∩ B) = P(A)P(B).
Proof.The multiplicative law follows directly from the definition ofconditional probability.
Al Nosedal. University of Toronto. STA 256: Statistics and Probability I
Theorem 2.6
The Additive Law of ProbabilityThe probability of the union of two events A and B is
P(A ∪ B) = P(A) + P(B)− P(A ∩ B).
If A and B are mutually exclusive events, P(A ∩ B) = 0 and
P(A ∪ B) = P(A) + P(B).
Al Nosedal. University of Toronto. STA 256: Statistics and Probability I

Theorem 2.7
If A is an event, then
P(A) = 1− P(Ac).
Al Nosedal. University of Toronto. STA 256: Statistics and Probability I
Exercise 2.85
If A and B are independent events, show that A and Bc are alsoindependent. Are Ac and Bc independent?
Al Nosedal. University of Toronto. STA 256: Statistics and Probability I
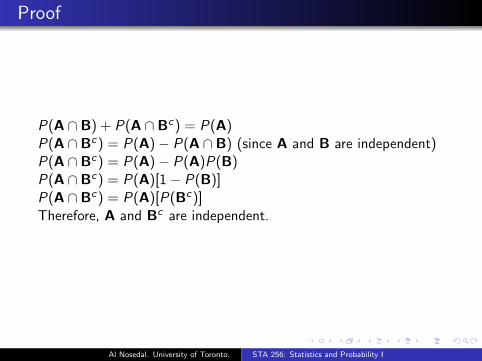
Proof
P(A ∩ B) + P(A ∩ Bc) = P(A)P(A ∩ Bc) = P(A)− P(A ∩ B) (since A and B are independent)P(A ∩ Bc) = P(A)− P(A)P(B)P(A ∩ Bc) = P(A)[1− P(B)]P(A ∩ Bc) = P(A)[P(Bc)]Therefore, A and Bc are independent.
Al Nosedal. University of Toronto. STA 256: Statistics and Probability I

Exercise 2.95
Two events A and B are such that P(A) = 0.2, P(B) = 0.3, andP(A ∪ B) = 0.4. Find the following:a. P(A ∩ B)b. P(Ac ∪ Bc)c. P(Ac ∩ Bc)d. P(Ac|B)
Al Nosedal. University of Toronto. STA 256: Statistics and Probability I
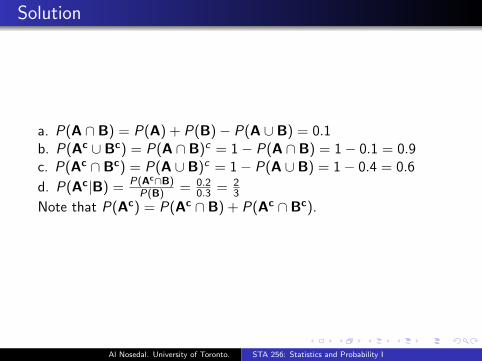
Solution
a. P(A ∩ B) = P(A) + P(B)− P(A ∪ B) = 0.1b. P(Ac ∪ Bc) = P(A ∩ B)c = 1− P(A ∩ B) = 1− 0.1 = 0.9c. P(Ac ∩ Bc) = P(A ∪ B)c = 1− P(A ∪ B) = 1− 0.4 = 0.6
d. P(Ac|B) = P(Ac∩B)P(B) = 0.2
0.3 = 23
Note that P(Ac) = P(Ac ∩ B) + P(Ac ∩ Bc).
Al Nosedal. University of Toronto. STA 256: Statistics and Probability I
Exercise 2.15
A football team has a probability of 0.75 of winning when playingany of the other four teams in its conference. If the games areindependent, what is the probability the team wins all itsconference games?
Al Nosedal. University of Toronto. STA 256: Statistics and Probability I
Solution
Let Wi denote the event our football team wins its ith conferencegame.P(W1 ∩W2 ∩W3 ∩W4) = P(W1)P(W2)P(W3)P(W4) =(0.75)4 = 81
256 ≈ 0.3164
Al Nosedal. University of Toronto. STA 256: Statistics and Probability I
Example
Observation of a waiting line at a medical clinic indicates theprobability that a new arrival will be an emergency case is p = 1/6.Find the probability that the rth patient is the first emergencycase. (Assume that conditions of arriving patients representindependent events.)
Al Nosedal. University of Toronto. STA 256: Statistics and Probability I
Solution
The experiment consists of watching patient arrivals until the firstemergency case appears. Then the sample points for theexperiment areEi : The ith patient is the first emergency case, for i = 1, 2, ...Because only one sample point falls in the event of interest,P(rth patient is the first emergency case) = P(Er ).Now define Ai to denote the event that the ith arrival is not anemergency case. Then we can represent Er as the intersection
Er = A1 ∩ A2 ∩ A3 ∩ ... ∩ Ar−1 ∩ Acr .
Applying the multiplicative law and because the eventsA1, A2, A3..., Ar−1 and Ac
r are independent, it follows that
P(Er ) = P(A1)P(A2)...P(Ar−1) = (1− p)r−1p
P(Er ) = (5/6)r−1(1/6) r = 1, 2, 3, ...
Al Nosedal. University of Toronto. STA 256: Statistics and Probability I
The Event-Composition Method
A summary of the steps used in the event-composition methodfollows:1. Define the experiment.2. Visualize the nature of the sample points. Identify a few toclarify your thinking.3. Write an equation expressing the event of interest - say, A - asa composition of two or more events, using unions, intersections,and/or complements.4. Apply the additive and multiplicative laws of probability to thecompositions obtained in step 3 to find P(A).
Al Nosedal. University of Toronto. STA 256: Statistics and Probability I

Problem
Ten percent of a company’s life insurance policyholders aresmokers. The rest are nonsmokers. For each nonsmoker, theprobability of dying during the year is 0.01. For each smoker, theprobability of dying during the year is 0.05. Given that apolicyholder has died, what is the probability that the policyholderwas a smoker?
Al Nosedal. University of Toronto. STA 256: Statistics and Probability I
Solution
Let S = smoker, N = Nonsmoker, D = Dying, and Ω = samplespace.Note that S ∪ N = Ω and S ∩ N = ∅. We also have thatP(S) = 0.10, P(N) = 0.90, P(D|N) = 0.01, and P(D|S) = 0.05.
P(S |D) =P(S ∩ D)
P(D)=
P(D|S)P(S)
P(D|S)P(S) + P(D|N)P(N)
P(S |D) =(0.05)(0.10)
(0.05)(0.10) + (0.01)(0.90)=
5
14
Al Nosedal. University of Toronto. STA 256: Statistics and Probability I
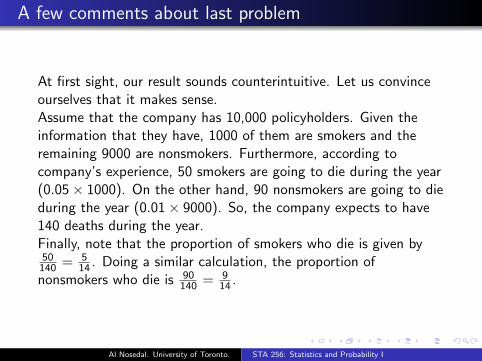
A few comments about last problem
At first sight, our result sounds counterintuitive. Let us convinceourselves that it makes sense.Assume that the company has 10,000 policyholders. Given theinformation that they have, 1000 of them are smokers and theremaining 9000 are nonsmokers. Furthermore, according tocompany’s experience, 50 smokers are going to die during the year(0.05× 1000). On the other hand, 90 nonsmokers are going to dieduring the year (0.01× 9000). So, the company expects to have140 deaths during the year.Finally, note that the proportion of smokers who die is given by50140 = 5
14 . Doing a similar calculation, the proportion ofnonsmokers who die is 90
140 = 914 .
Al Nosedal. University of Toronto. STA 256: Statistics and Probability I
Problem
The probability that a randomly chosen male has a circulationproblem is 0.25. Males who have a circulation problem are twice aslikely to be smokers as those who do not have a circulationproblem. What is the conditional probability that a male has acirculation problem, given that he is a smoker?
Al Nosedal. University of Toronto. STA 256: Statistics and Probability I
Solution
Let C stand for circulation problem and S for smoker. We aregiven that P(C ) = 0.25, and that P(S |C ) = 2P(S |C c). We needto find P(C |S).
P(C |S) =P(S |C )P(C )
P(S |C )P(C ) + P(S |C c)P(C c)
P(C |S) =P(S |C )(0.25)
P(S |C )(0.25) + (1/2)P(S |C )(0.75)= 0.4.
Al Nosedal. University of Toronto. STA 256: Statistics and Probability I
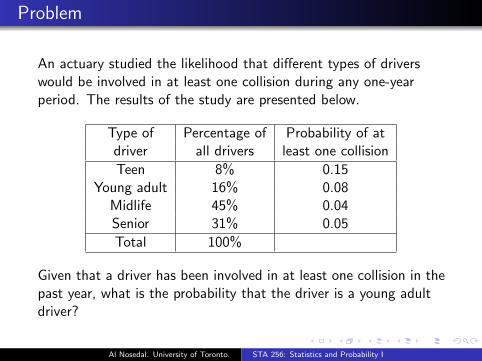
Problem
An actuary studied the likelihood that different types of driverswould be involved in at least one collision during any one-yearperiod. The results of the study are presented below.
Type of Percentage of Probability of atdriver all drivers least one collision
Teen 8% 0.15Young adult 16% 0.08
Midlife 45% 0.04Senior 31% 0.05
Total 100%
Given that a driver has been involved in at least one collision in thepast year, what is the probability that the driver is a young adultdriver?
Al Nosedal. University of Toronto. STA 256: Statistics and Probability I
Solution
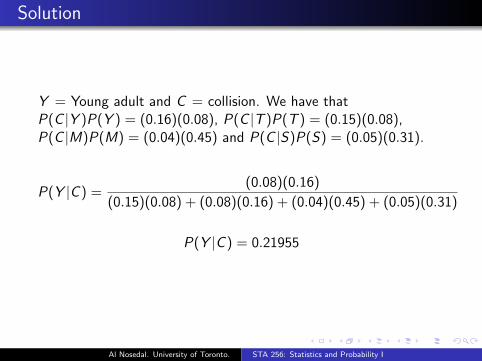
Y = Young adult and C = collision. We have thatP(C |Y )P(Y ) = (0.16)(0.08), P(C |T )P(T ) = (0.15)(0.08),P(C |M)P(M) = (0.04)(0.45) and P(C |S)P(S) = (0.05)(0.31).
P(Y |C ) =(0.08)(0.16)
(0.15)(0.08) + (0.08)(0.16) + (0.04)(0.45) + (0.05)(0.31)
P(Y |C ) = 0.21955
Al Nosedal. University of Toronto. STA 256: Statistics and Probability I
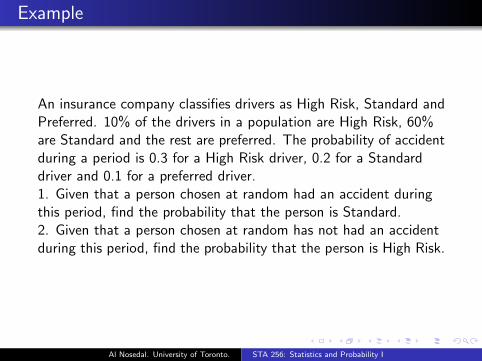
Example
An insurance company classifies drivers as High Risk, Standard andPreferred. 10% of the drivers in a population are High Risk, 60%are Standard and the rest are preferred. The probability of accidentduring a period is 0.3 for a High Risk driver, 0.2 for a Standarddriver and 0.1 for a preferred driver.1. Given that a person chosen at random had an accident duringthis period, find the probability that the person is Standard.2. Given that a person chosen at random has not had an accidentduring this period, find the probability that the person is High Risk.
Al Nosedal. University of Toronto. STA 256: Statistics and Probability I
Solution
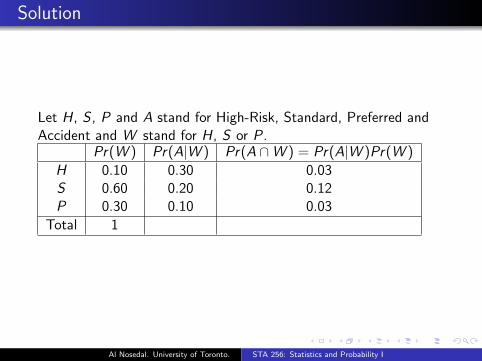
Let H, S , P and A stand for High-Risk, Standard, Preferred andAccident and W stand for H, S or P.
Pr(W ) Pr(A|W ) Pr(A ∩W ) = Pr(A|W )Pr(W )
H 0.10 0.30 0.03S 0.60 0.20 0.12P 0.30 0.10 0.03
Total 1
Al Nosedal. University of Toronto. STA 256: Statistics and Probability I
Solution (1)
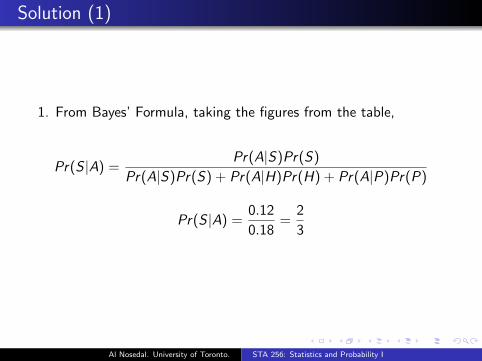
1. From Bayes’ Formula, taking the figures from the table,
Pr(S |A) =Pr(A|S)Pr(S)
Pr(A|S)Pr(S) + Pr(A|H)Pr(H) + Pr(A|P)Pr(P)
Pr(S |A) =0.12
0.18=
2
3
Al Nosedal. University of Toronto. STA 256: Statistics and Probability I
Solution (2)
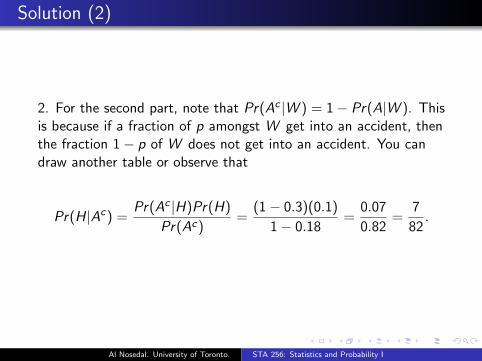
2. For the second part, note that Pr(Ac |W ) = 1− Pr(A|W ). Thisis because if a fraction of p amongst W get into an accident, thenthe fraction 1− p of W does not get into an accident. You candraw another table or observe that
Pr(H|Ac) =Pr(Ac |H)Pr(H)
Pr(Ac)=
(1− 0.3)(0.1)
1− 0.18=
0.07
0.82=
7
82.
Al Nosedal. University of Toronto. STA 256: Statistics and Probability I

Definition
For some positive integer k , let the sets B1,B2, ...,Bk be such that1.S = B1 ∪ B2 ∪ ... ∪ Bk .2.Bi ∩ Bj = ∅, for i 6= j .Then the collection of sets B1,B2, ...,Bk is said to be a partitionof S.
Al Nosedal. University of Toronto. STA 256: Statistics and Probability I
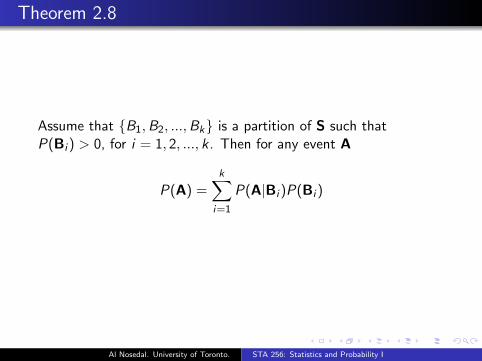
Theorem 2.8
Assume that B1,B2, ...,Bk is a partition of S such thatP(Bi ) > 0, for i = 1, 2, ..., k. Then for any event A
P(A) =k∑
i=1
P(A|Bi )P(Bi )
Al Nosedal. University of Toronto. STA 256: Statistics and Probability I
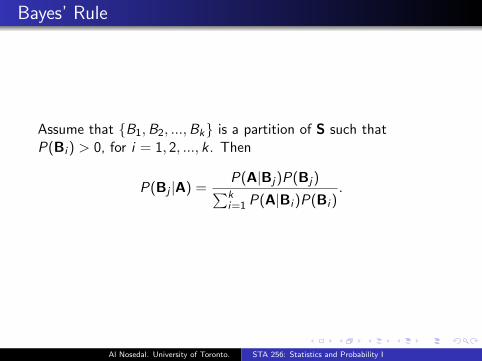
Bayes’ Rule
Assume that B1,B2, ...,Bk is a partition of S such thatP(Bi ) > 0, for i = 1, 2, ..., k. Then
P(Bj |A) =P(A|Bj)P(Bj)∑ki=1 P(A|Bi )P(Bi )
.
Al Nosedal. University of Toronto. STA 256: Statistics and Probability I
Definition
A random variable is a real-valued function for which the domainis a sample space.
Al Nosedal. University of Toronto. STA 256: Statistics and Probability I
Example
A fair die is thrown twice. The sample points are(1, 1), (1, 2), (1, 3), ..., (6, 6). There are 36 sample points. Let usassign the same probability 1/36 for each of these points. Supposewe are interested in the sum of the numbers of each outcome.Then we can define a random variable X = i + j associated withthe outcome (i , j). List the possible values of X and say what theprobability of each value is.
Al Nosedal. University of Toronto. STA 256: Statistics and Probability I
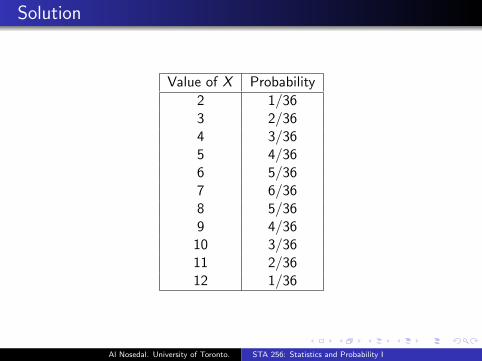
Solution
Value of X Probability
2 1/363 2/364 3/365 4/366 5/367 6/368 5/369 4/36
10 3/3611 2/3612 1/36
Al Nosedal. University of Toronto. STA 256: Statistics and Probability I

Definition
Let N and n represent the numbers of elements in the populationand sample, respectively. If the sampling is conducted in such away that each of the N!
n!(N−n)! samples has an equal probability ofbeing selected, the sampling is said to be random, and the result issaid to be a random sample.
Al Nosedal. University of Toronto. STA 256: Statistics and Probability I