Embed Size (px)
Citation preview
© University of London 2014 UL14/0741 Page 1 of 21 D1
~~ST104A ZA d0
This paper is not to be removed from the Examination Halls
UNIVERSITY OF LONDON ST104A ZA
BSc degrees and Diplomas for Graduates in Economics, Management, Finance and the Social Sciences, the Diplomas in Economics and Social Sciences and Access Route
Statistics 1
Wednesday, 14 May 2014 : 10:00 to 12:00
Candidates should answer THREE of the following FOUR questions: QUESTION 1 of Section A (50 marks) and TWO questions from Section B (25 marks each). Candidates are strongly advised to divide their time accordingly.
A list of formulae and extracts from statistical tables are provided after the final question on this paper.
Graph paper is provided at the end of this question paper. If used, it must be detached and fastened securely inside the answer book.
A calculator may be used when answering questions on this paper and it must comply in all respects with the specification given with your Admission Notice. The make and type of machine must be clearly stated on the front cover of the answer book.
PLEASE TURN OVER
SECTION A
Answer all parts of Question 1 (50 marks in total).
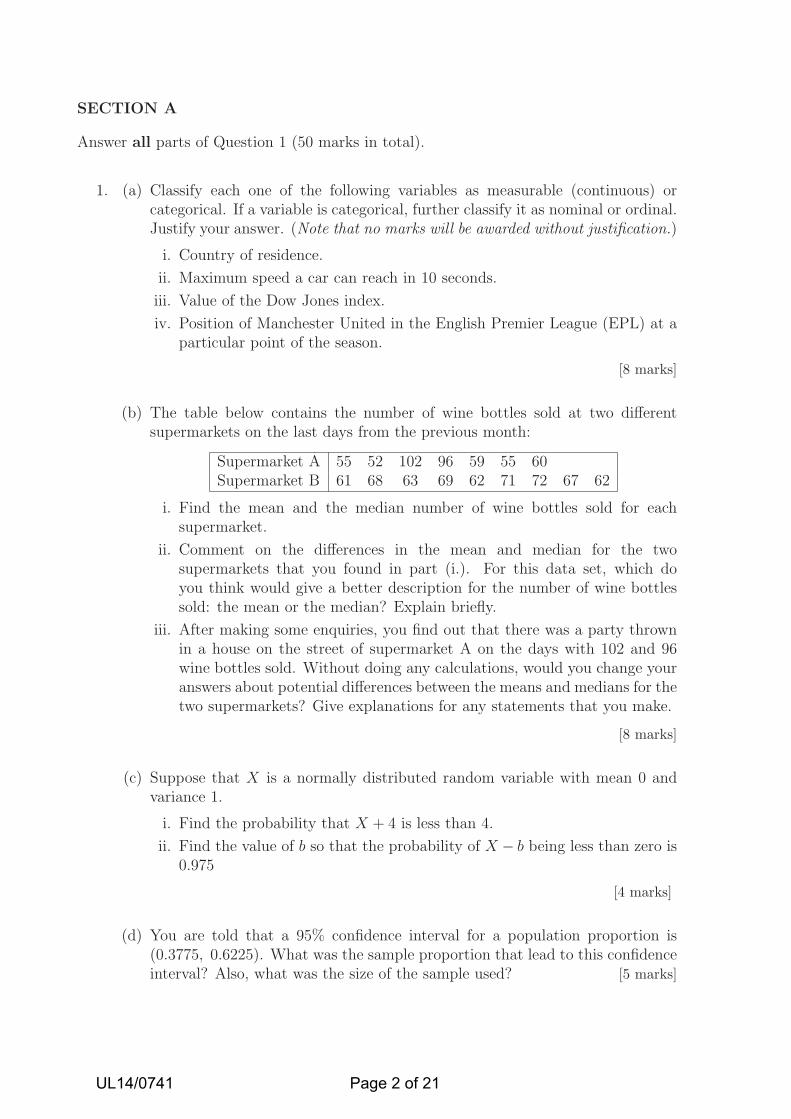
1. (a) Classify each one of the following variables as measurable (continuous) orcategorical. If a variable is categorical, further classify it as nominal or ordinal.Justify your answer. (Note that no marks will be awarded without justification.)
i. Country of residence.
ii. Maximum speed a car can reach in 10 seconds.
iii. Value of the Dow Jones index.
iv. Position of Manchester United in the English Premier League (EPL) at aparticular point of the season.
[8 marks]
(b) The table below contains the number of wine bottles sold at two differentsupermarkets on the last days from the previous month:
Supermarket A 55 52 102 96 59 55 60Supermarket B 61 68 63 69 62 71 72 67 62
i. Find the mean and the median number of wine bottles sold for eachsupermarket.
ii. Comment on the differences in the mean and median for the twosupermarkets that you found in part (i.). For this data set, which doyou think would give a better description for the number of wine bottlessold: the mean or the median? Explain briefly.
iii. After making some enquiries, you find out that there was a party thrownin a house on the street of supermarket A on the days with 102 and 96wine bottles sold. Without doing any calculations, would you change youranswers about potential differences between the means and medians for thetwo supermarkets? Give explanations for any statements that you make.
[8 marks]
(c) Suppose that X is a normally distributed random variable with mean 0 andvariance 1.
i. Find the probability that X + 4 is less than 4.
ii. Find the value of b so that the probability of X − b being less than zero is0.975
[4 marks]
(d) You are told that a 95% confidence interval for a population proportion is(0.3775, 0.6225). What was the sample proportion that lead to this confidenceinterval? Also, what was the size of the sample used? [5 marks]
UL12/0217D00
Page 2 of 6
UL14/0741 Page 2 of 21
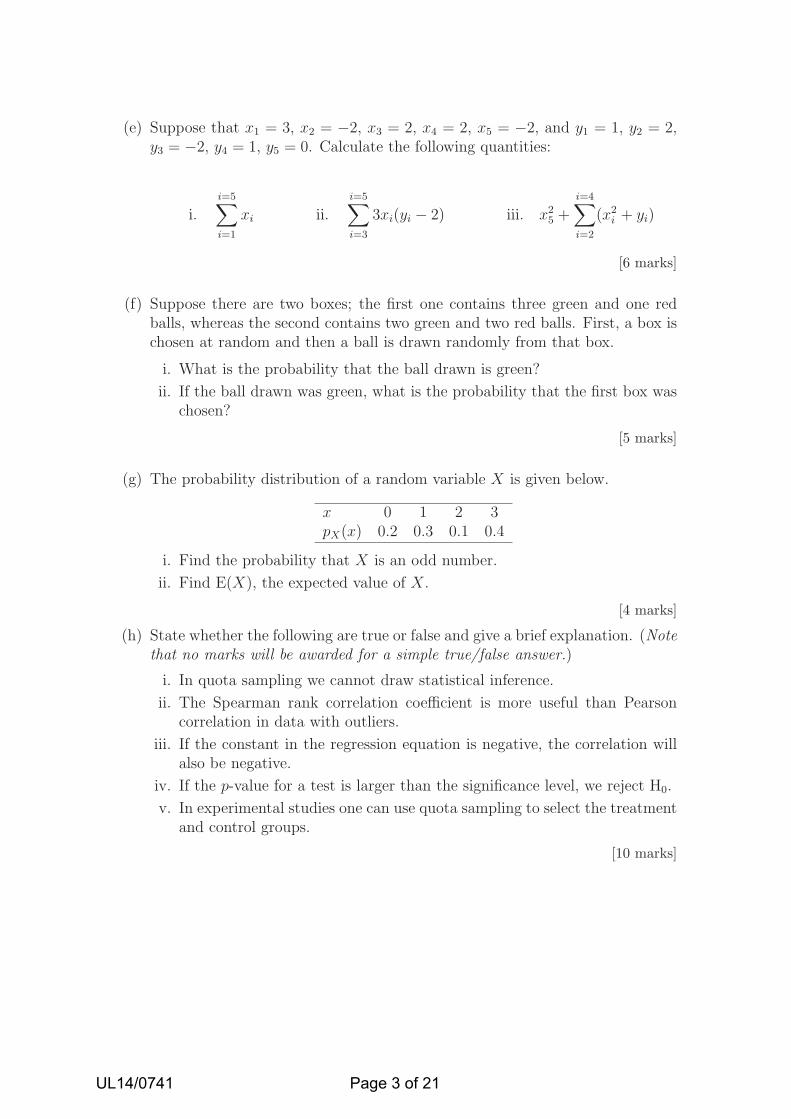
(e) Suppose that x1 = 3, x2 = −2, x3 = 2, x4 = 2, x5 = −2, and y1 = 1, y2 = 2,y3 = −2, y4 = 1, y5 = 0. Calculate the following quantities:
i.i=5∑
i=1
xi ii.i=5∑
i=3
3xi(yi − 2) iii. x2
5+
i=4∑
i=2
(x2
i+ yi)
[6 marks]
(f) Suppose there are two boxes; the first one contains three green and one redballs, whereas the second contains two green and two red balls. First, a box ischosen at random and then a ball is drawn randomly from that box.
i. What is the probability that the ball drawn is green?
ii. If the ball drawn was green, what is the probability that the first box waschosen?
[5 marks]
(g) The probability distribution of a random variable X is given below.
x 0 1 2 3pX(x) 0.2 0.3 0.1 0.4
i. Find the probability that X is an odd number.
ii. Find E(X), the expected value of X.
[4 marks]
(h) State whether the following are true or false and give a brief explanation. (Notethat no marks will be awarded for a simple true/false answer.)
i. In quota sampling we cannot draw statistical inference.
ii. The Spearman rank correlation coefficient is more useful than Pearsoncorrelation in data with outliers.
iii. If the constant in the regression equation is negative, the correlation willalso be negative.
iv. If the p-value for a test is larger than the significance level, we reject H0.
v. In experimental studies one can use quota sampling to select the treatmentand control groups.
[10 marks]
UL12/0217D00
Page 3 of 6
UL14/0741 Page 3 of 21
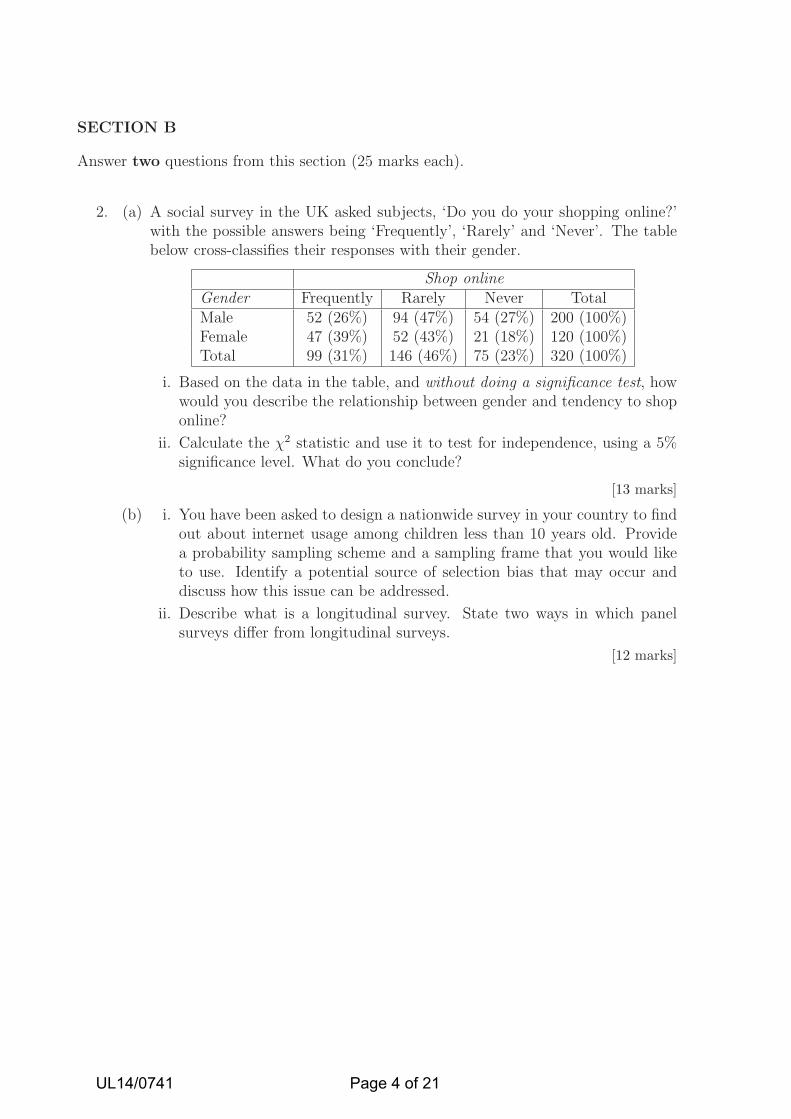
SECTION B
Answer two questions from this section (25 marks each).
2. (a) A social survey in the UK asked subjects, ‘Do you do your shopping online?’with the possible answers being ‘Frequently’, ‘Rarely’ and ‘Never’. The tablebelow cross-classifies their responses with their gender.
Shop onlineGender Frequently Rarely Never TotalMale 52 (26%) 94 (47%) 54 (27%) 200 (100%)Female 47 (39%) 52 (43%) 21 (18%) 120 (100%)Total 99 (31%) 146 (46%) 75 (23%) 320 (100%)
i. Based on the data in the table, and without doing a significance test, howwould you describe the relationship between gender and tendency to shoponline?
ii. Calculate the χ2 statistic and use it to test for independence, using a 5%significance level. What do you conclude?
[13 marks]
(b) i. You have been asked to design a nationwide survey in your country to findout about internet usage among children less than 10 years old. Providea probability sampling scheme and a sampling frame that you would liketo use. Identify a potential source of selection bias that may occur anddiscuss how this issue can be addressed.
ii. Describe what is a longitudinal survey. State two ways in which panelsurveys differ from longitudinal surveys.
[12 marks]
UL12/0217D00
Page 4 of 6
UL14/0741 Page 4 of 21
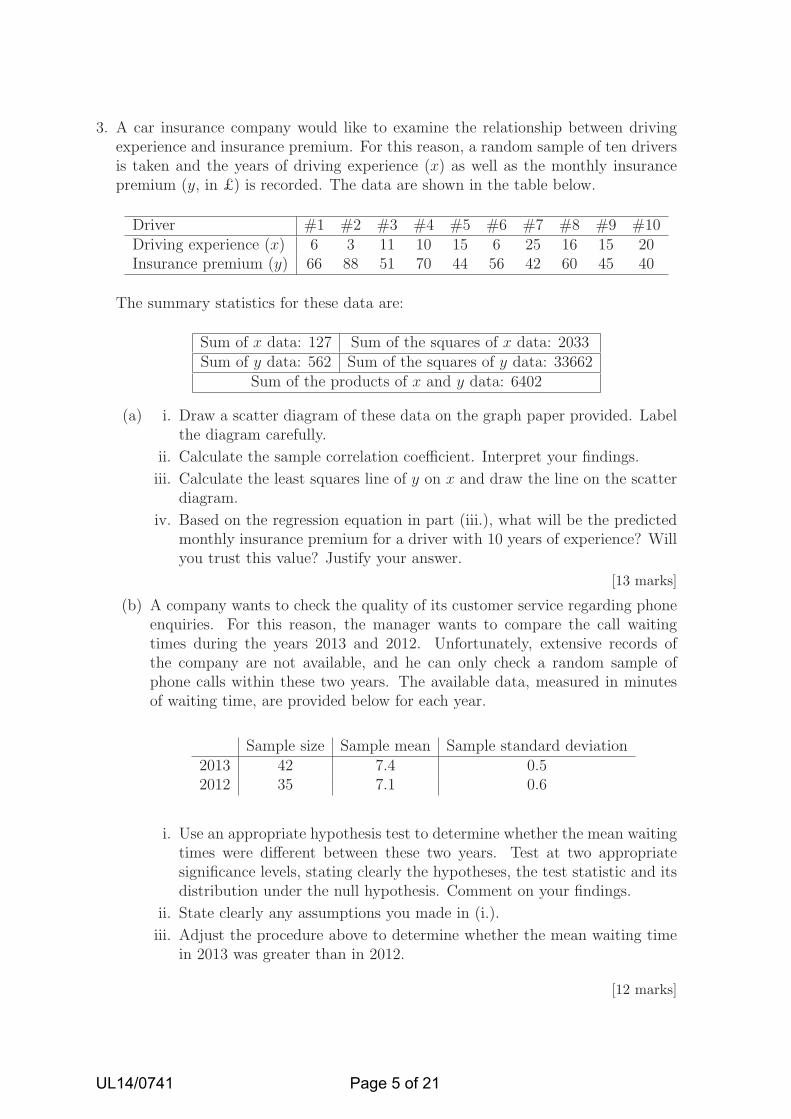
3. A car insurance company would like to examine the relationship between drivingexperience and insurance premium. For this reason, a random sample of ten driversis taken and the years of driving experience (x) as well as the monthly insurancepremium (y, in £) is recorded. The data are shown in the table below.
Driver #1 #2 #3 #4 #5 #6 #7 #8 #9 #10Driving experience (x) 6 3 11 10 15 6 25 16 15 20Insurance premium (y) 66 88 51 70 44 56 42 60 45 40
The summary statistics for these data are:
Sum of x data: 127 Sum of the squares of x data: 2033Sum of y data: 562 Sum of the squares of y data: 33662
Sum of the products of x and y data: 6402
(a) i. Draw a scatter diagram of these data on the graph paper provided. Labelthe diagram carefully.
ii. Calculate the sample correlation coefficient. Interpret your findings.
iii. Calculate the least squares line of y on x and draw the line on the scatterdiagram.
iv. Based on the regression equation in part (iii.), what will be the predictedmonthly insurance premium for a driver with 10 years of experience? Willyou trust this value? Justify your answer.
[13 marks]
(b) A company wants to check the quality of its customer service regarding phoneenquiries. For this reason, the manager wants to compare the call waitingtimes during the years 2013 and 2012. Unfortunately, extensive records ofthe company are not available, and he can only check a random sample ofphone calls within these two years. The available data, measured in minutesof waiting time, are provided below for each year.
Sample size Sample mean Sample standard deviation2013 42 7.4 0.52012 35 7.1 0.6
i. Use an appropriate hypothesis test to determine whether the mean waitingtimes were different between these two years. Test at two appropriatesignificance levels, stating clearly the hypotheses, the test statistic and itsdistribution under the null hypothesis. Comment on your findings.
ii. State clearly any assumptions you made in (i.).
iii. Adjust the procedure above to determine whether the mean waiting timein 2013 was greater than in 2012.
[12 marks]
UL12/0217D00
Page 5 of 6
UL14/0741 Page 5 of 21
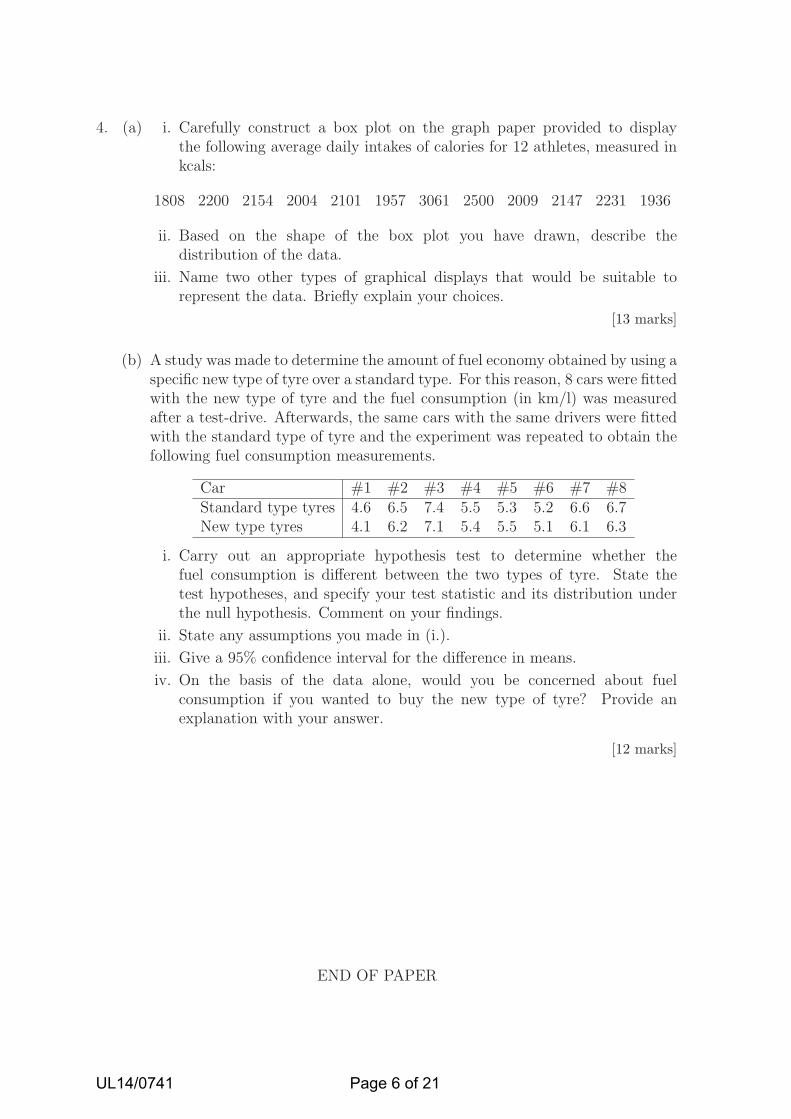
4. (a) i. Carefully construct a box plot on the graph paper provided to displaythe following average daily intakes of calories for 12 athletes, measured inkcals:
1808 2200 2154 2004 2101 1957 3061 2500 2009 2147 2231 1936
ii. Based on the shape of the box plot you have drawn, describe thedistribution of the data.
iii. Name two other types of graphical displays that would be suitable torepresent the data. Briefly explain your choices.
[13 marks]
(b) A study was made to determine the amount of fuel economy obtained by using aspecific new type of tyre over a standard type. For this reason, 8 cars were fittedwith the new type of tyre and the fuel consumption (in km/l) was measuredafter a test-drive. Afterwards, the same cars with the same drivers were fittedwith the standard type of tyre and the experiment was repeated to obtain thefollowing fuel consumption measurements.
Car #1 #2 #3 #4 #5 #6 #7 #8Standard type tyres 4.6 6.5 7.4 5.5 5.3 5.2 6.6 6.7New type tyres 4.1 6.2 7.1 5.4 5.5 5.1 6.1 6.3
i. Carry out an appropriate hypothesis test to determine whether thefuel consumption is different between the two types of tyre. State thetest hypotheses, and specify your test statistic and its distribution underthe null hypothesis. Comment on your findings.
ii. State any assumptions you made in (i.).
iii. Give a 95% confidence interval for the difference in means.
iv. On the basis of the data alone, would you be concerned about fuelconsumption if you wanted to buy the new type of tyre? Provide anexplanation with your answer.
[12 marks]
END OF PAPER
UL12/0217D00
Page 6 of 6
UL14/0741 Page 6 of 21
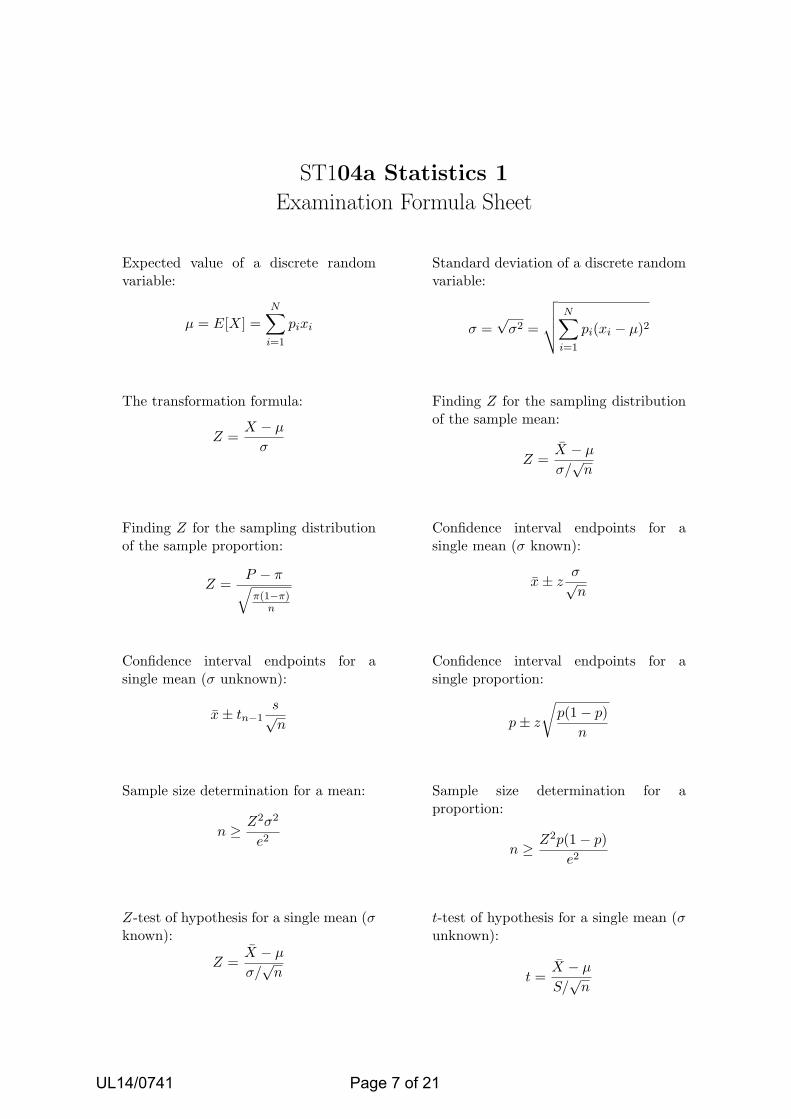
ST104a Statistics 1
Examination Formula Sheet
Expected value of a discrete randomvariable:
µ = E[X] =N∑
i=1
pixi
Standard deviation of a discrete randomvariable:
σ =√σ2 =
√
√
√
√
N∑
i=1
pi(xi − µ)2
The transformation formula:
Z =X − µ
σ
Finding Z for the sampling distributionof the sample mean:
Z =X − µ
σ/√n
Finding Z for the sampling distributionof the sample proportion:
Z =P − π
√
π(1−π)n
Confidence interval endpoints for asingle mean (σ known):
x± zσ√n
Confidence interval endpoints for asingle mean (σ unknown):
x± tn−1s√n
Confidence interval endpoints for asingle proportion:
p± z
√
p(1− p)
n
Sample size determination for a mean:
n ≥Z2σ2
e2
Sample size determination for aproportion:
n ≥Z2p(1− p)
e2
Z-test of hypothesis for a single mean (σknown):
Z =X − µ
σ/√n
t-test of hypothesis for a single mean (σunknown):
t =X − µ
S/√n
1
UL14/0741 Page 7 of 21
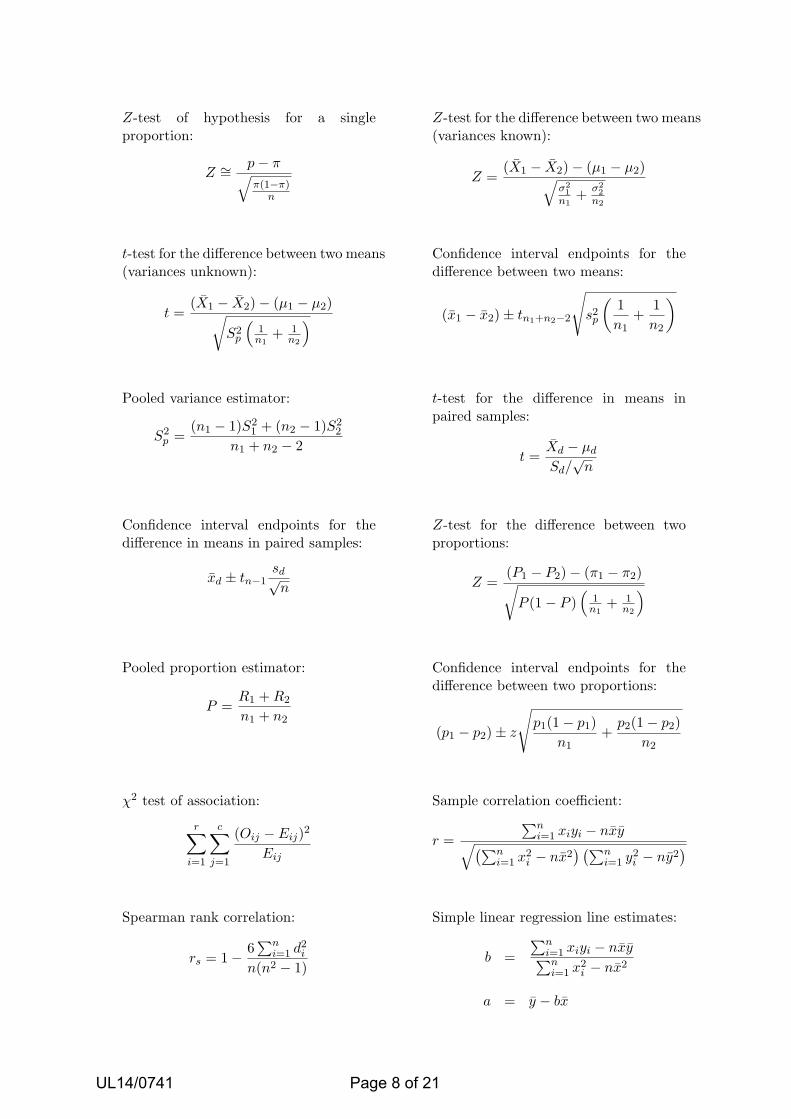
Z-test of hypothesis for a singleproportion:
Z ∼=p− π
√
π(1−π)n
Z-test for the difference between two means(variances known):
Z =(X1 − X2)− (µ1 − µ2)
√
σ2
1
n1+
σ2
2
n2
t-test for the difference between two means(variances unknown):
t =(X1 − X2)− (µ1 − µ2)
√
S2p
(
1n1
+ 1n2
)
Confidence interval endpoints for thedifference between two means:
(x1 − x2)± tn1+n2−2
√
s2p
(
1
n1+
1
n2
)
Pooled variance estimator:
S2p =
(n1 − 1)S21 + (n2 − 1)S2
2
n1 + n2 − 2
t-test for the difference in means inpaired samples:
t =Xd − µd
Sd/√n
Confidence interval endpoints for thedifference in means in paired samples:
xd ± tn−1sd√n
Z-test for the difference between twoproportions:
Z =(P1 − P2)− (π1 − π2)√
P (1− P )(
1n1
+ 1n2
)
Pooled proportion estimator:
P =R1 +R2
n1 + n2
Confidence interval endpoints for thedifference between two proportions:
(p1 − p2)± z
√
p1(1− p1)
n1+
p2(1− p2)
n2
χ2 test of association:
r∑
i=1
c∑
j=1
(Oij − Eij)2
Eij
Sample correlation coefficient:
r =
∑ni=1 xiyi − nxy
√
(∑n
i=1 x2i − nx2
) (∑n
i=1 y2i − ny2
)
Spearman rank correlation:
rs = 1−6∑n
i=1 d2i
n(n2 − 1)
Simple linear regression line estimates:
b =
∑ni=1 xiyi − nxy
∑ni=1 x
2i − nx2
a = y − bx
2
UL14/0741 Page 8 of 21
Dennis V. Lindley, William F. Scott, New Cambridge Statistical Tables, (1995) © Cambridge University Press, reproduced with permission.
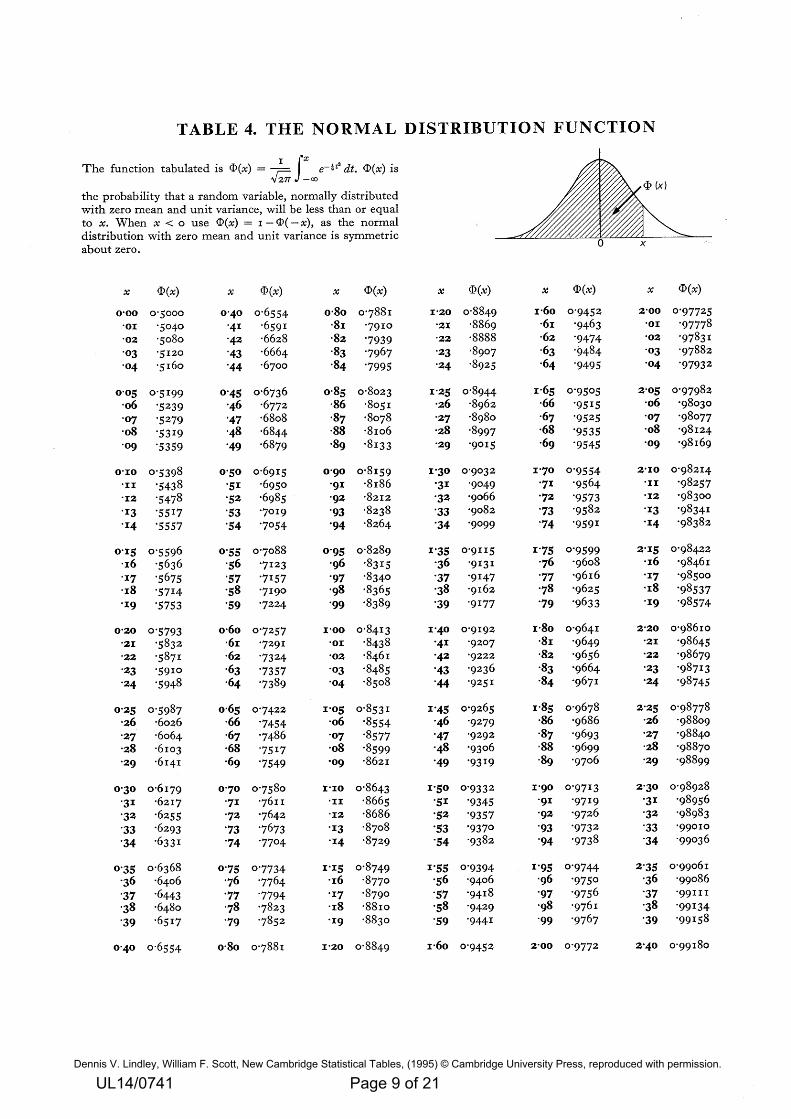
UL14/0741 Page 9 of 21
Dennis V. Lindley, William F. Scott, New Cambridge Statistical Tables, (1995) © Cambridge University Press, reproduced with permission.
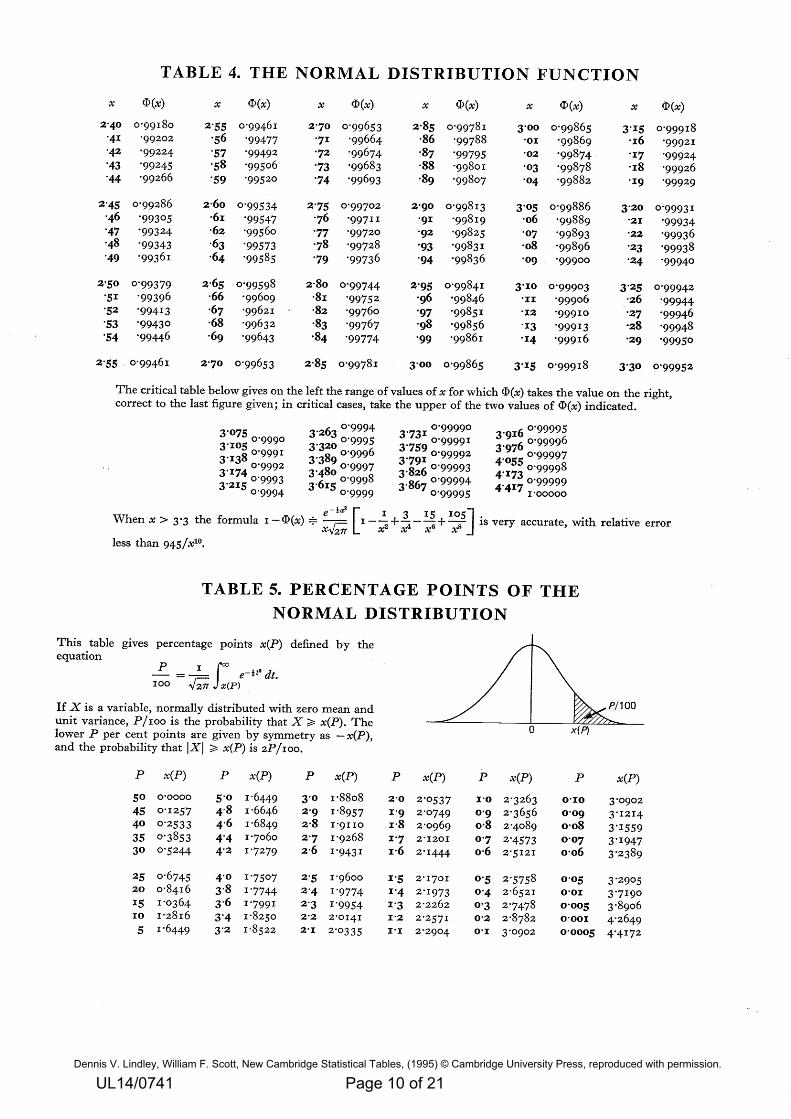
UL14/0741 Page 10 of 21
Dennis V. Lindley, William F. Scott, New Cambridge Statistical Tables, (1995) © Cambridge University Press, reproduced with permission.
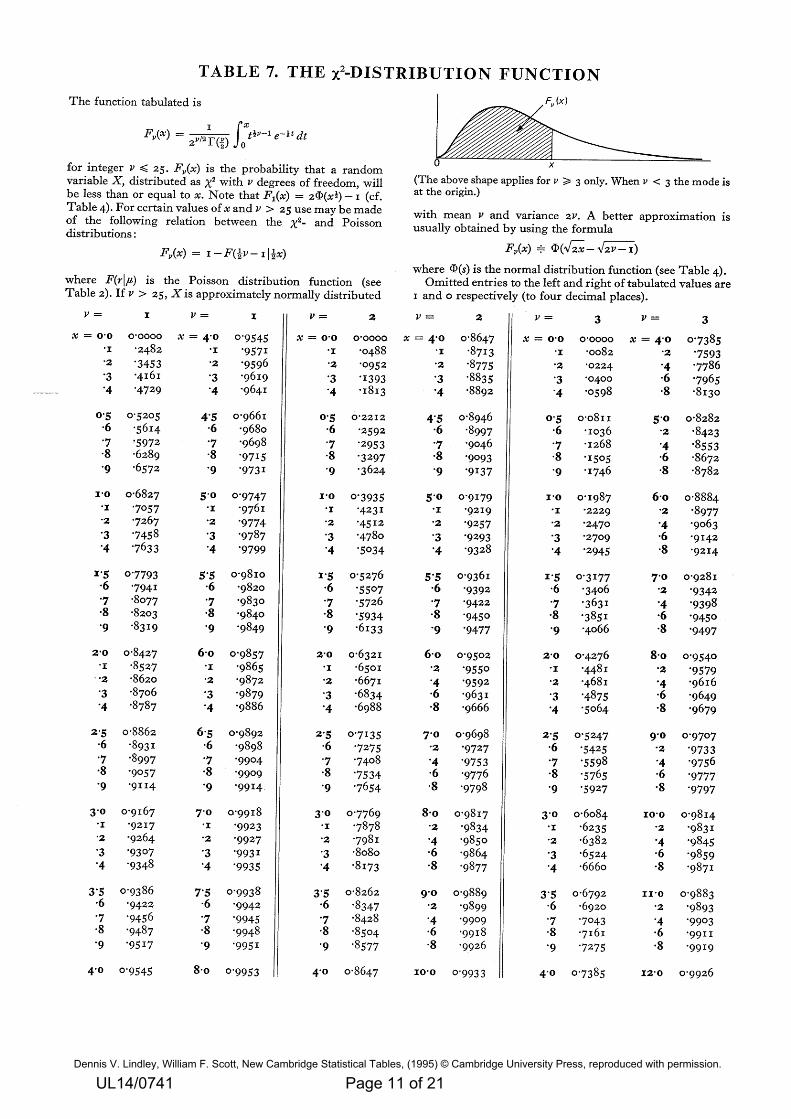
UL14/0741 Page 11 of 21
Dennis V. Lindley, William F. Scott, New Cambridge Statistical Tables, (1995) © Cambridge University Press, reproduced with permission.
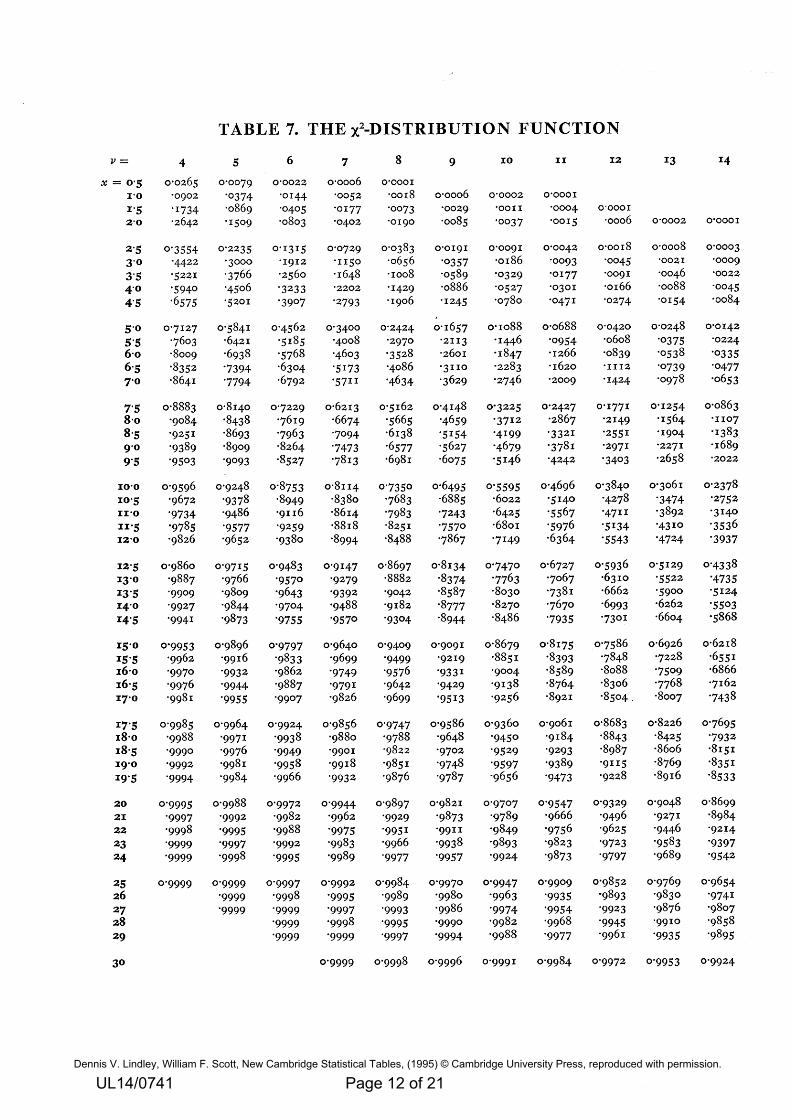
UL14/0741 Page 12 of 21
Dennis V. Lindley, William F. Scott, New Cambridge Statistical Tables, (1995) © Cambridge University Press, reproduced with permission.
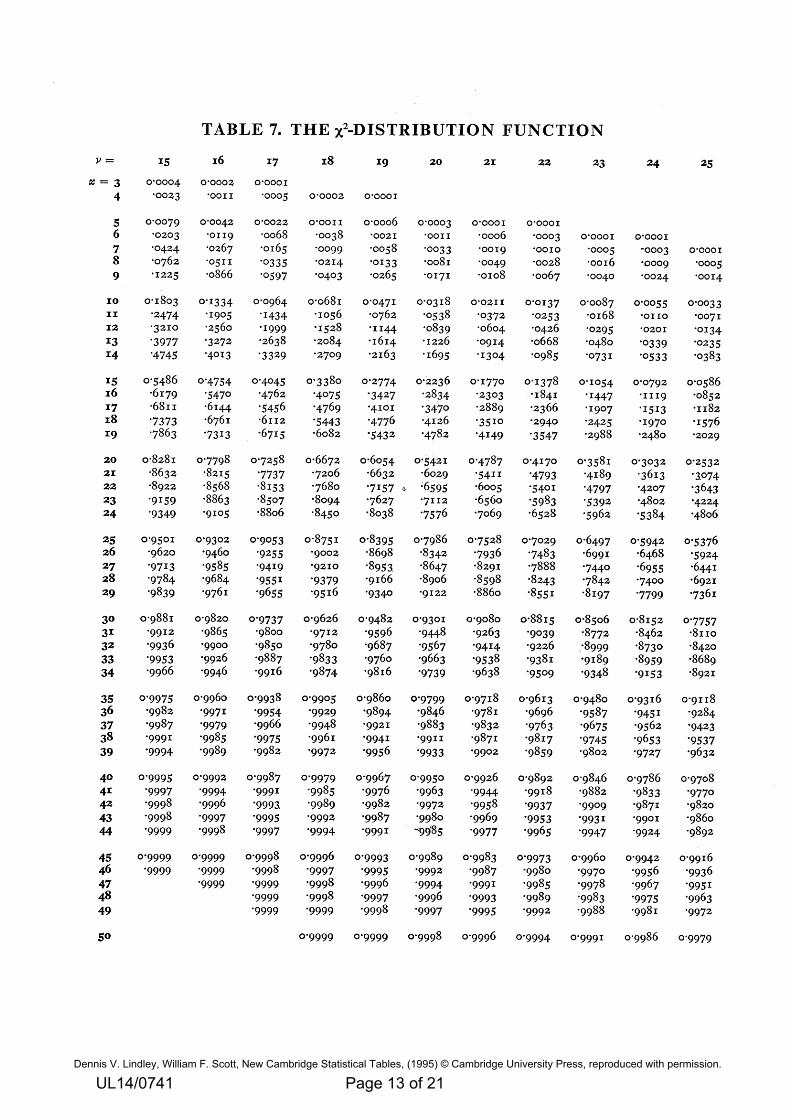
UL14/0741 Page 13 of 21
Dennis V. Lindley, William F. Scott, New Cambridge Statistical Tables, (1995) © Cambridge University Press, reproduced with permission.
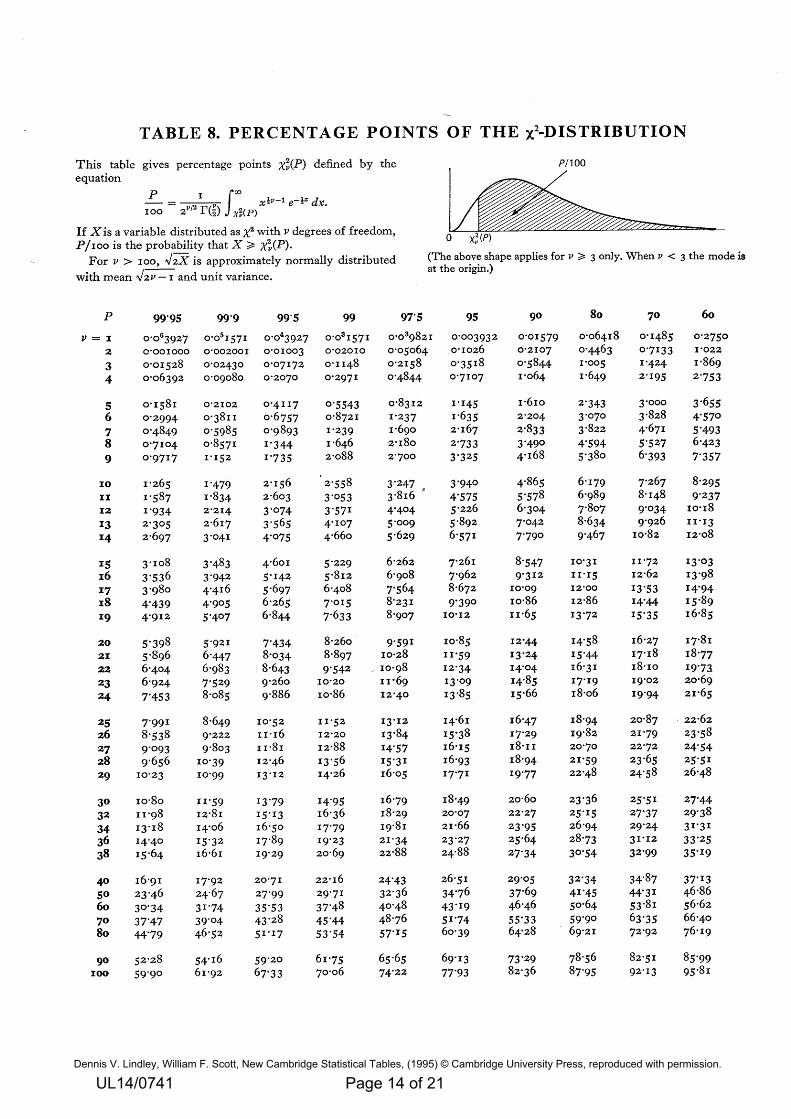
UL14/0741 Page 14 of 21
Dennis V. Lindley, William F. Scott, New Cambridge Statistical Tables, (1995) © Cambridge University Press, reproduced with permission.
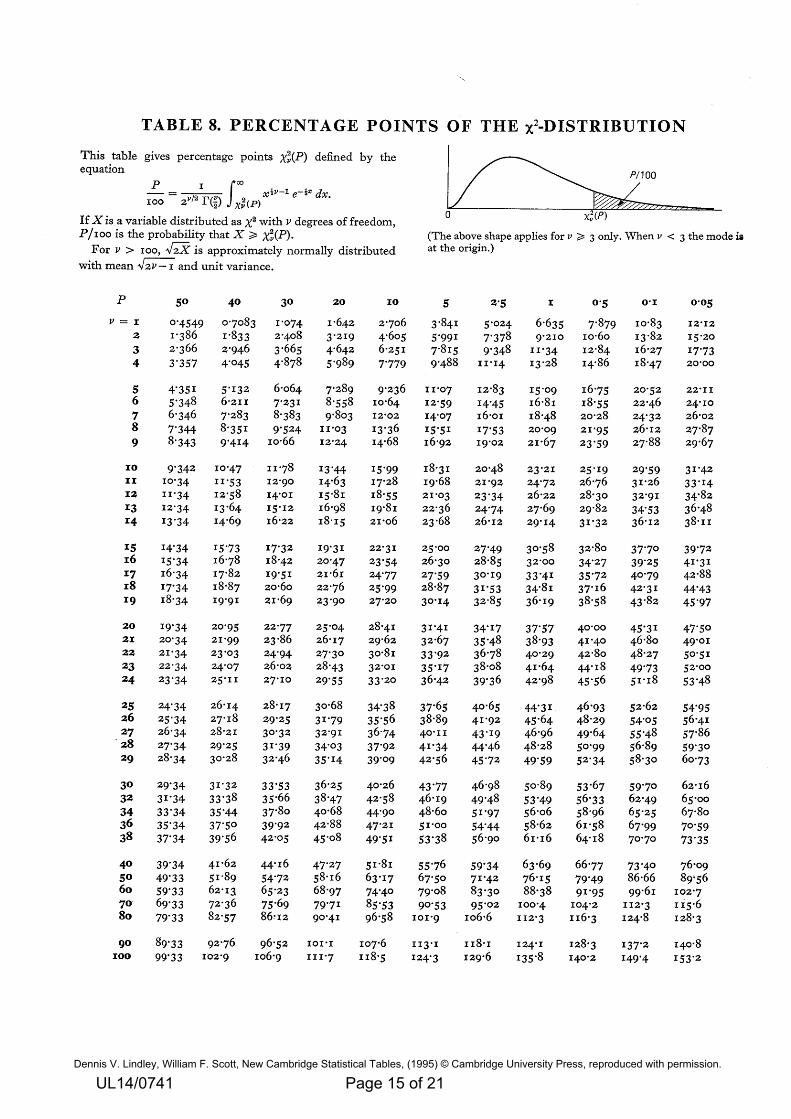
UL14/0741 Page 15 of 21
Dennis V. Lindley, William F. Scott, New Cambridge Statistical Tables, (1995) © Cambridge University Press, reproduced with permission.
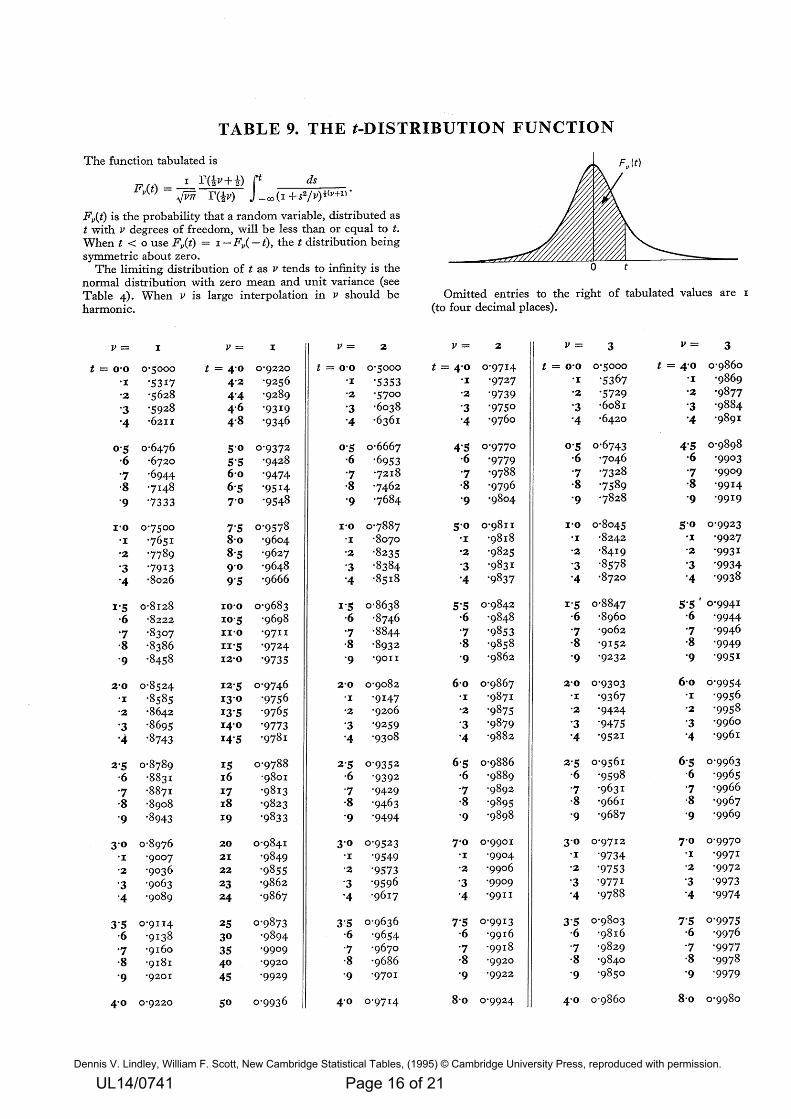
UL14/0741 Page 16 of 21
Dennis V. Lindley, William F. Scott, New Cambridge Statistical Tables, (1995) © Cambridge University Press, reproduced with permission.
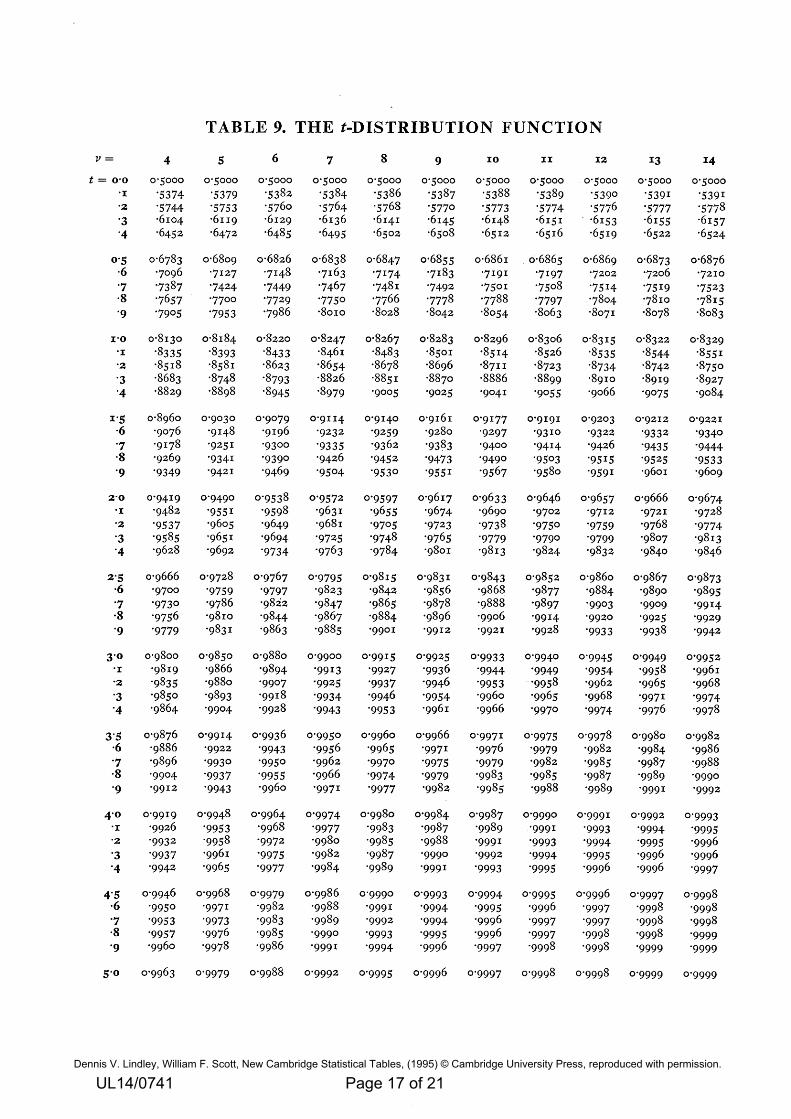
UL14/0741 Page 17 of 21
Dennis V. Lindley, William F. Scott, New Cambridge Statistical Tables, (1995) © Cambridge University Press, reproduced with permission.
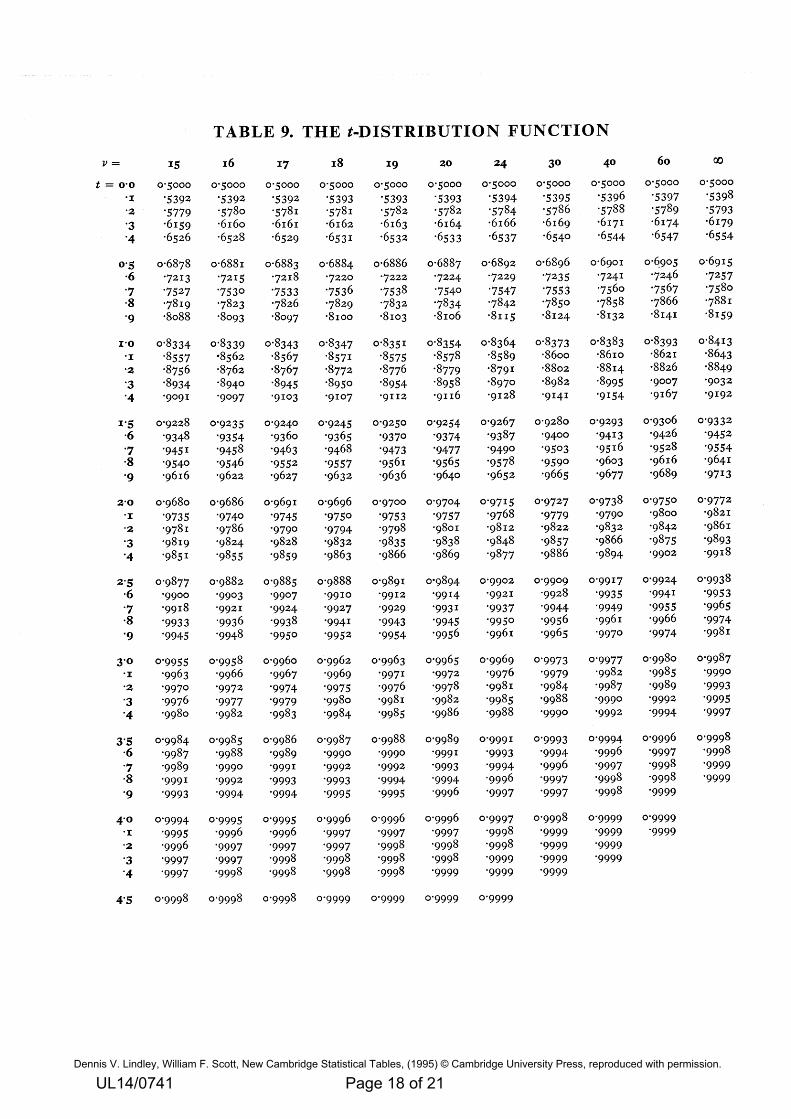
UL14/0741 Page 18 of 21
Dennis V. Lindley, William F. Scott, New Cambridge Statistical Tables, (1995) © Cambridge University Press, reproduced with permission.
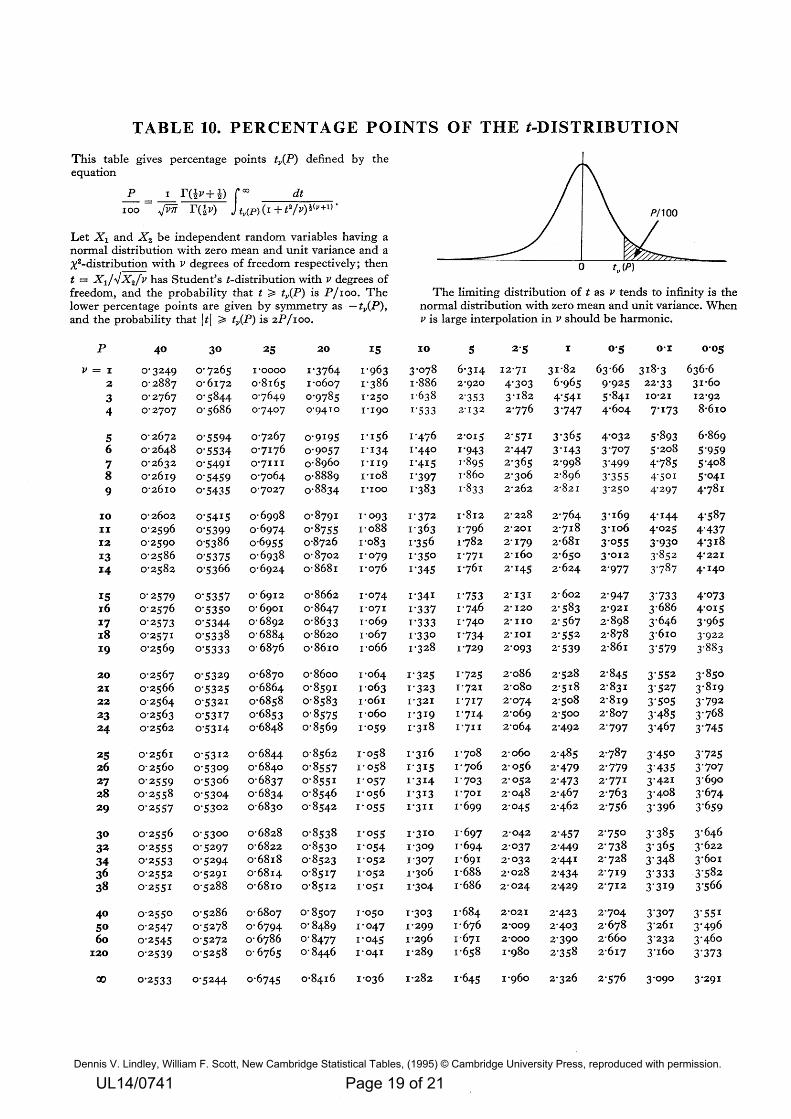
UL14/0741 Page 19 of 21
Dennis V. Lindley, William F. Scott, New Cambridge Statistical Tables, (1995) © Cambridge University Press, reproduced with permission.
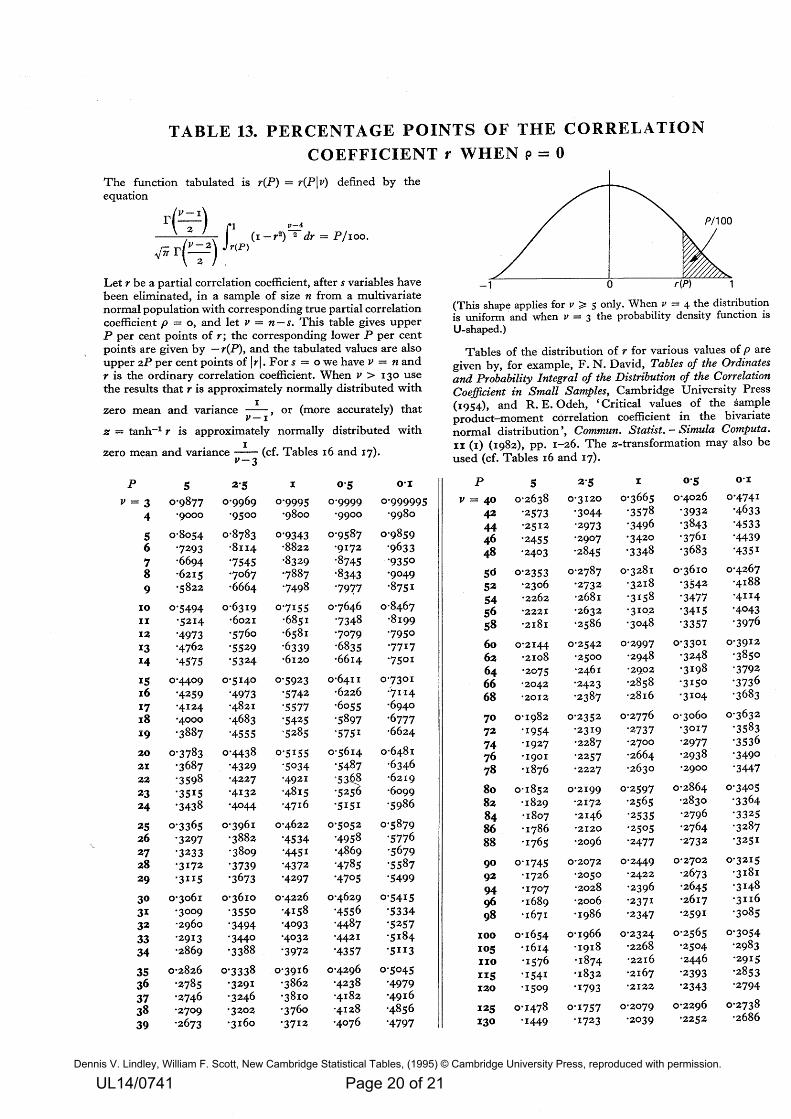
UL14/0741 Page 20 of 21
Dennis V. Lindley, William F. Scott, New Cambridge Statistical Tables, (1995) © Cambridge University Press, reproduced with permission.
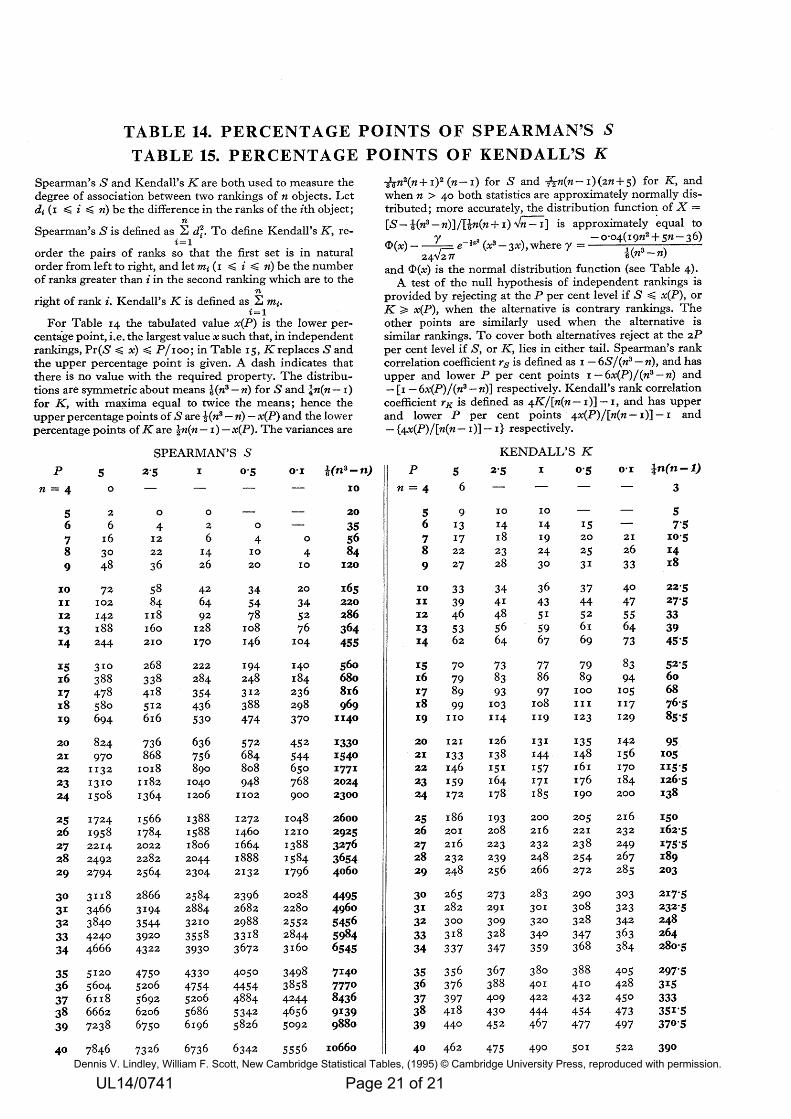
UL14/0741 Page 21 of 21