Embed Size (px)
DESCRIPTION
9. ST Segments, T Waves, QT Intervals, and U Waves. Fast & Easy ECGs, 2nd E – A Self-Paced Learning Program. Other Key Steps. To thoroughly assess the ECG, examine the ST segments, T waves, QT intervals and U waves. Q. ST Segment. - PowerPoint PPT Presentation
Citation preview
© 2013 The McGraw-Hill Companies, Inc. All rights reserved.
11Fast & Easy ECGs, 2EFast & Easy ECGs, 2E
ST Segments, T Waves, QTIntervals, and U WavesFast & Easy ECGs, 2nd E – A Self-
Paced Learning Program
99
© 2013 The McGraw-Hill Companies, Inc. All rights reserved.
22Fast & Easy ECGs, 2EFast & Easy ECGs, 2E
Other Key Steps
Q
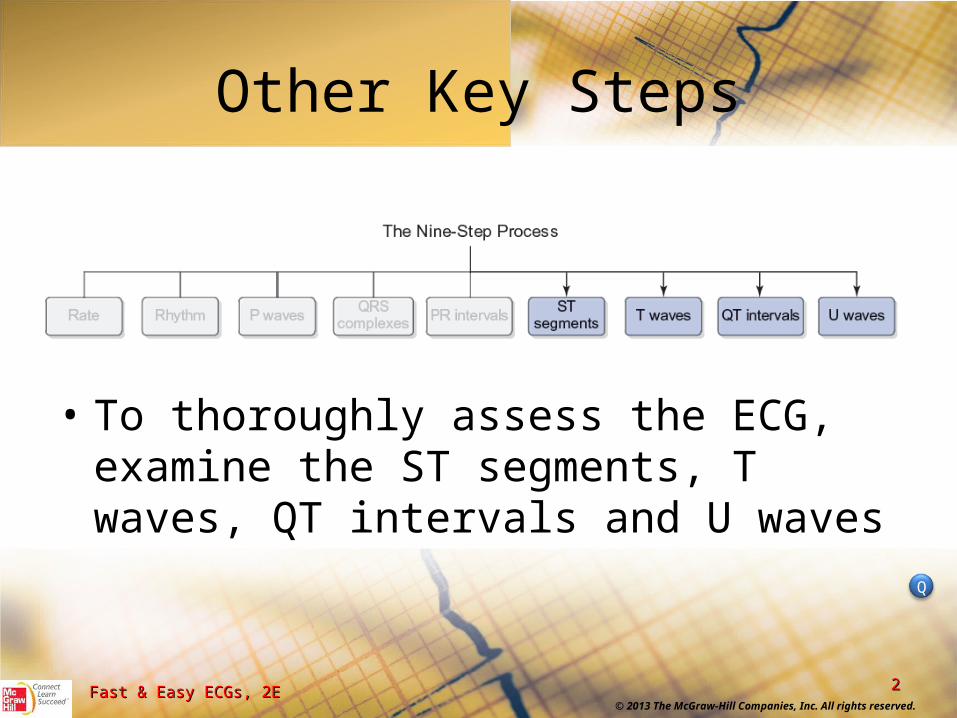
• To thoroughly assess the ECG, examine the ST segments, T waves, QT intervals and U waves
© 2013 The McGraw-Hill Companies, Inc. All rights reserved.
33Fast & Easy ECGs, 2EFast & Easy ECGs, 2E
ST Segment
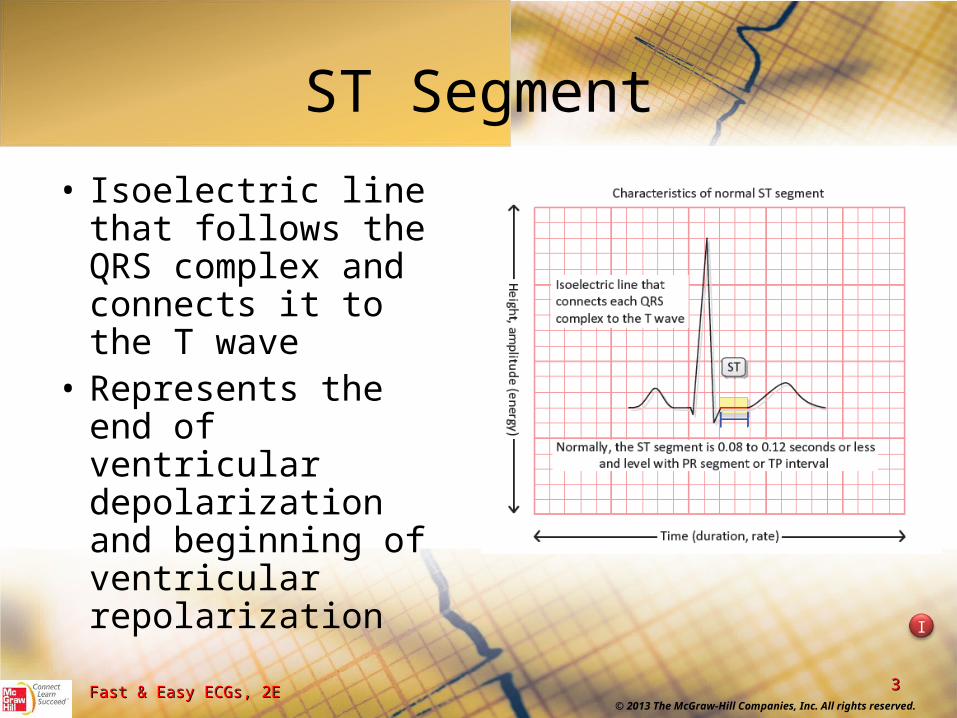
• Isoelectric line that follows the QRS complex and connects it to the T wave
• Represents the end of ventricular depolarization and beginning of ventricular repolarization
I
© 2013 The McGraw-Hill Companies, Inc. All rights reserved.
44Fast & Easy ECGs, 2EFast & Easy ECGs, 2E
Measuring ST Segments
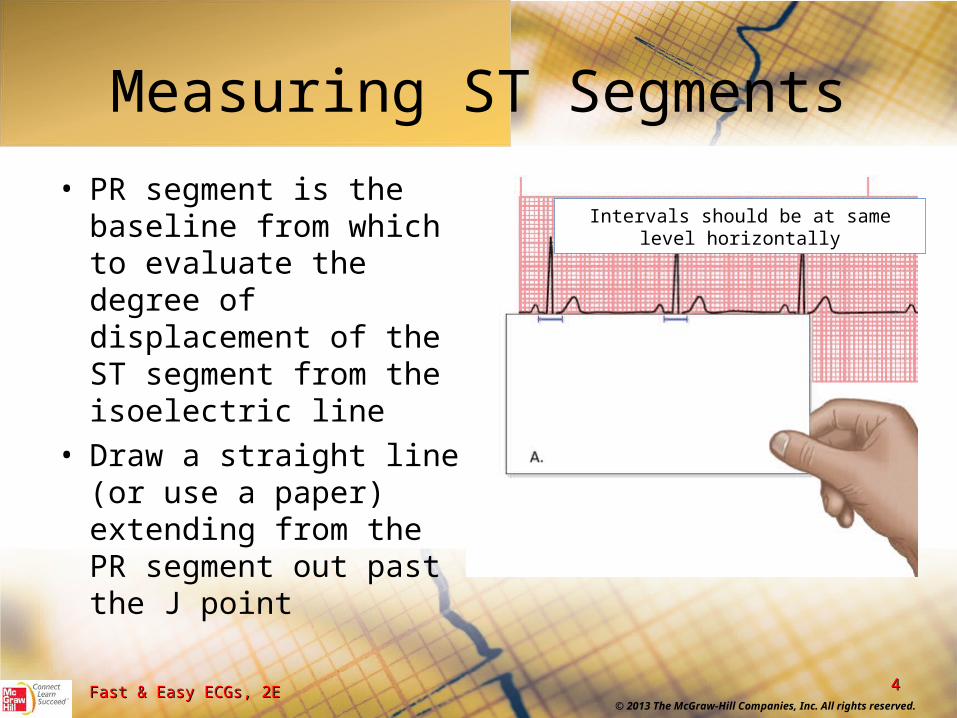
• PR segment is the baseline from which to evaluate the degree of displacement of the ST segment from the isoelectric line
• Draw a straight line (or use a paper) extending from the PR segment out past the J point
Intervals should be at same level horizontally
© 2013 The McGraw-Hill Companies, Inc. All rights reserved.
55Fast & Easy ECGs, 2EFast & Easy ECGs, 2E
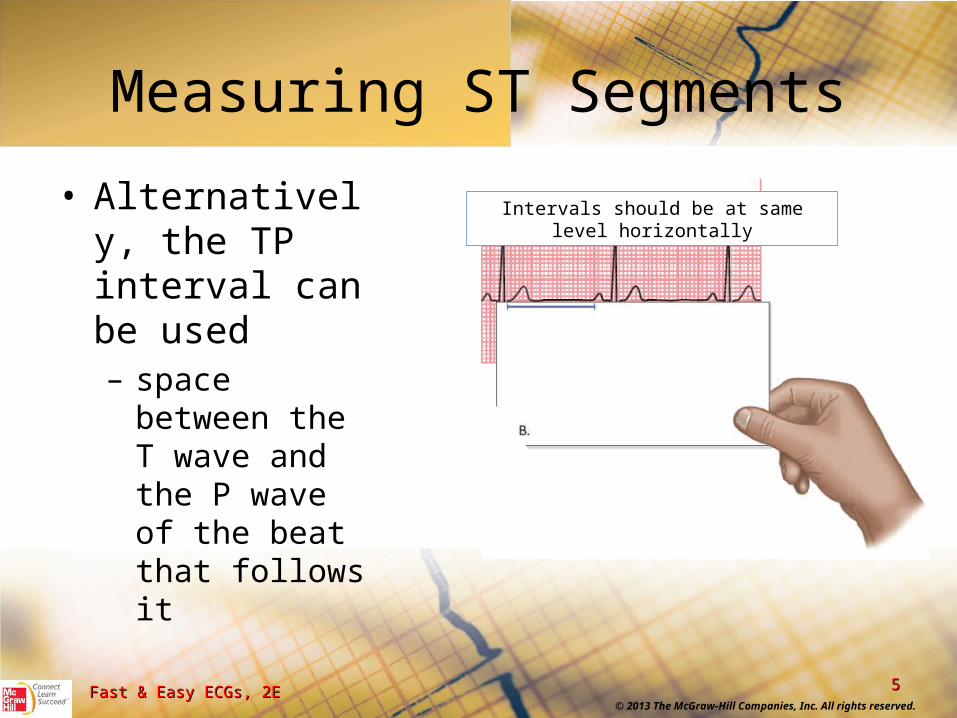
Measuring ST Segments
• Alternatively, the TP interval can be used – space between
the T wave and the P wave of the beat that follows it
Intervals should be at same level horizontally
© 2013 The McGraw-Hill Companies, Inc. All rights reserved.
66Fast & Easy ECGs, 2EFast & Easy ECGs, 2E
Measuring ST Segments
• For proper measurement, we use a point 0.04 seconds (one small box) after the J point to identify the presence of elevation or depression
• An elevated ST segment is one that is 1 mm or more above the baseline
• An depressed ST segment is one that is 1 mm or more below the baseline
© 2013 The McGraw-Hill Companies, Inc. All rights reserved.
77Fast & Easy ECGs, 2EFast & Easy ECGs, 2E
Abnormal ST Segments
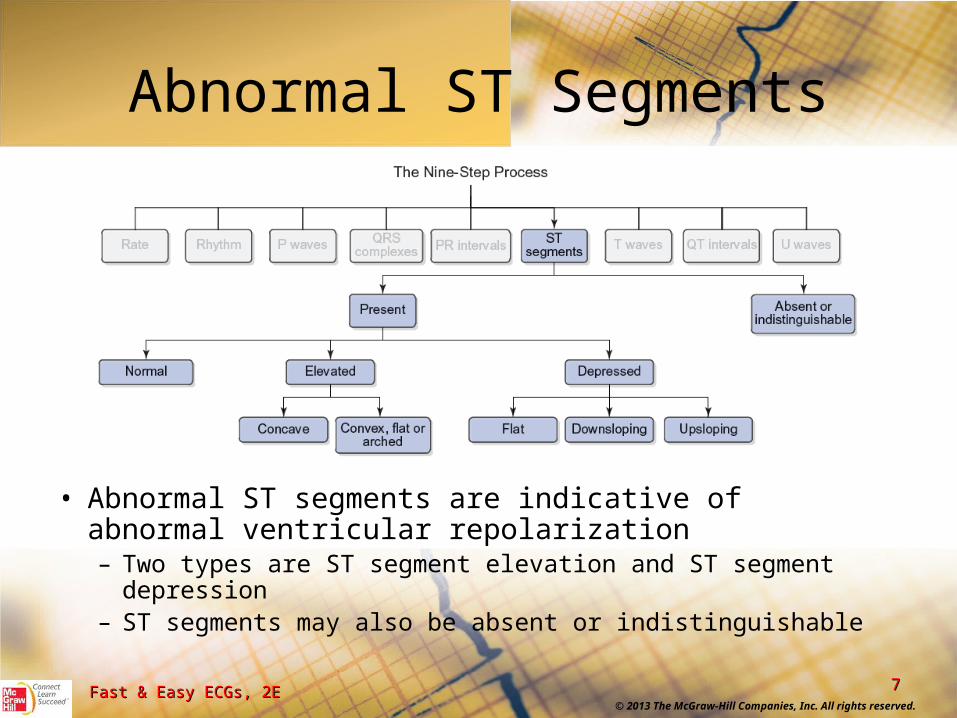
• Abnormal ST segments are indicative of abnormal ventricular repolarization– Two types are ST segment elevation and ST segment depression– ST segments may also be absent or indistinguishable
© 2013 The McGraw-Hill Companies, Inc. All rights reserved.
88Fast & Easy ECGs, 2EFast & Easy ECGs, 2E
Abnormal ST Segments
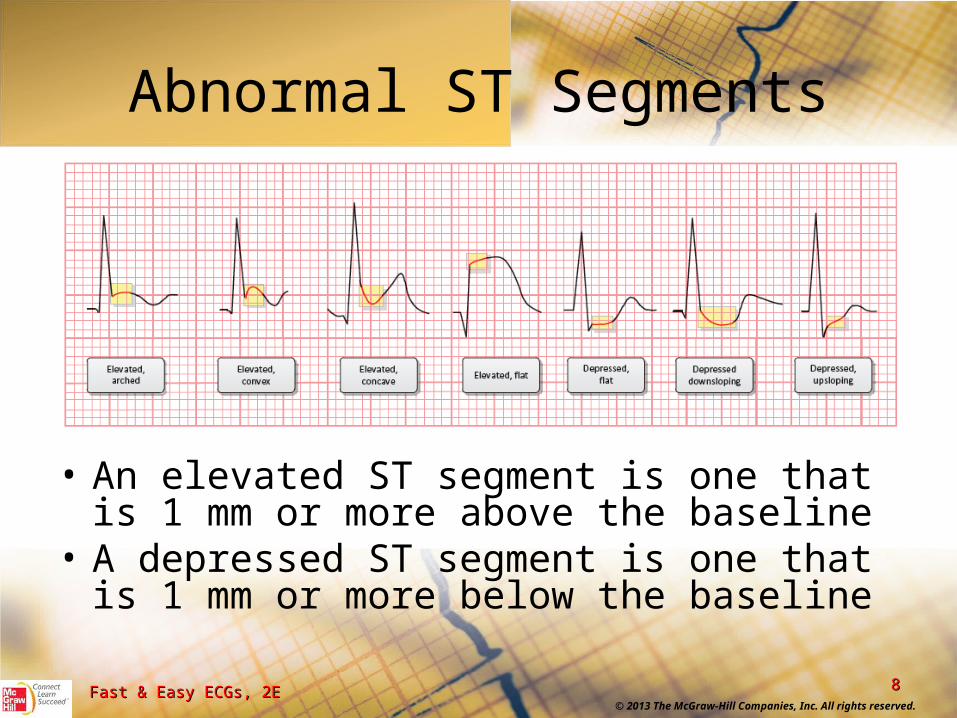
• An elevated ST segment is one that is 1 mm or more above the baseline
• A depressed ST segment is one that is 1 mm or more below the baseline
© 2013 The McGraw-Hill Companies, Inc. All rights reserved.
99Fast & Easy ECGs, 2EFast & Easy ECGs, 2E
ST Elevation and Depression
• Elevation or depression of the ST segment is a hallmark feature of myocardial ischemia and injury
I
© 2013 The McGraw-Hill Companies, Inc. All rights reserved.
1010Fast & Easy ECGs, 2EFast & Easy ECGs, 2E
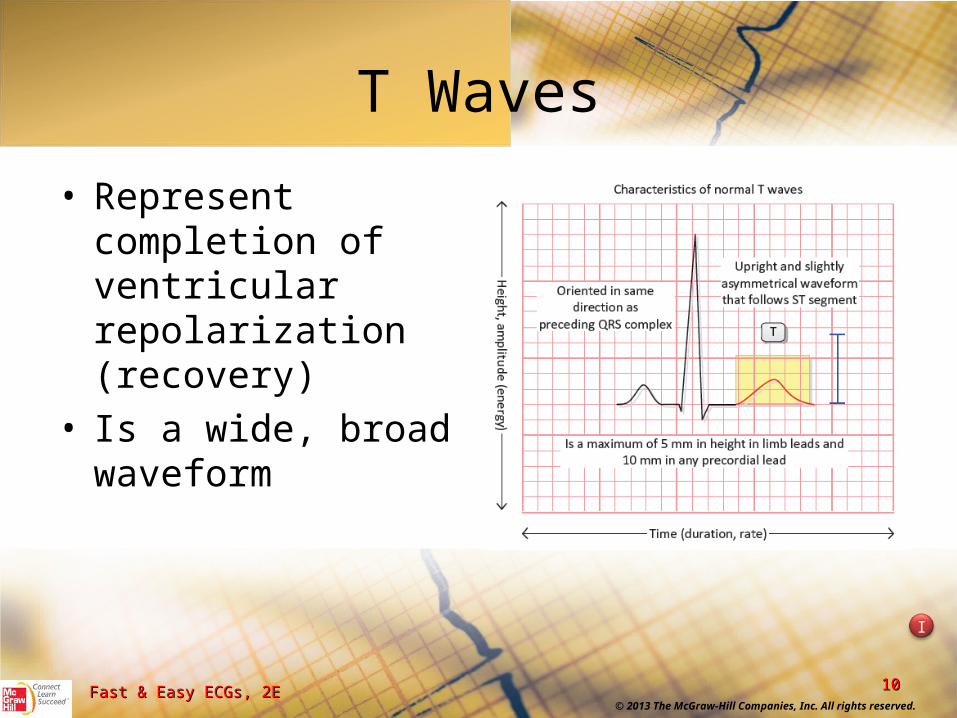
T Waves
• Represent completion of ventricular repolarization (recovery)
• Is a wide, broad waveform
I
© 2013 The McGraw-Hill Companies, Inc. All rights reserved.
1111Fast & Easy ECGs, 2EFast & Easy ECGs, 2E
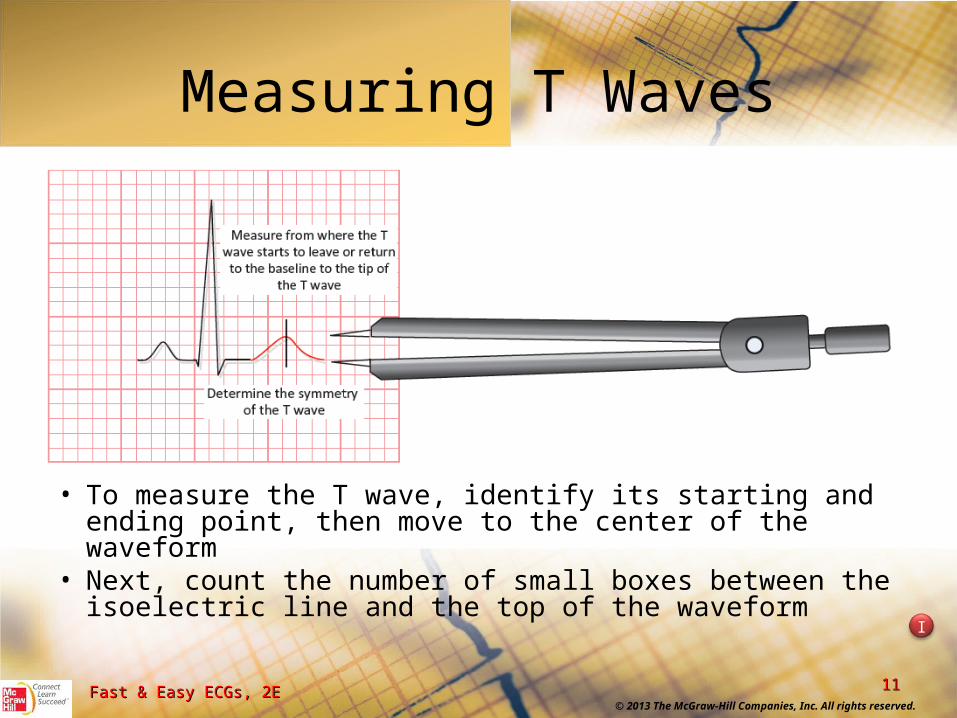
Measuring T Waves
• To measure the T wave, identify its starting and ending point, then move to the center of the waveform
• Next, count the number of small boxes between the isoelectric line and the top of the waveform
I
© 2013 The McGraw-Hill Companies, Inc. All rights reserved.
1212Fast & Easy ECGs, 2EFast & Easy ECGs, 2E
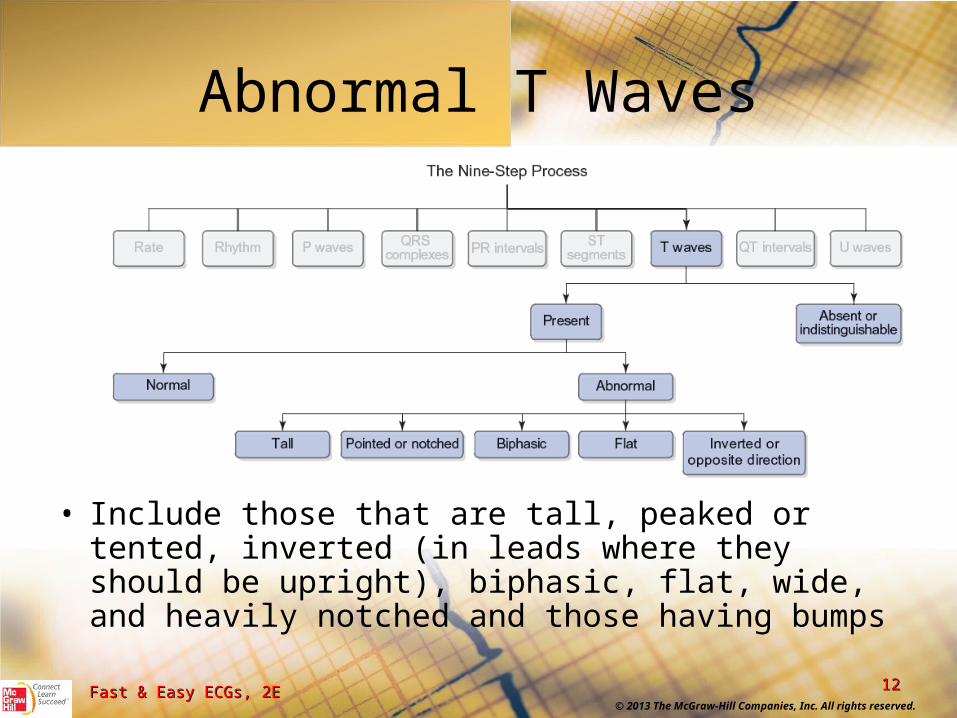
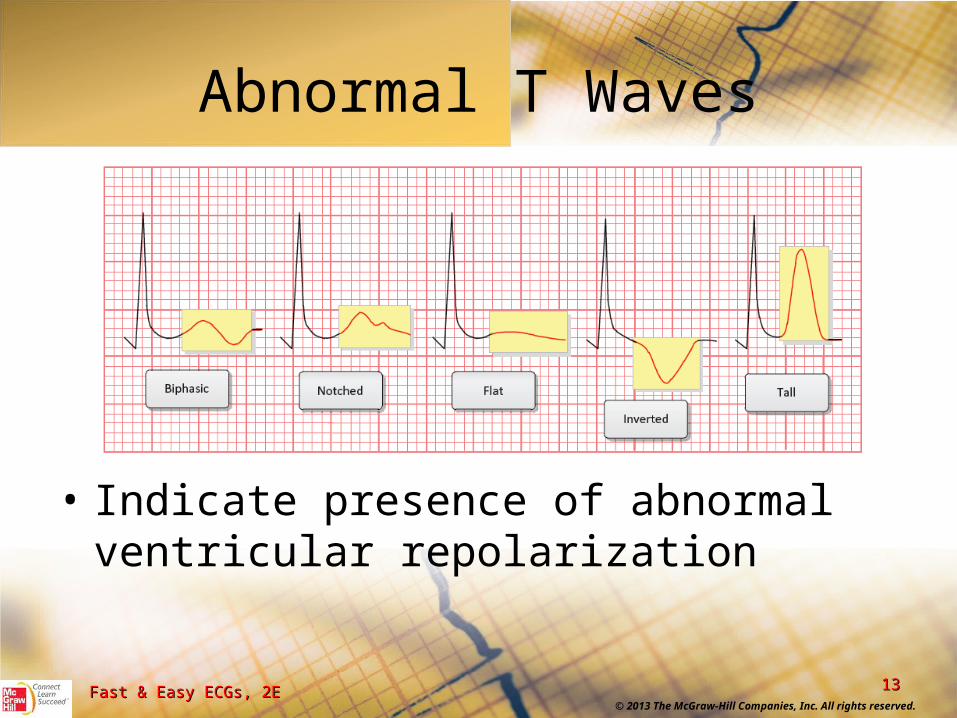
Abnormal T Waves
• Include those that are tall, peaked or tented, inverted (in leads where they should be upright), biphasic, flat, wide, and heavily notched and those having bumps
© 2013 The McGraw-Hill Companies, Inc. All rights reserved.
1313Fast & Easy ECGs, 2EFast & Easy ECGs, 2E
Abnormal T Waves
• Indicate presence of abnormal ventricular repolarization
© 2013 The McGraw-Hill Companies, Inc. All rights reserved.
1414Fast & Easy ECGs, 2EFast & Easy ECGs, 2E
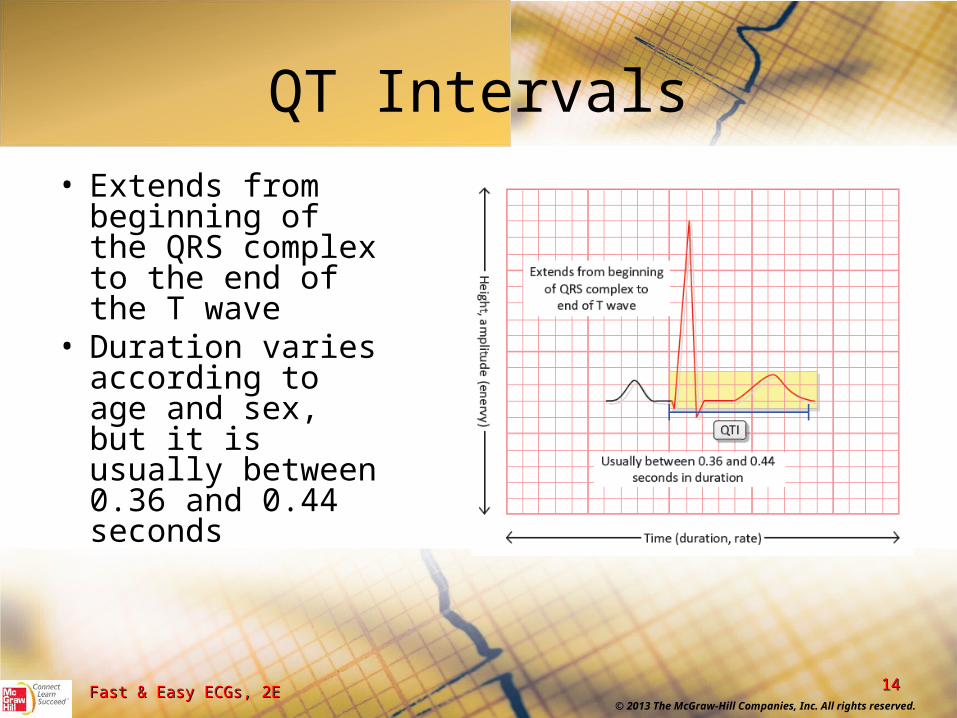
QT Intervals• Extends from
beginning of the QRS complex to the end of the T wave
• Duration varies according to age and sex, but it is usually between 0.36 and 0.44 seconds
© 2013 The McGraw-Hill Companies, Inc. All rights reserved.
1515Fast & Easy ECGs, 2EFast & Easy ECGs, 2E
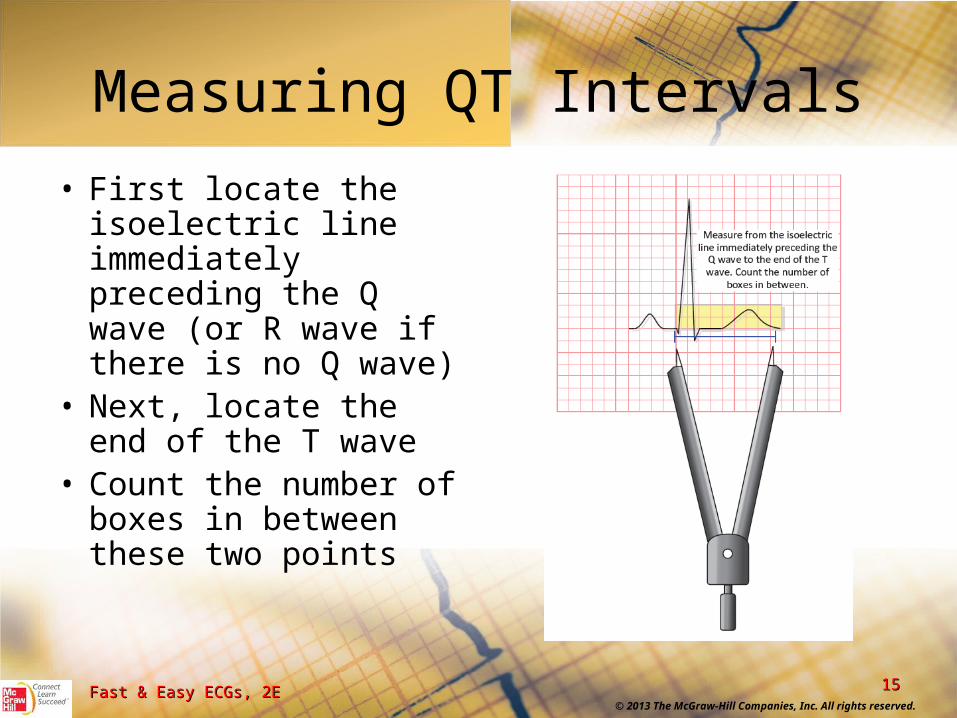
Measuring QT Intervals
• First locate the isoelectric line immediately preceding the Q wave (or R wave if there is no Q wave)
• Next, locate the end of the T wave
• Count the number of boxes in between these two points
© 2013 The McGraw-Hill Companies, Inc. All rights reserved.
1616Fast & Easy ECGs, 2EFast & Easy ECGs, 2E
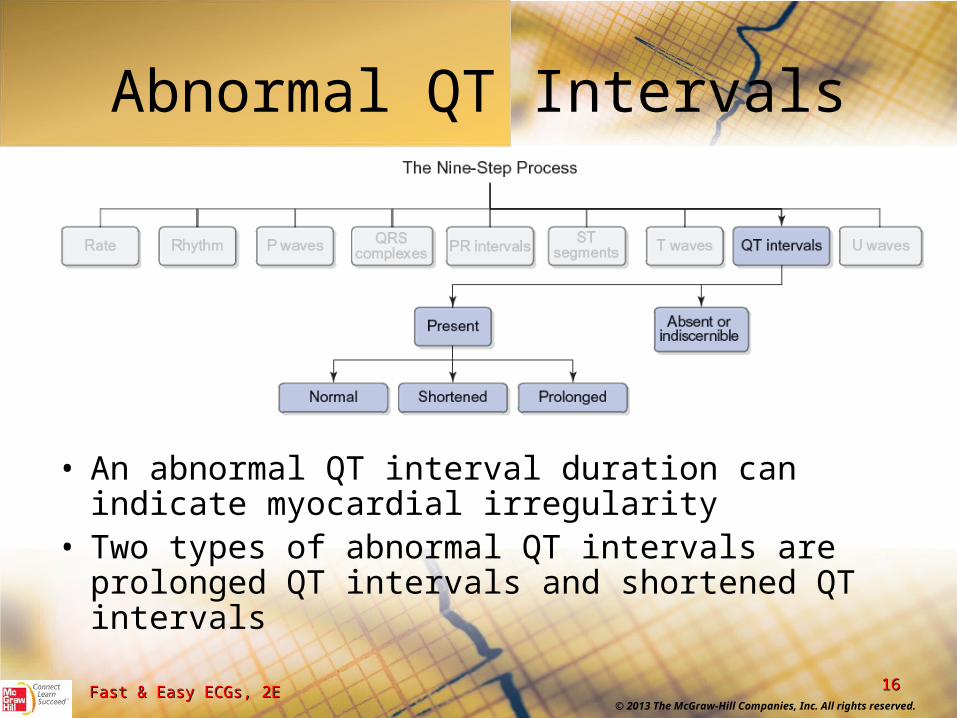
Abnormal QT Intervals
• An abnormal QT interval duration can indicate myocardial irregularity
• Two types of abnormal QT intervals are prolonged QT intervals and shortened QT intervals
© 2013 The McGraw-Hill Companies, Inc. All rights reserved.
1717Fast & Easy ECGs, 2EFast & Easy ECGs, 2E
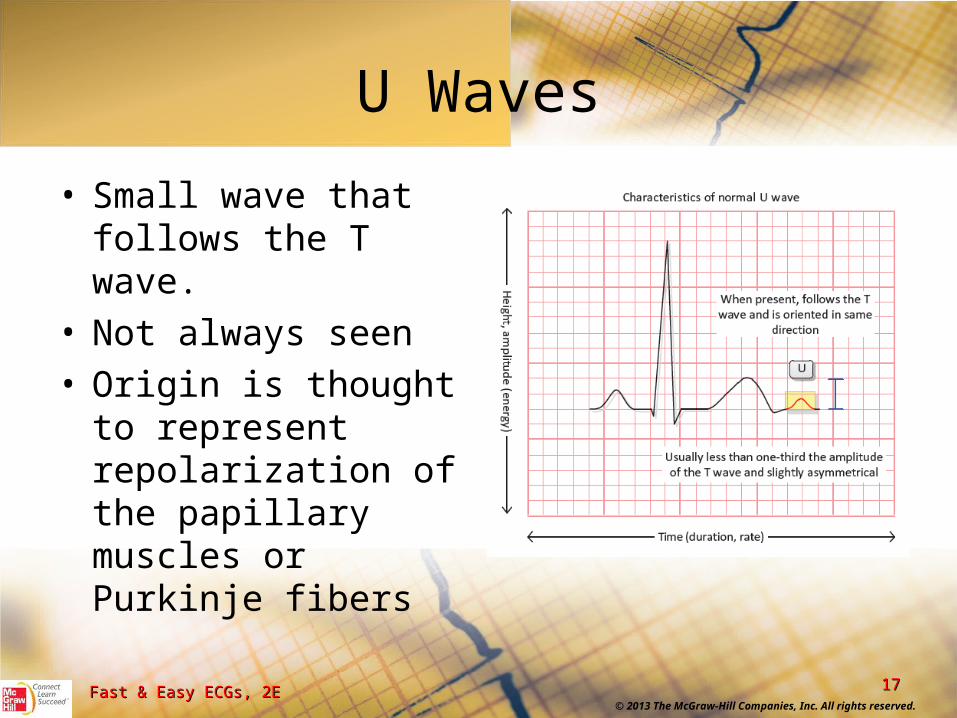
U Waves
• Small wave that follows the T wave.
• Not always seen • Origin is thought to
represent repolarization of the papillary muscles or Purkinje fibers
© 2013 The McGraw-Hill Companies, Inc. All rights reserved.
1818Fast & Easy ECGs, 2EFast & Easy ECGs, 2E
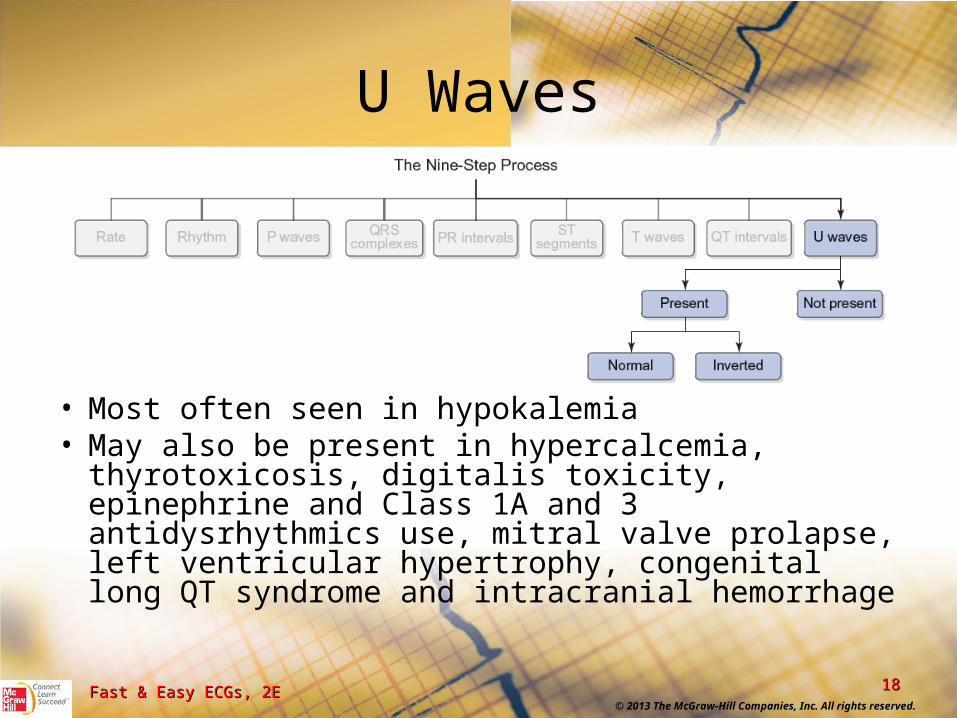
U Waves
• Most often seen in hypokalemia • May also be present in hypercalcemia, thyrotoxicosis,
digitalis toxicity, epinephrine and Class 1A and 3 antidysrhythmics use, mitral valve prolapse, left ventricular hypertrophy, congenital long QT syndrome and intracranial hemorrhage
© 2013 The McGraw-Hill Companies, Inc. All rights reserved.
1919Fast & Easy ECGs, 2EFast & Easy ECGs, 2E
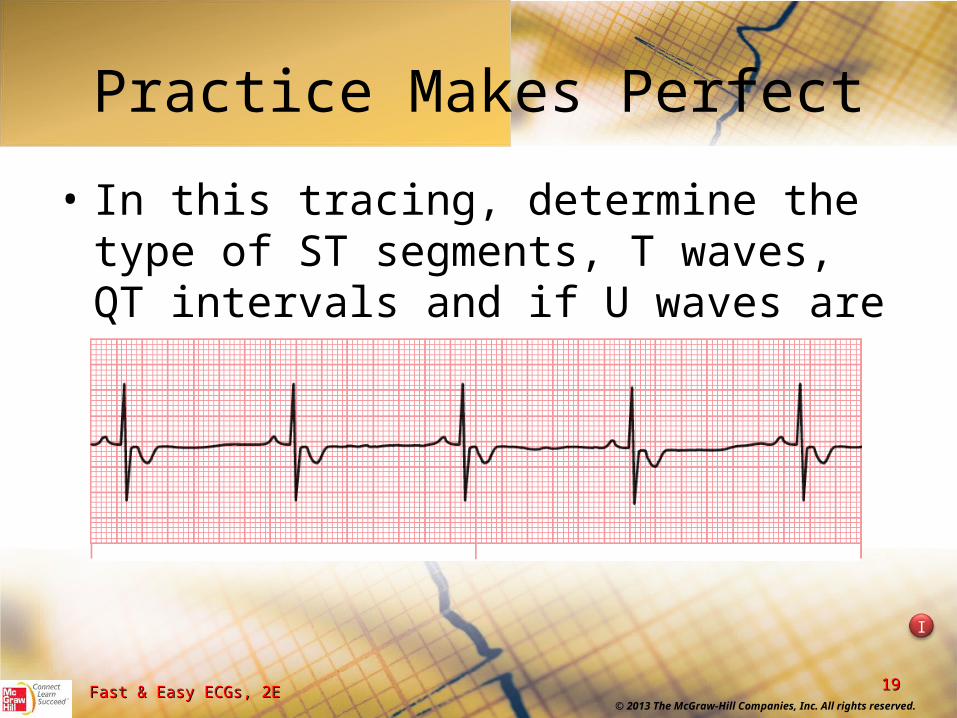
Practice Makes Perfect
• In this tracing, determine the type of ST segments, T waves, QT intervals and if U waves are present
I
© 2013 The McGraw-Hill Companies, Inc. All rights reserved.
2020Fast & Easy ECGs, 2EFast & Easy ECGs, 2E
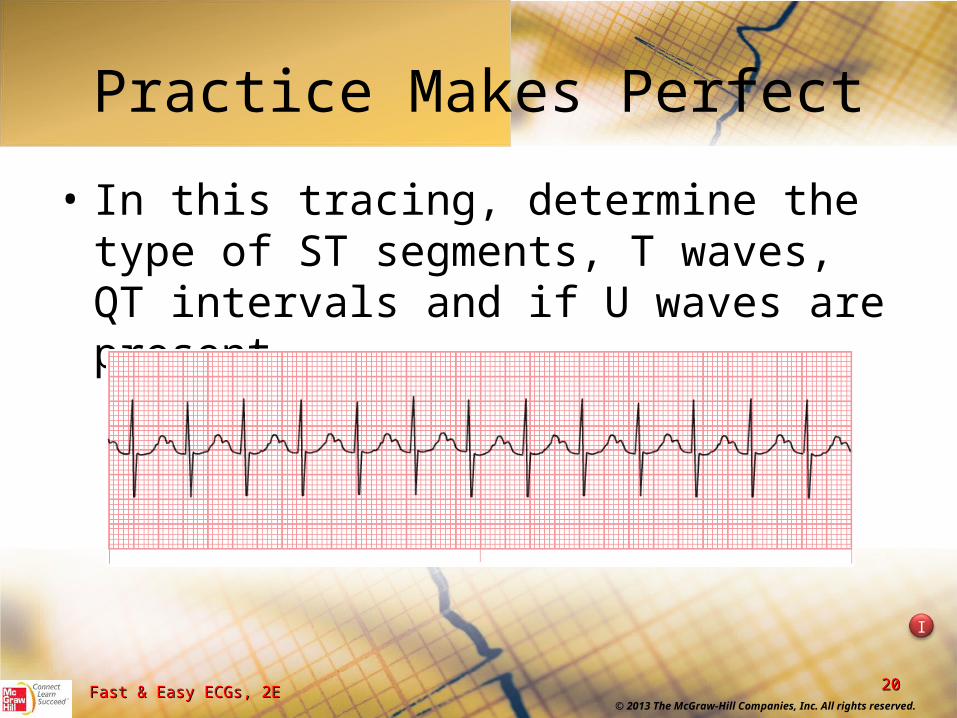
Practice Makes Perfect
• In this tracing, determine the type of ST segments, T waves, QT intervals and if U waves are present
I

© 2013 The McGraw-Hill Companies, Inc. All rights reserved.
2121Fast & Easy ECGs, 2EFast & Easy ECGs, 2E
Practice Makes Perfect
• In this tracing, determine the type of ST segments, T waves, QT intervals and if U waves are present
I
© 2013 The McGraw-Hill Companies, Inc. All rights reserved.
2222Fast & Easy ECGs, 2EFast & Easy ECGs, 2E
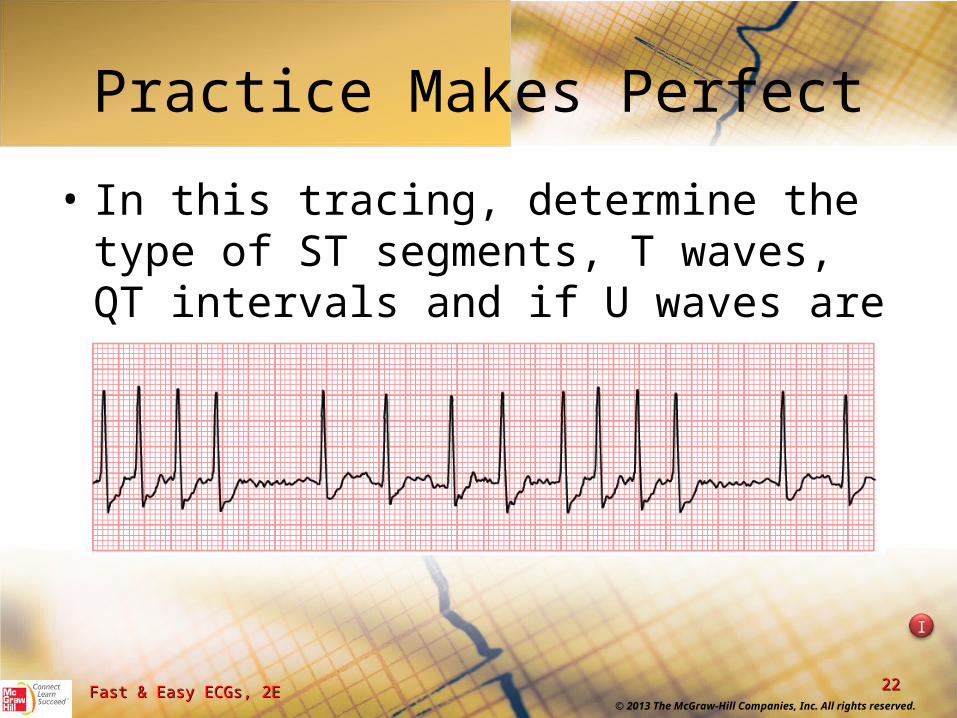
Practice Makes Perfect
• In this tracing, determine the type of ST segments, T waves, QT intervals and if U waves are present
I
© 2013 The McGraw-Hill Companies, Inc. All rights reserved.
2323Fast & Easy ECGs, 2EFast & Easy ECGs, 2E
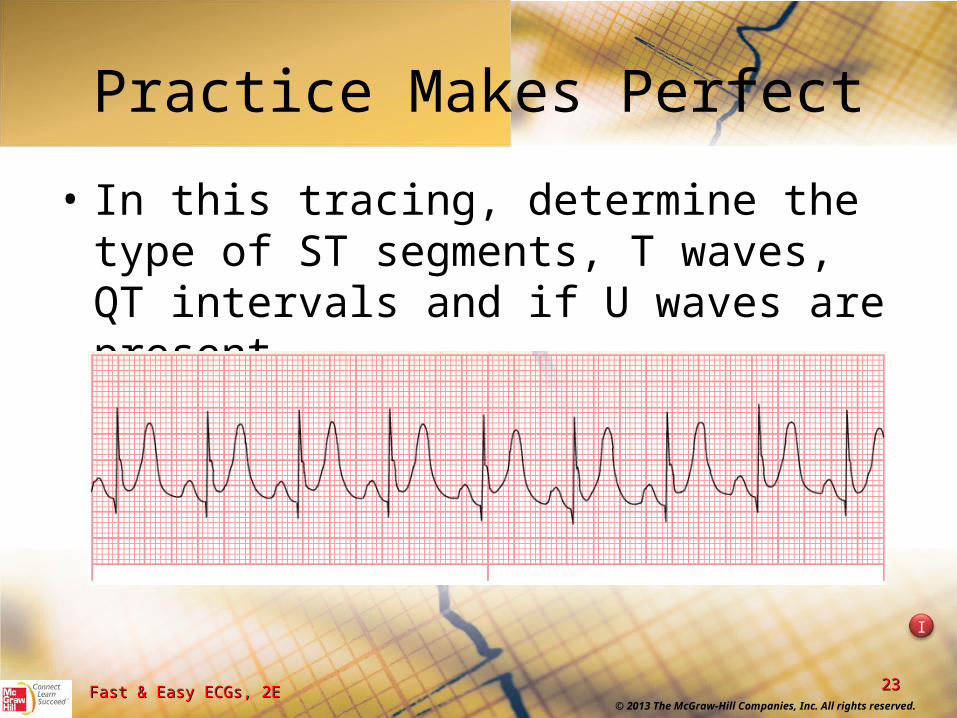
Practice Makes Perfect
• In this tracing, determine the type of ST segments, T waves, QT intervals and if U waves are present
I
© 2013 The McGraw-Hill Companies, Inc. All rights reserved.
2424Fast & Easy ECGs, 2EFast & Easy ECGs, 2E
Summary
• Assessing the ST segments, T waves, QT intervals, and U waves is a part of analyzing an ECG tracing
• The ST segment is the isoelectric line that follows the QRS complex and connects it to the T wave. It represents the end of ventricular depolarization and the beginning of ventricular repolarization
© 2013 The McGraw-Hill Companies, Inc. All rights reserved.
2525Fast & Easy ECGs, 2EFast & Easy ECGs, 2E
Summary
• ST segment depression or elevation can be evaluated by comparing the ST segment with the PR segment. It is considered elevated if it is above the baseline and depressed if it is below it
• Elevation or depression of the ST segment is a hallmark feature of myocardial ischemia and injury
© 2013 The McGraw-Hill Companies, Inc. All rights reserved.
2626Fast & Easy ECGs, 2EFast & Easy ECGs, 2E
Summary• The T wave represents the completion of
ventricular repolarization• The T wave is larger than the P wave and slightly
asymmetrical. It is oriented in the same direction as the preceding QRS complex
• Abnormal T waves indicate the presence of abnormal ventricular repolarization
• Tall or peaked and inverted T waves (in certain leads) may be seen in myocardial ischemia
© 2013 The McGraw-Hill Companies, Inc. All rights reserved.
2727Fast & Easy ECGs, 2EFast & Easy ECGs, 2E
Summary• The QT interval represents the time needed for
ventricular depolarization and repolarization• It extends from the beginning of the QRS
complex to the end of the T wave• Its duration varies according to age, sex, and
heart rate, but it is usually between 0.36 and 0.44 seconds
• In certain conditions, such as myocardial ischemia or infarction, a prolonged QT interval can predispose the patient to life-threatening ventricular dysrhythmias
© 2013 The McGraw-Hill Companies, Inc. All rights reserved.
2828Fast & Easy ECGs, 2EFast & Easy ECGs, 2E
Summary
• When present, the U wave is a small, rounded wave that follows the T wave. It has the same polarity as the T wave.
• Prominent U waves are most often seen in hypokalemia


![Clinical Study Report: 1403V921D 18 December 2014...QRS, QT, pulse rate [PR], and QTc-intervals), and laboratory test evaluations (hematology, blood chemistry, and urinalysis) were](https://img.pdfslide.us/doc/110x75/5e75db2cd6616129ce2eba9e/clinical-study-report-1403v921d-18-december-2014-qrs-qt-pulse-rate-pr.jpg)