Embed Size (px)
Citation preview
0
Preliminary ResultsYear ended 31 March 2008
Presentation – 5 June 2008
1
Disclaimers
For the purposes of the following disclaimers, references to this "document" shall be deemed to include references to the presenters' speeches, the question and answer session and any other related verbal or written communications.
This document contains certain “forward-looking statements” with respect to Severn Trent’s financial condition, results of operations and business, and certain of Severn Trent’s plans and objectives with respect to these items. Forward-looking statements are sometimes, but not always, identified by their use of a date in the future or such words as “anticipates”, “aims”, “due”, “could”, “may”, “should”, “expects”, “believes”, “intends”, “plans”, “targets”, “goal” or “estimates”. By their very nature forward-looking statements are inherently unpredictable, speculative and involve risk and uncertainty because they relate to events and depend on circumstances that will occur in the future. There are a number of factors that could cause actual results and developments to differ materially from those expressed or implied by these forward-looking statements. These factors include, but are not limited to, changes in the economies and markets in which the Group operates; changes in the regulatory and competition frameworks in which the Group operates; changes in the markets from which the Group raises finance; the impact of legal or other proceedings against or which affect the Group; and changes in interest and exchange rates. All written or verbal forward-looking statements, made in this document or made subsequently, which are attributable to Severn Trent or any other member of the Group or persons acting on their behalf are expressly qualified in their entirety by the factors referred to above. Severn Trent does not intend to update these forward-looking statements.
This document is not an offer to sell, exchange or transfer any securities of Severn Trent Plc or any of its subsidiaries and is not soliciting an offer to purchase, exchange or transfer such securities in any jurisdiction. Securities may not be offered, sold or transferred in the United States absent registration or an applicable exemption from the registration requirements of the US Securities Act of 1933 (as amended). Without prejudice to the above, whilst Severn Trent Plc accepts liability to the extent required by the Listing Rules of the UK Listing Authority for any information contained within this document which Severn Trent Plc makes publicly available as required by the Listing Rules;
(a) neither Severn Trent Plc nor any other member of the Group or persons acting on their behalf shall otherwise have any liability whatsoever for loss howsoever arising, directly or indirectly, from use of the information contained within this document;
(b) neither Severn Trent Plc nor any other member of the Group or persons acting on their behalf makes any representation or warranty, express or implied, as to the accuracy or completeness of the information contained within this document.
Without prejudice to the above, no reliance may be placed upon the information contained within this document to the extent that such information is subsequently updated by or on behalf of Severn Trent Plc.
Past performance of securities of Severn Trent Plc cannot be relied upon as a guide to the future performance of securities of Severn Trent Plc.
2
Sir John EganChairman

3
Mike McKeonFinance Director
4
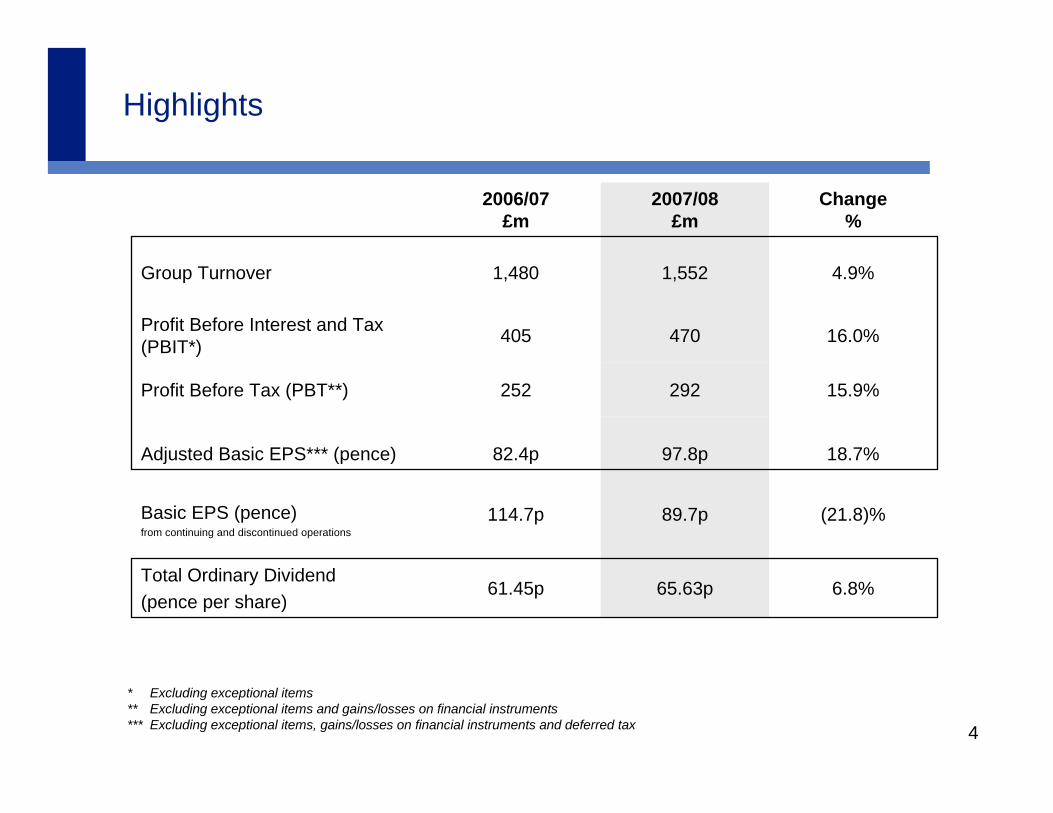
* Excluding exceptional items** Excluding exceptional items and gains/losses on financial instruments*** Excluding exceptional items, gains/losses on financial instruments and deferred tax
Highlights
6.8%65.63p61.45pTotal Ordinary Dividend(pence per share)
(21.8)%89.7p114.7pBasic EPS (pence)from continuing and discontinued operations
18.7%97.8p82.4pAdjusted Basic EPS*** (pence)
15.9%292252Profit Before Tax (PBT**)
16.0%470405Profit Before Interest and Tax (PBIT*)
4.9%1,5521,480Group Turnover
Change %
2007/08 £m
2006/07 £m
5
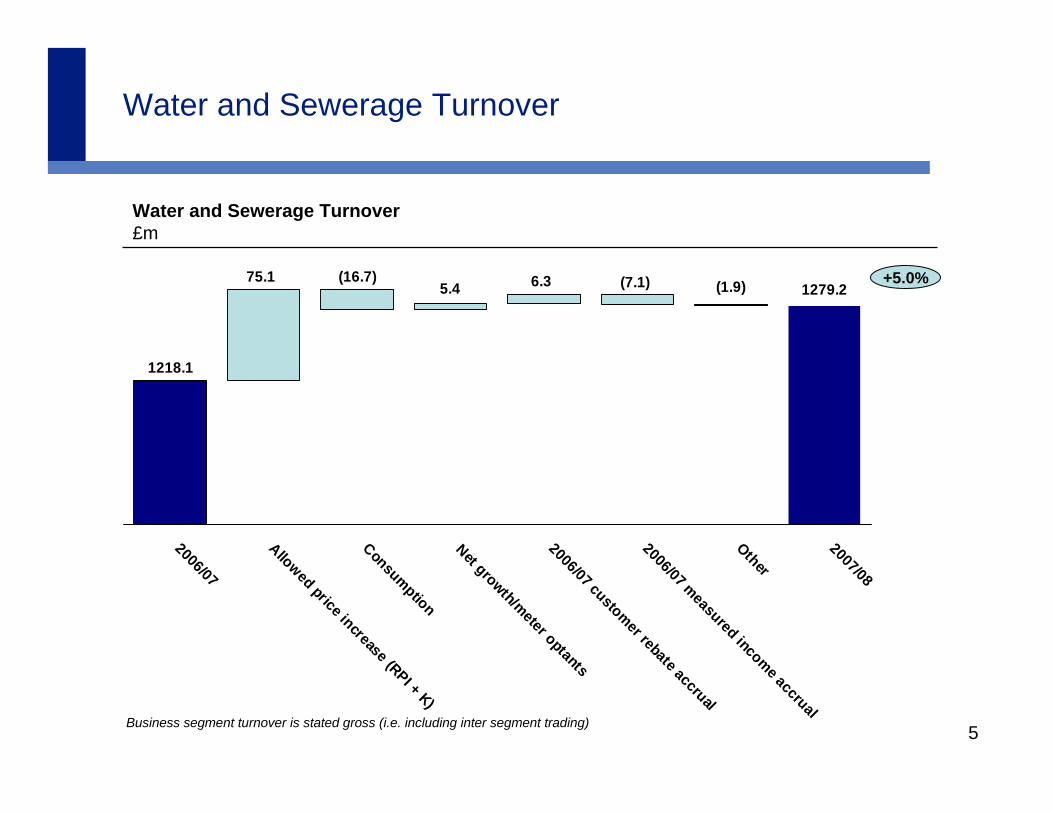
1279.2
1218.1
(1.9)(7.1)6.35.4(16.7)75.1
2006/07
Allowed price increase (RPI + K)
Consumption
Net growth/meter optants
2006/07 customer rebate accrual
2006/07 measured income accrual
Other
2007/08
Water and Sewerage Turnover
Water and Sewerage Turnover£m
Business segment turnover is stated gross (i.e. including inter segment trading)
+5.0%
6
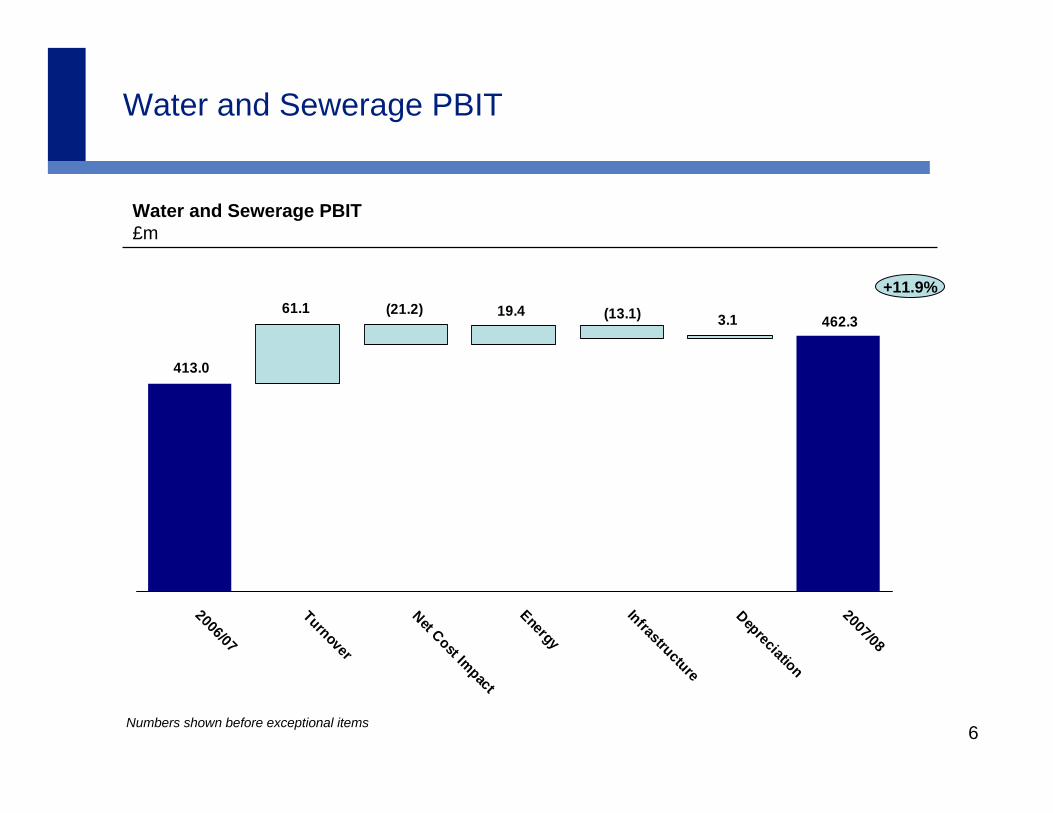
462.3
413.0
3.1(13.1)19.4(21.2)61.1
2006/07
Turnover
Net Cost Impact
Energy
Infrastructure
Depreciation
2007/08
Water and Sewerage PBIT
Water and Sewerage PBIT£m
+11.9%
Numbers shown before exceptional items
7
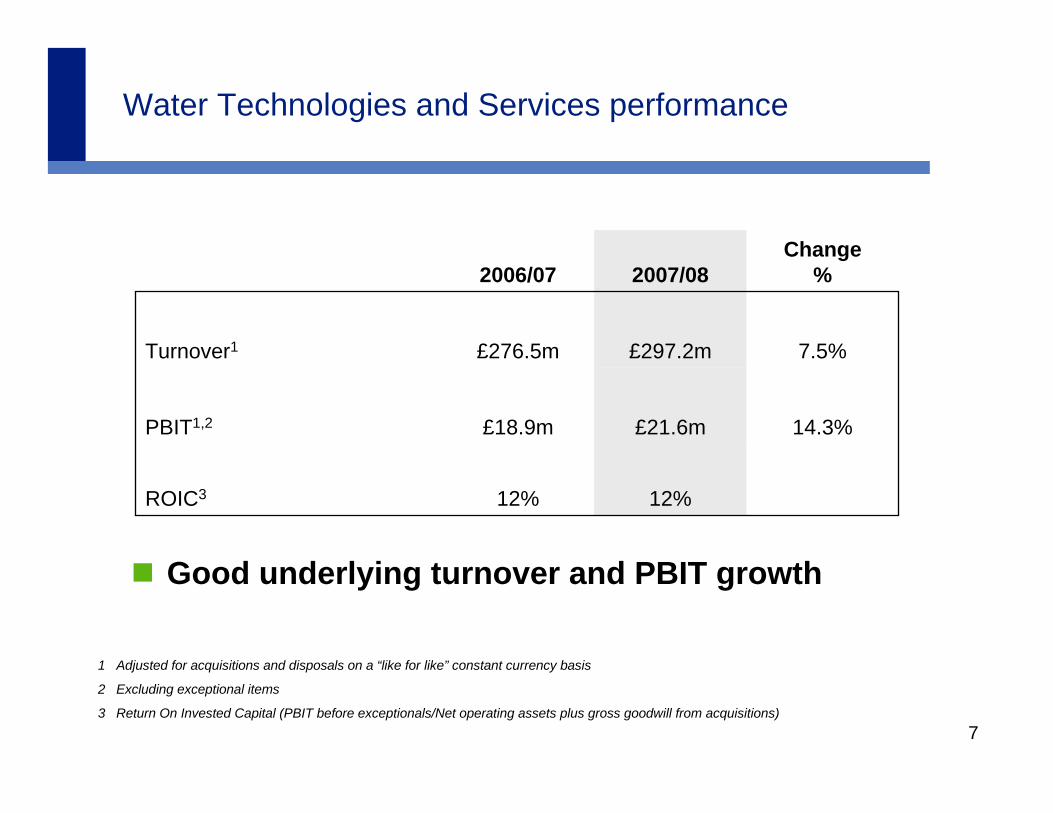
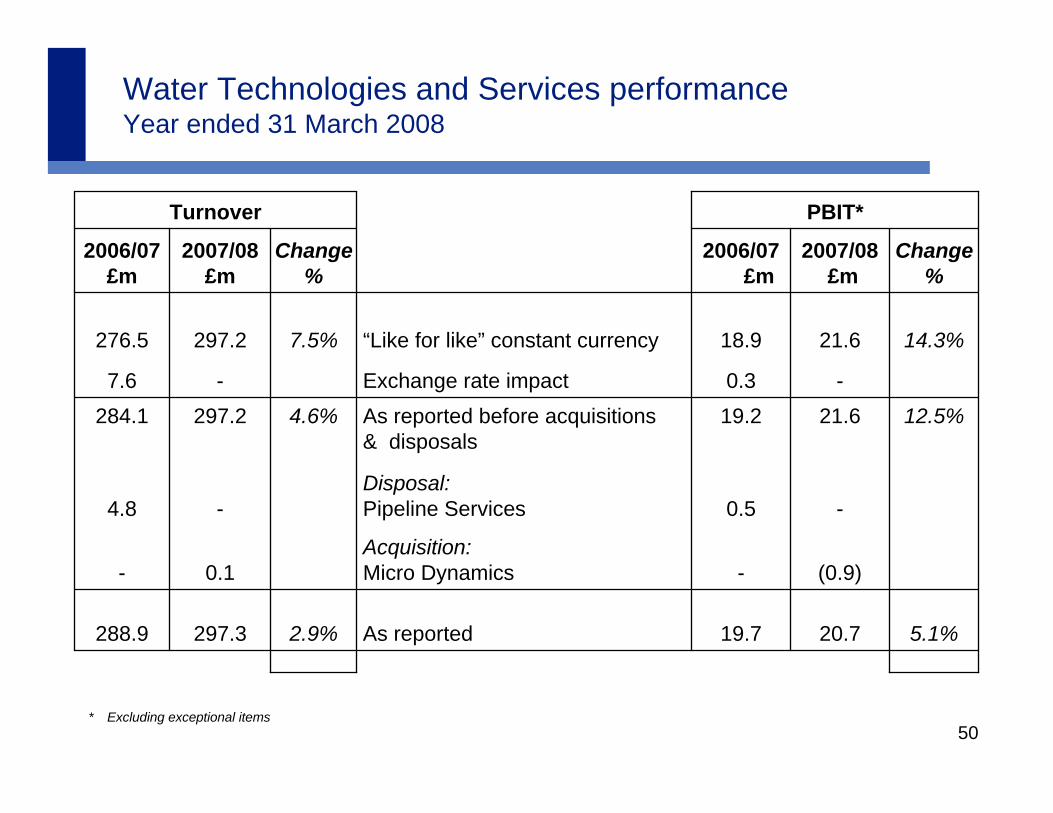
Water Technologies and Services performance
12%
£18.9m
£276.5m
2006/07
14.3%
7.5%
Change%
ROIC3
PBIT1,2
Turnover1
12%
£21.6m
£297.2m
2007/08
1 Adjusted for acquisitions and disposals on a “like for like” constant currency basis
2 Excluding exceptional items
3 Return On Invested Capital (PBIT before exceptionals/Net operating assets plus gross goodwill from acquisitions)
Good underlying turnover and PBIT growth
8* Excluding exceptional items
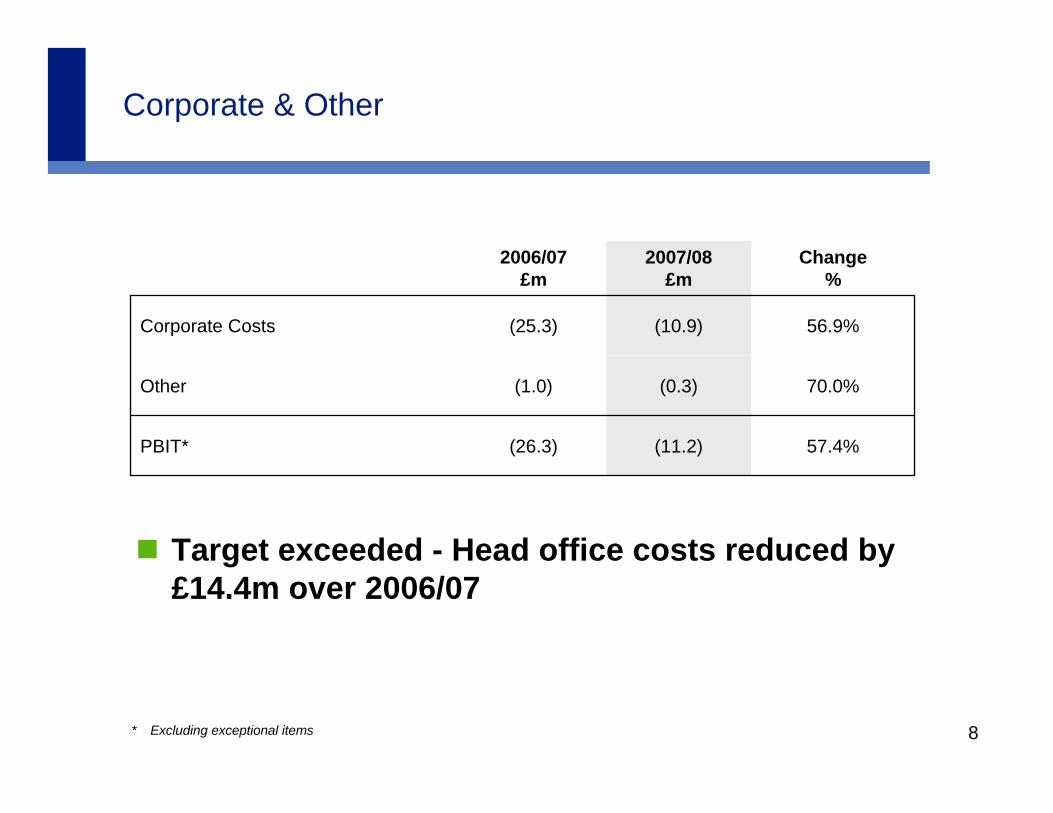
Corporate & Other
(26.3)
(1.0)
(25.3)
2006/07 £m
PBIT*
Other
Corporate Costs 56.9%(10.9)
70.0%(0.3)
57.4%(11.2)
Change %
2007/08 £m
Target exceeded - Head office costs reduced by £14.4m over 2006/07
9
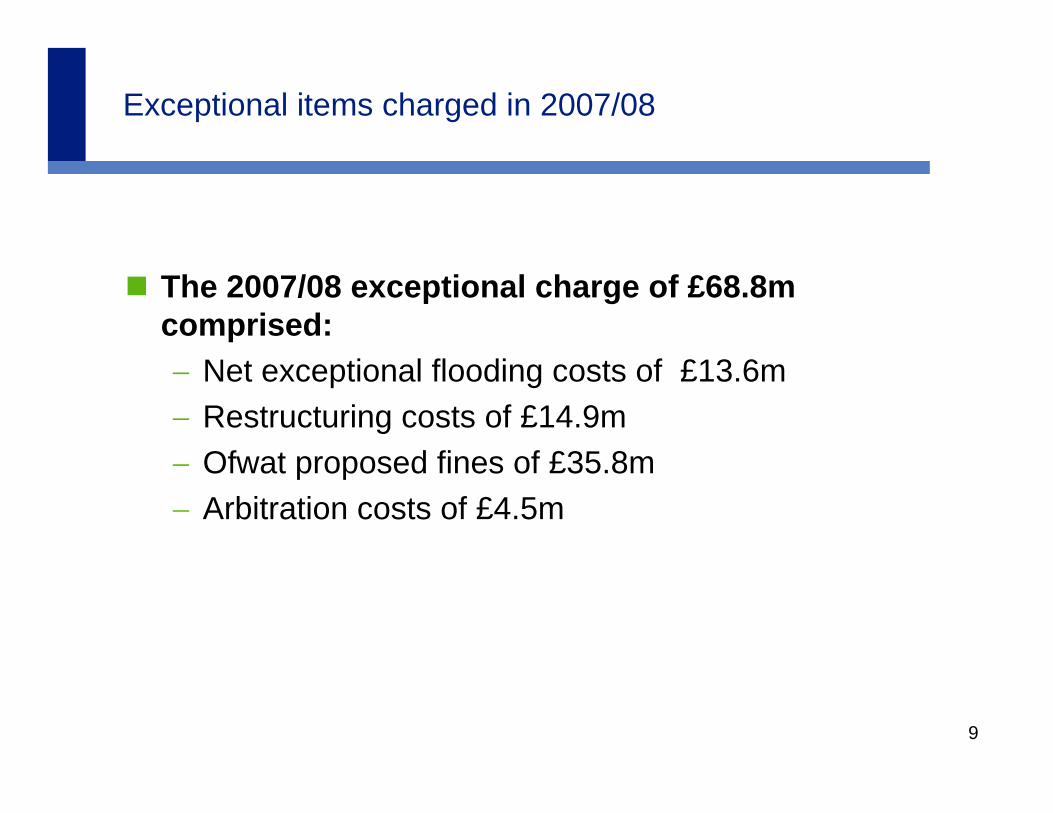
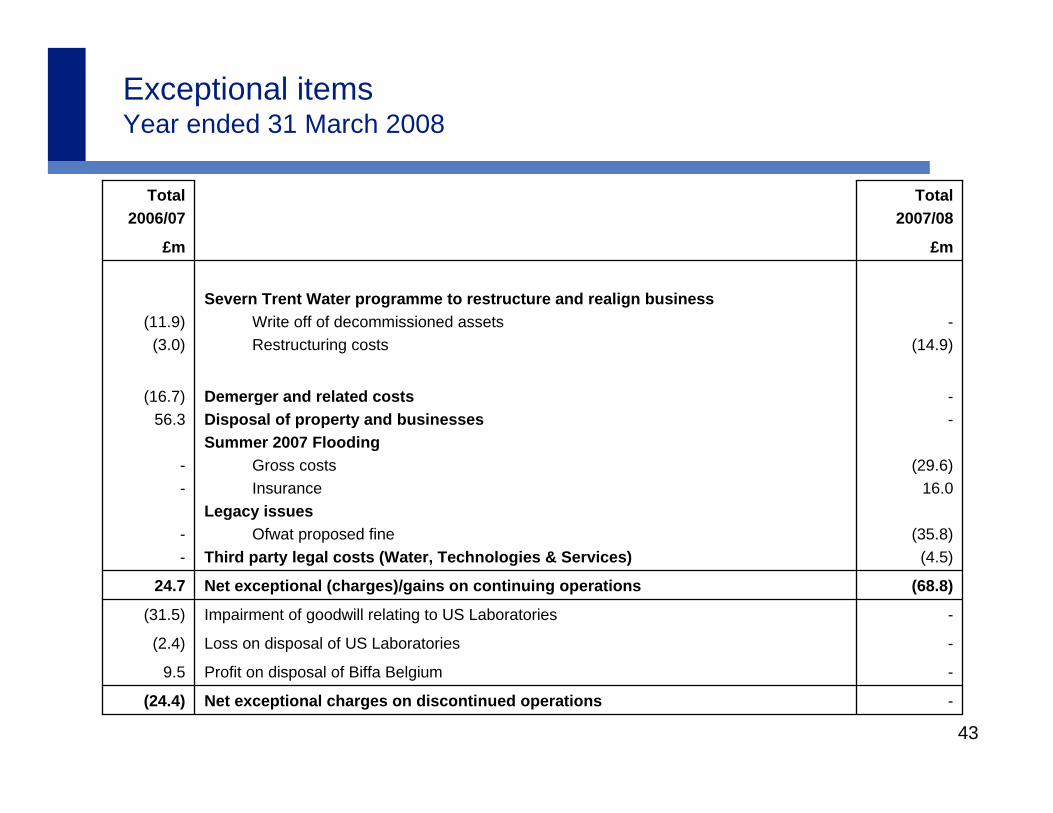
Exceptional items charged in 2007/08
The 2007/08 exceptional charge of £68.8m comprised:− Net exceptional flooding costs of £13.6m− Restructuring costs of £14.9m− Ofwat proposed fines of £35.8m− Arbitration costs of £4.5m
10
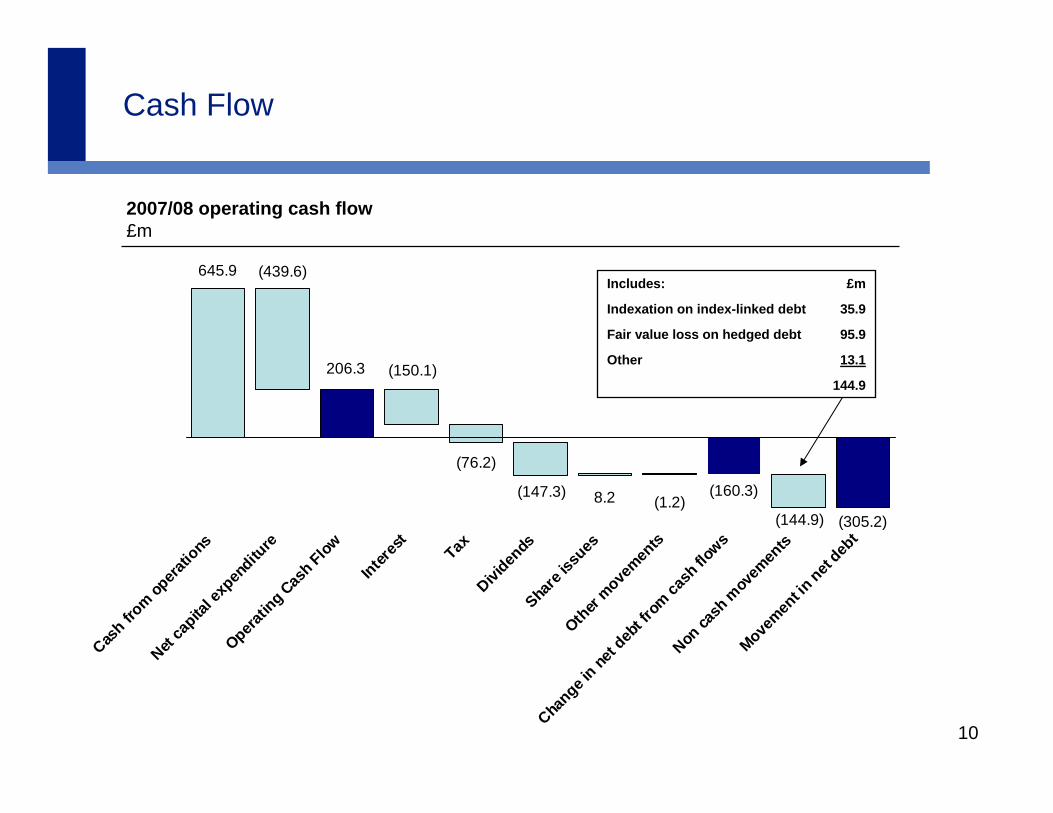
645.9
(76.2)
(305.2)
(439.6)
206.3 (150.1)
(147.3) 8.2 (1.2)(160.3)
(144.9)
Cash fr
om opera
tions
Net ca
pital e
xpen
diture
Operatin
g Cas
h Flow
Interes
t
TaxDivi
dends
Share
issues
Other
movemen
ts
Change i
n net d
ebt fr
om ca
sh flo
ws
Non ca
sh m
ovem
ents
Movemen
t in net
debt
Cash Flow
2007/08 operating cash flow£m
144.9
13.1Other
95.9Fair value loss on hedged debt
35.9Indexation on index-linked debt
£mIncludes:
11
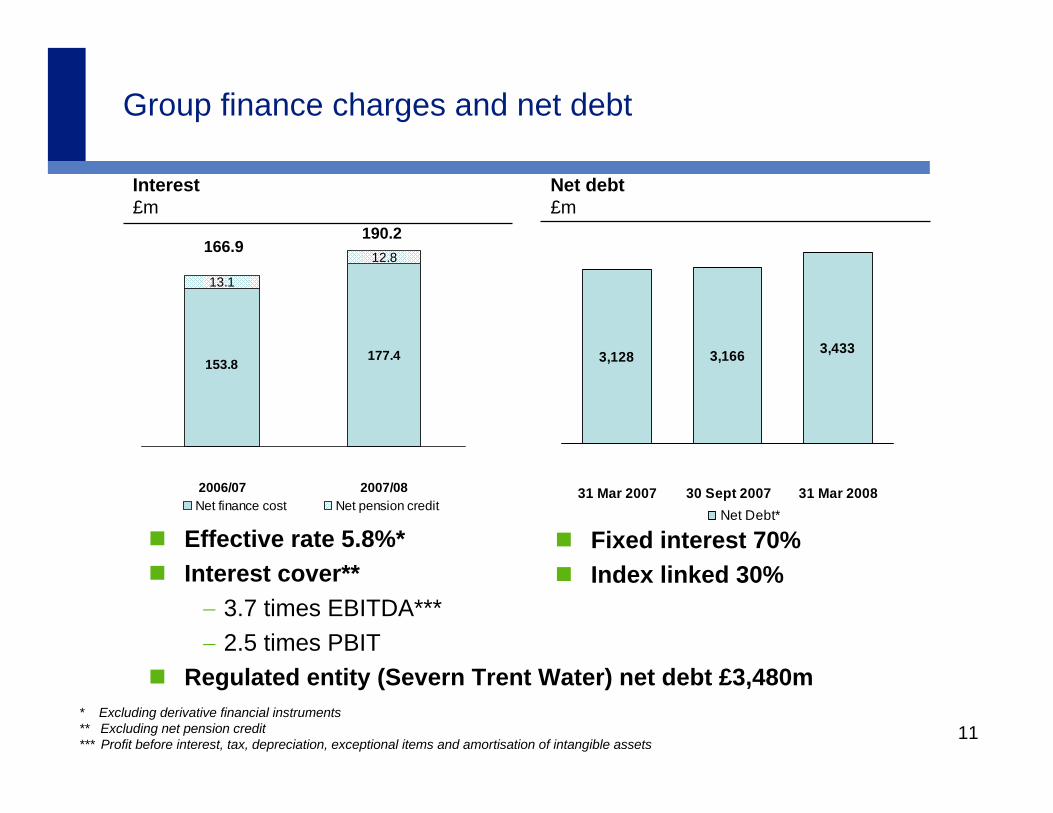
3,128 3,166 3,433
31 Mar 2007 30 Sept 2007 31 Mar 2008Net Debt*
Net debt£m
Interest£m
177.4153.8
12.8
13.1
2006/07 2007/08Net finance cost Net pension credit
Group finance charges and net debt
* Excluding derivative financial instruments** Excluding net pension credit*** Profit before interest, tax, depreciation, exceptional items and amortisation of intangible assets
166.9190.2
Effective rate 5.8%*Interest cover**− 3.7 times EBITDA***− 2.5 times PBIT
Regulated entity (Severn Trent Water) net debt £3,480m
Fixed interest 70%Index linked 30%
12
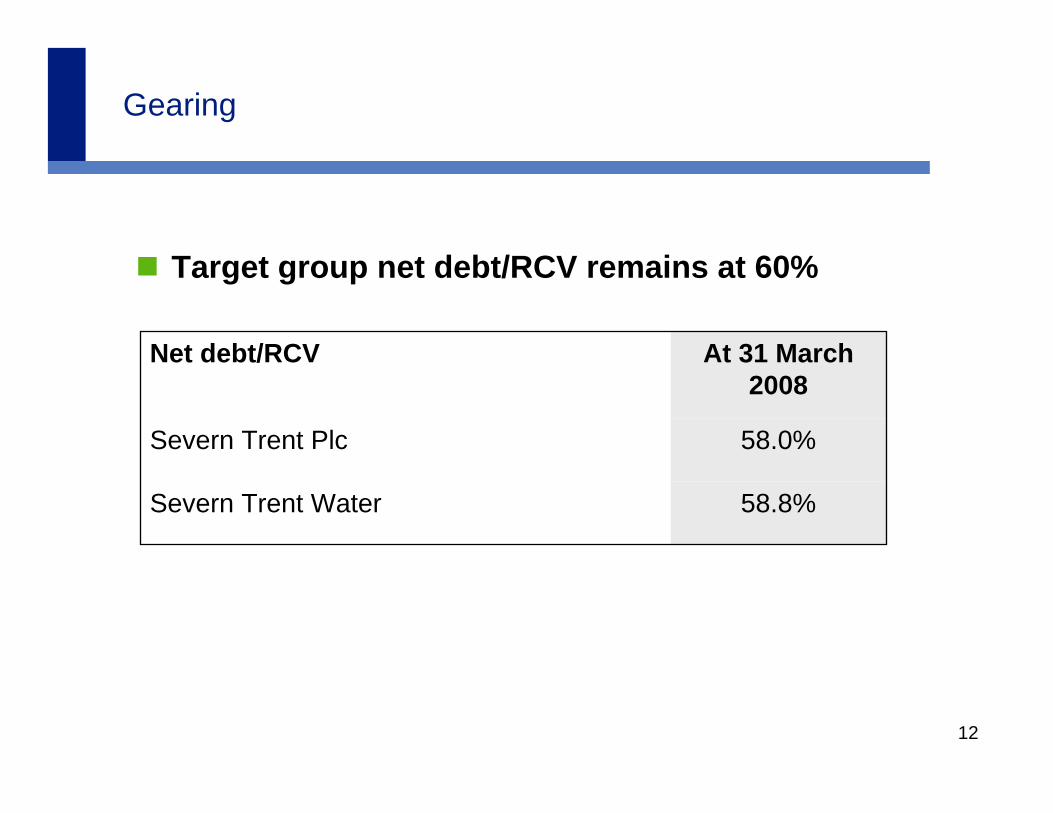
Gearing
Target group net debt/RCV remains at 60%
58.8%Severn Trent Water
58.0%Severn Trent Plc
At 31 March 2008
Net debt/RCV
13
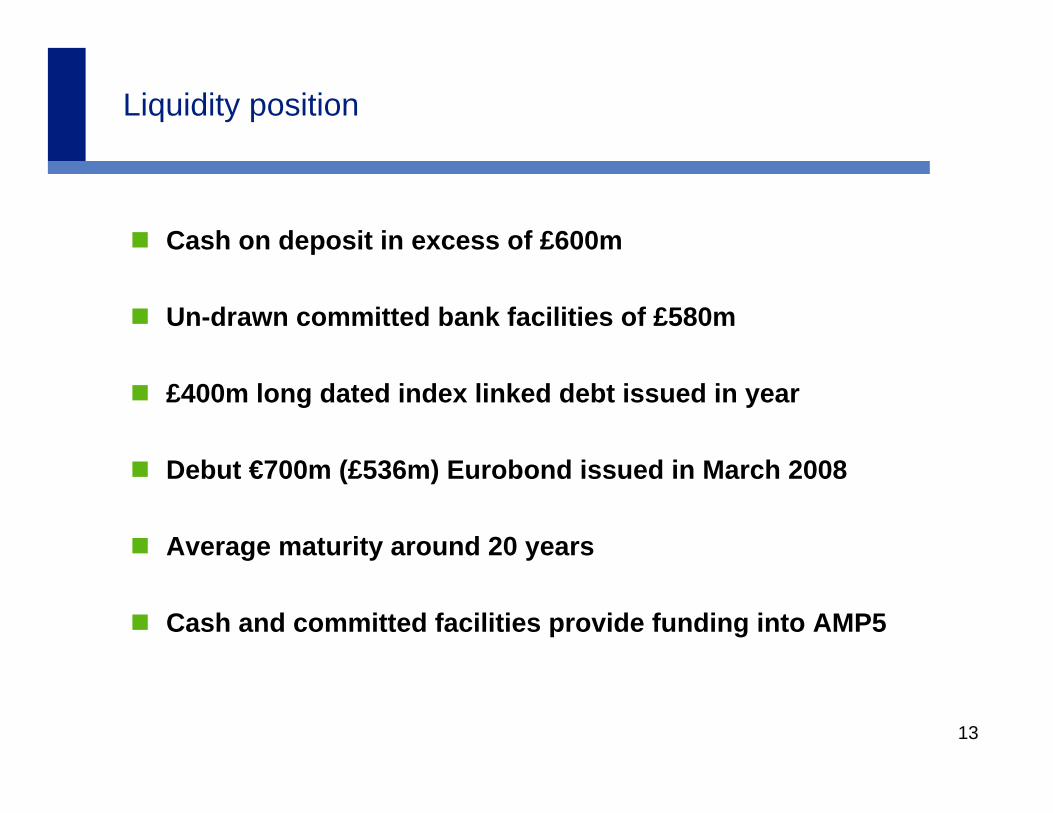
Liquidity position
Cash on deposit in excess of £600m
Un-drawn committed bank facilities of £580m
£400m long dated index linked debt issued in year
Debut €700m (£536m) Eurobond issued in March 2008
Average maturity around 20 years
Cash and committed facilities provide funding into AMP5

14
Effective rate of current tax
2006/07 Effective current tax rate%
*Attributable to PBT before IAS 39 fair value adjustments, exceptional items and share of results of associates and joint ventures. Excluding discontinued operations
2008/09 Full Year Severn Trent Group in range of 25%-27%
25.6%19.2%
(6.4%)
Effective rate* Exceptional items andprior year adjs.
2007/08 as reported
2007/08 Effective current tax rate%
26.9% 23.2%
(3.7%)
Effective rate* Exceptional items and prior year adjs.
2006/07 as reported
Impact of IBAs on 2008/09 deferred tax charge around £170m
15
Financial summary
Delivering tangible results across the group
Delivering on dividend growth
Delivering benefits on costs

16
Tony WrayChief Executive
17
Focus on water – Continuous improvement
Delivering tangible results for
− Customers− Regulators− Shareholders
Higher standards Greater efficiencyContinuous improvement
18
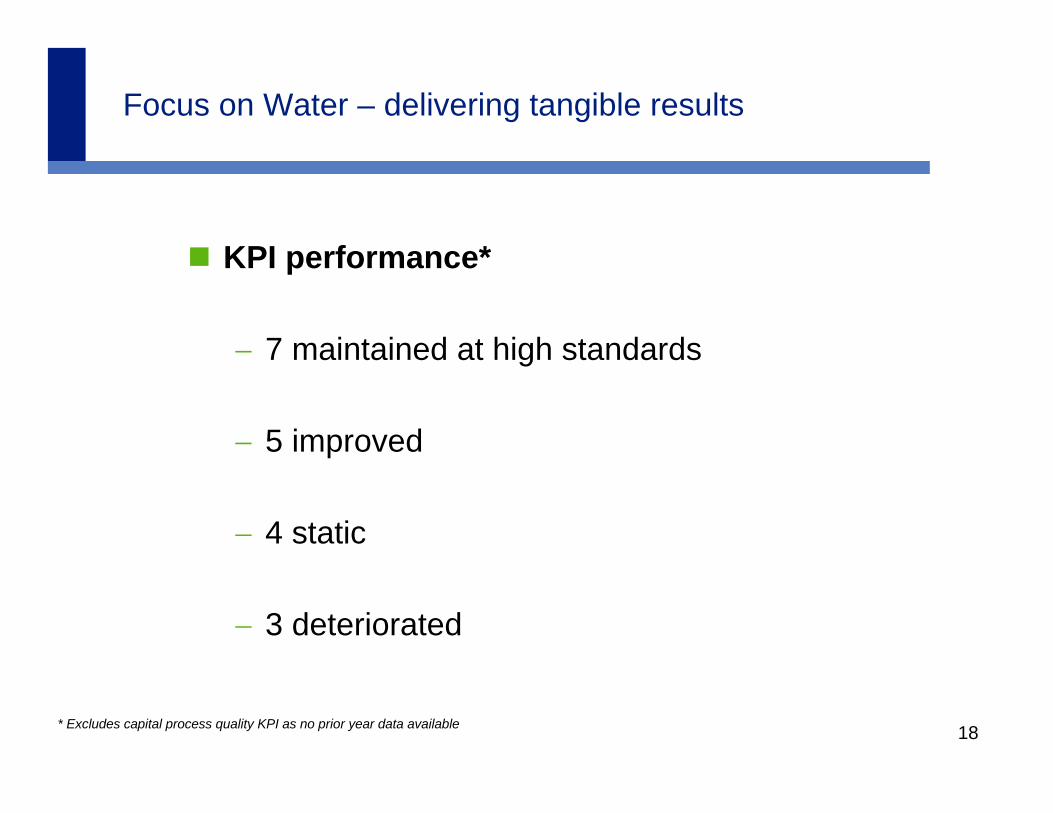
Focus on Water – delivering tangible results
KPI performance*
− 7 maintained at high standards
− 5 improved
− 4 static
− 3 deteriorated
* Excludes capital process quality KPI as no prior year data available

19
0.21
0.17
2006/07 2007/08
21.86**
10.70
2006/07 2007/08
Continued focus required in some areas
Unplanned interruptions >6hrsMAT* (per 1,000 properties)
Sewer flooding incidents- Other causesMAT (per 1,000 properties)
GOOD GOOD
• Moving Annual Total
** Unplanned Interruptions excludes impact of Summer 2007 Flooding, including flooding = 184.5
0.610.59
2006/07 2007/08
Lost time incidentsMAT (per 1,000 hours worked)
GOOD
20
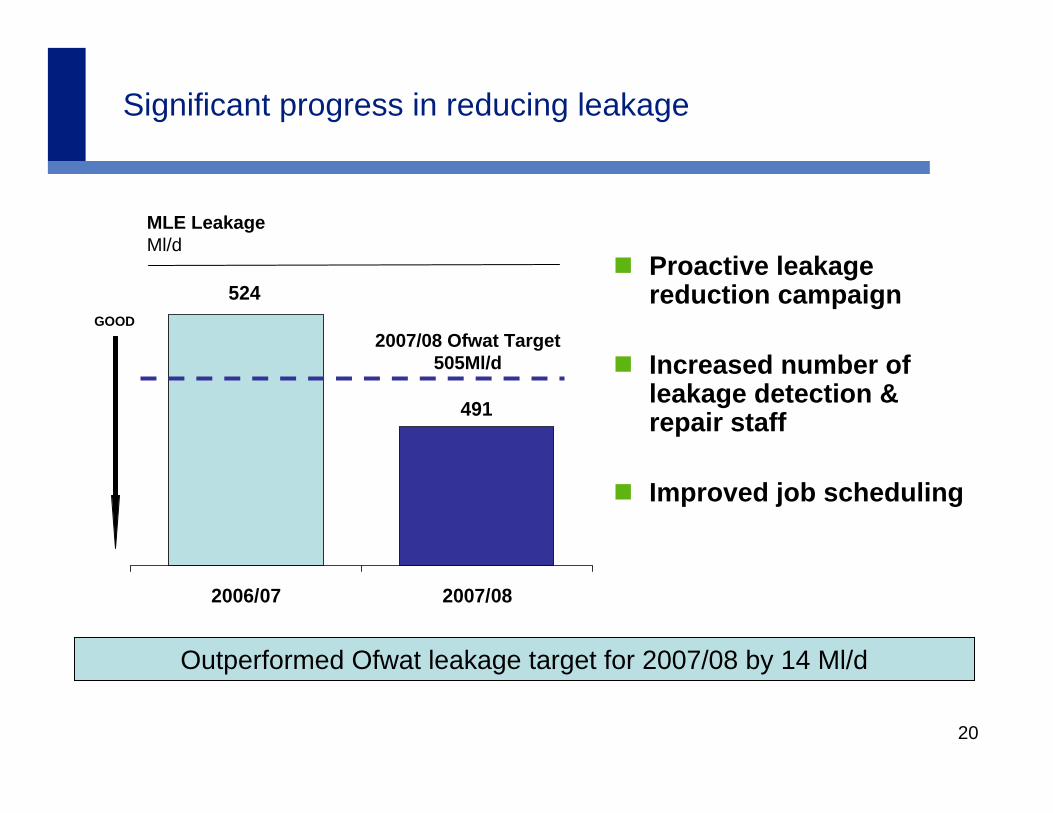
491
524
2006/07 2007/08
Significant progress in reducing leakage
MLE LeakageMl/d
Outperformed Ofwat leakage target for 2007/08 by 14 Ml/d
Proactive leakage reduction campaign
Increased number of leakage detection & repair staff
Improved job scheduling
2007/08 Ofwat Target 505Ml/d
GOOD
21
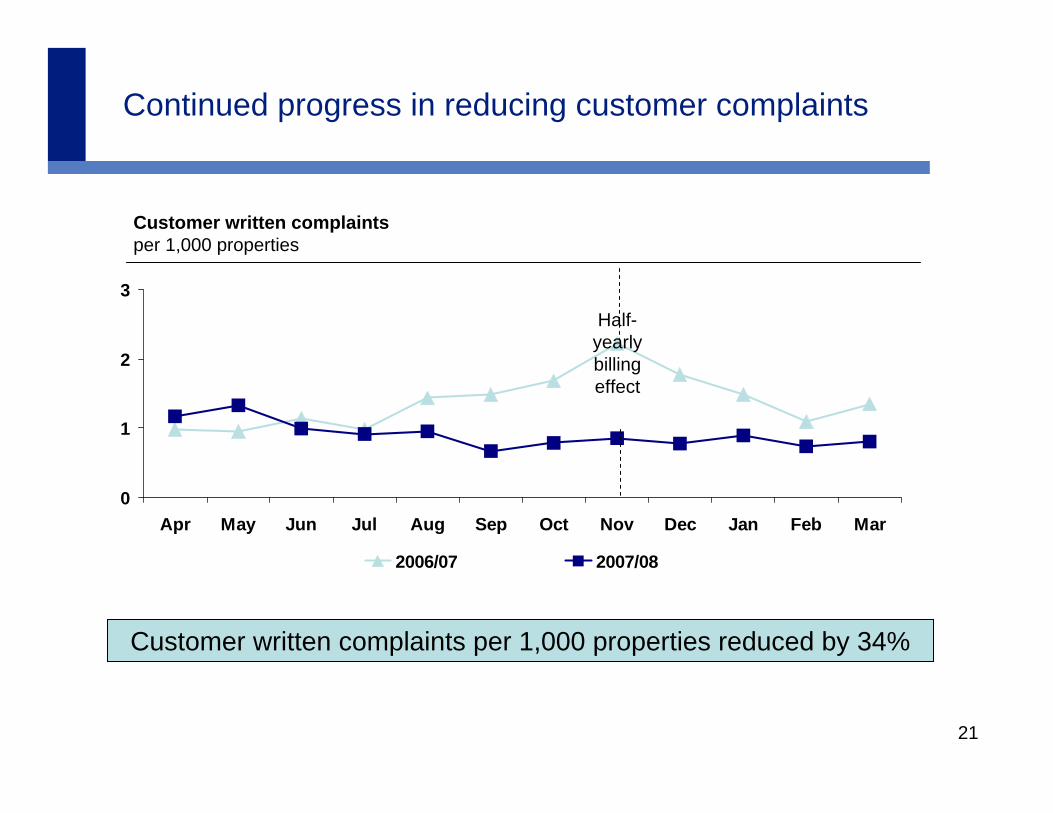
Continued progress in reducing customer complaints
Customer written complaintsper 1,000 properties
0
1
2
3
Apr May Jun Jul Aug Sep Oct Nov Dec Jan Feb Mar
2006/07 2007/08
Half-yearly billing effect
Customer written complaints per 1,000 properties reduced by 34%
22
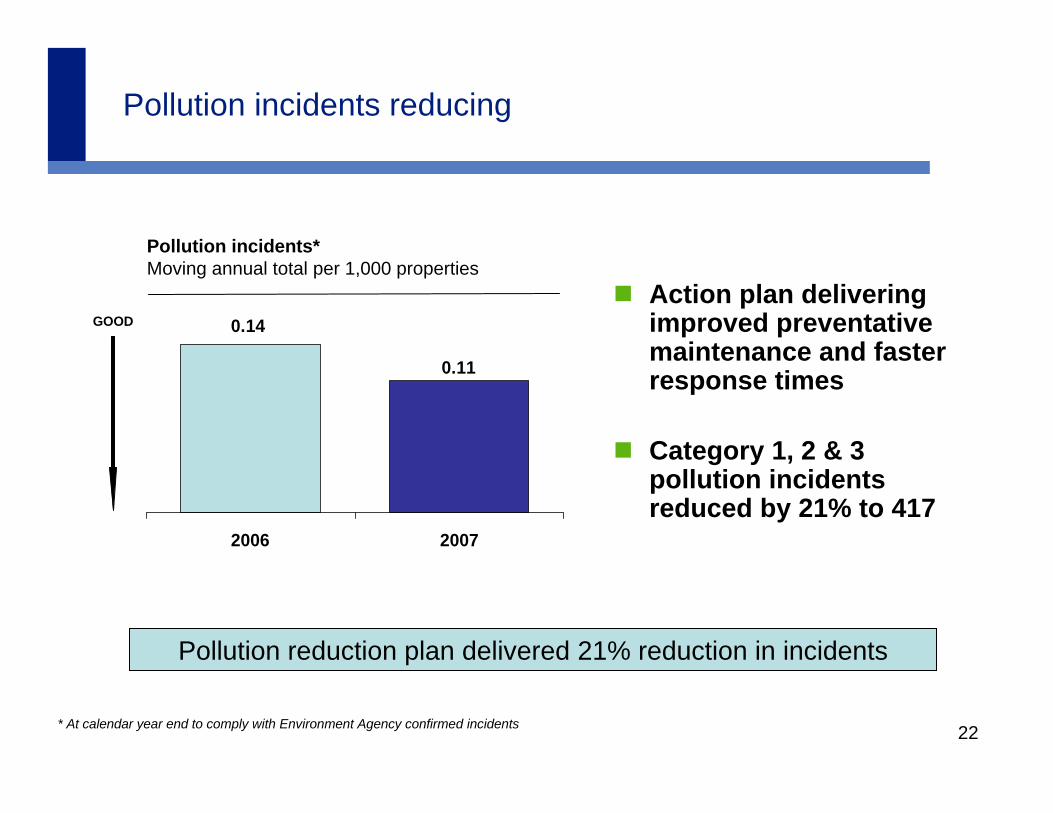
Pollution incidents reducing
Pollution incidents*Moving annual total per 1,000 properties
0.11
0.14
2006 2007
Pollution reduction plan delivered 21% reduction in incidents
Action plan delivering improved preventative maintenance and faster response times
Category 1, 2 & 3 pollution incidents reduced by 21% to 417
* At calendar year end to comply with Environment Agency confirmed incidents
GOOD

23
Outperformed against Ofwat FD for operating costs
On track to deliver 3% out-performance over balance of AMP4
Improvement plans to deliver £30m of opex. efficiencies over last 2 years of AMP4
Majority of energy costs fixed for 2008/09 and 2009/10
Operational costs vs. Ofwat Final Determination£m
485.9480.9
(5.0)
2007/08 FD out-performance
2007/08 Actual
Out-performed in 2007/08 by 1%
* UK GAAP
*
24
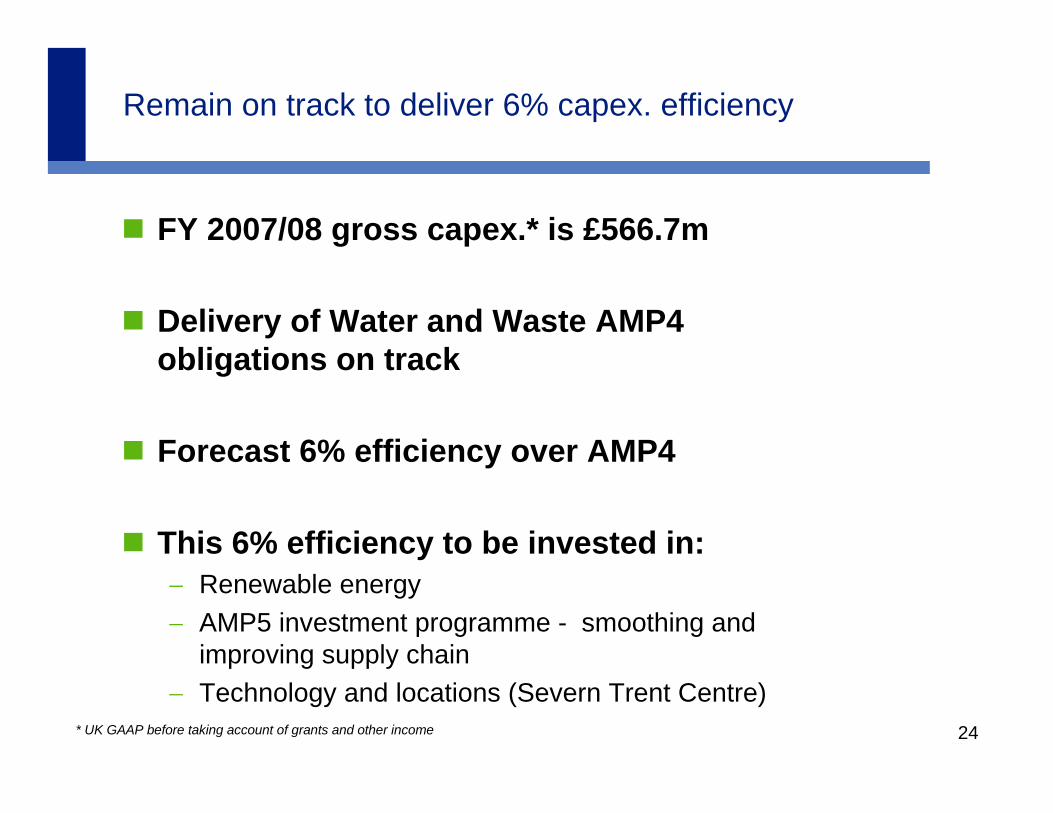
Remain on track to deliver 6% capex. efficiency
FY 2007/08 gross capex.* is £566.7m
Delivery of Water and Waste AMP4 obligations on track
Forecast 6% efficiency over AMP4
This 6% efficiency to be invested in:− Renewable energy− AMP5 investment programme - smoothing and
improving supply chain− Technology and locations (Severn Trent Centre)
* UK GAAP before taking account of grants and other income
25
Investing for growth in Water Technologies and Services
Good underlying performance in revenue, PBIT and ROIC
Strategy focused on organic growth and building international presence− Existing technologies into new markets− New technologies to existing markets
26
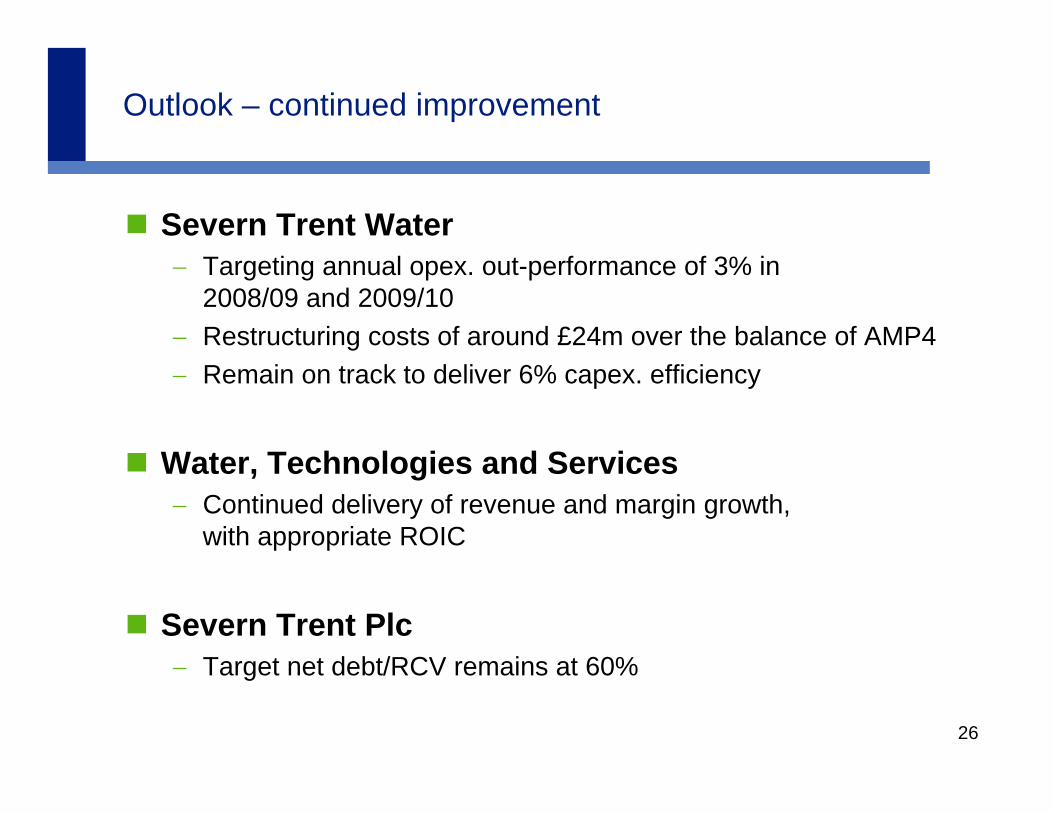
Outlook – continued improvement
Severn Trent Water− Targeting annual opex. out-performance of 3% in
2008/09 and 2009/10− Restructuring costs of around £24m over the balance of AMP4− Remain on track to deliver 6% capex. efficiency
Water, Technologies and Services− Continued delivery of revenue and margin growth,
with appropriate ROIC
Severn Trent Plc− Target net debt/RCV remains at 60%

27
PR09 and the longer term
Strategic Direction Statement− Ofwat longer term view− Consistent with Defra’s
“Future Water” report
Select Committee & Inquiry conclusions www.stwater.co.uk/sds
PR09− New requirements− Continuous improvement driving efficiencies− Capital programme of around £3bn− Appropriate WACC and robust funding strategy
28
Focus on Water – Continuous improvement
Delivering tangible results– Group PBIT up 15.8% at £469.5m– Outperformed on operating costs against Ofwat FD– Outperformed against Ofwat leakage target
Delivering our investment programme and sustainable investment returns
We have turned the corner and are focused on delivery
29
Q & A

30
31
Appendix
32
Contact Details – Investor Relations
Venetia CooperInvestor Relations Manager
Severn Trent Plc2297 Coventry RoadBirminghamB26 3PUUnited Kingdom
Tel: +44 (0)121 722 4523Fax: +44 (0)121 722 4294
e:mail [email protected]
www.severntrent.com

33
Measuring our performance – Key Performance Indicators1 of 2
D e s c r ip t io nB a s is N o te L o w e r
Q u a rt i le M e d ia nU p p e r
Q u a rt i leL o s t t im e in c id e n ts p e r 1 0 0 ,0 0 0 h rs w o rk e d 2 0 0 8 M A T 2 0 .6 1
2 0 0 7 0 .5 9E m p lo y e e m o tiv a tio n 2 0 0 8 Q R 3 7 7 %
2 0 0 7 7 6 %W a te r q u a lity (m e a n z o n a l c o m p lia n c e ) % 2 0 0 8 M A A 1 ,4 9 9 .9 6 %
2 0 0 7 9 9 .9 8 %C u s to m e r w r it te n c o m p la in ts p e r 1 ,0 0 0 p ro p e rt ie s 2 0 0 8 M A T 1 ,5 1 0 .9
2 0 0 7 1 6 .5 8F irs t t im e c a ll re s o lu tio n fo r b ill in g % 2 0 0 8 M A T 6 8 5 %
2 0 0 7 8 0 %U n p la n n e d in te rru p t io n s > 6 h rs p e r 1 ,0 0 0 p ro p e rt ie s 2 0 0 8 M A T 1 ,7 2 1 .8 6
2 0 0 7 1 0 .7P ro p e rt ie s a t r is k o f lo w p re s s u re p e r 1 ,0 0 0 p ro p e rt ie s 2 0 0 8 N P R 8 ,9 0 .0 6
2 0 0 7 0 .0 9F irs t t im e jo b re s o lu tio n 2 0 0 8 6 8 5 %
2 0 0 7 8 4 %P e rfo rm a n c e a g a in s t R e g u la to ry O b lig a tio n s % 2 0 0 8 Q R 6 1 5 %
2 0 0 7 2 6 %C a p e x (G ro s s ) v s F in a l D e te rm in a tio n % 2 0 0 8 A T D 1 0 1 .7 0 %
2 0 0 7 2 .7 0 %C a p ita l p ro c e s s q u a lity (n o . o f d e fe c ts p e r £ 1 0 0 k ) 2 0 0 8 6 0 .0 3
2 0 0 7 N /AD e b to r d a y s 2 0 0 8 8 ,1 0 3 7 .4
2 0 0 7 3 7 .5O p e x v s F in a l D e te rm in a tio n (U K G A A P ) - £ m 2 0 0 8 M A T 1 0 4 8 0 .9
2 0 0 7 4 7 9 .1C o s t to s e rv e p e r p ro p e rty - £ 2 0 0 8 M A T 1 1 2 3 6 .8 2
2 0 0 7 2 2 6 .9 3P o llu t io n in c id e n ts (c a t 1 , 2 & 3 ) p e r 1 ,0 0 0 p ro p e rt ie s 2 0 0 8 M A T 4 ,1 2 0 .1 1
2 0 0 7 0 .1 42 0 0 8 M A T 1 ,1 3 0 .2 12 0 0 7 0 .1 7
S e w a g e T re a tm e n t W o rk s - b re a c h o f c o n s e n ts % 2 0 0 8 P P S 1 ,8 0 .0 0 %2 0 0 7 0 .0 0 %
R a w w a te r s to ra g e % 2 0 0 8 M A A 6 9 2 %2 0 0 7 9 0 %
N e t E n e rg y U s e – K w h /M l 2 0 0 8 M A T 6 6 0 82 0 0 7 6 1 8
L e a k a g e M l/d 2 0 0 8 M L E 1 ,1 4 4 9 12 0 0 7 5 2 4
S e w e r f lo o d in g in c id e n ts - o th e r c a u s e s p e r 1 ,0 0 0 p ro p e rt ie s
34
Measuring our performance – Key Performance Indicators2 of 2
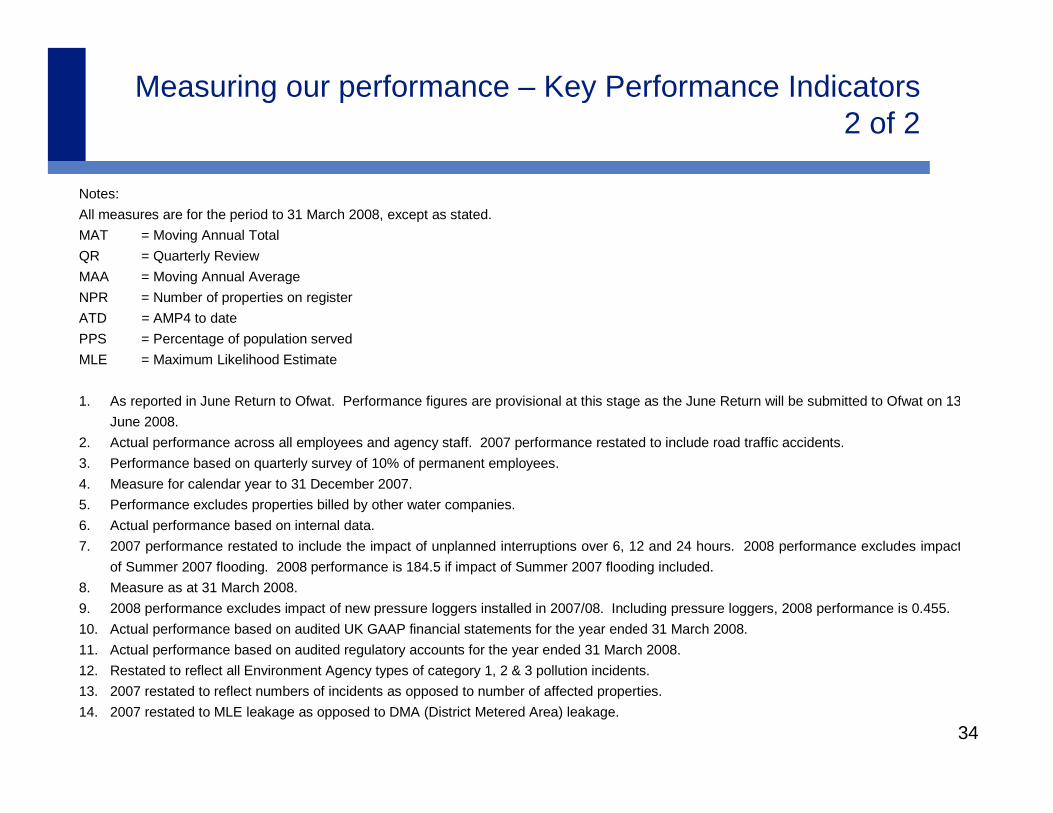
Notes: All measures are for the period to 31 March 2008, except as stated. MAT = Moving Annual Total QR = Quarterly Review MAA = Moving Annual Average NPR = Number of properties on register ATD = AMP4 to date PPS = Percentage of population served MLE = Maximum Likelihood Estimate 1. As reported in June Return to Ofwat. Performance figures are provisional at this stage as the June Return will be submitted to Ofwat on 13
June 2008. 2. Actual performance across all employees and agency staff. 2007 performance restated to include road traffic accidents. 3. Performance based on quarterly survey of 10% of permanent employees. 4. Measure for calendar year to 31 December 2007. 5. Performance excludes properties billed by other water companies. 6. Actual performance based on internal data. 7. 2007 performance restated to include the impact of unplanned interruptions over 6, 12 and 24 hours. 2008 performance excludes impact
of Summer 2007 flooding. 2008 performance is 184.5 if impact of Summer 2007 flooding included. 8. Measure as at 31 March 2008. 9. 2008 performance excludes impact of new pressure loggers installed in 2007/08. Including pressure loggers, 2008 performance is 0.455. 10. Actual performance based on audited UK GAAP financial statements for the year ended 31 March 2008. 11. Actual performance based on audited regulatory accounts for the year ended 31 March 2008. 12. Restated to reflect all Environment Agency types of category 1, 2 & 3 pollution incidents. 13. 2007 restated to reflect numbers of incidents as opposed to number of affected properties. 14. 2007 restated to MLE leakage as opposed to DMA (District Metered Area) leakage.
35
268.6
20.0
248.6
(18.4)
(58.5)
325.5
0.5
48.8
(153.8)
430.0
24.7
405.3
(1,074.9)
1,480.2
2006/07£m
Variance%
Variance£m
2007/08 £m
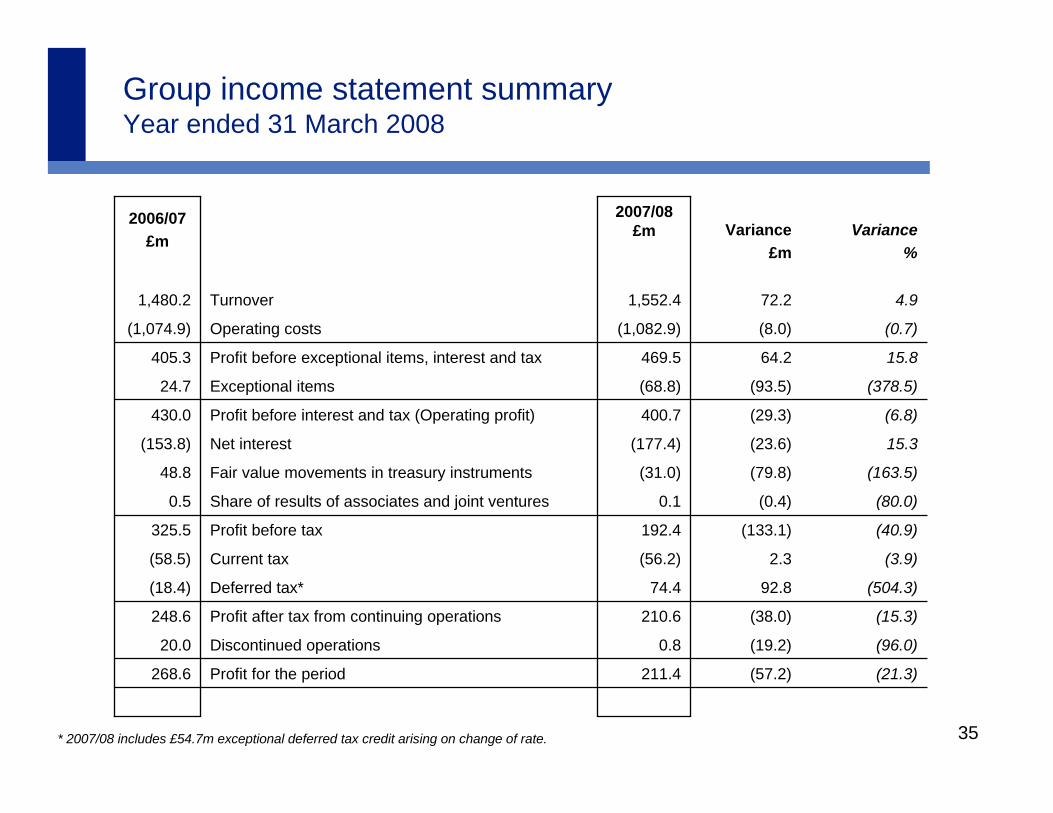
(21.3)(57.2)211.4Profit for the period
(96.0)(19.2)0.8Discontinued operations
(378.5)(93.5)(68.8)Exceptional items
(6.8)(29.3)400.7Profit before interest and tax (Operating profit)
210.6
74.4
(56.2)
192.4
0.1
(31.0)
(177.4)
469.5
(1,082.9)
1,552.4
(15.3)(38.0)Profit after tax from continuing operations
(504.3)92.8Deferred tax*
15.3(23.6)Net interest
(3.9)2.3Current tax
(40.9)(133.1)Profit before tax
(80.0)(0.4)Share of results of associates and joint ventures
(163.5)(79.8)Fair value movements in treasury instruments
15.864.2Profit before exceptional items, interest and tax
(0.7)(8.0)Operating costs
4.972.2Turnover
Group income statement summary Year ended 31 March 2008
* 2007/08 includes £54.7m exceptional deferred tax credit arising on change of rate.
36
105.1
81.6
106.1
82.4
Pence
1.5
267.1
268.6
2006/07£m
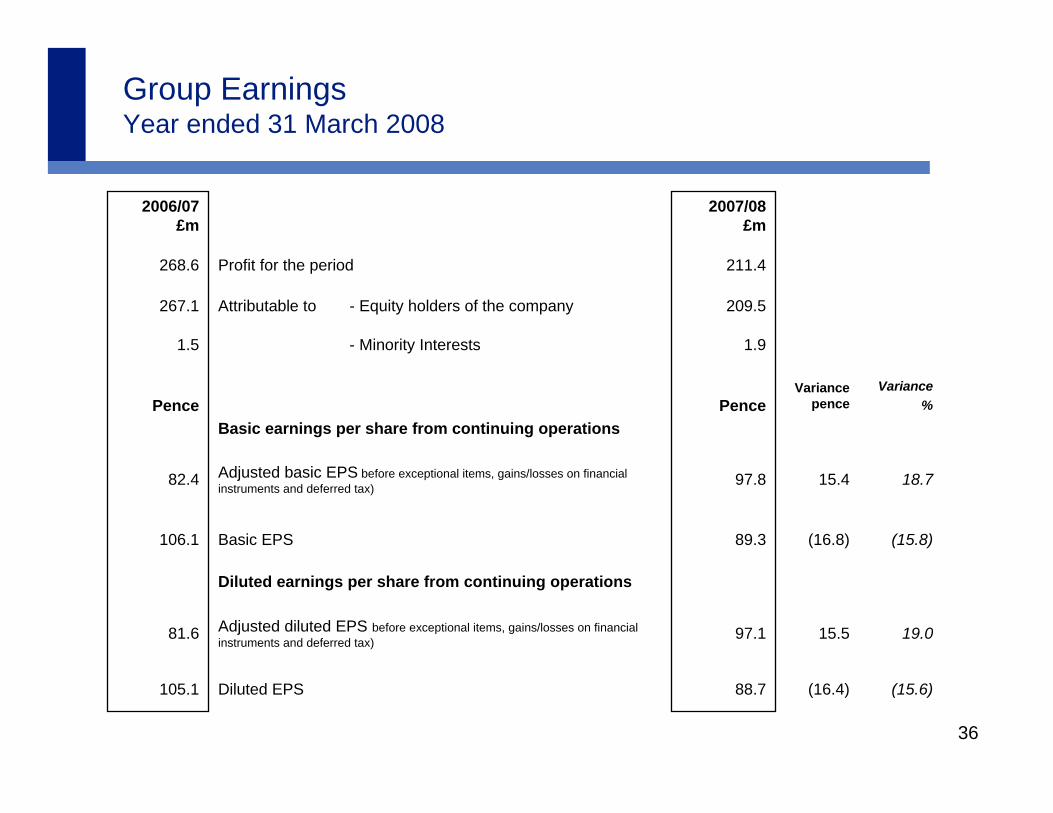
(15.6)(16.4)88.7Diluted EPS
19.015.5 97.1Adjusted diluted EPS before exceptional items, gains/losses on financial instruments and deferred tax)
Diluted earnings per share from continuing operations
(15.8)(16.8) 89.3Basic EPS
18.715.4 97.8Adjusted basic EPS before exceptional items, gains/losses on financial instruments and deferred tax)
209.5Attributable to - Equity holders of the company
1.9- Minority Interests
211.4Profit for the period
Pence
2007/08 £m
Variance%
Variancepence
Basic earnings per share from continuing operations
Group EarningsYear ended 31 March 2008
37
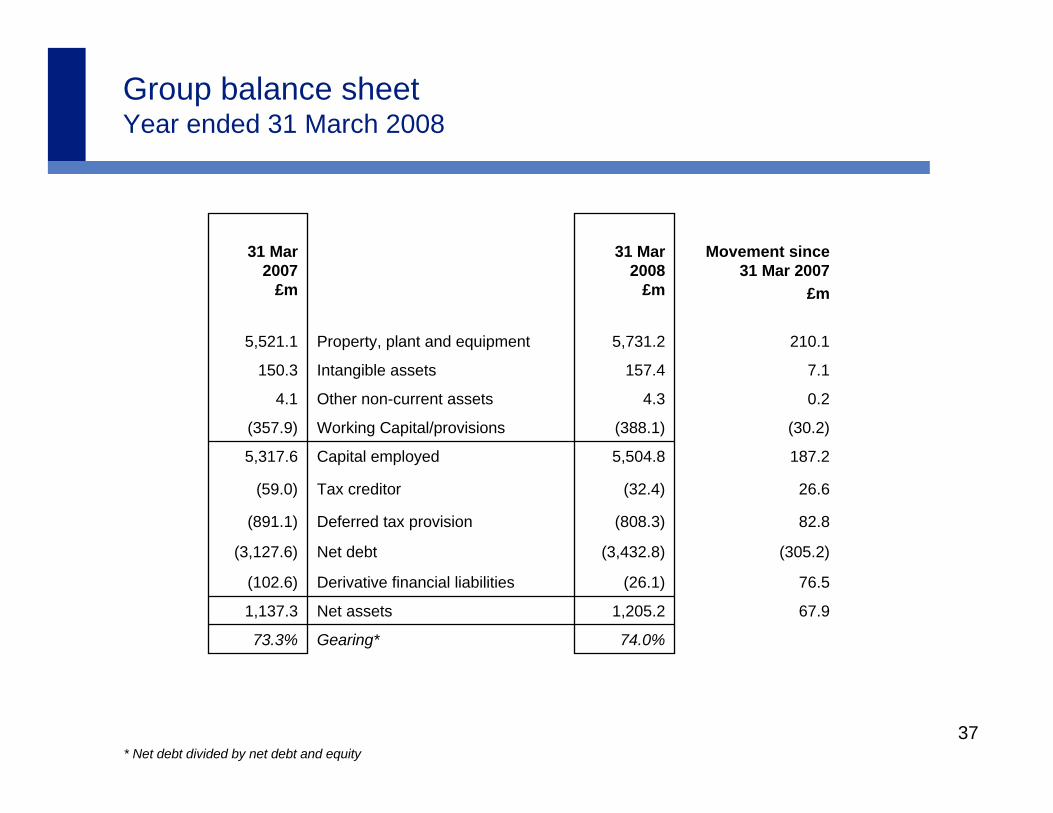
210.15,731.2Property, plant and equipment5,521.1
74.0%
1,205.2
(26.1)
(3,432.8)
(808.3)
(32.4)
5,504.8
(388.1)
4.3
157.4
31 Mar 2008
£m
73.3%
1,137.3
(102.6)
(3,127.6)
(891.1)
(59.0)
5,317.6
(357.9)
4.1
150.3
31 Mar 2007
£m
67.9
76.5
(305.2)
82.8
26.6
187.2
(30.2)
0.2
7.1
Movement since 31 Mar 2007
£m
Derivative financial liabilities
Gearing*
Net assets
Net debt
Working Capital/provisions
Deferred tax provision
Tax creditor
Capital employed
Other non-current assets
Intangible assets
Group balance sheetYear ended 31 March 2008
* Net debt divided by net debt and equity
38
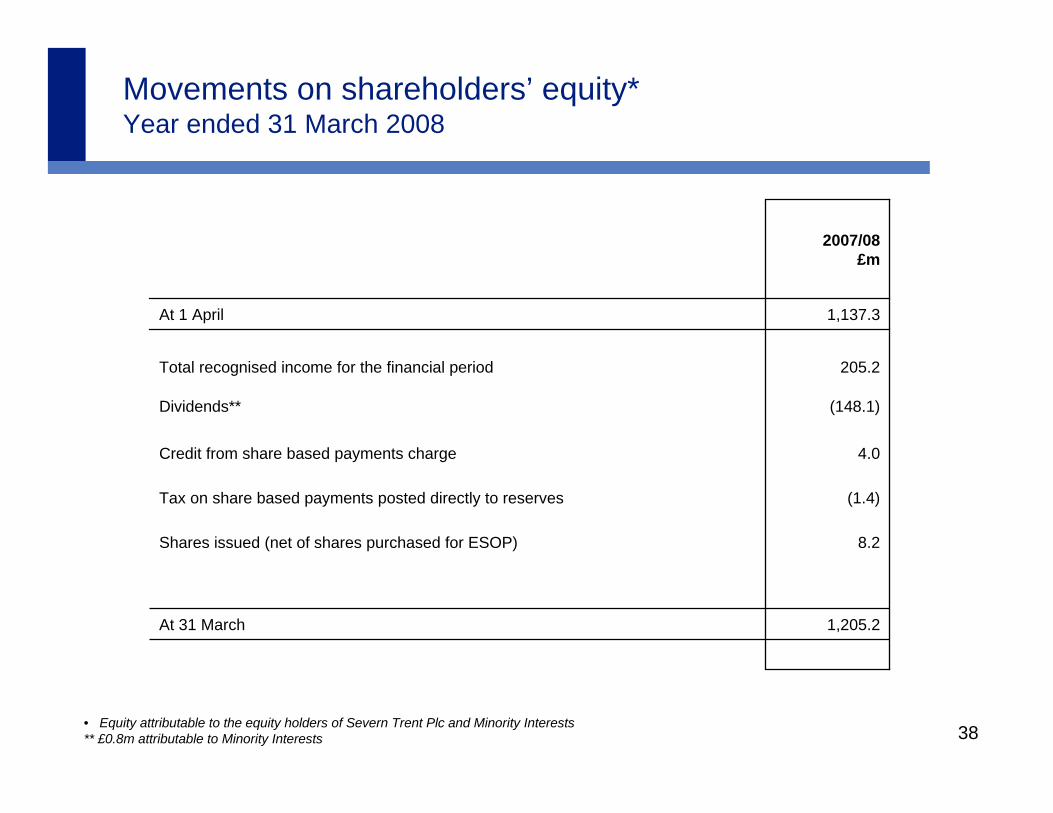
Movements on shareholders’ equity*Year ended 31 March 2008
(1.4)Tax on share based payments posted directly to reserves
1,205.2
8.2
4.0
(148.1)
205.2
1,137.3
2007/08 £m
At 1 April
At 31 March
Credit from share based payments charge
Shares issued (net of shares purchased for ESOP)
Dividends**
Total recognised income for the financial period
• Equity attributable to the equity holders of Severn Trent Plc and Minority Interests** £0.8m attributable to Minority Interests

39
Severn Trent PlcSevern Trent WaterShort-TermP2P1Moody’s*
A1A1Standard & Poor’s**
A-AStandard & Poor’s**
A3A2Moody’s*
Severn Trent PlcSevern Trent WaterLong-Term
Credit ratingsAt 31 March 2008
* Confirmed April 2008** Confirmed February 2008
40
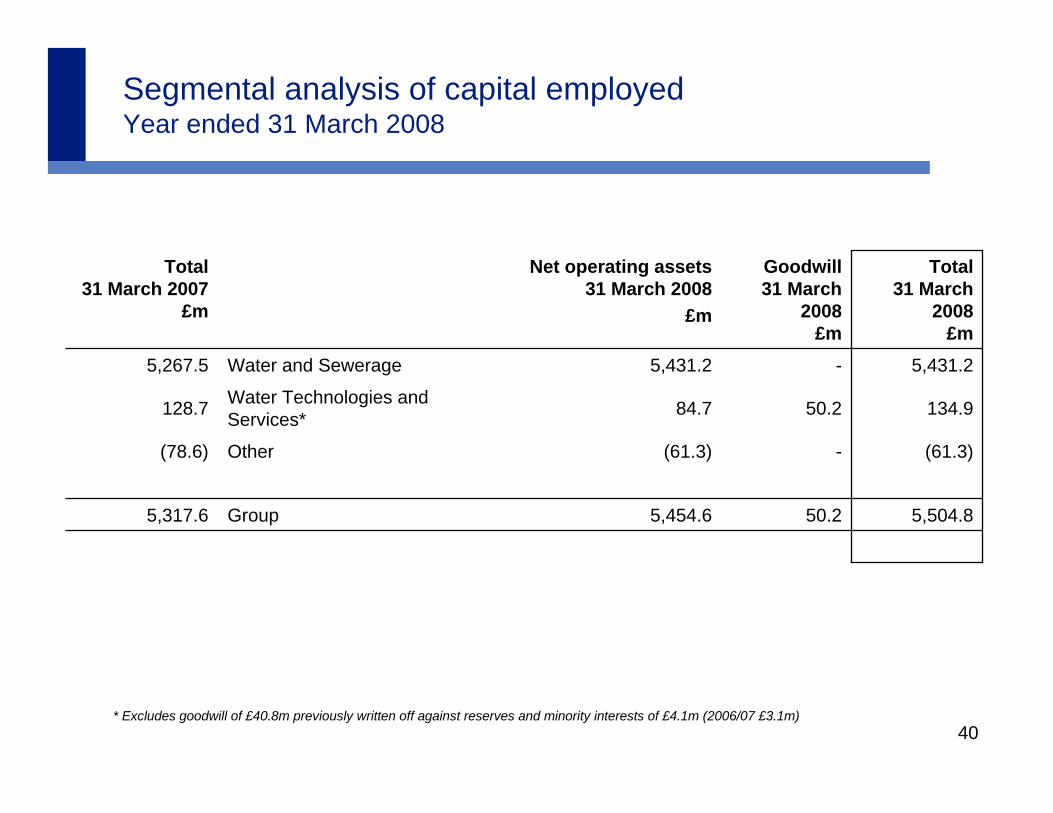
Segmental analysis of capital employedYear ended 31 March 2008
5,317.6
(78.6)
128.7
5,267.5
Total31 March 2007
£m
5,504.8
(61.3)
134.9
5,431.2
Total31 March
2008£m
50.284.7Water Technologies and Services*
-(61.3)Other
50.25,454.6Group
-5,431.2Water and Sewerage
Goodwill31 March
2008£m
Net operating assets31 March 2008
£m
* Excludes goodwill of £40.8m previously written off against reserves and minority interests of £4.1m (2006/07 £3.1m)
41
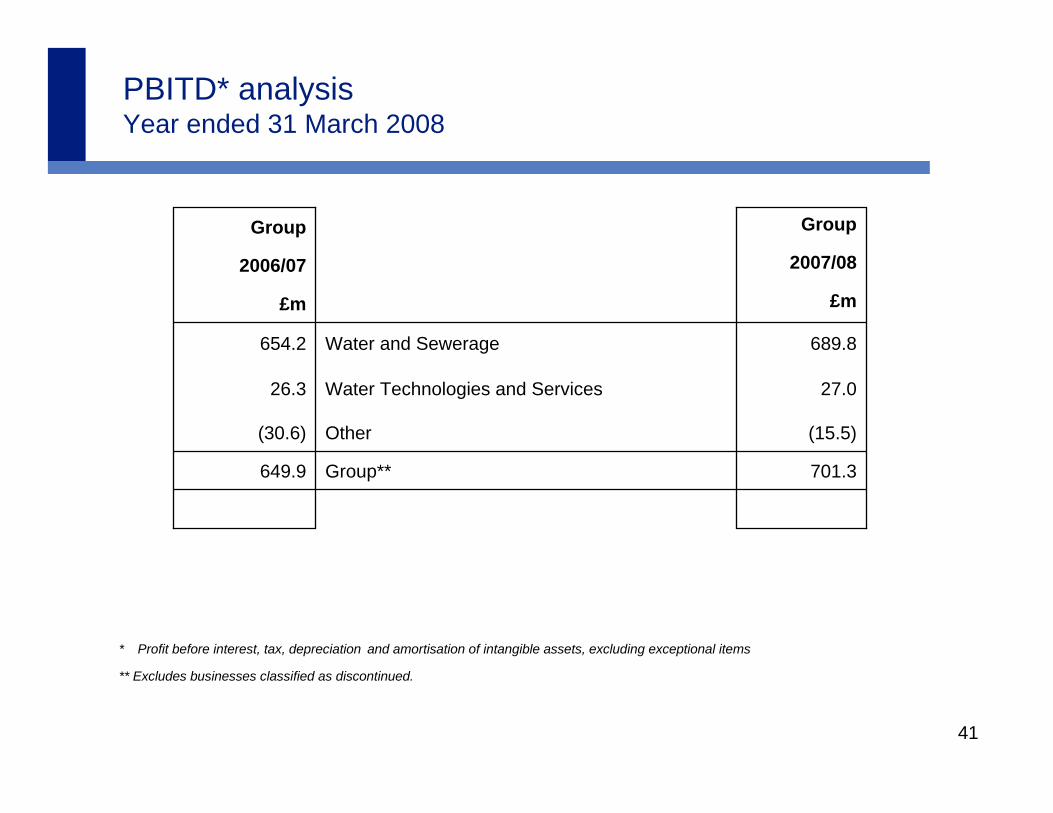
PBITD* analysisYear ended 31 March 2008
* Profit before interest, tax, depreciation and amortisation of intangible assets, excluding exceptional items
** Excludes businesses classified as discontinued.
£m£m
649.9
(30.6)
26.3
654.2
2006/07
Group
701.3Group**
2007/08
(15.5)
27.0
689.8
Group
Water Technologies and Services
Other
Water and Sewerage
42
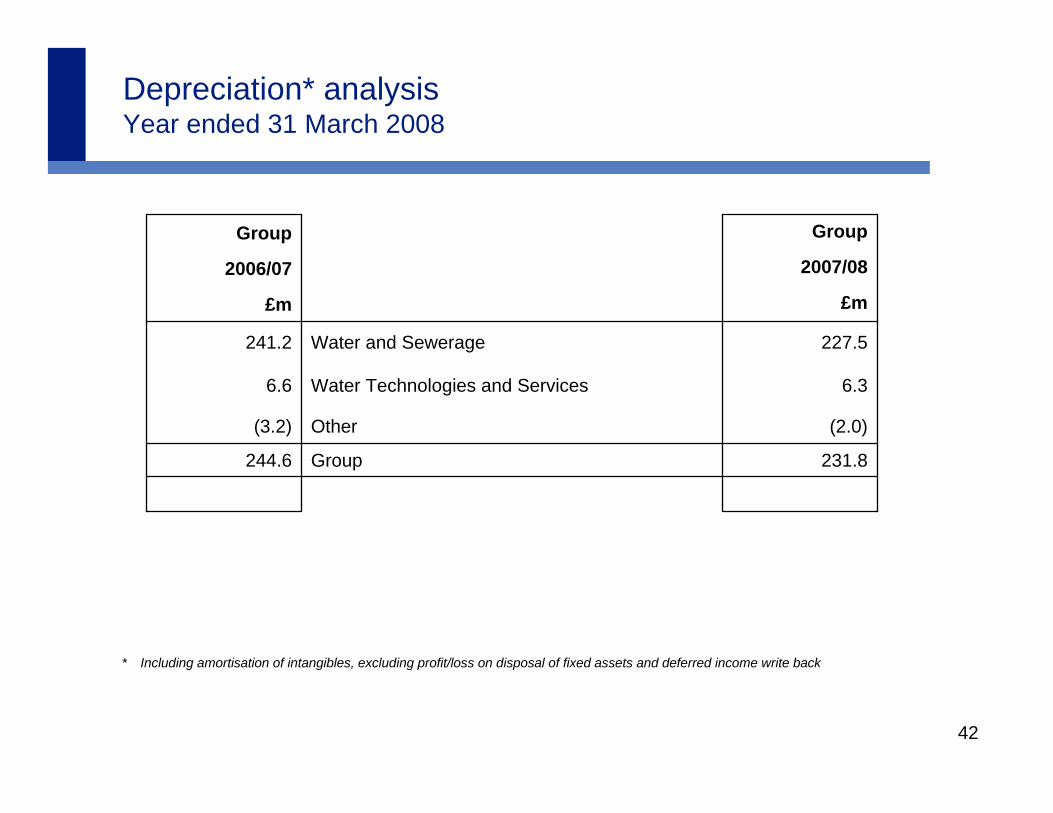
Depreciation* analysisYear ended 31 March 2008
* Including amortisation of intangibles, excluding profit/loss on disposal of fixed assets and deferred income write back
£m£m
244.6
(3.2)
6.6
241.2
2006/07
Group
231.8Group
2007/08
(2.0)
6.3
227.5
Group
Water Technologies and Services
Other
Water and Sewerage
43
Exceptional itemsYear ended 31 March 2008
(24.4)
9.5
(2.4)
(31.5)
24.7
(16.7)56.3
--
--
(11.9)(3.0)
£m
Total2006/07
-Profit on disposal of Biffa Belgium
-Loss on disposal of US Laboratories
(68.8)Net exceptional (charges)/gains on continuing operations
-Impairment of goodwill relating to US Laboratories
-Net exceptional charges on discontinued operations
£m
--
(29.6)16.0
(35.8)(4.5)
-(14.9)
Total2007/08
Demerger and related costsDisposal of property and businessesSummer 2007 Flooding
Gross costsInsurance
Legacy issuesOfwat proposed fine
Third party legal costs (Water, Technologies & Services)
Severn Trent Water programme to restructure and realign businessWrite off of decommissioned assetsRestructuring costs
44
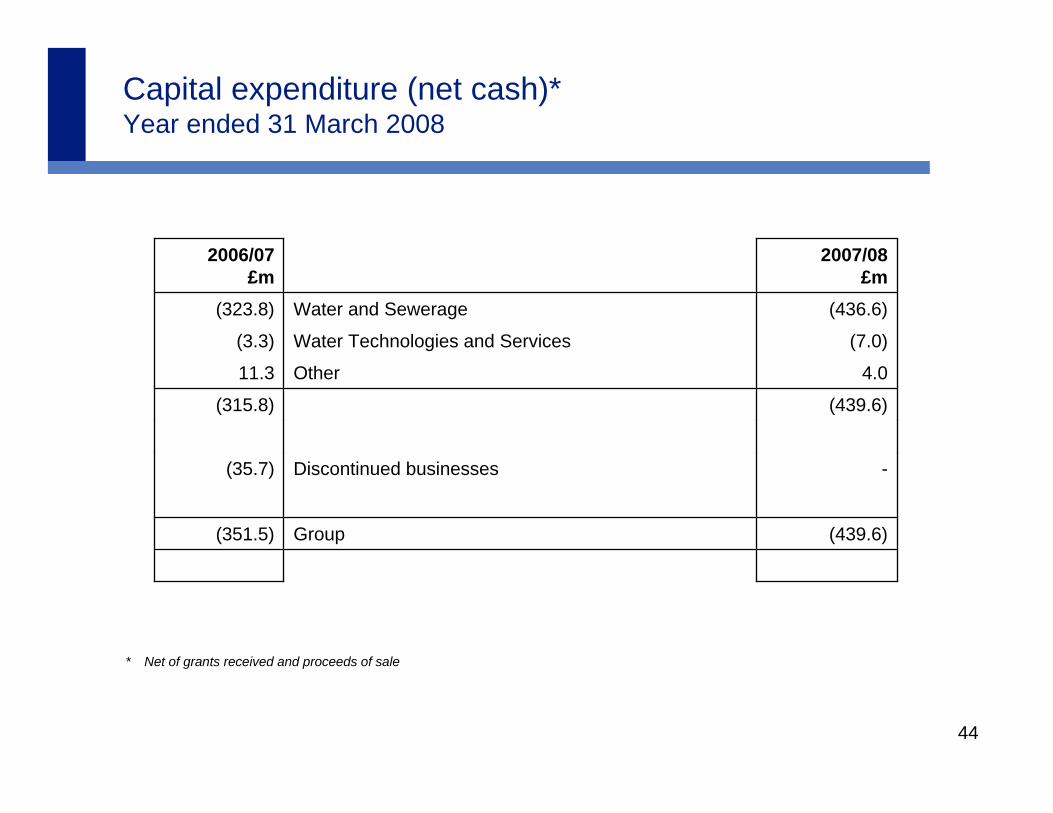
Capital expenditure (net cash)*Year ended 31 March 2008
* Net of grants received and proceeds of sale
(439.6)Group(351.5)
(35.7)
(315.8)
11.3
(3.3)
(323.8)
2006/07 £m
-Discontinued businesses
(439.6)
4.0
(7.0)
(436.6)
2007/08 £m
Water Technologies and Services
Other
Water and Sewerage

45
Water and Sewerage – income statement highlightsYear ended 31 March 2008
* Operating costs include profit on disposal of non-current assets of £1.6m (£Nil)
1.4(11.1)(808.9)Severn Trent Water*(797.8)
(7.1)0.7(9.1)Retail & Utility Services(9.8)
(56.0)(1.4)1.1Intra segment trading2.5
4.858.41,265.3Severn Trent Water1,206.9
9.51.315.0Retail & Utility Services13.7
(56.0)1.4(1.1)Intra segment trading(2.5)
11.9
1.5
5.0
Change%
462.3
(816.9)
1,279.2
2007/08 £m
413.0
(805.1)
1,218.1
2006/07 £m
Turnover
49.3
(11.8)
61.1
Change£m
PBIT
Operating Costs
46
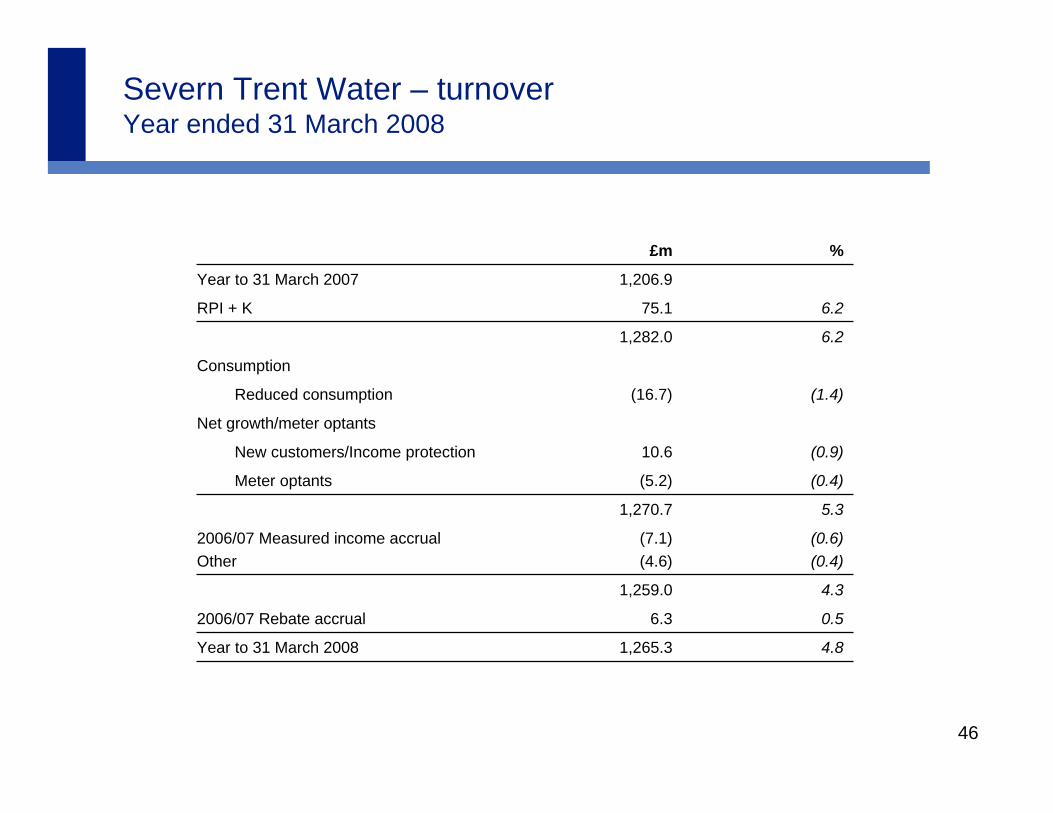
Severn Trent Water – turnoverYear ended 31 March 2008
0.56.32006/07 Rebate accrual
Net growth/meter optants
(0.9)10.6New customers/Income protection
(0.4)(5.2)Meter optants
6.275.1RPI + K
6.21,282.0
Consumption
4.8
4.3
(0.6)(0.4)
5.3
(1.4)
%
1,206.9Year to 31 March 2007
1,265.3
1,259.0
(7.1)(4.6)
1,270.7
(16.7)
£m
2006/07 Measured income accrualOther
Year to 31 March 2008
Reduced consumption

47
797.8
98.1
225.2
474.5
2006/07£m
1.4
13.4
(1.4)
0.2
Variance%
11.1
13.1
(3.1)
1.1
Variance£m
808.9Total
111.2Infrastructure renewals
222.1Depreciation**
475.6Direct operating costs*
2007/08£m
Severn Trent Water – operating costsYear ended 31 March 2008
* Net of other income £3.9m (£3.6m) but excluding management charges** Net of amortisation of grants and contributions and profit on disposal of property, plant and equipment, and after profit on disposal of non
current assets of £1.6m (£Nil)

48
Severn Trent Water – capex reconciliationYear ended 31 March 2008
* Capex at outturn prices after deduction of grants and contributions
436.6IFRS capex (net cash)
0.6Other
29.1Movement on capital creditors
409.8
521.1UK GAAP net capex*
(2.9)Proceeds on sale of fixed assets
(45.6)Less grants and contributions
(111.3)Treated as IFRS infrastructure operating expenditure
566.7UK GAAP gross capex
2007/08 £m
49
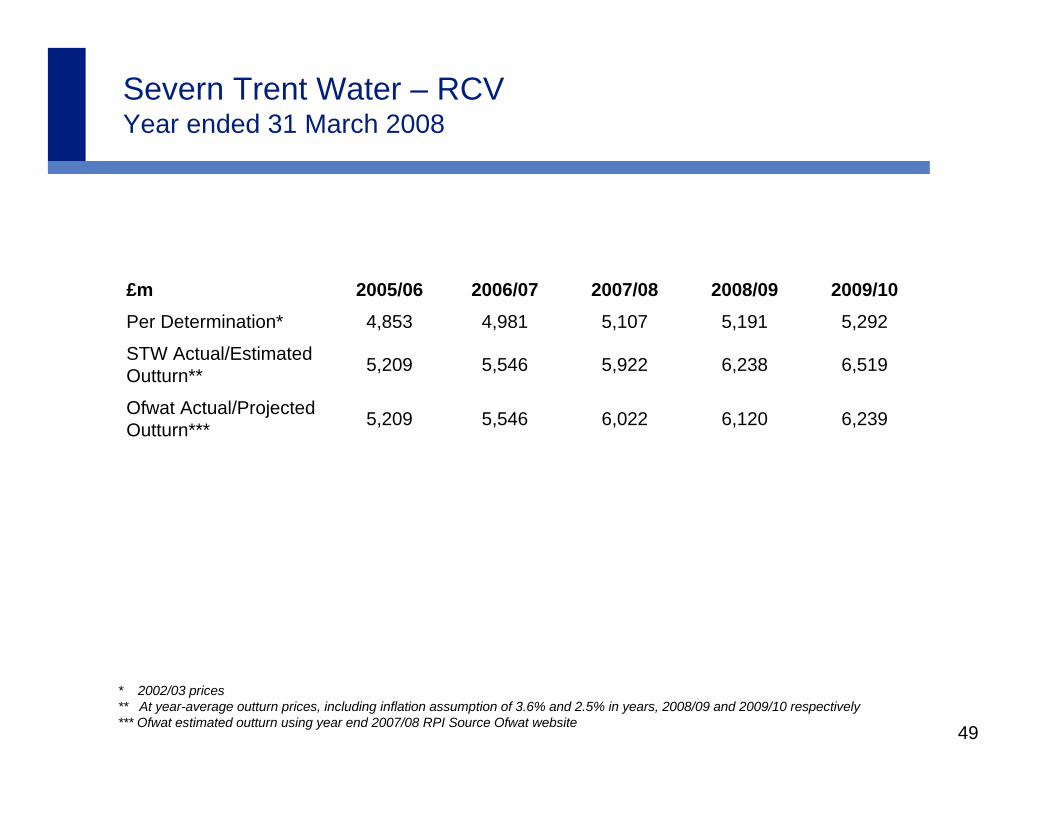
Severn Trent Water – RCVYear ended 31 March 2008
6,5196,2385,9225,5465,209STW Actual/Estimated Outturn**
2009/102008/092007/082006/072005/06£m
6,239
5,292
6,022
5,107
6,120
5,191
5,5465,209Ofwat Actual/Projected Outturn***
4,9814,853Per Determination*
* 2002/03 prices** At year-average outturn prices, including inflation assumption of 3.6% and 2.5% in years, 2008/09 and 2009/10 respectively*** Ofwat estimated outturn using year end 2007/08 RPI Source Ofwat website
50
Water Technologies and Services performanceYear ended 31 March 2008
12.5%21.619.2As reported before acquisitions & disposals
4.6%297.2284.1-0.3Exchange rate impact-7.6
5.1%20.719.7As reported2.9%297.3288.9
14.3%21.618.9“Like for like” constant currency7.5%297.2276.5
PBIT*Turnover
Change%
0.1
-
2007/08£m
-
0.5
2006/07 £m
(0.9)Acquisition:Micro Dynamics-
Change%
Disposal:Pipeline Services -4.8
2007/08£m
2006/07 £m
* Excluding exceptional items

51
Segment Reporting Year ended 31 March 2008 proforma for change in segmental reporting
-5.9(5.9)Retail & Utility Services
£m£m£m£m£m
(2.3)
(2.3)
(29.3)
(29.3)
Eliminations
456.4
462.3
1,264.2
(15.0)
1,279.2
Water andSewerage
1,552.45.2312.3Total Sales (proforma)
-15.0Retail & Utility Services
469.5(11.2)26.6PBIT* (proforma)
1,552.45.2297.3Total Sales (as reported)
20.7
Water Technologies and Services
469.5(11.2)PBIT*(as reported)
ConsolidatedCorporate and Other
* Excluding exceptional items
52