Embed Size (px)
Citation preview

Session Number: Parallel Session 4C
Time: Tuesday, August 24, PM
Paper Prepared for the 31st General Conference of
The International Association for Research in Income and Wealth
St. Gallen, Switzerland, August 22-28, 2010
Recent Progress in Measuring FDI in the Wake of Globalization
Adelheid Bürgi-Schmelz, Ralph Kozlow, Andrew Kitili, Mark van Wersch, and John Joisce
For additional information please contact:
Name: Adelheid Bürgi-Schmelz
Affiliation: IMF
Email Address: [email protected]
This paper is posted on the following website: http://www.iariw.org

2
Contents Page
Abstract ......................................................................................................................................3
I. Introduction .............................................................................................................................3
II. Discrepancies in Global External Sector Statistics ...............................................................5
III. FDI: Concepts and Progress in Measurement ......................................................................6
IV. 2009 Coordinated Direct Investment Survey .......................................................................9
A. Tools to Help Economies Conduct the CDIS .........................................................10
V. Next Steps and Conclusion .................................................................................................11
Tables
1. Reported Assets and Liabilities by Functional Categories.....................................................4
2. Global Discrepancies in FDI Flows .......................................................................................6
3. Top Ten Recipients of Inward Direct Investment and Value .................................................8
4. Top Ten Providers of Outward Direct Investment and Value ...............................................9
5. Countries Indicating a Willingness to Participate in the Coordinated Direct Investment
Survey (CDIS) ....................................................................................................................13
References ................................................................................................................................18
Annexes
I. Statistical issues in measuring FDI .......................................................................................14
II. Coverage of the CDIS Guide ...............................................................................................17
3
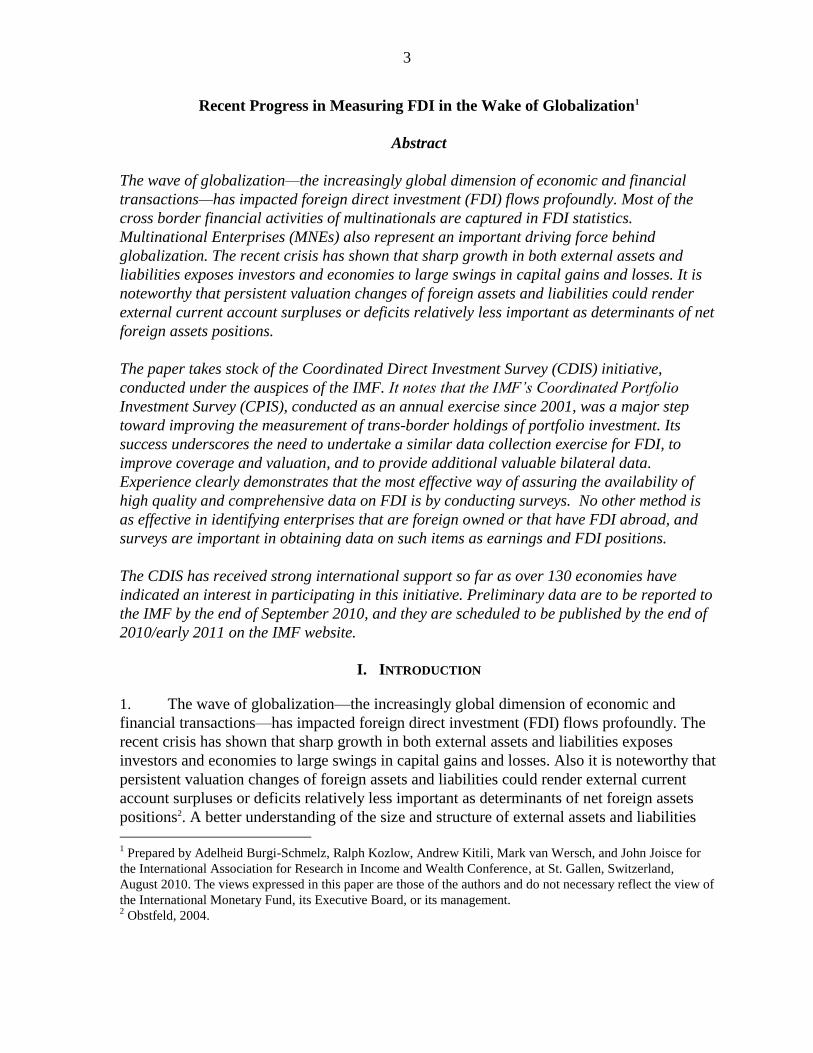
Recent Progress in Measuring FDI in the Wake of Globalization1
Abstract
The wave of globalization—the increasingly global dimension of economic and financial
transactions—has impacted foreign direct investment (FDI) flows profoundly. Most of the
cross border financial activities of multinationals are captured in FDI statistics.
Multinational Enterprises (MNEs) also represent an important driving force behind
globalization. The recent crisis has shown that sharp growth in both external assets and
liabilities exposes investors and economies to large swings in capital gains and losses. It is
noteworthy that persistent valuation changes of foreign assets and liabilities could render
external current account surpluses or deficits relatively less important as determinants of net
foreign assets positions.
The paper takes stock of the Coordinated Direct Investment Survey (CDIS) initiative,
conducted under the auspices of the IMF. It notes that the IMF’s Coordinated Portfolio
Investment Survey (CPIS), conducted as an annual exercise since 2001, was a major step
toward improving the measurement of trans-border holdings of portfolio investment. Its
success underscores the need to undertake a similar data collection exercise for FDI, to
improve coverage and valuation, and to provide additional valuable bilateral data.
Experience clearly demonstrates that the most effective way of assuring the availability of
high quality and comprehensive data on FDI is by conducting surveys. No other method is
as effective in identifying enterprises that are foreign owned or that have FDI abroad, and
surveys are important in obtaining data on such items as earnings and FDI positions.
The CDIS has received strong international support so far as over 130 economies have
indicated an interest in participating in this initiative. Preliminary data are to be reported to
the IMF by the end of September 2010, and they are scheduled to be published by the end of
2010/early 2011 on the IMF website.
I. INTRODUCTION
1. The wave of globalization—the increasingly global dimension of economic and
financial transactions—has impacted foreign direct investment (FDI) flows profoundly. The
recent crisis has shown that sharp growth in both external assets and liabilities exposes
investors and economies to large swings in capital gains and losses. Also it is noteworthy that
persistent valuation changes of foreign assets and liabilities could render external current
account surpluses or deficits relatively less important as determinants of net foreign assets
positions2. A better understanding of the size and structure of external assets and liabilities
1 Prepared by Adelheid Burgi-Schmelz, Ralph Kozlow, Andrew Kitili, Mark van Wersch, and John Joisce for
the International Association for Research in Income and Wealth Conference, at St. Gallen, Switzerland,
August 2010. The views expressed in this paper are those of the authors and do not necessary reflect the view of
the International Monetary Fund, its Executive Board, or its management. 2 Obstfeld, 2004.

4
plays an important role in determining whether and to which extent valuation effects
contribute to external adjustment following an era of economic imbalances. Good FDI data
are therefore important in analyzing cross border flows and positions, and their potential
impact on the economy; hence the call in April 2009, by the Group of 20 Economies (G-20)
for the IMF and the Financial Stability Board (FSB) to explore information gaps and provide
proposals for strengthening data collection including FDI3.
2. The measurement and analysis of international capital flows and positions is of
central interest to the IMF in carrying out its mandate. As markets evolve and transactions
become more complex the need to adapt and expand data collection systems becomes
paramount. While significant progress has been made in improving the measurement of
external assets and liabilities, one area that needs further strengthening is FDI. FDI is one of
the five functional categories used as the primary basis for classifying data on financial
transactions, positions, and income in the international economic accounts. The other four
functional categories are: portfolio investment, financial derivatives (other than reserves) and
employee stock options, reserve assets, and other investment.
3. Multinational enterprises (MNEs) are major participants in international financial markets
and are important providers of FDI, i.e., finance to their related entities abroad. MNEs also
provide important nonfinancial benefits through technical know-how, managerial expertise,
market access, and other similar non-tangible benefits. Because of the significant size and impact
of FDI, high quality data on FDI are needed.
4. Availability of such data can help policy makers address a number of important issues
in international macroeconomic developments, including the determinants of long-run net
external positions, the link between net external positions and real exchanges rates and
changes in the extent of international risk sharing4. Also the sum of external assets and
liabilities can be used (and has been used) as a volume-based measure of international
financial integration when studying the effects of integration on macroeconomic
performance5. Such data are used for compiling statistics on balance of payments and
international investment positions and for other analytical purposes.
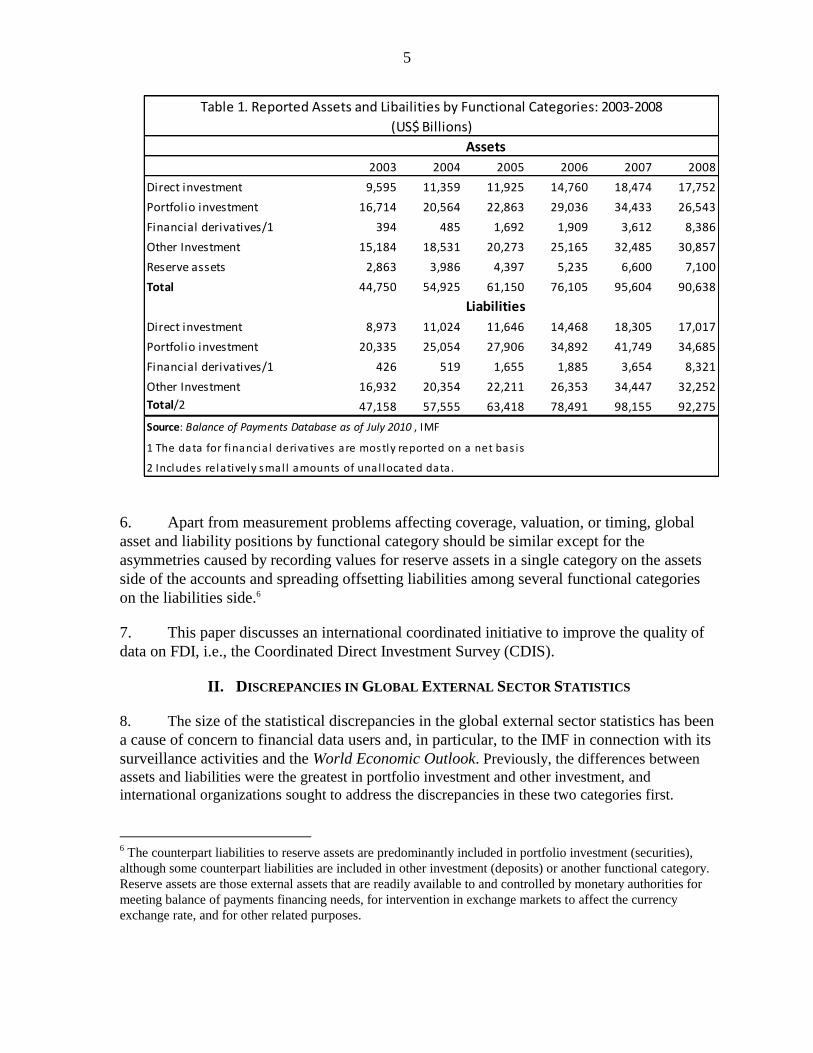
5. At the end of 2008 (the most recent year for which substantially complete data are
available), total global asset and liabilities positions in the five categories mentioned above
amounted to:
Table 1. Reported Assets and Liabilities by Functional Categories: 2003-2008
3 See reports at: http://www.imf.org/external/np/g20/pdf/102909.pdf and
http://www.imf.org/external/np/g20/pdf/053110.pdf.
4 See Lane and Milesi-Ferreti, 2002b and 2004b; IMbs, 2004; Huzinga and Zhu, 2004.
5 See Edison and others, 2002, and Prasad and others, 2003.
5
Assets
2003 2004 2005 2006 2007 2008
Direct investment 9,595 11,359 11,925 14,760 18,474 17,752
Portfolio investment 16,714 20,564 22,863 29,036 34,433 26,543
Financial derivatives/1 394 485 1,692 1,909 3,612 8,386
Other Investment 15,184 18,531 20,273 25,165 32,485 30,857
Reserve assets 2,863 3,986 4,397 5,235 6,600 7,100
Total 44,750 54,925 61,150 76,105 95,604 90,638
Liabilities
Direct investment 8,973 11,024 11,646 14,468 18,305 17,017
Portfolio investment 20,335 25,054 27,906 34,892 41,749 34,685
Financial derivatives/1 426 519 1,655 1,885 3,654 8,321
Other Investment 16,932 20,354 22,211 26,353 34,447 32,252
Total/2 47,158 57,555 63,418 78,491 98,155 92,275
Source: Balance of Payments Database as of July 2010 , IMF
1 The data for financia l derivatives are mostly reported on a net bas is
2 Includes relatively smal l amounts of unal located data.
Table 1. Reported Assets and Libailities by Functional Categories: 2003-2008
(US$ Billions)
6. Apart from measurement problems affecting coverage, valuation, or timing, global
asset and liability positions by functional category should be similar except for the
asymmetries caused by recording values for reserve assets in a single category on the assets
side of the accounts and spreading offsetting liabilities among several functional categories
on the liabilities side.6
7. This paper discusses an international coordinated initiative to improve the quality of
data on FDI, i.e., the Coordinated Direct Investment Survey (CDIS).
II. DISCREPANCIES IN GLOBAL EXTERNAL SECTOR STATISTICS
8. The size of the statistical discrepancies in the global external sector statistics has been
a cause of concern to financial data users and, in particular, to the IMF in connection with its
surveillance activities and the World Economic Outlook. Previously, the differences between
assets and liabilities were the greatest in portfolio investment and other investment, and
international organizations sought to address the discrepancies in these two categories first.
6 The counterpart liabilities to reserve assets are predominantly included in portfolio investment (securities),
although some counterpart liabilities are included in other investment (deposits) or another functional category.
Reserve assets are those external assets that are readily available to and controlled by monetary authorities for
meeting balance of payments financing needs, for intervention in exchange markets to affect the currency
exchange rate, and for other related purposes.

6
9. The IMF’s Coordinated Portfolio Investment Survey (CPIS), conducted as an annual
exercise since 2001, was a major step toward improving the measurement of trans-border
holdings of portfolio investment. Also, the IMF’s INFER Survey (“Instrument Composition
of Transactions in Foreign Exchange Reserves”), which has been conducted annually
beginning with 1991, provides information on the level of liabilities within each of the
functional categories associated with reserve assets. Such information is useful in isolating
the discrepancies that arise from measurement errors. Similarly, the Bank for International
Settlements (BIS) has conducted a survey on banks’ international positions (assets and
liabilities) of currency and deposits and loans (the major components of other investment).
Over time, there have been significant improvements in these data sets in the aggregate. In
addition, the CPIS and BIS datasets provide bilateral data that are of growing interest. Data
on positions at an individual economy level (“from whom to whom” data) help analysts gain
valuable insights into the degree of interconnectedness in financial markets, particularly
during periods of turmoil.
Table 2.
Table 2. Global Discrepancies in FDI Flows
2003 2004 2005 2006 2007 2008
1. Total
Abroad -668.1 -1008.4 -1066.2 -1501.2 -2437.1 -2107.4
In Reporting Economy 649.5 767.7 1154.2 1528.6 2351.1 1850.8
Discrepancy -18.7 -240.7 87.9 27.4 -86.1 -256.5
2. Equity & Other Capital
Abroad -440.7 -649.9 -798.8 -957.3 -1757.1 -1480.9
In Reporting Economy 516.2 545.7 921.6 1166.9 1901.6 1420.5
Discrepancy 75.5 -104.2 122.8 209.7 144.5 -60.4
3. Reinvested Earnings
Abroad -227.5 -358.6 -267.4 -544.0 -680.0 -626.4
In Reporting Economy 133.2 222.1 232.5 361.7 449.4 430.3
Discrepancy -94.2 -136.5 -34.9 -182.2 -230.6 -196.1
Source: BOPSY part 2, 2009
(US$ Billions)
lobal Discrepancies in FDI Flows
10. In light of the success of the CPIS and of the BIS banking data collections, and the
significant discrepancies in FDI data (see Table 2), it was recognized that there is a need to
undertake a similar data collection exercise for FDI, to improve coverage and valuation, and
to provide additional valuable bilateral data.
III. FDI: CONCEPTS AND PROGRESS IN MEASUREMENT
11. FDI is a major category of cross-border investment. Unlike other categories of cross-
border investment, it involves international investment in which an investor in one economy
obtains an ownership interest that confers influence, or more often control, over the

7
management of a direct investment enterprise in another economy that receives equity
investment.7 The relationship between enterprises involved in FDI tends to be lasting, and as
noted, FDI tends to bring nonfinancial dimensions, such as management expertise,
technology transfer, marketing, and market access that are not usually associated with other
forms of cross-border investment. Enterprises in a FDI relationship are more likely to trade
with each other. FDI tends to provide a stable source of funds during periods of market stress
and facilitates risk sharing.
12. FDI is, however, difficult to measure, not just because of the complexities of the
concepts underlying FDI but also because identifying the parties in a FDI relationship is not
straightforward. It also is difficult to explain FDI concepts to survey respondents. The
challenges associated with measuring FDI include: identifying the units that meet the
definition of direct investor, direct investment enterprise, and fellow;8 consolidation of
business registers; conducting a survey; and ensuring that the direct investor reports
information obtained from the books of the direct investment enterprise (see Annex I).
13. Until recently, data on external assets and liabilities position were reported mainly by
industrial and a few emerging market economies. However, as result of concerted effort of
the IMF under the auspices of the IMF’s Balance of Payments Committee9 there has been
significant improvement in data on external assets and liabilities. The number of economies
reporting inward FDI investment positions to the IMF’s Statistics Department has increased
markedly from 82 economies at end-2000 to 113 economies at end-2008. The number
reporting outward FDI positions also grew strongly, from 72 economies at end-2000, to
100 economies at end-2008. The rapid growth in reporting countries is consistent with the
growth in value of the global reported FDI position. Reported inward and outward FDI
positions almost doubled between 2003 and 2008, to stand at about $17.0 trillion and
$17.8 trillion, at the end-2008, respectively (Table 1). These increases in value captured not
only the increase of the value of the stock as a result of increased investment and price
increases, but also increases in the number of economies reporting and improved coverage.
7 Influence is defined as owning at least 10 percent and control as owning more than 50 percent of voting power.
8 For further detail, see the discussion of the Framework for Direct Investment Relationships in Chapter 6,
Section B (and particularly Box 6.1) in BPM6 (http://www.imf.org/external/pubs/ft/bop/2007/bopman6.htm),
and Annex 4 of the OECD Benchmark Definition of Foreign Direct Investment, fourth edition (available at:
http://www.oecd.org/document/33/0,3343,en_2649_33763_33742497_1_1_1_1,00.html). 9 The IMF Committee on Balance of Payments Statistics comprises the IMF and senior balance of payments
experts from all regions of the world. The present members are from: Canada, Chile, China PR, China Hong
Kong SAR, Germany, Ghana, Japan, Oman, Pakistan, the Philippines, Russia, South Africa, Spain, and the
United States. Several international organizations also participate. These are: the Bank for International
Settlements, European Central Bank, Eurostat, the Organisation for Economic Cooperation and Development,
the United Nations Organization, and the United Nations Conference on Trade and Development.

8
Table 3. Top Ten Recipients of Inward Direct Investment and Value
2000 and 2008 Positions
(US$ Billions)
Economy
Value of Inward
Direct Investment,
2000
Economy
Value of Inward
Direct Investment,
2008 United States 1,421 United States 2,647
France 537 Luxembourg 1,517
United Kingdom 463 France 1,029
Germany 463 United Kingdom 980
China, P.R.: Hong Kong 455 Germany 950
Netherlands 244 China,P.R.: Mainland 876
Canada 213 China, P.R.: Hong Kong 816
Belgium 195 Belgium 671
Spain 156 Netherlands 639
Italy 121 Spain 623
Total Top Ten 4,268 Total Top Ten 10,748
Source: International Financial Statistics, May 2010.
Note: Totals may not sum because of rounding.
14. The value of reported inward FDI for top ten recipients rose from $4,268 billion at
end-2000 to $10,748 billion at end-2008, an increase of over 150 percent (see Table 3). The
composition of the top ten changed substantially. Whereas the United States remained the top
recipient throughout this time, with the value almost doubling, Luxembourg and Mainland
China gained prominence as recipients of FDI, with stocks at the end of 2008 of $1,517
billion and $876 billion, respectively. (Neither of these economies produced estimates of
their FDI positions for end-2000.10) Spain’s inward FDI stock quadrupled over this period,
while Belgium’s more than tripled. Canada and Italy dropped out of the top ten destinations
over that period.
15. For FDI abroad, the top ten direct investing economies (outward FDI) saw their total
value increase from $5,507 billion at end-2000 to $12,853 billion at end-2008, or more than
doubling (see Table 4). The United States remained the top investor. As with inward FDI,
one of the more striking changes between 2000 and 2008 was the emergence of the
importance of Luxembourg as a major outward direct investor. (In 2000, it did not produce
estimates of FDI abroad. It is notable that Luxembourg is the home economy for a large
number of special purpose entities that are engaged in pass-through finance.) Canada and
Italy dropped out.
10
In the four years since China PR and Luxembourg began reporting their inward FDI positions to the IMF, the
values more than doubled for China PR, from $369 billion, and increased 86 percent for Luxembourg.

9
Table 4. Top Ten Providers of Outward Direct Investment and Value
2000 and 2008 Positions
(US$ Billions)
Economy
Value of Outward
Direct Investment
2000
Economy
Value of Outward
Direct Investment
2008
United States 1,532 United States 3,699
France 943 United Kingdom 1,531
United Kingdom 923 Luxembourg 1,466
Germany 487 France 1,303
China, P.R.: Hong Kong 388 Germany 1,249
Netherlands 305 Netherlands 821
Japan 278 China, P.R.: Hong Kong 762
Canada 238 Switzerland 726
Switzerland 232 Japan 680
Italy 180 Belgium 615
Total Top Ten 5,507 Total Top Ten 12,853
Source: International Financial Statistics, May 2010 Note: Totals may not sum because of rounding
IV. 2009 COORDINATED DIRECT INVESTMENT SURVEY
16. As noted above, there are a number of difficulties associated with measuring FDI.
Some of these difficulties are beyond the scope of this paper and involve complex
methodological issues, such as in regard to consolidation of statistical units. Experience
clearly demonstrates that the most effective way of assuring the availability of high quality
and comprehensive data on FDI is by conducting surveys. No other method is as effective in
identifying enterprises that are foreign owned or that have FDI abroad, and surveys are
important in obtaining data on such items as earnings and FDI positions.
17. In recognition of the need to improve data quality, the IMF, in conjunction with its
international partner agencies—including the ECB, Eurostat, the OECD, UNCTAD, and the
Word Bank—launched the CDIS in 2007. It is a major global statistical undertaking that is
expected to improve the quality and availability of data on FDI used in the international and
national economic accounts.11
18. The CDIS has attracted considerable support. As of July 2010, 132 economies had
indicated an interest in participating (see Table 5). The purpose of the CDIS is to improve the
uality of FDI position statistics in the international investment position and by immediate
11
The CDIS home page can be found at http://www.imf.org/external/np/sta/cdis/index.htm.

10
counterpart economy. Specifically, the objectives of the CDIS are to collect the following
data items, with a measurement date of December 31, 2009:
For all economies, comprehensive and harmonized data on direct investment
positions, broken down between equity and debt, and for debt to be further broken
down between claims and liabilities, by economy of direct investor (for inward direct
investment), or of direct investment enterprise (for outward direct investment).
19. At its meeting in November 2009, the IMF Committee on Balance of Payments
Statistics agreed with the IMF’s proposal that the CDIS be an annual exercise. As a result, the
CDIS will continue to promote improvements in the quality and availability of data on FDI in
the future.
A. Tools to Help Economies Conduct the CDIS
20. To maximize coverage, quality and consistency, the IMF formed a Task Force in
June 2007 to prepare a Guide on the CDIS. In addition to the IMF’s international partner
agencies, eleven jurisdictions also participated in the Task Force12. The Guide that can be
found on the IMF web site at http://www.imf.org/external/np/sta/cdis/index.htm is available in
Arabic, Chinese, French, Russian, and Spanish, as well as in English. Annex II is an example
of the degree of detail covered in the Guide.
21. In addition to the Guide, the IMF, with the support of its international partner
agencies, conducted 10 regional seminars on the CDIS in 2008. These were for:
members of the European Union and of the European Free Trade Association (two
seminars);
China PR;
economies in East and South Asia and the Pacific;
Latin American economies;
economies in the Middle East;
formerly centrally planned economies in South East Europe and Central Asia;
Francophone African economies;
Anglophone African economies; and
12
The jurisdictions were: Brazil, China PR, China Hong Kong, France, Japan, Mexico, the Netherlands, Oman,
South Africa, United Kingdom, and the United States.

11
economies and jurisdictions in the Caribbean and Atlantic.
22. As a result of these seminars, it was clear that many participants were well advanced
and needed no further input from the IMF, whereas others needed further assistance. In light
of this, the IMF decided to modify its approach and focused on those regions/countries that
were deemed to be in greater need of assistance. Accordingly, in 2009, one-on-one missions
were conducted in China PR, Russia, and Nigeria, and regional workshops were held for:
economies in East and South Asia and the Pacific;
economies in the Middle East;
Francophone African economies;
Anglophone African economies; and
economies in the Caribbean and Atlantic.
23. The primary purpose of these workshops was to review with the participants the
model survey questionnaires that had been added to the Guide in 2009, and to discuss the
participants’ implementation plans.
V. NEXT STEPS AND CONCLUSION
24. In 2010, further assistance is being provided to countries that may be experiencing
compilation challenges. Preliminary data are scheduled to be reported to the IMF by the end
of September 2010, and they are scheduled to be published by the end of 2010/early 2011.
The IMF has corresponded with CDIS participants and has provided data reporting templates
and reporting instructions. The submitted data will be published on the IMF website. Revised
data will be submitted to the IMF by the end of March 2011 and these are scheduled to be
published in June or July 2011. In addition to the data, participants will be asked to provide
metadata and indicate what improvements have been introduced as a result of conducting the
CDIS.
25. With continued strong international support for the CDIS, continued research into
FDI data compilation and analytical issues, and the decision to conduct the CDIS on an
annual basis starting with data for 2009, the quality of data on FDI will improve substantially.
For example, with improved data collection by an economy, as well as the availability of
bilateral counterpart data (“mirror data”) from other economies participating in the CDIS,
there will be better coverage and consistency of balance sheet information for both equity and
debt, assets and liabilities, and there will be benefits to the flow accounts as well. Indeed, the
Guide identifies a number of income and financial account items that economies may choose
to collect as part of the CDIS (there are no plans for these additional items to be reported to
the IMF). These include the collection of data on all aspects of FDI income (interest,
dividends, and reinvested earnings) and financial account transactions by instrument. The
availability of mirror data can help an economy target areas where its own data may be weak.

12
26. A further benefit from CDIS participation may be improvement in the quality of data
on foreign controlled enterprises—such as statistics on the Activities of Multinational
Enterprises (AMNE statistics), and the closely related data on Foreign AffiliaTes Statistics
(FATS) and data on the foreign-controlled sector of the national accounts.13
27. We are pleased that the CDIS and other international efforts have been receiving
strong support, and we are optimistic of further support and progress in the months ahead.
The CDIS will not only improve the overall quality of direct investment data in its own right,
it will also help in the analysis of the interconnectedness of financial markets. Given the
increased recognition of the need for bilateral data, the bilateral detail collected in the CDIS
is an important addition to the existing BIS data set covering bank positions and the IMF data
set covering holdings of securities.
13
AMNE statistics cover a range of variables on the overall activities of direct investors and their foreign
controlled enterprises, such as gross output, value added, and number of people employed. It excludes data that
are classified in direct investment, portfolio investment, or elsewhere in the international financial accounts, as
well as data on associates. Foreign AffiliaTes Statistics are also statistics describing the overall activities of
foreign controlled enterprises; it excludes data on direct investors and on associates.

1
3
Table 5. Countries Indicating a Willingness to Participate in the Coordinated Direct Investment Survey (CDIS)
as of July 2010
N. America &
Caribbean
South
America Europe: EU
Europe:
Non EU
Former
nonEU
Soviet Union
Middle East
and North
Africa
Sub-Sahara
Africa
East and South
Asia and Pacific
Aruba Argentina Austria Albania Armenia Bahrain Benin Australia
Barbados Bolivia Belgium Bosnia Azerbaijan Iran Botswana Bangladesh
Canada Chile Bulgaria Croatia Belarus Israel Burundi Bhutan
Grenada Costa Rica Czech Rep Iceland Georgia Jordan Cape Verde Cambodia
Guyana Ecuador Denmark Macedonia Kazakhstan Kuwait Comores China PR
Haiti El Salvador Estonia Montenegro Kyrgyz Lebanon Congo (Rep of) China HK SAR
Jamaica Honduras Finland Norway Moldova Libya Cote d'Ivoire China Macao SAR
Netherlands Antilles Mexico France Serbia Russia Oman Ethiopia Fiji
Trinidad and Tobago Nicaragua Germany Switzerland Tajikistan Syria Gabon India
USA Panama Greece Turkey Ukraine
The Gambia Indonesia
Paraguay Hungary
Ghana Japan
Peru Ireland
Guinea-Bissau Korea (Rep of)
Uruguay Italy
Guinea Malaysia
Latvia
Kenya Maldives
Lithuania
Madagascar Mongolia
Luxembourg
Mauritius Myanmar
Malta
Morocco Nepal
Netherlands
Mozambique New Zealand
Poland
Namibia Pakistan
Portugal
Nigeria Philippines
Romania
Rwanda Samoa
Slovakia
Seychelles Solomon Islands
Slovenia
Sierra Leone Sri Lanka
Spain
Somalia Thailand
Sweden
South Africa Tonga
UK
Swaziland
Tanzania
Uganda
Zambia
Total of all participants 132

14
Annex I. Statistical issues in measuring FDI
1. FDI involves a direct investor, a direct investment enterprise, and a fellow enterprise. A
direct investor is an entity or group of related entities that is able to exercise control or a
significant degree of influence over another entity (the direct investment enterprise) that is a
resident of a different economy. A direct investment enterprise is an entity subject to control
or a significant degree of influence by a direct investor, obtained through holding 10 percent
or more of voting power. Fellow enterprises do not meet the threshold of equity investment,
but are in a FDI relationship because they have a common investor, who is a direct investor in
at least one of them. In some cases, a single entity may be, at the same time, a direct investor,
a direct investment enterprise, and a fellow enterprise in its relationships to other enterprises.
2. There are a number of challenges associated with measuring FDI. These include:
identifying the units that meet the definition of direct investor, direct investment enterprise,
and fellow; consolidation differences between business registers, particularly where different
registers are used for international and national account purposes; conducting a survey so that
the respondents provide data according to the concepts used in FDI; and ensuring that the
data reported by the direct investor are reported using information from the books of the
direct investment enterprise.
3. The development of a business register that identifies whether or not an entity is in a FDI
relationship is an important step toward comprehensively identifying key units in such
relationships. Most business surveys that collect information that feeds into the national accounts
do not routinely collect information on whether an entity is in a FDI relationship. To build a
register that includes that information may require considerable effort. In addition, because much
of the information (both financial and on equity holders) may not be routinely produced for any
internal company purpose, it often takes persistence on the part of the statistical agency to obtain
the information from the respondent. This is true even where data collection is supported by
statutory authorities that protect the confidentiality of the data reported and carry substantial
penalties for nonresponse.
4. A further complication may occur in regard to consolidation of statistical units,
particularly where separate agencies have responsibility for compiling data for the international
and national economic accounts. This issue can even arise where a single agency has such
responsibility but uses different registers for compiling data for the international and national
accounts. In particular, for national accounts purposes, often economies include each individual
enterprise on their national registers. In contrast, for international economic account purposes
(such as for measuring FDI flows and positions), economies often consolidate domestic units that
are under common control for statistical purposes, in much the same fashion that a business
consolidates business units for reporting to stockholders. As a consequence of these differences in
consolidation, there may be inconsistencies in classification by industry, domestic sector, etc. of
direct investors, direct investment enterprises, and fellow enterprises between the international
and national economic accounts
5. It also is noteworthy that, looking just within the international economic accounts, the
degree of consolidation can affect whether a given statistical unit is recorded in inward or outward
FDI. This is because consolidation may affect whether or not a given unit is a fellow enterprise.

15
This is significant because, under the new standards, a resident fellow enterprise is recorded in
inward (or outward) FDI stocks or flows depending upon the location of its ultimate controlling
parent (UCP). In contrast, a resident direct investor’s stocks and flows vis-à-vis its direct
investment enterprises are always recorded in outward FDI, and a resident direct investment
enterprise’s stocks and flows vis-à-vis its direct investor are always recorded in inward FDI. Thus,
if an enterprise is consolidated within the local enterprise group, its relationship to a related
nonresident enterprise could be that of a direct investor and its direct investment enterprise
abroad, whereas if that enterprise is not consolidated within the local enterprise group, its
relationship with its related nonresident enterprise abroad could be one of a resident fellow
enterprise with its fellow enterprise abroad. This could have an impact on whether the position is
recorded as inward or as outward FDI in the second instance, depending on the residence of the
UCP of the fellow enterprise.
6. Identifying fellow enterprises is particularly difficult, because the concept is not based on
the equity holder of the investor/investee. A common situation involves the following:
Figure: Direct Investor (Enterprise A) and Its Two Direct Investment Enterprises
(Enterprises B and C)
Economy 1 50 equity
(100 percent)
Economy 2 2 equity 100 loan
(100 percent)
250 loan
Economy 3
350 debt issue on
international financial
markets
(unrelated entities)
7. In the above diagram, Enterprise A (in Economy 1) holds all the equity in Enterprise B (in
Economy 2) and in Enterprise C (in Economy 3). (Thus, enterprise A is a direct investor in direct
investment enterprises B and C.) Enterprise C raised funds on international financial markets and
then lent the funds to Enterprises A and B. If the compiler in Economy 3 approaches Enterprise C
to collect data on FDI, it has to be explained that the investment by Enterprise C in Enterprise B
should be recorded in FDI, even though Enterprise C owns no equity in Enterprise B. Similarly,
A
B
C

16
the compiler in Economy 2 has to be very careful to explain that the lending to Enterprise B
should be recorded in FDI.14 Indeed, Enterprise C’s lending to Enterprise A is also FDI (referred
to as “reverse investment”); because all equity and debt positions between related entities are
recorded in FDI (except where both parties are certain types of financial intermediaries). None of
these aspects of the definition of FDI are easy for a non-direct investment statistician to
understand.
8. Another statistical challenge is that information on equity holdings is often not recorded
on the same basis by the direct investor as it is by its direct investment enterprise. There are
several reasons for this, of which the following may be important. First, while the direct
investment enterprise will record its accumulated retained earnings as part of owners’ equity, it is
not uncommon for the direct investor to record its investment in the direct investment enterprise at
acquisition price, and make no further adjustment. A second reason is that, whereas the direct
investment enterprise may adjust its assets and liabilities to reflect current market prices or
exchange rates, with the concomitant adjustment to owners’ equity, these adjustments may not be
included on the books of the direct investor. Data from the books of the direct investment
enterprise are preferred in compiling estimates of international investment positions or national
balance sheets in the international and national economic accounts, because these books reflect
values that are more consistent with the market value principle that is preferred in compiling both
sets of accounts. The CDIS recommends this approach to improve comparability.
14
Positions between Enterprises B and C are recorded in FDI because both of these enterprises are under the
control or influence of the same direct investor (Enterprise A).

17
Annex II. Coverage of the CDIS Guide
The Guide goes into considerable detail regarding how to conduct a survey. For example, it
discusses what units to survey, what information to collect in a survey, how to compile and
report statistics, and how to undertake a survey. An example of the degree of detail is given
below (taken from the table of contents of the Guide).
Chapter 5: Undertaking the CDIS ............................................................................................. ..... 84
Timetable .......................................................................................................................... 84
Responsibility to produce direct investment statistics ........................................................ 84
Creation/update of a survey frame ...................................................................................... 84
Draft timetable for conduct of a direct investment survey.................................................... 85
Information content of the survey frame ............................................................................. 86
Computerizing the survey frame ......................................................................................... 86
Use of the survey frame ...................................................................................................... 87
Determining the coverage of the direct investment survey (sample or census) ................... 88
Draft survey questionnaire .................................................................................................. 89
Communication with respondents ....................................................................................... 90
How to address low coverage or low response rates ............................................................ 92
Editing/validating collected data ........................................................................................ 93
Data editing/validation through the questionnaire form ......................................... 93
Data editing/validation through analytical checks ................................................... 94
Data editing/validation from the viewpoint of the counterpart economy of
the direct investor and direct investment enterprise ................................................ 94
Confidentiality considerations ................................................................................ 95
Data reporting and dissemination ...................................................................................... 95

18
References
Balance of Payments and International Investment Position Manual.-- Washington D.C.:
International Monetary Fund ,2009.
Edison, Hali, and others, 2002, “International Financial Integration and Economic Growth,”
Journal of International Money and Finance, Vol. 21 (November).
Huizinga, Harry, and Dantao Zhu, 2004, “Domestic and International Finance: How Do They
Affect Consumption Smoothing?” CEPR Discussion Paper No. 44677 (London: Centre for
Economic Policy Research).
Lane, Philip, R., and Gian Maria Milesi-Ferretti, 2001, “The External Wealth of Nations:
Measures of Foreign Assets and Liabilities for Industrial and Developing Countries,” Journal of
International Economics, Vol. 55, No. 2.
_______, 2002b, “Long-Term Capital Movements,” in NBER Macroeconomics Annual, Vol. 16,
ed. by Ben S. Bernanke and Kenneth Rogoff (Cambridge, Massachusetts: MIT Press).
_______,2004b, “The Transfer Problem Revisited: Net Foreign Assets and Real Exchange
Rates,” Review of Economics and Statistics, Vol. 86, No. 4.
Obstfeld, Maurice, and Alan M. Taylor, 2004, Global Capital Markets: Integration, Crisis, and
Growth (Cambridge, Massachusetts: Cambridge University Press).
OECD Benchmark Definition of Foreign Direct Investment, fourth edition.
Prasad, Eswar S., and others, 2003, Effects on Financial Globalization on Developing Countries:
Some Empirical Evidence, IMF Occasional Paper No. 220 (Washington: International Monetary
Fund).
System of National Accounts, 2008, New York 2009.
The Coordinated Direct Investment Survey Guide, IMF, March 2010.