Embed Size (px)
Citation preview

No.
S S S
0 3 4 3
J R

List of Volumes
Volume I : Executive Summary Volume II : Phase 1: Master Plan Study - Main Report Volume III : Phase 1: Master Plan Study - Supporting Report Volume IV : Phase 2: Feasibility Study - Main Report Volume V : Phase 2: Feasibility Study – Supporting Report Volume VI : Phase 2: Feasibility Study - Data Book
The cost estimate is based on the price level and exchange rate of June 2002.
The exchange rate is:
US$1.00 = PHP52.0 = ¥120.0

ncece
Laguna dede Bay
Pacific Ocean
amm
5°
10°
15°
120°
125°
PROJECT ARE
0 10 20 30km
LEGEND
River
Province Boundary
ment Boundary
RoadScale

THE STUDY ON
WATER RESOURCES DEVELOPMENT FOR
METRO MANILA IN
THE REPUBLIC OF THE PHILIPPINES
FINAL REPORT
VOLUME V PHASE 2: FEASIBILITY STUDY
SUPPORTING REPORT
List of Annexes
LOCATION MAP ABBREVIATION
Annex A :Topographic Survey Annex B :Geological Investigation Annex C :Hydrological Invesigation Annex D :Environmental Impact Assessment (EIA) Annex E :Coastal Investigation Annex F :Study on Water Resources Facilities Annex G :Water Conveyance and Water Supply Plans for Metro Manila Annex H :Power Development Plan Annex I :Associated Projects for Supporting Regional Socio-Economic Activities Annex J :Construction Plan and Cost Estimate

i
ABBREVIATION ACP : Asbestos Cement Pipe ADB : Asian Development Bank AMSL : Above Mean Sea Level ANR : Assisted Natural Regeneration ASEAN : Association of Southeast Asian Nations AWLR : Automatic Water Level Recorder AWSOP : Angat Water Supply Optimization Project AWWA : American Waterworks Association BIR : Bureau of Internal Revenue BOD : Biochemical Oxygen Demand BOO : Build Operate Own BOT : Build-Operate-and-Transfer BP : Bank Policy BRS : Bureau of Research and Standards BSWM : Bureau of Soils and Water Management CA : Concession Agreement CALABARZON : "Cavite, Laguna, Batangas, Rizal and Quezon Provinces" CAPEX : Capital Expenditure CARP : Comprehensive Agrarian Reform Program CBFM : Community-Based Forestry Management CD : Community Development CDO : Cease and Desist Order CENRO : Community Environment and Natural Resources Office CERA : Currency Exchange Rate Adjustment CFRD : Concrete Face Rockfill Dam CO : Community Organization COA : Commission On Audit CPC : Certificate for Public Convenience CPCN : Certificate for Public Conveniences and Necessity CPI : Consumer’s Price Index DA : Department of Agriculture DAO : DENR Administrative Order DAR : Department of Agrarian Reform DBCC : Development Budget Coordination Committee of NEDA DECS : Department of Education, Culture and Sports DENR : Department of Environment and Natural Resources DFI : Development Financing Institutes DILG : Department of Interior and Local Government DMA : District Metering Area DMS : Detailed Measurement Survey DMZ : District Monitoring Zone DO : Dissolved Oxygen DOE : Department Energy DOF : Department Of Finance DOH : Department of Health DPWH : Department of Public Works and Highways DSCR : Debt Service Coverage Ratio DSWD : Department of Social Welfare and Development

ii
DTI : Department of Trade and Industry EA : Executing Agency ECAs : Environmentally Critical Areas ECC : Environmental Compliance Certificate ECPs : Environmental Critical Projects ECRD : Earth Core Rockfill Dam EDCOP : Engineering and Development Corporations Of the Philippines EIA : Environmental Impact Assessment EIARC : EIA Review Committee EIRR : Economic Internal Rate of Return EIS : Environmental Impact Statement ELC : ELC Electroconsult EMB : Environmental Management Bureau EMMP : Environmental Management and Monitoring Plan EMP : Environmental Management Plan EMS : Environmental Management System EO : Executive Order EPA : Extraordinary Price Adjustment ERB : Energy Regulatory Board (of DOE) EVAT : Expanded Value Added Tax FC : Foreign Currency FGD : Focus Group Discussion FIRR : Financial Internal Rate of Return FMB : Forest Management Bureau F/S : Feasibility Study FSL : Full Supply Level G.S. : Gauging Station GDP : Gross Domestic Products GHD : Gutteridge Haskins and Davey Pty Ltd. GI : Galvanized Iron GNP : Gross National Products GOCC : Government Owned and Controlled Corporations GOJ : Government of Japan GOP : Government of the Philippines GRDP : Gross Regional Domestic Products HP : Hydropower HUDCC : Housing and Urban Development Coordinating Council HWL : High Water Level IAs : Implementing Agencies IBRD : International Bank for Reconstruction and Development or the
World Bank ICC : Investment Coordination Committee of NEDA ICCs : Indigenous Cultural Communities IEC : Information-Education and Communications IEE : Initial Environmental Examination IICDA : Infanta Integrated Community Development Assistance IOL : Inventory of Losses IPs : Indigenous Peoples IPRA : Indigenous People’s Right Act IRR : Implementing Rules and Regulations

iii
IU : International Union for the Conservation of Nature and Natural Resources
JBIC : The Japan Bank for International Cooperation JICA : Japan International Cooperation Agency JVC : Joint Venture Company JWWA : Japan Waterworks Association LC : Local Currency LCB : Local Competitive Bidding LFPR : Labor Force Participation Rate LGU : Local Government Unit LLDA : Laguna Lake Development Authority Lpcd : Liter per capita per day LPG : Liquefied Petroleum Gas LTPDP : Long-term Philippines Development Plan LWL : Low Water Level LWUA : Local Water Utilities Administration M/P : Master Plan Study MARILAQUE : Manila-Rizal-Laguna-Quezon MEMSI : "MADECOR Environmental Management Systems, Inc." MENT : Multi-Partite Environment Monitoring Team MERALCO : Manila Electric Company MGB : Mines and Geosciences Bureau MLD : Million Liter per Day MMDA : Metro Manila Development Authority MMT : Multi-partite Monitoring Team MMUTIS : Metropolitan Manila Urban Transportation Information System MOA : Memorandum of Agreement MOL : Minimum Operation Level MTPDP : Medium-Term Philippines Development Plan MWCI : Manila Water Company Inc. MWSI : Maynilad Water Services Inc. MWSP : Manila Water Supply Project MWSRP : Manila Water Supply Rehabilitation Project MWSS : Metropolitan Waterworks and Sewerage System NAMRIA : National Mapping and Resource Information Authority NATM : New Austrian Tunneling Method NCIP : National Commission on Indigenous Peoples NCR : National Capital Region NEDA : National Economic and Development Authority NEPC : National Environmental Protection Council NGO : Non-Government Organization NGOs : Non-Government Organizations NIA : National Irrigation Administration NP Junction : Novaliches Portal Junction NPC : National Power Corporation NPCC : National Pollurion Control Commission NRW : Non-Revenue Water NSCB : National Statistical Coordination Board NSDW : National Standard for Drinking Water NSO : National Statistical Office NTFW : Non-timber Forest Product

iv
NTU : Nephelometric Turbidity Unit NWDCC : National Water Data Coordinating Center (to be created) NWRB : National Water Resources Board NWRMP : National Water Resources Master Plan O&M : Operation and Maintenance ODA : Official Development Assistance OP : Office of the President PAC : Poly Aluminum Chloride PAFs : Project Affected Families PAGASA : Philippine Atmospheric, Geophysical and Astronomical Services
Administration PAMB : Protected Area Management Board PAPs : Project Affected Persons PD : Presidential Decree PENRO : Provincial Environment and Natural Resources Officer PFDA : Philipine Fisheries Development Authority PHILVOLCS : Philippine Institute of Volcanology and Seismology PHP : Philippine Peso PMF : Probable Maximum Flood PMP : Probable Maximum Precipitation PNSDW : Philippine National Standards for Drinking Water PO : People's Organization PR : Public Relations PROC : Proclamation P/S : Power Station PSY 2000 : Philippine Statistical Yearbook 2000 PTFWRDM : Presidential Task Force on Water Resources Development and
Management PVC : Poly Vinyl Chloride QUEZELCO : Quezon Electric Company RA : Republic Act RAP : Resetlement Action Plan RBW : Receiving Body of Water RBWA : River Basin and Watershed Authorities RCCD : Roller Compacted Concrete Dam REECS : "Resources, Environment and Economics Center for Studies" RIZWADA : Rizal Water Districts Association ROE : Return on Equity ROW : Right Of Way RPV : Pressure Reducing Valve SAMAKA : Samahang Mahalin ang Kalikasan SAMAKABAY : Samahang Magsasaka ng Bantay Bayan SCP : Strategic Communications Plan SEC : Securities and Exchange Commission SES : Socio-Economic Survey S.G.S. : Streamflow Gauging Station SMBDSM : Samahan ng Magsasaka sa Bundok na Dahilig ng Sierra Madre, Inc. SO2 : Sulfur Oxides STP : Sewerage Treatment Plant SR : Service Reservoir SRD : Social Resettlement Division

v
TBM : Tunnel Boring Machine TCD : Tribal Community Development TCU : True Color Unit TDS : Total Dissolved Solids TOR : Terms Of Referece TRANSCO : National Transmission Company TSS : Total Suspended Solids UATP : Umiray-Angat Transbasin Project UP : Univerdity of the Philippines UPSARDFI : "UP Social Action and Research for Development Foundation, Inc." WACC : Weighted Average Cost of Capital WB : World Bank WCS : Water Conveyance Schemes WCT : Water Conveyance Tunnel WD : Water District WRAP : Water Resources Authority of the Philippines WRDP : Water Resources Development Project WTP : Water Treatment Plant WtP : Willingness to Pay

vi
Measurements
Length Area mm = millimeter m2 = square meter cm = centimeter ha = hectare m = meter km2 = square kilometer km = kilometer cu m = cubic meter Volume Derived Measures cm3 = cubic centimeter m/sec = meter per second l = liter m3/sec = cubic meter per second kl = kiloliter kWh = kilowatt hour m3 = cubic meter MWh = megawatt hour GWh = gigawatt hour PPM = parts per million kmph = kilometer per hour MLD = million liter per day mg/l = milligram per liter Weight Currency g = gram PHP = Philippine Peso kg = kilogram ¥ = Japanese Yen ton = metric ton US$ = US Dollar Time Other Measure sec = second % = percent min = minute o = degree hr = hour oC = degree(s) Celsius d = day 103 = thousand y = year 106 = million 109 = billion Energy W = watt kW = kilowatt MW = Megawatt

Annex A
Topographic Survey

Annex A Topographic Survey
A-i
Annex A TOPOGRAPHIC SURVEY
Table of Contents Page
A1 Introduction .................................................................................................... A-1A1.1 Purpose and General Description of Topographic Survey Works ...... A-1 A1.2 Survey Area and Survey Period .......................................................... A-1 A1.3 Basic Datum for Surveying ................................................................ A-1
A2 Survey Method ................................................................................................ A-2 A2.1 Background ......................................................................................... A-2 A2.2 Alternative Methods Adopted ............................................................ A-2
A3 Ground Control Survey for Photogrammetoric Mapping .......................... A-4 A3.1 Traverse Survey .................................................................................. A-4
A3.1.1 Method ................................................................................ A-4 A3.1.2 Accuracy of GPS Observation ............................................ A-4
A3.2 Leveling ............................................................................................. A-5 A3.3 Installation of New Control /Benchmark Points for
Photogrammetric Mapping ................................................................. A-5 A3.4 Results of Ground Control Survey ..................................................... A-5
A4 Aerial Photography and Photogrammetric Mapping ................................. A-6 A4.1 Aerial Photography ............................................................................ A-6
A4.1.1 Available Aerial Photographs .............................................. A-6 A4.1.2 Aerial Photography Performed ........................................... A-6
A4.2 Photogrammetric Mapping ................................................................. A-7 A4.2.1 Mapping Area and Mapping Scale ...................................... A-7 A4.2.2 Field Identification .............................................................. A-7 A4.2.3 Aerial Triangulation ............................................................ A-7
A4.3 Digital Mapping .................................................................................. A-8 A4.3.1 General ................................................................................ A-8 A4.3.2 Photogrammetric Mapping at scale of 1:5,000 ................... A-8 A4.3.3 Photogrammetric Mapping at scale of 1:2,000 ................. A-10 A4.3.4 Editing and Drawing ......................................................... A-10 A4.3.5 Field Identification Survey .................................................A-11
A5 Other Topographic Survey Works Conducted .......................................... A-12 A5.1 Rearrangement of Contour Line on Existing Topographic Maps ..... A-12 A5.2 Photography of Housings Using Ordinary Camera .......................... A-13 A5.3 Land Classification Mapping Using SPOT Satellite Data ................. A-13 A5.4 River Cross Section Survey along the Agos Mainstream .................. A-14
A5.4.1 River Cross Section Survey ............................................... A-14 A5.4.2 Longitudinal River Profile ................................................ A-14
A6 Topographic Survey Materials Produced .................................................. A-15 A6.1 Preparation of CAD Data ................................................................. A-15 A6.2 Final Products ................................................................................... A-15

A-ii
List of Tables
PageTable A2.1 Comparison of Work Quantities in Original Contract and Amended
Contract for Topographic Survey ............................................................. AT-1 Table A3.1 Misclosures of GPS Observation .............................................................. AT-2 Table A3.2 Observation Standard and Measurement Accuracy of Leveling .............AT-11 Table A3.3 Check Sheet for Leveling Accuracy........................................................ AT-12 Table A3.4 Final Results of Ground Control Survey ................................................. AT-15 Table A3.5 Quality Control Sheets for Aerial Photography ...................................... AT-19 Table A3.6 Standard and Accuracy of Mapping ....................................................... AT-20
List of Figures
PageFigure A1.1 Survey Area ..............................................................................................AF-1 Figure A2.1 Coverage of New Photographs and Other Photographs Used for
Photogrammetric Mapping .......................................................................AF-2 Figure A3.1 Distribution of New Benchmark, Control Points and Leveling Route .....AF-3 Figure A3.2 GPS Observation Network .......................................................................AF-5 Figure A4.1 Map Index of 1:2,000 Scale Topographic Maps .......................................AF-6 Figure A4.2 Classification of Maps According to Source Data ....................................AF-7 Figure A4.3 Index of Adjoining Sheets for 1:5,000 Scale Topographic Maps ..............AF-8 Figure A5.1 Location of River Cross Sections .............................................................AF-9

Annex A Topographic Survey
A-1
Annex A TOPOGRAPHIC SURVEY
A1 Introduction
A1.1 Purpose and General Description of Topographic Survey
The purpose of the topographic survey is to produce the topographic data and products required for a feasibility study on the Project comprising the Kaliwa Low Dam, Agos Dam and Reservoir, and the Kaliwa-Taytay Waterway connecting the Kaliwa River basin and the Taytay Service Reservoir located adjacent to the central part of Metro Manila. The topographic survey carried out in this Study includes the following:
• Ground control survey for photogrammetric mapping,
• Installation of new bench marks and control points,
• Aerial photography,
• Photogrammetric mapping at scales of 1:2,000 and 1:5,000,
• River cross section survey in the lower reach of the Agos River,
• Collection of latest information of distribution of housings in the planned Agos Reservoir area, and
• Collection of general information of land classification in the planned Agos Reservoir area.
A1.2 Survey Area and Survey Period
The areas covered by the topographic survey are shown in Figure A1.1. The topographic survey was conducted by entrusting it to the local contractor, CERTEZA, on a local contract basis. Most of the field survey works were completed by the end of August 2002 under the supervision of the JICA Study Team and the subsequent office works including the phtogrammetric mapping works were completed within the 2nd Field Investigation period lasting up to the early October 2002.
A1.3 Basic Datum for Surveying
The following basic datum for surveying was applied to the topographic survey: 1) Spheroid : Clarke 1866 2) Map projection : The Philippine Transverse Mercator (PTM) Grid
System 3) Coordinates : National Coordinates System established by NAMRIA
(PRS’92) 4) Vertical datum : National Elevation System established by NAMRIA 5) Unit of measurement : Metric System

Annex A Topographic Survey
A-2
A2 Survey Method
A2.1 Background
The aerial photography for the survey area had been attempted since the beginning of February 2002, but during the dry season of 2002 there were very few occurrences of bright and clear weather or good conditions which enabled the aerial photography needed to prepare the topographic maps by the photogrammetric method. The weather condition was always rainy or cloudy in and around the Project Area. Although the attempts for the aerial photography were carried on up to June 15, 2002 when the dry season usually ends in the Agos River Basin, there were not enough bright and clear days to complete the aerial photography. Since the rainy season had already started so that there was no more possibility of accomplishing the aerial photography as originally planned, the JICA Study Team decided to give up further attempts of the aerial photography.
The aerial photography work therefore was not fully completed during the 2nd Field Investigation. As a result, the lack of aerial photographs made it unable to prepare the topographical maps in accordance with the originally planned methods and procedures. The areas covered with the new photographs at a photo scale of 1:10,000 taken in the topographic survey are shown in Figure A2.1. As seen in the Figure, a large portion of the Kaliwa-Taytay Waterway route up to the Taytay Service Reservoir with the exception of the easternmost part of the Tunnel No.1 was covered by the new aerial photographs taken in this topographic survey. Likewise, the new photographs also could cover a portion of the Kaliwa River from the Daraitan village to the upstream part. On the other hand, the Agos River Basin was not fully covered thereby due to the long-lasting bad weather condition, although the new aerial photographs could cover the Agos mainstream area including the Agos Dam site and Afterbay Weir site.
Besides, new aerial photographs could not be taken for a large part of the lower Agos or Infanta Peninsula as well as the Agos Reservoir area consisting of the Kanan River Basin upstream of the Agos Dam site and the Kaliwa River Basin. Concerning the Kaliwa-Taytay Waterway route, the approximately 7km long section of the Tunnel No.1 from the Kaliwa Low Dam/Intake Site was also deficient of new aerial photographs taken in the topographic survey as shown in Figure A2.1 as mentioned above.
In order to make up for the deficiency of the new aerial photographs, it was needed to work out and adopt the alternative topographic survey methods to acquire the topographic maps that were required for the subsequent study works for the Feasibility Study.
A2.2 Alternative Methods Adopted
The following alternative methods for acquiring the topographic map were introduced and some topographic survey works were additionally carried out from the originally planned ones:
Annex A Topographic Survey
A-3
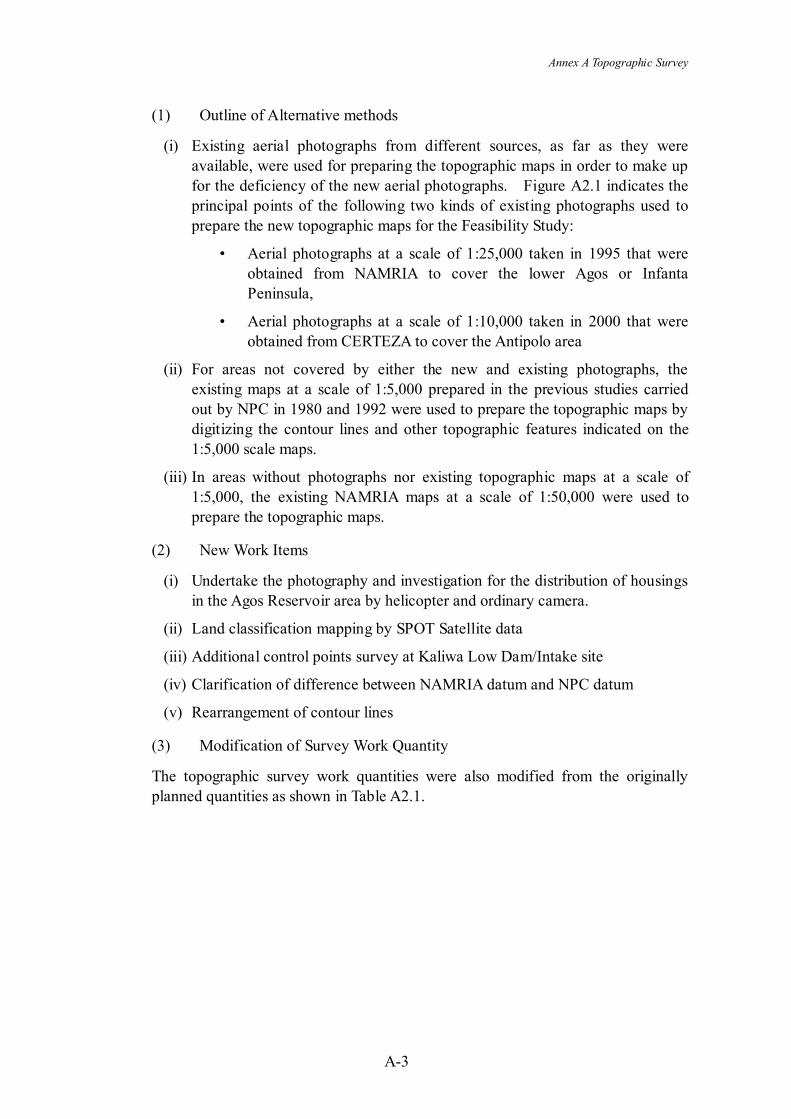
(1) Outline of Alternative methods
(i) Existing aerial photographs from different sources, as far as they were available, were used for preparing the topographic maps in order to make up for the deficiency of the new aerial photographs. Figure A2.1 indicates the principal points of the following two kinds of existing photographs used to prepare the new topographic maps for the Feasibility Study:
• Aerial photographs at a scale of 1:25,000 taken in 1995 that were obtained from NAMRIA to cover the lower Agos or Infanta Peninsula,
• Aerial photographs at a scale of 1:10,000 taken in 2000 that were obtained from CERTEZA to cover the Antipolo area
(ii) For areas not covered by either the new and existing photographs, the existing maps at a scale of 1:5,000 prepared in the previous studies carried out by NPC in 1980 and 1992 were used to prepare the topographic maps by digitizing the contour lines and other topographic features indicated on the 1:5,000 scale maps.
(iii) In areas without photographs nor existing topographic maps at a scale of 1:5,000, the existing NAMRIA maps at a scale of 1:50,000 were used to prepare the topographic maps.
(2) New Work Items
(i) Undertake the photography and investigation for the distribution of housings in the Agos Reservoir area by helicopter and ordinary camera.
(ii) Land classification mapping by SPOT Satellite data
(iii) Additional control points survey at Kaliwa Low Dam/Intake site
(iv) Clarification of difference between NAMRIA datum and NPC datum
(v) Rearrangement of contour lines
(3) Modification of Survey Work Quantity
The topographic survey work quantities were also modified from the originally planned quantities as shown in Table A2.1.

Annex A Topographic Survey
A-4
A3 Ground Control Survey for Photogrammetric Mapping
A3.1 Traverse Survey
A3.1.1 Method
Traversing was carried out in order to precisely measure the coordinates of the bench marks/control points and pre-marking points. These points were connected to the existing national control points. The traverse survey to determine the horizontal coordinates was performed using the Global Positioning System (GPS) equipment. The specifications of GPS receiver used for the traversing are as follows: a) Type of GPS receiver : Dual or single frequencies type b) Accuracy of GPS receiver : +/-(10mm+2ppm x D), where D is a distance
of baseline in km.
The GPS observation method is as follows: a) The GPS observation was carried out simultaneously at more than three (3)
points. b) The only satellites with a vertical angle of more than 15 to 30 were
observed. c) The GPS observation was continued for more than 2 hours for 4 satellites or
1.5 hours for more than 5 satellites.d) The GPS observation was done at least for a common baseline of each
session. e) Heights of the bench marks/control points were obtained to meet the
accuracy of the third level order by the direct leveling using auto level or by the indirect leveling using distance meter or GPS. The distribution map and index map of the control points are shown in Figure A3.1.
f) The observed point was pricked carefully on the enlarged photographs and data such as location, coordinates and other information are shown in the description of pricking point.
A3.1.2 Accuracy of GPS Observation
The observed data by GPS were checked and their misclosures were computed immediately after completion of the GPS observation. The ionospheric correction was applied to the baselines analysis and the following allowable range of the misclosures was adopted:
Ds< D x 2ppm, where D is a total distance in km.
The sessions map of the GPS observation is indicated in Figure A3.2 and the quality control of the GPS observation expressed in the misclousures of each session is shown in Table A3.1. The adjustment of the horizontal network and transformation from WGS-84 coordinates to PTM coordinates were carried out.

Annex A Topographic Survey
A-5
The conventional traverse survey method was also adopted for control points located at the place where the GPS was not effective. Especially, the conventional traverse survey was effective for determining the positions of bank posts for the river cross section survey.
A3.2 Leveling
The elevations of new benchmarks/control points to be used as the permanent base points were surveyed by the third order leveling, while the minor order leveling was carried out to obtain the necessary elevations of pre-marking points and those for aerial triangulation and stereo plotting. The observation standard and measurement accuracy of the leveling are shown in Table A3.2. The leveling routes and leveling results are shown in Figure A3.1 and Table A3.3, respectively.
A3.3 Installation of new Bench Mark/Control Points for Photogrammetric Mapping
During the topographic survey, 25 permanent bench mark/control points were newly installed at the major structure sites. These bench mark/control points were made of concrete with a rivet on its top in order to be durable for the permanent use. In addition to the permanent bench mark/control points, the temporary control points required for photogrammetric mapping were set up at more than 45 locations. These permanent and temporary bench mark/control points were connected by leveling and/or traversing survey by GPS to existing NAMRIA’s bench mark/control points applying the NAMRIA datum for the Project Area.
The permanent bench mark/control points were distributed to the nearby locations of the major structure sites shown in the following table:
Number of Permanent Benchmarks and Control Point Installed in the Topographic survey
No. Site Nos. of Benchmarks and Control Point
1) Lower Agos near Infanta 4 2) Agos Dam site 3 3) Agos Afterbay Weir site 2 4) Barangay Daraitan 2 4) Kaliwa Low Dam/Intake site 2 5) Powerhouse on Waterway for Metro Manila 2 6) Morong Water Treatment Plant (WTP) 2 7) Main Pipeline 3 8) Pump Station 1 9) Taytay Service Reservoir 1 10) Antipolo Pump Station and Pipeline 2 11) Antipolo Service Reservoir 1
Total 25
The locations of the control points used for aerial triangulation and leveling route are shown in Figure A3.1.
A3.4 Results of Ground Control Survey
The results of the leveling and traverse survey to measure coordinates and elevations of the benchmark/control points including cross sections posts on both banks of the lower Agos are shown in Table A3.4.

Annex A Topographic Survey
A-6
A4 Aerial Photography and Photogrammetric Mapping
A4.1 Aerial Photography
A4.1.1 Available Aerial Photographs
The new aerial photographs taken in this topographic survey carried out in this Study are indicated in Figure A2.1. The Figure also shows the photographs obtained from other sources, i.e. NAMRIA and CERTEZA concerning the aerial photographs covering Infanta Peninsula and the Antipolo area, respectively. The scales of the aerial photographs made available for this Study are as follows:
a) New aerial photographs taken in this topographic survey (2002) : 1:10,000
b) CERTEZA photographs (2000) : 1:10,000
c) NAMRIA photographs (1995) : 1:25,000
A4.1.2 Aerial Photography Performed
In this topographic survey, the aerial photography to produce the topographic maps for the Feasibility Study was performed applying the methods and procedures mentioned below.
(1) Type of Photography
The panchromatic black-and-white aerial photographs at a scale of 1:10,000 were taken using the KODAK Aerographic Double-X (#2405) film.
(2) Air Craft and Camera
A twin-engined AeroCommander 500U aircraft equipped with a WILD RC-10 camera (f=152 mm) and a GPS-assisted Flight Management System (FMS) were used to take the aerial photographs.
(3) Condition of Aerial Photography
The condition of newly taken aerial photographs was generally fine as indicated in the quality control sheets compiled in Table A3.5.
(4) Photographic Processing
The aerial photo negatives were processed using a ZEISS FE130 roll filmdeveloping equipment, while the contact prints were produced using a ZEISS KG30 Contact Printing equipment. KODAK photographic materials and chemicals were used in the processing of the negative film, diapositives film, and photographic paper prints.
Due care was taken in the processing so that negatives and prints were substantially free of blisters, bubbles, inclusions, coating lines, stress or static marks, bar marks, pin holes, abrasions, streaks, stains, and drying marks.

Annex A Topographic Survey
A-7
A4.2 Photogrammetric Mapping
A4.2.1 Mapping Area and Mapping Scale
In this topographic survey, the area mapped at scale of 1:5,000 using the new and existing aerial photographs and existing topographic maps at a scale of 1:5,000 covers the whole survey area except for the easternmost part of the Tunnel No.1 connecting from the Kaliwa Low Dam/Intake site and Taytay Service Reservoir.
In addition to the 1:5,000 scaled topographic maps, the following five (5) structure sites were mapped at a scale of 1:2,000 and these are shown in Figure A4.1:
1) Agos Dam site
2) Agos Afterbay Weir site
3) Kaliwa Low Dam/Intake site
4) Lagundi powerhouse site, Moron Water Treatment Plant (WTP) site, main pipeline route, Antipolo pump station, Antipolo Service Reservoir site, Pipeline route on the Kaliwa-Taytay Waterway
5) Taytay Service Reservoir on the Kaliwa-Taytay Waterway
The mapping standard and accuracy are shown in Table A3.6.
A4.2.2 Field Identification
Using the new aerial photographs, the field identification survey was carried out in order to classify the land use on the topographic maps produced:
A4.2.3 Aerial Triangulation
Using the newly taken aerial photographs and the results of ground control survey described in the foregoing Chapter A3, the geodetic coordinates (N, E, H) of required orientation points such as pass points and tie points were computed. The results of aerial triangulation were checked by residual errors of ground control points’ coordinates through the comparison of residual errors between ground control survey results and the values obtained from the aerial triangulation. Also, the standard deviation of control points and discrepancies of pass points and tie points between adjacent models after the adjustment were checked to confirm whether they are within or not within 0.08% of flight height for both planimetry and height.
The photo-coordinate of each photograph was measured using an analytical plotter (ZEISS P3) and the independent model adjustment undertaken using the PATM-PC software.
The aerial triangulation was done separately for each block of the newly taken photographs as follows:
a) Kaliwa-Taytay Waterway to the Taytay Service Reservoir site and Antipolo Service Reservoir site
b) Agos Dam Site, Afterbay Weir site and a part of the Agos River Basin.

Annex A Topographic Survey
A-8
It is noted that the aerial triangulation could not be initially done for the Kaliwa Low Dam/Kaliwa Intake Structure site, since the benchmark/control points for aerial triangulation were deficient due to the isolation of the block, although the newly taken aerial photographs taken in the topographic survey covered the area from the Kaliwa Low Dam/Intake site to upstream area of the Kaliwa River. Nevertheless, the Kaliwa Low Dam site was mapped by establishing additional control points by GPS survey and using them for the absolute orientation of the stereo-model.
A4.3 Digital Mapping
A4.3.1 General
On the basis of the results of the aerial triangulation, the topographic maps were produced by digital stereo-compilation technique, utilizing the ZEISS P3 Analytical Plotter and PCAP software. The digital drawing files were prepared applying the AutoCAD format.
Basically, planimetric features and structure were digitized directly with regard to line and point feature from the stereo models, while the elevation data were input in the form of terrain spot heights, 3-D break lines, and gridded DEM points. In addition, the digitizing of contour lines on existing maps prepared in the previous NPC’s study were also done in the mapping works.
A4.3.2 Photogrammetric Mapping at a Scale of 1:5,000
(1) Lower Agos Basin (Infanta Peninsula) with Contour Interval of 1 m and 5 m
The topographic mapping of the whole survey area at a scale of 1:5,000 was done by means of using both the new aerial photographs at a scale of 1:10,000 taken in this topographic survey and the existing aerial photographs at a scale of 1:25,000 taken in 1995 that was obtained from NAMRIA.
The contour lines at 1m intervals were plotted for the low-lying areas by using the new aerial photographs, while the contour lines at 5m interval were plotted in and around the mountain area.
The aerial photographs as well as the photogrammetric block adjustment data of NAMRIA in the UTM system were used to produce the required 1:5,000 scale topographic map through the additional works to convert the UTM to PTM system prior to merging it with the newly produced adjoining maps.
It is noted that there are differences in the terrain features such as rivers, creeks, and roads at the boundary of areas covered by these two (2) different photographs. This was deemed to be quite reasonable and logical, considering that the photographs were taken in different years with a time span of 7 years, during which the continuous human activities as well as the natural phenomenon could result in some range of change in the terrain features. For clarity and better understanding of the map user, this boundary line is delineated and annotated in the affected map
Annex A Topographic Survey
A-9
sheets.
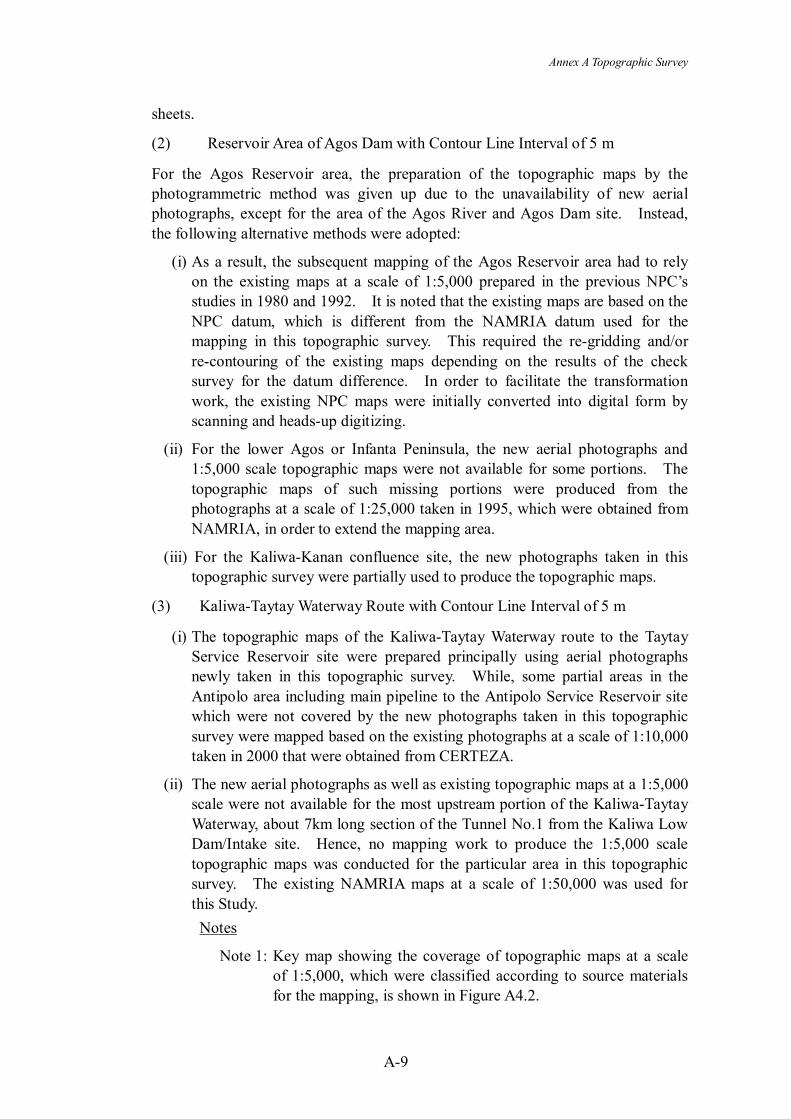
(2) Reservoir Area of Agos Dam with Contour Line Interval of 5 m
For the Agos Reservoir area, the preparation of the topographic maps by the photogrammetric method was given up due to the unavailability of new aerial photographs, except for the area of the Agos River and Agos Dam site. Instead, the following alternative methods were adopted:
(i) As a result, the subsequent mapping of the Agos Reservoir area had to rely on the existing maps at a scale of 1:5,000 prepared in the previous NPC’s studies in 1980 and 1992. It is noted that the existing maps are based on the NPC datum, which is different from the NAMRIA datum used for the mapping in this topographic survey. This required the re-gridding and/or re-contouring of the existing maps depending on the results of the check survey for the datum difference. In order to facilitate the transformation work, the existing NPC maps were initially converted into digital form by scanning and heads-up digitizing.
(ii) For the lower Agos or Infanta Peninsula, the new aerial photographs and 1:5,000 scale topographic maps were not available for some portions. The topographic maps of such missing portions were produced from the photographs at a scale of 1:25,000 taken in 1995, which were obtained from NAMRIA, in order to extend the mapping area.
(iii) For the Kaliwa-Kanan confluence site, the new photographs taken in this topographic survey were partially used to produce the topographic maps.
(3) Kaliwa-Taytay Waterway Route with Contour Line Interval of 5 m
(i) The topographic maps of the Kaliwa-Taytay Waterway route to the Taytay Service Reservoir site were prepared principally using aerial photographs newly taken in this topographic survey. While, some partial areas in the Antipolo area including main pipeline to the Antipolo Service Reservoir site which were not covered by the new photographs taken in this topographic survey were mapped based on the existing photographs at a scale of 1:10,000 taken in 2000 that were obtained from CERTEZA.
(ii) The new aerial photographs as well as existing topographic maps at a 1:5,000 scale were not available for the most upstream portion of the Kaliwa-Taytay Waterway, about 7km long section of the Tunnel No.1 from the Kaliwa Low Dam/Intake site. Hence, no mapping work to produce the 1:5,000 scale topographic maps was conducted for the particular area in this topographic survey. The existing NAMRIA maps at a scale of 1:50,000 was used for this Study. Notes
Note 1: Key map showing the coverage of topographic maps at a scale of 1:5,000, which were classified according to source materials for the mapping, is shown in Figure A4.2.

Annex A Topographic Survey
A-10
Note 2: Index of adjoining sheets of 1:5,000 scale topographic maps consisting of a total of 50 sheets is shown in Figure A4.3.
A4.3.3 Photogrammetric Mapping at a Scale of 1:2,000 for Structure Sites
The mapping areas of the structure sites at a scale of 1:2,000 are shown in Figure A4.1.
(1) Agos Dam site and Agos Afterbay Weir Site
Topographic map of Agos Dam site was prepared by using the new aerial photographs at a scale of 10,000 taken in this topographic survey. The condition of aerial photographs is very clear without cloud and dense cloud shadow and quite adequate to be used to prepare the topographic maps by the photogrammetric method.
(2) Kaliwa Low Dam/Intake Site
Topographic map of Kaliwa Low Dam Site was prepared from the new photographs at a scale of 1:10,000 taken in this topographic survey, although the photographs could be taken only for a limited area around the Low Dam/Intake Site. The additional survey was carried out to provide the control points necessary for orientation of the stereo-model covering the site as it had isolated from the photogrammetric block where control points were available.
A total of 3 control points was installed on the ground and their positions were identified on the photographs by pricking.
(3) Main Structures on the Kaliwa-Taytay Waterway
The topographic maps of this area were prepared using two (2) kinds of photographs, one was new photographs taken in this topographic survey and the other was photographs taken in 2000 that were obtained from CERTEZA. The scales of these two (2) kinds of photographs are the same at 1:10,000.
Most of the topographic maps were prepared using the new aerial photographs taken in this topographic survey, while the Antipolo Service Reservoir site including the main pipeline route thereto was produced by the aerial photographs taken in 2000 that were obtained from CERTEZA.
(4) Taytay Service Reservoir
The topographic maps of the Tytay Service Reservoir site were produced using the new aerial photographs taken in this topographic survey. They were in very clear condition as well as those of the Agos Dam and Afterbay Weir sites mentioned above.
A4.3.4 Editing and Drawing
The digital output files from the stereo-compilation phase together with the results of field identification survey and other collected data were used as basis for further cartographic processing and editing. The drawn lines were accordingly straighten

Annex A Topographic Survey
A-11
and smoothen, and contours were generated and edited. The drawing files were subdivided in accordance with the map sheet layout.
Further annotations, symbols, and grid ticks were incorporated prior to final plotting. The topographic maps were produced both in the forms of reproducible hardcopy sheets and digital drawing files on CDs.
A4.3.5 Field Identification Survey
The areal features, which were obscured or were not easily identifiable on the photographs, were surveyed at the field using the terrestrial survey methods. Likewise, annotated information such as geographic names and administrative names were confirmed at the field. All the information was duly incorporated in the final topographic maps.

Annex A Topographic Survey
A-12
A5 Other Topographic Survey Works Conducted
A5.1 Rearrangement of Contour Lines on Existing Topographic Maps
The NPC maps covering the Kaliwa River Basin (1980) and portions of the Kanan River Basin (1992) were initially converted to digital form by scanning and onscreen digitizing to vector form. Before it could be joined to the new maps of the other areas, the following steps were taken.
(1) Difference between NAMRIA Datum and NPC Datum.
The difference between the NPC datum used in preparing the old maps and the NAMRIA datum used in the present mapping was determined by the measurement with GPS at least two identifiable points in each of the earlier-mapped areas and comparing the computed positions with the mapped positions.
For the 1992 NPC maps covering the Kanan River area, the two stations, BLLM-15 and BLLM-16, which were used as reference points for the mapping at that time, were recovered and measured by GPS in this topographic survey. The computed positions were then compared with the given positions on the map. The results showed that the both elevations are practically the same with an average difference of 0.125m, while the horizontal positions differ by an average of 7.228 m in Northings and 1.099 m in Eastings. Based on these results, the digitized NPC maps were transformed by CAD operation into the present (NAMRIA) datum.
For the 1980 NPC maps covering the Kaliwa River area including Barangay Daraitan, no reference points could be recovered. Attempts were made to identify distinct features such as road intersection, houses, trails, but no definite determination and conclusion could be derived from the measurements except for the good coincidence between the spot heights on road intersections in Daraitan that were obtained from the old maps, and the elevations measured by direct leveling in this topographic survey. As a further course of action, additional bench mark/control points were established in Daraitan to enable the accurate mapping of the area using the new aerial photographs. Thereafter, the resulting map was used as the basis for transforming (by CAD operation) the digitized NPC map into the new mapping datum. From this operation, it was determined that the difference between the NPC datum for the 1980 map and the present datum (NAMRIA) is about 105.05 m in Northings and 11.25m in Eastings.
After transforming the 1980 and 1992 NPC maps to the NAMRIA datum, the resulting digital files were combined with the maps produced by photogrammetric techniques to produce an overall composite map based on a single datum.
(2) Realignment of Contour Lines.
It is noted from the aforesaid results that, while a significant horizontal datum shift was detected, there was no significant differences in elevations between the NPC and NAMRIA datum, so it would be logical to conclude that the old maps do not need to be re-contoured, but just have to be shifted in its horizontal position.

Annex A Topographic Survey
A-13
A5.2 Photography of Housings by Using Ordinary Camera
In order to get the latest information on the distribution of housings in the planned Agos Reservoir area where the new aerial photographs could not be taken, the photographs of housings in villages were taken using helicopter and ordinary camera.
The photographs were taken for the whole stretches of the Kaliwa River from Daraitan to the Kaliwa-Kanan confluence and the Kanan River from the confluence towards the upstream end of the proposed Agos Reservoir with a FSL of EL. 159m, especially focussing on the areas where houses and other structures were seen.
Flying height for the helicopter was nominally 300 m above ground. To determine the location of the houses, a photograph was first taken at a convenient angle, since vertical photography could not be taken due to the absence of camera hole at flooring of the helicopter. Then, the helicopter was hovered over the housing area so that the GPS position was taken. In this way the location of the house was visually shown in the photograph, while its corresponding position was determined by the GPS.
A Canon Power Shot A50 digital camera was used as the main camera, while an Olympus OM10 SLR camera was used as a backup. The digital camera was chosen due mainly to large number of exposures (up to 178) per memory card and the flexibility of image access, reproduction, and presentation.
Aside from the pilot, the survey crew included the cameraman, GPS man, and an assistant cameraman. The study on the housing was not only based on the photographs taken from the helicopter, but also the information from the surveyors who were fully acquainted with the area in the course of carrying out the ground control survey in this topographic survey.
A5.3 Land Classification Mapping by Using SPOT Satellite Data
The primary objective of the land classification mapping using SPOT Satellite data is to acquire general information on the land cover classification in the proposed Agos Reservoir area. For this purpose, the most recent cloud-free SPOT Satellite Composite Sensor (P+XS) Product taken on 21 April 2001 was procured. It was produced from the simultaneously acquired Panchromatic and Multi-spectral data by re-sampling and mixing the spectral bands XS1 and XS2 with the panchromatic band and resampling band XS3 at 10 meters. The area coverage of the scene is 60km by 60km. The delivered image data were already pre-processed with radiometric corrections associated with the systematic distortion introduced by the system.
Using ER Mapper 6.3 software, the image was geocoded and rectified applying the map rectification techniques. The existing NAMRIA topographic maps at a 1:50,000 scale covering the survey area were the major source in selecting the ground orientation points. The image enhancement was also employed to improve the visual interpretability of the image by enhancing the apparent distinction between the features in the scene.
Annex A Topographic Survey
A-14
The image interpretation and analysis was done by a combination of the supervised and unsupervised classification techniques. Eleven (11) general land cover classes were selected. These are i) close canopy, ii) open canopy, iii) brushland, iv) grassland, v) agricultural areas, vi) barren land, vii) built-up areas, viii) mangrove areas, ix) fishponds, x) sand/shallow water, and xi) water body.
These classes were verified with the aid of existing aerial photographs of the area. Land cover maps produced were overlayed with contours at 160-meter elevation and plotted at scales of 1:50,000 and 1:25,000, respectively, complete with map annotation and symbols.
From the resulting land cover map, land cover area computations were also done on several areas such as those within 80-meter, 120-meter, 160-meter and 200-meter contour interval within the project boundary. Similarly, the land cover area computation on several specified areas such as the Tunnel No.2, Pipeline, Morong Water Treatment Plant (WTP), pipeline to Antipolo and Angono Service Reservoir.
Likewise, Satellite Image Maps (SIMs) were produced by subdividing the image to be exactly coherent to the 1:50,000 scale topographic maps of NAMRIA covering the Project Area. The SIMS were then plotted at scales of 1:50,000 and 1:25,000 complete with map annotation and symbols.
A5.4 River Cross Section Survey along the Agos Mainstream
A5.4.1 River Cross Section Survey
The river cross-section survey was carried out at a total of 35 locations along the Agos River from the Agos Dam site to its estuary.
Prior to the river cross section survey, the following works were carried out: 1) Installation of cross section posts on both banks of each cross section, and 2) Traversing and leveling for measuring the coordinates and elevations of the
cross section posts. The river cross section survey was mostly performed using a total station and/or a leveling instrument, depending on the nature of the terrain. Sounding was also conducted using either a sounding pole or a sounding lead line. The locations of the river cross sections are shown in Figure A5.1.
A5.4.2 Longitudinal River Profile
The longitudinal profile was produced based on the following cross section survey data that were obtained through the river cross section survey mentioned above:
a) Lowest riverbed elevations, b) River water level at the time of measurements, and c) Ground elevations of the right and left banks.
The distances between the neighboring river cross sections were measured along the river course based on the 1:5,000 scale topographic maps produced from the photogrammetric mapping as explained in the foregoing Chapter A4.
Annex A Topographic Survey
A-15
A6 Topographic Survey Materials Produced
A6.1 Preparation of CAD Data
All topographic map and cross section data including longitudinal profile were saved in CD and the data format is AutoCAD .dwg.
Aside from the topographic information such as the natural and man-made terrain features, the digital drawing files also contain information on the sources of information, map datum, map scale, sheet number, geographic names, grid ticks, legend, and other marginal information.
A6.2 Final Products
a. Aerial photography
1) Contact Prints at scale 1:10,000 : 3set 2) Photo index map : 1 original, 2copies 3) Negative film of aerial photography : 1 Roll 4) Aerial photographs with pricking points : 1 set 5) Results of aerial triangulation : 1 original, 1 copy
b. Ground Control Survey
6) Description of ground control points : 1 set 7) Results of GPS survey : 1 set 8) Results of leveling : 1 set
c. Photogrammetric Mapping
9) 1:5,000 scale topographic maps : 1 set Original : 1 set second Original : 5 set Diazo Prints 10) 1:2,000 scale map : 1 set Original : 1 set second Original : 5 set Diazo Prints 11) Digital map files on CD : 1 set
d. River Cross section survey
12) River cross section/longitudinal profile : 1 set Original : 1 set second Original : 5 set Diazo Prints 13) Results of river cross section survey : 1 set 14) Digital files on CD : 1 set
e. Helicopter Photography
15) Map showing location of housing area : 1 set 16) Photo album : 2 sets
f. Satellite Image Mapping
17) Land classification map at scale of 1:50,000 : 1set 18) Satellite Image map of general area : 1 set