Embed Size (px)
Citation preview

SSRS/IQA/Rise Training Series
Module 4 – Using SSRS with iMIS Hands-On Training Reference and
Workbook
Business Systems Consultants, Inc. (312) 553-1253
www.bscichicago.com
© 2014 Business Systems Consultants, Inc. – All rights reserved 2 of 72
Table of Contents
Overview of SQL Server Reporting Services (SSRS) ..............................................................................5
What is SSRS? ................................................................................................................................5
Open Database Connectivity (ODBC) ...............................................................................................5
Relational Databases ......................................................................................................................6
About tables and records ...................................................................................................................... 6
About fields ........................................................................................................................................... 7
About keys ............................................................................................................................................ 7
iMIS Tables ....................................................................................................................................7
Membership Tables .............................................................................................................................. 7
Meetings Tables .................................................................................................................................... 7
Dues and Subscription Tables ............................................................................................................... 8
AR/Cash and Orders Tables................................................................................................................... 8
Fundraising Tables ................................................................................................................................ 8
SSRS Integration with iMIS .............................................................................................................8
Creating a New Project .......................................................................................................................9
Section Goal ...................................................................................................................................9
Understanding SSRS .......................................................................................................................9
Opening SSRS .................................................................................................................................9
Solution Explorer ............................................................................................................................. 10
Planning your report ........................................................................................................................ 11
Section Goal ................................................................................................................................. 11
Report Elements........................................................................................................................... 11
Creating a Report in Five Steps ..................................................................................................... 12
Getting it Right ............................................................................................................................. 12
Creating a Data Source ..................................................................................................................... 12
Section Goal ................................................................................................................................. 12
Setting up a connection ................................................................................................................ 13
Lab 1................................................................................................................................................ 15
Creating a report definition file ........................................................................................................ 16
Section Goal ........................................................................................................................................ 16
Creating a Report Definition File ......................................................................................................... 16

© 2014 Business Systems Consultants, Inc. – All rights reserved 3 of 72
Your Report Window .................................................................................................................... 17
Creating a dataset ............................................................................................................................ 19
Section Goal ........................................................................................................................................ 19
Datasets .............................................................................................................................................. 19
Creating a dataset ............................................................................................................................... 19
Query................................................................................................................................................... 20
Name: .............................................................................................................................................. 20
Data source: .................................................................................................................................... 20
Command type: ............................................................................................................................... 20
Query string: ................................................................................................................................... 20
Timeout: .......................................................................................................................................... 20
Fields ................................................................................................................................................... 21
Data Options ....................................................................................................................................... 21
Parameters .......................................................................................................................................... 22
Filters ................................................................................................................................................... 22
Building a query ........................................................................................................................... 23
Using SQL ............................................................................................................................................ 23
Using the Query Builder ...................................................................................................................... 24
Saving your work ................................................................................................................................. 28
Lab 2................................................................................................................................................ 29
Report Layout .................................................................................................................................. 30
Section Goal ................................................................................................................................. 30
Layouts ........................................................................................................................................ 30
Adding Fields ............................................................................................................................... 31
Lab 3................................................................................................................................................ 33
Layout.......................................................................................................................................... 34
Preview........................................................................................................................................ 34
Field Properties ............................................................................................................................ 34
Appearance ............................................................................................................................. 35
Data ......................................................................................................................................... 35
Design ...................................................................................................................................... 35
© 2014 Business Systems Consultants, Inc. – All rights reserved 4 of 72
International ........................................................................................................................... 35
Layout ...................................................................................................................................... 35
Misc ......................................................................................................................................... 35
Lab 4................................................................................................................................................ 37
Finishing Touches ............................................................................................................................. 39
Section Goal ................................................................................................................................. 39
Moving Report Components ......................................................................................................... 39
Adding a Text Box ........................................................................................................................ 39
Adding a Header or Footer ............................................................................................................ 40
Adding Report Parameters ........................................................................................................... 40
Lab 5................................................................................................................................................ 42
Integrating Reports with iMIS ........................................................................................................... 43
Section Goal ................................................................................................................................. 43
SSRS within iMIS .......................................................................................................................... 43
Importing an SSRS report into iMIS ............................................................................................... 44
Adding Reports to your Navigation ..................................................................................................... 46
Using SSRS to format your report ..................................................................................................... 50
Lab 6 – Create a Pie Chart report using IQA and SSRS ........................................................................ 50
Appendix A – Setting up SSRS in SQL Server 2008 R2 ......................................................................... 60
Appendix B – Setting SQL/SSRS for automatic email subscriptions ..................................................... 64
Configure SQL 2005 ...................................................................................................................... 64
Configure the report in SSRS for Email Subscription ....................................................................... 66
Configure SSRS for File Share subscription ..................................................................................... 71
© 2014 Business Systems Consultants, Inc. – All rights reserved 5 of 72
Overview of SQL Server Reporting Services (SSRS) Welcome to iMIS - Introductory SQL Server Reporting Services (SSRS). This guide will provide you with a basic understanding of Microsoft’s reporting system and how it integrates with iMIS. The exercises in this guide walk you through creating a report, selecting records, organizing records, inserting special fields, and adding SSRS to the iMIS Report menu. This guide includes the following sections:
1. Overview of SSRS 2. Creating a New Project 3. Creating a Data Source 4. Planning Your Report 5. Creating a Report Definition File 6. Creating a Dataset 7. Report Layout 8. Finishing Touches
What is SSRS? Microsoft SQL Server Reporting Service is a professional report writer that has the ability to communicate with any SQL database, including iMIS. SSRS is included with your purchase of SQL server and is run through Visual Studio. SSRS and iMIS communicate with each other through a database interface called Open Database Connectivity (ODBC). SSRS allows you to create presentationquality reports, share reports online, or email people reports on a scheduled basis as a subscription. iMIS provides a query tool Intelligent Query Architect (IQA) that can be used as the basis of an SSRS report, allowing people comfortable with IQA to use it to query the data, and then use SSRS to do the layout and any charts and graphs.
Open Database Connectivity (ODBC) Client programs, such as database tools and business applications, communicate with the database engine or network database server through database interfaces. The ODBC is the database interface that points the SSRS software to the iMIS database. The user runs an ODBC compliant application (for example, SSRS, Crystal Reports, iMIS, Access) that reads an ODBC data source. The ODBC data source points to a database that resides on the network or on the workstation. With this connectivity, the client application can access the information from the database and then use this information to create reports or work with the data in other ways. The following diagram illustrates how the ODBC interface communicates with the database and the client applications.

© 2014 Business Systems Consultants, Inc. – All rights reserved 6 of 72
Relational Databases A relational database consists of tables, fields (columns), and rows. Relational databases are powerful because they require few assumptions about how data is related or how it will be extracted from the database. Relational databases store data in the form of related tables. For example, the iMIS database is a relational database.
Here, the Name table contains the ID, LAST_FIRST, TITLE, and WORK_PHONE fields and has five data rows.
About tables and records
The tables consist of fields, or columns, and rows of records. A table consists of records that are a collection of individual fields. Tables are linked through relationships. The Name table, for example, is a table in iMIS.
© 2014 Business Systems Consultants, Inc. – All rights reserved 7 of 72
About fields
A field is used to store data. The data type to be stored in a field is pre-defined, for example, as a money field, as an integer field, or as a picture field. The ID and LAST_NAME fields, for example, are fields in the Name table.
About keys
A key is a field that defines a relationship between two or more tables. The main key types are primary and secondary. A primary key uniquely identifies a row, for example, Name.ID. More than one row may have the same secondary key.
iMIS Tables The iMIS database comprises many tables and groups of tables. Each iMIS module contains a group of tables such as the Membership, Meetings, Dues/Subscriptions, AR/Cash, Orders, and Fundraising tables. When you link your SSRS report to the iMIS database, you can set up your report to access data from these or any other iMIS tables. Tip: For help identifying which tables to include in your report, visit http://www.docs.imis.com or find an existing report or IQA query with similar fields.
Membership Tables
For example, if you were creating a Roster report, you would include the Name and Name_Address tables in your report. Note: The Name_XXX is the name of your customized demographic tables where XXX represents the name of the tables. Name_Demo is used for the conversion of the iMIS LAN-based demographic fields.
Meetings Tables
For example, if you were creating a Badge report, you would include the Order_Meet, Order_Badge, and possibly, the Meet_Master tables in your report.

© 2014 Business Systems Consultants, Inc. – All rights reserved 8 of 72
Dues and Subscription Tables
For example, to create a Dues history report, you would include the Activity and Subscriptions tables in your report.
AR/Cash and Orders Tables
For example, to create an Invoice report, you would include the Invoice and Orders tables in your report.
Fundraising Tables
For example, if you were creating a mailing label report, you would include the Activity table in your report.
SSRS Integration with iMIS ASI is in the process of rewriting several Omnis and Crystal reports in SSRS. The iMIS installation and upgrade will automatically copy any such SSRS reports into the iMIS directory. The SSRS reports will display with the Cyrstal reports under Generate Reports. Until this process is complete, you will have to create and upload your own reports into iMIS.
© 2014 Business Systems Consultants, Inc. – All rights reserved 9 of 72
Creating a New Project
Section Goal The goal of this section is to give you the knowledge and skills necessary to create a new Report Project in SSRS. After completing this section, you will be able to do the following:
1. Navigate to SSRS 2. Create a new project 3. Understand the main page
Understanding SSRS To create a report in SSRS, you must first create a report server project where you will save your report definition (.rdl) file and any other resource files that you need for your report. Next you will define a shared data source for your reports, create the actual report definition file, define a dataset, and define the report layout. When you run the report, the data is retrieved and combined with the layout, and then rendered on your screen, from where you can export it, print it, or save it.
Opening SSRS SSRS is accessed through Microsoft Visual Studio, which will most likely be installed on your SQL server. If not it can be installed from your original SQL discs. To open SSRS, complete the following steps:
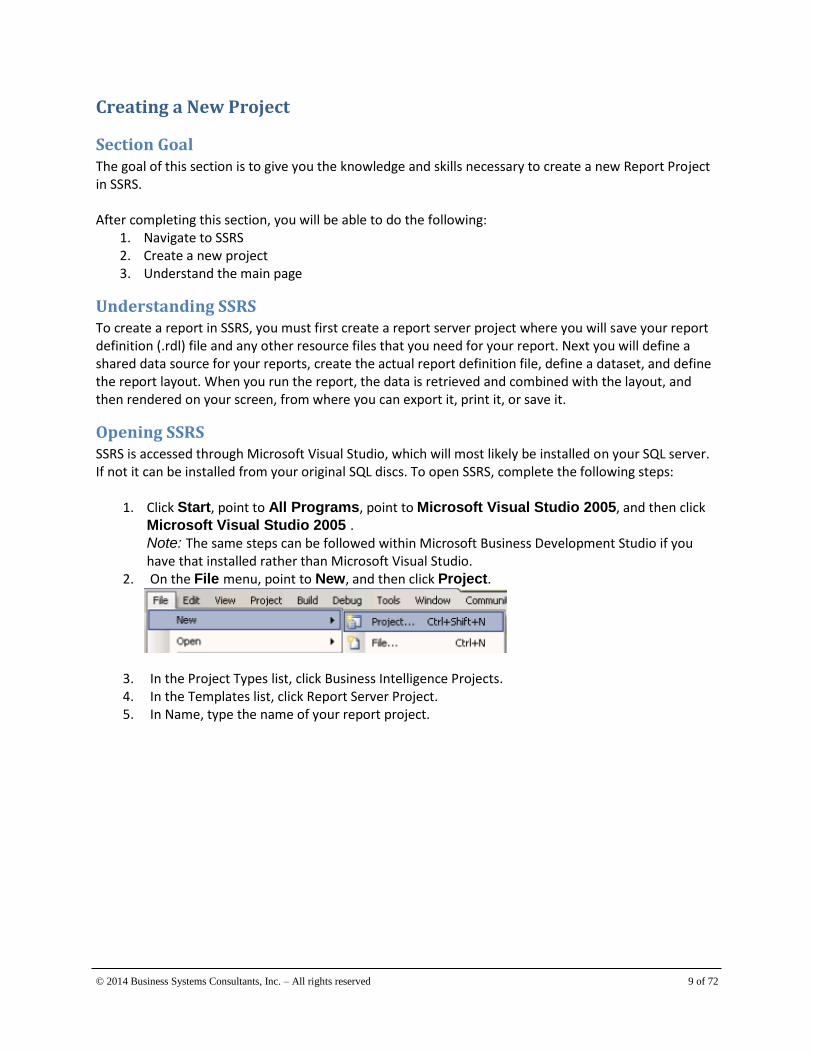
1. Click Start, point to All Programs, point to Microsoft Visual Studio 2005, and then click Microsoft Visual Studio 2005 . Note: The same steps can be followed within Microsoft Business Development Studio if you have that installed rather than Microsoft Visual Studio.
2. On the File menu, point to New, and then click Project.
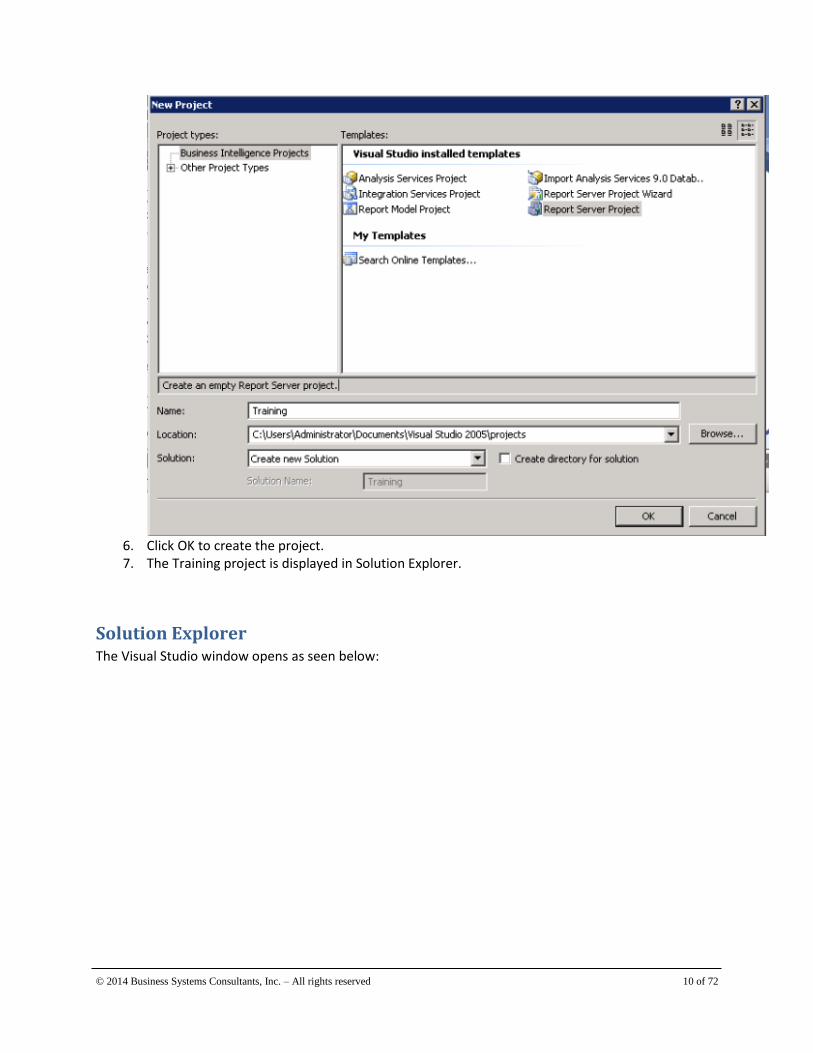
3. In the Project Types list, click Business Intelligence Projects. 4. In the Templates list, click Report Server Project. 5. In Name, type the name of your report project.
© 2014 Business Systems Consultants, Inc. – All rights reserved 10 of 72
6. Click OK to create the project. 7. The Training project is displayed in Solution Explorer.
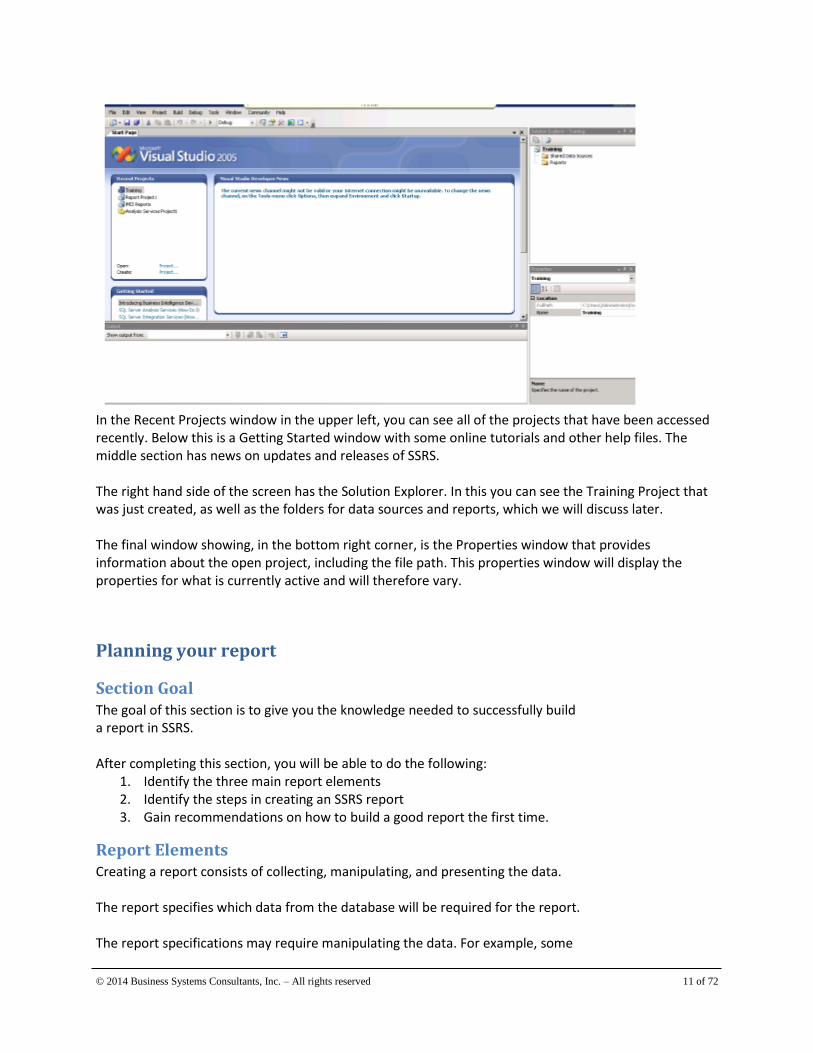
Solution Explorer The Visual Studio window opens as seen below:
© 2014 Business Systems Consultants, Inc. – All rights reserved 11 of 72
In the Recent Projects window in the upper left, you can see all of the projects that have been accessed recently. Below this is a Getting Started window with some online tutorials and other help files. The middle section has news on updates and releases of SSRS. The right hand side of the screen has the Solution Explorer. In this you can see the Training Project that was just created, as well as the folders for data sources and reports, which we will discuss later. The final window showing, in the bottom right corner, is the Properties window that provides information about the open project, including the file path. This properties window will display the properties for what is currently active and will therefore vary.
Planning your report
Section Goal The goal of this section is to give you the knowledge needed to successfully build a report in SSRS. After completing this section, you will be able to do the following:
1. Identify the three main report elements 2. Identify the steps in creating an SSRS report 3. Gain recommendations on how to build a good report the first time.
Report Elements Creating a report consists of collecting, manipulating, and presenting the data. The report specifies which data from the database will be required for the report. The report specifications may require manipulating the data. For example, some
© 2014 Business Systems Consultants, Inc. – All rights reserved 12 of 72
fields may need to be joined or truncated, or you may wish to change the format of a date field. Finally, the report format or layout determines how the data will be presented in the report.
Creating a Report in Five Steps You can create a report in five steps:
1. Choose a report type – Decide what design layout you would like your report to have. You should decide what layout will best present the data. If it is percentage data, a pie chart may work nicely. If it is detailed numbers you need, a table will present the information clearly and concisely.
2. Create a data source - Create the data source for the information you are reporting. 3. Build your query - Select the tables from which the data will be pulled. This is the area of
interest, for example, names, activities, and so forth. Join your tables - Select the tables for your join. This is only necessary if you are using more than one table in the data source. Add any filters to your data source to limit the data results.
4. Choose the fields - Select the fields you want displayed on your report. 5. Build your layout- Place the fields in your report. Display the report to the screen or to print the
report.
Getting it Right There are some steps you can take in advance to make sure that you have an idea of how to build your report before you get started. Some tips include:
If you are writing the report for a colleague, meet in person to make sure you have a good understanding of what they need to proceed. Ask questions early to make the job easier.
Find out how the report will be used. Knowing what the desired uses of the report are, and any action that may be taken dependent upon results will help to make sure you choose the best layout to present the data.
Figure out in plain English what fields you want to include. For example: I need to pull the name and email address for all records in our database who are active members, in each country.
Make sure you know which fields from which tables in your database correspond to what you listed in your non-technical description, including any filters. In the example above, converted into iMIS:s
I need to pull the name (name.full_name) and email address (name.email) for all records in our database who are active (name.status) members (name.member_type), in each country (group by name.country).
Clarify in iMIS any fields of which you are uncertain.
Creating a Data Source
Section Goal The goal of this section is to give you the knowledge and skills necessary to create a data source from which to build reports. After completing this section, you will be able to do the following:

© 2014 Business Systems Consultants, Inc. – All rights reserved 13 of 72
1. Add a new shared data source 2. Understand the components of the data source set up screen
Setting up a connection A data source is a set of connection information that a report will use to access data from a relational database (iMIS) or other resource. In this class we will be using a sample iMIS database for our reports. Microsoft SQL also comes with an AdventureWorks database installed, and you can use this to practice writing reports as well. A data source can be shared or local. We will begin by creating a shared data source that can be used by multiple reports within your project. This is good for a top-level look at your data that does not have any filters. It is where you build the connection to your database, from which you can then create datasets that are more specific. In the Solution Explorer, click on the Shared Data Sources folder under the Training project to highlight it. Note: If the Solution Explorer is not visible, click on the View menu and select Solution Explorer.
1. Right click on the Shared Data Sources folder, and select Add New Data Source. You will see the following screen:

© 2014 Business Systems Consultants, Inc. – All rights reserved 14 of 72
2. Type in the name of your data source, in the example above it is iMIS. 3. In the drop down for Type, select ODBC. If you have another project with the same data
source, you can copy the connection string and paste it in. If not, continue with step 4. 4. Click on Edit. You will see the following:
For the Data source specification select your iMIS database from the drop down menu. This drop down includes all databases installed on your
5. If required, enter the sa user name and password. You are able to click on Use connection string, click Build, and then tick the Use Trusted Connection box to avoid typing in the password.
6. Click on Test Connection to confirm that a connection was successful to the database. You
should see the following:
© 2014 Business Systems Consultants, Inc. – All rights reserved 15 of 72
Lab 1 1. Create a new report in Visual Studio and name it Training with your initials (e.g. Training_SJ).
Save it in the default directory.
2. Open the project and familiarize yourself with the window.
3. Create a Shared Data Source connecting through the ODBC to the iMIS database. Call the
connection iMIS_Training
4. Test your connection
5. Save your project
Notes

© 2014 Business Systems Consultants, Inc. – All rights reserved 16 of 72
Creating a report definition file
Section Goal
The goal of this section is to give you the knowledge and skills necessary to create a report definition file
in your SSRS project.
After completing this section, you will be able to do the following:
1. Create a new report definition file.
2. Navigate the Design and Preview windows.
3. Add tools to your window.
Creating a Report Definition File
Follow the steps below to create a report definition file:
1. In Solution Explorer, right-click Reports, point to Add, and click New Item. (This option gives you
more control then selecting Add New Report, which takes you directly into the wizard. You will
see the following screen:
2. In the Add New Item dialog box, under Visual Studio Installed Templates, click Report.
3. In Name, type Training1.rdl and then click Add. Report Designer opens and displays the new .rdl
file.

© 2014 Business Systems Consultants, Inc. – All rights reserved 17 of 72
Your Report Window Your report definition file now opens. As you have not yet created a dataset, it will open to the data tab.
Once this has been selected, you will have two views: Layout and Preview. Click each of the tabs to
change views.
You define your data in the Report Data pane. You define your report layout in Layout view. You can run
the report and see what it looks like in Preview view.
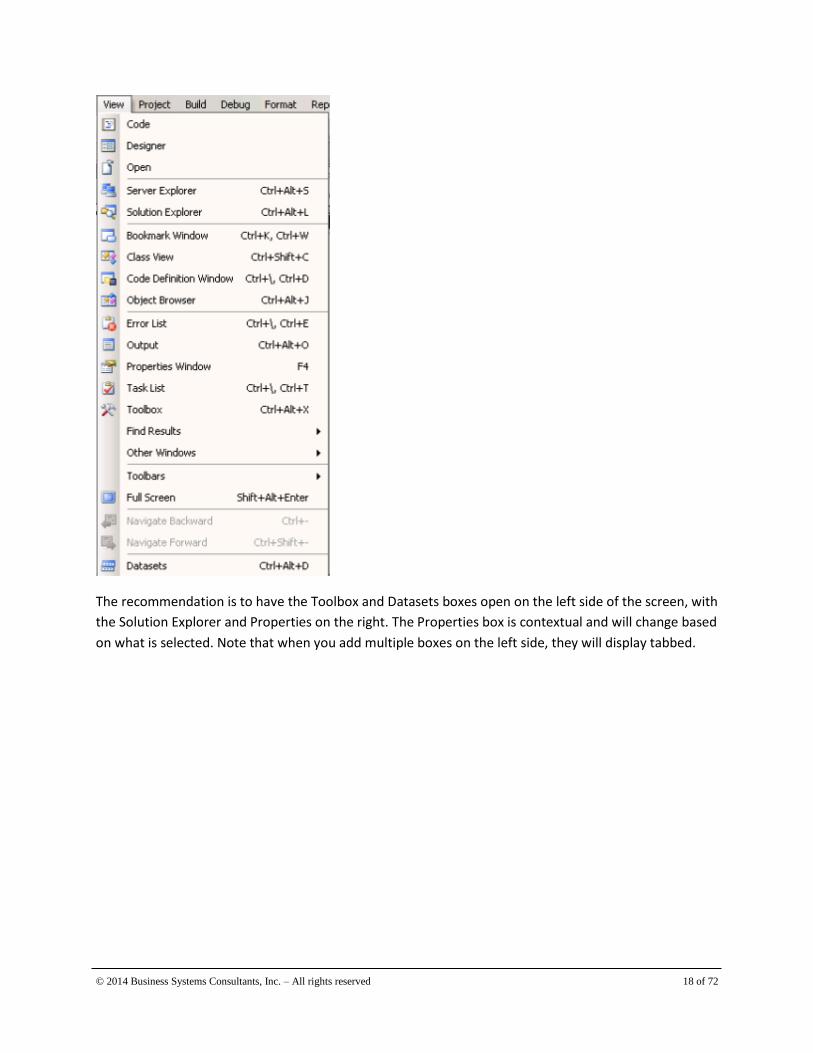
There are many toolbars you can add to your report project window to allow you to easily work with
your report. These can be moved around the screen, and added and removed as possible. They are all
found under the View menu, although some also have keyboard shortcuts.
© 2014 Business Systems Consultants, Inc. – All rights reserved 18 of 72
The recommendation is to have the Toolbox and Datasets boxes open on the left side of the screen, with
the Solution Explorer and Properties on the right. The Properties box is contextual and will change based
on what is selected. Note that when you add multiple boxes on the left side, they will display tabbed.

© 2014 Business Systems Consultants, Inc. – All rights reserved 19 of 72
Creating a dataset
Section Goal
The goal of this section is to give you the knowledge and skills necessary to create a dataset in your SSRS
project.
After completing this section, you will be able to do the following:
1. Understand the definition and components of a dataset.
2. Identify the steps in creating a dataset.
3. Build a basic query.
Datasets
After you define the data source, you need to define a dataset. In SSRS, the data that you use in reports
is contained within a dataset. A dataset includes a pointer to a data source (such as iMIS) and a query to
be used by the report. This query can be built through a user interface, or created directly via SQL code.
You can also use an IQA from iMIS as your dataset. As well as including fields and filtering the date, you
can also include calculated fields and variables.
Creating a dataset
To create a dataset, click on the Data tab at the top of the report and select New Dataset from the drop
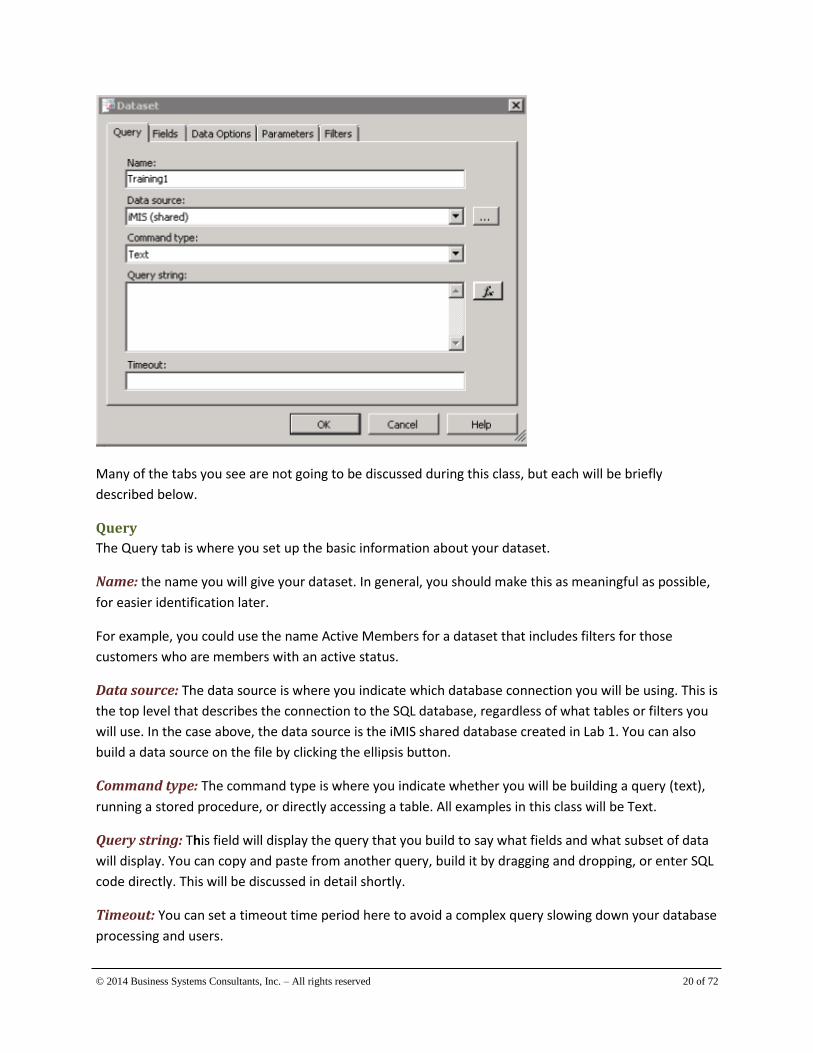
down. This opens the Dataset window, as seen below:
© 2014 Business Systems Consultants, Inc. – All rights reserved 20 of 72
Many of the tabs you see are not going to be discussed during this class, but each will be briefly
described below.
Query
The Query tab is where you set up the basic information about your dataset.
Name: the name you will give your dataset. In general, you should make this as meaningful as possible,
for easier identification later.
For example, you could use the name Active Members for a dataset that includes filters for those
customers who are members with an active status.
Data source: The data source is where you indicate which database connection you will be using. This is
the top level that describes the connection to the SQL database, regardless of what tables or filters you
will use. In the case above, the data source is the iMIS shared database created in Lab 1. You can also
build a data source on the file by clicking the ellipsis button.
Command type: The command type is where you indicate whether you will be building a query (text),
running a stored procedure, or directly accessing a table. All examples in this class will be Text.
Query string: This field will display the query that you build to say what fields and what subset of data
will display. You can copy and paste from another query, build it by dragging and dropping, or enter SQL
code directly. This will be discussed in detail shortly.
Timeout: You can set a timeout time period here to avoid a complex query slowing down your database
processing and users.
© 2014 Business Systems Consultants, Inc. – All rights reserved 21 of 72
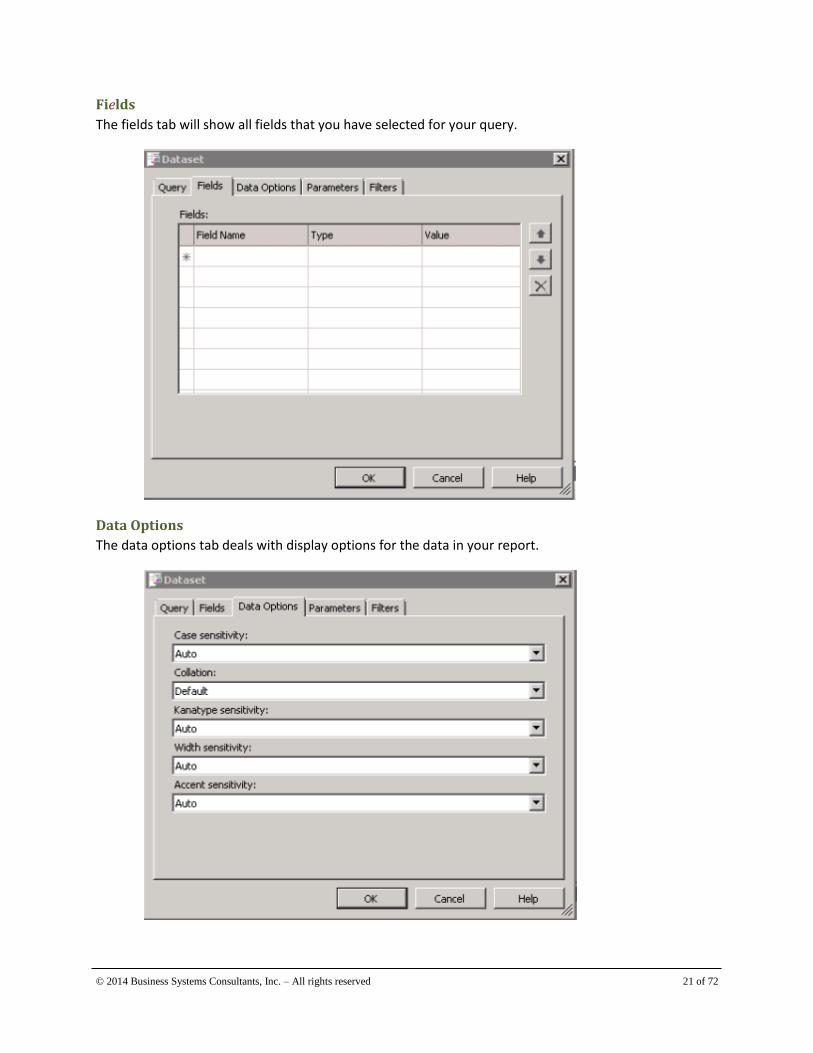
Fields
The fields tab will show all fields that you have selected for your query.
Data Options
The data options tab deals with display options for the data in your report.

© 2014 Business Systems Consultants, Inc. – All rights reserved 22 of 72
You can select details such as what language you wish to use for concatenation, and various levels of
sensitivity for when filters are applied.
Parameters
Parameters is where you can take advantage of the ability to ask the report user to provide values which
will then be used to display on the report or to filter data.
Filters
Filters is where you can view the filters that you have included in your query.
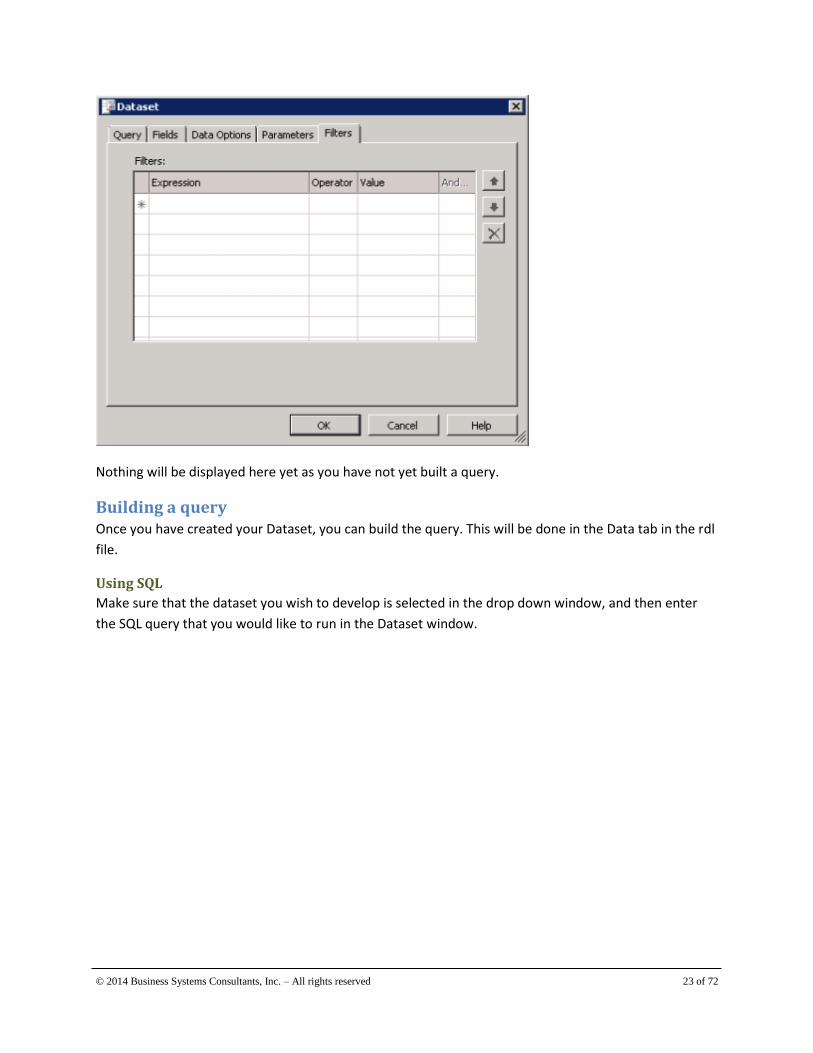
© 2014 Business Systems Consultants, Inc. – All rights reserved 23 of 72
Nothing will be displayed here yet as you have not yet built a query.
Building a query Once you have created your Dataset, you can build the query. This will be done in the Data tab in the rdl
file.
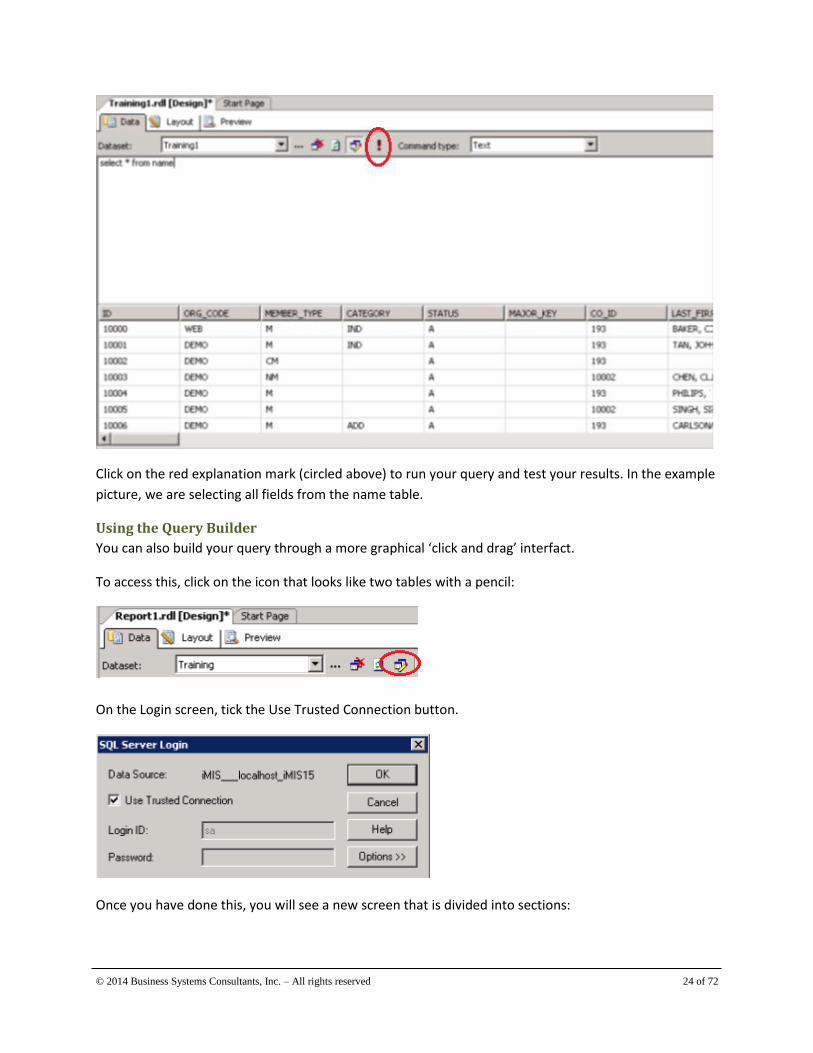
Using SQL
Make sure that the dataset you wish to develop is selected in the drop down window, and then enter
the SQL query that you would like to run in the Dataset window.
© 2014 Business Systems Consultants, Inc. – All rights reserved 24 of 72
Click on the red explanation mark (circled above) to run your query and test your results. In the example
picture, we are selecting all fields from the name table.
Using the Query Builder
You can also build your query through a more graphical ‘click and drag’ interfact.
To access this, click on the icon that looks like two tables with a pencil:
On the Login screen, tick the Use Trusted Connection button.
Once you have done this, you will see a new screen that is divided into sections:

© 2014 Business Systems Consultants, Inc. – All rights reserved 25 of 72
Right click anywhere in the open white area of the window, and select Add Table to add iMIS tables to
your query.
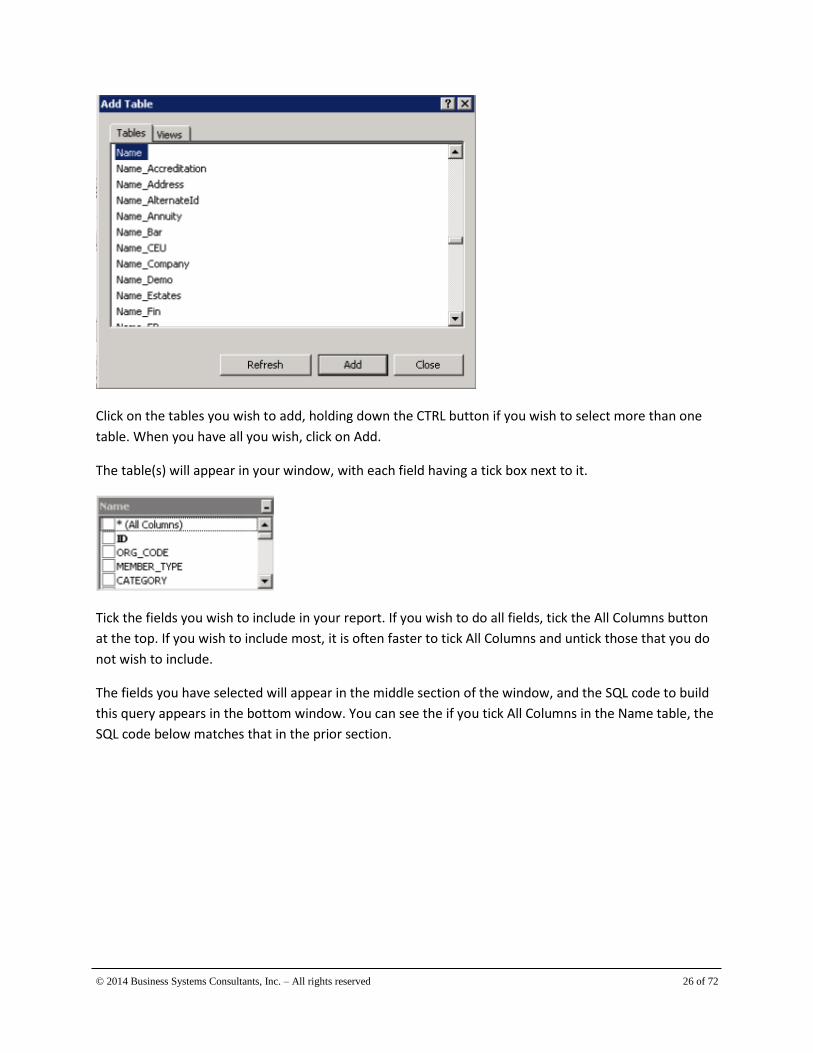
All of the tables and views available to you in your Shared Data Source (iMIS) will appear:
© 2014 Business Systems Consultants, Inc. – All rights reserved 26 of 72
Click on the tables you wish to add, holding down the CTRL button if you wish to select more than one
table. When you have all you wish, click on Add.
The table(s) will appear in your window, with each field having a tick box next to it.
Tick the fields you wish to include in your report. If you wish to do all fields, tick the All Columns button
at the top. If you wish to include most, it is often faster to tick All Columns and untick those that you do
not wish to include.
The fields you have selected will appear in the middle section of the window, and the SQL code to build
this query appears in the bottom window. You can see the if you tick All Columns in the Name table, the
SQL code below matches that in the prior section.

© 2014 Business Systems Consultants, Inc. – All rights reserved 27 of 72
Again, clicking on the red exclamation mark icon will run the query so that you can see your results.
Note that if you add more than one table, you will need to join them by the appropriate field, often ID.
This is discussed in more detail later.
To add a filter to narrow your result, scroll down and find the field in the middle section of your screen.
Note that you can change the size of any of these sections by clicking on the borders between with a
double-arrowed cursor and dragging.
Once you have located your field, type in the filter criteria that you would like for your report. Use
standard operators such as =, <, > and BETWEEN. Text values should be entered in single quotes. An
example is below:

© 2014 Business Systems Consultants, Inc. – All rights reserved 28 of 72
Saving your work
To save a report definition, right click on the tab at the top of the window and select Save Selected
Items.
Note: You will need to include a field on which you wish to filter, even if you do not plan to display it in
your report. If you wish to include multiple criteria (such as member type of M or MT) you can use the
OR columns to the right of Filter to add additional criteria.
© 2014 Business Systems Consultants, Inc. – All rights reserved 29 of 72
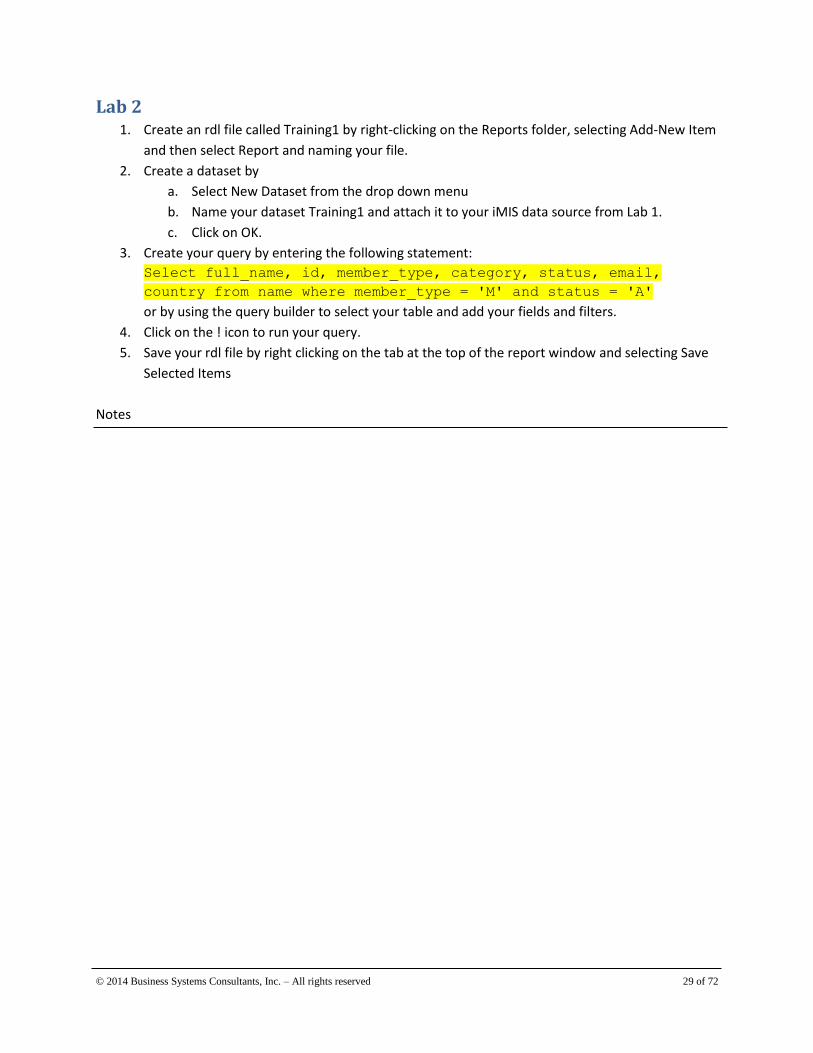
Lab 2 1. Create an rdl file called Training1 by right-clicking on the Reports folder, selecting Add-New Item
and then select Report and naming your file.
2. Create a dataset by
a. Select New Dataset from the drop down menu
b. Name your dataset Training1 and attach it to your iMIS data source from Lab 1.
c. Click on OK.
3. Create your query by entering the following statement:
Select full_name, id, member_type, category, status, email,
country from name where member_type = 'M' and status = 'A'
or by using the query builder to select your table and add your fields and filters.
4. Click on the ! icon to run your query.
5. Save your rdl file by right clicking on the tab at the top of the report window and selecting Save
Selected Items
Notes

© 2014 Business Systems Consultants, Inc. – All rights reserved 30 of 72
Report Layout
Section Goal The goal of this section is to give you the knowledge and skills necessary to add fields to your
report and change the layout.
After completing this section, you will be able to do the following:
1. Understand the types of layout with which you can work.
2. Add fields to your report.
3. Change field properties.
Layouts There are three main data layouts you can use when building a report. These are:
Table: Displays data in a grid that has a fixed number of columns and a variable number of rows.
This will give you a report similar in appearance to an Excel spreadsheet.
Matrix: Displays aggregated data in a grid that has a variable number of columns and a variable
number of rows. This is similar to a cross tab report.
For both table and matrix reports, you can move the mouse cursor between the fields to see a
double-headed arrow that allows you to change the size of the fields.
List: Displays a set of report items that is repeated for each group or row of data.
This is what you would use to write letters.

© 2014 Business Systems Consultants, Inc. – All rights reserved 31 of 72
You can also add subreports, charts, textboxes, and design elements such as rectangles and
lines.
Adding Fields The first step in adding fields to your report layout is to choose one of the layouts and add it to
the report by dragging it from the Toolbox on the left into the Layout window in the middle of
the screen. The outline to which you can add fields then appears, as pictured in each section
above.
Once you have the placeholder for your fields, click on the Datasets tab at the bottom left of the
screen. Any dataset(s) associated with the reports will be there.
Click on the plus sign to expand one and see the available fields.
© 2014 Business Systems Consultants, Inc. – All rights reserved 32 of 72
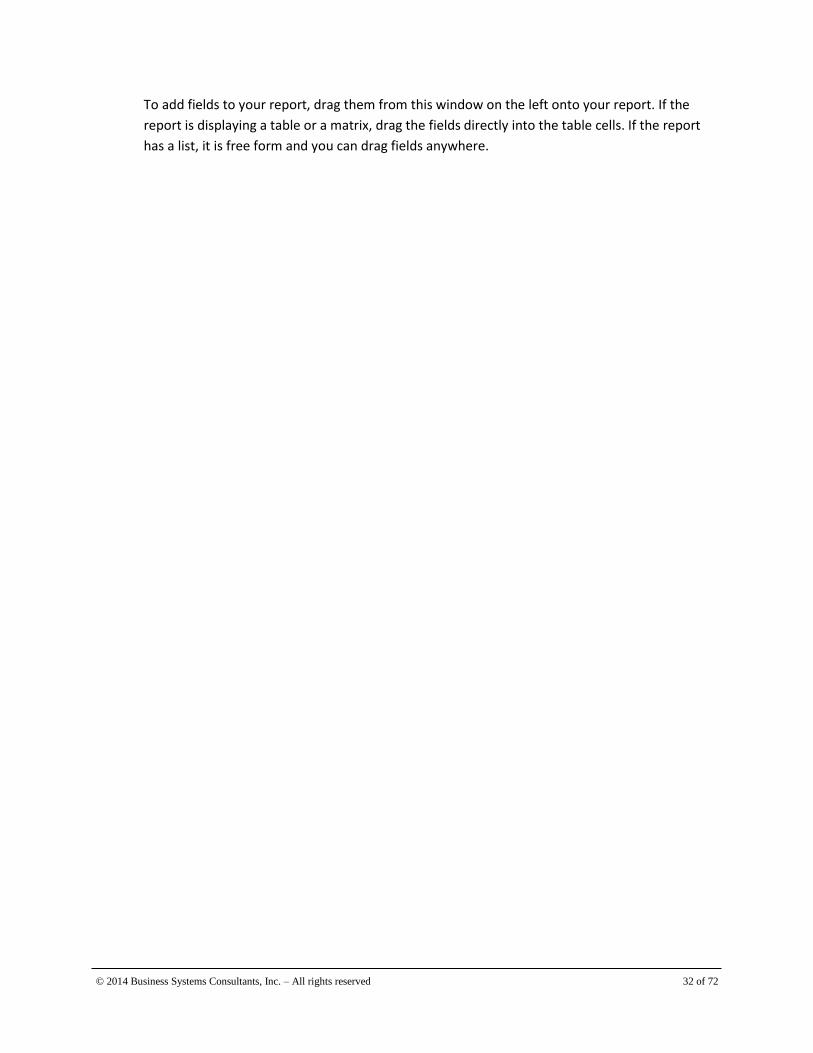
To add fields to your report, drag them from this window on the left onto your report. If the
report is displaying a table or a matrix, drag the fields directly into the table cells. If the report
has a list, it is free form and you can drag fields anywhere.
© 2014 Business Systems Consultants, Inc. – All rights reserved 33 of 72
Lab 3 1. Click on Toolbox and drag a Table onto your Layout tab.
2. Click on Datasets, expand Training1 and drag the following fields into the details field in the
following columns:
a. ID into the first column.
b. Full_Name into the second column.
c. Email into the third column.
3. Resize the ID column to make it smaller and drag the email column to make it larger.
4. Save your report.
5. Click on Preview to see your report.
Notes

© 2014 Business Systems Consultants, Inc. – All rights reserved 34 of 72
Layout
Preview
Field Properties You can very quickly make simple changes to the field formatting and other properties. To do so, first
click on the Layout tab to be sure you are in design mode. When you highlight a field, you will see that
the Properties box in the bottom right corner changes to display the properties of that field.

© 2014 Business Systems Consultants, Inc. – All rights reserved 35 of 72
There are many properties you can change here, in the major expandable categories listed below, many
of which have subcategories as well.
Appearance – how does it look?
o Colors
o Fonts
o Alignment
o Borders
o Shading
You can also do much of this using the Formatting toolbar at the top of the window:
Data – what data displays?
o Value
o Sorting
Design – what is it called?
o Name
International – general display settings, regional
o Calendar
o Direction
o Language
o Writing
Layout – how does the field act?
o CanGrow
o CanShrink
o HideDuplicates
Misc – labels and actions

© 2014 Business Systems Consultants, Inc. – All rights reserved 36 of 72
o Action
o Bookmark
o Label
o Tooltip
© 2014 Business Systems Consultants, Inc. – All rights reserved 37 of 72
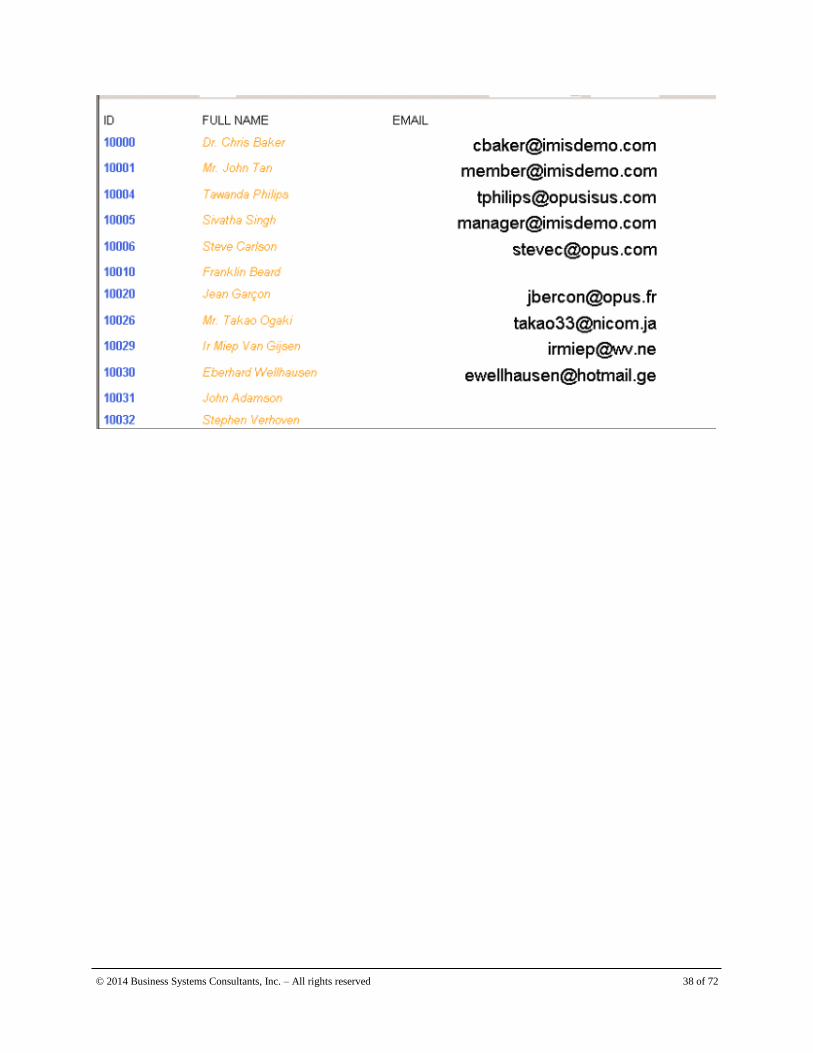
Lab 4 1. Play with the formats of your fields, by doing the following
a. Make the ID bold, blue and 14 point.
b. Make the Full_Name italicized and orange
c. Right justify the email field
2. Click on Preview to view your report.
3. Save your report.
Notes
© 2014 Business Systems Consultants, Inc. – All rights reserved 38 of 72

© 2014 Business Systems Consultants, Inc. – All rights reserved 39 of 72
Finishing Touches
Section Goal The goal of this section is to give you the knowledge and skills necessary to add finishing touches to
create a presentation level report.
After completing this section, you will be able to do the following:
1. Add a title.
2. Add page numbers.
3. Add a date run.
Moving Report Components In order to add design components to your report, you may need to move other components around. To
move a table, matrix, list or any other design element of your report, first make sure you are on the
Layout tab and then click on element you wish to move. This will make it active.
Once an element is active, you will see the standard Microsoft hashed lines around it, with square
handles on each corner and in the middle of each side.
As you move your mouse over the lines, you will see it change to a four-headed arrow.
Click on any line with this arrow cursor and drag the item to move it around in any direction. Move the
mouse over one of the squares in the corners or midpoints, and it will change to a double-headed arrow.
Any of these will allow you to resize the element making it bigger or smaller. The direction of the arrows
indicates which way the element will increase or decrease in size. The corners will resize in two
directions at once, the midpoints in only one.
Adding a Text Box To add a report title or other text to the report, again make sure you are on the Layout tab, and then
click on the Toolbox tab at the bottom left of the screen.
Click on the Textbox icon, and drag it onto your report, in the position at which you would like the item
to appear. As it is dropped on, it will be highlighted by default, so you can move and resize it.

© 2014 Business Systems Consultants, Inc. – All rights reserved 40 of 72
Click inside the text box to get the text cursor, and type what you would like to display. While the text
box is highlighted, the properties window will be general properties for the text box, so you can set
border color, background color, fonts and so on. You can also do much of this using the Formatting
toolbar at the top of the window:
Adding a Header or Footer To add a header or footer to your report, use the menus at the top of the window.
Click on Report and then choose Header or Footer or both. Whichever are included in the report will
appear highlighted.
Once you have a header or footer in place, you can add toolbox items to it by dragging and dropping
into it from the toolbox on the right of the screen.
Adding Report Parameters There are certain components of your report that can be added into your report and included in a
preview or print. To add any of these, first make sure you are in Layout view. Then click on Toolbox on
the bottom left of the screen and drag a text box into the area of the report to which you would like to
add a parameter.
© 2014 Business Systems Consultants, Inc. – All rights reserved 41 of 72
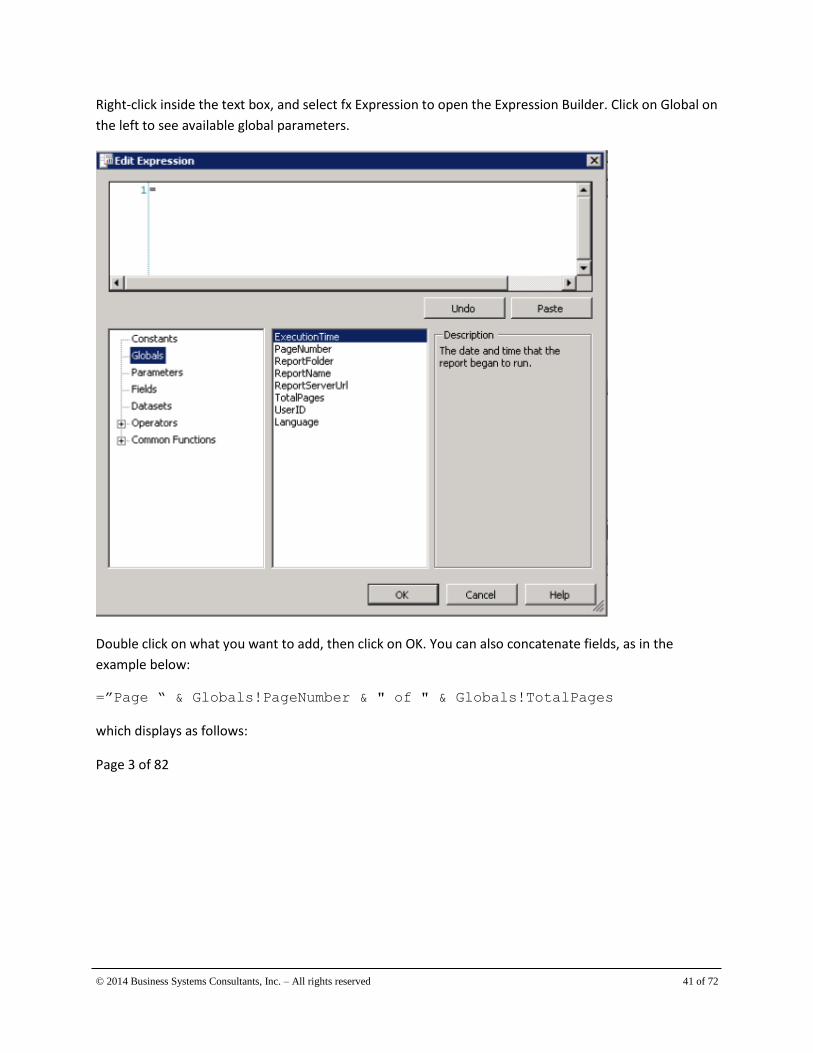
Right-click inside the text box, and select fx Expression to open the Expression Builder. Click on Global on
the left to see available global parameters.
Double click on what you want to add, then click on OK. You can also concatenate fields, as in the
example below:
=”Page “ & Globals!PageNumber & " of " & Globals!TotalPages
which displays as follows:
Page 3 of 82
© 2014 Business Systems Consultants, Inc. – All rights reserved 42 of 72
Lab 5 1. Add a title to your report. Center it on the page and make it bold and 16 point.
2. Add a footer to your report.
3. Enter the page number and number of pages to the report footer, as in the example above.
4. Add the date the report was run to the top of the report, near the title.
Notes

© 2014 Business Systems Consultants, Inc. – All rights reserved 43 of 72
Integrating Reports with iMIS
Section Goal The goal of this section is to give you the knowledge and skills necessary to create a new Report Project
in SSRS.
After completing this section, you will be able to do the following:
1. Use IQA as the basis for a report
2. Importing an SSRS report into iMIS
3. Making SSRS reports accessible within iMIS
SSRS within iMIS iMIS natively supports SQL Server Reporting Services (SSRS) for both static and dynamic reporting
capability with SQL Server databases. You can run Reporting Services reports from inside iMIS two ways:
run reports from the Document System, or generate an SSRS report on the fly using the new Report
command in the IQA Editor.
To create an SSRS report from an existing query, follow these steps:
1. In the Document System, browse to your query and choose Edit.
2. Click Report to generate a report that is dynamically formatted based off of settings in
system.config.
3. You have the option to save to report definition to iMIS or your workstation. If you are going to
be modifying the report in SSRS, save to your workstation. Save Report Definition to iMIS is the
option to use if you want to use the report in an SSRS iPart.
© 2014 Business Systems Consultants, Inc. – All rights reserved 44 of 72
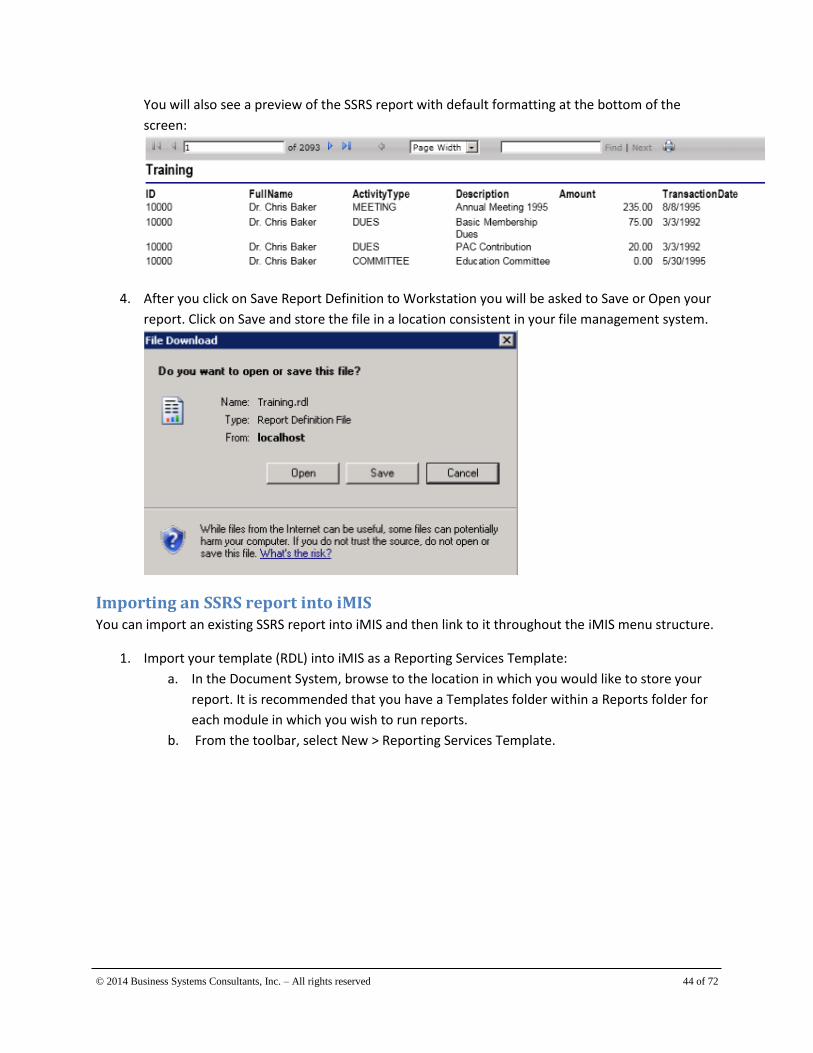
You will also see a preview of the SSRS report with default formatting at the bottom of the
screen:
4. After you click on Save Report Definition to Workstation you will be asked to Save or Open your
report. Click on Save and store the file in a location consistent in your file management system.
Importing an SSRS report into iMIS You can import an existing SSRS report into iMIS and then link to it throughout the iMIS menu structure.
1. Import your template (RDL) into iMIS as a Reporting Services Template:
a. In the Document System, browse to the location in which you would like to store your
report. It is recommended that you have a Templates folder within a Reports folder for
each module in which you wish to run reports.
b. From the toolbar, select New > Reporting Services Template.

© 2014 Business Systems Consultants, Inc. – All rights reserved 45 of 72
c. Browse to the source RDL file on your file system and click on Open.
d. Enter a description that will be meaningful for users of your report

© 2014 Business Systems Consultants, Inc. – All rights reserved 46 of 72
2. Create a report that will bind a query to this template as a Reporting Services Report:
a. In the Document System, browse to the location in which you wish to store the report. It
is recommended that you have a Reports folder in each module you wish to run reports
in.
b. From the toolbar, select New > Reporting Services Report. This object is a process
engine.
c. On the Summary tab, give the report a meaningful name and description.
d. On the Sources tab, specify which Reporting Services Template and IQA query to use.
e. On the Parameters tab, choose whether to show the report’s parameters at run-time
and whether to preset their values (such as to make a report display members only).
Adding Reports to your Navigation
With iMIS version 15.1.3 and higher, you are able to modify the navigation and menu items within iMIS
desktop and web view. You can use this ability to add SSRS reports into your iMIS navigation using the
Report Manager.
© 2014 Business Systems Consultants, Inc. – All rights reserved 47 of 72
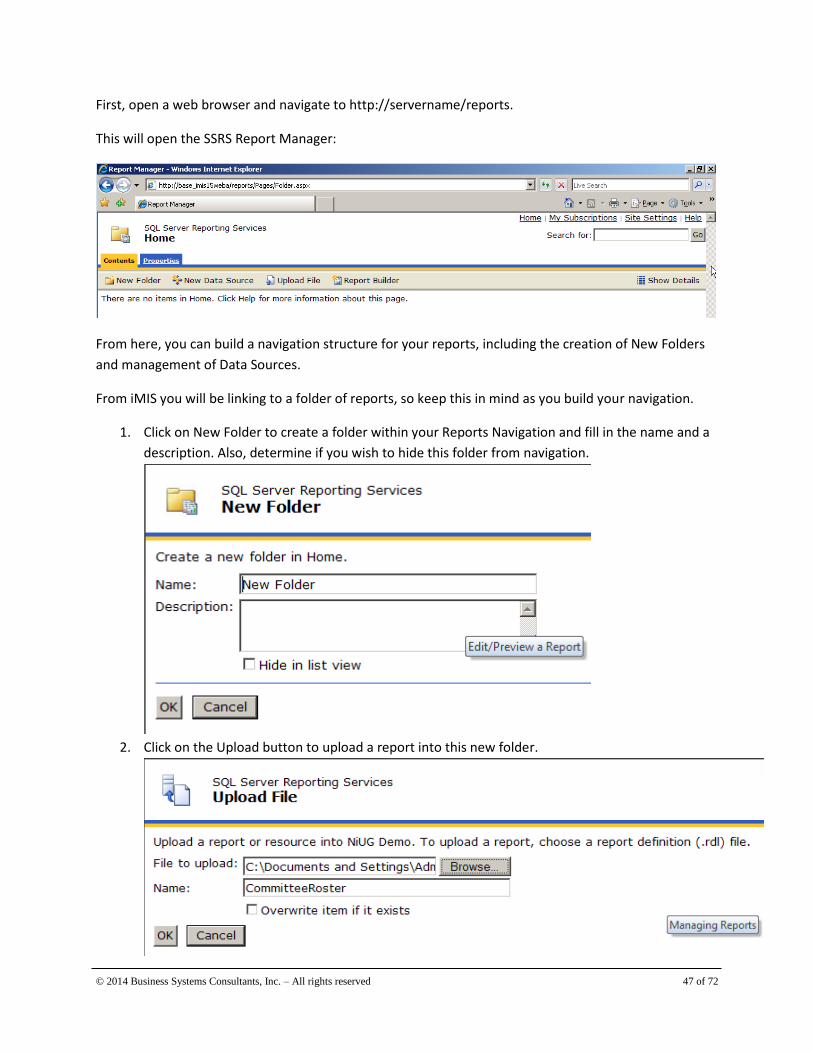
First, open a web browser and navigate to http://servername/reports.
This will open the SSRS Report Manager:
From here, you can build a navigation structure for your reports, including the creation of New Folders
and management of Data Sources.
From iMIS you will be linking to a folder of reports, so keep this in mind as you build your navigation.
1. Click on New Folder to create a folder within your Reports Navigation and fill in the name and a
description. Also, determine if you wish to hide this folder from navigation.
2. Click on the Upload button to upload a report into this new folder.
© 2014 Business Systems Consultants, Inc. – All rights reserved 48 of 72
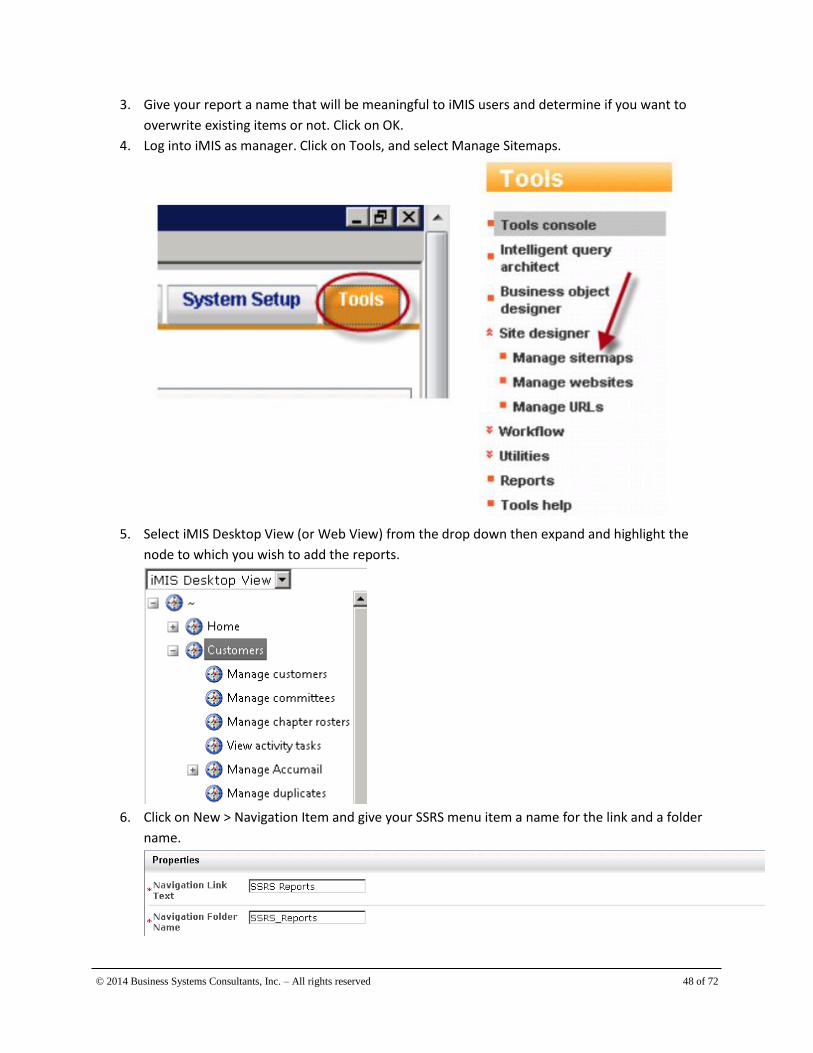
3. Give your report a name that will be meaningful to iMIS users and determine if you want to
overwrite existing items or not. Click on OK.
4. Log into iMIS as manager. Click on Tools, and select Manage Sitemaps.
5. Select iMIS Desktop View (or Web View) from the drop down then expand and highlight the
node to which you wish to add the reports.
6. Click on New > Navigation Item and give your SSRS menu item a name for the link and a folder
name.
© 2014 Business Systems Consultants, Inc. – All rights reserved 49 of 72
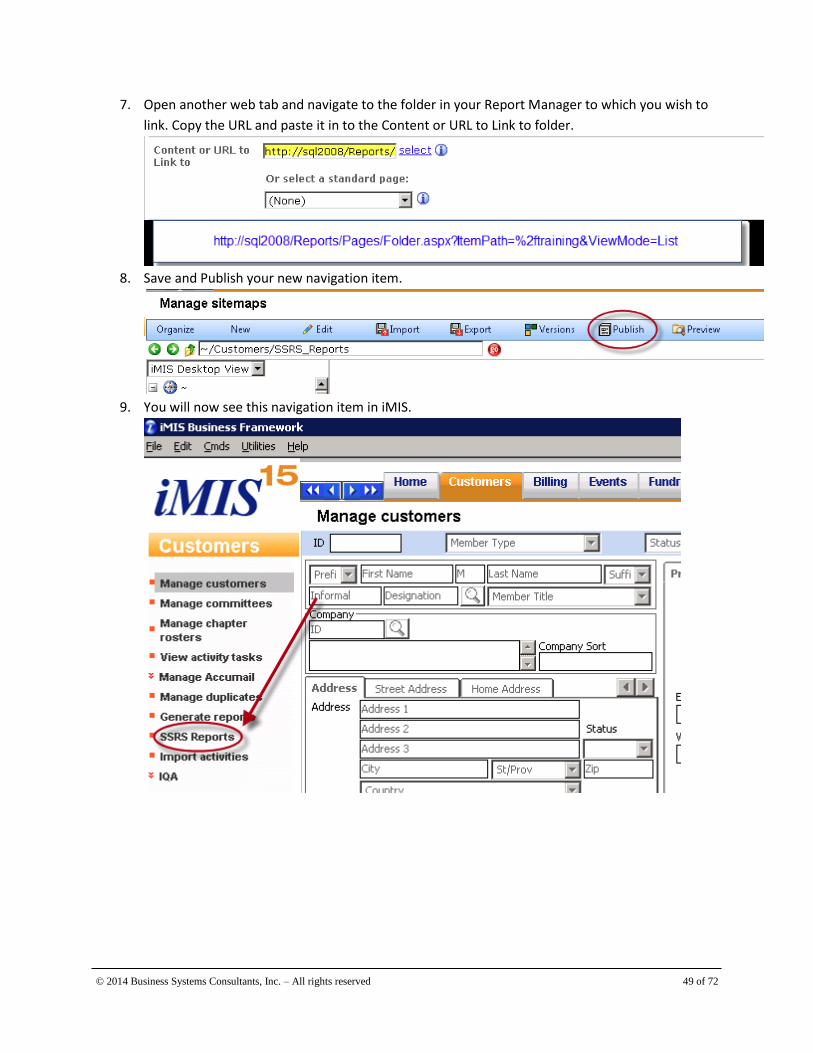
7. Open another web tab and navigate to the folder in your Report Manager to which you wish to
link. Copy the URL and paste it in to the Content or URL to Link to folder.
8. Save and Publish your new navigation item.
9. You will now see this navigation item in iMIS.

© 2014 Business Systems Consultants, Inc. – All rights reserved 50 of 72
Using SSRS to format your report You can format your report in SSRS as shown before. We will create a pie chart in our next lab to
illustrate some of the other options available in SSRS.
Lab 6 – Create a Pie Chart report using IQA and SSRS 1. If needed, install the Businss Intelligence Development Studio (BIDS) feature (included with
SQL Server)
2. Open your report writer and create a new solution (See Appendix A for more details)
a. Open BIDS: go to All Programs Microsoft SQL Server (Your Version) > SQL Server
Business Intelligence Development Studio
b. Select File > New > Project
c. Select Report Server Project
d. (Project name) Name: SSRS Training Project
e. (Default location) Location: C:\...\Visual Studio 2008\Projects
f. Solution Name: SSRS Training Solution
g. Click OK
3. Add Shared Data Source called IMIS
a. Right-click the Shared Data Sources folder inside the SSRS Training Project within
the Solution Explorer and select Add New Data Source
© 2014 Business Systems Consultants, Inc. – All rights reserved 51 of 72
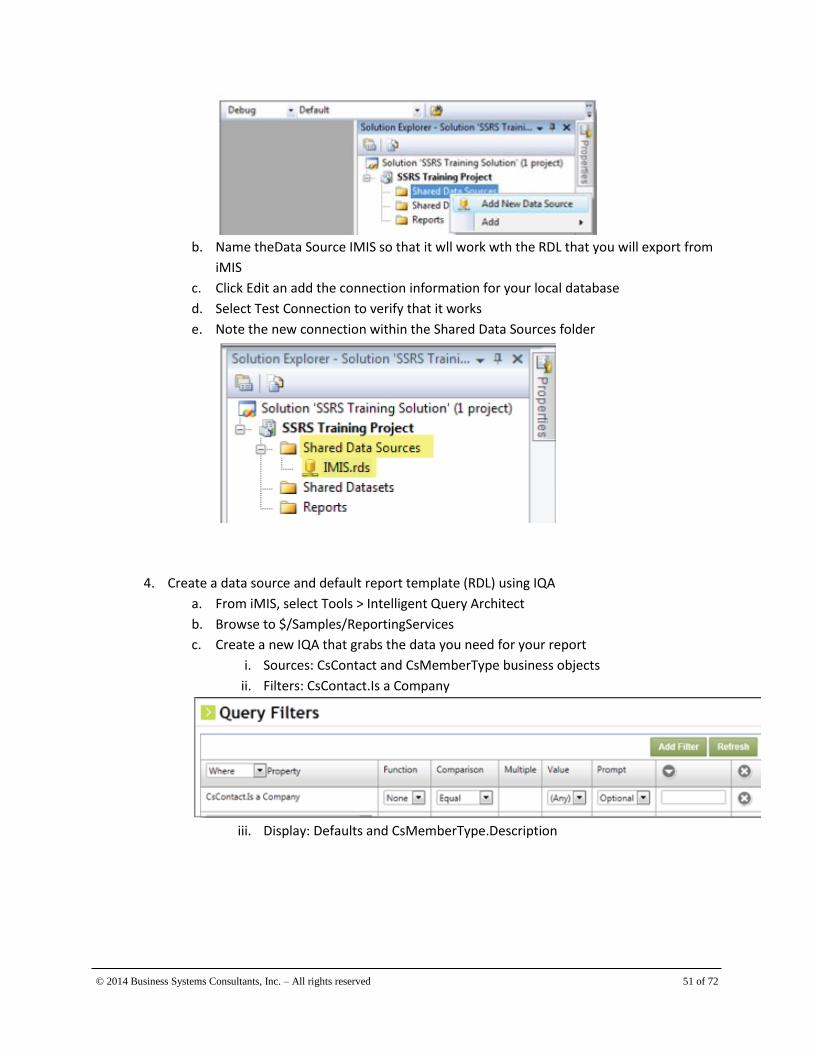
b. Name theData Source IMIS so that it wll work wth the RDL that you will export from
iMIS
c. Click Edit an add the connection information for your local database
d. Select Test Connection to verify that it works
e. Note the new connection within the Shared Data Sources folder
4. Create a data source and default report template (RDL) using IQA
a. From iMIS, select Tools > Intelligent Query Architect
b. Browse to $/Samples/ReportingServices
c. Create a new IQA that grabs the data you need for your report
i. Sources: CsContact and CsMemberType business objects
ii. Filters: CsContact.Is a Company
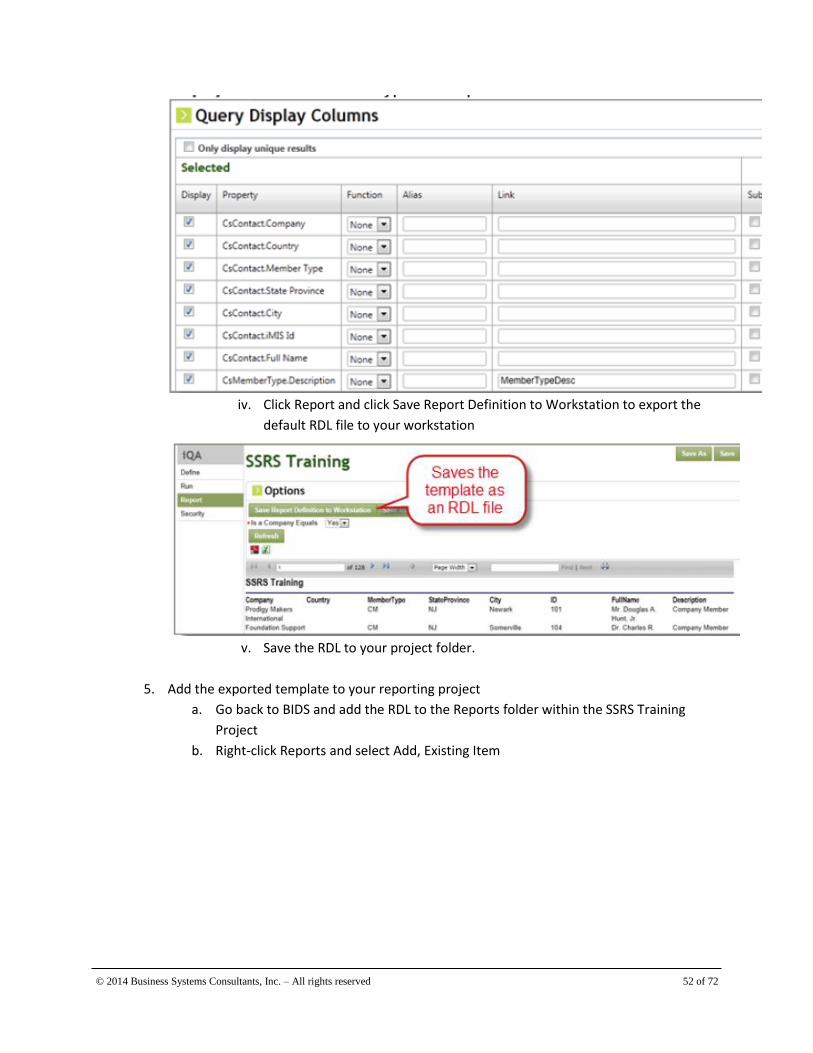
iii. Display: Defaults and CsMemberType.Description
© 2014 Business Systems Consultants, Inc. – All rights reserved 52 of 72
iv. Click Report and click Save Report Definition to Workstation to export the
default RDL file to your workstation
v. Save the RDL to your project folder.
5. Add the exported template to your reporting project
a. Go back to BIDS and add the RDL to the Reports folder within the SSRS Training
Project
b. Right-click Reports and select Add, Existing Item

© 2014 Business Systems Consultants, Inc. – All rights reserved 53 of 72
c. Find the RDL you exported from IQA (note that the name defaults to the name of
the query).
d. Double-click on the name of the report to open it for editing. You’ll see the default
template that IQA uses for all IQA report definitions which includes a header, a table
to display the results set, and a footer.
6. Change the report template into a pie chart that shows the percentage of embers within a
given member type
a. Right-click on the footer and select Remove Page Footer
b. Select the table, click the top left corner, and press the Delete button on your
keyboard.
c. Drag the bottom of the report to give yourself more room to add the chart.
d. From the toolbox, drag and drop the Chart report item onto the body of the report
e. The Select Chart Type window opens

© 2014 Business Systems Consultants, Inc. – All rights reserved 54 of 72
f. Select the exploded pie chart and click OK and expand the pie chart to fill in the area
as needed.
g. Right-click on the chart itself to show its properties, which open the Chart Data pane
to the right of the chart
i. In the Value section, select ID
ii. Change the Aggregate type from Sum to Count

© 2014 Business Systems Consultants, Inc. – All rights reserved 55 of 72
iii. In he Category Groups section, select Description (which is the Member
Type Description).
iv. Change the title of the report by clicking the area that says Chart Title and
typing.
v. Add labels that show the counte-per-member type by right-clicking on the
chart and selecting Show Data Labels
vi. Click Preview to see the new report (there is a default parameter for the
report title – click the View Report button on the top right to preiew the
report).
h. Change the chart to show percentages instead of counts
i. Right-click on any of the labels in Design mode
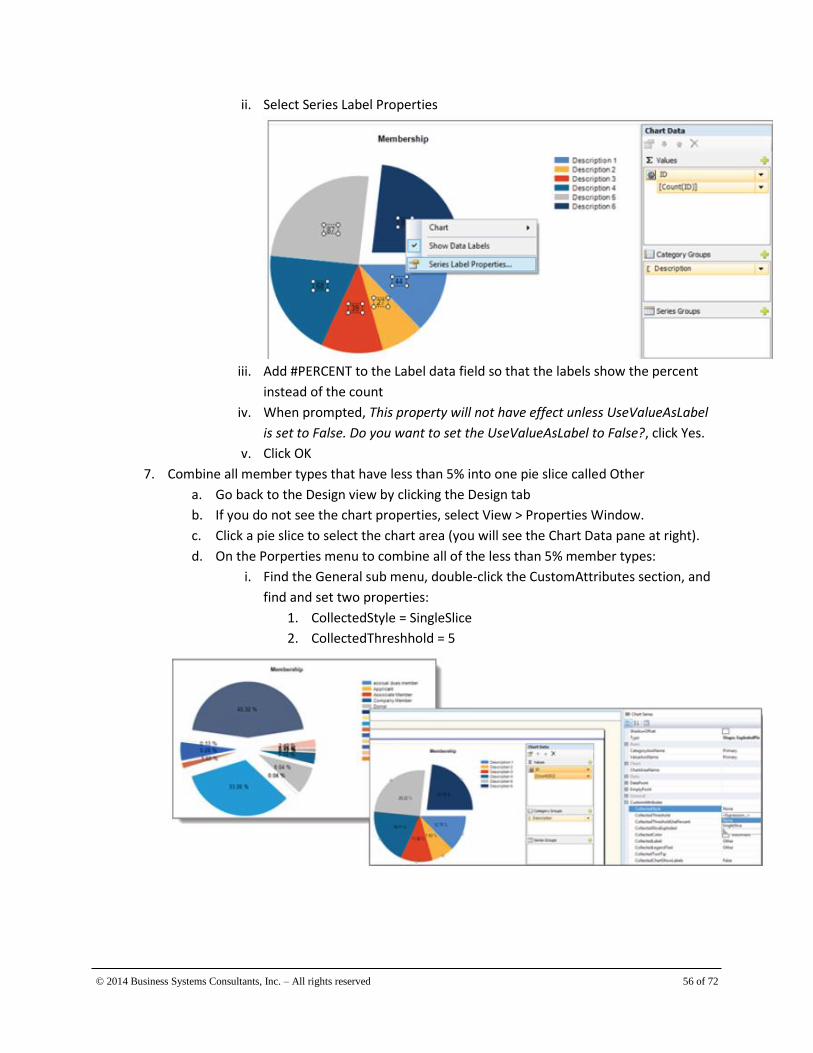
© 2014 Business Systems Consultants, Inc. – All rights reserved 56 of 72
ii. Select Series Label Properties
iii. Add #PERCENT to the Label data field so that the labels show the percent
instead of the count
iv. When prompted, This property will not have effect unless UseValueAsLabel
is set to False. Do you want to set the UseValueAsLabel to False?, click Yes.
v. Click OK
7. Combine all member types that have less than 5% into one pie slice called Other
a. Go back to the Design view by clicking the Design tab
b. If you do not see the chart properties, select View > Properties Window.
c. Click a pie slice to select the chart area (you will see the Chart Data pane at right).
d. On the Porperties menu to combine all of the less than 5% member types:
i. Find the General sub menu, double-click the CustomAttributes section, and
find and set two properties:
1. CollectedStyle = SingleSlice
2. CollectedThreshhold = 5

© 2014 Business Systems Consultants, Inc. – All rights reserved 57 of 72
8. Preview, adjust as needed, and Save
9. Add your template to your report in iMIS
a. In iMIS, open the Document System: select Tools > Document System
b. Browse to the location of the original template: $/Samples/ReportingServices
c. Bring your template into iMIS as a new object: select New > Reporting Services
Template
d. Upload your RDL file: Click Select and browse to the file that you turned into a chart
template: C:\...\Visual Studio [Your Version]\Projects\SSRS Training Solution\SSRS
Training Project
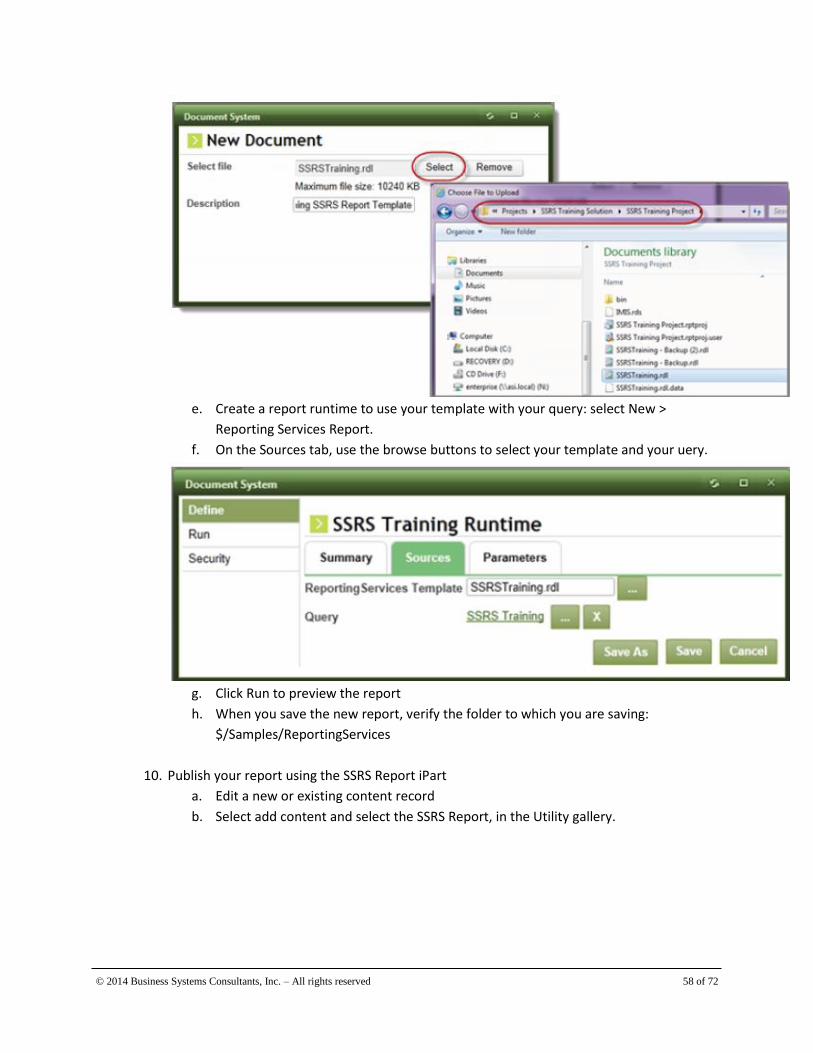
© 2014 Business Systems Consultants, Inc. – All rights reserved 58 of 72
e. Create a report runtime to use your template with your query: select New >
Reporting Services Report.
f. On the Sources tab, use the browse buttons to select your template and your uery.
g. Click Run to preview the report
h. When you save the new report, verify the folder to which you are saving:
$/Samples/ReportingServices
10. Publish your report using the SSRS Report iPart
a. Edit a new or existing content record
b. Select add content and select the SSRS Report, in the Utility gallery.

© 2014 Business Systems Consultants, Inc. – All rights reserved 59 of 72
c. Select Hide the toolbar, since pagination isn’t needed.
d. Save & Publish, and view your report
11.
© 2014 Business Systems Consultants, Inc. – All rights reserved 60 of 72
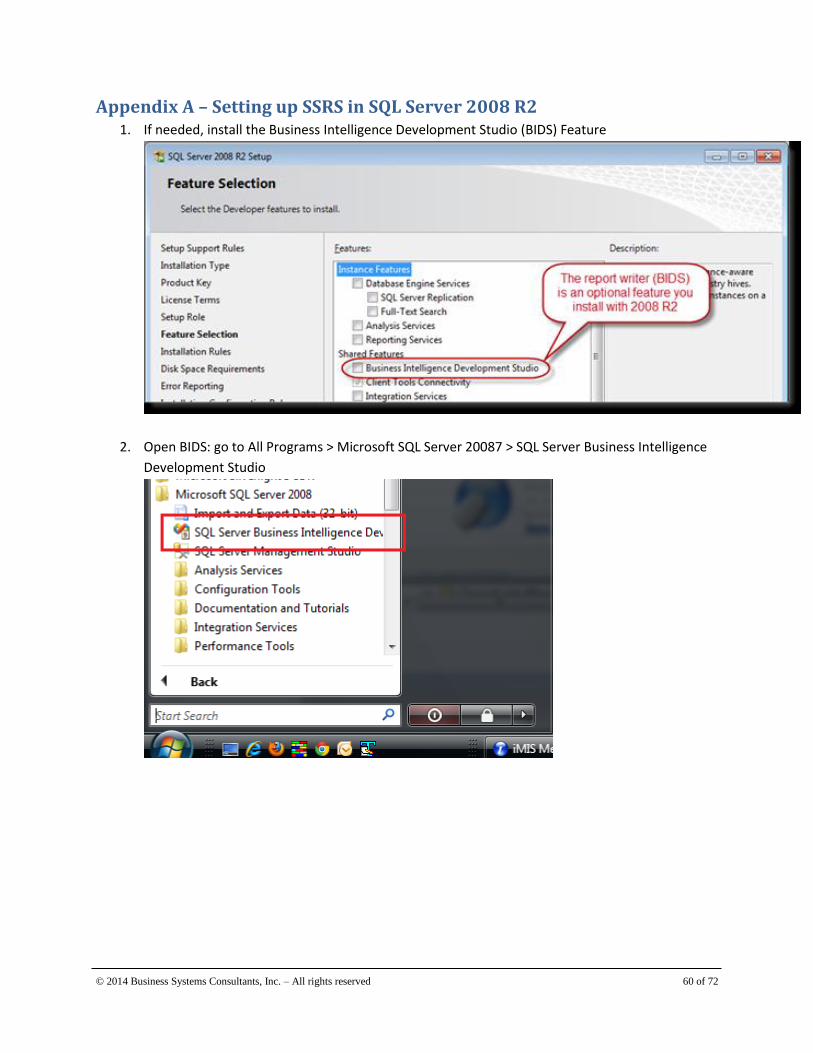
Appendix A – Setting up SSRS in SQL Server 2008 R2 1. If needed, install the Business Intelligence Development Studio (BIDS) Feature
2. Open BIDS: go to All Programs > Microsoft SQL Server 20087 > SQL Server Business Intelligence
Development Studio

© 2014 Business Systems Consultants, Inc. – All rights reserved 61 of 72
3. Select File > New > Project
4. Select Report Server Project. Name your project SSRS Training Project. Keep the default location.
Name the solution SSRS Training Solution. Click OK
5. In the right window in the Solution Explorer pane, right click on Shared Data Sources and select
Add New Data Source

© 2014 Business Systems Consultants, Inc. – All rights reserved 62 of 72
6. Name your data source IMIS
7. Click the Edit button next to the Connection string; window
8. Enter the server name and connection information (you may need to get this information from
your system administrator) and test the connection. Click OK if test is successful

© 2014 Business Systems Consultants, Inc. – All rights reserved 63 of 72
9. Click OK on the Shared Data Source Properties window
10. You should now see IMIS.rds under Shared Data Sources in the Solution Explorer window on the
right
11. You are now ready to use SSRS with iMIS.
12. Repeat these steps for all new projects.
© 2014 Business Systems Consultants, Inc. – All rights reserved 64 of 72
Appendix B – Setting SQL/SSRS for automatic email subscriptions
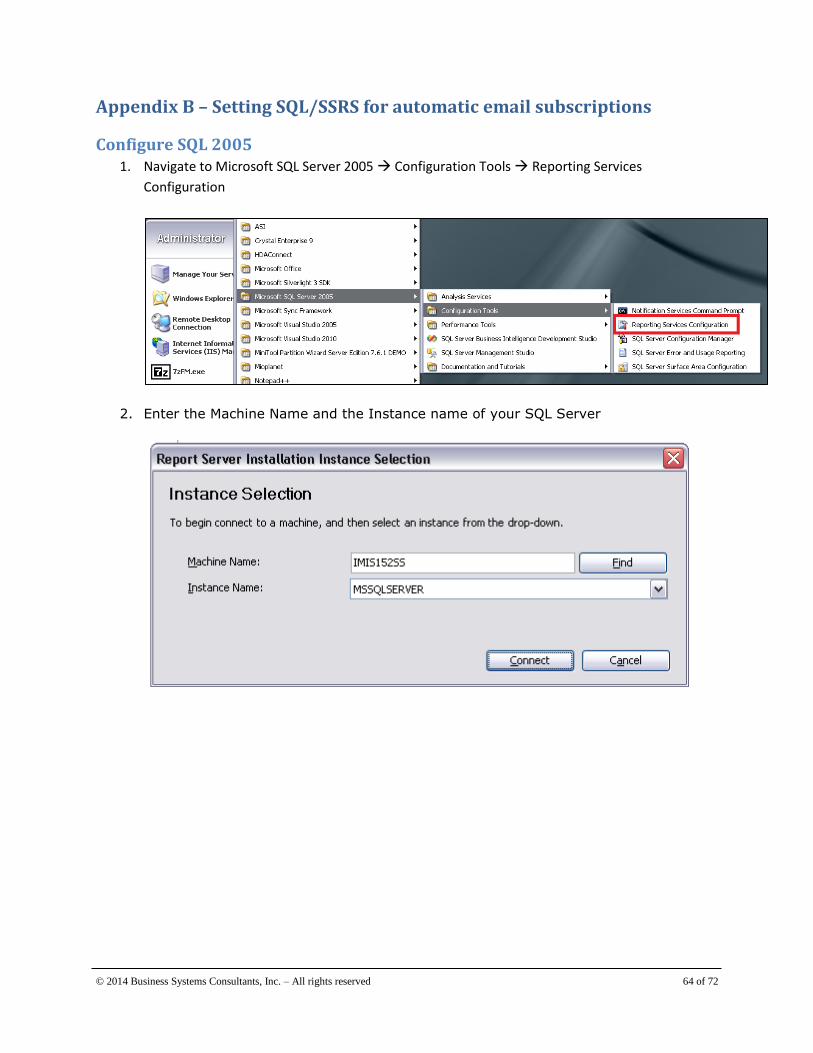
Configure SQL 2005 1. Navigate to Microsoft SQL Server 2005 Configuration Tools Reporting Services
Configuration
2. Enter the Machine Name and the Instance name of your SQL Server

© 2014 Business Systems Consultants, Inc. – All rights reserved 65 of 72
The first thing you’ll see is list if items that can be configured in the left pane, and in
the right pane will be the server status, its configuration, and a legend to show what
each of the icons means.
3. Click on Email Settings
4. Enter the address that you want to be the sender of emails through Reporting
services.
5. You’ll note the Current Delivery Method: is set to User SMTP server and is grayed
out. This is the only way email can be sent from SSRS.
© 2014 Business Systems Consultants, Inc. – All rights reserved 66 of 72
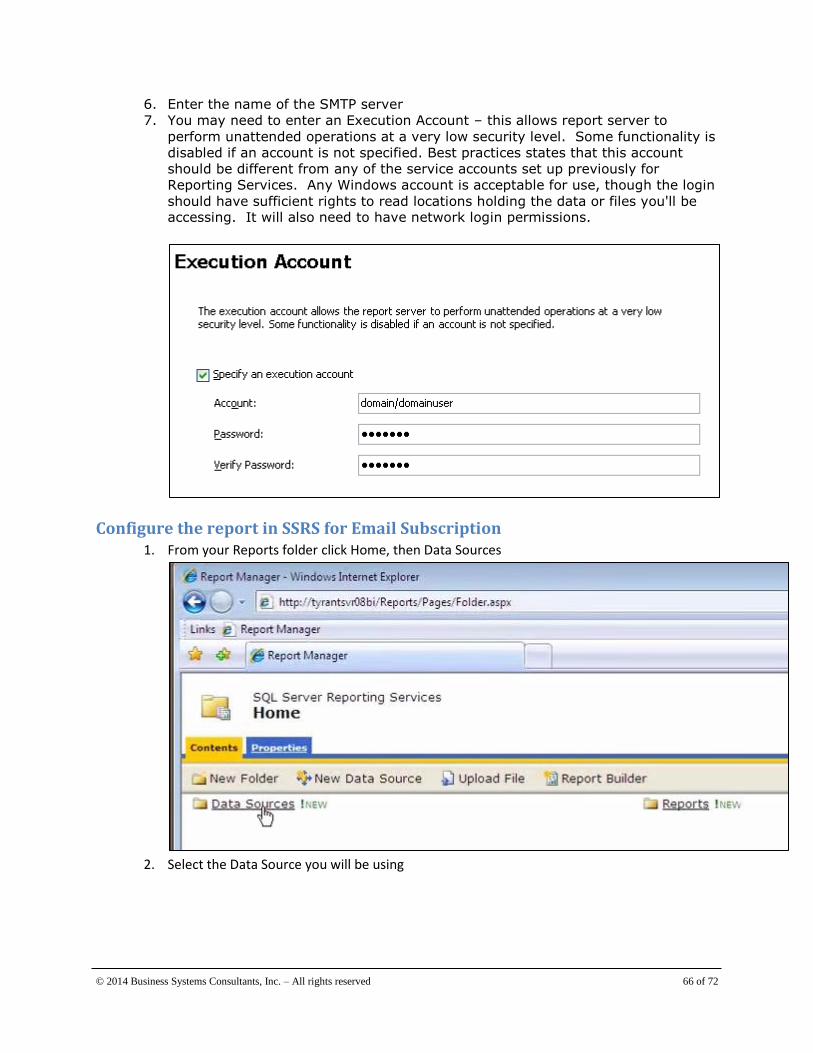
6. Enter the name of the SMTP server
7. You may need to enter an Execution Account – this allows report server to
perform unattended operations at a very low security level. Some functionality is
disabled if an account is not specified. Best practices states that this account
should be different from any of the service accounts set up previously for
Reporting Services. Any Windows account is acceptable for use, though the login
should have sufficient rights to read locations holding the data or files you'll be accessing. It will also need to have network login permissions.
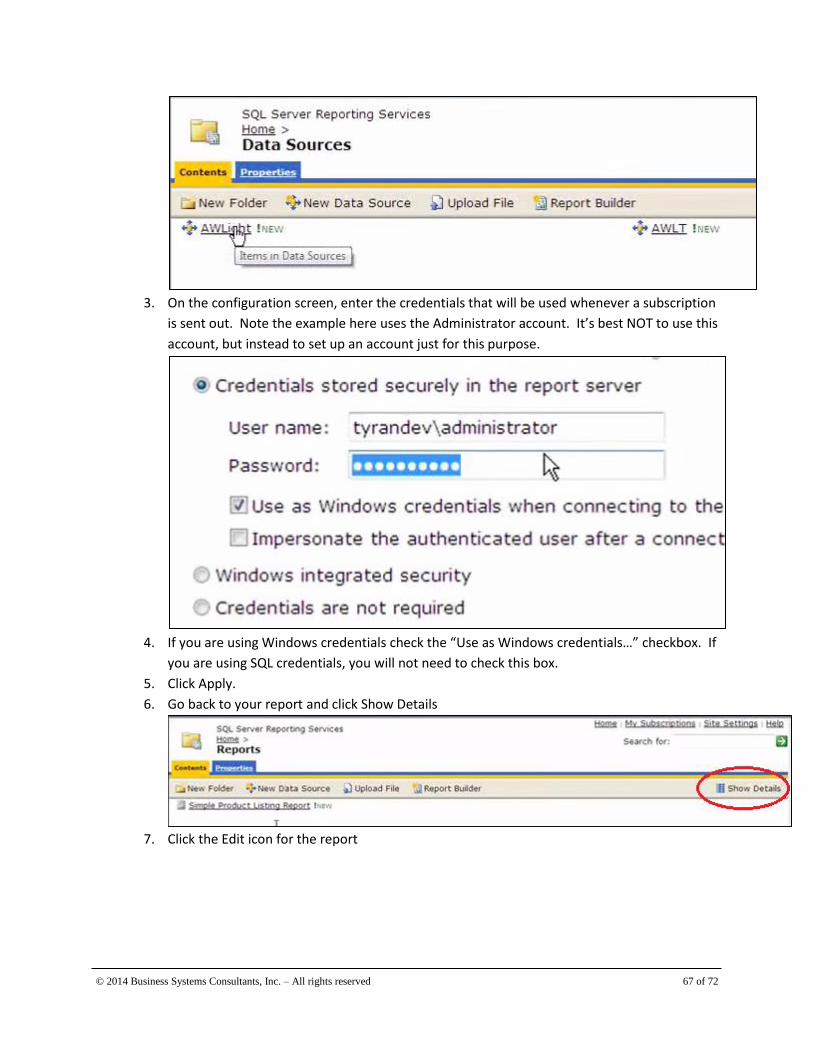
Configure the report in SSRS for Email Subscription 1. From your Reports folder click Home, then Data Sources
2. Select the Data Source you will be using
© 2014 Business Systems Consultants, Inc. – All rights reserved 67 of 72
3. On the configuration screen, enter the credentials that will be used whenever a subscription
is sent out. Note the example here uses the Administrator account. It’s best NOT to use this
account, but instead to set up an account just for this purpose.
4. If you are using Windows credentials check the “Use as Windows credentials…” checkbox. If
you are using SQL credentials, you will not need to check this box.
5. Click Apply.
6. Go back to your report and click Show Details
7. Click the Edit icon for the report

© 2014 Business Systems Consultants, Inc. – All rights reserved 68 of 72
8. Click Execution then the Subscriptions Tab
9. Click New Subscription
10. Choose your delivery method (Email)
11. You can also choose Windows File Share, to save the reports in a specified folder to be
accessed by staff.
12. Set up your report delivery options

© 2014 Business Systems Consultants, Inc. – All rights reserved 69 of 72
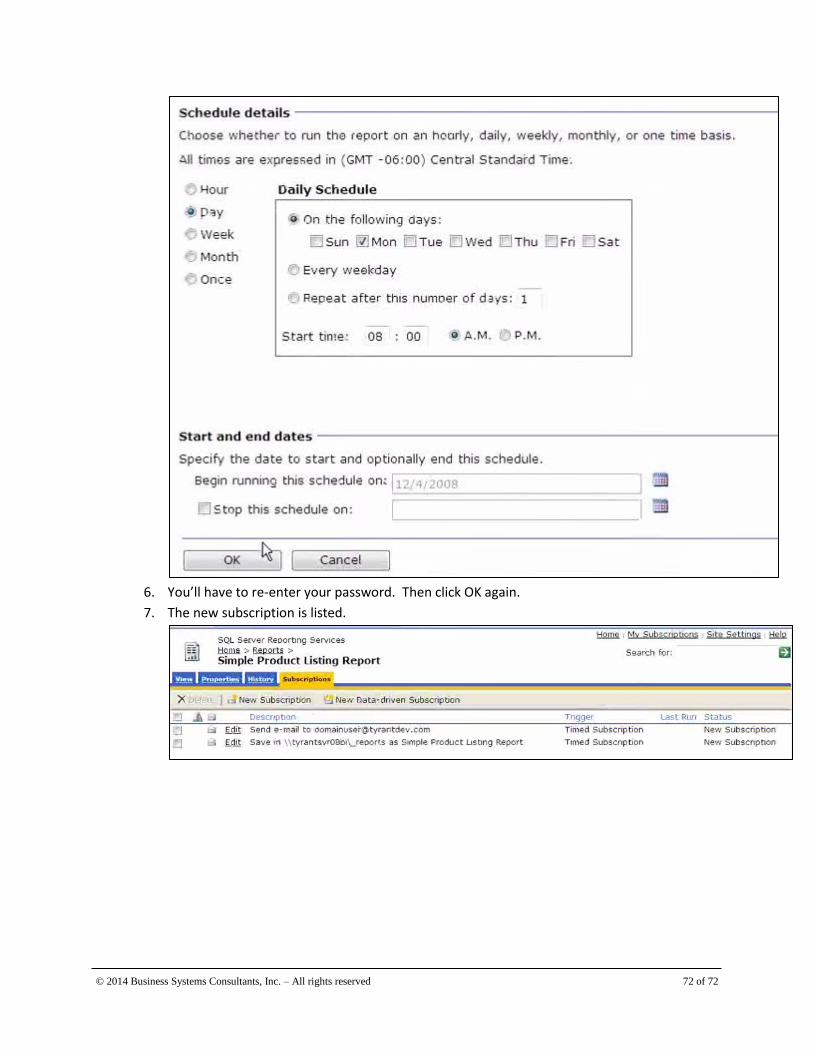
13. Click Select Schedule from Subscription Processing Options
14. Set up your schedule

© 2014 Business Systems Consultants, Inc. – All rights reserved 70 of 72
15. Click OK then click OK again
16. You’ll see your subscription is set.
© 2014 Business Systems Consultants, Inc. – All rights reserved 71 of 72
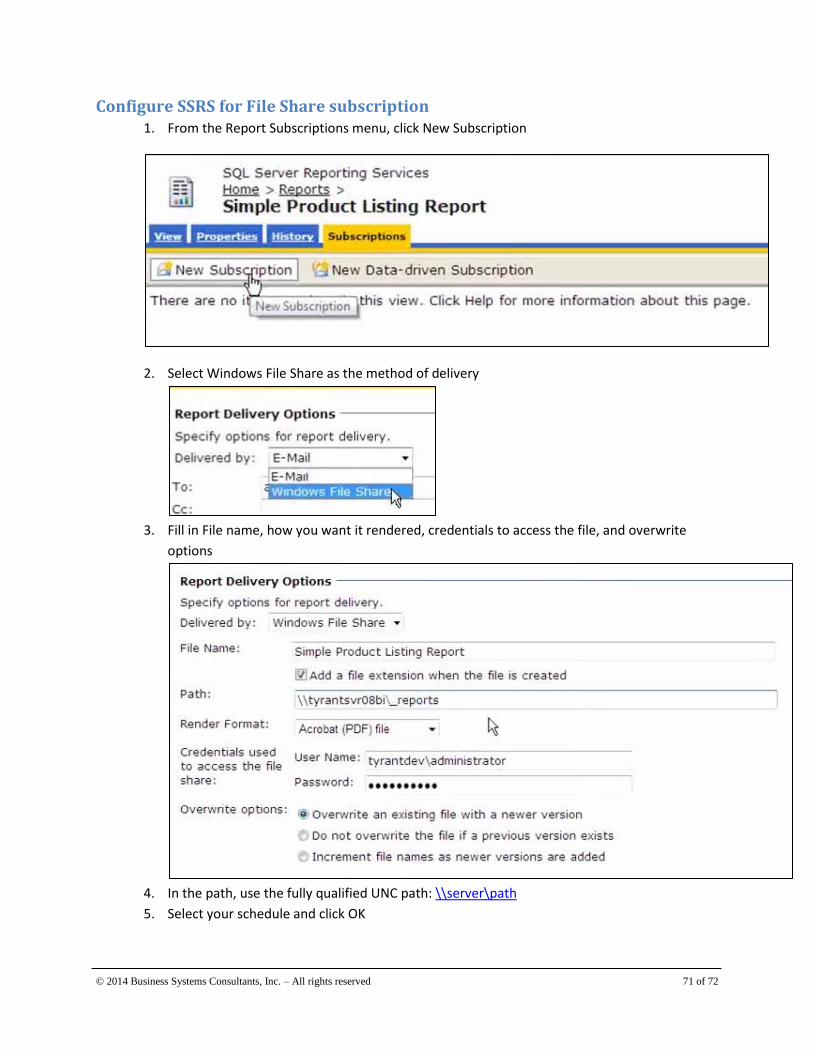
Configure SSRS for File Share subscription 1. From the Report Subscriptions menu, click New Subscription
2. Select Windows File Share as the method of delivery
3. Fill in File name, how you want it rendered, credentials to access the file, and overwrite
options
4. In the path, use the fully qualified UNC path: \\server\path
5. Select your schedule and click OK
© 2014 Business Systems Consultants, Inc. – All rights reserved 72 of 72
6. You’ll have to re-enter your password. Then click OK again.
7. The new subscription is listed.