Embed Size (px)
Citation preview
SSRG International Journal of Civil Engineering (SSRG-IJCE) – volume 2 Issue 5 May 2015
ISSN: 2348 – 8352 www.internationaljournalssrg.org Page 13
Parametric Study on the Distribution of
Longitudinal Load in Railway Track under
Dynamic Wheel Loading using Finite Element
Analysis Zijian Zhang
1, Bassem Andrawes
2, and J. Riley Edwards
3
1(Department of Civil and Environmental Engineering/ University of Illinois at Urbana-Champaign, USA)
2(Department of Civil and Environmental Engineering, University of Illinois at Urbana-Champaign, USA,
Corresponding author) 3(Rail Transportation and Engineering Centre (RailTEC), Department of Civil and Environmental Engineering,
University of Illinois at Urbana-Champaign, USA)
ABSTRACT : The increasing tractive power of
locomotives has led to a significant increase in the
longitudinal loading demand on railway tracks.
The capacity of longitudinal restraint of existing
rail fastening system and its dependency on track
parameters can affect the future design of the rail
fastening system. This paper investigates the effects
of wheel acceleration, elastic modulus of clips, rail
to rail pad coefficient of friction (COF), and
sleeper spacing on the distribution of longitudinal
force in the rail fastening system and on the
maximum rail to rail pad friction force. A finite
element (FE) model with multiple sleepers and
their accompanying fastening systems, along with a
moving wheel, is developed and validated using
field data. The results of our parametric study
indicate that a COF of 0.65 is optional when
maximizing the longitudinal resistance per rail
seat. Additionally, the maximum rail to rail pad
friction force increases exponentially with the
spacing of sleepers, and a sleeper spacing of 0.61
m can lead to a desired distribution of longitudinal
force.
Keywords -concrete sleeper, fastening system,
finite element analysis, longitudinal load,
parametric study
I. INTRODUCTION Outside of the realm of thermal forces and
expansion, longitudinal forces in a railway track
are produced by the tractive effort and dynamic
braking of a train [1]. As railway traffic has
increased over the past few decades in terms of
their tonnages and speed of trains, more powerful
locomotives have been built to meet the demands.
The latest model of diesel-electric locomotive is
capable of producing twice as much tractive force
as its predecessors [2]. As a result, the longitudinal
forces imparted from the tractive effort are
increased significantly. The longitudinal forces
transfer from the rail to the sleepers through the
fastening system. In other words, the fastening
system serves as the connection between the rail
and the sleepers, thus anchors the rail against its
longitudinal movement due to forces in the
longitudinal direction [1]. Therefore, the increase
in the wheel-induced longitudinal forces can
impose a higher loading demand in the fastening
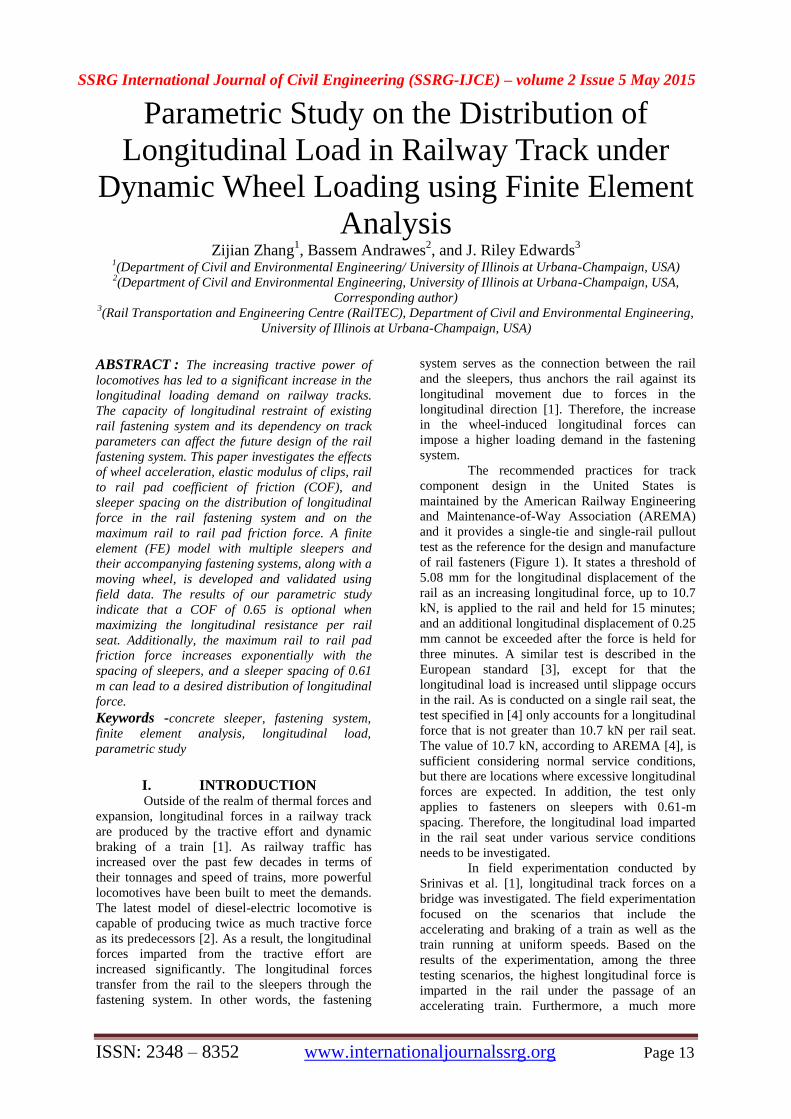
system. The recommended practices for track
component design in the United States is
maintained by the American Railway Engineering
and Maintenance-of-Way Association (AREMA)
and it provides a single-tie and single-rail pullout
test as the reference for the design and manufacture
of rail fasteners (Figure 1). It states a threshold of
5.08 mm for the longitudinal displacement of the
rail as an increasing longitudinal force, up to 10.7
kN, is applied to the rail and held for 15 minutes;
and an additional longitudinal displacement of 0.25
mm cannot be exceeded after the force is held for
three minutes. A similar test is described in the
European standard [3], except for that the
longitudinal load is increased until slippage occurs
in the rail. As is conducted on a single rail seat, the
test specified in [4] only accounts for a longitudinal
force that is not greater than 10.7 kN per rail seat.
The value of 10.7 kN, according to AREMA [4], is
sufficient considering normal service conditions,
but there are locations where excessive longitudinal
forces are expected. In addition, the test only
applies to fasteners on sleepers with 0.61-m
spacing. Therefore, the longitudinal load imparted
in the rail seat under various service conditions
needs to be investigated.
In field experimentation conducted by
Srinivas et al. [1], longitudinal track forces on a
bridge was investigated. The field experimentation
focused on the scenarios that include the
accelerating and braking of a train as well as the
train running at uniform speeds. Based on the
results of the experimentation, among the three
testing scenarios, the highest longitudinal force is
imparted in the rail under the passage of an
accelerating train. Furthermore, a much more
SSRG International Journal of Civil Engineering (SSRG-IJCE) – volume 2 Issue 5 May 2015
ISSN: 2348 – 8352 www.internationaljournalssrg.org Page 14
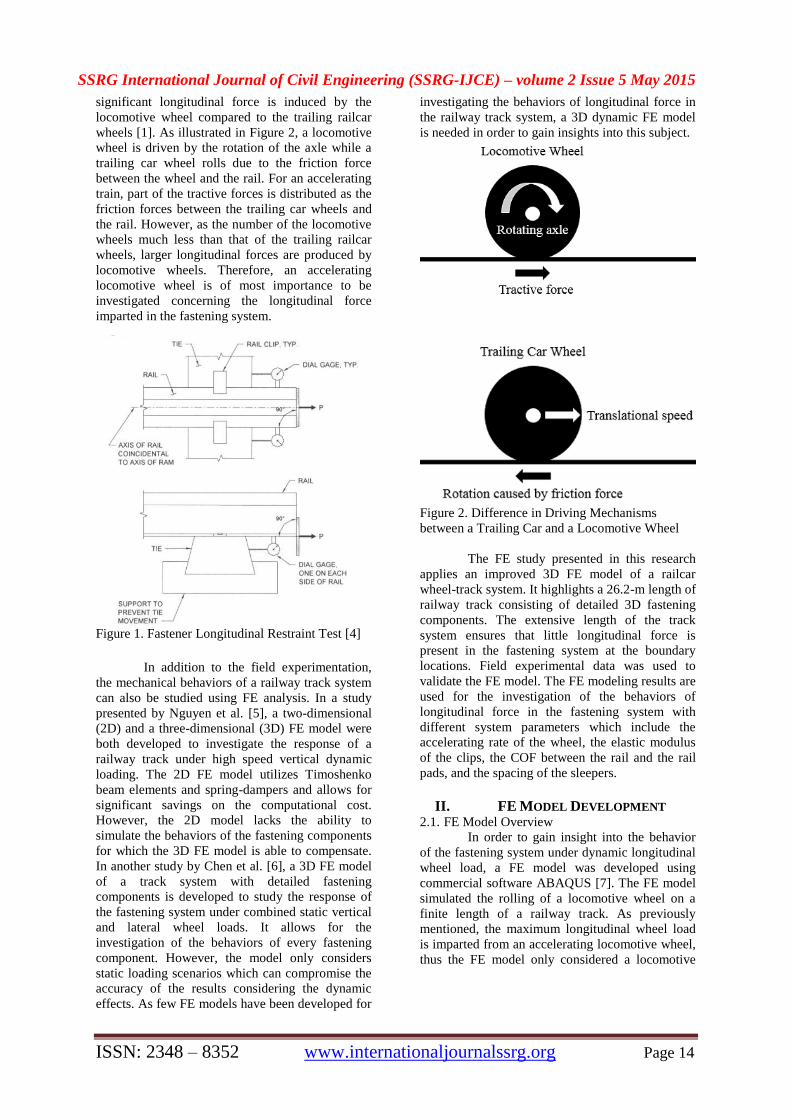
significant longitudinal force is induced by the
locomotive wheel compared to the trailing railcar
wheels [1]. As illustrated in Figure 2, a locomotive
wheel is driven by the rotation of the axle while a
trailing car wheel rolls due to the friction force
between the wheel and the rail. For an accelerating
train, part of the tractive forces is distributed as the
friction forces between the trailing car wheels and
the rail. However, as the number of the locomotive
wheels much less than that of the trailing railcar
wheels, larger longitudinal forces are produced by
locomotive wheels. Therefore, an accelerating
locomotive wheel is of most importance to be
investigated concerning the longitudinal force
imparted in the fastening system.
Figure 1. Fastener Longitudinal Restraint Test [4]
In addition to the field experimentation,
the mechanical behaviors of a railway track system
can also be studied using FE analysis. In a study
presented by Nguyen et al. [5], a two-dimensional
(2D) and a three-dimensional (3D) FE model were
both developed to investigate the response of a
railway track under high speed vertical dynamic
loading. The 2D FE model utilizes Timoshenko
beam elements and spring-dampers and allows for
significant savings on the computational cost.
However, the 2D model lacks the ability to
simulate the behaviors of the fastening components
for which the 3D FE model is able to compensate.
In another study by Chen et al. [6], a 3D FE model
of a track system with detailed fastening
components is developed to study the response of
the fastening system under combined static vertical
and lateral wheel loads. It allows for the
investigation of the behaviors of every fastening
component. However, the model only considers
static loading scenarios which can compromise the
accuracy of the results considering the dynamic
effects. As few FE models have been developed for
investigating the behaviors of longitudinal force in
the railway track system, a 3D dynamic FE model
is needed in order to gain insights into this subject.
Figure 2. Difference in Driving Mechanisms
between a Trailing Car and a Locomotive Wheel
The FE study presented in this research
applies an improved 3D FE model of a railcar
wheel-track system. It highlights a 26.2-m length of
railway track consisting of detailed 3D fastening
components. The extensive length of the track
system ensures that little longitudinal force is
present in the fastening system at the boundary
locations. Field experimental data was used to
validate the FE model. The FE modeling results are
used for the investigation of the behaviors of
longitudinal force in the fastening system with
different system parameters which include the
accelerating rate of the wheel, the elastic modulus
of the clips, the COF between the rail and the rail
pads, and the spacing of the sleepers.
II. FE MODEL DEVELOPMENT 2.1. FE Model Overview
In order to gain insight into the behavior
of the fastening system under dynamic longitudinal
wheel load, a FE model was developed using
commercial software ABAQUS [7]. The FE model
simulated the rolling of a locomotive wheel on a
finite length of a railway track. As previously
mentioned, the maximum longitudinal wheel load
is imparted from an accelerating locomotive wheel,
thus the FE model only considered a locomotive
SSRG International Journal of Civil Engineering (SSRG-IJCE) – volume 2 Issue 5 May 2015
ISSN: 2348 – 8352 www.internationaljournalssrg.org Page 15
wheel.
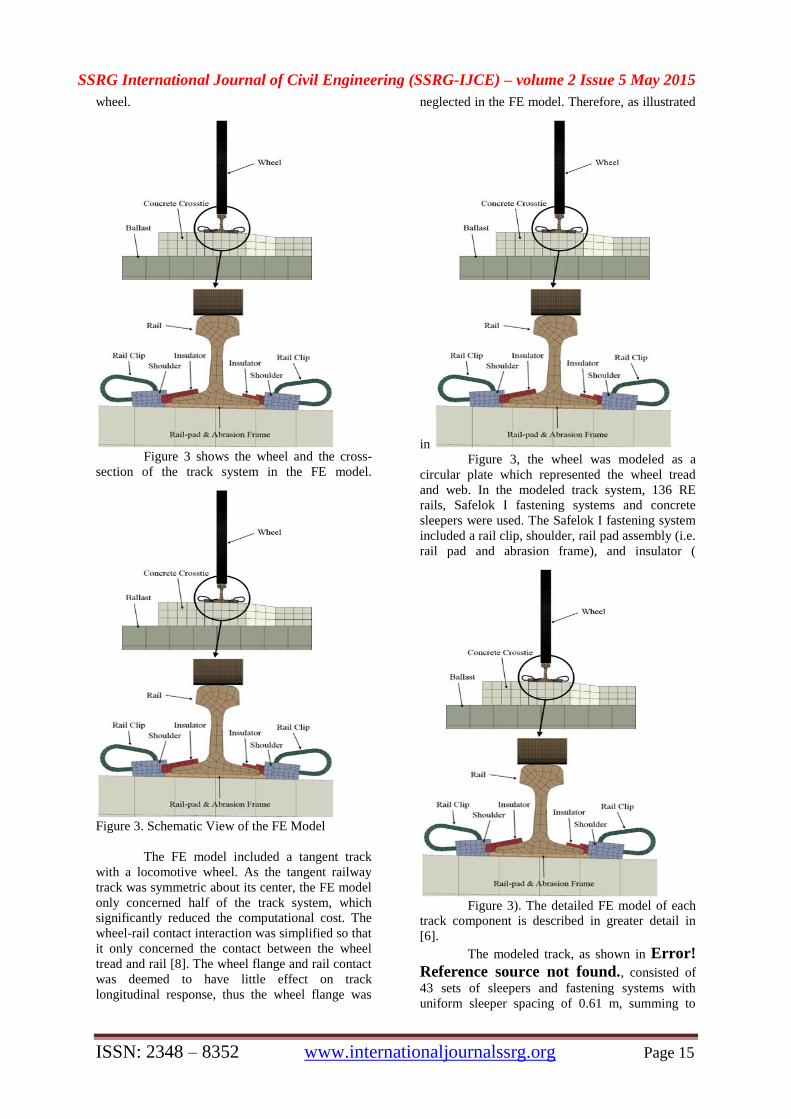
Figure 3 shows the wheel and the cross-
section of the track system in the FE model.
Figure 3. Schematic View of the FE Model
The FE model included a tangent track
with a locomotive wheel. As the tangent railway
track was symmetric about its center, the FE model
only concerned half of the track system, which
significantly reduced the computational cost. The
wheel-rail contact interaction was simplified so that
it only concerned the contact between the wheel
tread and rail [8]. The wheel flange and rail contact
was deemed to have little effect on track
longitudinal response, thus the wheel flange was
neglected in the FE model. Therefore, as illustrated
in
Figure 3, the wheel was modeled as a
circular plate which represented the wheel tread
and web. In the modeled track system, 136 RE
rails, Safelok I fastening systems and concrete
sleepers were used. The Safelok I fastening system
included a rail clip, shoulder, rail pad assembly (i.e.
rail pad and abrasion frame), and insulator (
Figure 3). The detailed FE model of each
track component is described in greater detail in
[6].
The modeled track, as shown in Error!
Reference source not found., consisted of
43 sets of sleepers and fastening systems with
uniform sleeper spacing of 0.61 m, summing to
SSRG International Journal of Civil Engineering (SSRG-IJCE) – volume 2 Issue 5 May 2015
ISSN: 2348 – 8352 www.internationaljournalssrg.org Page 16
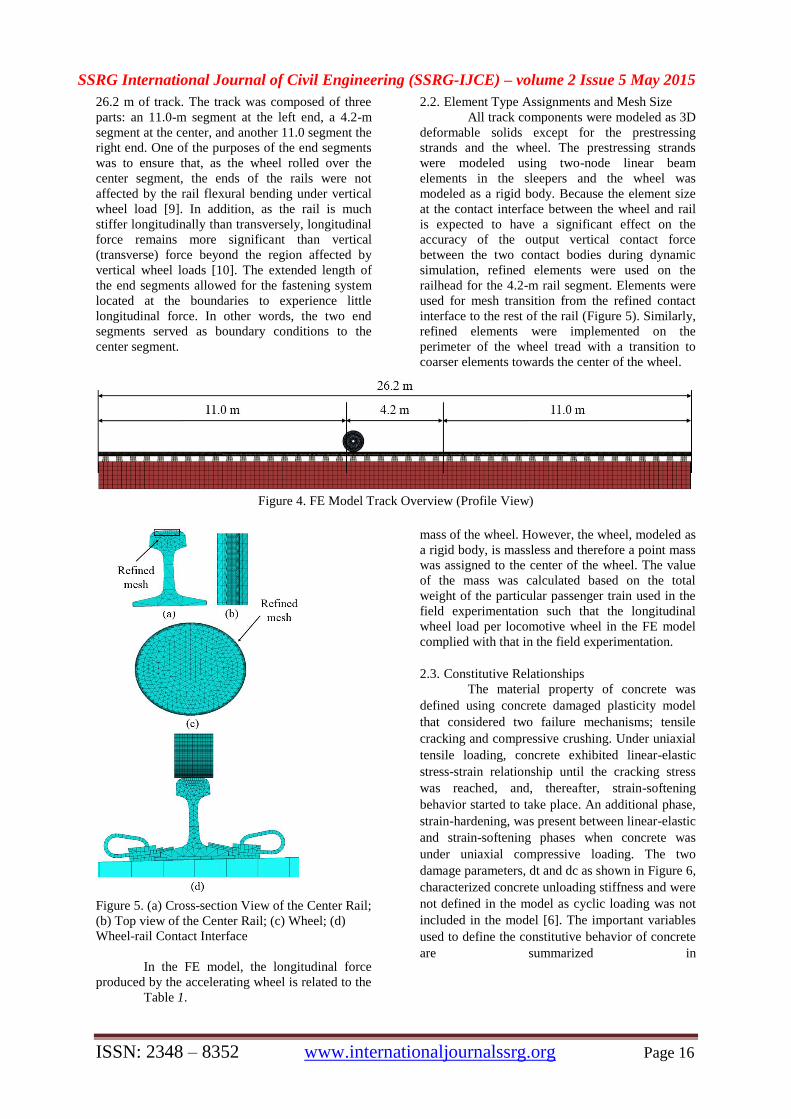
26.2 m of track. The track was composed of three
parts: an 11.0-m segment at the left end, a 4.2-m
segment at the center, and another 11.0 segment the
right end. One of the purposes of the end segments
was to ensure that, as the wheel rolled over the
center segment, the ends of the rails were not
affected by the rail flexural bending under vertical
wheel load [9]. In addition, as the rail is much
stiffer longitudinally than transversely, longitudinal
force remains more significant than vertical
(transverse) force beyond the region affected by
vertical wheel loads [10]. The extended length of
the end segments allowed for the fastening system
located at the boundaries to experience little
longitudinal force. In other words, the two end
segments served as boundary conditions to the
center segment.
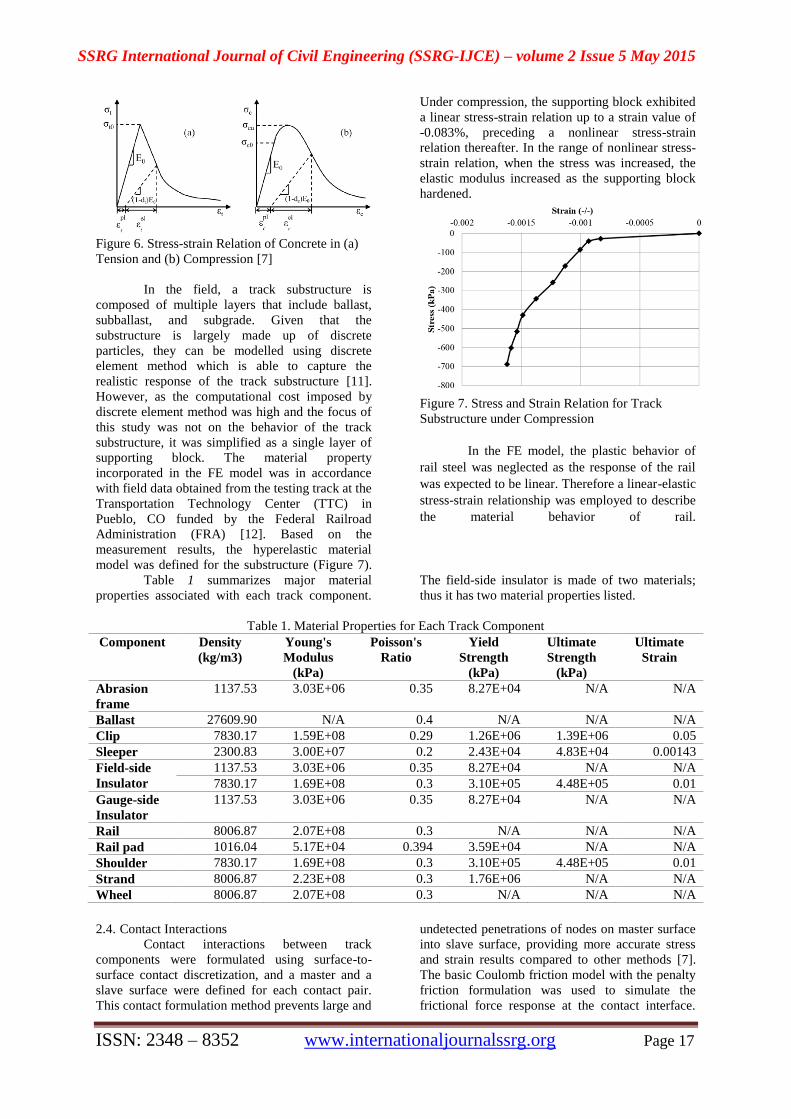
2.2. Element Type Assignments and Mesh Size
All track components were modeled as 3D
deformable solids except for the prestressing
strands and the wheel. The prestressing strands
were modeled using two-node linear beam
elements in the sleepers and the wheel was
modeled as a rigid body. Because the element size
at the contact interface between the wheel and rail
is expected to have a significant effect on the
accuracy of the output vertical contact force
between the two contact bodies during dynamic
simulation, refined elements were used on the
railhead for the 4.2-m rail segment. Elements were
used for mesh transition from the refined contact
interface to the rest of the rail (Figure 5). Similarly,
refined elements were implemented on the
perimeter of the wheel tread with a transition to
coarser elements towards the center of the wheel.
Figure 4. FE Model Track Overview (Profile View)
Figure 5. (a) Cross-section View of the Center Rail;
(b) Top view of the Center Rail; (c) Wheel; (d)
Wheel-rail Contact Interface
In the FE model, the longitudinal force
produced by the accelerating wheel is related to the
mass of the wheel. However, the wheel, modeled as
a rigid body, is massless and therefore a point mass
was assigned to the center of the wheel. The value
of the mass was calculated based on the total
weight of the particular passenger train used in the
field experimentation such that the longitudinal
wheel load per locomotive wheel in the FE model
complied with that in the field experimentation.
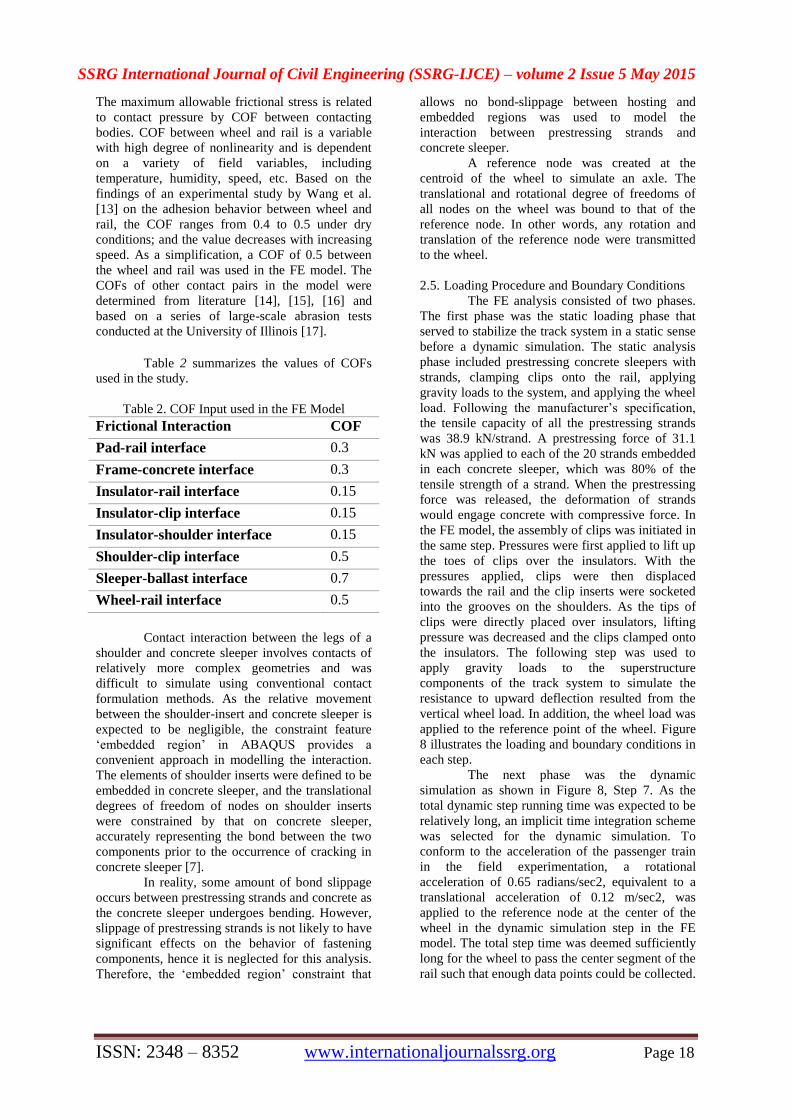
2.3. Constitutive Relationships
The material property of concrete was
defined using concrete damaged plasticity model
that considered two failure mechanisms; tensile
cracking and compressive crushing. Under uniaxial
tensile loading, concrete exhibited linear-elastic
stress-strain relationship until the cracking stress
was reached, and, thereafter, strain-softening
behavior started to take place. An additional phase,
strain-hardening, was present between linear-elastic
and strain-softening phases when concrete was
under uniaxial compressive loading. The two
damage parameters, dt and dc as shown in Figure 6,
characterized concrete unloading stiffness and were
not defined in the model as cyclic loading was not
included in the model [6]. The important variables
used to define the constitutive behavior of concrete
are summarized in
Table 1.
SSRG International Journal of Civil Engineering (SSRG-IJCE) – volume 2 Issue 5 May 2015
ISSN: 2348 – 8352 www.internationaljournalssrg.org Page 17
Figure 6. Stress-strain Relation of Concrete in (a)
Tension and (b) Compression [7]
In the field, a track substructure is
composed of multiple layers that include ballast,
subballast, and subgrade. Given that the
substructure is largely made up of discrete
particles, they can be modelled using discrete
element method which is able to capture the
realistic response of the track substructure [11].
However, as the computational cost imposed by
discrete element method was high and the focus of
this study was not on the behavior of the track
substructure, it was simplified as a single layer of
supporting block. The material property
incorporated in the FE model was in accordance
with field data obtained from the testing track at the
Transportation Technology Center (TTC) in
Pueblo, CO funded by the Federal Railroad
Administration (FRA) [12]. Based on the
measurement results, the hyperelastic material
model was defined for the substructure (Figure 7).
Under compression, the supporting block exhibited
a linear stress-strain relation up to a strain value of
-0.083%, preceding a nonlinear stress-strain
relation thereafter. In the range of nonlinear stress-
strain relation, when the stress was increased, the
elastic modulus increased as the supporting block
hardened.
Figure 7. Stress and Strain Relation for Track
Substructure under Compression
In the FE model, the plastic behavior of
rail steel was neglected as the response of the rail
was expected to be linear. Therefore a linear-elastic
stress-strain relationship was employed to describe
the material behavior of rail.
Table 1 summarizes major material
properties associated with each track component.
The field-side insulator is made of two materials;
thus it has two material properties listed.
Table 1. Material Properties for Each Track Component
Component Density
(kg/m3)
Young's
Modulus
(kPa)
Poisson's
Ratio
Yield
Strength
(kPa)
Ultimate
Strength
(kPa)
Ultimate
Strain
Abrasion
frame
1137.53 3.03E+06 0.35 8.27E+04 N/A N/A
Ballast 27609.90 N/A 0.4 N/A N/A N/A
Clip 7830.17 1.59E+08 0.29 1.26E+06 1.39E+06 0.05
Sleeper 2300.83 3.00E+07 0.2 2.43E+04 4.83E+04 0.00143
Field-side
Insulator
1137.53 3.03E+06 0.35 8.27E+04 N/A N/A
7830.17 1.69E+08 0.3 3.10E+05 4.48E+05 0.01
Gauge-side
Insulator
1137.53 3.03E+06 0.35 8.27E+04 N/A N/A
Rail 8006.87 2.07E+08 0.3 N/A N/A N/A
Rail pad 1016.04 5.17E+04 0.394 3.59E+04 N/A N/A
Shoulder 7830.17 1.69E+08 0.3 3.10E+05 4.48E+05 0.01
Strand 8006.87 2.23E+08 0.3 1.76E+06 N/A N/A
Wheel 8006.87 2.07E+08 0.3 N/A N/A N/A
2.4. Contact Interactions
Contact interactions between track
components were formulated using surface-to-
surface contact discretization, and a master and a
slave surface were defined for each contact pair.
This contact formulation method prevents large and
undetected penetrations of nodes on master surface
into slave surface, providing more accurate stress
and strain results compared to other methods [7].
The basic Coulomb friction model with the penalty
friction formulation was used to simulate the
frictional force response at the contact interface.
SSRG International Journal of Civil Engineering (SSRG-IJCE) – volume 2 Issue 5 May 2015
ISSN: 2348 – 8352 www.internationaljournalssrg.org Page 18
The maximum allowable frictional stress is related
to contact pressure by COF between contacting
bodies. COF between wheel and rail is a variable
with high degree of nonlinearity and is dependent
on a variety of field variables, including
temperature, humidity, speed, etc. Based on the
findings of an experimental study by Wang et al.
[13] on the adhesion behavior between wheel and
rail, the COF ranges from 0.4 to 0.5 under dry
conditions; and the value decreases with increasing
speed. As a simplification, a COF of 0.5 between
the wheel and rail was used in the FE model. The
COFs of other contact pairs in the model were
determined from literature [14], [15], [16] and
based on a series of large-scale abrasion tests
conducted at the University of Illinois [17].
Table 2 summarizes the values of COFs
used in the study.
Table 2. COF Input used in the FE Model
Frictional Interaction COF
Pad-rail interface 0.3
Frame-concrete interface 0.3
Insulator-rail interface 0.15
Insulator-clip interface 0.15
Insulator-shoulder interface 0.15
Shoulder-clip interface 0.5
Sleeper-ballast interface 0.7
Wheel-rail interface 0.5
Contact interaction between the legs of a
shoulder and concrete sleeper involves contacts of
relatively more complex geometries and was
difficult to simulate using conventional contact
formulation methods. As the relative movement
between the shoulder-insert and concrete sleeper is
expected to be negligible, the constraint feature
‘embedded region’ in ABAQUS provides a
convenient approach in modelling the interaction.
The elements of shoulder inserts were defined to be
embedded in concrete sleeper, and the translational
degrees of freedom of nodes on shoulder inserts
were constrained by that on concrete sleeper,
accurately representing the bond between the two
components prior to the occurrence of cracking in
concrete sleeper [7].
In reality, some amount of bond slippage
occurs between prestressing strands and concrete as
the concrete sleeper undergoes bending. However,
slippage of prestressing strands is not likely to have
significant effects on the behavior of fastening
components, hence it is neglected for this analysis.
Therefore, the ‘embedded region’ constraint that
allows no bond-slippage between hosting and
embedded regions was used to model the
interaction between prestressing strands and
concrete sleeper.
A reference node was created at the
centroid of the wheel to simulate an axle. The
translational and rotational degree of freedoms of
all nodes on the wheel was bound to that of the
reference node. In other words, any rotation and
translation of the reference node were transmitted
to the wheel.
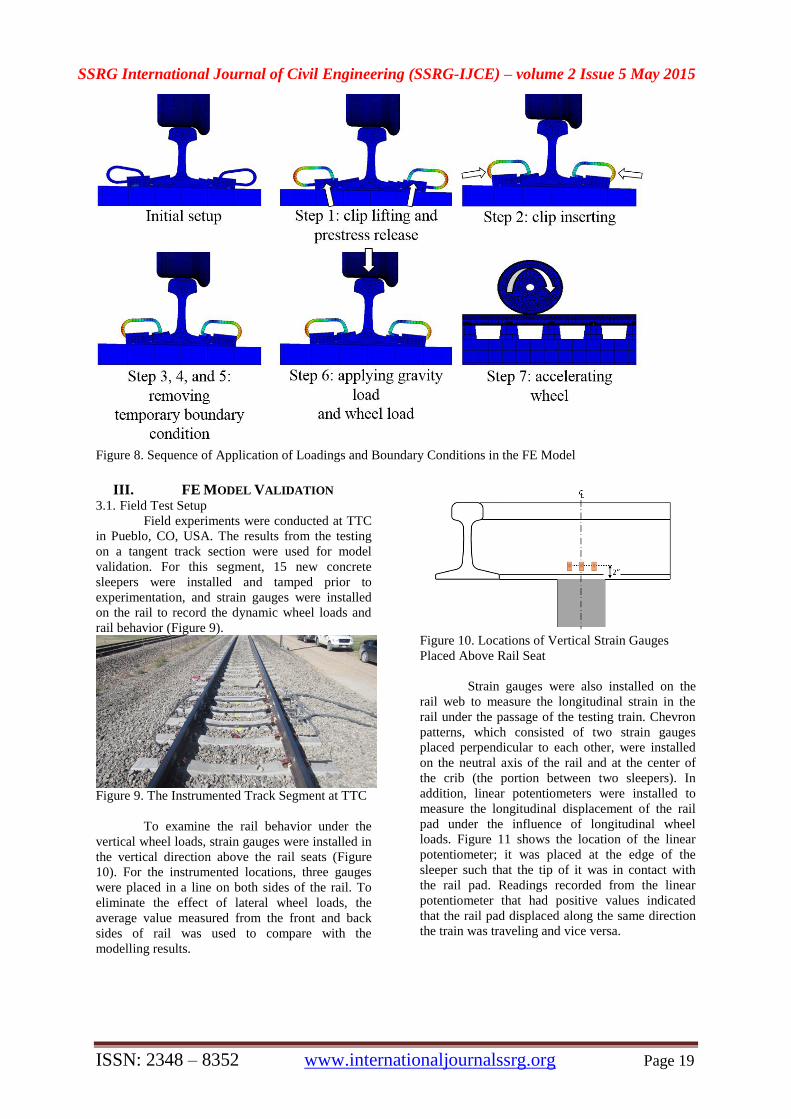
2.5. Loading Procedure and Boundary Conditions
The FE analysis consisted of two phases.
The first phase was the static loading phase that
served to stabilize the track system in a static sense
before a dynamic simulation. The static analysis
phase included prestressing concrete sleepers with
strands, clamping clips onto the rail, applying
gravity loads to the system, and applying the wheel
load. Following the manufacturer’s specification,
the tensile capacity of all the prestressing strands
was 38.9 kN/strand. A prestressing force of 31.1
kN was applied to each of the 20 strands embedded
in each concrete sleeper, which was 80% of the
tensile strength of a strand. When the prestressing
force was released, the deformation of strands
would engage concrete with compressive force. In
the FE model, the assembly of clips was initiated in
the same step. Pressures were first applied to lift up
the toes of clips over the insulators. With the
pressures applied, clips were then displaced
towards the rail and the clip inserts were socketed
into the grooves on the shoulders. As the tips of
clips were directly placed over insulators, lifting
pressure was decreased and the clips clamped onto
the insulators. The following step was used to
apply gravity loads to the superstructure
components of the track system to simulate the
resistance to upward deflection resulted from the
vertical wheel load. In addition, the wheel load was
applied to the reference point of the wheel. Figure
8 illustrates the loading and boundary conditions in
each step.
The next phase was the dynamic
simulation as shown in Figure 8, Step 7. As the
total dynamic step running time was expected to be
relatively long, an implicit time integration scheme
was selected for the dynamic simulation. To
conform to the acceleration of the passenger train
in the field experimentation, a rotational
acceleration of 0.65 radians/sec2, equivalent to a
translational acceleration of 0.12 m/sec2, was
applied to the reference node at the center of the
wheel in the dynamic simulation step in the FE
model. The total step time was deemed sufficiently
long for the wheel to pass the center segment of the
rail such that enough data points could be collected.
SSRG International Journal of Civil Engineering (SSRG-IJCE) – volume 2 Issue 5 May 2015
ISSN: 2348 – 8352 www.internationaljournalssrg.org Page 19
Figure 8. Sequence of Application of Loadings and Boundary Conditions in the FE Model
III. FE MODEL VALIDATION
3.1. Field Test Setup
Field experiments were conducted at TTC
in Pueblo, CO, USA. The results from the testing
on a tangent track section were used for model
validation. For this segment, 15 new concrete
sleepers were installed and tamped prior to
experimentation, and strain gauges were installed
on the rail to record the dynamic wheel loads and
rail behavior (Figure 9).
Figure 9. The Instrumented Track Segment at TTC
To examine the rail behavior under the
vertical wheel loads, strain gauges were installed in
the vertical direction above the rail seats (Figure
10). For the instrumented locations, three gauges
were placed in a line on both sides of the rail. To
eliminate the effect of lateral wheel loads, the
average value measured from the front and back
sides of rail was used to compare with the
modelling results.
Figure 10. Locations of Vertical Strain Gauges
Placed Above Rail Seat
Strain gauges were also installed on the
rail web to measure the longitudinal strain in the
rail under the passage of the testing train. Chevron
patterns, which consisted of two strain gauges
placed perpendicular to each other, were installed
on the neutral axis of the rail and at the center of
the crib (the portion between two sleepers). In
addition, linear potentiometers were installed to
measure the longitudinal displacement of the rail
pad under the influence of longitudinal wheel
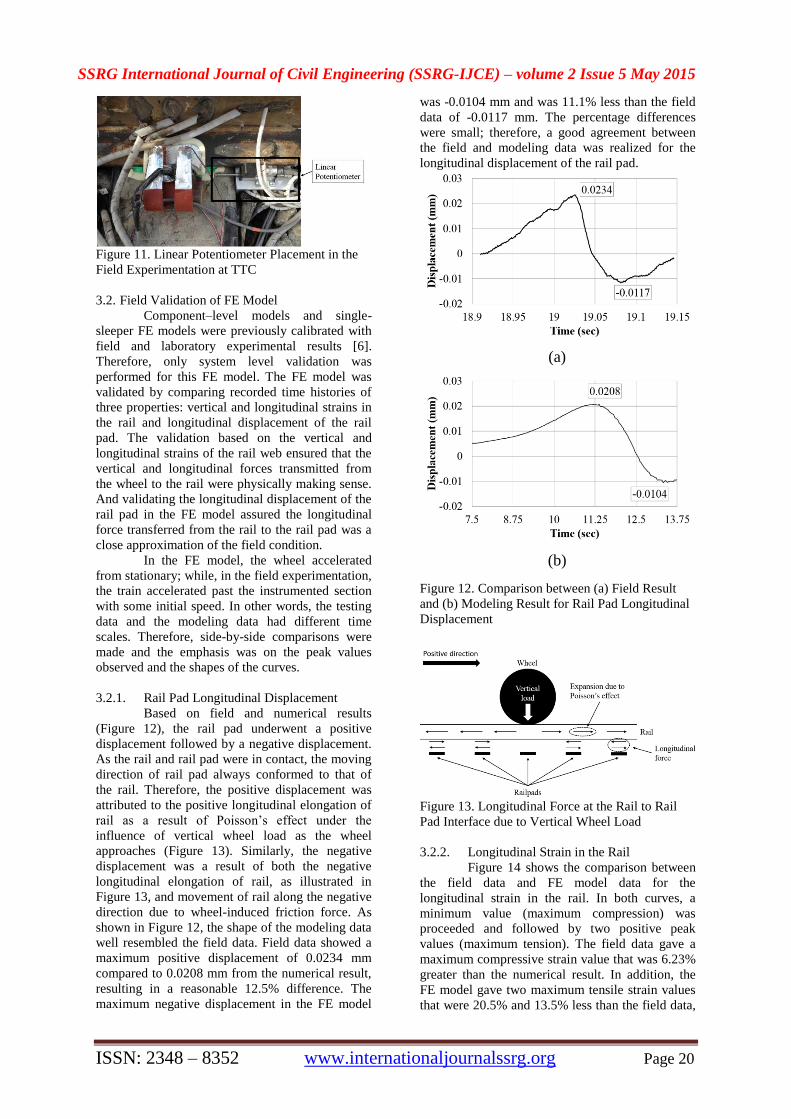
loads. Figure 11 shows the location of the linear
potentiometer; it was placed at the edge of the
sleeper such that the tip of it was in contact with
the rail pad. Readings recorded from the linear
potentiometer that had positive values indicated
that the rail pad displaced along the same direction
the train was traveling and vice versa.
SSRG International Journal of Civil Engineering (SSRG-IJCE) – volume 2 Issue 5 May 2015
ISSN: 2348 – 8352 www.internationaljournalssrg.org Page 20
Figure 11. Linear Potentiometer Placement in the
Field Experimentation at TTC
3.2. Field Validation of FE Model
Component–level models and single-
sleeper FE models were previously calibrated with
field and laboratory experimental results [6].
Therefore, only system level validation was
performed for this FE model. The FE model was
validated by comparing recorded time histories of
three properties: vertical and longitudinal strains in
the rail and longitudinal displacement of the rail
pad. The validation based on the vertical and
longitudinal strains of the rail web ensured that the
vertical and longitudinal forces transmitted from
the wheel to the rail were physically making sense.
And validating the longitudinal displacement of the
rail pad in the FE model assured the longitudinal
force transferred from the rail to the rail pad was a
close approximation of the field condition.
In the FE model, the wheel accelerated
from stationary; while, in the field experimentation,
the train accelerated past the instrumented section
with some initial speed. In other words, the testing
data and the modeling data had different time
scales. Therefore, side-by-side comparisons were
made and the emphasis was on the peak values
observed and the shapes of the curves.
3.2.1. Rail Pad Longitudinal Displacement
Based on field and numerical results
(Figure 12), the rail pad underwent a positive
displacement followed by a negative displacement.
As the rail and rail pad were in contact, the moving
direction of rail pad always conformed to that of
the rail. Therefore, the positive displacement was
attributed to the positive longitudinal elongation of
rail as a result of Poisson’s effect under the
influence of vertical wheel load as the wheel
approaches (Figure 13). Similarly, the negative
displacement was a result of both the negative
longitudinal elongation of rail, as illustrated in
Figure 13, and movement of rail along the negative
direction due to wheel-induced friction force. As
shown in Figure 12, the shape of the modeling data
well resembled the field data. Field data showed a
maximum positive displacement of 0.0234 mm
compared to 0.0208 mm from the numerical result,
resulting in a reasonable 12.5% difference. The
maximum negative displacement in the FE model
was -0.0104 mm and was 11.1% less than the field
data of -0.0117 mm. The percentage differences
were small; therefore, a good agreement between
the field and modeling data was realized for the
longitudinal displacement of the rail pad.
Figure 12. Comparison between (a) Field Result
and (b) Modeling Result for Rail Pad Longitudinal
Displacement
Figure 13. Longitudinal Force at the Rail to Rail
Pad Interface due to Vertical Wheel Load
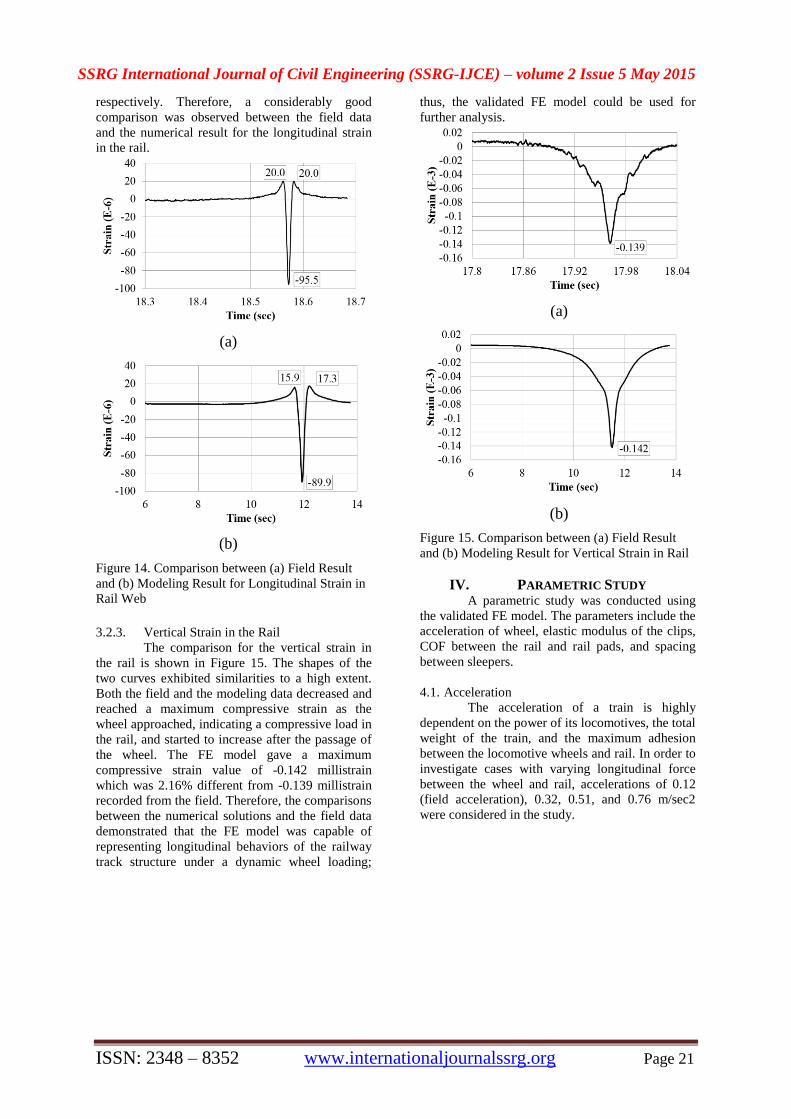
3.2.2. Longitudinal Strain in the Rail
Figure 14 shows the comparison between
the field data and FE model data for the
longitudinal strain in the rail. In both curves, a
minimum value (maximum compression) was
proceeded and followed by two positive peak
values (maximum tension). The field data gave a
maximum compressive strain value that was 6.23%
greater than the numerical result. In addition, the
FE model gave two maximum tensile strain values
that were 20.5% and 13.5% less than the field data,
(a)
(b)
SSRG International Journal of Civil Engineering (SSRG-IJCE) – volume 2 Issue 5 May 2015
ISSN: 2348 – 8352 www.internationaljournalssrg.org Page 21
respectively. Therefore, a considerably good
comparison was observed between the field data
and the numerical result for the longitudinal strain
in the rail.
Figure 14. Comparison between (a) Field Result
and (b) Modeling Result for Longitudinal Strain in
Rail Web
3.2.3. Vertical Strain in the Rail
The comparison for the vertical strain in
the rail is shown in Figure 15. The shapes of the
two curves exhibited similarities to a high extent.
Both the field and the modeling data decreased and
reached a maximum compressive strain as the
wheel approached, indicating a compressive load in
the rail, and started to increase after the passage of
the wheel. The FE model gave a maximum
compressive strain value of -0.142 millistrain
which was 2.16% different from -0.139 millistrain
recorded from the field. Therefore, the comparisons
between the numerical solutions and the field data
demonstrated that the FE model was capable of
representing longitudinal behaviors of the railway
track structure under a dynamic wheel loading;
thus, the validated FE model could be used for
further analysis.
Figure 15. Comparison between (a) Field Result
and (b) Modeling Result for Vertical Strain in Rail
IV. PARAMETRIC STUDY A parametric study was conducted using
the validated FE model. The parameters include the
acceleration of wheel, elastic modulus of the clips,
COF between the rail and rail pads, and spacing
between sleepers.
4.1. Acceleration
The acceleration of a train is highly
dependent on the power of its locomotives, the total
weight of the train, and the maximum adhesion
between the locomotive wheels and rail. In order to
investigate cases with varying longitudinal force
between the wheel and rail, accelerations of 0.12
(field acceleration), 0.32, 0.51, and 0.76 m/sec2
were considered in the study.
(a)
(b)
(a)
(b)
SSRG International Journal of Civil Engineering (SSRG-IJCE) – volume 2 Issue 5 May 2015
ISSN: 2348 – 8352 www.internationaljournalssrg.org Page 22
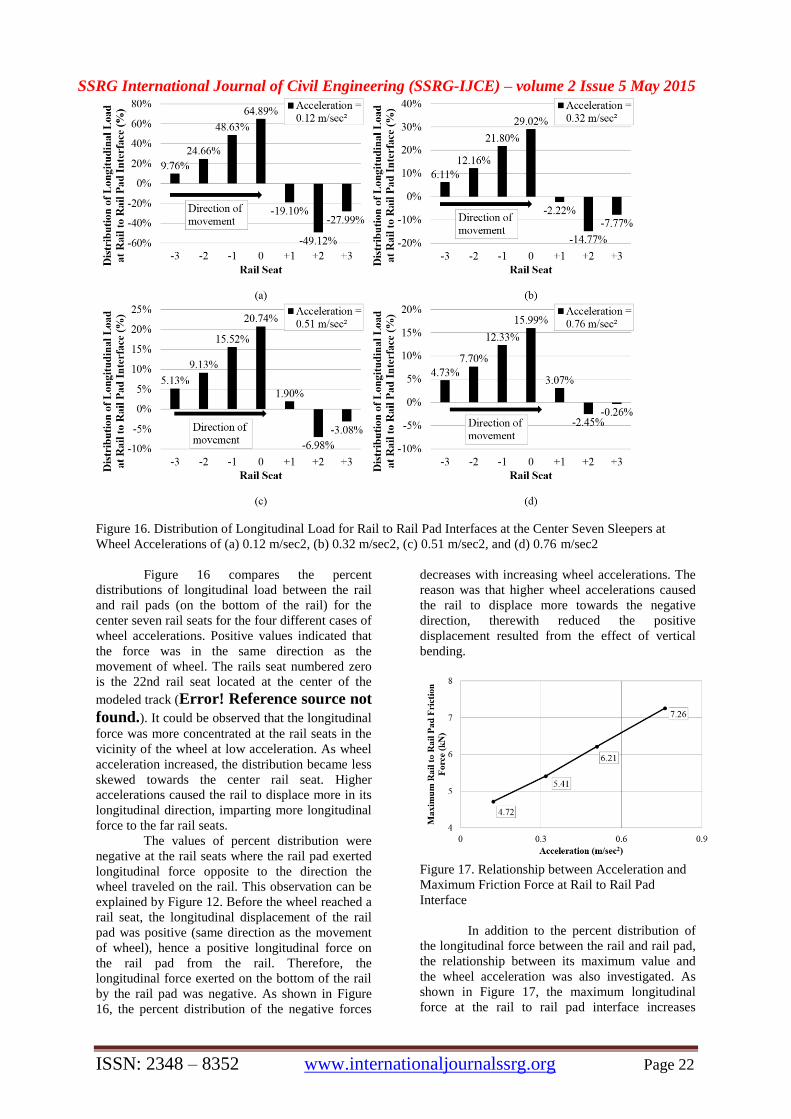
Figure 16. Distribution of Longitudinal Load for Rail to Rail Pad Interfaces at the Center Seven Sleepers at
Wheel Accelerations of (a) 0.12 m/sec2, (b) 0.32 m/sec2, (c) 0.51 m/sec2, and (d) 0.76 m/sec2
Figure 16 compares the percent
distributions of longitudinal load between the rail
and rail pads (on the bottom of the rail) for the
center seven rail seats for the four different cases of
wheel accelerations. Positive values indicated that
the force was in the same direction as the
movement of wheel. The rails seat numbered zero
is the 22nd rail seat located at the center of the
modeled track (Error! Reference source not
found.). It could be observed that the longitudinal
force was more concentrated at the rail seats in the
vicinity of the wheel at low acceleration. As wheel
acceleration increased, the distribution became less
skewed towards the center rail seat. Higher
accelerations caused the rail to displace more in its
longitudinal direction, imparting more longitudinal
force to the far rail seats.
The values of percent distribution were
negative at the rail seats where the rail pad exerted
longitudinal force opposite to the direction the
wheel traveled on the rail. This observation can be
explained by Figure 12. Before the wheel reached a
rail seat, the longitudinal displacement of the rail
pad was positive (same direction as the movement
of wheel), hence a positive longitudinal force on
the rail pad from the rail. Therefore, the
longitudinal force exerted on the bottom of the rail
by the rail pad was negative. As shown in Figure
16, the percent distribution of the negative forces
decreases with increasing wheel accelerations. The
reason was that higher wheel accelerations caused
the rail to displace more towards the negative
direction, therewith reduced the positive
displacement resulted from the effect of vertical
bending.
Figure 17. Relationship between Acceleration and
Maximum Friction Force at Rail to Rail Pad
Interface
In addition to the percent distribution of
the longitudinal force between the rail and rail pad,
the relationship between its maximum value and
the wheel acceleration was also investigated. As
shown in Figure 17, the maximum longitudinal
force at the rail to rail pad interface increases
SSRG International Journal of Civil Engineering (SSRG-IJCE) – volume 2 Issue 5 May 2015
ISSN: 2348 – 8352 www.internationaljournalssrg.org Page 23
linearly with wheel acceleration. However, the
percent increase in the maximum longitudinal force
was only 54% while the acceleration increased by
more than five times. It agreed with Figure 16 that
the percent distribution decreased at the center rail
seat even though the force transmitted to it
increased; and this behavior could be attributed to
the high rigidity of the rail in the longitudinal
direction. In other words, the majority of the
longitudinal force produced by the wheel at high
accelerations was distributed to the far rail seats.
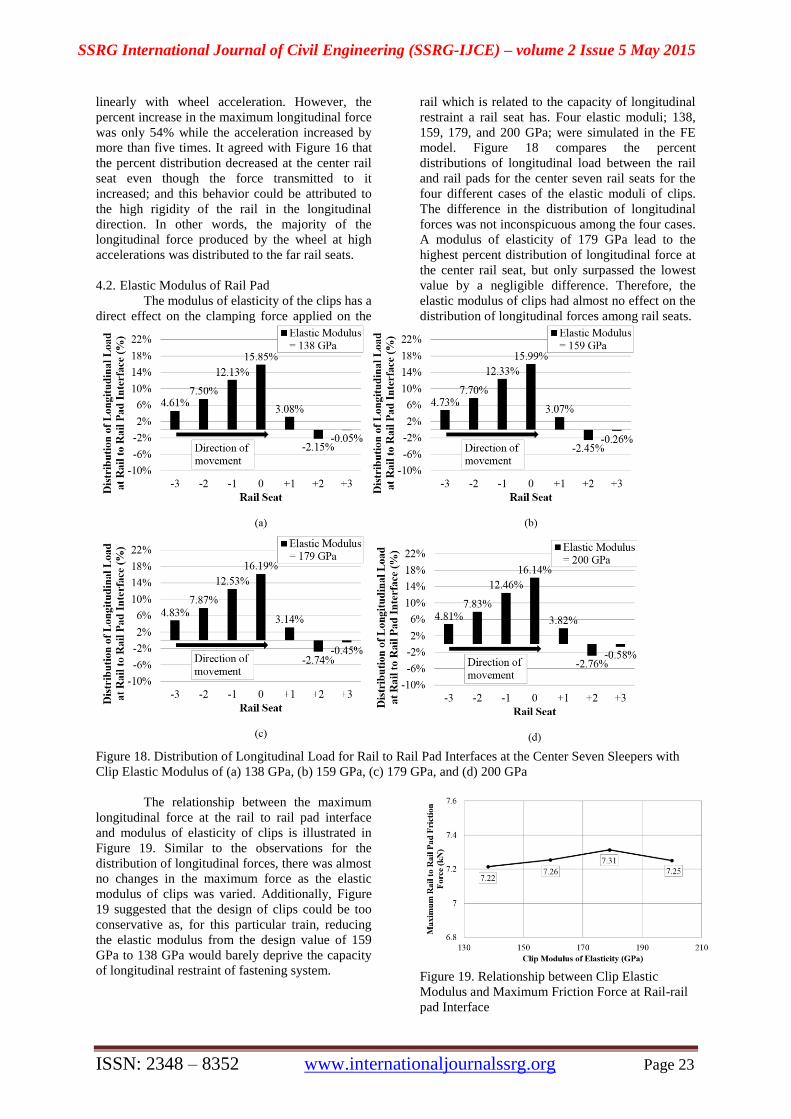
4.2. Elastic Modulus of Rail Pad
The modulus of elasticity of the clips has a
direct effect on the clamping force applied on the
rail which is related to the capacity of longitudinal
restraint a rail seat has. Four elastic moduli; 138,
159, 179, and 200 GPa; were simulated in the FE
model. Figure 18 compares the percent
distributions of longitudinal load between the rail
and rail pads for the center seven rail seats for the
four different cases of the elastic moduli of clips.
The difference in the distribution of longitudinal
forces was not inconspicuous among the four cases.
A modulus of elasticity of 179 GPa lead to the
highest percent distribution of longitudinal force at
the center rail seat, but only surpassed the lowest
value by a negligible difference. Therefore, the
elastic modulus of clips had almost no effect on the
distribution of longitudinal forces among rail seats.
Figure 18. Distribution of Longitudinal Load for Rail to Rail Pad Interfaces at the Center Seven Sleepers with
Clip Elastic Modulus of (a) 138 GPa, (b) 159 GPa, (c) 179 GPa, and (d) 200 GPa
The relationship between the maximum
longitudinal force at the rail to rail pad interface
and modulus of elasticity of clips is illustrated in
Figure 19. Similar to the observations for the
distribution of longitudinal forces, there was almost
no changes in the maximum force as the elastic
modulus of clips was varied. Additionally, Figure
19 suggested that the design of clips could be too
conservative as, for this particular train, reducing
the elastic modulus from the design value of 159
GPa to 138 GPa would barely deprive the capacity
of longitudinal restraint of fastening system. Figure 19. Relationship between Clip Elastic
Modulus and Maximum Friction Force at Rail-rail
pad Interface
SSRG International Journal of Civil Engineering (SSRG-IJCE) – volume 2 Issue 5 May 2015
ISSN: 2348 – 8352 www.internationaljournalssrg.org Page 27
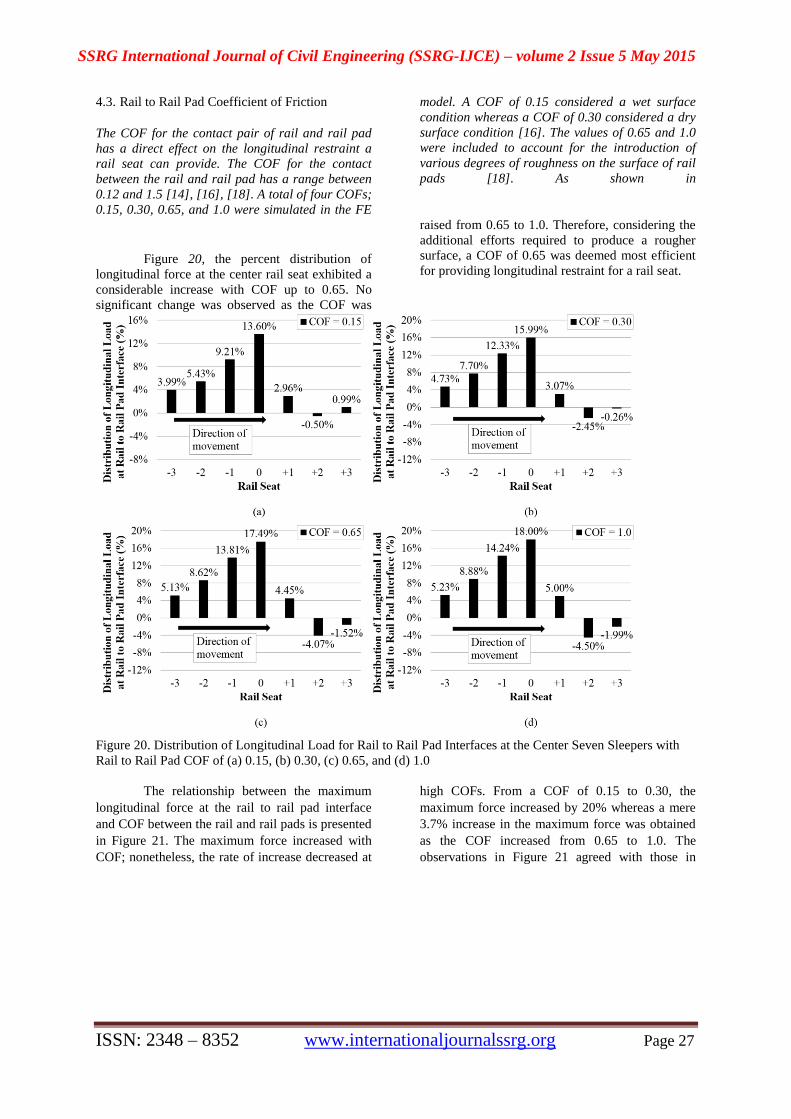
4.3. Rail to Rail Pad Coefficient of Friction
The COF for the contact pair of rail and rail pad
has a direct effect on the longitudinal restraint a
rail seat can provide. The COF for the contact
between the rail and rail pad has a range between
0.12 and 1.5 [14], [16], [18]. A total of four COFs;
0.15, 0.30, 0.65, and 1.0 were simulated in the FE
model. A COF of 0.15 considered a wet surface
condition whereas a COF of 0.30 considered a dry
surface condition [16]. The values of 0.65 and 1.0
were included to account for the introduction of
various degrees of roughness on the surface of rail
pads [18]. As shown in
Figure 20, the percent distribution of
longitudinal force at the center rail seat exhibited a
considerable increase with COF up to 0.65. No
significant change was observed as the COF was
raised from 0.65 to 1.0. Therefore, considering the
additional efforts required to produce a rougher
surface, a COF of 0.65 was deemed most efficient
for providing longitudinal restraint for a rail seat.
Figure 20. Distribution of Longitudinal Load for Rail to Rail Pad Interfaces at the Center Seven Sleepers with
Rail to Rail Pad COF of (a) 0.15, (b) 0.30, (c) 0.65, and (d) 1.0
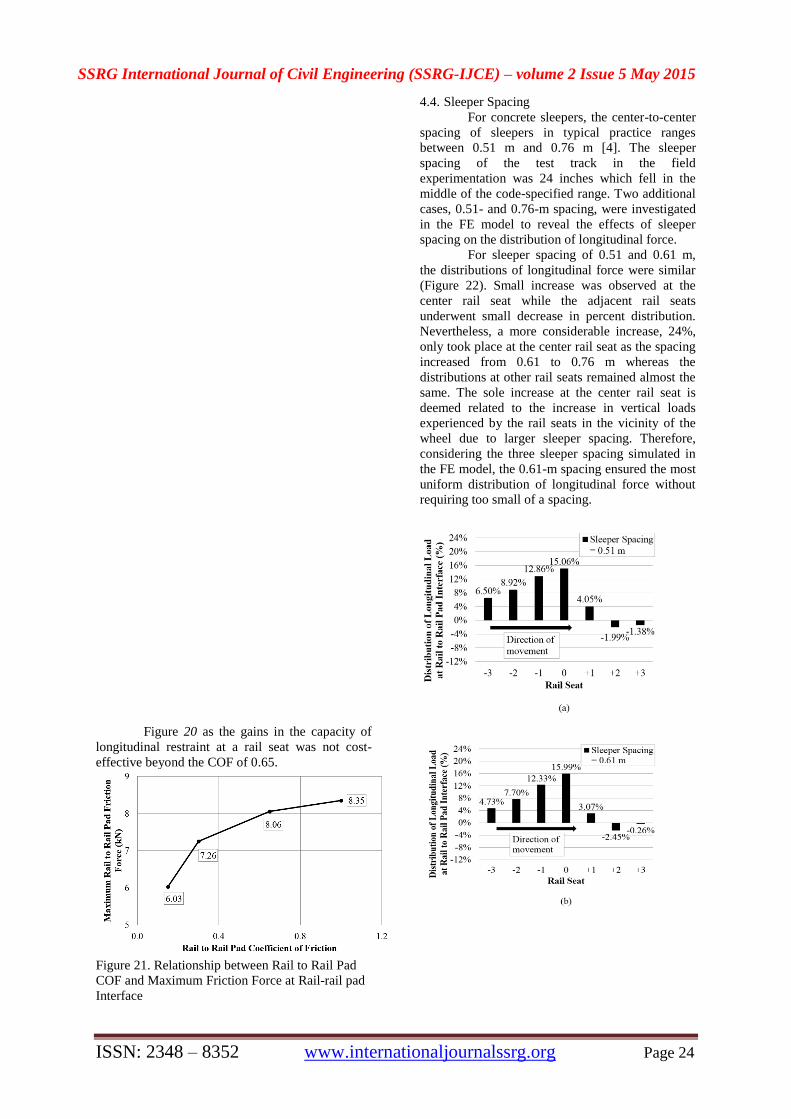
The relationship between the maximum
longitudinal force at the rail to rail pad interface
and COF between the rail and rail pads is presented
in Figure 21. The maximum force increased with
COF; nonetheless, the rate of increase decreased at
high COFs. From a COF of 0.15 to 0.30, the
maximum force increased by 20% whereas a mere
3.7% increase in the maximum force was obtained
as the COF increased from 0.65 to 1.0. The
observations in Figure 21 agreed with those in
SSRG International Journal of Civil Engineering (SSRG-IJCE) – volume 2 Issue 5 May 2015
ISSN: 2348 – 8352 www.internationaljournalssrg.org Page 24
Figure 20 as the gains in the capacity of
longitudinal restraint at a rail seat was not cost-
effective beyond the COF of 0.65.
Figure 21. Relationship between Rail to Rail Pad
COF and Maximum Friction Force at Rail-rail pad
Interface
4.4. Sleeper Spacing
For concrete sleepers, the center-to-center
spacing of sleepers in typical practice ranges
between 0.51 m and 0.76 m [4]. The sleeper
spacing of the test track in the field
experimentation was 24 inches which fell in the
middle of the code-specified range. Two additional
cases, 0.51- and 0.76-m spacing, were investigated
in the FE model to reveal the effects of sleeper
spacing on the distribution of longitudinal force.
For sleeper spacing of 0.51 and 0.61 m,
the distributions of longitudinal force were similar
(Figure 22). Small increase was observed at the
center rail seat while the adjacent rail seats
underwent small decrease in percent distribution.
Nevertheless, a more considerable increase, 24%,
only took place at the center rail seat as the spacing
increased from 0.61 to 0.76 m whereas the
distributions at other rail seats remained almost the
same. The sole increase at the center rail seat is
deemed related to the increase in vertical loads
experienced by the rail seats in the vicinity of the
wheel due to larger sleeper spacing. Therefore,
considering the three sleeper spacing simulated in
the FE model, the 0.61-m spacing ensured the most
uniform distribution of longitudinal force without
requiring too small of a spacing.
SSRG International Journal of Civil Engineering (SSRG-IJCE) – volume 2 Issue 5 May 2015
ISSN: 2348 – 8352 www.internationaljournalssrg.org Page 25
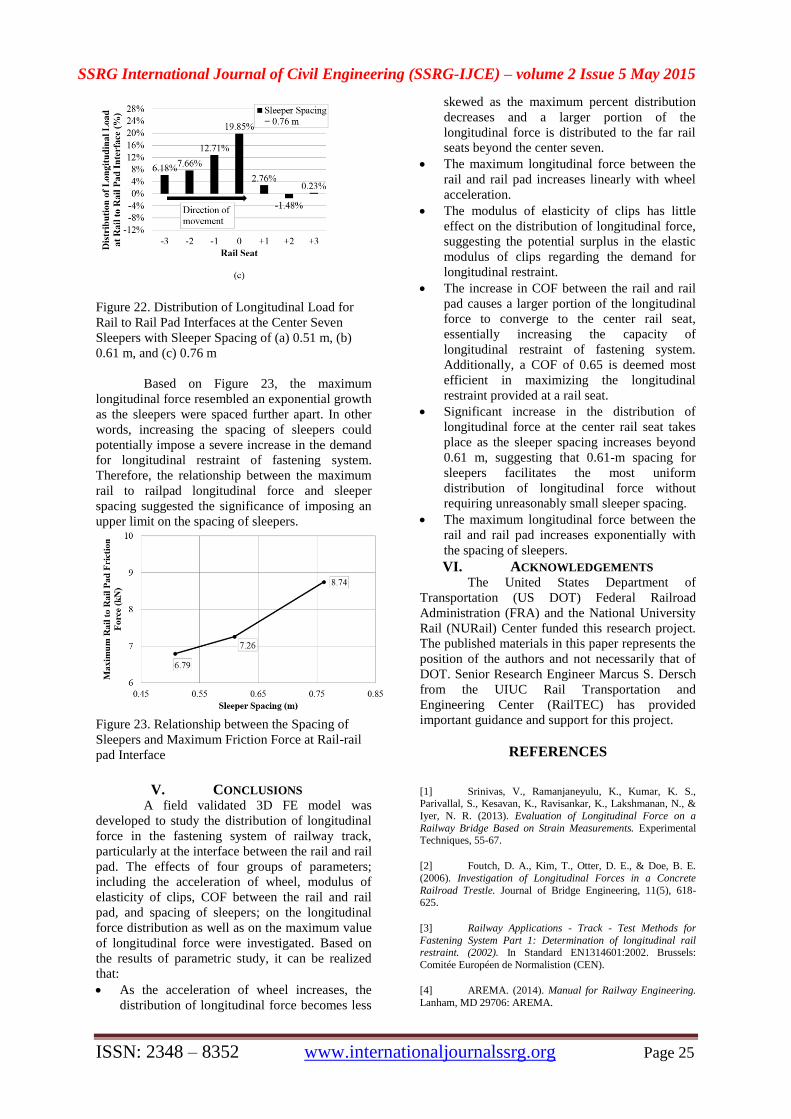
Figure 22. Distribution of Longitudinal Load for
Rail to Rail Pad Interfaces at the Center Seven
Sleepers with Sleeper Spacing of (a) 0.51 m, (b)
0.61 m, and (c) 0.76 m
Based on Figure 23, the maximum
longitudinal force resembled an exponential growth
as the sleepers were spaced further apart. In other
words, increasing the spacing of sleepers could
potentially impose a severe increase in the demand
for longitudinal restraint of fastening system.
Therefore, the relationship between the maximum
rail to railpad longitudinal force and sleeper
spacing suggested the significance of imposing an
upper limit on the spacing of sleepers.
Figure 23. Relationship between the Spacing of
Sleepers and Maximum Friction Force at Rail-rail
pad Interface
V. CONCLUSIONS
A field validated 3D FE model was
developed to study the distribution of longitudinal
force in the fastening system of railway track,
particularly at the interface between the rail and rail
pad. The effects of four groups of parameters;
including the acceleration of wheel, modulus of
elasticity of clips, COF between the rail and rail
pad, and spacing of sleepers; on the longitudinal
force distribution as well as on the maximum value
of longitudinal force were investigated. Based on
the results of parametric study, it can be realized
that:
As the acceleration of wheel increases, the
distribution of longitudinal force becomes less
skewed as the maximum percent distribution
decreases and a larger portion of the
longitudinal force is distributed to the far rail
seats beyond the center seven.
The maximum longitudinal force between the
rail and rail pad increases linearly with wheel
acceleration.
The modulus of elasticity of clips has little
effect on the distribution of longitudinal force,
suggesting the potential surplus in the elastic
modulus of clips regarding the demand for
longitudinal restraint.
The increase in COF between the rail and rail
pad causes a larger portion of the longitudinal
force to converge to the center rail seat,
essentially increasing the capacity of
longitudinal restraint of fastening system.
Additionally, a COF of 0.65 is deemed most
efficient in maximizing the longitudinal
restraint provided at a rail seat.
Significant increase in the distribution of
longitudinal force at the center rail seat takes
place as the sleeper spacing increases beyond
0.61 m, suggesting that 0.61-m spacing for
sleepers facilitates the most uniform
distribution of longitudinal force without
requiring unreasonably small sleeper spacing.
The maximum longitudinal force between the
rail and rail pad increases exponentially with
the spacing of sleepers.
VI. ACKNOWLEDGEMENTS The United States Department of
Transportation (US DOT) Federal Railroad
Administration (FRA) and the National University
Rail (NURail) Center funded this research project.
The published materials in this paper represents the
position of the authors and not necessarily that of
DOT. Senior Research Engineer Marcus S. Dersch
from the UIUC Rail Transportation and
Engineering Center (RailTEC) has provided
important guidance and support for this project.
REFERENCES
[1] Srinivas, V., Ramanjaneyulu, K., Kumar, K. S., Parivallal, S., Kesavan, K., Ravisankar, K., Lakshmanan, N., &
Iyer, N. R. (2013). Evaluation of Longitudinal Force on a
Railway Bridge Based on Strain Measurements. Experimental Techniques, 55-67.
[2] Foutch, D. A., Kim, T., Otter, D. E., & Doe, B. E.
(2006). Investigation of Longitudinal Forces in a Concrete
Railroad Trestle. Journal of Bridge Engineering, 11(5), 618-625.
[3] Railway Applications - Track - Test Methods for
Fastening System Part 1: Determination of longitudinal rail restraint. (2002). In Standard EN1314601:2002. Brussels:
Comitée Européen de Normalistion (CEN).
[4] AREMA. (2014). Manual for Railway Engineering.
Lanham, MD 29706: AREMA.
SSRG International Journal of Civil Engineering (SSRG-IJCE) – volume 2 Issue 5 May 2015
ISSN: 2348 – 8352 www.internationaljournalssrg.org Page 26
[5] Nguyen, K., Goicolea, J. M., & Galbadon, F. (2011).
Dynamic Analysis of High Speed Railway Track Loads on Ballasted Track. Proceedings of the Fifth International
Symposium on Environmental Vibration. Chengdu, China.
[6] Chen, Z., Shin, M., Andrawes, B., & Edwards, J.
(2014). Parametric study on damage and load demand of prestressed concrete crosstie and fastening systems.
Engineering Failure Analysis, 49-61.
[7] Dassault Systemes Simulia Corp. (2013). ABAQUS
Analysis User's Manual, Version 6.13.
[8] Anderson, E., Berg, M., & Stichel, S. (2004). Rail Vehicle Dynamics. KTH Railway Technology.
[9] Selig, E., & Waters, J. (1994). Track geotechnology
and substructure management. London: T. Telford.
[10] Rhodes, D., & Coats, B. (2008). Resistance to rail
creep – what do rail fastenings really have to do? Proceedings of the AREMA 2008 Annual Conference. Salt Lake City, UT.
[11] Huang, H., & Tutumluer, E. (2011). Discrete
Element Modeling for Fouled Railroad Ballast. Construction
and Building Materials, 3306-3312.
[12] Grasse, J. S. (2013). Field Test Program of the Concrete Crosstie and Fastening System (M.S. Thesis). Urbana,
IL 61801: University of Illinois at Urbana-Champaign.
[13] Wang, W. J., Shen, P., Song, J. H., Liu, Q. Y., & Jin,
X. S. (2011). Experimental Study on Adhesion Behavior of Wheel/Rail under Dry and Water Conditions. Wear, 2699-2705.
[14] Friedrich, K. (1986). Friction and wear of polymer
composites. Amsterdam: Elsevier.
[15] Stachowiak, G., & Batchelor, A. (2005). Engineering tribology (3rd ed.). Amsterdam: Elsevier Butterworth-
Heinemann.
[16] Yamaguchi, Y. (1990). Tribology of plastic
materials: Their characteristics and applications to sliding components. Amsterdam: Elsevier.
[17] Kernes, R. G., Edwards, J. R., Dersch, M. S., Lange,
D. A., & Barkan, C. P. (2012). Investigation of the Dynamic
Frictional Properties of a Concrete Crosstie Rail Seat and Pad and Its Effect on Rail Seat Deterioration (RSD). Proceedings of
the Transportation Research Board 91st Annual Meeting.
Washington, D.C.
[18] Bely, V. A., Sviridenok, A. I., & Petrokovets, M. I. (1982). Friction and Wear in Polymer-Based Materials.
Elsevier.

![SSRG International Journal of Mechanical Engineering (SSRG ......DOF that proposed by Wael Abbas et al [3]. In this model, the seated human-body was constructed with four separate](https://img.pdfslide.us/doc/110x75/60087b332ec2540948279254/ssrg-international-journal-of-mechanical-engineering-ssrg-dof-that-proposed.jpg)