Embed Size (px)
Citation preview

SSRG Annual Workshop 2011:How can the Children in Need
census help to improve children’s services and outcomes?
Monday 7th March Birmingham
Isabella Craig
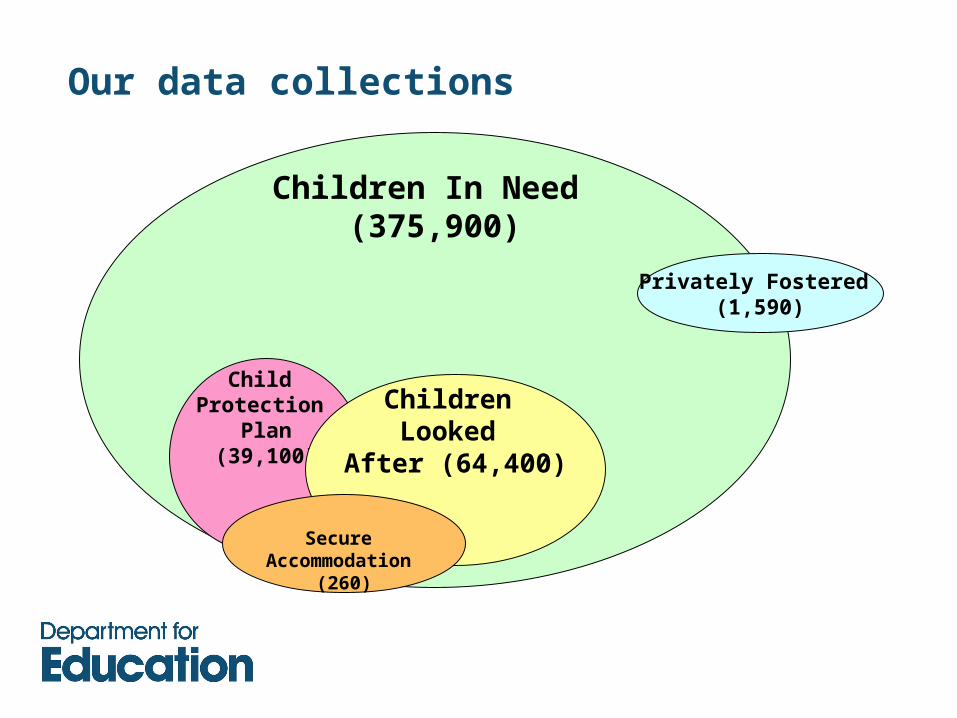
Children In Need (375,900)
Our data collections
Child Protection
Plan(39,100)
Children Looked
After (64,400)
Secure Accommodation
(260)
Privately Fostered (1,590)
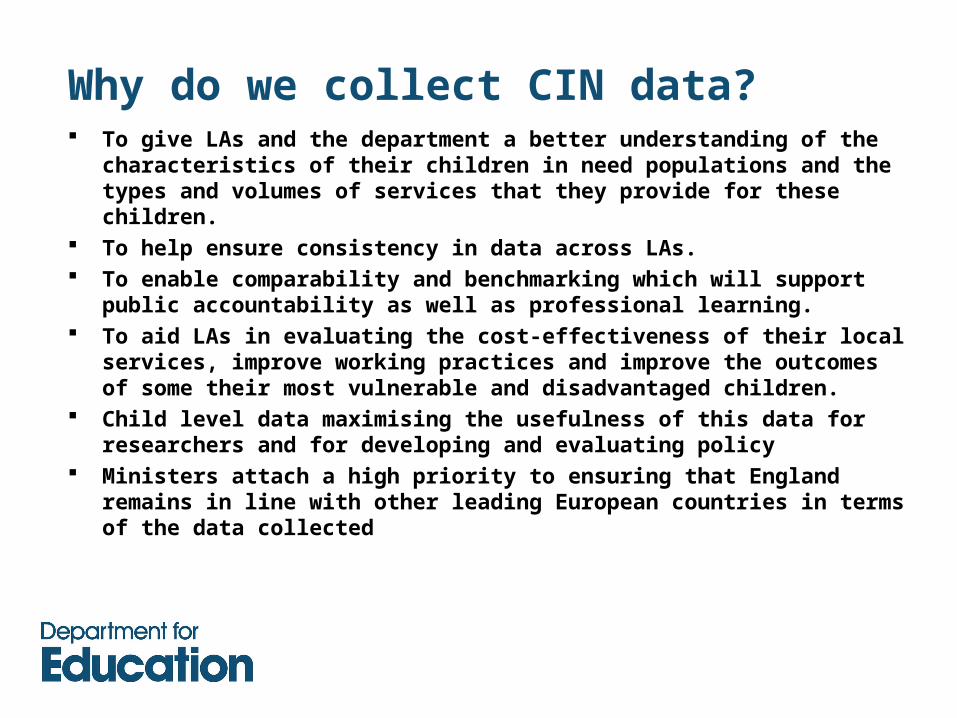
Why do we collect CIN data? To give LAs and the department a better understanding of the
characteristics of their children in need populations and the types and volumes of services that they provide for these children.
To help ensure consistency in data across LAs. To enable comparability and benchmarking which will support public
accountability as well as professional learning. To aid LAs in evaluating the cost-effectiveness of their local services,
improve working practices and improve the outcomes of some their most vulnerable and disadvantaged children.
Child level data maximising the usefulness of this data for researchers and for developing and evaluating policy
Ministers attach a high priority to ensuring that England remains in line with other leading European countries in terms of the data collected
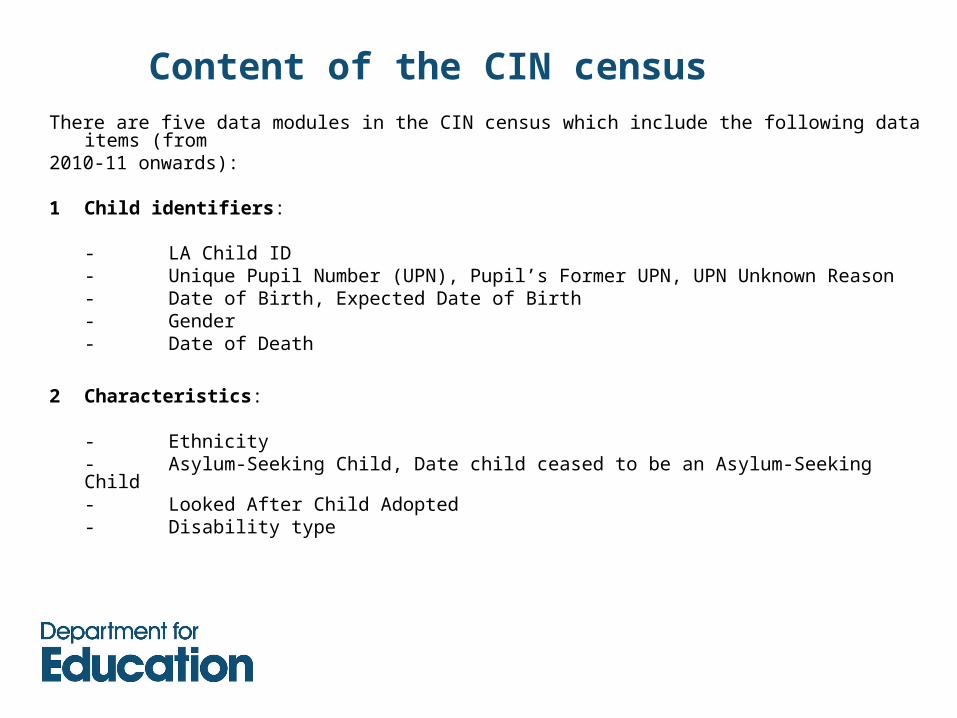
Content of the CIN census
There are five data modules in the CIN census which include the following data items (from 2010-11 onwards):
1 Child identifiers:
- LA Child ID- Unique Pupil Number (UPN), Pupil’s Former UPN, UPN Unknown Reason- Date of Birth, Expected Date of Birth- Gender- Date of Death
2 Characteristics:
- Ethnicity- Asylum-Seeking Child, Date child ceased to be an Asylum-Seeking Child- Looked After Child Adopted- Disability type
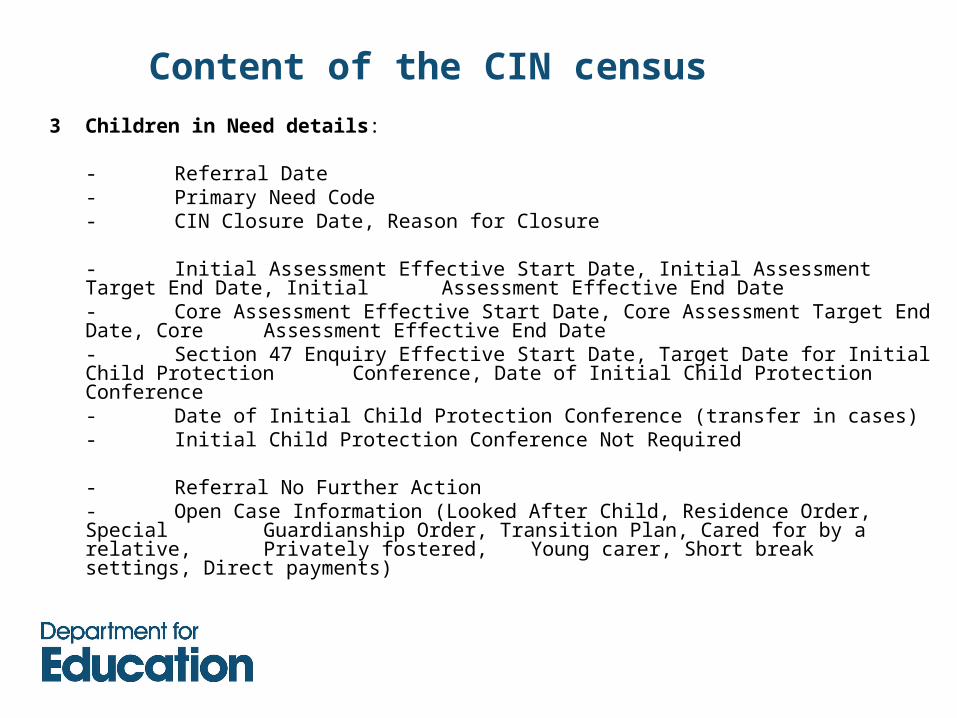
Content of the CIN census
3 Children in Need details:
- Referral Date- Primary Need Code- CIN Closure Date, Reason for Closure
- Initial Assessment Effective Start Date, Initial Assessment Target End Date, Initial Assessment Effective End Date- Core Assessment Effective Start Date, Core Assessment Target End Date, Core Assessment Effective End Date- Section 47 Enquiry Effective Start Date, Target Date for Initial Child Protection
Conference, Date of Initial Child Protection Conference- Date of Initial Child Protection Conference (transfer in cases)- Initial Child Protection Conference Not Required
- Referral No Further Action- Open Case Information (Looked After Child, Residence Order, Special Guardianship Order, Transition Plan, Cared for by a relative, Privately fostered, Young carer, Short break settings, Direct payments)
Content of the CIN census4 Service provision:
- Service Type
- Service Provider
- Start Date
- End Date
5 Child Protection Plans:
- Child Protection Plan Start Date
- Initial Category of Abuse, Latest Category of Abuse
- Number of Previous Child Protection Plans
- Child Protection Plan End Date
- Plan Review Date
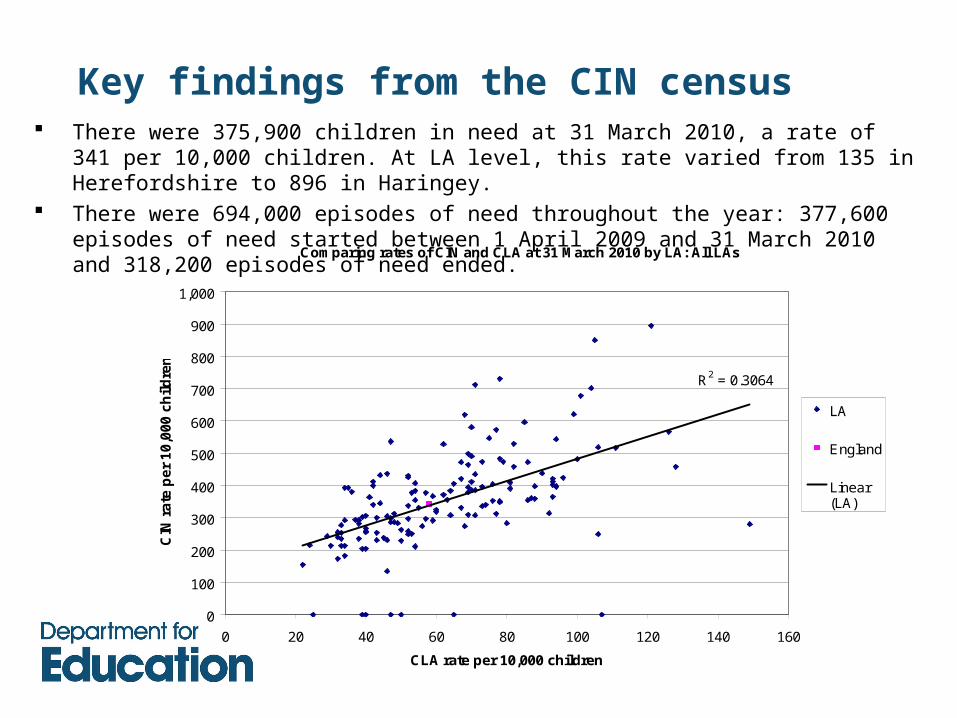
Key findings from the CIN census There were 375,900 children in need at 31 March 2010, a rate of 341 per 10,000 children.
At LA level, this rate varied from 135 in Herefordshire to 896 in Haringey. There were 694,000 episodes of need throughout the year: 377,600 episodes of need
started between 1 April 2009 and 31 March 2010 and 318,200 episodes of need ended.
Comparing rates of CIN and CLA at 31 March 2010 by LA: All LAs
R2 = 0.3064
0
100
200
300
400
500
600
700
800
900
1,000
0 20 40 60 80 100 120 140 160
CLA rate per 10,000 children
CIN
ra
te p
er
10
,00
0 c
hil
dre
n
LA
England
Linear(LA)
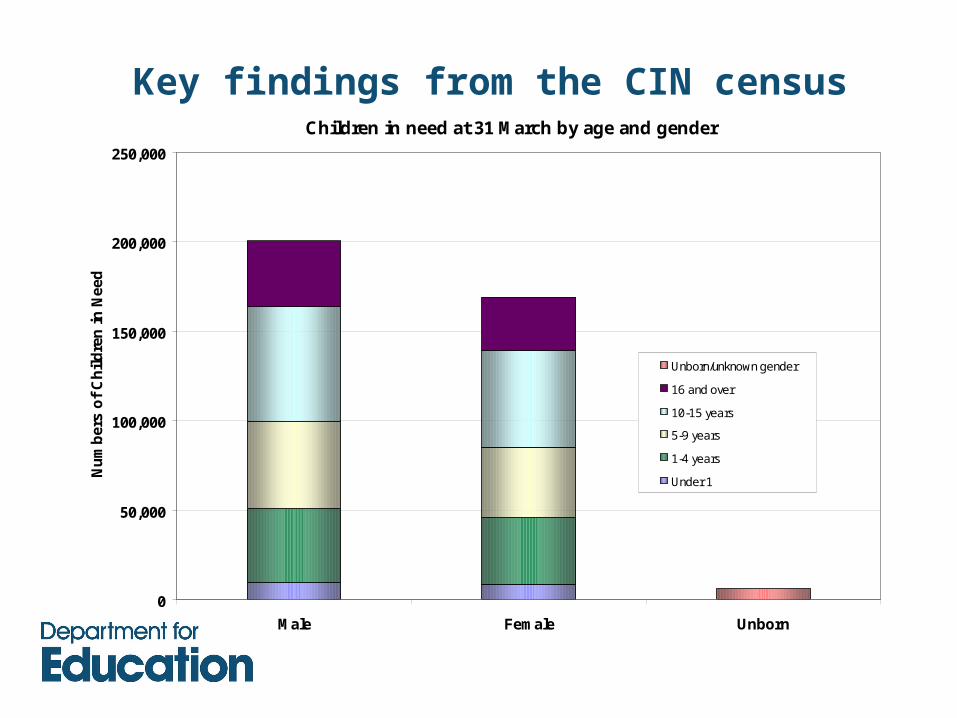
Key findings from the CIN censusChildren in need at 31 March by age and gender
0
50,000
100,000
150,000
200,000
250,000
Male Female Unborn
Nu
mb
ers
of
Ch
ild
ren
in
Nee
d
Unborn/unknown gender
16 and over
10-15 years
5-9 years
1-4 years
Under 1
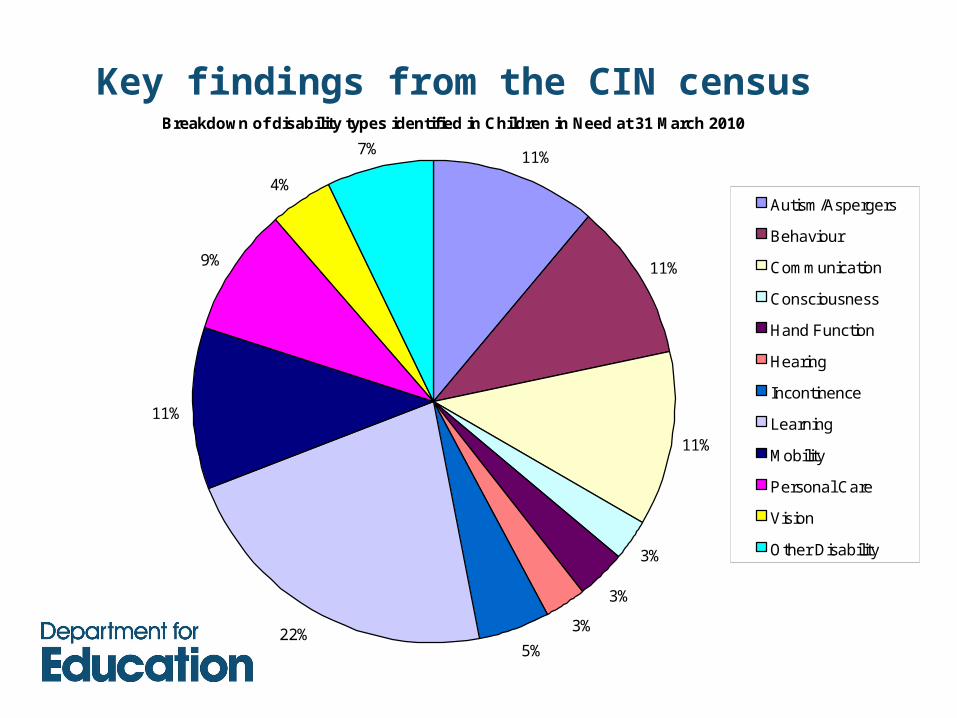
Key findings from the CIN censusBreakdown of disability types identified in Children in Need at 31 March 2010
11%
11%
11%
3%
3%
3%
5%22%
11%
9%
4%
7%
Autism/Aspergers
Behaviour
Communication
Consciousness
Hand Function
Hearing
Incontinence
Learning
Mobility
Personal Care
Vision
Other Disability
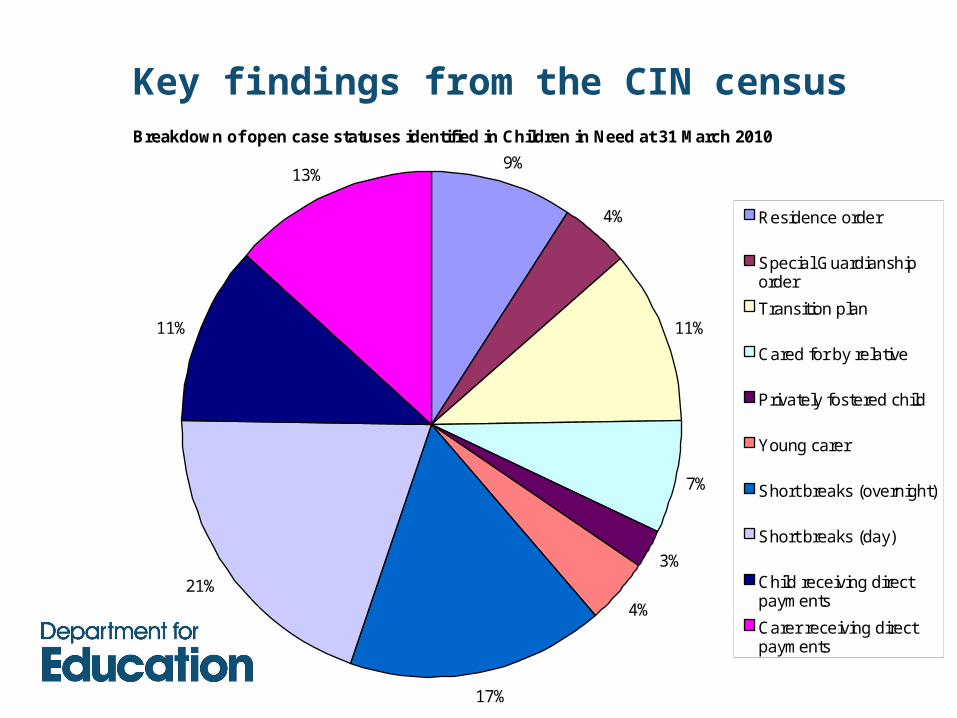
Key findings from the CIN censusBreakdown of open case statuses identified in Children in Need at 31 March 2010
9%
4%
11%
7%
3%
4%
17%
21%
11%
13%
Residence order
Special Guardianshiporder
Transition plan
Cared for by relative
Privately fostered child
Young carer
Short breaks (overnight)
Short breaks (day)
Child receiving directpayments
Carer receiving directpayments
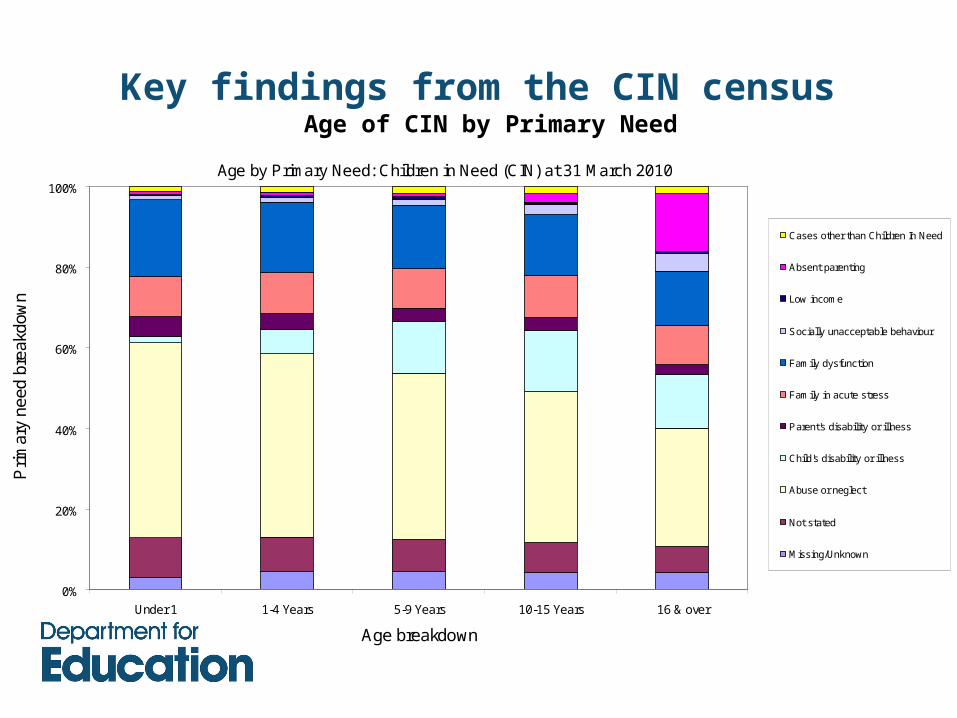
Key findings from the CIN census Age of CIN by Primary Need
Age by Primary Need: Children in Need (CIN) at 31 March 2010
0%
20%
40%
60%
80%
100%
Under 1 1-4 Years 5-9 Years 10-15 Years 16 & over
Age breakdown
Prim
ary
need
bre
akdo
wn
Cases other than Children In Need
Absent parenting
Low income
Socially unacceptable behaviour
Family dysfunction
Family in acute stress
Parent's disability or illness
Child's disability or illness
Abuse or neglect
Not stated
Missing/Unknown
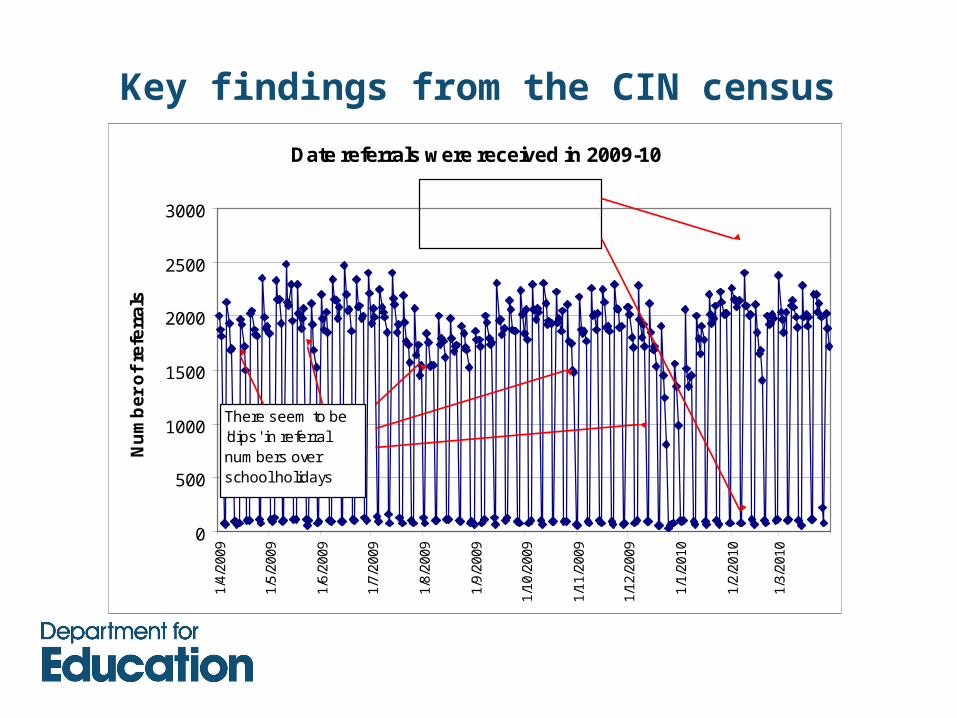
Key findings from the CIN census Date referrals were received in 2009-10
0
500
1000
1500
2000
2500
30001/
4/20
09
1/5/
2009
1/6/
2009
1/7/
2009
1/8/
2009
1/9/
2009
1/10
/200
9
1/11
/200
9
1/12
/200
9
1/1/
2010
1/2/
2010
1/3/
2010
Nu
mb
er
of
refe
rra
ls
There seem to be 'dips' in referral numbers over school holidays
Referral numbers peak on a Monday and fall on a Saturday and Sunday
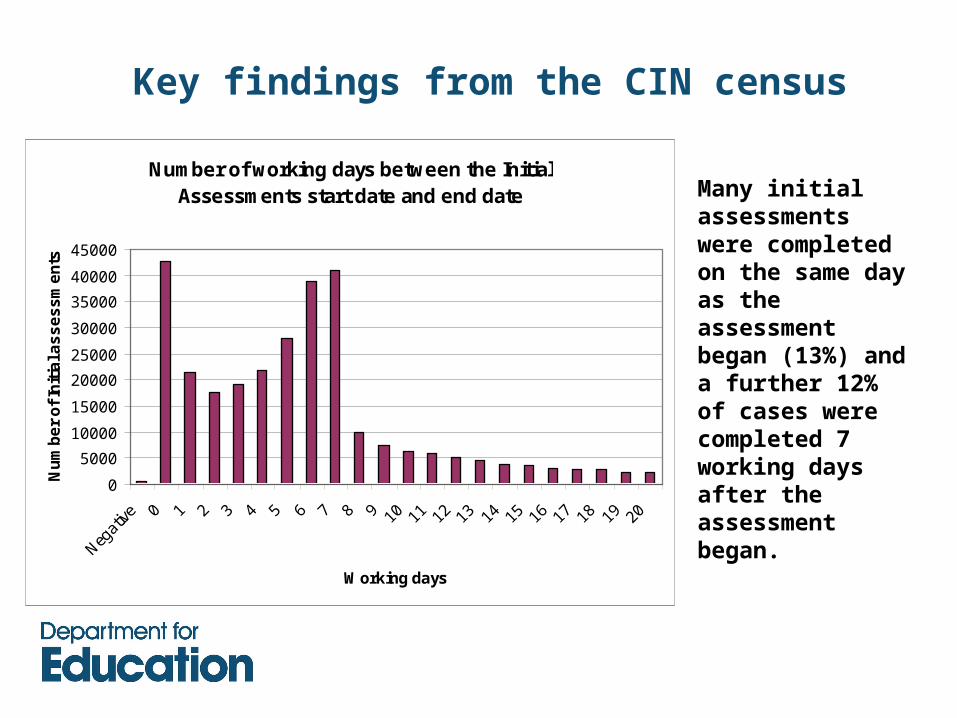
Key findings from the CIN census
Many initial assessments were completed on the same day as the assessment began (13%) and a further 12% of cases were completed 7 working days after the assessment began.
Number of working days between the Initial Assessments start date and end date
0
5000
10000
15000
20000
25000
30000
35000
40000
45000
Negat
ive 0 1 2 3 4 5 6 7 8 9 10 11 12 13 14 15 16 17 18 19 20
Working days
Nu
mb
er
of
Init
ial a
ss
es
sm
en
ts
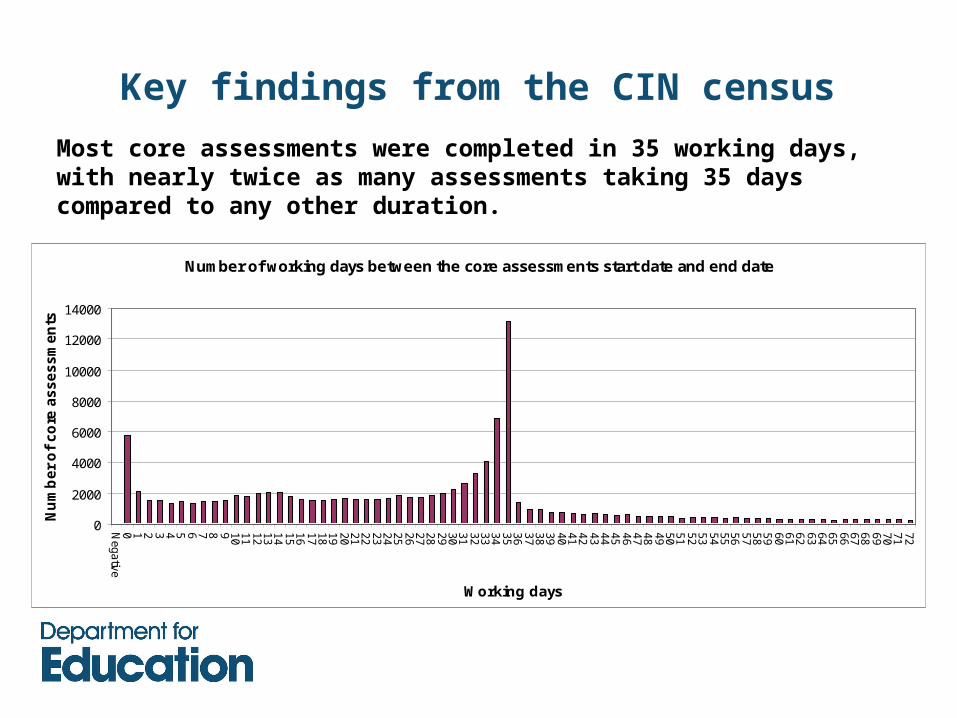
Key findings from the CIN census Most core assessments were completed in 35 working days, with nearly twice as many assessments taking 35 days compared to any other duration.
Number of working days between the core assessments start date and end date
0
2000
4000
6000
8000
10000
12000
14000
Negativ
e0 1 2 3 4 5 6 7 8 9 10
11
12
13
14
15
16
17
18
19
20
21
22
23
24
25
26
27
28
29
30
31
32
33
34
35
36
37
38
39
40
41
42
43
44
45
46
47
48
49
50
51
52
53
54
55
56
57
58
59
60
61
62
63
64
65
66
67
68
69
70
71
72
Working days
Nu
mb
er
of
co
re a
ss
es
sm
en
ts
Key findings from the CIN census
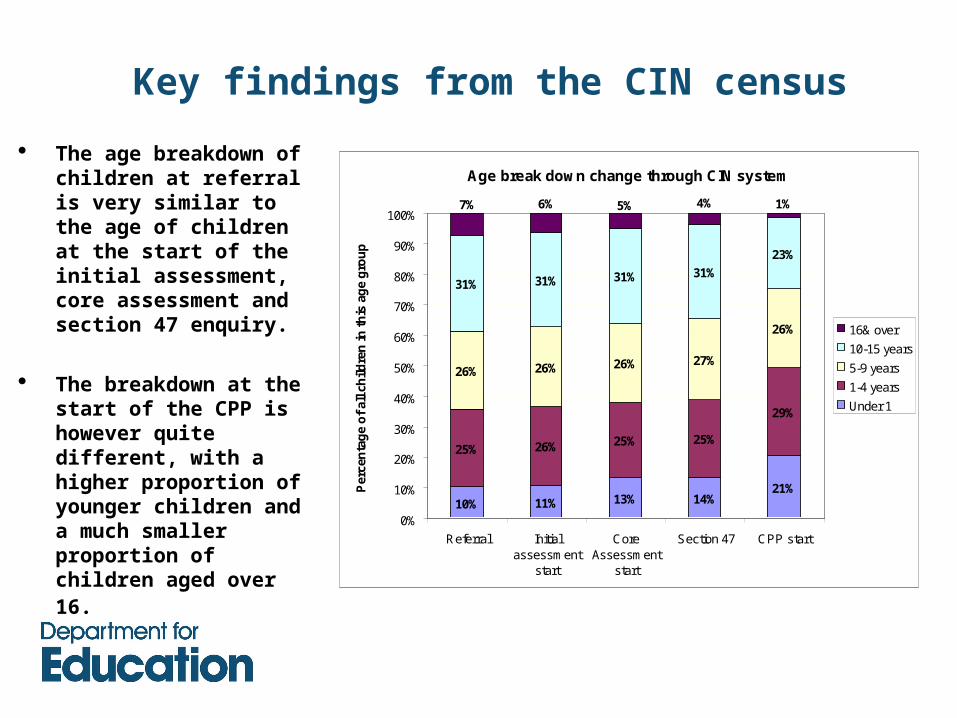
The age breakdown of children at referral is very similar to the age of children at the start of the initial assessment, core assessment and section 47 enquiry.
The breakdown at the start of the CPP is however quite different, with a higher proportion of younger children and a much smaller proportion of children aged over 16.
Age break down change through CIN system
10% 11% 13% 14%21%
25% 26% 25% 25%
29%
26% 26% 26% 27%
26%
31% 31% 31% 31%
23%
7% 6% 5% 4% 1%
0%
10%
20%
30%
40%
50%
60%
70%
80%
90%
100%
Referral Initialassessment
start
CoreAssessment
start
Section 47 CPP start
Per
cen
tag
e o
f al
l ch
ildre
n in
th
is a
ge
gro
up
16& over
10-15 years
5-9 years
1-4 years
Under 1
Key findings from the CIN census
0
20000
40000
60000
80000
100000
120000
Apr-0
9
May
-09
Jun-
09
Jul-0
9
Aug-0
9
Sep-0
9
Oct-09
Nov-09
Dec-09
Jan-
10
Feb-1
0
Mar
-10
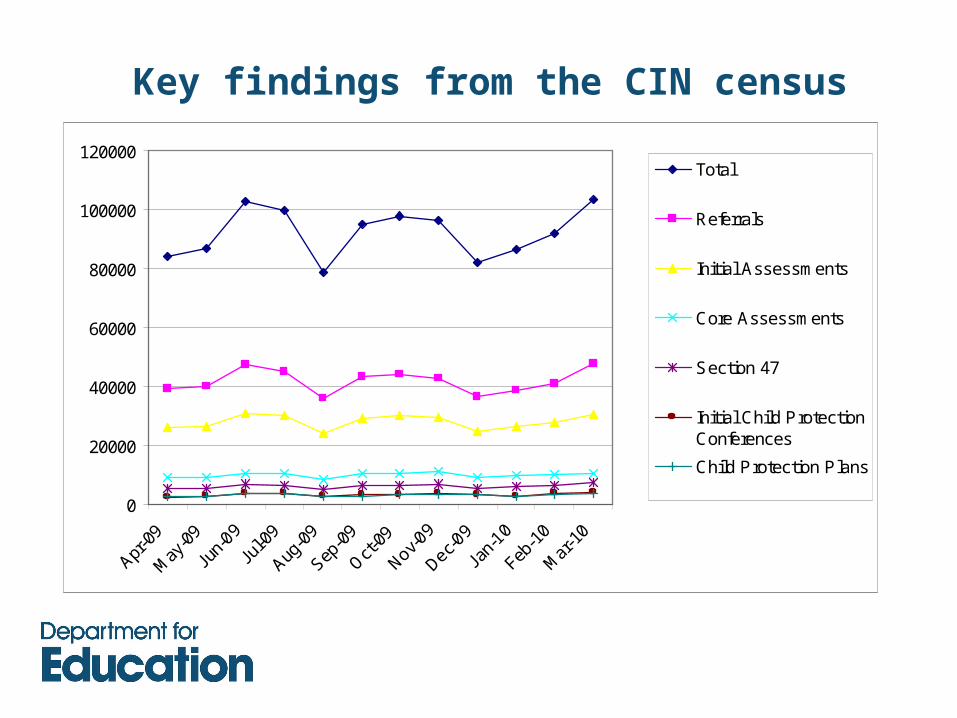
Total
Referrals
Initial Assessments
Core Assessments
Section 47
Initial Child ProtectionConferences
Child Protection Plans
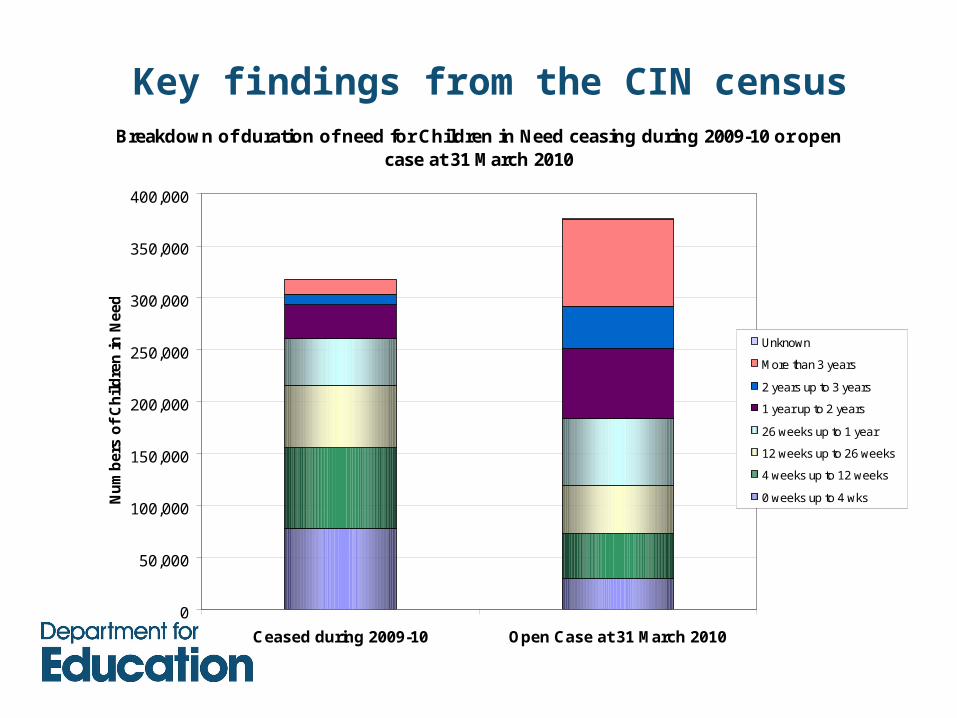
Key findings from the CIN censusBreakdown of duration of need for Children in Need ceasing during 2009-10 or open
case at 31 March 2010
0
50,000
100,000
150,000
200,000
250,000
300,000
350,000
400,000
Ceased during 2009-10 Open Case at 31 March 2010
Nu
mb
ers
of
Ch
ild
ren
in
Nee
d
Unknown
More than 3 years
2 years up to 3 years
1 year up to 2 years
26 weeks up to 1 year
12 weeks up to 26 weeks
4 weeks up to 12 weeks
0 weeks up to 4 wks
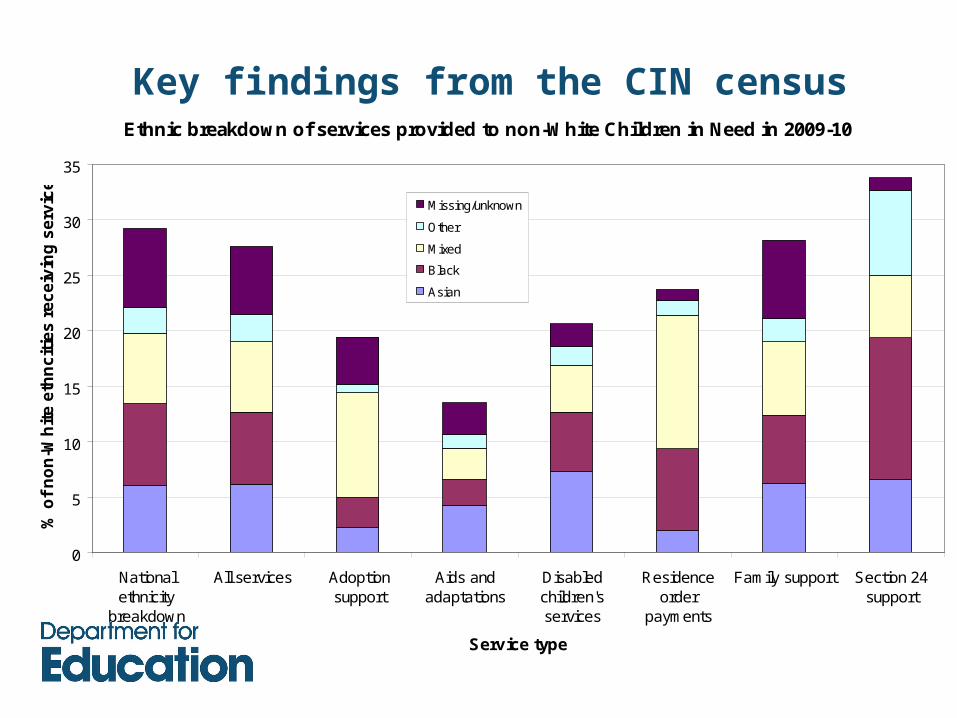
Key findings from the CIN censusEthnic breakdown of services provided to non-White Children in Need in 2009-10
0
5
10
15
20
25
30
35
Nationalethnicity
breakdown
All services Adoptionsupport
Aids andadaptations
Disabledchildren'sservices
Residenceorder
payments
Family support Section 24support
Service type
% o
f n
on
-Wh
ite
eth
nc
itie
s r
ec
eiv
ing
se
rvic
e
Missing/unknown
Other
Mixed
Black
Asian
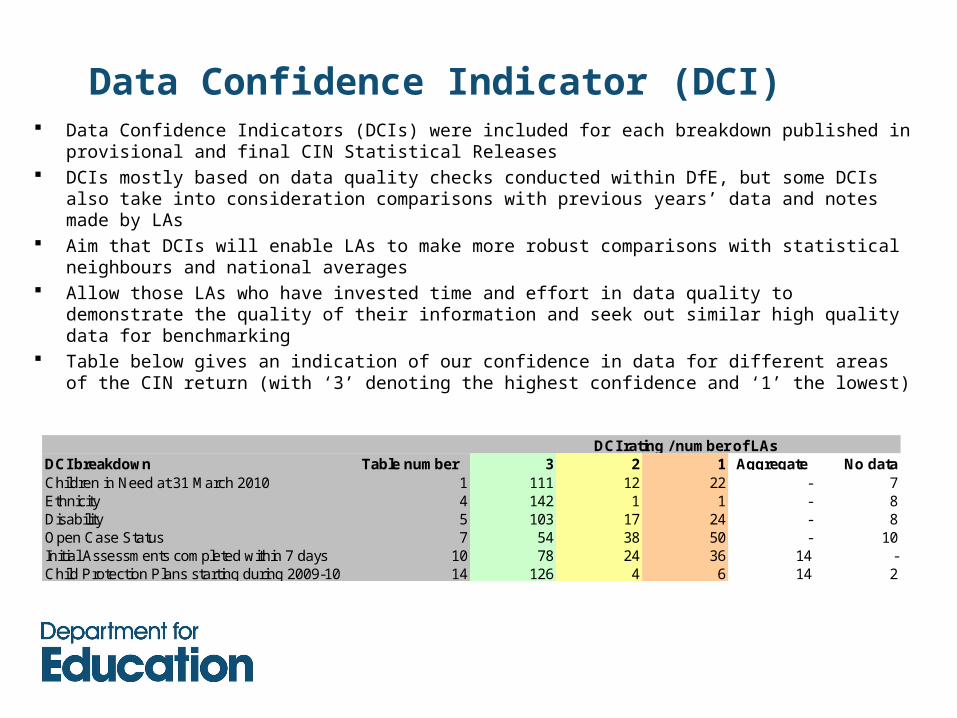
Data Confidence Indicator (DCI) Data Confidence Indicators (DCIs) were included for each breakdown published in
provisional and final CIN Statistical Releases DCIs mostly based on data quality checks conducted within DfE, but some DCIs also
take into consideration comparisons with previous years’ data and notes made by LAs Aim that DCIs will enable LAs to make more robust comparisons with statistical
neighbours and national averages Allow those LAs who have invested time and effort in data quality to demonstrate the
quality of their information and seek out similar high quality data for benchmarking Table below gives an indication of our confidence in data for different areas of the CIN
return (with ‘3’ denoting the highest confidence and ‘1’ the lowest)
DCI breakdown Table number 3 2 1 Aggregate No dataChildren in Need at 31 March 2010 1 111 12 22 - 7Ethnicity 4 142 1 1 - 8Disability 5 103 17 24 - 8Open Case Status 7 54 38 50 - 10Initial Assessments completed within 7 days 10 78 24 36 14 -Child Protection Plans starting during 2009-10 14 126 4 6 14 2
DCI rating / number of LAs
CIN census review
The ultimate aim of the CIN review was to compare costs and burdens of completing the CIN census against the value of the resulting data, allowing for improvements that can feasibly be made, with a view to informing a decision on the future life of the collection
CIN census review Steering Group established including data users and providers; LA reps, IT specialists, Ofsted, charities, external researchers, DfE analysis, DfE policy
Steering Group discussions have included establishing the evidence base, estimating the average LA costs (c£26k) and identifying areas of census which place greatest burden on LAs and DfE.
Final recommendations for 2010-11 and future years have been agreed by Steering Group and are awaiting Ministerial approval.
Terms of reference and Steering Group meeting minutes available at:
http://www.education.gov.uk/researchandstatistics/childrenandyoungpeople/cincensus/a0013657/children-in-need-cin-census
Further analysis: matching projects
Matching to 2008-09 CIN census (January 2011): Looked at whether data in 2009-10 is comparable with 2008-09 (e.g. do
children referred before 1 April 2009 appear in 2008-09 with the same date of birth). Found that the data are not yet consistent enough to allow robust longitudinal analysis.
Matching to 2009-10 LAC (January 2011): Improved matching rate from 76% (of LAC at 31 March 2009) to 79%
(of LAC at 31 March 2010). These matching rates were shared with LAs.
Matching to 2009/10 NPD (by March 2011): Aiming to improve UPN prevalence from 82% and matching rate from
70% in 2008-09 (for 4-16 year olds). Aim to disseminate national and local matching rates, characteristics, attainment and absence levels of CIN.