Embed Size (px)
Citation preview
1
SSL Pricing and Efficacy Trend Analysis for
Utility Program Planning
Jason Tuenge
Pacific Northwest National Laboratory Cost Effectiveness—Utility Perspective November 13, 2013
DOE SSL Market Introduction Workshop
2
Background
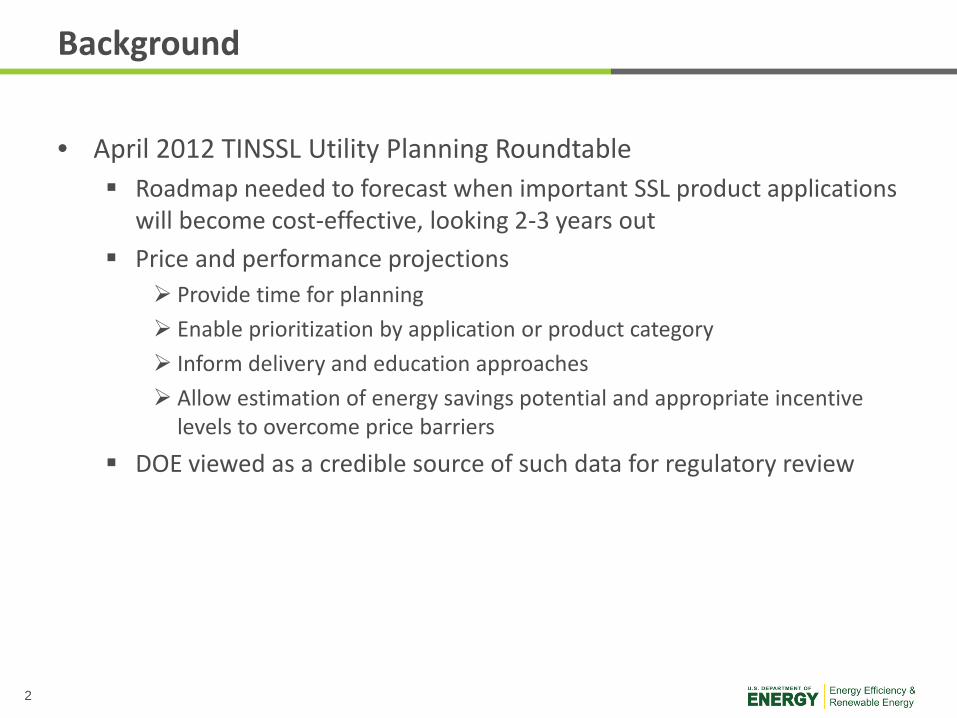
• April 2012 TINSSL Utility Planning Roundtable Roadmap needed to forecast when important SSL product applications
will become cost-effective, looking 2-3 years out Price and performance projections
Provide time for planning Enable prioritization by application or product category Inform delivery and education approaches Allow estimation of energy savings potential and appropriate incentive
levels to overcome price barriers DOE viewed as a credible source of such data for regulatory review
3
Background
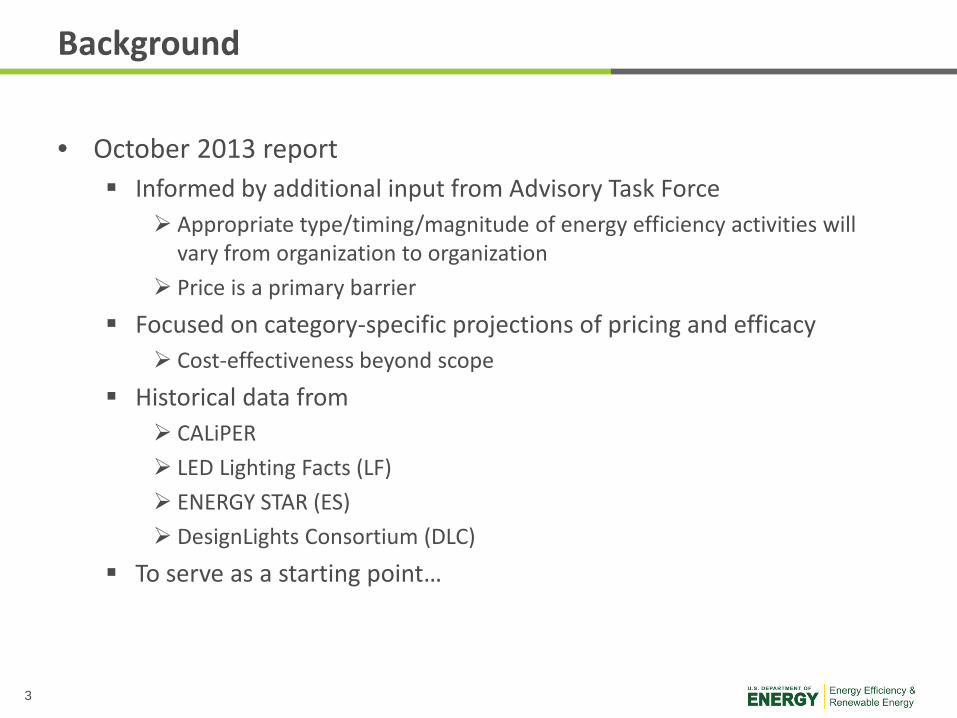
• October 2013 report Informed by additional input from Advisory Task Force
Appropriate type/timing/magnitude of energy efficiency activities will vary from organization to organization
Price is a primary barrier Focused on category-specific projections of pricing and efficacy
Cost-effectiveness beyond scope Historical data from
CALiPER LED Lighting Facts (LF) ENERGY STAR (ES) DesignLights Consortium (DLC)
To serve as a starting point…
4
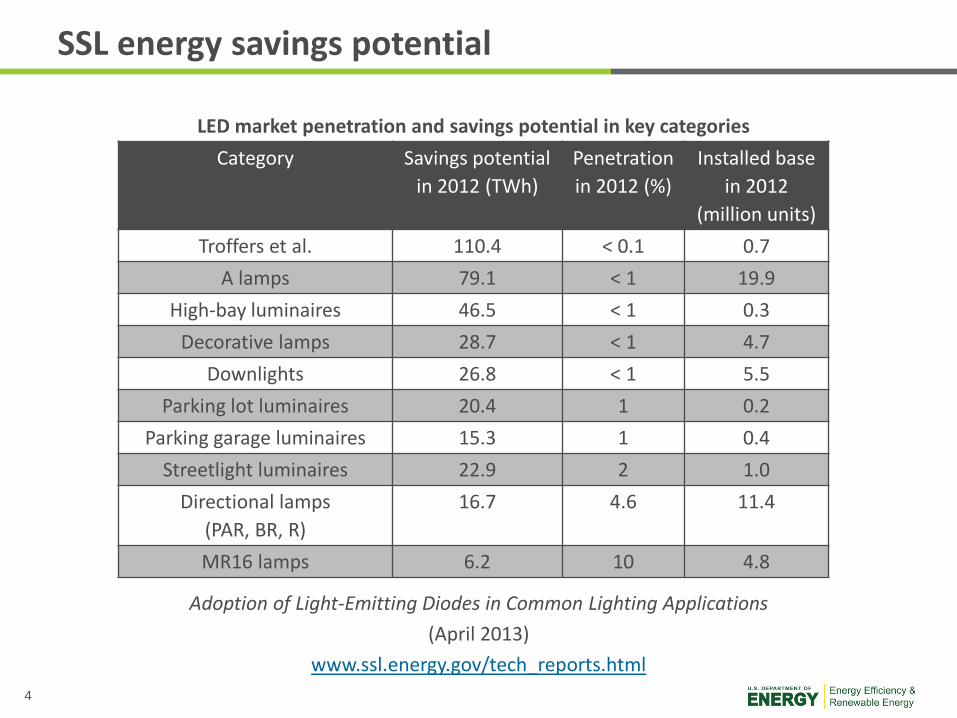
SSL energy savings potential
LED market penetration and savings potential in key categories Category Savings potential
in 2012 (TWh) Penetration in 2012 (%)
Installed base in 2012
(million units) Troffers et al. 110.4 < 0.1 0.7
A lamps 79.1 < 1 19.9 High-bay luminaires 46.5 < 1 0.3
Decorative lamps 28.7 < 1 4.7 Downlights 26.8 < 1 5.5
Parking lot luminaires 20.4 1 0.2 Parking garage luminaires 15.3 1 0.4
Streetlight luminaires 22.9 2 1.0 Directional lamps
(PAR, BR, R) 16.7 4.6 11.4
MR16 lamps 6.2 10 4.8
Adoption of Light-Emitting Diodes in Common Lighting Applications (April 2013)
www.ssl.energy.gov/tech_reports.html
5
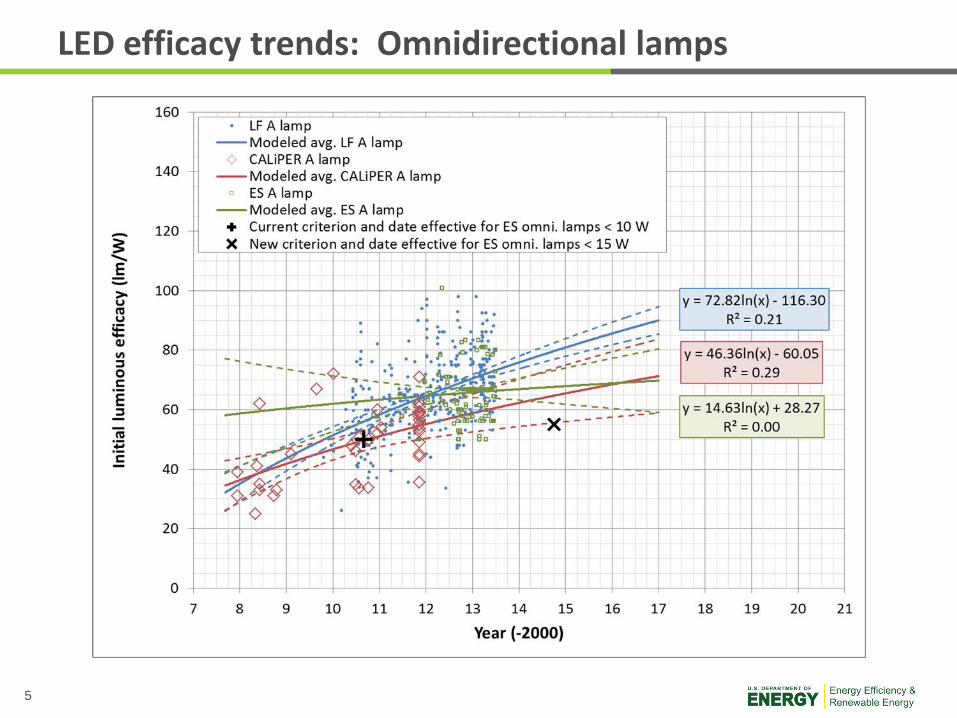
LED efficacy trends: Omnidirectional lamps
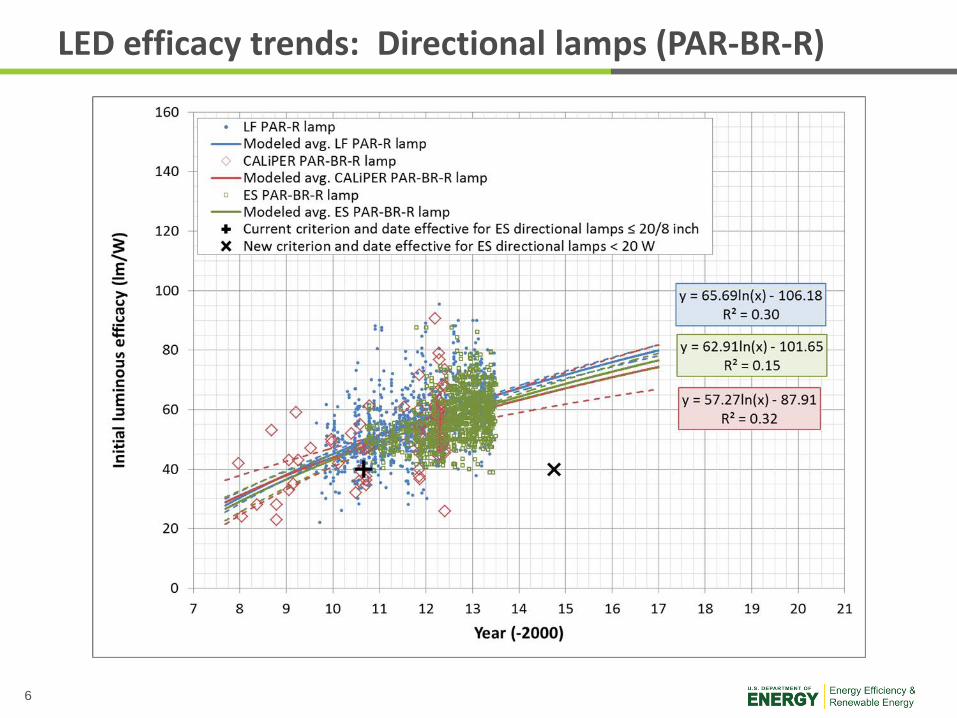
6
LED efficacy trends: Directional lamps (PAR-BR-R)
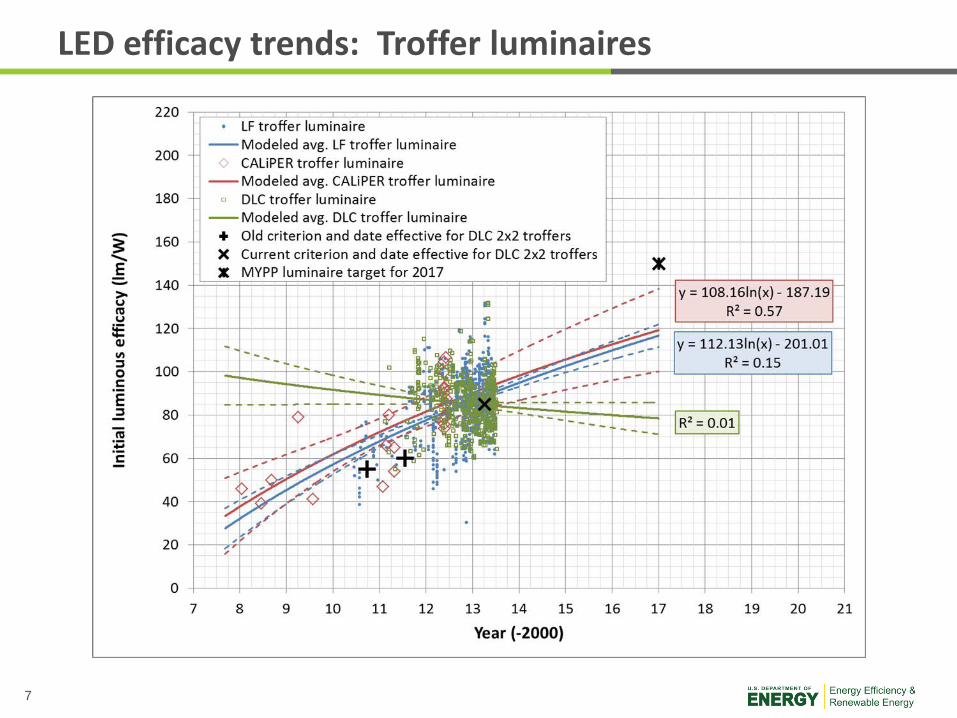
7
LED efficacy trends: Troffer luminaires
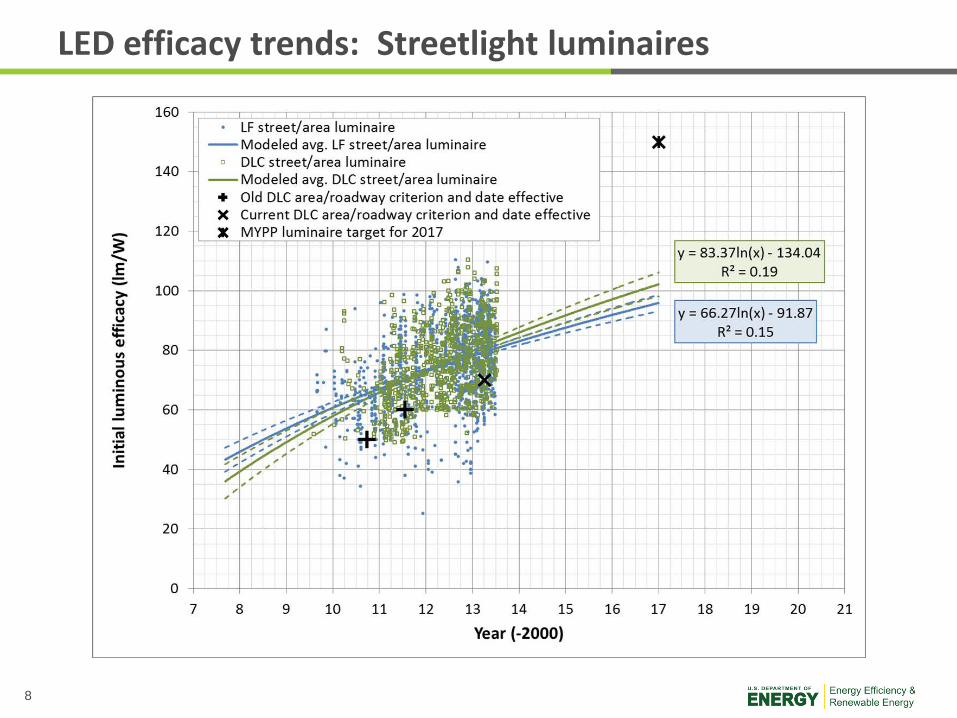
8
LED efficacy trends: Streetlight luminaires
9
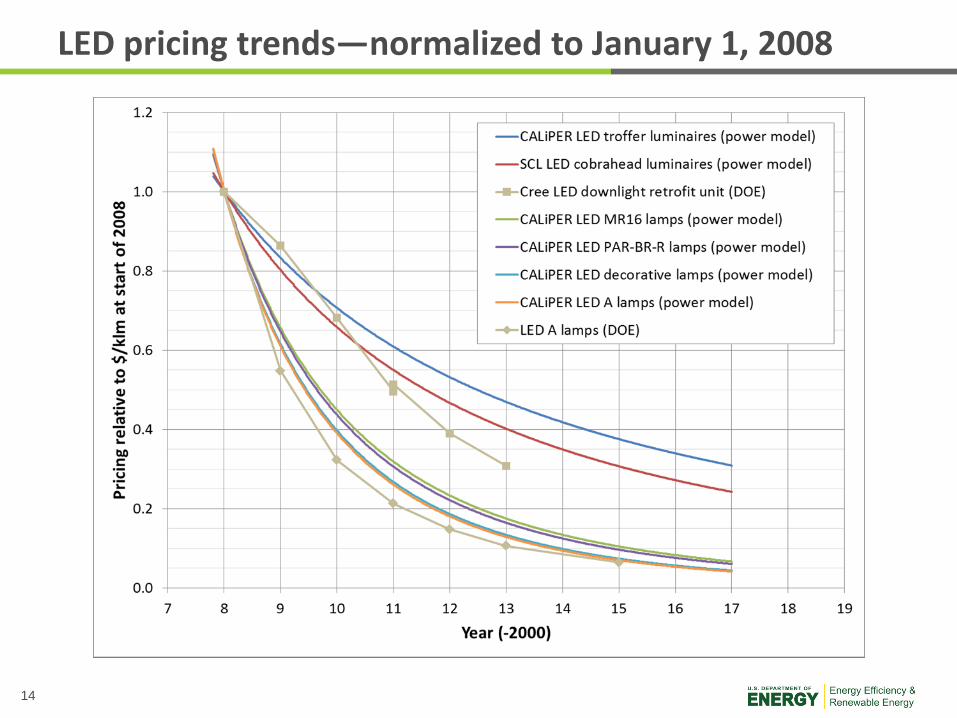
LED pricing trends
• Scoured CALiPER data for product categories meeting criteria Substantial number of models for which purchase date, purchase
price, and measured lumens could be determined Rated life was not considered in this analysis
Purchases dispersed fairly well over time Substantial span between oldest and most recent
• CALiPER datasets meeting criteria Omnidirectional lamps Decorative lamps Directional lamps (PAR-BR-R and MR16) Troffer luminaires
• Supplemented by Seattle City Light (SCL) streetlight luminaires • Projections using least-squares regression fits to power
mathematical models based on historical product data
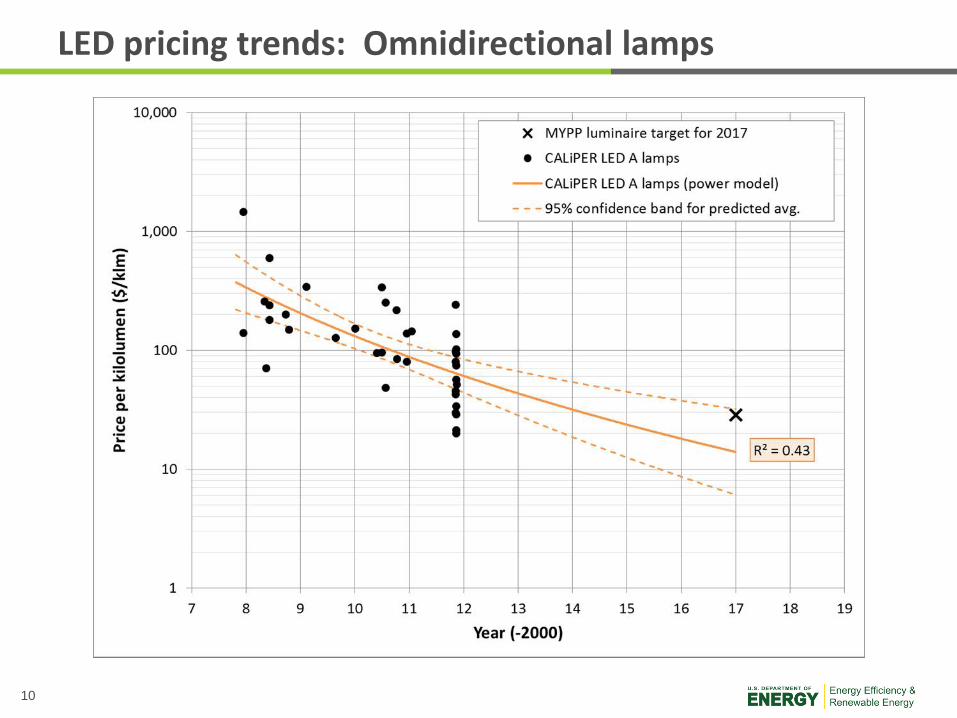
10
LED pricing trends: Omnidirectional lamps
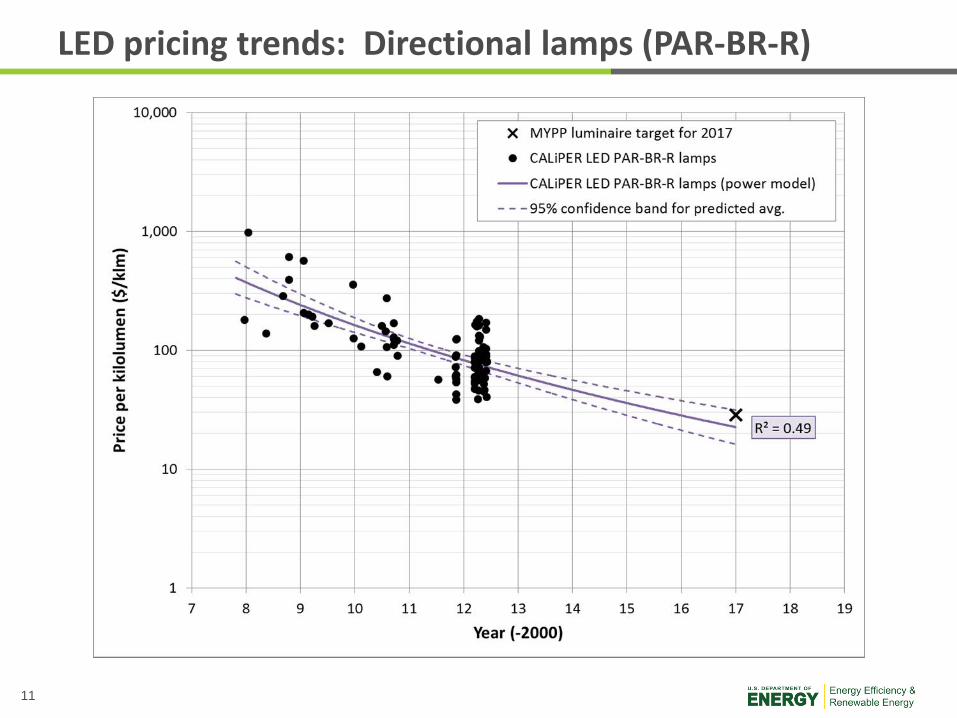
11
LED pricing trends: Directional lamps (PAR-BR-R)
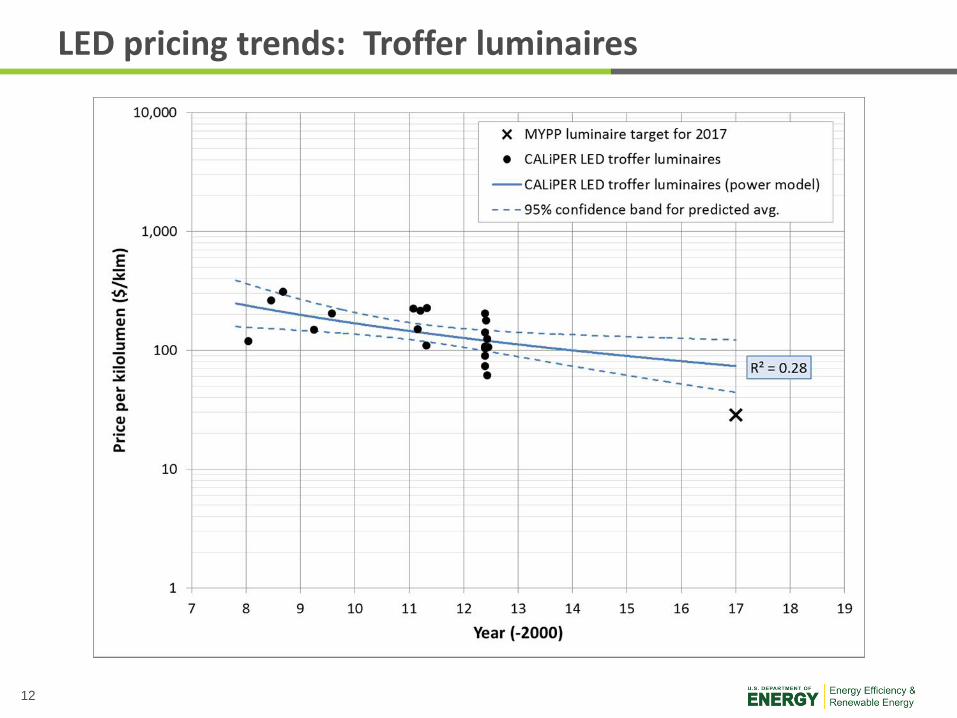
12
LED pricing trends: Troffer luminaires
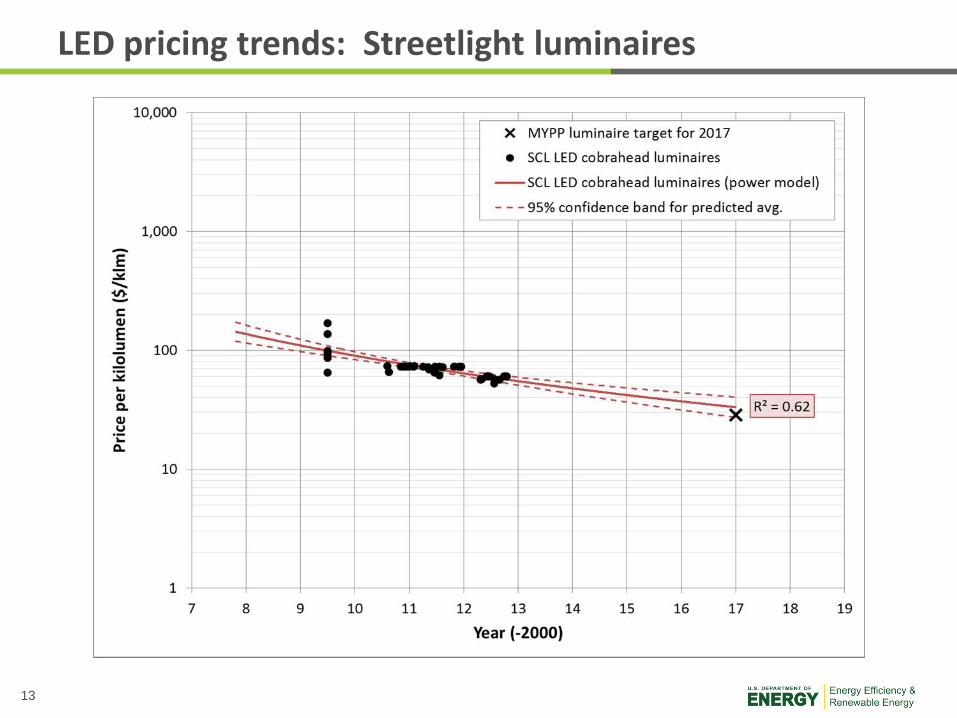
13
LED pricing trends: Streetlight luminaires
14
LED pricing trends—normalized to January 1, 2008
15
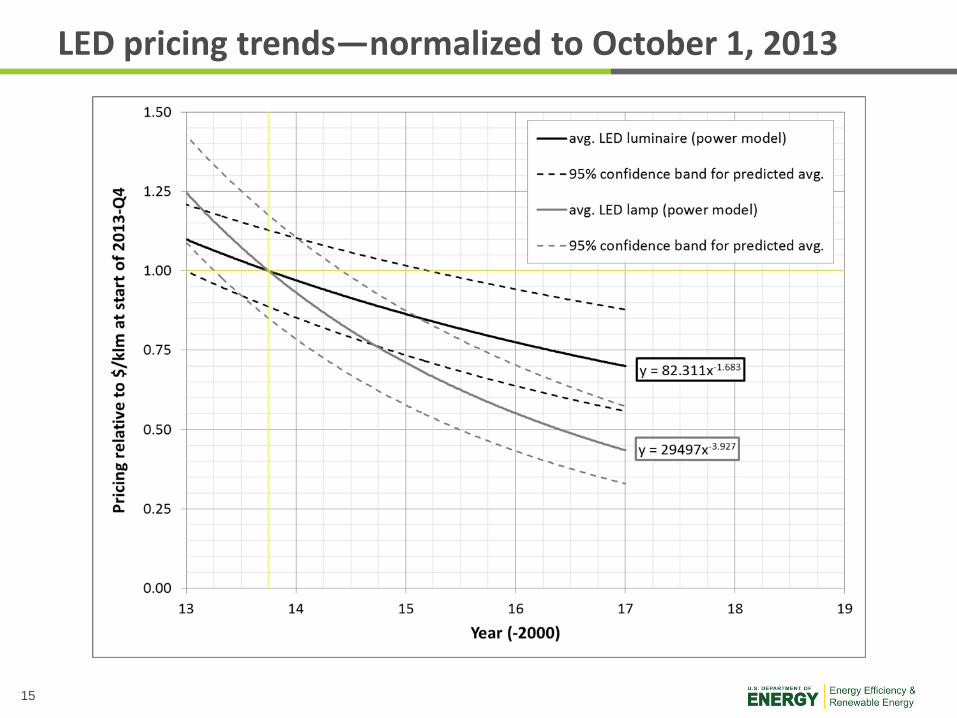
LED pricing trends—normalized to October 1, 2013
16
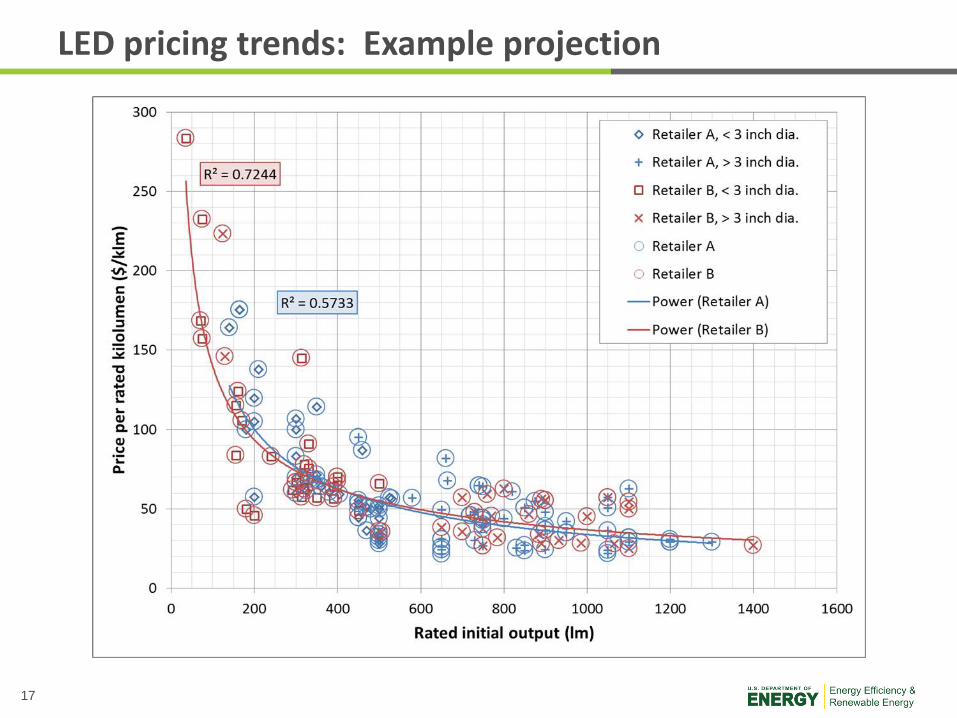
LED pricing trends: Example projection
• September 2013 LED directional lamp pricing from major retailers Ace Hardware, Best Buy, The Home Depot, Lowe’s, Sears, True Value
No adjustment for possible upstream incentives Cree, EcoSmart, Feit, GE, Insignia, LSGC, Philips, Samsung, Sylvania,
Utilitech, and TCP CCT of 2700-3000 K CRI and ENERGY STAR certification not consistently indicated Strong relationship between price and output—and diameter
Similar relationship observed for omnidirectional and decorative
17
LED pricing trends: Example projection
18
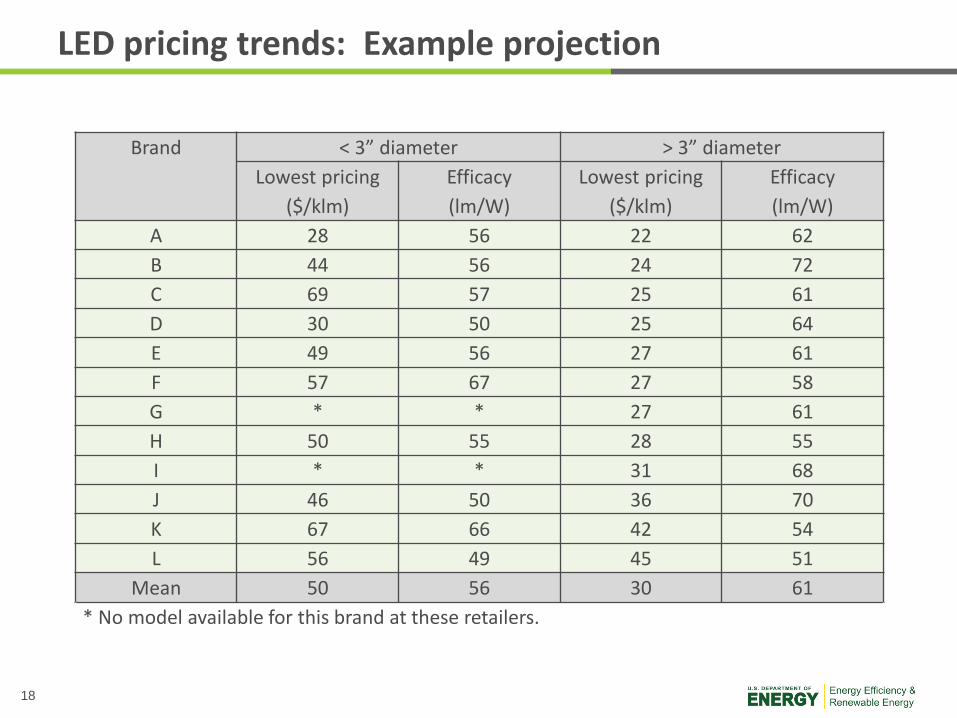
LED pricing trends: Example projection
Brand < 3” diameter > 3” diameter Lowest pricing
($/klm) Efficacy (lm/W)
Lowest pricing ($/klm)
Efficacy (lm/W)
A 28 56 22 62 B 44 56 24 72 C 69 57 25 61 D 30 50 25 64 E 49 56 27 61 F 57 67 27 58 G * * 27 61 H 50 55 28 55 I * * 31 68 J 46 50 36 70 K 67 66 42 54 L 56 49 45 51
Mean 50 56 30 61 * No model available for this brand at these retailers.
19
LED pricing trends: Example projection
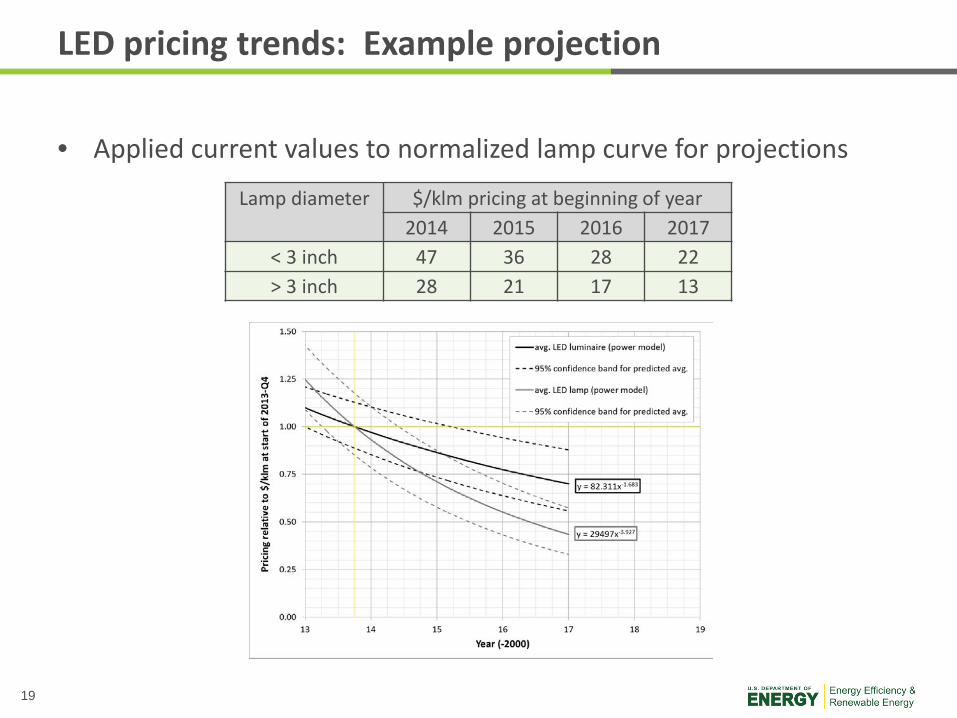
Lamp diameter $/klm pricing at beginning of year 2014 2015 2016 2017
< 3 inch 47 36 28 22 > 3 inch 28 21 17 13
• Applied current values to normalized lamp curve for projections
20
Key findings
• Projected average efficacies are below 2017 targets, but leading products might still reach these goals on or ahead of schedule
• In several key LED product categories, projected efficacies based on LED Lighting Facts listings are substantially higher than projections based on the corresponding ENERGY STAR or DLC listings
• Historical data indicates two distinct normalized curves—one for LED lamps, and one for LED luminaires—can be used to make projections from current $/klm pricing for a given product category
• LED lamp $/klm pricing is expected to decrease roughly 55% by 2017, relative to current pricing—a more modest decrease of 30% is projected for LED luminaires over this same period
21
End of slides
Thank you!