Embed Size (px)
Citation preview
SSI Data Collection Collaborative Workshop Report
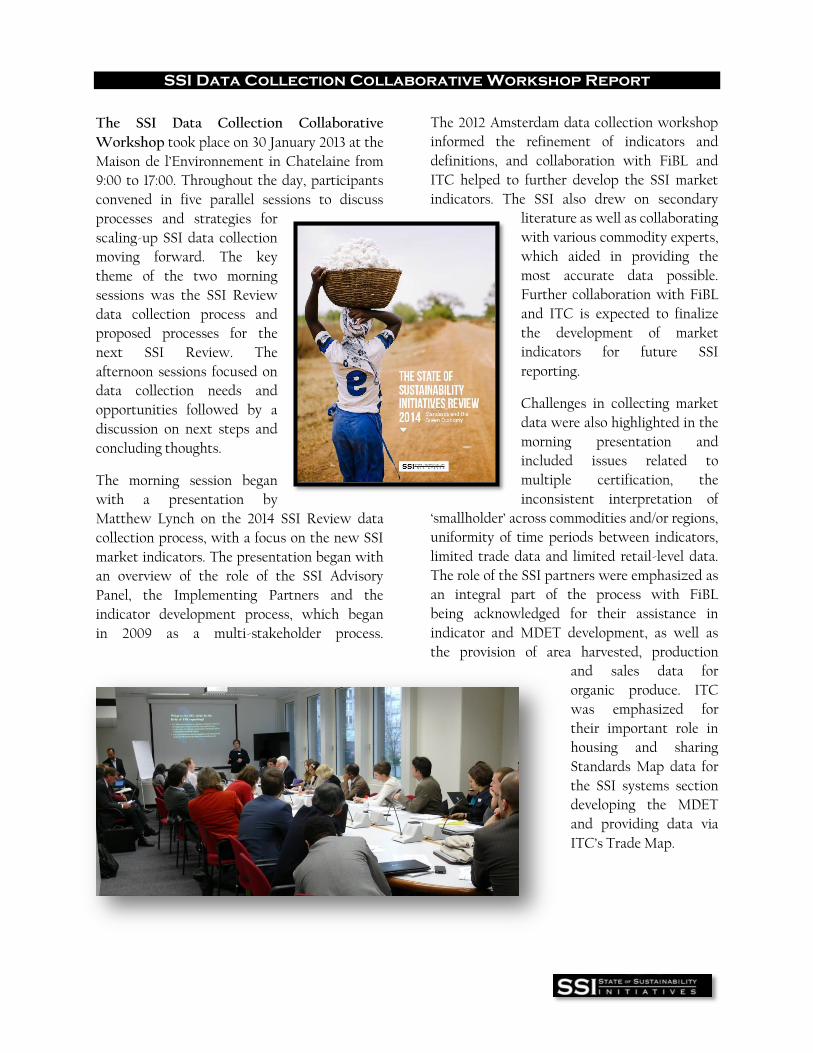
The SSI Data Collection Collaborative
Workshop took place on 30 January 2013 at the
Maison de l’Environnement in Chatelaine from
9:00 to 17:00. Throughout the day, participants
convened in five parallel sessions to discuss
processes and strategies for
scaling-up SSI data collection
moving forward. The key
theme of the two morning
sessions was the SSI Review
data collection process and
proposed processes for the
next SSI Review. The
afternoon sessions focused on
data collection needs and
opportunities followed by a
discussion on next steps and
concluding thoughts.
The morning session began
with a presentation by
Matthew Lynch on the 2014 SSI Review data
collection process, with a focus on the new SSI
market indicators. The presentation began with
an overview of the role of the SSI Advisory
Panel, the Implementing Partners and the
indicator development process, which began
in 2009 as a multi-stakeholder process.
The 2012 Amsterdam data collection workshop
informed the refinement of indicators and
definitions, and collaboration with FiBL and
ITC helped to further develop the SSI market
indicators. The SSI also drew on secondary
literature as well as collaborating
with various commodity experts,
which aided in providing the
most accurate data possible.
Further collaboration with FiBL
and ITC is expected to finalize
the development of market
indicators for future SSI
reporting.
Challenges in collecting market
data were also highlighted in the
morning presentation and
included issues related to
multiple certification, the
inconsistent interpretation of
‘smallholder’ across commodities and/or regions,
uniformity of time periods between indicators,
limited trade data and limited retail-level data.
The role of the SSI partners were emphasized as
an integral part of the process with FiBL
being acknowledged for their assistance in
indicator and MDET development, as well as
the provision of area harvested, production
and sales data for
organic produce. ITC
was emphasized for
their important role in
housing and sharing
Standards Map data for
the SSI systems section
developing the MDET
and providing data via
ITC’s Trade Map.
SSI Data Collection Collaborative Workshop Report
The second half of the presentation
highlighted the SSI’s commitment to
streamlining the data collection process
moving forward. Further refinement of
ITC’s Data Entry Tool (DET) will result in
more streamlined data-entry and
management, and a centralized platform in
conjunction with Standards Map and Trade
Map. The SSI is committed to the
improvement of SSI data collection
processes by increased alignment with ITC
and ISEAL, a deeper understanding of field-level impacts, and a continued open collaboration in the data
collection processes.
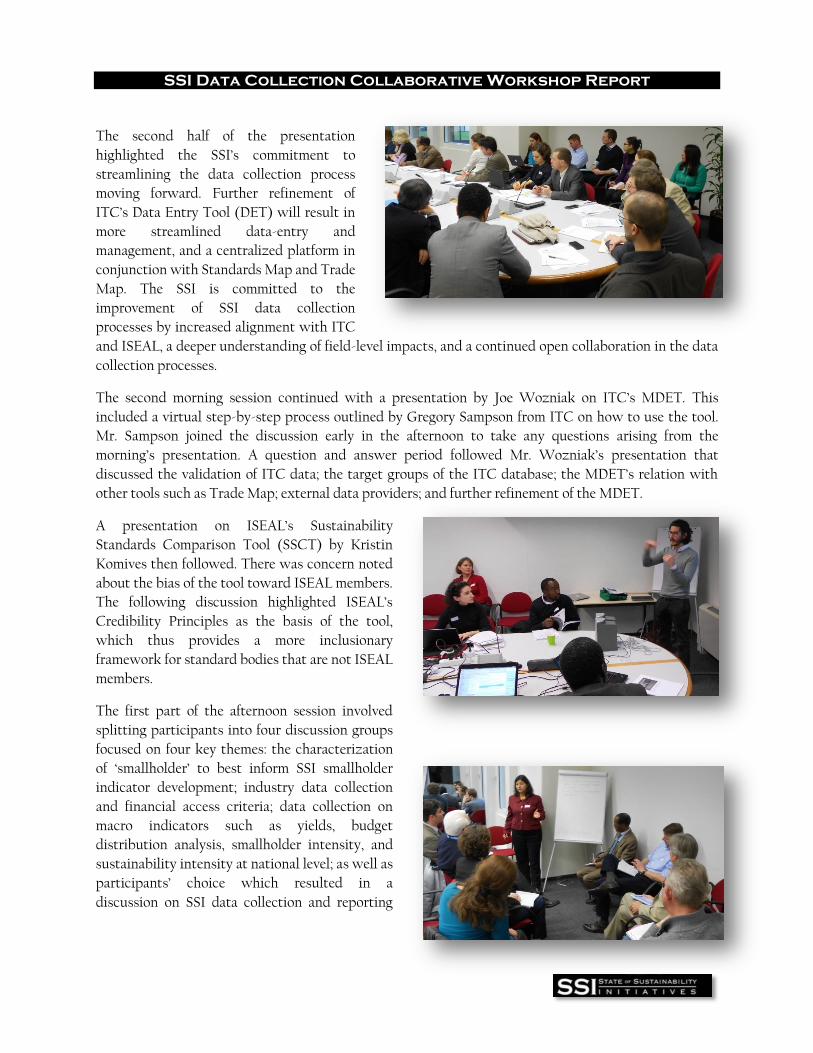
The second morning session continued with a presentation by Joe Wozniak on ITC’s MDET. This
included a virtual step-by-step process outlined by Gregory Sampson from ITC on how to use the tool.
Mr. Sampson joined the discussion early in the afternoon to take any questions arising from the
morning’s presentation. A question and answer period followed Mr. Wozniak’s presentation that
discussed the validation of ITC data; the target groups of the ITC database; the MDET’s relation with
other tools such as Trade Map; external data providers; and further refinement of the MDET.
A presentation on ISEAL’s Sustainability
Standards Comparison Tool (SSCT) by Kristin
Komives then followed. There was concern noted
about the bias of the tool toward ISEAL members.
The following discussion highlighted ISEAL’s
Credibility Principles as the basis of the tool,
which thus provides a more inclusionary
framework for standard bodies that are not ISEAL
members.
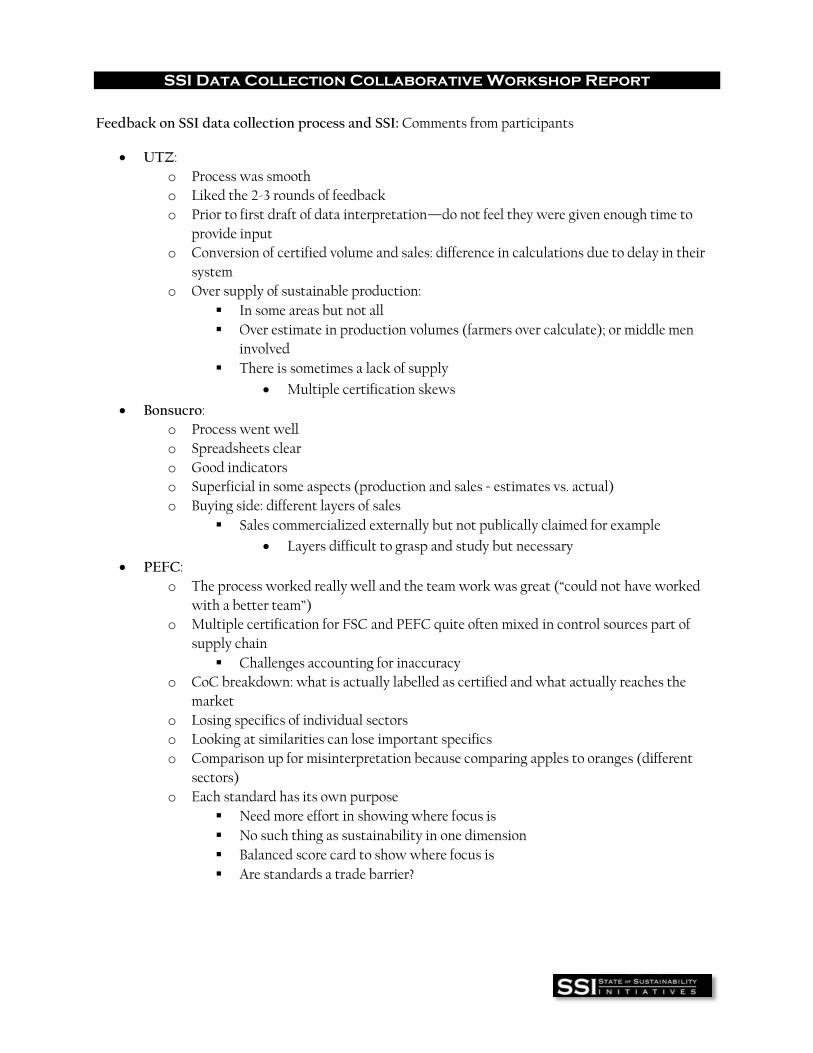
The first part of the afternoon session involved
splitting participants into four discussion groups
focused on four key themes: the characterization
of ‘smallholder’ to best inform SSI smallholder
indicator development; industry data collection
and financial access criteria; data collection on
macro indicators such as yields, budget
distribution analysis, smallholder intensity, and
sustainability intensity at national level; as well as
participants’ choice which resulted in a
discussion on SSI data collection and reporting

SSI Data Collection Collaborative Workshop Report
gaps. Each group was given a little over an hour
to discuss how best to refine indicators and/or
data collection processes with respect to each
theme with the aim at improving SSI data
collection processes for future reporting. All
participants then reconvened in the second half
of the afternoon session to discuss key points
that had stemmed from each group discussion.
Based on the three indicators proposed by the
SSI team for best determining a set of high level
macro indicators for smallholder data collection
that could better reflect whether VSSs are
reaching those most in need, specifically number
of farmers, number of hectares and volumes
produced, the first discussion group noted that
number of farmers is difficult to determine given
that smallholder farmers are typically
certified/verified by groups or cooperative.
Measuring volumes produced can also be
problematic for commodities such as forestry. It
was determined that labour model and level of
mechanization are important factors in
characterizing what it means to be a
smallholder, with commodity also being an
influential factor.
The second discussion group investigated the
incentives and disincentives associated with the
private sector sharing data related to sustainable
development reporting and sustainable product
sourcing. Specific industry indicators were then
discussed along with the challenges associated
with collecting data on these indicators.
Indicators included total volume of sustainable
product sourced and per cent premiums, both of
which were viewed as challenging with respect
to issues of competition and additional incurred
cost to the data provider. The discussion group
also focused on the issue of the shortage of
economic information regarding the financial
needs of certificate holders. The development of
appropriate financial access criteria to better
enable financial institutions to make long-term
investments is needed in order to achieve
economic sustainability for certificate holders. It
was suggested that financial institutions invest
in increased productivity resulting in SMEs
being better placed to repay loans.
The data collection on macro indicators group
discussed the option of building a more
comprehensive data reporting strategy for the
SSI’s existing indicators rather than attempting
to collect and present data on indicators that
involve a number of challenging variables, such
as yields. The collection of time-series data for

SSI Data Collection Collaborative Workshop Report
existing indicators was proposed, along with
the availability of a detailed description of data
collection processes by the standard bodies.
Additionally, the group considered the potential
for the SSI to collect data on the portion of sales
that occurs through segregated, mass-balance,
and book and claim supply chains, accompanied
by notable trends and an explanation of each
systems’ processes.
The fourth discussion group discussed
clarification of the intended audience of the SSI.
Currently it was argued that the SSI targets
those who already know about the VSSs, and
not necessarily the general public. The Review
was noted to be too dense and too detailed but
not ideal for specifics. It was suggested that
people are more interested in impacts, which is
not of focus for the SSI. However, it should be
noted that although field impact is important it
is not necessarily the most important factor in
determining the sustainability impact of
standards. Some standards can have high field
impact but lower market reach or alternatively
low field impact with high market reach. Micro
level impacts do not necessarily provide the
answers to how sustainability standards impact
sustainable development on a global scale.
Participants in this group also noted that they
would like to see more of a focus on consumer
markets, and there was a general consensus on
SSI commodity focused reports.
The afternoon session wrapped up with a
consensus on the importance of face to face
discussions and online dialogue for the
continuation and improvement of SSI data
collection processes. Continued dialogue
through open forum is welcomed, maintaining
awareness of how indicators are interpreted and
the benefits associated with the diversity of
voluntary sustainability initiatives.
Please see Appendix I for more detailed
minutes of the workshop.
The SSI team is grateful to everyone who attended and participated in the workshop, and we are committed
to incorporating your suggestions and comments into our data collection processes moving forward into 2015
and beyond.
This workshop was made possible with the support from our donors (The Swiss State
Secretariat for Economic Affairs (SECO), Entwined and UK AID) and the SSI implementing
partners (International Institute for Sustainable Development, International Institute for
Environment and Development, Finance Alliance for Sustainable Trade, ENTWINED Research
Consortium, and the Sustainable Trade Initiative).

SSI Data Collection Collaborative Workshop Report
Appendix I: SSI Data Collection Collaborate Workshop Minutes
Morning Data Collection Processes Discussion: Comments from participants
Indicators need to take on a common approach
Important to identify right stakeholders
Going beyond measuring footprint and what does that mean for moving forward
Data collection for smallholders is a burden
o Difficult to implement on supply side
o Misinterpretation of tropical countries
o Long term impacts for farmers – too many certificates
Remember, data is coming from farmers!
Methodology for measuring impacts
o Definition of sustainable
Indicators vary considerably producing different results
Audits: info not good across the board, so not good for impact assessment
Non availability of data that is needed (for example: compliant production data)
More market indicators needed such as for certified product, needs to be collected in
collaborative ways
Certification—gap in information on producers side (smallholders)
Difficult to accommodate all processes—stakeholder vs. reaction to market: hard to find right
balance
Evaluation: need for threshold tightening and criteria tightening
o Setting criteria is important: how do we translate standards into sustainable impacts?
Some criteria does not fit into sustainability performance, particularly social
Measuring impact, harmonizing monitoring of data
o Balance between principles and criteria
Important not to lose smallholders
o Setting right indicators
o Generic for each and every one
Simple information for people who want to buy more sustainably
o Which standard is suitable?
What is an SPS product standard? Definition difficult
o Market access for producers to comply, high cost of certification
Aid for trade—in assisting developing countries to engage global value chains in meeting
standards
o What is the process?
Need common understanding of measurement of indicators--basic comparisons.
Need quality data, especially for smallholders
There is a necessity for standards (Mexico representative)
Need for objective evaluation
o Not only data collection but evaluation also
Need for improved market access for farmers
SSI Data Collection Collaborative Workshop Report
Feedback on SSI data collection process and SSI: Comments from participants
UTZ:
o Process was smooth
o Liked the 2-3 rounds of feedback
o Prior to first draft of data interpretation—do not feel they were given enough time to
provide input
o Conversion of certified volume and sales: difference in calculations due to delay in their
system
o Over supply of sustainable production:
In some areas but not all
Over estimate in production volumes (farmers over calculate); or middle men
involved
There is sometimes a lack of supply
Multiple certification skews
Bonsucro:
o Process went well
o Spreadsheets clear
o Good indicators
o Superficial in some aspects (production and sales = estimates vs. actual)
o Buying side: different layers of sales
Sales commercialized externally but not publically claimed for example
Layers difficult to grasp and study but necessary
PEFC:
o The process worked really well and the team work was great (“could not have worked
with a better team”)
o Multiple certification for FSC and PEFC quite often mixed in control sources part of
supply chain
Challenges accounting for inaccuracy
o CoC breakdown: what is actually labelled as certified and what actually reaches the
market
o Losing specifics of individual sectors
o Looking at similarities can lose important specifics
o Comparison up for misinterpretation because comparing apples to oranges (different
sectors)
o Each standard has its own purpose
Need more effort in showing where focus is
No such thing as sustainability in one dimension
Balanced score card to show where focus is
Are standards a trade barrier?
SSI Data Collection Collaborative Workshop Report
Fairtrade:
o Not involved personally but heard that the process was smooth
o Need for clarity on content criteria methodology, which was achieved after some back
and forth but not clear initially
FSC:
o Forestry different
Lower yields
Unique elements in forestry standards
Promote wood but do not want to sell right away
CmiA:
o Does not like entering data
o Did not find the process to be clear
o Document provided not easy to enter data
o Not satisfied
o Need new indicators
Education level
Toxic load
o Is the information relevant to us (VSS)? Who is using the data?
Feedback on providing data to SSI:
o PEFC: We value the diversity of the standards; however, the SSI provides more of a homogenous
picture. What are the unique attributes of each standard? For example, what are the reasons why
CmiA has less coverage on specific criteria?
o FAST: Who are the users of the data collected? What is the added value to the producers?
Benchmarking of standards enables producers to make a choice, and it is good for transparency.
It is very valuable to find out about impacts, who is it who really benefits? What is the credibility
of this data? What is the validity of the sample size? What is the robustness of the sample size?
Seeing more convergence in standards drives innovation
o CmiA: Quite often smallholder farms involve family work so not always applicable to the labour
criteria. CmiA finances farmers to comply to the Standard and CmiA pays the verification fees. In
his experience impact assessment and control groups does not work—where is the control group
in the nation-wide context?
Suggestions for moving forward:
o Provide information regarding sustainable procurement: public and private
o Governance aspects: stakeholder engagement in a meaningful way
o National / local indicators for global standards
o VSS collaboration: how we learn from one another—Consistent reporting

SSI Data Collection Collaborative Workshop Report
Presentations:
1. ITC presentation –Joe Wozniak: MDET: Comments from participants
2. Q: Does the system enable you to look back in time to see who changes what and what time?
A: Yes.
3. Q: How does ITC validate data?
A: data provided by VSS. Statisticians access information and sometimes ITC performs spot
audits.
4. Q: What is the target group for the ITC database?
A: Many: researchers, academics, producers, suppliers
5. Q: What type of analysis does ITC provide?
A: Whose doing what and when;
Shows information in SSI Reviews, Standard Map website
o General information for producers and suppliers
o A compare and contrast tool
6. Q: What is the MDET’s relation to other tools? Can the information be incorporated into Trade
Map?
A: Difficult to harmonize system: Info not tracked by customs authorities; Therefore, do not
want to mix the two right now (market and systems)
7. Identification of external data providers
Q: Will ITC work with commercial organizations?
A: We work with FiBL to leverage networks in select countries and we plan to expand from
there; We are not asking for specific company information—it remains anonymous to overcome
proprietary national or trade competiveness
8. Q: With respect to certified paper, will ITC develop a budget to get data from commercialized
sources?
A: With external data providers there would be more of a need to double check data; it is harder
with consultants--not so reliable
9. FSC: Marion not ready to invest the time to provide this sort of data
10. ITC trying to streamline and systemize the system
o Data comes from customized authorities
o Trade partners using for proxy for data export yields
o Striving for full transparency on sources of data
11. Q: Is MDET going to be available in other languages?
A: The MEDET is available in English; Spanish; French; possibly Portuguese (based on UN
policies); Cannot speak for the SSI
12. MDET: free access for all
13. ITC is updating Standard Map with respect to the number of criteria per hotspot per VSS, the
level of rigor, and the number of criteria and level of obligation
14. ITC is not an auditing business but rather a roadmap diagnostic

SSI Data Collection Collaborative Workshop Report
ISEAL: SSCT presentation
o PEFC: is concerned that if tool recognizes only ISEAL members what about other VSS
that are not ISEAL members? If following ISO guidelines and would end up with a similar
measure as ISEAL members, then PEFC would use. Concerned that the tool is biased
toward ISEAL members.
ISEAL impact codes only for members but ISEAL credibility principles are
applicable to VSS that are not members of ISEAL
PEFC still has a major concern
o GIZ: Credibility principles also operate under ISO framework
Other initiatives that try to define sustainability overlap with ISEAL—not much
of a difference across framework (ISO, ISEAL)
Principles offer useful framework but does not depend on compliance with
ISEAL codes
Some initiatives, for various reasons, are not ISEAL members, so they created a
system that works beyond ISEAL Impacts Code (members)
o PEFC: if this is the case, then he is happy with this
o ISEAL: The credibility principles are universal principles
Of course, ISEAL attempts to have their members score high on their indicators
_____________________________________________________________________________________________________________________
Afternoon Group Discussions:
1. Smallholder Discussion Group (Ann facilitator):
The way VSS’s currently define smallholders varies but hectare size is typically a common
factor--for example:
1. 4C Association/ProTerra: number of hectares but varies by region
2. CmiA: 10 per cent or less of total area and/or 5 per cent or less of farmers
cultivating 20 ha or less of cotton
3. FSC, RSB*, BCI, RSPO: number of hectares
4. UTZ: individual vs. group—smallholder = number of group members
Challenges:
The average hectare size of farmers represents “one way” of gathering
smallholder data but prone to degree of subjective error because based on
estimates measured by “the group” (How do you account for the two largest
producers within the group that account for half of production?)
Data collection challenges:
Consistency of interpretation (reliability, predictability of data quality)
Simplicity of data requirements
Data collection challenges:
Without a common definition of ‘smallholder’ it is difficult to truly
assess whether VSS’s are reaching the poor

SSI Data Collection Collaborative Workshop Report
What is considered “smallholder” currently varies across commodity and
across region (ie. South America vs. Asia)
ISEAL proposed smallholder criteria: (Assess ‘smallholder’ not only by size but also by
type of producer)
o Group level:
1. Size:
a. How many farmers are in the group?
b. How many hectares are distributed among these farmers?
2. Type:
a. Dominant labour model:
b. Method of mechanization:
o Within group level (not likely to get for each area):
1. Farmer profile: defined by commodity, includes (but not limited to)
indictors like:
a. Cultivation area, land size
b. Production intensity (low, medium, high)
c. PPI poverty status likelihood at time of entry into program
The goal is to move away from the approach of smallholders to characterization of farmers,
which would help to align the indicators across regions (and thus across VSSs)
o Commodity would remain determining factor (ie. Production intensity)
SSI Smallholder Criteria:
1. Objective is to align SSI smallholder criteria with ISEAL and ITC
2. One of the main attributes and assets of the SSI is to find ways to avoid getting bogged down
by the intimate details of impacts. We are always looking for ways to gather data in the
highest level that still provide meaning.
3. Extract a subset of ISEAL’s smallholder criteria that are considered manageable for macro
trend reporting
a. Question: What is it that’s “really” important with this data point? What are we
trying to get at?
b. Answer: We’re trying to understand the reach of a standard’s impacts; how far
does it reach into the lives of people? How far does it reach into the lives of people
in need?
i. We know that there are at least 15 factors that determine whether a
standard is getting to those most in need. Now, what if somebody said to
you, you can only measure two of the fifteen variables? What would they be?
4. Suggestions for three key indicators for the SSI:
a. Number of farmers
b. Number of hectares
c. Volumes produced
i. Based on these indicators we could calculate global (or regional) sums to
figure out total number of farmers being reached and how many farmers per
volume are being reached (for example an initiative that deals only with

SSI Data Collection Collaborative Workshop Report
smallholders should in theory have a higher number of farmers per volume
than an initiative that does not)
5. Questions posed to discussion group:
a. What do you think of these suggested indicators for reporting macro trends?
b. Do you have other suggestions for a set of high level (macro) indicators that could
better reflect whether VSS are reaching those most in need?
6. Discussion group points:
a. Labour model is an important factor: is it family labour or hired labour?
b. Smallholders are typically certified by group or cooperative, which can involve
varying numbers of farmers—so number of farmers would mean what exactly.
c. Volumes produced does not work for every commodity, for example forestry—
where within the first five-10 years volumes produced is minimal, after which time
volumes produced increases exponentially moving forest producers out of the
classification of “smallholder”.
i. With this in mind, participants agreed that smallholder is dependent on
commodity and providing one definition of smallholder across all
commodities would be difficult.
7. Responses and discussion presented:
PEFC: We need to ask what do farmers lack in order to be a smallholder?
Smallholder should be defined on the basis of what they do not have
It is important for smallholders to know the standards and to understand them
ProTerra: Provides smallholders—easy requirements for information reporting
Stratified sampling of audits---big producers get audited more
SSI definition?: How many standards have smallholder specific standard
Aim is to define/measure: are VSS supporting smallholders?
If that is the goal: characterization of who, rather than defining “smallholder”
Syngenta: CSR—easy to fall short on claims—greenwashing
Need decent viable business model
Crop dependent
Regional dependent
Commodity specific: premium vs. access
2. Industry / Financial Discussion Group (Vivek facilitator):
What are the incentives and disincentives associated for the private sector to share data for
sustainable development reporting or sustainable product sourcing?
There may clear value in improving one’s brand. As demonstrated by Puma and others
who have embraced sustainable development as a business strategy and way to guide
corporate decision making sharing data helps with transparency and could lead to
important partnerships.
This requirement may be driven by shareholders and lead to improved invested
relations.
SSI Data Collection Collaborative Workshop Report
Could improve the corporate responsibility as it could lead to demonstrating
positive contributions related to standards for sustainable development.
If you don’t share data and report others may report for you. Sharing data will
help set fair prices and shape the market through better knowledge. It could also
lead to enabling coherence in global trade and facilitate trading generally.
The main disincentive is that it may stifle a business’s competitiveness. Sharing data may
be risky if there is no benchmark. This could lead to exposure to criticism. If there is a
benchmark there is incentive to perform above it. Managing expectations in terms of
improvement may be more difficult if data is being shared. In this case sharing data and
reporting on sustainable product sourcing may not be good enough.
Indicator: Total volume of sustainable product sourced
There will be barriers to sharing data on per cent of product that comes from sustainable
sources as it is a competitive issue.
If aggregated to the appropriate level it could be feasible but this represents additional
work. Sharing this type of information could represent a check between VSS production
reported and private sector consumption.
There is a cost factor associated with sharing data as it can take years to build trust for
data sharing even when it is bilateral. Could report targets to source sustainable product
but not venture to report on projected volumes sources due to the variability of the
agricultural sector.
The data should be collected at the trader level. Collecting the total volume of
sustainable product sourced and sold as sustainable at the trader level would be very
valuable (sold as certified and non-certified).
Ensuring cost effectiveness of data collection long-term is an important consideration.
Capturing retail value is difficult for most commodities.
We need to remember that response from farmers are inelastic. Perhaps concentrating on
the food industry would be more strategic.
Indicator: % Premiums
Although certifiers can provide some idea on % premiums it would not be amenable for
the private sector to share this information due to competition.
For tracking non-GMO products this could be useful as premiums can be used to track
GMO versus non-GMO products due to the pervasiveness of GMOs.
There should be a value add as a result of sustainable practices reflected in increases in
productivity.
Premiums should not be factored into pricing. It should be not be more expensive to be
sustainable but more profitable in terms of ensuring long-term production.
There is a marketing challenge associated with sustainably produced goods and
standards may be able to help.
SSI Data Collection Collaborative Workshop Report
What are the needs of the private sector as it relates to VSS market data?
We need certified volumes at the country and perhaps regional level (disaggregated
geographically). To establish a definition for smallholders perhaps focus on what they
don’t have instead of what they have.
Financial Access Criteria
Socially and environmentally oriented financial institutions are using certification as criteria to motivate access to finance
Information about the specific needs of long-term finance is needed to try to motivate financial institutions to make long-term investments.
Access to finance is already present along the value chain, for example: Contracts used as collateral Negotiated terms (time) to pay contracts
Work along the supply chain actors that are involved to provide access to finance to collect data
Data collection to access finance depends on the business model Who is the recipient?
Shortage of economic information by certification schemes about the financial needs of certificate holders
Economic sustainability is key. It is not enough to be certified to access finance.
Standard indicators in yields would help to monitor financial sustainability
Financial institutions should invest in increasing productivity i.e. high yield seedlings, which could result in a better position for the SME to repay loans.
Responses and discussion presented:
SMEs defined by amount of money they need
Smallholder = aggregated farm
Economic sustainability is key
Identify financial gap—indicators to gather data for financial institutions in order to
identify gaps
Is access to finance an added value for certification?
3. Macro Indicators Discussion Group (Matthew facilitator):
Macro indicators: yields; budget distribution analysis; smallholder intensity; sustainability intensity at national
level; also open to additional indicators
Yields:
Can yields be derived from available area harvested and production figures? If not, are other yield data available?
While ideally area production divided by area harvested would result in a valid yield calculation, yields cannot be derived from available area harvested and production figures because area harvested data is collected at the group level, but it’s possible that not all production may be sold from farmers to the group.
SSI Data Collection Collaborative Workshop Report
Projected production (or ‘production capacity’), is sometimes used as a proxy for the ‘production’ indicator. This wouldn’t be able to be used to calculate yields due to an overconfidence bias.
There is the issue of lining up timeframes for area harvested/production
How can available yield data be presented to best reflect the reality of how VSS are affecting yields? E.g., VSS-compliant vs. non-VSS-compliant yields on a country (or regional) level for a given commodity, or perhaps a broad review of case study data, etc.
This is very difficult. Some of the problems encountered include disaggregating mechanized vs. non-mechanized production for crops like sugarcane or soy, as well as irrigated vs. non-irrigated land.
It is important, when looking at yields for VSS-compliant product vs. conventional product, to take into account how long a given product has been VSS-compliant
One must identify or somehow take into account extreme weather events
VSS-compliant vs. conventional yields would have to at the very least be compared at the regional or farm level, as opposed to country level, to account for different production systems, soil, etc.
National Indicators:
In the 2014 SSI, the indicator Market share of VSS-compliant production volume, countries’ VSS-compliant production are presented as a percentage of national production. An equally important indicator would be trade of VSS-compliant products as a percentage of total traded products. What is the progress on recording the trade of VSS-compliant products?
HS codes exist for Organic products only in USA, Canada and the Dominican Republic
The World Customs Organization is probably about 10 years away from establishing any codes for other VSS-compliant products. This is a long process that takes 4-5 years
Despite the lack of HS codes, trade data for organic product is collected by FiBL in about 40 countries through contact with customs officials and traders. With segregated product (as opposed to mass-balance or book-and-claim), data collection through contact with customs officials and traders is still possible
In regards to retail consumption, The Soy Taskforce collects data through a survey of private-sector purchasers, and ensures privacy through the presentation of only aggregate-level data. This is an especially effective method for calculating the retail-level consumption of products that are integrated with other products downstream, like soy or sugar.
Smallholder Intensity: The group did not have time to discuss this.

SSI Data Collection Collaborative Workshop Report
Conclusions of this working group: The group decided that perhaps instead of attempting to
collect and present data on other indicators such as yields, the SSI Review should work to build
a more comprehensive data reporting strategy for its existing indicators. This would include
collecting comprehensive time-series data for all indicators presented in the 2014 SSI Review, as
well as providing a detailed description of how each indicator is collected by each individual VSS
(‘State of Data Collection’). Additionally, the group thought that the SSI could collect data on
what portion of sales occurs through segregated, mass-balance, and book and claim supply
chains, followed by a discussion on the trends and an outline of how/why each system works and
an overview of trends in these systems.
Responses and discussion presented:
Data on yields is very specific regionally—can’t calculate causality
Rather, focus on our own meta data—make data collection of SSI more transparent,
comprehensive, time series
CoC data—easily accessible, rather than expand data set, make more transparent
Comparing sustainability of a VSS with national data
4. SSI Gaps Discussion Group (Kristin facilitator):
Need to clarify what is the audience for the SSI report?
Pitched at middle ground for those who already know about VSSs
Too dense, too detailed
But if want specifics not ideal
Does not necessarily target the public
People more interested in impacts, which is not the focus of the SSI
Would like to see more focus on consumer markets
Investment: measure of what is being contributed
Consensus on commodity focused reports
Need for focus on cost effectiveness that show outcomes
Concluding thoughts:
Face to face discussions are important, followed by online dialogue
Continued dialogue through open forum welcomed
Important to keep in mind how indicators are being interpreted
Diversity of VSS is a benefit to overall community
Paid positions for data providers?
To download the full Review or individual chapters go to:
http://www.iisd.org/publications/pub.aspx?pno=2899