Embed Size (px)
Citation preview
SSE plc A
nn
ual R
epo
rt 20
17
Strategic Report
About SSE
Our story 2
About our business 4
Chairman’s introduction 6
Our role in society 8
Executing our long-term strategy
Questions to the Chief Executive 10
Our strategy 12
Performance in 2016/17 and future plans 14
Financial and non-financial performance indicators 16
Reducing our carbon emissions 18
Our people and our values 20
Risk Management Framework 24
Working in partnership with our stakeholders 28
Our financial and business performance
Financial overview 30
The weather 39
Wholesale – producing energy 40
Networks – delivering energy 44
Retail – supplying energy 48
Enterprise – providing energy services 52
Directors’ Report
Chairman’s introduction 54
Board of Directors 56
Leadership 58
Effectiveness 64
Accountability 70
Stakeholder engagement and responsible stewardship 76
Remuneration 80
Other statutory information 98
Statement of Directors’ responsibilities 100
Financial Statements
Alternative Performance Measures 101
Consolidated income statement 106
Consolidated statement of comprehensive income 107
Consolidated balance sheet 108
Consolidated statement of changes in equity 109
Consolidated cash flow statement 110
Notes to the consolidated financial statements 111
Accompanying information 159
Company balance sheet 187
Company statement of changes in equity 188
Notes to the Company financial statements 189
Independent Auditor’s Report 199
Shareholder information IBC
Welcome to the SSE Annual Report 2017At SSE we provide the energy people need in a reliable and sustainable way. We’re involved in producing, generating, distributing and supplying electricity and gas, as well as other energy-related services, across the UK and Ireland. This gives SSE the broadest range of energy businesses of any company listed on the London Stock Exchange.
Our performance in 2016/17 demonstrates the value of a business built on core strengths and a commitment to providing long-term value for our shareholders and meeting the needs of our customers. This Report, addressed to SSE’s shareholders, details SSE’s performance in 2016/17 and looks ahead to 2017/18 and beyond.
About SSE
CDP has again recognised SSE as a leader for its actions and disclosure on climate change. SSE was awarded a score of A- in recognition of its significant reduction in carbon emissions in 2015/16. This score is expected to be updated in October 2017.
Strategic Report
For the third year in a row SSE has been awarded the Fair Tax Mark for its transparent tax disclosures, it is the only FTSE-listed company to have this accreditation.
SSE is an accredited Living Wage company and extends this commitment to its supply chain.
1
3.1. Strategic Report 2.
2000 2002 2004 2012 2014 20172011 2013 201620152005 2007 20092006 2008 20101999 2001 2003
27.532.4
37.7
80.186.7
91.3
75.084.2
89.488.4
42.5
55.066.0
46.5
60.570.0
25.7 30.035.0
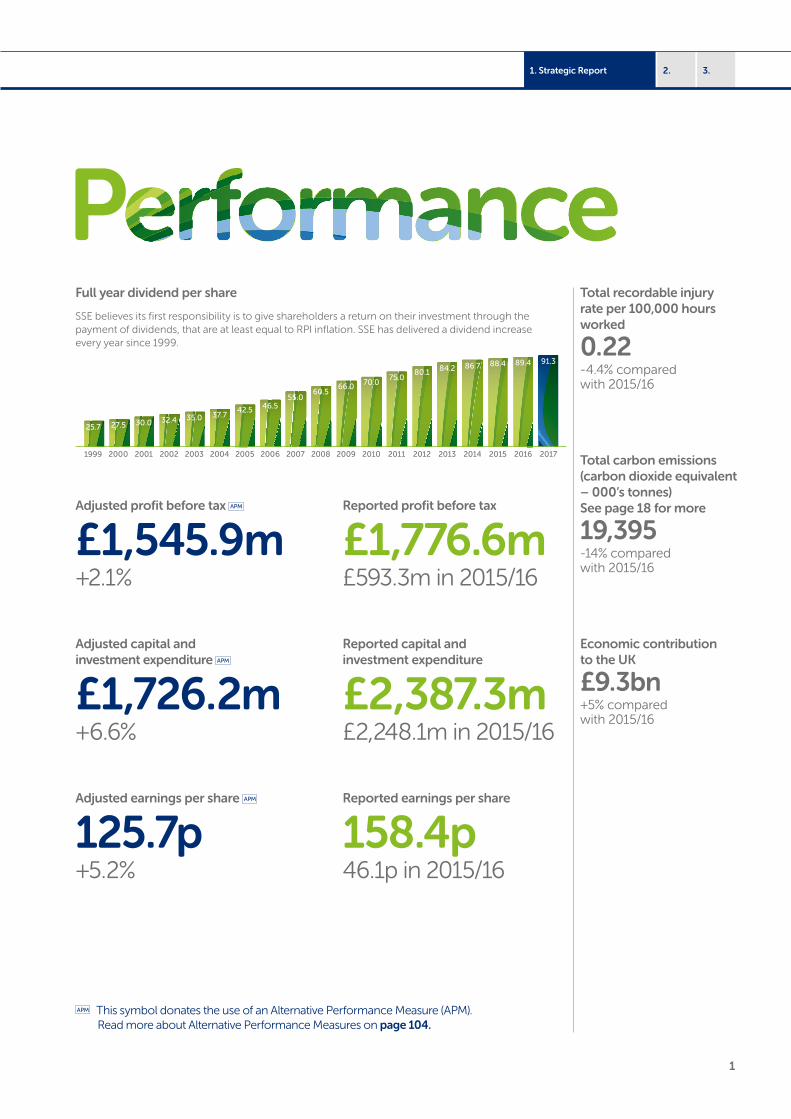
Total recordable injury rate per 100,000 hours worked
0.22-4.4% compared with 2015/16
Total carbon emissions (carbon dioxide equivalent – 000’s tonnes) See page 18 for more
19,395-14% compared with 2015/16
Economic contribution to the UK
£9.3bn+5% compared with 2015/16
This symbol donates the use of an Alternative Performance Measure (APM).Read more about Alternative Performance Measures on page 104.
Full year dividend per share
SSE believes its first responsibility is to give shareholders a return on their investment through the payment of dividends, that are at least equal to RPI inflation. SSE has delivered a dividend increase every year since 1999.
Reported earnings per share
158.4p46.1p in 2015/16
Reported profit before tax
£1,776.6m£593.3m in 2015/16
Reported capital and investment expenditure
£2,387.3m£2,248.1m in 2015/16
Adjusted earnings per share
125.7p+5.2%
Adjusted profit before tax
£1,545.9m+2.1%
Adjusted capital and investment expenditure
£1,726.2m+6.6%

2 SSE plc Annual Report 2017
Taking inspiration from a rich heritageSSE’s roots are firmly planted in the hydro-electric revolution that took place in the north of Scotland shortly after the Second World War. Bringing power to the islands, glens and crofts of the north of Scotland was transformative to life in the north and established, at the time, a public corporation whose aim was to harness abundant natural resource for public benefit. It was the privatised Scottish Hydro-electric that merged with Southern Electric to create Scottish and Southern Energy, now known as SSE.
The two regions in the most extreme north and south of the British Isles could not have been more different geographically, economically or socially. The electricity network in the south of England had expanded quickly: the challenge was to provide electricity reliably to a booming population. The relative strengths complemented each other and provided the basis from which SSE grew rapidly through the 2000s.
Pitlochry Dam Visitor CentreAt the heart of the post World War Two hydro-electric revolution in the north of Scotland was the Tummel-Garry project, known as the Grand Scheme because of the vast area of the project. While Perthshire has abundant rainfall and many hills and mountains, the scale of these mountains was not comparable to the hydro schemes that were developing in North America. Therefore the Scottish schemes needed to think more creatively and capture more water from a wider area. Across the north of Scotland 54 main hydro-electric power stations were built, 30km of tunnel and a construction workforce that reached 12,000 at its peak. This was a feat of incredible vision, engineering and effort.
The social history that was created by these hydro pioneers is something that does not simply belong to SSE and there is a responsibility to preserve and promote that heritage for future generations. That’s why in 2015 a final investment decision was taken to invest £4m in a brand new visitor centre in Pitlochry – the very heart of the Tummel-Garry hydro scheme. It opened to the public on 30 January 2017, is free entry and tells the story of Scotland’s hydro heritage. Furthermore, the visitor centre allows visitors to learn more about the importance of newer forms of renewable energy for a low carbon future.
1933The National Grid started operating across GB
1943The Hydro Electric (Scotland) Development Act
1956Calder Hall, the world’s first nuclear power station of industrial scale opened in Cumbria
1990Central Electricity Board broken into three parts and privatised
1989The Electricity Act provided for the privatisation of the electricity industry
1986The Gas Act provided for the privatisation of the gas industry
1991Scottish electricity industry privatised
1998Scottish Hydro Electric and Southern Electric merge and become Scottish and Southern Energy
Building on a proud past; creating a smarter, low-carbon future
Our heritage Preserving our heritage
Our story
Strategic Report – About SSE
1. Strategic Report 2. 3.
3
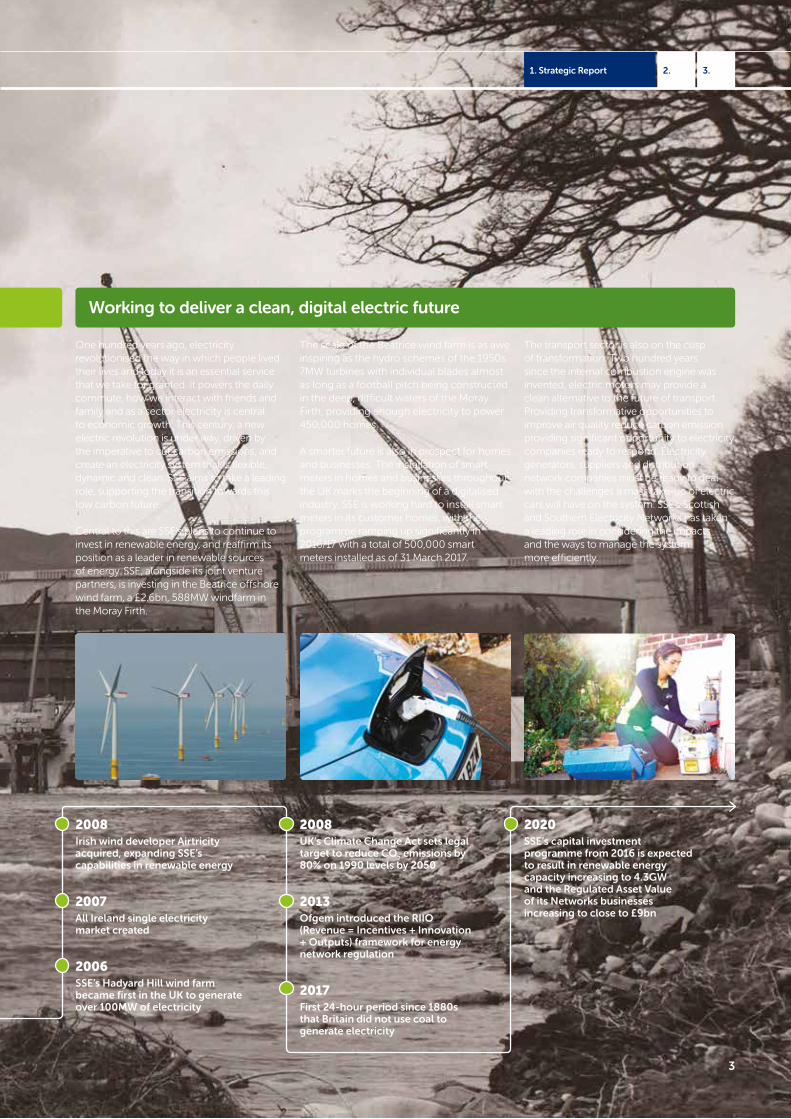
One hundred years ago, electricity revolutionised the way in which people lived their lives and today it is an essential service that we take for granted. It powers the daily commute, how we interact with friends and family and as a sector electricity is central to economic growth. This century, a new electric revolution is under way, driven by the imperative to cut carbon emissions, and create an electricity system that is flexible, dynamic and clean. SSE aims to take a leading role, supporting the transition towards this low carbon future.
Central to this are SSE’s plans to continue to invest in renewable energy, and reaffirm its position as a leader in renewable sources of energy. SSE, alongside its joint venture partners, is investing in the Beatrice offshore wind farm, a £2.6bn, 588MW windfarm in the Moray Firth.
The scale of the Beatrice wind farm is as awe inspiring as the hydro schemes of the 1950s. 7MW turbines with individual blades almost as long as a football pitch being constructed in the deep, difficult waters of the Moray Firth, providing enough electricity to power 450,000 homes.
A smarter future is also in prospect for homes and businesses. The installation of smart meters in homes and businesses throughout the UK marks the beginning of a digitalised industry. SSE is working hard to install smart meters in its customer homes, with the programme ramping up significantly in 2016/17 with a total of 500,000 smart meters installed as of 31 March 2017.
The transport sector is also on the cusp of transformation. Two hundred years since the internal combustion engine was invented, electric motors may provide a clean alternative to the future of transport. Providing transformative opportunities to improve air quality reduce carbon emission providing significant opportunity to electricity companies ready to respond. Electricity generators, suppliers and distribution network companies must be ready to deal with the challenges a mass take-up of electric cars will have on the system. SSE’s Scottish and Southern Electricity Networks has taken a leading role in considering the impacts and the ways to manage the system more efficiently.
2008Irish wind developer Airtricity acquired, expanding SSE’s capabilities in renewable energy
2007All Ireland single electricity market created
2006SSE’s Hadyard Hill wind farm became first in the UK to generate over 100MW of electricity
2008UK’s Climate Change Act sets legal target to reduce CO
2 emissions by
80% on 1990 levels by 2050
2013Ofgem introduced the RIIO (Revenue = Incentives + Innovation + Outputs) framework for energy network regulation
2017First 24-hour period since 1880s that Britain did not use coal to generate electricity
2020SSE’s capital investment programme from 2016 is expected to result in renewable energy capacity increasing to 4.3GW and the Regulated Asset Value of its Networks businesses increasing to close to £9bn
Working to deliver a clean, digital electric future
4 SSE plc Annual Report 2017
ElectricityGas
3
1
2
1
2
3
Strategic Report – About SSE
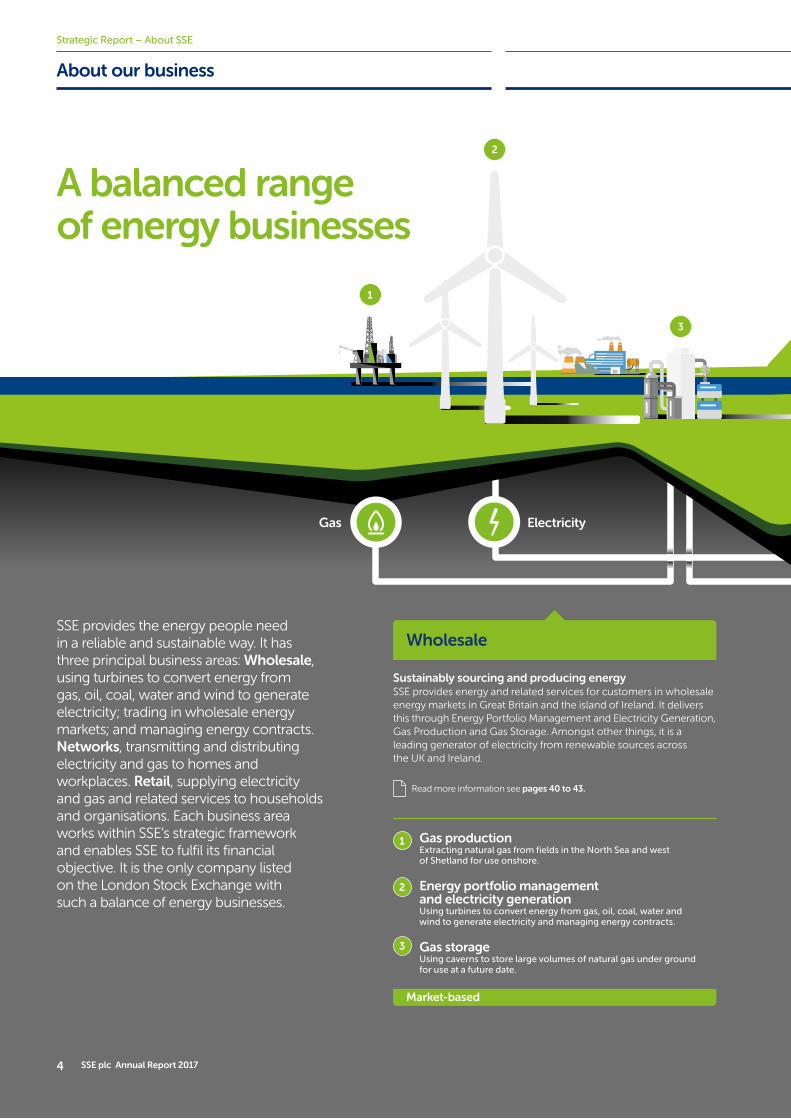
SSE provides the energy people need in a reliable and sustainable way. It has three principal business areas: Wholesale, using turbines to convert energy from gas, oil, coal, water and wind to generate electricity; trading in wholesale energy markets; and managing energy contracts. Networks, transmitting and distributing electricity and gas to homes and workplaces. Retail, supplying electricity and gas and related services to households and organisations. Each business area works within SSE’s strategic framework and enables SSE to fulfil its financial objective. It is the only company listed on the London Stock Exchange with such a balance of energy businesses.
Sustainably sourcing and producing energySSE provides energy and related services for customers in wholesale energy markets in Great Britain and the island of Ireland. It delivers this through Energy Portfolio Management and Electricity Generation, Gas Production and Gas Storage. Amongst other things, it is a leading generator of electricity from renewable sources across the UK and Ireland.
Market-based
Gas productionExtracting natural gas from fields in the North Sea and west of Shetland for use onshore.
Energy portfolio management and electricity generationUsing turbines to convert energy from gas, oil, coal, water and wind to generate electricity and managing energy contracts.
Gas storageUsing caverns to store large volumes of natural gas under ground for use at a future date.
Wholesale
A balanced range of energy businesses
Read more information see pages 40 to 43.
About our business

3.1. Strategic Report 2.
5
4
5
6
7
8
9
4 7
5 8
6 9
Safely delivering energy to homes and businessesSSE has an ownership interest in the energy networks businesses in electricity transmission in the north of Scotland, electricity distribution in the north of Scotland and southern central England and in gas distribution in Scotland and southern England. These ‘regionally-defined’ businesses are subject to economic regulation by Ofgem.
Supplying energy and essential services to customersSSE supplies electricity, gas and related services such as telecoms in markets in Great Britain and the island of Ireland. It aims to become a market-leading retailer by digitalising and diversifying its business and consistently excelling in customer service. It also incorporates SSE Enterprise, which brings together key SSE services for industrial, commercial and public sector customers.
Economically-regulated Market-based
Gas distributionUsing pipes to distribute gas from the transmission network to homes, work places and other premises.
Electricity transmissionUsing higher voltage lines and cables to transmit electricity from generating plant to the distribution network.
Electricity distributionUsing lower voltage lines and cables to distribute electricity to homes, work places and other premises.
Energy supplyRetailing gas and electricity to household, small business and industrial and commercial customers.
Energy-related servicesProviding energy-related products and services to households and small businesses.
EnterpriseBringing together key SSE services for industrial, commercial and public sector customers.
Networks Retail
Read more information see pages 44 to 47. Read more information see pages 48 to 51.

6 SSE plc Annual Report 2017
Chairman’s introduction
Providing the energy people need
Strategic Report – About SSE
I’m pleased to introduce this year’s Strategic Report. Since becoming Chairman of SSE in July 2015 I’ve had the privilege of seeing first hand a business made up of talented and committed people who are focused on exceeding the expectations of customers; building, owning and operating assets that power our low-carbon energy future; working constructively with stakeholders; and making a positive contribution to the communities and wider society it serves. There is more detail about all of these areas in this Strategic Report.
Energy underpins modern society: it’s at the centre of economic growth and industrial strategy, and it powers the daily commute to work and how our customers engage with friends and family. Yet the energy sector never stands still and 2016/17 brought further changes and challenges. In all of this SSE is a business built for the long term. The fundamentals of the business are strong and our proposition to shareholders, to increase annually the dividend payable to shareholders by at least RPI inflation, remains firm.
A business investing, building and operating long-term assetsSSE is a business that focuses on what it does well. As well as efficiently operating our assets that provide energy to the UK and Ireland’s homes and businesses, in 2016/17 we invested over £1.7bn as part of plans to invest around £6bn in the four years to March 2020 of which around two thirds is investment in regulated networks and government mandate renewables. This investment adds to the diversity of SSE’s operations and the balance of our business. It also helps to stimulate sustainable economic activity, principally by supporting around 120,000 people’s employment. The sheer scale and impact of the Caithness-Moray transmission link and the engineering feats at the Beatrice offshore wind farm, SSE’s two largest projects to date, can not fail to leave a positive impression. The projects are on track for completion in 2018 and 2019 respectively.
Of course, SSE’s assets are not confined to plant and machinery; SSE is a people business. The stable, experienced and increasingly diverse team are committed to adding to the ‘human capital’ of the organisation. This stretches from our engineering apprentices helping to deliver an efficient distribution network whatever the weather; those who operate our diverse portfolio of power
This Strategic Report sets out our performance over 2016/17, and looks at our future strategic priorities.
7
3.1. Strategic Report 2.
stations; through to the teams dedicated to making energy fair and simple for customers. Our highly skilled teams cover the length and breadth of the UK and Ireland and their commitment to their roles has formed the basis of SSE’s success to date, and will drive it to succeed in the future.
A changing energy sectorChange is a theme running throughout all aspects of SSE’s businesses. Some political uncertainty is a fact of life for the energy sector. It is again evident with the UK’s decision to leave the European Union, political parties in the UK considering possible intervention in the Retail energy market and the calls for a second Scottish independence referendum. This is something on which the Board is clearly focused, not only to manage any risks from politics and regulation but also to foster constructive working relationships with government and regulators, to best represent customers’ interests and identify opportunities that may emerge.
Politics is just one factor driving change. Energy markets are now changing at a rapid pace as competition changes market dynamics and the costs of some low-carbon technologies falls rapidly. This brings notable changes to every part of SSE’s operations. SSE has shown before it can respond and adapt when market conditions change, from becoming a leading investor in renewable energy to spearheading calls for tax transparency on the part of large business. The Board held several discussions this year to help the SSE team pursue emerging opportunities, whilst mitigating risk.
Putting customers at the heart of everything we do Almost everything SSE does is paid for by consumers. It must therefore put their interests and needs at the heart of its activities. We can’t control the underlying cost of energy, particularly wholesale prices or many of the costs associated with the low-carbon transition, and it was with regret that we announced an increase in our GB domestic electricity tariffs, which took effect at the end of April 2017, and increases for customers in Northern Ireland also. While we have been able to hold gas prices at their current levels, and we protected customers from an increase in energy costs during the preceding winter, the fact is that the costs of programmes to upgrade and decarbonise our ageing energy infrastructure are ultimately borne by the bill payer. At SSE, we do everything we can to keep the impact of that on customers to a minimum.
We are very aware that energy is an essential service and energy suppliers have to treat their customers fairly. We have taken action, be it investment in smart metering or outlining a proactive programme to engage with our customers to ensure they are on the right products for them. There is always more to do, particularly as the regulatory environment evolves, following the UK General Election. The Board is committed to fostering constructive relationships with governments and regulators as they pursue their priorities; and to ensuring that SSE is as well-placed as possible to respond to the challenges and opportunities that those priorities represent.
Creating a culture for long-term success In July 2016, the Financial Reporting Council (FRC) published a report on the importance of corporate culture to long-term business success. SSE’s Board endorsed the FRC’s definition of culture and the active management and oversight of SSE’s culture has been a growing theme for the Board throughout 2016/17.
There are, of course, distinctive responsibilities between Board and Executive in relation to corporate culture: it is the role of the Board to agree a healthy culture and for ensuring there is an appropriate framework of control with regard to culture-related issues; and it is the role of the Executive team to ensure that the attitudes and behaviours demonstrated in day-to-day operations are consistent with an appropriate culture.
I have been pleased with early progress in a more systematic and methodical approach to defining, nurturing and monitoring SSE’s internal culture. From a new code of ethics for employees to the development of ethical training packages, SSE made a good start in 2016/17 with much to do in the years to come.
Acting in the interests of stakeholdersOver the last year, there has been significant debate about the UK’s strategy for economic growth. Creating an Industrial Strategy and giving greater importance to the voice of the stakeholder in business decision making are increasingly coming into focus.
Stakeholder interests are explicitly outlined in Section 172 of the Companies Act 2006, as is the impact of a company’s operations on the community and the environment. SSE has always sought to live by the spirit and the letter of Section 172 of the Act.
Fulfilling its duty to act in the interest of all stakeholders should make a significant contribution to a healthy organisational culture. As well as our commitment to reduce carbon emissions from our electricity generation output, the achievement of the Fair Tax Mark for the third year in a row, supported by more accessible tax disclosure, and SSE’s four year commitment to the accredited Living Wage are symbols of fairness that are valued by stakeholders, customers and shareholders.
I have no doubt that continuous improvement in openness and transparency at the same time as recognising the strategic role of the stakeholder voice will benefit SSE in the short, medium and long term.
Achieving our first financial objectiveAt SSE our financial objective is to increase annually the dividend payable to shareholders, by at least RPI inflation. SSE has delivered a dividend increase every year since 1999. I’m pleased that the Board is recommending a final dividend that will take the full-year dividend for 2016/17 to 91.3 pence per share.
In all, SSE provides the energy people need in a reliable and sustainable way. We made a £9.3bn contribution to the UK economy this year and we know we have a unique role in the energy sectors in the UK and Ireland which comes with responsibilities and the need to earn the right to make a sustainable profit over the long term. There are complex issues to manage and additional challenges facing us in 2017/18 yet SSE has the strategy, culture, and a team of talented people required to succeed in 2017/18 and beyond. The Strategic Report was approved by and on behalf of the Board of Directors on 16 May 2017. This Strategic Report provides you the shareholder with an update on our approach and performance.
Richard Gillingwater CBEChairmanMay 2017
8 SSE plc Annual Report 2017
Society
Providing public
services
Giving the right to pay dividends
Investing in infrastructure
Lending human capital
Supporting and creating sustainable
jobs
Paying a fair share of tax
Our role in society
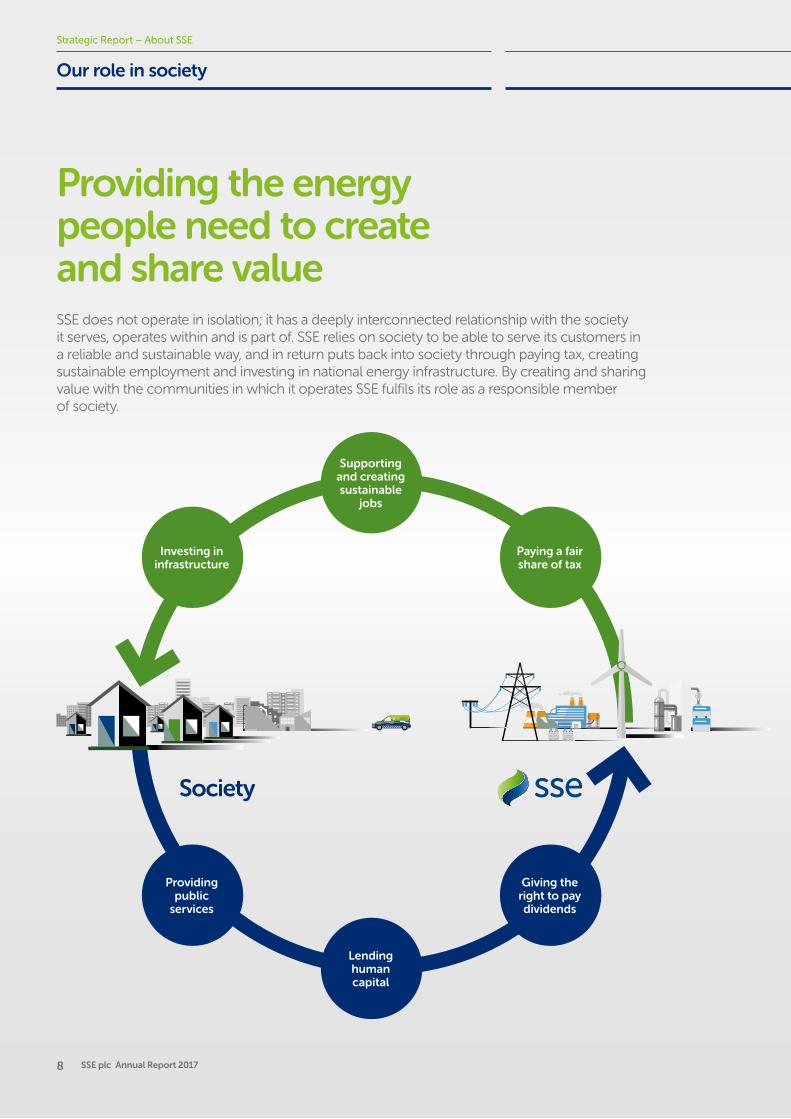
Providing the energy people need to create and share valueSSE does not operate in isolation; it has a deeply interconnected relationship with the society it serves, operates within and is part of. SSE relies on society to be able to serve its customers in a reliable and sustainable way, and in return puts back into society through paying tax, creating sustainable employment and investing in national energy infrastructure. By creating and sharing value with the communities in which it operates SSE fulfils its role as a responsible member of society.
Strategic Report – About SSE
9
3.1. Strategic Report 2.
Society
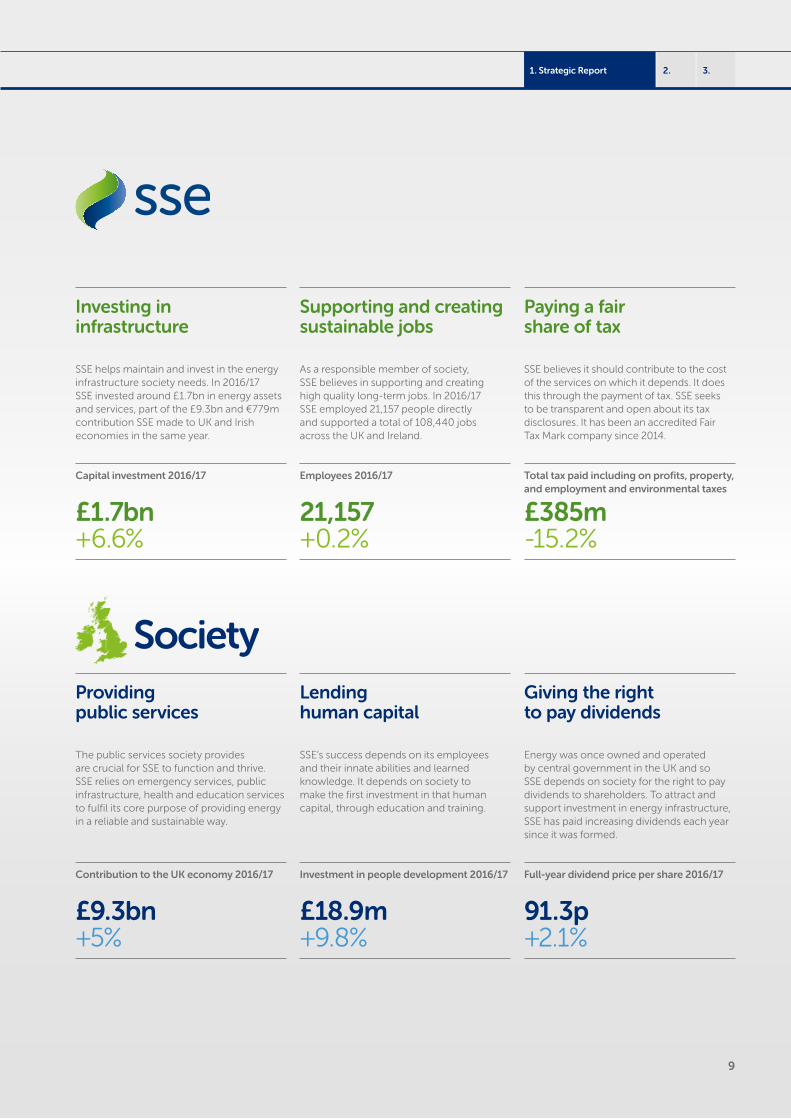
Investing in infrastructure
SSE helps maintain and invest in the energy infrastructure society needs. In 2016/17 SSE invested around £1.7bn in energy assets and services, part of the £9.3bn and €779m contribution SSE made to UK and Irish economies in the same year.
Capital investment 2016/17
£1.7bn +6.6%
Providing public services
The public services society provides are crucial for SSE to function and thrive. SSE relies on emergency services, public infrastructure, health and education services to fulfil its core purpose of providing energy in a reliable and sustainable way.
Contribution to the UK economy 2016/17
£9.3bn +5%
Supporting and creating sustainable jobs
As a responsible member of society, SSE believes in supporting and creating high quality long-term jobs. In 2016/17 SSE employed 21,157 people directly and supported a total of 108,440 jobs across the UK and Ireland.
Employees 2016/17
21,157 +0.2%
Lending human capital
SSE’s success depends on its employees and their innate abilities and learned knowledge. It depends on society to make the first investment in that human capital, through education and training.
Investment in people development 2016/17
£18.9m +9.8%
Paying a fair share of tax
SSE believes it should contribute to the cost of the services on which it depends. It does this through the payment of tax. SSE seeks to be transparent and open about its tax disclosures. It has been an accredited Fair Tax Mark company since 2014.
Total tax paid including on profits, property, and employment and environmental taxes
£385m -15.2%
Giving the right to pay dividends
Energy was once owned and operated by central government in the UK and so SSE depends on society for the right to pay dividends to shareholders. To attract and support investment in energy infrastructure, SSE has paid increasing dividends each year since it was formed.
Full-year dividend price per share 2016/17
91.3p +2.1%
10 SSE plc Annual Report 2017
Questions to the Chief Executive
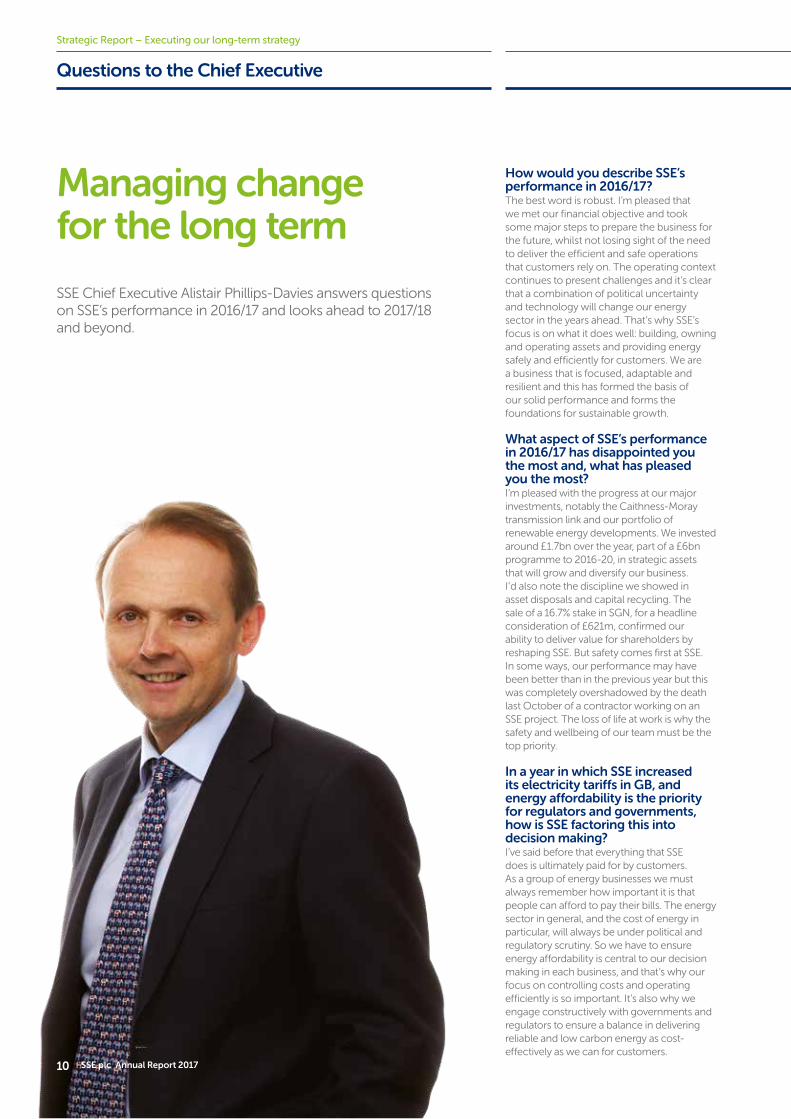
Managing change for the long term
How would you describe SSE’s performance in 2016/17? The best word is robust. I’m pleased that we met our financial objective and took some major steps to prepare the business for the future, whilst not losing sight of the need to deliver the efficient and safe operations that customers rely on. The operating context continues to present challenges and it’s clear that a combination of political uncertainty and technology will change our energy sector in the years ahead. That’s why SSE’s focus is on what it does well: building, owning and operating assets and providing energy safely and efficiently for customers. We are a business that is focused, adaptable and resilient and this has formed the basis of our solid performance and forms the foundations for sustainable growth.
What aspect of SSE’s performance in 2016/17 has disappointed you the most and, what has pleased you the most? I’m pleased with the progress at our major investments, notably the Caithness-Moray transmission link and our portfolio of renewable energy developments. We invested around £1.7bn over the year, part of a £6bn programme to 2016-20, in strategic assets that will grow and diversify our business. I’d also note the discipline we showed in asset disposals and capital recycling. The sale of a 16.7% stake in SGN, for a headline consideration of £621m, confirmed our ability to deliver value for shareholders by reshaping SSE. But safety comes first at SSE. In some ways, our performance may have been better than in the previous year but this was completely overshadowed by the death last October of a contractor working on an SSE project. The loss of life at work is why the safety and wellbeing of our team must be the top priority.
In a year in which SSE increased its electricity tariffs in GB, and energy affordability is the priority for regulators and governments, how is SSE factoring this into decision making? I’ve said before that everything that SSE does is ultimately paid for by customers. As a group of energy businesses we must always remember how important it is that people can afford to pay their bills. The energy sector in general, and the cost of energy in particular, will always be under political and regulatory scrutiny. So we have to ensure energy affordability is central to our decision making in each business, and that’s why our focus on controlling costs and operating efficiently is so important. It’s also why we engage constructively with governments and regulators to ensure a balance in delivering reliable and low carbon energy as cost-effectively as we can for customers.
Strategic Report – Executing our long-term strategy
SSE Chief Executive Alistair Phillips-Davies answers questions on SSE’s performance in 2016/17 and looks ahead to 2017/18 and beyond.
11
3.1. Strategic Report 2.
The energy market continues to change at a rapid pace, and innovation and competition are driving this change. Is SSE’s strategic framework still the right one in this rapidly- developing sector? Sector changes mean that to succeed in the future SSE will have to evolve and adapt, as it has in the past. Our strategic framework is consistent over the long term and allows us to exploit opportunities, as well as mitigate risk. It has also seen us undertake some innovative projects, including our distribution business trialling more active network management on Orkney, to prepare it for an increasingly distributed and flexible energy system. Our Wholesale business is involved in the testing of wind turbines that are larger, more efficient and capable of supporting offshore wind projects in deeper waters, such as the Beatrice offshore wind farm. Our strategic framework gives us the foundations from which to innovate, whilst providing great service to our customers, and invest for the future.
How are SSE’s capital expenditure and investment plans to 2020 progressing? We’re pleased with our investment portfolio. Central to our strategy is building, owning and operating assets that bring scale, diversity and balance to the business and any final investment decisions for such assets are determined by the need to secure returns that are clearly greater than the cost of capital, enhance earnings and support the delivery of annual dividend increases that at least keep pace with inflation. We invested around £1.7bn in 2016/17. Over the four years 2016-20 we’re on course to invest around £6bn. This strategic investment is largely in assets that are either economically-regulated or government mandated, such as renewables. This will further transform the SSE Group and support earnings and our commitment to dividend growth.
Has the macro-economic and regulatory risk to SSE escalated due to Brexit and calls from the Scottish Government for a second independence referendum? Politics, regulation and compliance is one of SSE’s principal risks. Whilst these events don’t present an immediate risk to how we serve customers or our investment plans, the level of risk could increase if political uncertainty leads to a prolonged period of legislative or regulatory volatility. Whenever I speak to government I always advocate for as much stability in the operating environment as can be achieved. Our balanced business model is designed, amongst other things, to provide underlying resilience when there is regulatory uncertainty. I do think as well as risks there will be opportunities emerging in this changing environment and we need to identify them.
What do you expect to be the consequences for the energy sector of the UK General Election?Energy was a prominent issue when the election was called. During it, SSE issued a five-part ‘manifesto’ with a series of proposals for building a productive and sustainable UK economy and an energy sector that works for customers. Our balanced business model is designed to ensure SSE is resilient to political changes – for example, operating profit from GB household energy supply comprised around 15% of overall operating profits in 2016/17. We clearly recognise the role of government and regulation in the energy sector, but I’d caution that intervention in a changing market requires a clear objective with broad support and careful consultation on the principles and the detail. This belief will form the basis of our approach to working with the UK government and members of Parliament in the years ahead.
How has SSE invested in the people and culture for future success? This is a critical area for us. Our sector is facing challenges in terms of its diversity, age profile and skillset. We have to therefore
respond. I was pleased that we were the first major UK company to measure the economic value of the skills and capabilities of the people we employ; and are updating this. We did this principally to give us the insights our team needs into how to manage our most critical resource – the people who work for SSE. We’ve put considerable thought into our people and getting the right culture at SSE. This is about attracting talent, investing in a pipeline of apprentices and young people, and building an inclusive and diverse workforce who will achieve our strategic aims.
Is the commitment to the dividend sustainable in the years ahead? Yes. Annual dividend increases, in line with RPI inflation, remains our first financial objective. Our strategic framework and opportunities for growth mean we can deliver a full-year dividend increase that keeps pace with RPI in 2017/18 and in the subsequent years.
What are your personal priorities for 2017/18 and the period to 2020? We know that 2017/18 will present challenges and changes. But that’s a fact of life in the energy sector. Our focus will be on doing what we do well and building on our core strengths. Our long-term approach is to maintain focus, be resilient and ensure we can adapt to external change. So in the coming years, we’ll focus on securing maximum value from our portfolio of Wholesale assets and investments, achieving further efficiencies and customer service improvements in our Networks businesses and giving our Retail and Enterprise customers the products and services they need. In all this our commitment will be to provide long-term value for customers and shareholders.
Alistair Phillips-DaviesChief ExecutiveMay 2017
Our strategic priorities to 2020
The safe and efficient operation of assets and providing the energy products and services that customers rely on.
The disciplined investment in new assets, or the upgrading of existing assets, to support and maintain the balance of the business.
Constructive engagement with regulators and legislators to advocate for clarity and stability, where possible, in the regulatory framework for all three business segments.
12 SSE plc Annual Report 2017
Strategic Report – Executing our long-term strategy
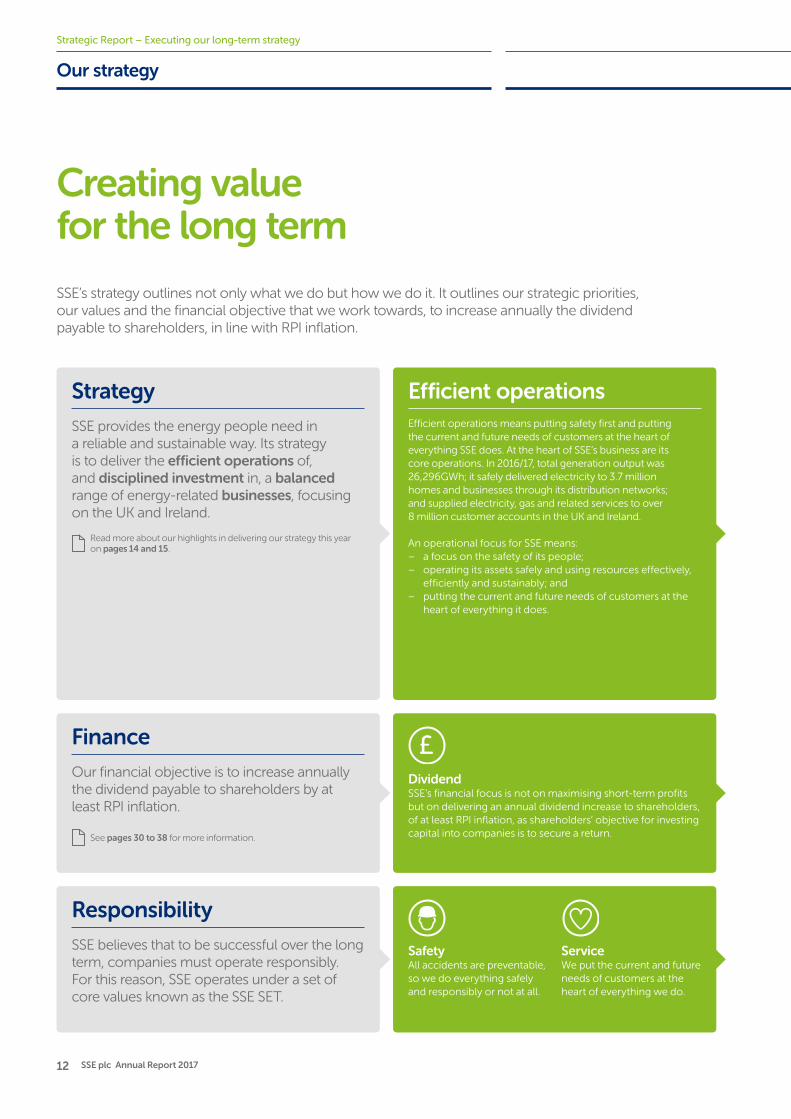
Our strategy
Creating value for the long term
SSE’s strategy outlines not only what we do but how we do it. It outlines our strategic priorities, our values and the financial objective that we work towards, to increase annually the dividend payable to shareholders, in line with RPI inflation.
Strategy
SSE provides the energy people need in a reliable and sustainable way. Its strategy is to deliver the efficient operations of, and disciplined investment in, a balanced range of energy-related businesses, focusing on the UK and Ireland.
Read more about our highlights in delivering our strategy this year on pages 14 and 15.
Efficient operationsEfficient operations means putting safety first and putting the current and future needs of customers at the heart of everything SSE does. At the heart of SSE’s business are its core operations. In 2016/17, total generation output was 26,296GWh; it safely delivered electricity to 3.7 million homes and businesses through its distribution networks; and supplied electricity, gas and related services to over 8 million customer accounts in the UK and Ireland.
An operational focus for SSE means: – a focus on the safety of its people; – operating its assets safely and using resources effectively,
efficiently and sustainably; and – putting the current and future needs of customers at the
heart of everything it does.
DividendSSE’s financial focus is not on maximising short-term profits but on delivering an annual dividend increase to shareholders, of at least RPI inflation, as shareholders’ objective for investing capital into companies is to secure a return.
Safety All accidents are preventable, so we do everything safely and responsibly or not at all.
ServiceWe put the current and future needs of customers at the heart of everything we do.
Finance
Our financial objective is to increase annually the dividend payable to shareholders by at least RPI inflation.
Responsibility
SSE believes that to be successful over the long term, companies must operate responsibly. For this reason, SSE operates under a set of core values known as the SSE SET.
See pages 30 to 38 for more information.
13
3.1. Strategic Report 2.
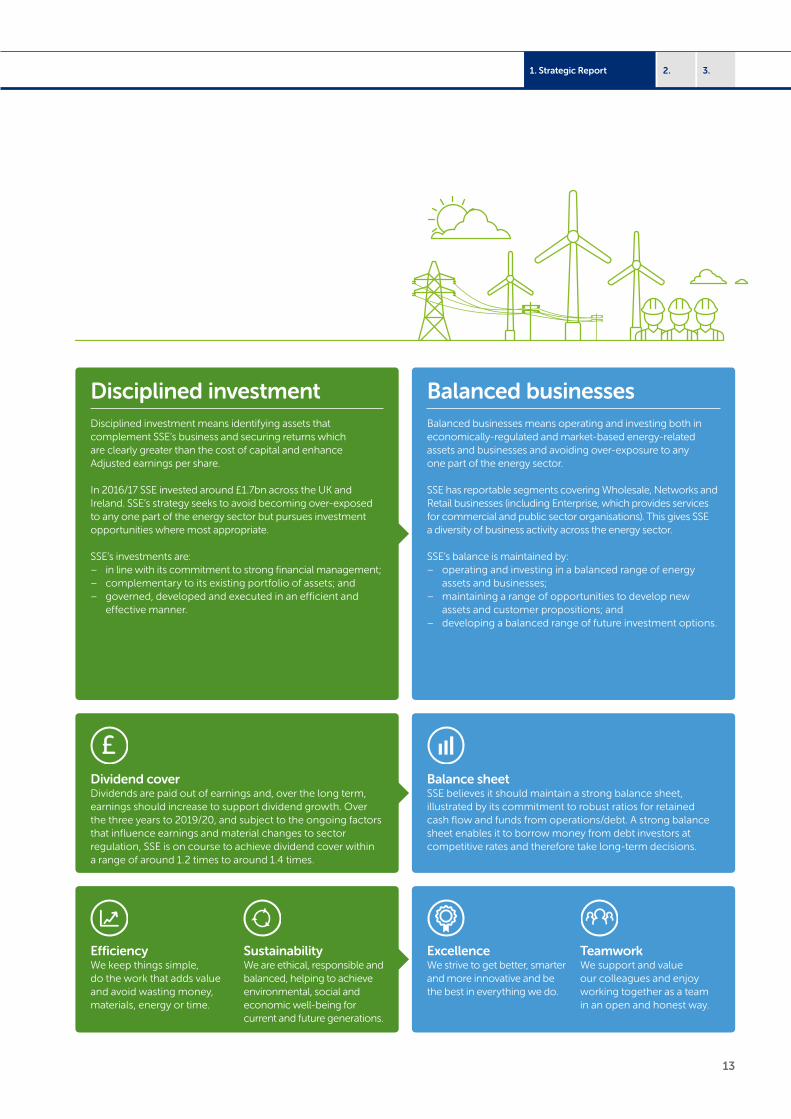
Dividend coverDividends are paid out of earnings and, over the long term, earnings should increase to support dividend growth. Over the three years to 2019/20, and subject to the ongoing factors that influence earnings and material changes to sector regulation, SSE is on course to achieve dividend cover within a range of around 1.2 times to around 1.4 times.
Balance sheetSSE believes it should maintain a strong balance sheet, illustrated by its commitment to robust ratios for retained cash flow and funds from operations/debt. A strong balance sheet enables it to borrow money from debt investors at competitive rates and therefore take long-term decisions.
EfficiencyWe keep things simple, do the work that adds value and avoid wasting money, materials, energy or time.
SustainabilityWe are ethical, responsible and balanced, helping to achieve environmental, social and economic well-being for current and future generations.
ExcellenceWe strive to get better, smarter and more innovative and be the best in everything we do.
TeamworkWe support and value our colleagues and enjoy working together as a team in an open and honest way.
Disciplined investmentDisciplined investment means identifying assets that complement SSE’s business and securing returns which are clearly greater than the cost of capital and enhance Adjusted earnings per share.
In 2016/17 SSE invested around £1.7bn across the UK and Ireland. SSE’s strategy seeks to avoid becoming over-exposed to any one part of the energy sector but pursues investment opportunities where most appropriate.
SSE’s investments are: – in line with its commitment to strong financial management; – complementary to its existing portfolio of assets; and – governed, developed and executed in an efficient and
effective manner.
Balanced businessesBalanced businesses means operating and investing both in economically-regulated and market-based energy-related assets and businesses and avoiding over-exposure to any one part of the energy sector.
SSE has reportable segments covering Wholesale, Networks and Retail businesses (including Enterprise, which provides services for commercial and public sector organisations). This gives SSE a diversity of business activity across the energy sector.
SSE’s balance is maintained by: – operating and investing in a balanced range of energy
assets and businesses; – maintaining a range of opportunities to develop new
assets and customer propositions; and – developing a balanced range of future investment options.
14 SSE plc Annual Report 2017
Performance in 2016/17 and future plans
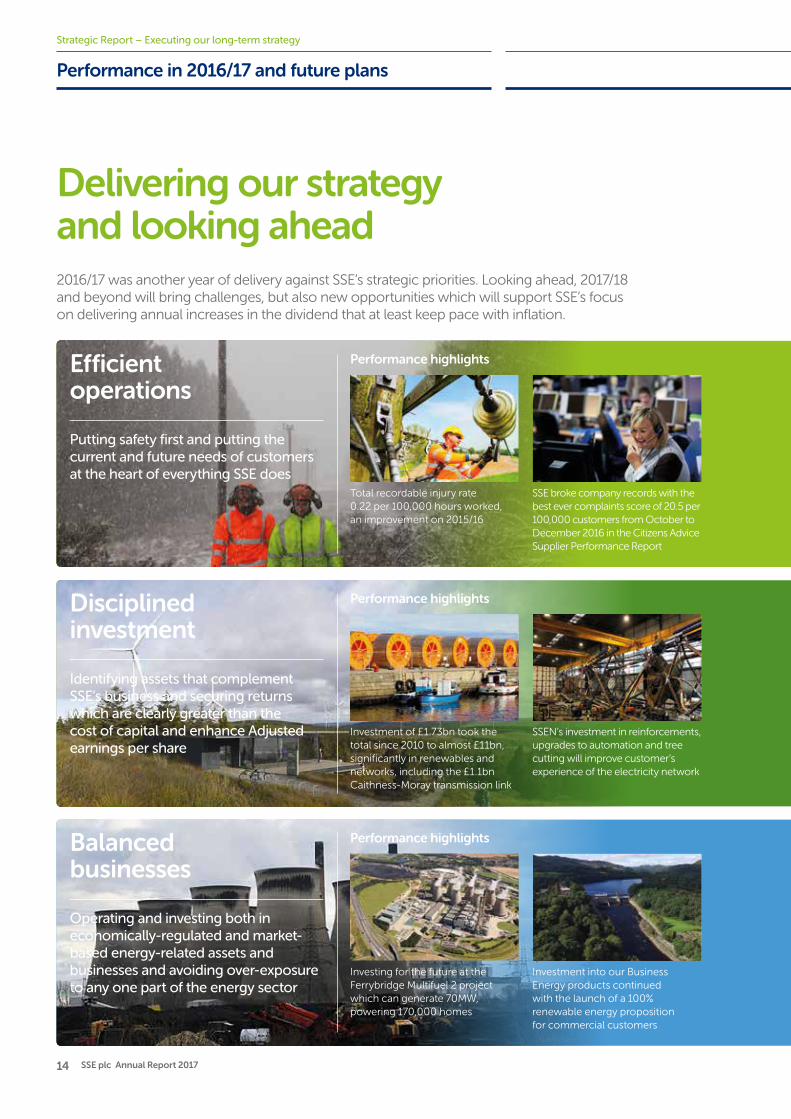
Delivering our strategy and looking ahead 2016/17 was another year of delivery against SSE’s strategic priorities. Looking ahead, 2017/18 and beyond will bring challenges, but also new opportunities which will support SSE’s focus on delivering annual increases in the dividend that at least keep pace with inflation.
Strategic Report – Executing our long-term strategy
Efficient operations
Putting safety first and putting the current and future needs of customers at the heart of everything SSE does
Total recordable injury rate 0.22 per 100,000 hours worked, an improvement on 2015/16
SSE broke company records with the best ever complaints score of 20.5 per 100,000 customers from October to December 2016 in the Citizens Advice Supplier Performance Report
Disciplined investment
Identifying assets that complement SSE’s business and securing returns which are clearly greater than the cost of capital and enhance Adjusted earnings per share
Investment of £1.73bn took the total since 2010 to almost £11bn, significantly in renewables and networks, including the £1.1bn Caithness-Moray transmission link
SSEN’s investment in reinforcements, upgrades to automation and tree cutting will improve customer’s experience of the electricity network
Balanced businesses
Operating and investing both in economically-regulated and market-based energy-related assets and businesses and avoiding over-exposure to any one part of the energy sector
Investing for the future at the Ferrybridge Multifuel 2 project which can generate 70MW, powering 170,000 homes
Investment into our Business Energy products continued with the launch of a 100% renewable energy proposition for commercial customers
Performance highlights
Performance highlights
Performance highlights
15
3.1. Strategic Report 2.
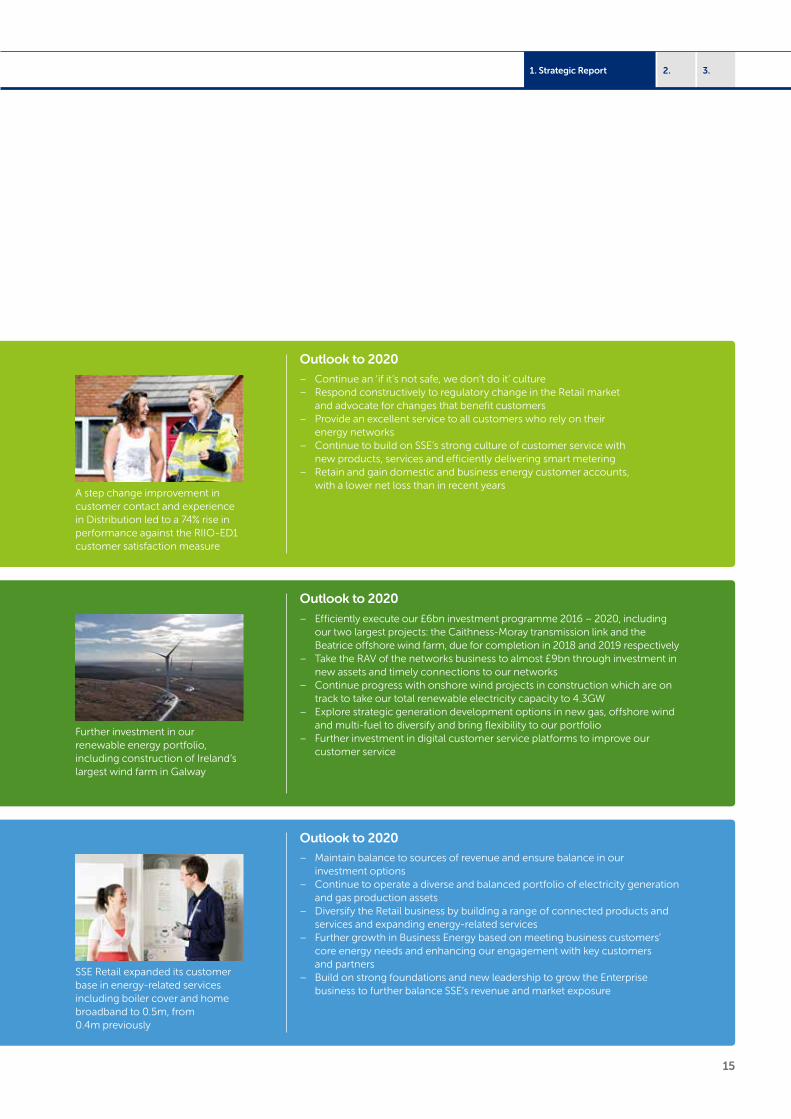
– Continue an ‘if it’s not safe, we don’t do it’ culture – Respond constructively to regulatory change in the Retail market
and advocate for changes that benefit customers – Provide an excellent service to all customers who rely on their
energy networks – Continue to build on SSE’s strong culture of customer service with
new products, services and efficiently delivering smart metering – Retain and gain domestic and business energy customer accounts,
with a lower net loss than in recent years A step change improvement in customer contact and experience in Distribution led to a 74% rise in performance against the RIIO-ED1 customer satisfaction measure
– Efficiently execute our £6bn investment programme 2016 – 2020, including our two largest projects: the Caithness-Moray transmission link and the Beatrice offshore wind farm, due for completion in 2018 and 2019 respectively
– Take the RAV of the networks business to almost £9bn through investment in new assets and timely connections to our networks
– Continue progress with onshore wind projects in construction which are on track to take our total renewable electricity capacity to 4.3GW
– Explore strategic generation development options in new gas, offshore wind and multi-fuel to diversify and bring flexibility to our portfolio
– Further investment in digital customer service platforms to improve our customer service
Further investment in our renewable energy portfolio, including construction of Ireland’s largest wind farm in Galway
– Maintain balance to sources of revenue and ensure balance in our investment options
– Continue to operate a diverse and balanced portfolio of electricity generation and gas production assets
– Diversify the Retail business by building a range of connected products and services and expanding energy-related services
– Further growth in Business Energy based on meeting business customers’ core energy needs and enhancing our engagement with key customers and partners
– Build on strong foundations and new leadership to grow the Enterprise business to further balance SSE’s revenue and market exposure
SSE Retail expanded its customer base in energy-related services including boiler cover and home broadband to 0.5m, from 0.4m previously
Outlook to 2020
Outlook to 2020
Outlook to 2020
16 SSE plc Annual Report 2017
1,726.21,618.7
1,475.3
2015 2016 2017
0.220.230.23
2015 2016 2017
172.0
129.7139.9
2015 2016 2017
304
397
474
2015 2016 2017
7.687.967.35
2015 2016 2017
3,3093,2753,394
2015 2016 2017
125.7119.5124.1
2015 2016 2017
91.389.488.4
2015 2016 2017
1.381.341.40
2015 2016 2017
Carbon intensity of electricity generated (Emissions Relative to MWh output (kg CO
2e per MWh))
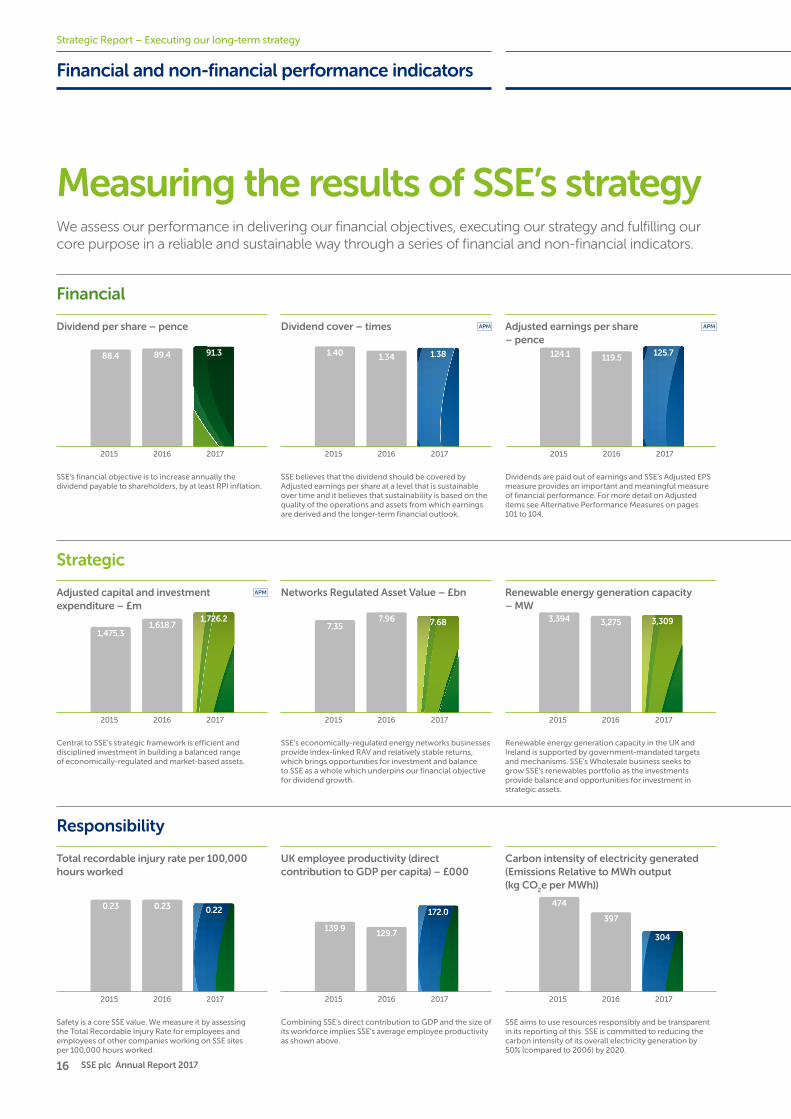
SSE believes that the dividend should be covered by Adjusted earnings per share at a level that is sustainable over time and it believes that sustainability is based on the quality of the operations and assets from which earnings are derived and the longer-term financial outlook.
Dividend cover – times
SSE’s financial objective is to increase annually the dividend payable to shareholders, by at least RPI inflation.
Dividend per share – pence
Financial and non-financial performance indicators
Measuring the results of SSE’s strategy We assess our performance in delivering our financial objectives, executing our strategy and fulfilling our core purpose in a reliable and sustainable way through a series of financial and non-financial indicators.
Financial
Adjusted earnings per share – pence
Dividends are paid out of earnings and SSE’s Adjusted EPS measure provides an important and meaningful measure of financial performance. For more detail on Adjusted items see Alternative Performance Measures on pages 101 to 104.
Total recordable injury rate per 100,000 hours worked
UK employee productivity (direct contribution to GDP per capita) – £000
Responsibility
Central to SSE’s strategic framework is efficient and disciplined investment in building a balanced range of economically-regulated and market-based assets.
Safety is a core SSE value. We measure it by assessing the Total Recordable Injury Rate for employees and employees of other companies working on SSE sites per 100,000 hours worked.
Combining SSE’s direct contribution to GDP and the size of its workforce implies SSE’s average employee productivity as shown above.
SSE aims to use resources responsibly and be transparent in its reporting of this. SSE is committed to reducing the carbon intensity of its overall electricity generation by 50% (compared to 2006) by 2020.
SSE’s economically-regulated energy networks businesses provide index-linked RAV and relatively stable returns, which brings opportunities for investment and balance to SSE as a whole which underpins our financial objective for dividend growth.
Renewable energy generation capacity in the UK and Ireland is supported by government-mandated targets and mechanisms. SSE’s Wholesale business seeks to grow SSE’s renewables portfolio as the investments provide balance and opportunities for investment in strategic assets.
Strategic
Networks Regulated Asset Value – £bn Renewable energy generation capacity – MW
Adjusted capital and investment expenditure – £m
Strategic Report – Executing our long-term strategy
For information on the performance of SSE’s Wholesale, Networks, Retail and Enterprise businesses in 2016/17, see pages 40 to 53.
17
3.1. Strategic Report 2.
385454
506
2015 2016 2017
158.4
46.155.3
2015 2016 2017
8%
32%14%
46%
23%27%
50%
23%28%
49%
31.4%
68.6%
1,776.6
593.3735.2
2015 2016 2017
1,545.91,513.51,564.7
2015 2016 2017
Financial
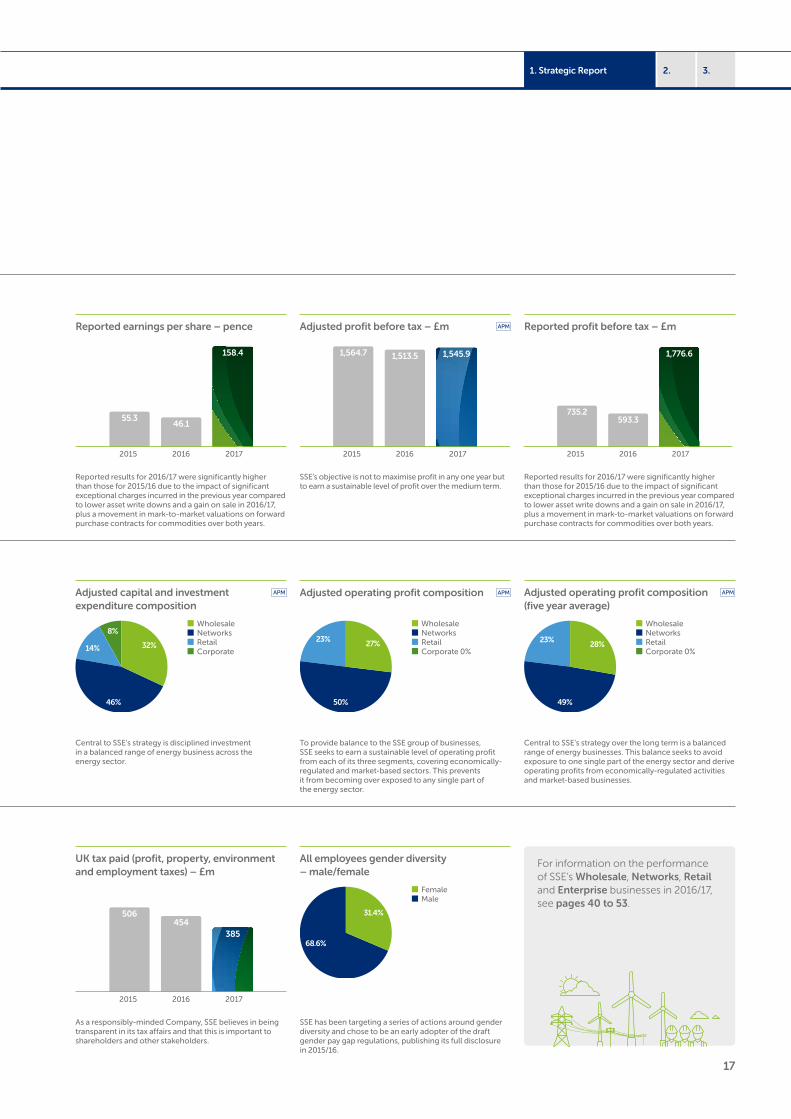
Reported profit before tax – £m
Reported results for 2016/17 were significantly higher than those for 2015/16 due to the impact of significant exceptional charges incurred in the previous year compared to lower asset write downs and a gain on sale in 2016/17, plus a movement in mark-to-market valuations on forward purchase contracts for commodities over both years.
Reported results for 2016/17 were significantly higher than those for 2015/16 due to the impact of significant exceptional charges incurred in the previous year compared to lower asset write downs and a gain on sale in 2016/17, plus a movement in mark-to-market valuations on forward purchase contracts for commodities over both years.
Adjusted profit before tax – £m
SSE’s objective is not to maximise profit in any one year but to earn a sustainable level of profit over the medium term.
Reported earnings per share – pence
UK tax paid (profit, property, environment and employment taxes) – £m
All employees gender diversity – male/female
Responsibility
As a responsibly-minded Company, SSE believes in being transparent in its tax affairs and that this is important to shareholders and other stakeholders.
SSE has been targeting a series of actions around gender diversity and chose to be an early adopter of the draft gender pay gap regulations, publishing its full disclosure in 2015/16.
Central to SSE’s strategy is disciplined investment in a balanced range of energy business across the energy sector.
Strategic
Adjusted capital and investment expenditure composition
Wholesale Networks Retail Corporate
Wholesale Networks Retail Corporate 0%
Wholesale Networks Retail Corporate 0%
Female Male
To provide balance to the SSE group of businesses, SSE seeks to earn a sustainable level of operating profit from each of its three segments, covering economically-regulated and market-based sectors. This prevents it from becoming over exposed to any single part of the energy sector.
Central to SSE’s strategy over the long term is a balanced range of energy businesses. This balance seeks to avoid exposure to one single part of the energy sector and derive operating profits from economically-regulated activities and market-based businesses.
Adjusted operating profit composition Adjusted operating profit composition (five year average)
18 SSE plc Annual Report 2017
Managing our environmental impacts
Reducing our carbon emissions
A sustainable climate change strategySSE’s most material environmental impact is the carbon it emits when generating electricity. Its strategy is to transition to a low carbon energy system by reducing the carbon intensity of the electricity it generates. To do this it is undertaking a strategic shift away from carbon intensive fossil fuel generation towards electricity generation from more efficient thermal generation and renewable sources. At its core is a long-standing commitment to reduce the carbon intensity of its electricity generation by 50% by 2020, using 2006 performance as its baseline.
SSE’s performance in managing climate change impacts led CDP to award SSE an A- in 2016 and include it in the global Climate Disclosure Leadership Index.
Risks and opportunities to SSE’s business from climate changeClimate change, and the imperative to decarbonise energy systems, creates both risks and opportunities for SSE. In response to a heightened awareness from investors and other stakeholders, SSE has considered the way in which climate change is best reflected in its assessment of Group Principal Risks. The framework for managing these risks is outlined on pages 24 to 27. Furthermore, SSE’s Sustainability Report 2017 and CDP submission 2017 outline in more detail the risks and opportunities associated with climate change for the SSE Group.
Taking action on climate changeTo bring about a change in carbon performance, SSE has:
– invested significantly in renewable energy (£3.2bn since 2010) and has the largest renewable energy capacity in the UK and Ireland at 3,309MW;
– switched from thermal (primarily coal) to renewables generation with coal output contributing 3.4% of output and renewables contributing 30% of output in 2016/17 (22% and nearly 35% respectively in 2015/16); and
Managing the issues of climate change, resource use and waste is gaining significant interest from stakeholders interested in the impacts of these issues on business performance and long term viability. SSE has an important role to play in driving a low carbon transition as well as improving its environmental performance and disclosure.
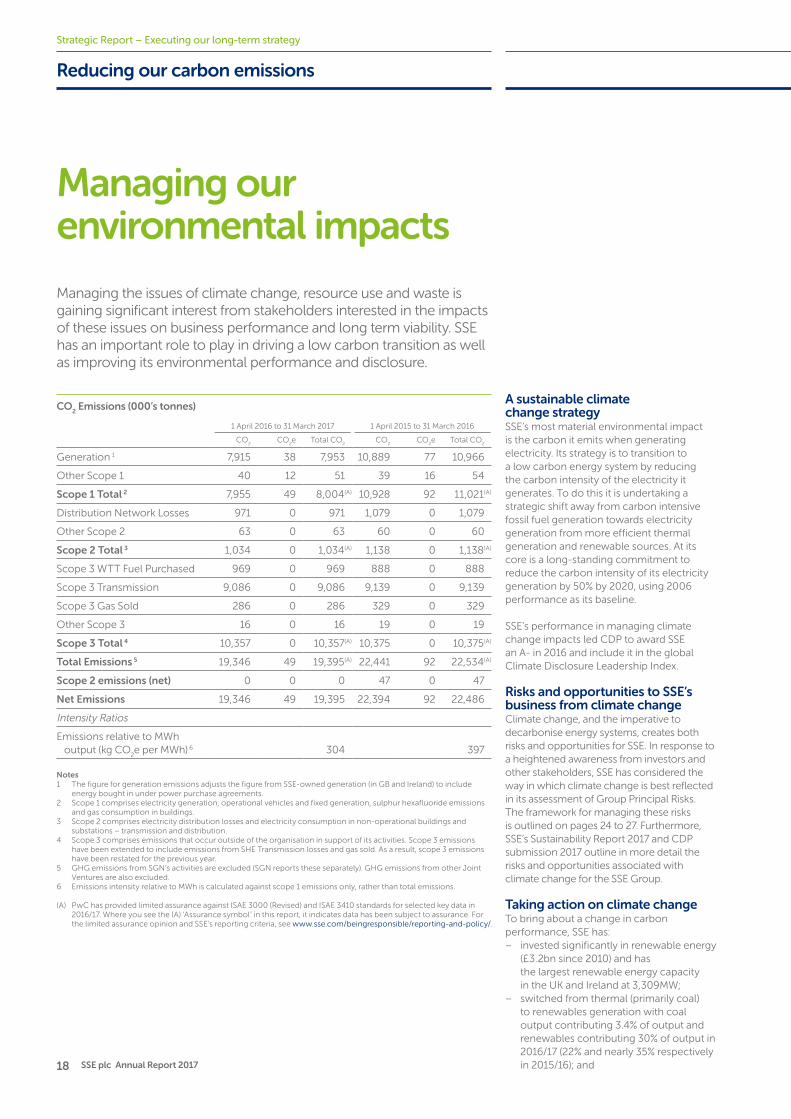
CO2 Emissions (000’s tonnes)
1 April 2016 to 31 March 2017 1 April 2015 to 31 March 2016
CO2
CO2e Total CO
2CO
2CO
2e Total CO
2
Generation 1 7,915 38 7,953 10,889 77 10,966
Other Scope 1 40 12 51 39 16 54
Scope 1 Total 2 7,955 49 8,004(A) 10,928 92 11,021(A)
Distribution Network Losses 971 0 971 1,079 0 1,079
Other Scope 2 63 0 63 60 0 60
Scope 2 Total 3 1,034 0 1,034(A) 1,138 0 1,138(A)
Scope 3 WTT Fuel Purchased 969 0 969 888 0 888
Scope 3 Transmission 9,086 0 9,086 9,139 0 9,139
Scope 3 Gas Sold 286 0 286 329 0 329
Other Scope 3 16 0 16 19 0 19
Scope 3 Total 4 10,357 0 10,357(A) 10,375 0 10,375(A)
Total Emissions 5 19,346 49 19,395(A) 22,441 92 22,534(A)
Scope 2 emissions (net) 0 0 0 47 0 47
Net Emissions 19,346 49 19,395 22,394 92 22,486
Intensity Ratios
Emissions relative to MWh output (kg CO
2e per MWh) 6 304 397
Notes1 The figure for generation emissions adjusts the figure from SSE-owned generation (in GB and Ireland) to include
energy bought in under power purchase agreements.2 Scope 1 comprises electricity generation, operational vehicles and fixed generation, sulphur hexafluoride emissions
and gas consumption in buildings.3 Scope 2 comprises electricity distribution losses and electricity consumption in non-operational buildings and
substations – transmission and distribution.4 Scope 3 comprises emissions that occur outside of the organisation in support of its activities. Scope 3 emissions
have been extended to include emissions from SHE Transmission losses and gas sold. As a result, scope 3 emissions have been restated for the previous year.
5 GHG emissions from SGN’s activities are excluded (SGN reports these separately). GHG emissions from other Joint Ventures are also excluded.
6 Emissions intensity relative to MWh is calculated against scope 1 emissions only, rather than total emissions.
(A) PwC has provided limited assurance against ISAE 3000 (Revised) and ISAE 3410 standards for selected key data in 2016/17. Where you see the (A) ‘Assurance symbol’ in this report, it indicates data has been subject to assurance. For the limited assurance opinion and SSE’s reporting criteria, see www.sse.com/beingresponsible/reporting-and-policy/.
Strategic Report – Executing our long-term strategy
19
3.1. Strategic Report 2.
2012/132011/12
0
10,000
20,000
30,000
40,000
50,000
2013/14 2014/15 2015/16 2016/17
Car
bo
n e
mis
sio
ns
(00
0s
ton
nes
CO
2e)
Ou
tpu
t (G
wh
)
0
10,000
20,000
30,000
– enabled more renewable generation to connect to the electricity network by investing close to £1.9bn since the Transmission price control period began in 2013 in new electricity infrastructure that has allowed the connection 500MW of new renewable generation capacity in 2016/17.
In addition, SSE has been advocating for carbon pricing by engaging with government officials, the Committee on Climate Change and collaborated with partners to publish an open letter in the Financial Times in September 2016. The decision by the UK Government to maintain the Carbon Price Floor up to 2021 at the current carbon price support level, as well as the tightening of the EU ETS to close the global emissions gap to keep global temperature changes to well below 2°C of pre-industrial levels, was welcomed by SSE.
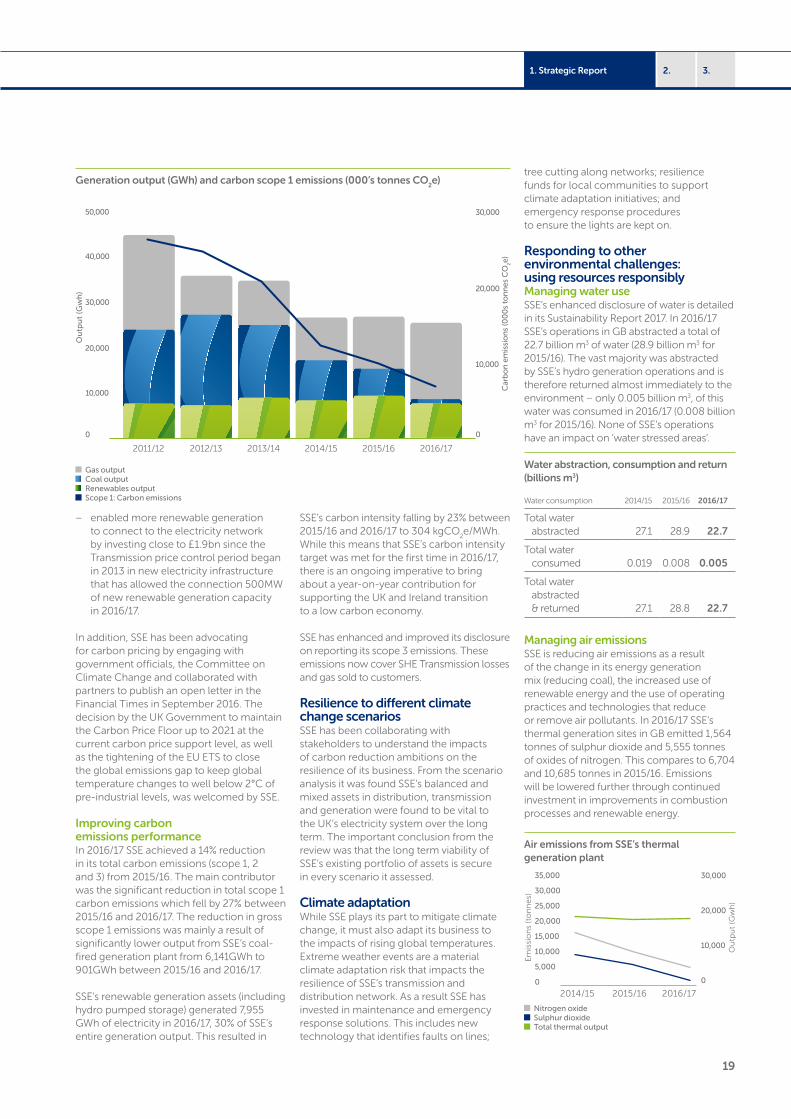
Improving carbon emissions performanceIn 2016/17 SSE achieved a 14% reduction in its total carbon emissions (scope 1, 2 and 3) from 2015/16. The main contributor was the significant reduction in total scope 1 carbon emissions which fell by 27% between 2015/16 and 2016/17. The reduction in gross scope 1 emissions was mainly a result of significantly lower output from SSE’s coal- fired generation plant from 6,141GWh to 901GWh between 2015/16 and 2016/17.
SSE’s renewable generation assets (including hydro pumped storage) generated 7,955 GWh of electricity in 2016/17, 30% of SSE’s entire generation output. This resulted in
SSE’s carbon intensity falling by 23% between 2015/16 and 2016/17 to 304 kgCO
2e/MWh.
While this means that SSE’s carbon intensity target was met for the first time in 2016/17, there is an ongoing imperative to bring about a year-on-year contribution for supporting the UK and Ireland transition to a low carbon economy.
SSE has enhanced and improved its disclosure on reporting its scope 3 emissions. These emissions now cover SHE Transmission losses and gas sold to customers.
Resilience to different climate change scenariosSSE has been collaborating with stakeholders to understand the impacts of carbon reduction ambitions on the resilience of its business. From the scenario analysis it was found SSE’s balanced and mixed assets in distribution, transmission and generation were found to be vital to the UK’s electricity system over the long term. The important conclusion from the review was that the long term viability of SSE’s existing portfolio of assets is secure in every scenario it assessed.
Climate adaptationWhile SSE plays its part to mitigate climate change, it must also adapt its business to the impacts of rising global temperatures. Extreme weather events are a material climate adaptation risk that impacts the resilience of SSE’s transmission and distribution network. As a result SSE has invested in maintenance and emergency response solutions. This includes new technology that identifies faults on lines;
tree cutting along networks; resilience funds for local communities to support climate adaptation initiatives; and emergency response procedures to ensure the lights are kept on.
Responding to other environmental challenges: using resources responsiblyManaging water useSSE’s enhanced disclosure of water is detailed in its Sustainability Report 2017. In 2016/17 SSE’s operations in GB abstracted a total of 22.7 billion m3 of water (28.9 billion m3 for 2015/16). The vast majority was abstracted by SSE’s hydro generation operations and is therefore returned almost immediately to the environment – only 0.005 billion m3, of this water was consumed in 2016/17 (0.008 billion m3 for 2015/16). None of SSE’s operations have an impact on ‘water stressed areas’.
Water abstraction, consumption and return (billions m3)
Water consumption 2014/15 2015/16 2016/17
Total water abstracted 27.1 28.9 22.7
Total water consumed 0.019 0.008 0.005
Total water abstracted & returned 27.1 28.8 22.7
Managing air emissions SSE is reducing air emissions as a result of the change in its energy generation mix (reducing coal), the increased use of renewable energy and the use of operating practices and technologies that reduce or remove air pollutants. In 2016/17 SSE’s thermal generation sites in GB emitted 1,564 tonnes of sulphur dioxide and 5,555 tonnes of oxides of nitrogen. This compares to 6,704 and 10,685 tonnes in 2015/16. Emissions will be lowered further through continued investment in improvements in combustion processes and renewable energy.
0
10,000
5,000
15,000
25,000
20,000
35,000
30,000
2015/16 2016/172014/15
Ou
tpu
t (G
wh
)
Em
issi
on
s (t
on
ne
s)
0
10,000
20,000
30,000
Air emissions from SSE’s thermal generation plant
Nitrogen oxide Sulphur dioxide Total thermal output
Gas output Coal output Renewables output Scope 1: Carbon emissions
Generation output (GWh) and carbon scope 1 emissions (000’s tonnes CO2e)
20 SSE plc Annual Report 2017
Investing in a diverse team, built on core values
Our people and our values
SSE’s current and future success depends upon the talents, skills and motivation of the people it employs. The strategic development of human capital value is therefore critical to SSE’s long-term success.
Strategic Report – Executing our long-term strategy
Key workforce metrics
2016/17 2015/16
Total number of employees 1 Number 21,157 21,118
Retention rate 2 % 86 89
Total recruitment 3 Number 3,227 2,763
Employee gender (female) % 31.4 30.9
Average age Years 40 40
Employee engagement index 4 % n/a 77
Learning and development expenditure £m 18.9 17.2
Total number of training interventions 6 Number 103,688 63,052
Investment in pipelines 7 £m 9.4 12.7
UK Productivity (GVA per capita) 8 £ 172,000 129,670
Productivity compared to UK average 9 n:n 3.1:1 2.4:1
Whistle-blowing cases raised 10 Number 88 41
1 Total headcount at 31 March 2017, including employees within Windtowers Ltd.2 Excludes end of fixed term contracts and internal transfers.3 External recruitment only.4 Total expenditure in learning and development, internal and external, including talent pipelines.5 Externally facilitated company-wide employee engagement survey, not available until July 2017.6 Including targeting courses, workshops, seminars on e-learning packages.7 The total cost of providing apprentice, graduate, technical skills and employability training programmes.8 Based on SSE’s direct contribution to UK GDP and directly employed employees, analysis undertaken by PwC.9 Ratio of SSE’s UK labour productivity to the UK’s national productivity (source: PwC).10 Number of cases reported to SSE’s independent whistle-blow line.
Responding to strategic challenges: skills shortages and greater diversityThe strategic human capital challenges SSE has articulated regularly in recent years remain key. The strategy is to anticipate the skills gaps that are looming in the early 2020s by attracting a wide and diverse range of entry level talent into SSE’s pipeline programmes. These pipelines include employability programmes, apprenticeships, higher level technical skills trainees and engineering graduates.
The solution to the second strategic challenge, a lack of diversity, is complementary to the first. Because of the skills gap SSE has a unique opportunity to become a more inclusive employer, improve its attractiveness to a diverse set of applicants and to build a pipeline of new talent that more closely reflects the communities SSE serves.
Creating a workforce for the futureSSE offers a range of structured programmes designed for school leavers, apprentices, trainee engineers and graduates. These pipelines introduce hundreds of young people into SSE every year and represent the single most important way SSE builds its future workforce.
While the financial investment in its pipeline programmes in 2016/17 was £9.4m, representing a fall in investment since 2015/16, the number of individuals participating increased to 1,277 from 859 in 2015/16. The increase is dominated by a concerted effort to develop existing employees working in customer service, progressing from Level 2 to Level 3 qualifications, supporting SSE’s strategy to continue to differentiate itself on the basis of sector leading customer service.
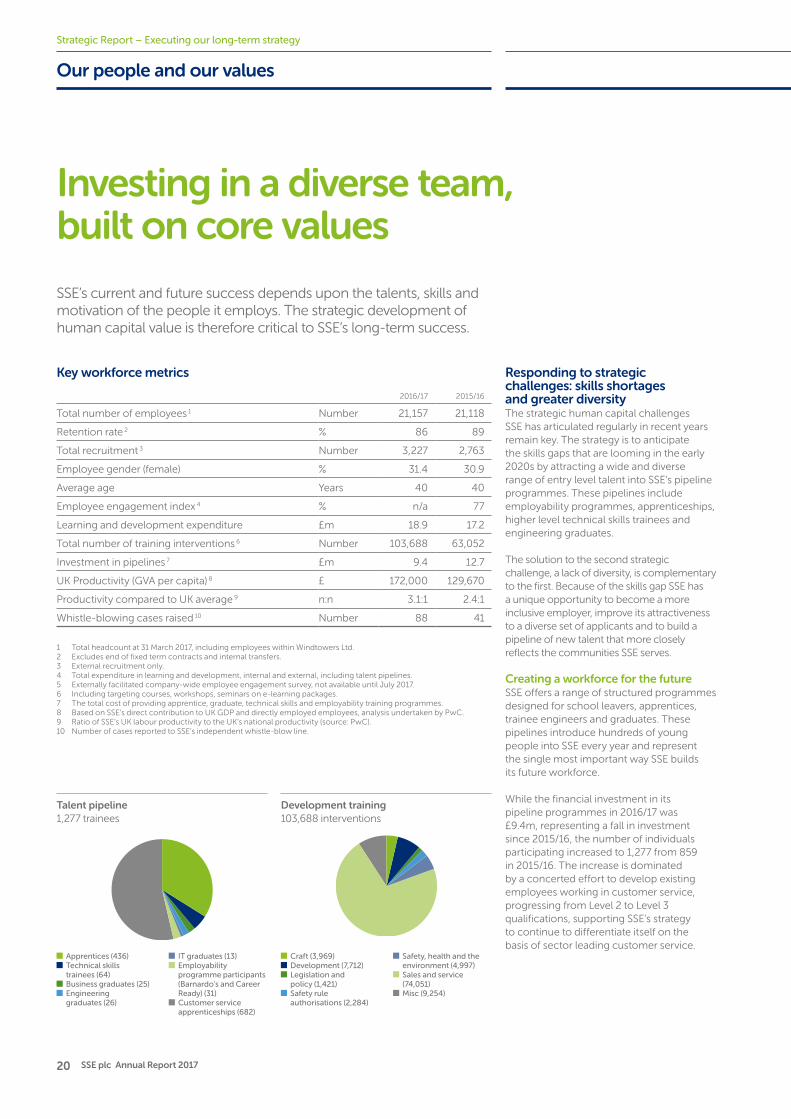
Talent pipeline 1,277 trainees
Apprentices (436) Technical skills trainees (64)
Business graduates (25) Engineering graduates (26)
IT graduates (13) Employability programme participants (Barnardo’s and Career Ready) (31)
Customer service apprenticeships (682)
Development training 103,688 interventions
Craft (3,969) Development (7,712) Legislation and policy (1,421)
Safety rule authorisations (2,284)
Safety, health and the environment (4,997)
Sales and service (74,051)
Misc (9,254)
21
3.1. Strategic Report 2.
Talent pipelinesThere were 1,277 trainees on a pipeline programme in 2016/17. See pie chart on page 20.
Beyond this focus on pipelines of new talent, SSE invests in its people through talent development, management training, technical training, customer service development and the delivery of particular issues based knowledge and skills through electronic learning techniques. This development activity is predominately delivered internally, ensuring the skills and knowledge learnt are bespoke and designed for SSE’s particular circumstances.
Development training103,688 training interventions were delivered internally in 2016/17. See pie chart on page 20.
2016/17 saw a step change in the way SSE delivers continuous learning and development across its workforce. The establishment of a new Learning Management System has provided the opportunity to deliver significantly more training opportunities online. There has been greater focus on training for compliance, and significantly more individual interventions supporting higher quality customer service. The ability to track and monitor employee participation and the efficacy of training programmes has also improved.
Furthermore, the momentum in delivering SSE’s Smart Meter programme increased significantly in 2016/17. The nature and demand of the programme means there is a shortage of smart meter operatives in the labour market; therefore SSE is both redeploying existing meter reading employees and recruiting individuals with the aptitude to be skilled smart meter operative installers and putting them through a comprehensive training and assessment programme. In 2016/17 583 smart meter operatives were recruited to SSE’s Smart Meter programme.
Inclusion and diversitySSE’s efforts to improve its inclusiveness have prioritised gender representation in the short term. Further disclosure relating to other protected characteristic contained within the Equalities Act, including disability, can be found in the Sustainability Report 2017. In relation to gender diversity, the proportion of women within SSE has, once again, risen marginally from 30.9% to 31.4%.
SSE chose to be an early adopter of the draft gender pay gap regulations in 2015/16 and published its full disclosure in its Sustainability Report 2016. The full disclosure for 2016/17
is published, once again, in its Sustainability Report available on see.com. This exercise proved to be very instructive to SSE’s strategy to improve inclusion and diversity and supported the formation of its strategy of ‘in, on and up’.
In: The first level of the inclusion and diversity programme is to attract more women applicants into SSE. Some progress was made in 2016/17. The proportion of women being recruited externally has risen from 33% in 2014/15, to 37% in 2015/16 and to 39% in 2016/17. It is worth noting that the short term impact of attracting higher proportions of entry level women, may actually influence the gender pay gap in a negative direction. Nevertheless, SSE believes the longer term prize of an organisation more reflective of the society it serves is more important. Furthermore, SSE understands that the barriers to a career in the energy industry are deep and cultural, therefore SSE has a role to encourage non-traditional entrants into the industry and has a partnership with Teach First to influence the uptake of STEM subjects by girls in schools in England and Wales.
On: Retaining women within the organisation is particularly important given the relative success, so far, of efforts to attract more women entrants. There are many initiatives targeting this group from enhanced flexible working practices and investment in connected working technology to the development of STEM and senior women networks. Most recently maternity, adoption and paternity benefit offerings have been significantly enhanced. Whilst this includes a substantial increase in the level of paid leave, it also sees the introduction of a gradual phasing in the return to work for maternity and adoption leavers, with no reduction in salary. New ways of flexible working are being piloted for employees moving to SSE’s new Forbury Place development in Reading, with a view to this being rolled out across the wider organisation.
Up: Creating the conditions whereby more women are present in the highest levels of the organisation is expected to take time. A number of initiatives are in place, in particular, the establishment of a ‘Shadow Board’ of diverse emerging talent for SSE’s Wholesale business has proved to be an interesting pilot due to be rolled out in new areas of the SSE group in the year ahead. The first target set is a simple one, where the proportion of women earning over £40,000 will rise to 25% by 2025. In 2016/17 the proportion was 12.8%, representing a rise of 8% since 2015/16.
Sustainable employment ethosAt the centre of SSE’s human capital strategy is an ethos about the way in which the talents and abilities of people flourish. This approach gives a signal to its employees that they are valued and that worthwhile, rewarding careers can be built with SSE. In return, SSE looks to its employees to be engaged, motivated and committed, delivering for both customers and shareholders over the long term.
A focus on career progression and recruiting senior positions
from within
A preference for direct employment as opposed to
out-sourcing core work
A preference for direct employment and a presumption against offshoring work outside
of the UK and Republic of Ireland
Career progressionThrough 2016/17, 3,826 employment vacancies were filled across SSE. Of those 3,826 vacancies, 16% were filled from internal applicants. However, at the most senior levels, where talent and succession is managed closely, 34 vacancies were filled. Of those, nearly 60% were awarded to internal applicants.
Out-sourcingThere is a clear preference to directly deliver core work in house. On the occasions where it is necessary to use external contractors to support peak demand or transitional change, SSE insists on a number of core standards in relation to health and safety and conditions of service. In 2016/17, SSE took the decision to extend its Living Wage commitment in its supply chain. Rather than simply ensuring that regular contractors working on SSE’s sites receive the real Living Wage, (as required by the Living Wage Foundation) from 1 April 2017 every new contract will include a requirement to ensure that everyone UK based providing regular services to SSE’s customers will receive the Living Wage.
22 SSE plc Annual Report 2017
Our people and our values continued
Strategic Report – Executing our long-term strategy
RedeploymentChange is an ongoing feature of the energy market and SSE must be able to respond to changing conditions and markets. To remain competitive and efficient SSE has had to review and either restructure or cease several operations in 2016/17. In all instances, it has sought to fully consult with those employees impacted and to offer opportunities for retraining and redeployment where possible. One such example of this is the Retail shops in the north of Scotland. To ensure opportunities are available to employees affected by change in the organisation, a number of vacancies are advertised internally only. In 2016/17, 306 vacancies were opened to internal applicants only.
An engaged workforceTeamwork is one of six enduring values that guide employees in their day-to-day working lives in SSE. It is underpinned by an ethic of mutual respect and is defined as:
Teamwork: we support and value our colleagues and enjoy working together in an open and honest way.
SSE has undertaken an annual survey of employee opinion for many years. A review of the survey in 2016/17 considered feedback and decided to adjust the frequency of the survey to every two years to allow sufficient time to understand, plan and report back on progress with action plans to all employees. The next survey is being run in the early summer of 2017. The objective of the new survey is to gather instructive data on SSE’s business culture, as well as gather signals on issues such as inclusiveness, engagement and strategy.
Headline results from that survey will be published on sse.com/beingresponsible in the summer of 2017.
Rewarding employee contributionPerformance management is undertaken comprehensively throughout SSE. Its objective is to create a framework for continuous feedback and improvement in line with business goals. Above all, this approach is designed to ensure the safe operation of SSE’s businesses and the reliable provision of service to customers. Alongside assessing performance against agreed objectives, the process assesses the extent to which each individual, including the senior management team, demonstrate their support for SSE’s core values of Safety, Service, Excellence, Sustainability, Efficiency and Teamwork.
The opportunity to grow and develop a career has the greatest impact on employee
commitment but it is also understood that employee benefits make an important contribution to both employee engagement and the attractiveness of SSE as a place to choose to work.
– Employee benefits: a significantly enhanced package of employee benefits was established in 2016/17. A more flexible and family friendly package includes significant improvement to parental benefits, more flexibility for unexpected situations and a new ‘gradual return to work’ offer for returning mothers. This package has been deliberately designed to reflect modern lives and support SSE’s efforts to become a more inclusive and diverse organisation. There has also been a strong focus on delivering additional health related benefits to support employee wellbeing.
– Sharing success: SSE actively encourages it employees to own SSE shares, offering both an employee Share Incentive Plan (SIP) and a Sharesave scheme, with participation rates at 73% and 41% respectively.
– SSE pension schemes: SSE has taken measures to help employees plan and save for their financial future and has proactively enrolled new employees onto its pension schemes since 2005. 97% of SSE’s employees in 2016/17 chose to save for their future through one of SSE’s pension schemes. Recent supplier negotiations have improved the value that employees get from these schemes, with affinity benefits and reduced management charges.
Fairness at workSSE’s Human Rights policy specifically respects the right of its employees to join a trade union. SSE recognises four trade unions and a Joint Negotiating and Consultative Committee (JNCC) continue to provide the structure by which industrial relations are conducted. 66% of SSE’s employees are covered by the negotiating arrangements under the JNCC.
SSE has a range of employment policies in place to ensure that all people, including those with disabilities, are dealt with fairly during the recruitment process, and that all people have access to training and development opportunities with SSE.
Believing that its employees deserve at least to earn a rate of pay that enables them to live a decent life, SSE continues to be an accredited Living Wage employer in the UK and pays its employees in Ireland the Irish Living Wage.
Reinforcing an ethical business cultureCode of ethical business conductIn 2016/17 SSE published a new code: Doing the right thing: A guide to ethical business conduct for SSE employees. The new code is a development from the previous version as it more explicitly outlines the steps employees should take to ensure that their day-to-day actions and decisions are consistent both with SSE’s values and rules. SSE engaged proactively with the Institute of Business Ethics to ensure the new code reflected best practice. The implementation of the code is ongoing, with regular issue driven awareness raising campaigns alongside the delivery of a range of training packages.
Creating a culture of speaking upBuilding on the establishment of a new whistleblowing policy in 2015/16, SSE worked throughout 2016/17 to actively promote the Speak Up policy, alongside awareness raising of Doing the right thing: A guide to ethical business conduct for SSE employees. As a result, the number of whistle-blowing reports has more than doubled between 2015/16 and 2016/17 from 41 to 88. This increase is welcome as it confirms that the efforts to promote Speak Up are having an impact. Analysis is being undertaken to carefully track trends and an aftercare process is being introduced to get feedback on the experience from those reporting issues through this approach.
Human rightsSSE’s Human Rights Policy outlines the fundamental principles that guide SSE, recognising that in both its direct employment and through its supply chain, human rights must be actively respected and protected. The policy also outlines SSE’s commitment to meeting the provision of the UK’s Modern Slavery Act and SSE’s second Modern Slavery Statement is published on sse.com.
More information: SSE is committed to the ongoing development of workforce metrics and works with a number of stakeholders to provide more data that supports its human capital strategy. More information and disclosure can be found in SSE’s Sustainability Report 2017.

1. Strategic Report 2. 3.
23
Creating a workforce for the futureSSE offers a range of structured programmes designed for school leavers, apprentices, trainee engineers and graduates. These pipelines introduce hundreds of young people into SSE every year and represent the single most important way SSE builds its future workforce.
In 2016/17 the number of individuals participating in SSE’s talent pipelines was 1,277.
24 SSE plc Annual Report 2017
Corporate Governance Framework
StrategicFramework
Risk Management Framework
AssuranceFramework
Standards and QualityFramework
Board
Board Committees
Executive Committee
Executive Sub-Committees
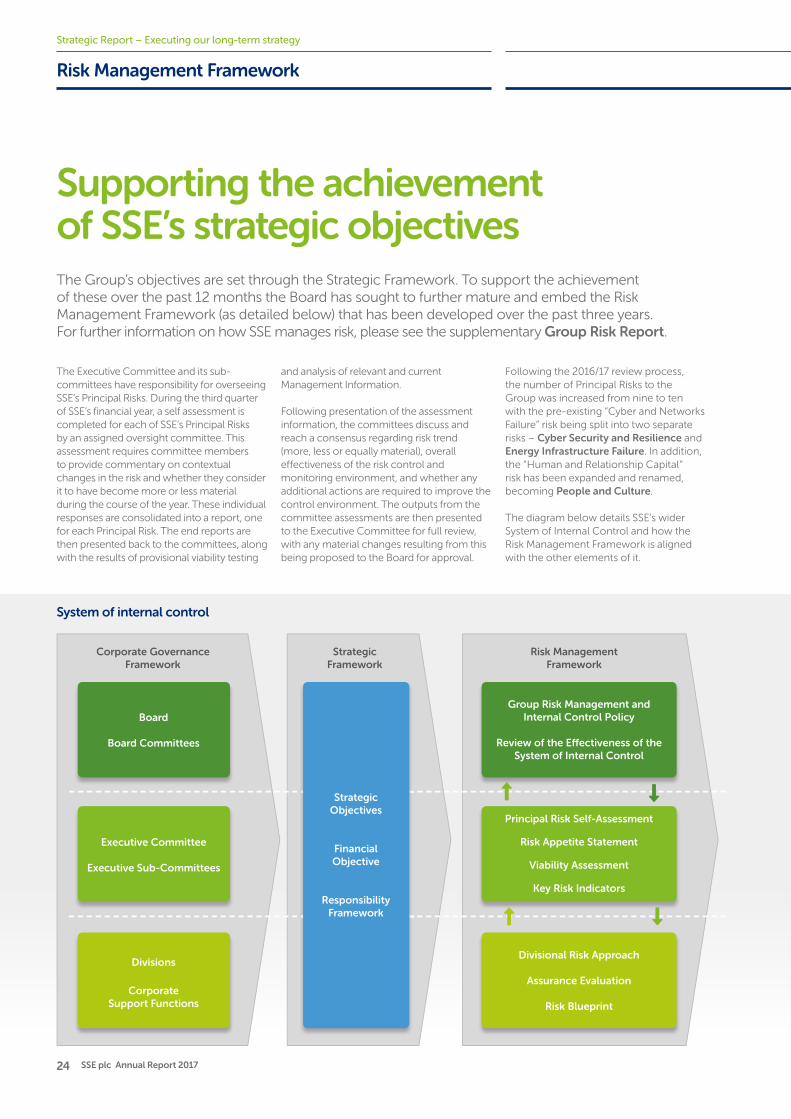
StrategicObjectives
FinancialObjective
ResponsibilityFramework
Divisions
CorporateSupport Functions
Group Risk Management and Internal Control Policy
Review of the E�ectiveness of theSystem of Internal Control
External Audit
Internal Audit
Group Compliance
Group SHE
Large Capital Projects Services
BusinessAssurance
Group Policies
Divisional Procedures, Processes and Systems
GovernanceManuals
Principal Risk Self-Assessment
Risk Appetite Statement
Viability Assessment
Key Risk Indicators
Divisional Risk Approach
Assurance Evaluation
Risk Blueprint
Supporting the achievement of SSE’s strategic objectives
Risk Management Framework
The Group’s objectives are set through the Strategic Framework. To support the achievement of these over the past 12 months the Board has sought to further mature and embed the Risk Management Framework (as detailed below) that has been developed over the past three years. For further information on how SSE manages risk, please see the supplementary Group Risk Report.
The Executive Committee and its sub-committees have responsibility for overseeing SSE’s Principal Risks. During the third quarter of SSE’s financial year, a self assessment is completed for each of SSE’s Principal Risks by an assigned oversight committee. This assessment requires committee members to provide commentary on contextual changes in the risk and whether they consider it to have become more or less material during the course of the year. These individual responses are consolidated into a report, one for each Principal Risk. The end reports are then presented back to the committees, along with the results of provisional viability testing
and analysis of relevant and current Management Information.
Following presentation of the assessment information, the committees discuss and reach a consensus regarding risk trend (more, less or equally material), overall effectiveness of the risk control and monitoring environment, and whether any additional actions are required to improve the control environment. The outputs from the committee assessments are then presented to the Executive Committee for full review, with any material changes resulting from this being proposed to the Board for approval.
System of internal control
Strategic Report – Executing our long-term strategy
Following the 2016/17 review process, the number of Principal Risks to the Group was increased from nine to ten with the pre-existing “Cyber and Networks Failure” risk being split into two separate risks – Cyber Security and Resilience and Energy Infrastructure Failure. In addition, the “Human and Relationship Capital” risk has been expanded and renamed, becoming People and Culture.
The diagram below details SSE’s wider System of Internal Control and how the Risk Management Framework is aligned with the other elements of it.
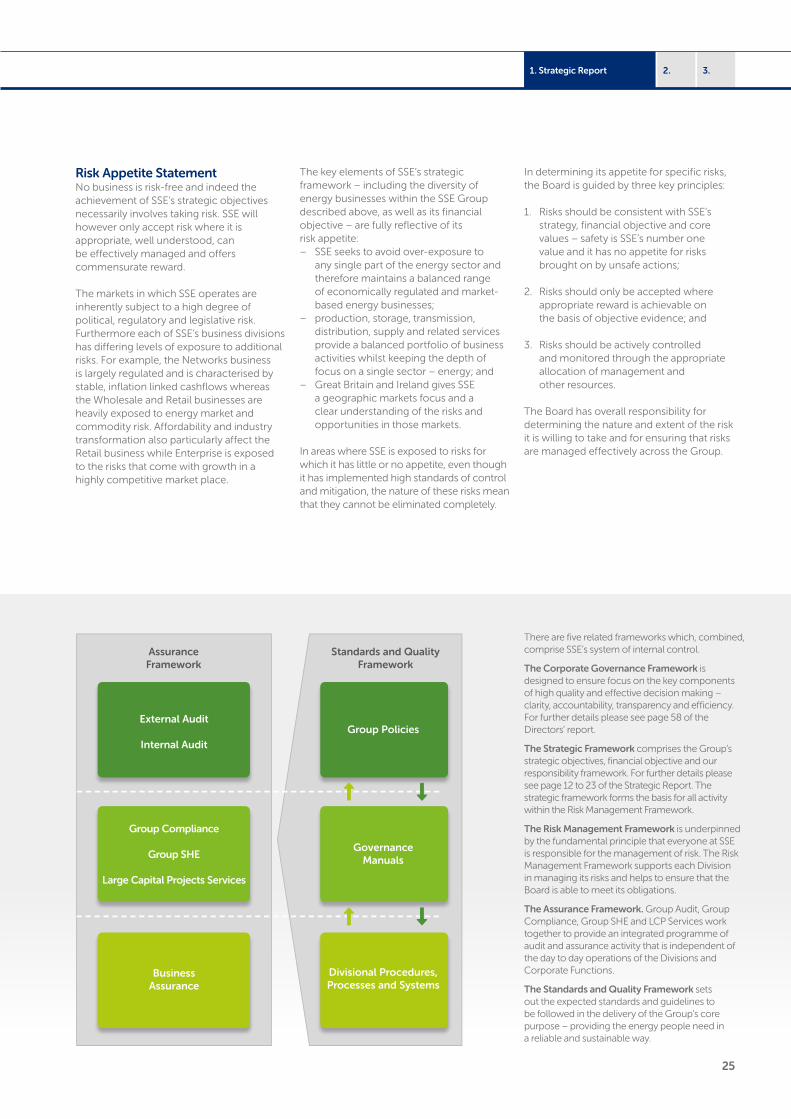
25
3.1. Strategic Report 2.
Corporate Governance Framework
StrategicFramework
Risk Management Framework
AssuranceFramework
Standards and QualityFramework
Board
Board Committees
Executive Committee
Executive Sub-Committees
StrategicObjectives
FinancialObjective
ResponsibilityFramework
Divisions
CorporateSupport Functions
Group Risk Management and Internal Control Policy
Review of the E�ectiveness of theSystem of Internal Control
External Audit
Internal Audit
Group Compliance
Group SHE
Large Capital Projects Services
BusinessAssurance
Group Policies
Divisional Procedures, Processes and Systems
GovernanceManuals
Principal Risk Self-Assessment
Risk Appetite Statement
Viability Assessment
Key Risk Indicators
Divisional Risk Approach
Assurance Evaluation
Risk Blueprint
Risk Appetite StatementNo business is risk-free and indeed the achievement of SSE’s strategic objectives necessarily involves taking risk. SSE will however only accept risk where it is appropriate, well understood, can be effectively managed and offers commensurate reward.
The markets in which SSE operates are inherently subject to a high degree of political, regulatory and legislative risk. Furthermore each of SSE’s business divisions has differing levels of exposure to additional risks. For example, the Networks business is largely regulated and is characterised by stable, inflation linked cashflows whereas the Wholesale and Retail businesses are heavily exposed to energy market and commodity risk. Affordability and industry transformation also particularly affect the Retail business while Enterprise is exposed to the risks that come with growth in a highly competitive market place.
The key elements of SSE’s strategic framework – including the diversity of energy businesses within the SSE Group described above, as well as its financial objective – are fully reflective of its risk appetite:
– SSE seeks to avoid over-exposure to any single part of the energy sector and therefore maintains a balanced range of economically regulated and market-based energy businesses;
– production, storage, transmission, distribution, supply and related services provide a balanced portfolio of business activities whilst keeping the depth of focus on a single sector – energy; and
– Great Britain and Ireland gives SSE a geographic markets focus and a clear understanding of the risks and opportunities in those markets.
In areas where SSE is exposed to risks for which it has little or no appetite, even though it has implemented high standards of control and mitigation, the nature of these risks mean that they cannot be eliminated completely.
In determining its appetite for specific risks, the Board is guided by three key principles:
1. Risks should be consistent with SSE’s strategy, financial objective and core values – safety is SSE’s number one value and it has no appetite for risks brought on by unsafe actions;
2. Risks should only be accepted where appropriate reward is achievable on the basis of objective evidence; and
3. Risks should be actively controlled and monitored through the appropriate allocation of management and other resources.
The Board has overall responsibility for determining the nature and extent of the risk it is willing to take and for ensuring that risks are managed effectively across the Group.
There are five related frameworks which, combined, comprise SSE’s system of internal control.
The Corporate Governance Framework is designed to ensure focus on the key components of high quality and effective decision making – clarity, accountability, transparency and efficiency. For further details please see page 58 of the Directors’ report.
The Strategic Framework comprises the Group’s strategic objectives, financial objective and our responsibility framework. For further details please see page 12 to 23 of the Strategic Report. The strategic framework forms the basis for all activity within the Risk Management Framework.
The Risk Management Framework is underpinned by the fundamental principle that everyone at SSE is responsible for the management of risk. The Risk Management Framework supports each Division in managing its risks and helps to ensure that the Board is able to meet its obligations.
The Assurance Framework. Group Audit, Group Compliance, Group SHE and LCP Services work together to provide an integrated programme of audit and assurance activity that is independent of the day to day operations of the Divisions and Corporate Functions.
The Standards and Quality Framework sets out the expected standards and guidelines to be followed in the delivery of the Group’s core purpose – providing the energy people need in a reliable and sustainable way.
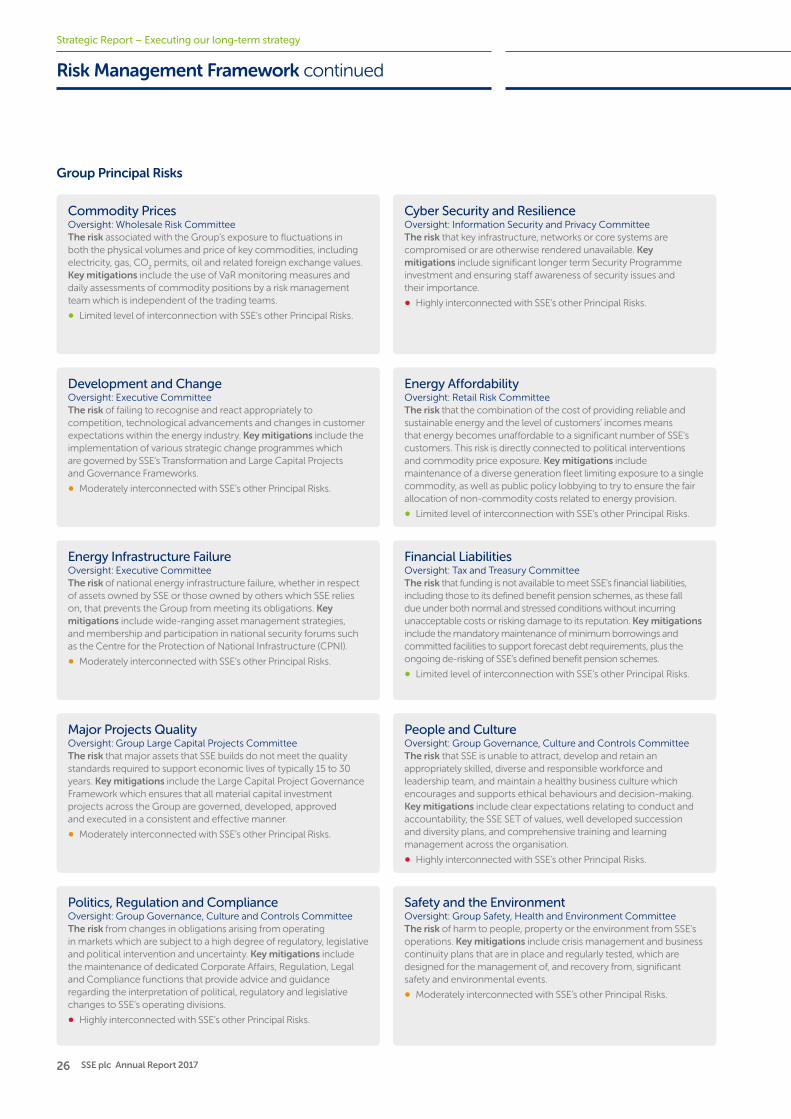
26 SSE plc Annual Report 2017
Group Principal Risks
Commodity PricesOversight: Wholesale Risk Committee The risk associated with the Group’s exposure to fluctuations in both the physical volumes and price of key commodities, including electricity, gas, CO
2 permits, oil and related foreign exchange values.
Key mitigations include the use of VaR monitoring measures and daily assessments of commodity positions by a risk management team which is independent of the trading teams.
• Limited level of interconnection with SSE’s other Principal Risks.
Development and ChangeOversight: Executive CommitteeThe risk of failing to recognise and react appropriately to competition, technological advancements and changes in customer expectations within the energy industry. Key mitigations include the implementation of various strategic change programmes which are governed by SSE’s Transformation and Large Capital Projects and Governance Frameworks.
• Moderately interconnected with SSE’s other Principal Risks.
Energy Infrastructure FailureOversight: Executive CommitteeThe risk of national energy infrastructure failure, whether in respect of assets owned by SSE or those owned by others which SSE relies on, that prevents the Group from meeting its obligations. Key mitigations include wide-ranging asset management strategies, and membership and participation in national security forums such as the Centre for the Protection of National Infrastructure (CPNI).
• Moderately interconnected with SSE’s other Principal Risks.
Politics, Regulation and ComplianceOversight: Group Governance, Culture and Controls CommitteeThe risk from changes in obligations arising from operating in markets which are subject to a high degree of regulatory, legislative and political intervention and uncertainty. Key mitigations include the maintenance of dedicated Corporate Affairs, Regulation, Legal and Compliance functions that provide advice and guidance regarding the interpretation of political, regulatory and legislative changes to SSE’s operating divisions.
• Highly interconnected with SSE’s other Principal Risks.
Major Projects QualityOversight: Group Large Capital Projects CommitteeThe risk that major assets that SSE builds do not meet the quality standards required to support economic lives of typically 15 to 30 years. Key mitigations include the Large Capital Project Governance Framework which ensures that all material capital investment projects across the Group are governed, developed, approved and executed in a consistent and effective manner.
• Moderately interconnected with SSE’s other Principal Risks.
Cyber Security and ResilienceOversight: Information Security and Privacy CommitteeThe risk that key infrastructure, networks or core systems are compromised or are otherwise rendered unavailable. Key mitigations include significant longer term Security Programme investment and ensuring staff awareness of security issues and their importance.
• Highly interconnected with SSE’s other Principal Risks.
Energy AffordabilityOversight: Retail Risk CommitteeThe risk that the combination of the cost of providing reliable and sustainable energy and the level of customers’ incomes means that energy becomes unaffordable to a significant number of SSE’s customers. This risk is directly connected to political interventions and commodity price exposure. Key mitigations include maintenance of a diverse generation fleet limiting exposure to a single commodity, as well as public policy lobbying to try to ensure the fair allocation of non-commodity costs related to energy provision.
• Limited level of interconnection with SSE’s other Principal Risks.
Financial LiabilitiesOversight: Tax and Treasury CommitteeThe risk that funding is not available to meet SSE’s financial liabilities, including those to its defined benefit pension schemes, as these fall due under both normal and stressed conditions without incurring unacceptable costs or risking damage to its reputation. Key mitigations include the mandatory maintenance of minimum borrowings and committed facilities to support forecast debt requirements, plus the ongoing de-risking of SSE’s defined benefit pension schemes.
• Limited level of interconnection with SSE’s other Principal Risks.
Safety and the EnvironmentOversight: Group Safety, Health and Environment CommitteeThe risk of harm to people, property or the environment from SSE’s operations. Key mitigations include crisis management and business continuity plans that are in place and regularly tested, which are designed for the management of, and recovery from, significant safety and environmental events.
• Moderately interconnected with SSE’s other Principal Risks.
People and CultureOversight: Group Governance, Culture and Controls CommitteeThe risk that SSE is unable to attract, develop and retain an appropriately skilled, diverse and responsible workforce and leadership team, and maintain a healthy business culture which encourages and supports ethical behaviours and decision-making. Key mitigations include clear expectations relating to conduct and accountability, the SSE SET of values, well developed succession and diversity plans, and comprehensive training and learning management across the organisation.
• Highly interconnected with SSE’s other Principal Risks.
Risk Management Framework continued
Strategic Report – Executing our long-term strategy
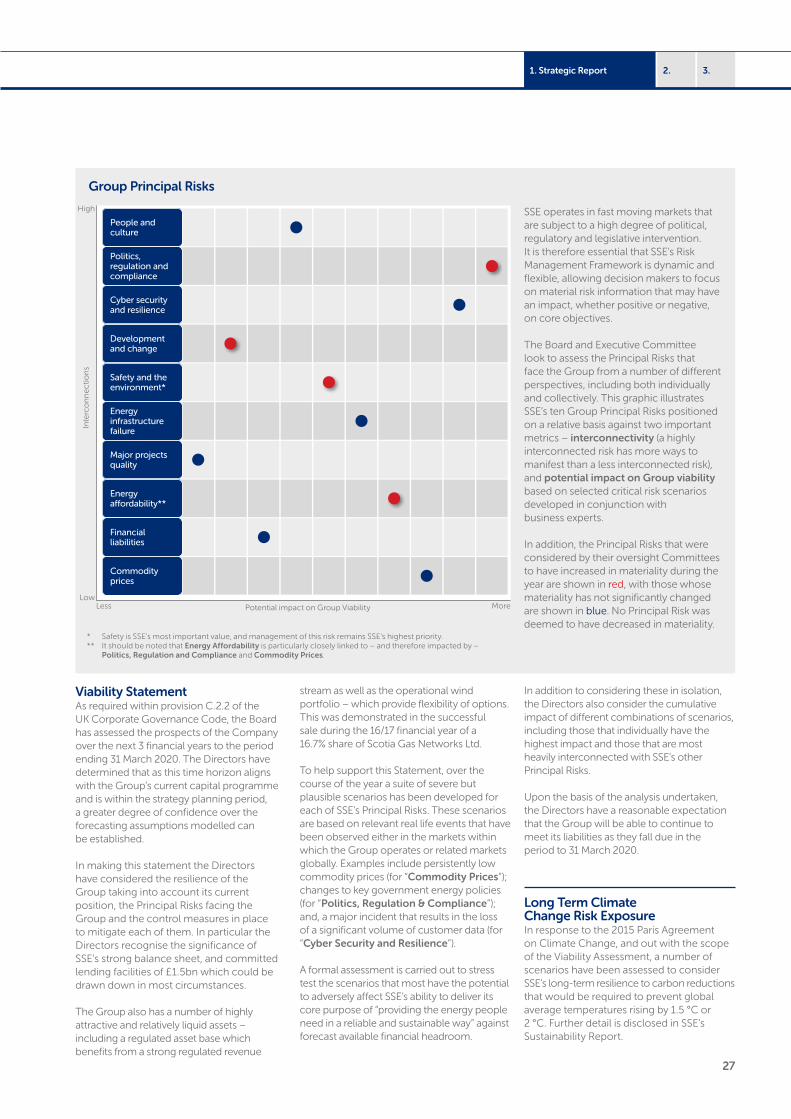
27
3.1. Strategic Report 2.
Less More
Inte
rco
nn
ec
tio
ns
High
LowPotential impact on Group Viability
Energy affordability**
Safety and the environment*
Development and change
Commodity prices
People and culture
Financial liabilities
Cyber security and resilience
Major projects quality
Energy infrastructure failure
Politics, regulation and compliance
SSE operates in fast moving markets that are subject to a high degree of political, regulatory and legislative intervention. It is therefore essential that SSE’s Risk Management Framework is dynamic and flexible, allowing decision makers to focus on material risk information that may have an impact, whether positive or negative, on core objectives.
The Board and Executive Committee look to assess the Principal Risks that face the Group from a number of different perspectives, including both individually and collectively. This graphic illustrates SSE’s ten Group Principal Risks positioned on a relative basis against two important metrics – interconnectivity (a highly interconnected risk has more ways to manifest than a less interconnected risk), and potential impact on Group viability based on selected critical risk scenarios developed in conjunction with business experts.
In addition, the Principal Risks that were considered by their oversight Committees to have increased in materiality during the year are shown in red, with those whose materiality has not significantly changed are shown in blue. No Principal Risk was deemed to have decreased in materiality.
Viability StatementAs required within provision C.2.2 of the UK Corporate Governance Code, the Board has assessed the prospects of the Company over the next 3 financial years to the period ending 31 March 2020. The Directors have determined that as this time horizon aligns with the Group’s current capital programme and is within the strategy planning period, a greater degree of confidence over the forecasting assumptions modelled can be established.
In making this statement the Directors have considered the resilience of the Group taking into account its current position, the Principal Risks facing the Group and the control measures in place to mitigate each of them. In particular the Directors recognise the significance of SSE’s strong balance sheet, and committed lending facilities of £1.5bn which could be drawn down in most circumstances.
The Group also has a number of highly attractive and relatively liquid assets – including a regulated asset base which benefits from a strong regulated revenue
stream as well as the operational wind portfolio – which provide flexibility of options. This was demonstrated in the successful sale during the 16/17 financial year of a 16.7% share of Scotia Gas Networks Ltd.
To help support this Statement, over the course of the year a suite of severe but plausible scenarios has been developed for each of SSE’s Principal Risks. These scenarios are based on relevant real life events that have been observed either in the markets within which the Group operates or related markets globally. Examples include persistently low commodity prices (for “Commodity Prices”); changes to key government energy policies (for “Politics, Regulation & Compliance”); and, a major incident that results in the loss of a significant volume of customer data (for “Cyber Security and Resilience”).
A formal assessment is carried out to stress test the scenarios that most have the potential to adversely affect SSE’s ability to deliver its core purpose of “providing the energy people need in a reliable and sustainable way” against forecast available financial headroom.
In addition to considering these in isolation, the Directors also consider the cumulative impact of different combinations of scenarios, including those that individually have the highest impact and those that are most heavily interconnected with SSE’s other Principal Risks.
Upon the basis of the analysis undertaken, the Directors have a reasonable expectation that the Group will be able to continue to meet its liabilities as they fall due in the period to 31 March 2020.
Long Term Climate Change Risk ExposureIn response to the 2015 Paris Agreement on Climate Change, and out with the scope of the Viability Assessment, a number of scenarios have been assessed to consider SSE’s long-term resilience to carbon reductions that would be required to prevent global average temperatures rising by 1.5 °C or 2 °C. Further detail is disclosed in SSE’s Sustainability Report.
* Safety is SSE’s most important value, and management of this risk remains SSE’s highest priority.** It should be noted that Energy Affordability is particularly closely linked to – and therefore impacted by –
Politics, Regulation and Compliance and Commodity Prices.
Group Principal Risks
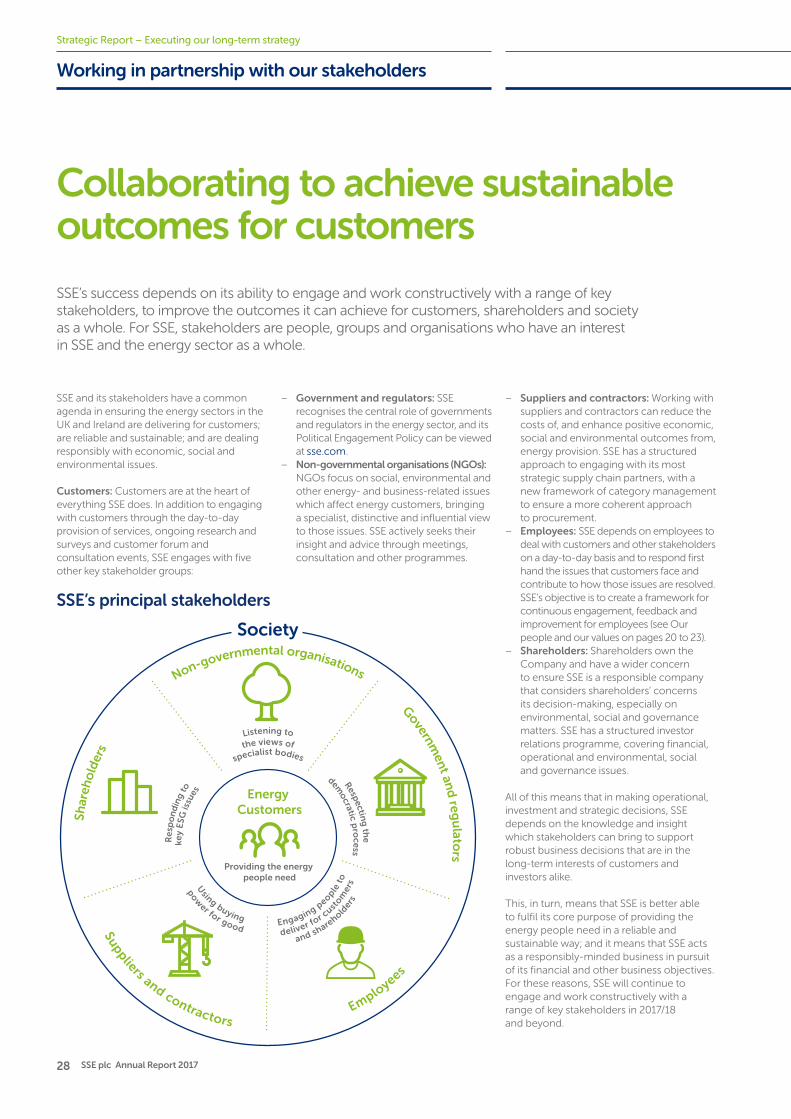
28 SSE plc Annual Report 2017
Providing the energy people need
Non-governmental organisationsSuppliers and contractors
Employees
specialist bodiesthe views ofListening to
key
ESG
issu
es
Res
po
nd
ing
to
democratic p
rocess
Respecting
the
Engaging people
to
deliver for c
ustom
ers
and sharehold
ers
Using buying
pow
er for good
Shar
eho
lder
s
Government an
d reg
ulato
rs
Energy Customers
Society
Collaborating to achieve sustainable outcomes for customers
Working in partnership with our stakeholders
SSE’s success depends on its ability to engage and work constructively with a range of key stakeholders, to improve the outcomes it can achieve for customers, shareholders and society as a whole. For SSE, stakeholders are people, groups and organisations who have an interest in SSE and the energy sector as a whole.
SSE and its stakeholders have a common agenda in ensuring the energy sectors in the UK and Ireland are delivering for customers; are reliable and sustainable; and are dealing responsibly with economic, social and environmental issues.
Customers: Customers are at the heart of everything SSE does. In addition to engaging with customers through the day-to-day provision of services, ongoing research and surveys and customer forum and consultation events, SSE engages with five other key stakeholder groups:
Strategic Report – Executing our long-term strategy
– Government and regulators: SSE recognises the central role of governments and regulators in the energy sector, and its Political Engagement Policy can be viewed at sse.com.
– Non-governmental organisations (NGOs): NGOs focus on social, environmental and other energy- and business-related issues which affect energy customers, bringing a specialist, distinctive and influential view to those issues. SSE actively seeks their insight and advice through meetings, consultation and other programmes.
SSE’s principal stakeholders
– Suppliers and contractors: Working with suppliers and contractors can reduce the costs of, and enhance positive economic, social and environmental outcomes from, energy provision. SSE has a structured approach to engaging with its most strategic supply chain partners, with a new framework of category management to ensure a more coherent approach to procurement.
– Employees: SSE depends on employees to deal with customers and other stakeholders on a day-to-day basis and to respond first hand the issues that customers face and contribute to how those issues are resolved. SSE’s objective is to create a framework for continuous engagement, feedback and improvement for employees (see Our people and our values on pages 20 to 23).
– Shareholders: Shareholders own the Company and have a wider concern to ensure SSE is a responsible company that considers shareholders’ concerns its decision-making, especially on environmental, social and governance matters. SSE has a structured investor relations programme, covering financial, operational and environmental, social and governance issues.
All of this means that in making operational, investment and strategic decisions, SSE depends on the knowledge and insight which stakeholders can bring to support robust business decisions that are in the long-term interests of customers and investors alike.
This, in turn, means that SSE is better able to fulfil its core purpose of providing the energy people need in a reliable and sustainable way; and it means that SSE acts as a responsibly-minded business in pursuit of its financial and other business objectives. For these reasons, SSE will continue to engage and work constructively with a range of key stakeholders in 2017/18 and beyond.
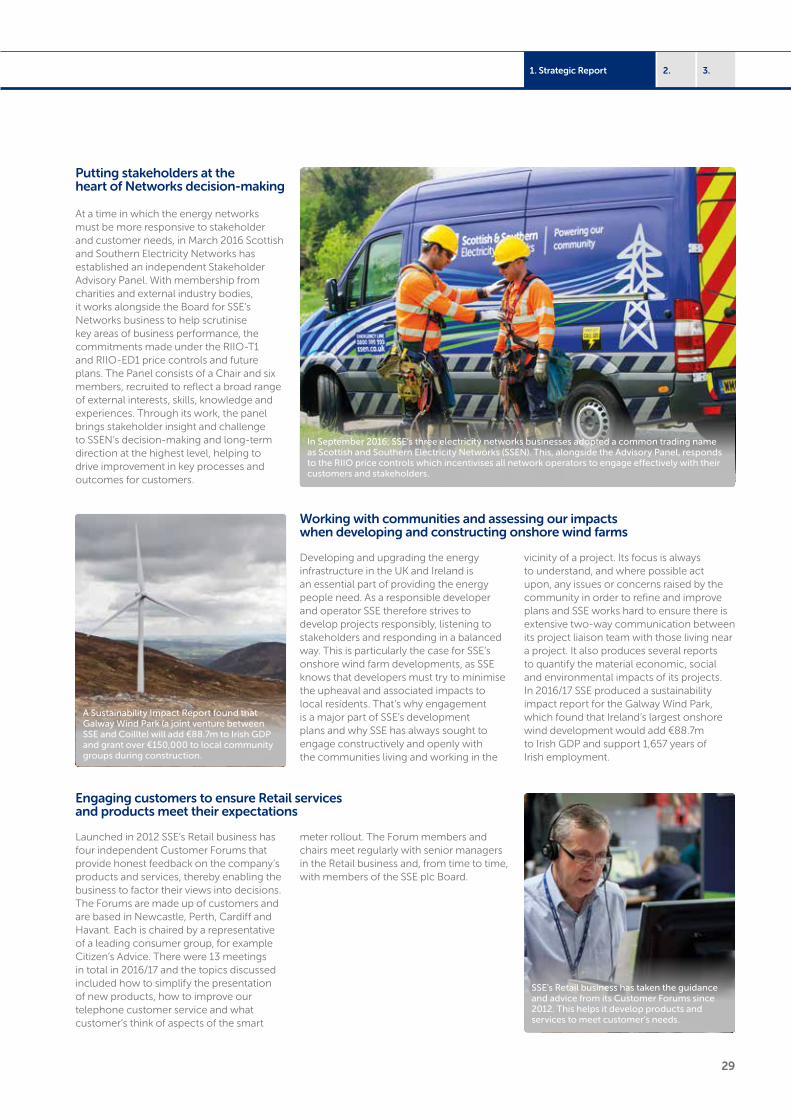
29
3.1. Strategic Report 2.
Putting stakeholders at the heart of Networks decision-making
At a time in which the energy networks must be more responsive to stakeholder and customer needs, in March 2016 Scottish and Southern Electricity Networks has established an independent Stakeholder Advisory Panel. With membership from charities and external industry bodies, it works alongside the Board for SSE’s Networks business to help scrutinise key areas of business performance, the commitments made under the RIIO-T1 and RIIO-ED1 price controls and future plans. The Panel consists of a Chair and six members, recruited to reflect a broad range of external interests, skills, knowledge and experiences. Through its work, the panel brings stakeholder insight and challenge to SSEN’s decision-making and long-term direction at the highest level, helping to drive improvement in key processes and outcomes for customers.
Developing and upgrading the energy infrastructure in the UK and Ireland is an essential part of providing the energy people need. As a responsible developer and operator SSE therefore strives to develop projects responsibly, listening to stakeholders and responding in a balanced way. This is particularly the case for SSE’s onshore wind farm developments, as SSE knows that developers must try to minimise the upheaval and associated impacts to local residents. That’s why engagement is a major part of SSE’s development plans and why SSE has always sought to engage constructively and openly with the communities living and working in the
In September 2016, SSE’s three electricity networks businesses adopted a common trading name as Scottish and Southern Electricity Networks (SSEN). This, alongside the Advisory Panel, responds to the RIIO price controls which incentivises all network operators to engage effectively with their customers and stakeholders.
A Sustainability Impact Report found that Galway Wind Park (a joint venture between SSE and Coillte) will add €88.7m to Irish GDP and grant over €150,000 to local community groups during construction.
SSE’s Retail business has taken the guidance and advice from its Customer Forums since 2012. This helps it develop products and services to meet customer’s needs.
vicinity of a project. Its focus is always to understand, and where possible act upon, any issues or concerns raised by the community in order to refine and improve plans and SSE works hard to ensure there is extensive two-way communication between its project liaison team with those living near a project. It also produces several reports to quantify the material economic, social and environmental impacts of its projects. In 2016/17 SSE produced a sustainability impact report for the Galway Wind Park, which found that Ireland’s largest onshore wind development would add €88.7m to Irish GDP and support 1,657 years of Irish employment.
Working with communities and assessing our impacts when developing and constructing onshore wind farms
Launched in 2012 SSE’s Retail business has four independent Customer Forums that provide honest feedback on the company’s products and services, thereby enabling the business to factor their views into decisions. The Forums are made up of customers and are based in Newcastle, Perth, Cardiff and Havant. Each is chaired by a representative of a leading consumer group, for example Citizen’s Advice. There were 13 meetings in total in 2016/17 and the topics discussed included how to simplify the presentation of new products, how to improve our telephone customer service and what customer’s think of aspects of the smart
meter rollout. The Forum members and chairs meet regularly with senior managers in the Retail business and, from time to time, with members of the SSE plc Board.
Engaging customers to ensure Retail services and products meet their expectations
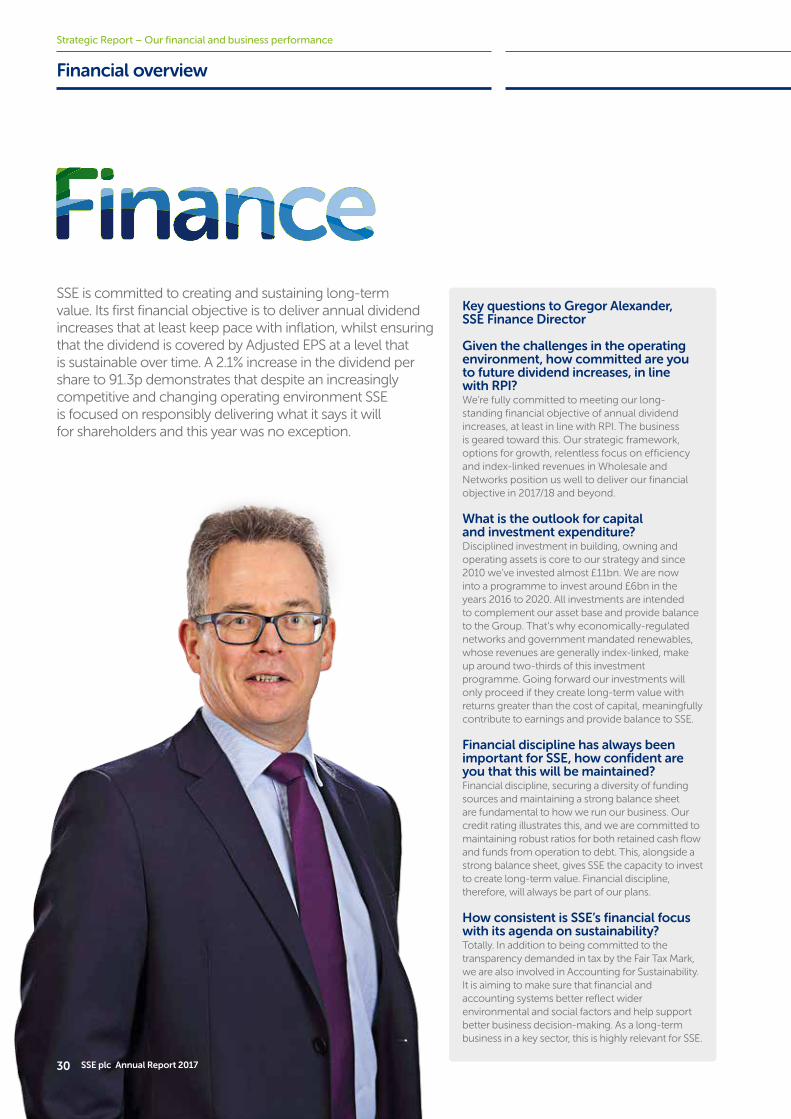
30 SSE plc Annual Report 2017
Financial overview
SSE is committed to creating and sustaining long-term value. Its first financial objective is to deliver annual dividend increases that at least keep pace with inflation, whilst ensuring that the dividend is covered by Adjusted EPS at a level that is sustainable over time. A 2.1% increase in the dividend per share to 91.3p demonstrates that despite an increasingly competitive and changing operating environment SSE is focused on responsibly delivering what it says it will for shareholders and this year was no exception.
Strategic Report – Our financial and business performance
Key questions to Gregor Alexander, SSE Finance Director
Given the challenges in the operating environment, how committed are you to future dividend increases, in line with RPI? We’re fully committed to meeting our long-standing financial objective of annual dividend increases, at least in line with RPI. The business is geared toward this. Our strategic framework, options for growth, relentless focus on efficiency and index-linked revenues in Wholesale and Networks position us well to deliver our financial objective in 2017/18 and beyond.
What is the outlook for capital and investment expenditure? Disciplined investment in building, owning and operating assets is core to our strategy and since 2010 we’ve invested almost £11bn. We are now into a programme to invest around £6bn in the years 2016 to 2020. All investments are intended to complement our asset base and provide balance to the Group. That’s why economically-regulated networks and government mandated renewables, whose revenues are generally index-linked, make up around two-thirds of this investment programme. Going forward our investments will only proceed if they create long-term value with returns greater than the cost of capital, meaningfully contribute to earnings and provide balance to SSE.
Financial discipline has always been important for SSE, how confident are you that this will be maintained? Financial discipline, securing a diversity of funding sources and maintaining a strong balance sheet are fundamental to how we run our business. Our credit rating illustrates this, and we are committed to maintaining robust ratios for both retained cash flow and funds from operation to debt. This, alongside a strong balance sheet, gives SSE the capacity to invest to create long-term value. Financial discipline, therefore, will always be part of our plans.
How consistent is SSE’s financial focus with its agenda on sustainability?Totally. In addition to being committed to the transparency demanded in tax by the Fair Tax Mark, we are also involved in Accounting for Sustainability. It is aiming to make sure that financial and accounting systems better reflect wider environmental and social factors and help support better business decision-making. As a long-term business in a key sector, this is highly relevant for SSE.
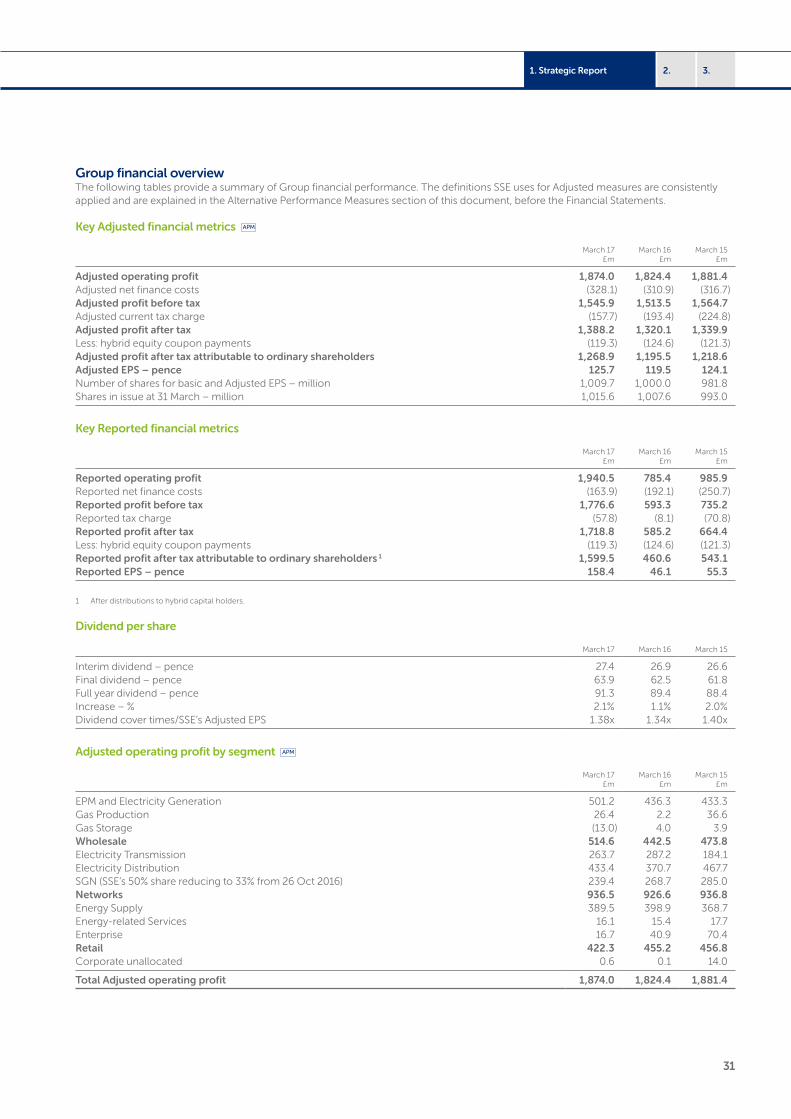
31
3.1. Strategic Report 2.
Group financial overviewThe following tables provide a summary of Group financial performance. The definitions SSE uses for Adjusted measures are consistently applied and are explained in the Alternative Performance Measures section of this document, before the Financial Statements.
Key Adjusted financial metrics
March 17 £m
March 16 £m
March 15 £m
Adjusted operating profit 1,874.0 1,824.4 1,881.4Adjusted net finance costs (328.1) (310.9) (316.7)Adjusted profit before tax 1,545.9 1,513.5 1,564.7Adjusted current tax charge (157.7) (193.4) (224.8)Adjusted profit after tax 1,388.2 1,320.1 1,339.9Less: hybrid equity coupon payments (119.3) (124.6) (121.3)Adjusted profit after tax attributable to ordinary shareholders 1,268.9 1,195.5 1,218.6Adjusted EPS – pence 125.7 119.5 124.1Number of shares for basic and Adjusted EPS – million 1,009.7 1,000.0 981.8Shares in issue at 31 March – million 1,015.6 1,007.6 993.0
Key Reported financial metrics
March 17 £m
March 16 £m
March 15 £m
Reported operating profit 1,940.5 785.4 985.9Reported net finance costs (163.9) (192.1) (250.7)Reported profit before tax 1,776.6 593.3 735.2Reported tax charge (57.8) (8.1) (70.8)Reported profit after tax 1,718.8 585.2 664.4Less: hybrid equity coupon payments (119.3) (124.6) (121.3)Reported profit after tax attributable to ordinary shareholders 1 1,599.5 460.6 543.1Reported EPS – pence 158.4 46.1 55.3
1 After distributions to hybrid capital holders.
Dividend per share
March 17 March 16 March 15
Interim dividend – pence 27.4 26.9 26.6Final dividend – pence 63.9 62.5 61.8Full year dividend – pence 91.3 89.4 88.4Increase – % 2.1% 1.1% 2.0%Dividend cover times/SSE’s Adjusted EPS 1.38x 1.34x 1.40x
Adjusted operating profit by segment
March 17 £m
March 16 £m
March 15 £m
EPM and Electricity Generation 501.2 436.3 433.3Gas Production 26.4 2.2 36.6Gas Storage (13.0) 4.0 3.9Wholesale 514.6 442.5 473.8Electricity Transmission 263.7 287.2 184.1Electricity Distribution 433.4 370.7 467.7SGN (SSE’s 50% share reducing to 33% from 26 Oct 2016) 239.4 268.7 285.0Networks 936.5 926.6 936.8Energy Supply 389.5 398.9 368.7Energy-related Services 16.1 15.4 17.7Enterprise 16.7 40.9 70.4Retail 422.3 455.2 456.8Corporate unallocated 0.6 0.1 14.0
Total Adjusted operating profit 1,874.0 1,824.4 1,881.4
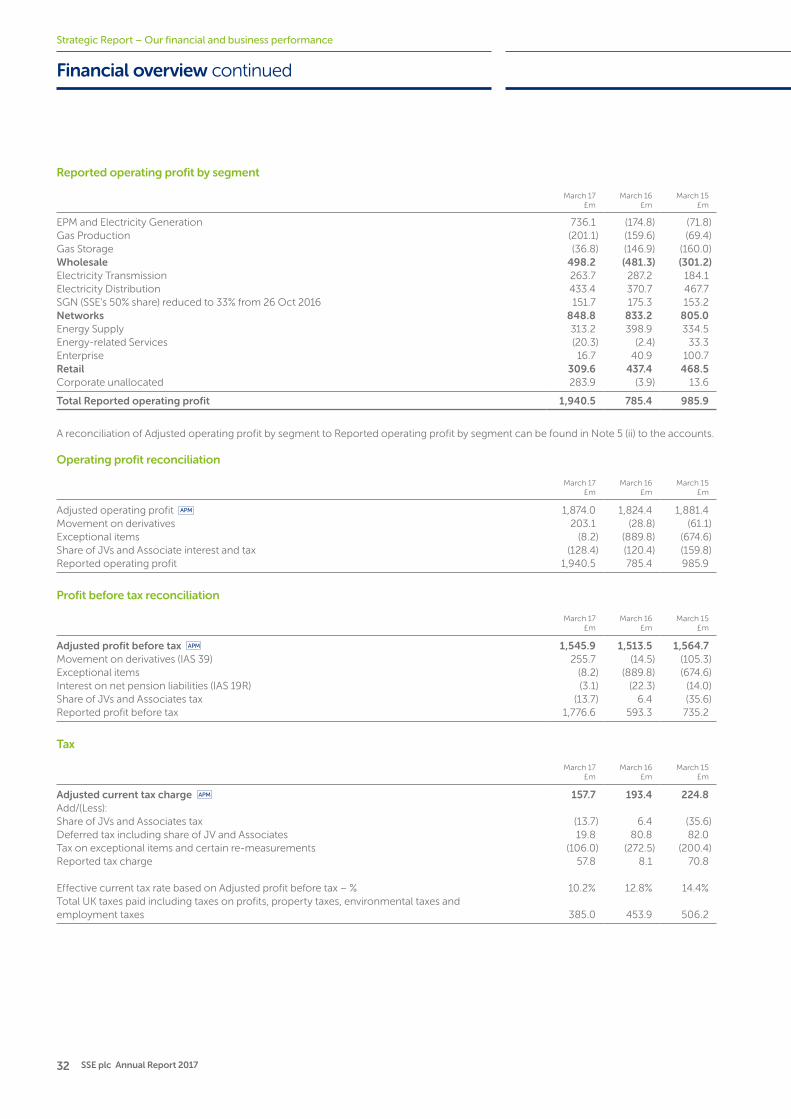
32 SSE plc Annual Report 2017
Strategic Report – Our financial and business performance
Financial overview continued
Reported operating profit by segment
March 17 £m
March 16 £m
March 15 £m
EPM and Electricity Generation 736.1 (174.8) (71.8)Gas Production (201.1) (159.6) (69.4)Gas Storage (36.8) (146.9) (160.0)Wholesale 498.2 (481.3) (301.2)Electricity Transmission 263.7 287.2 184.1Electricity Distribution 433.4 370.7 467.7SGN (SSE’s 50% share) reduced to 33% from 26 Oct 2016 151.7 175.3 153.2Networks 848.8 833.2 805.0Energy Supply 313.2 398.9 334.5Energy-related Services (20.3) (2.4) 33.3Enterprise 16.7 40.9 100.7Retail 309.6 437.4 468.5Corporate unallocated 283.9 (3.9) 13.6
Total Reported operating profit 1,940.5 785.4 985.9
A reconciliation of Adjusted operating profit by segment to Reported operating profit by segment can be found in Note 5 (ii) to the accounts.
Operating profit reconciliation
March 17 £m
March 16 £m
March 15 £m
Adjusted operating profit 1,874.0 1,824.4 1,881.4Movement on derivatives 203.1 (28.8) (61.1)Exceptional items (8.2) (889.8) (674.6)Share of JVs and Associate interest and tax (128.4) (120.4) (159.8)Reported operating profit 1,940.5 785.4 985.9
Profit before tax reconciliation
March 17 £m
March 16 £m
March 15 £m
Adjusted profit before tax 1,545.9 1,513.5 1,564.7Movement on derivatives (IAS 39) 255.7 (14.5) (105.3)Exceptional items (8.2) (889.8) (674.6)Interest on net pension liabilities (IAS 19R) (3.1) (22.3) (14.0)Share of JVs and Associates tax (13.7) 6.4 (35.6)Reported profit before tax 1,776.6 593.3 735.2
Tax
March 17 £m
March 16 £m
March 15 £m
Adjusted current tax charge 157.7 193.4 224.8Add/(Less):Share of JVs and Associates tax (13.7) 6.4 (35.6)Deferred tax including share of JV and Associates 19.8 80.8 82.0Tax on exceptional items and certain re-measurements (106.0) (272.5) (200.4)Reported tax charge 57.8 8.1 70.8
Effective current tax rate based on Adjusted profit before tax – % 10.2% 12.8% 14.4%Total UK taxes paid including taxes on profits, property taxes, environmental taxes and employment taxes 385.0 453.9 506.2
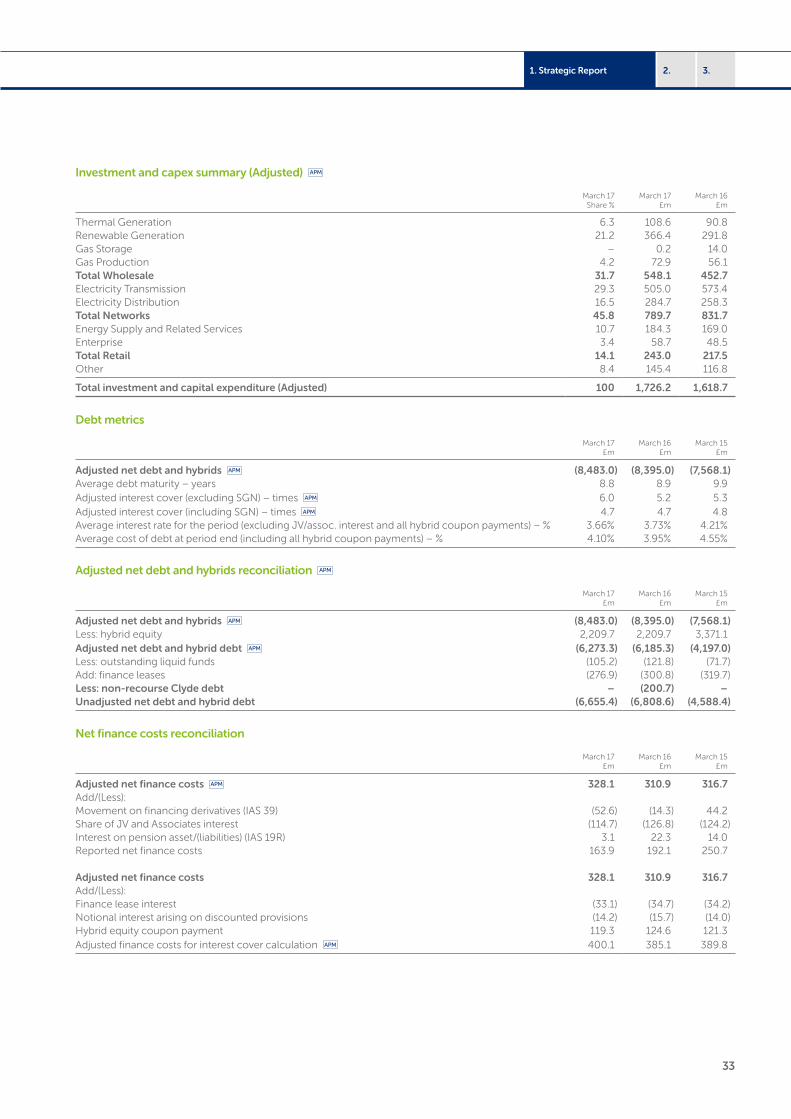
33
3.1. Strategic Report 2.
Investment and capex summary (Adjusted)
March 17 Share %
March 17 £m
March 16 £m
Thermal Generation 6.3 108.6 90.8Renewable Generation 21.2 366.4 291.8Gas Storage – 0.2 14.0Gas Production 4.2 72.9 56.1Total Wholesale 31.7 548.1 452.7Electricity Transmission 29.3 505.0 573.4Electricity Distribution 16.5 284.7 258.3Total Networks 45.8 789.7 831.7Energy Supply and Related Services 10.7 184.3 169.0Enterprise 3.4 58.7 48.5Total Retail 14.1 243.0 217.5Other 8.4 145.4 116.8
Total investment and capital expenditure (Adjusted) 100 1,726.2 1,618.7
Debt metrics
March 17 £m
March 16 £m
March 15 £m
Adjusted net debt and hybrids (8,483.0) (8,395.0) (7,568.1)Average debt maturity – years 8.8 8.9 9.9Adjusted interest cover (excluding SGN) – times 6.0 5.2 5.3Adjusted interest cover (including SGN) – times 4.7 4.7 4.8Average interest rate for the period (excluding JV/assoc. interest and all hybrid coupon payments) – % 3.66% 3.73% 4.21%Average cost of debt at period end (including all hybrid coupon payments) – % 4.10% 3.95% 4.55%
Adjusted net debt and hybrids reconciliation
March 17 £m
March 16 £m
March 15 £m
Adjusted net debt and hybrids (8,483.0) (8,395.0) (7,568.1)Less: hybrid equity 2,209.7 2,209.7 3,371.1Adjusted net debt and hybrid debt (6,273.3) (6,185.3) (4,197.0)Less: outstanding liquid funds (105.2) (121.8) (71.7)Add: finance leases (276.9) (300.8) (319.7)Less: non-recourse Clyde debt – (200.7) –Unadjusted net debt and hybrid debt (6,655.4) (6,808.6) (4,588.4)
Net finance costs reconciliation
March 17 £m
March 16 £m
March 15 £m
Adjusted net finance costs 328.1 310.9 316.7Add/(Less):Movement on financing derivatives (IAS 39) (52.6) (14.3) 44.2Share of JV and Associates interest (114.7) (126.8) (124.2)Interest on pension asset/(liabilities) (IAS 19R) 3.1 22.3 14.0Reported net finance costs 163.9 192.1 250.7
Adjusted net finance costs 328.1 310.9 316.7Add/(Less):Finance lease interest (33.1) (34.7) (34.2)Notional interest arising on discounted provisions (14.2) (15.7) (14.0)Hybrid equity coupon payment 119.3 124.6 121.3Adjusted finance costs for interest cover calculation 400.1 385.1 389.8
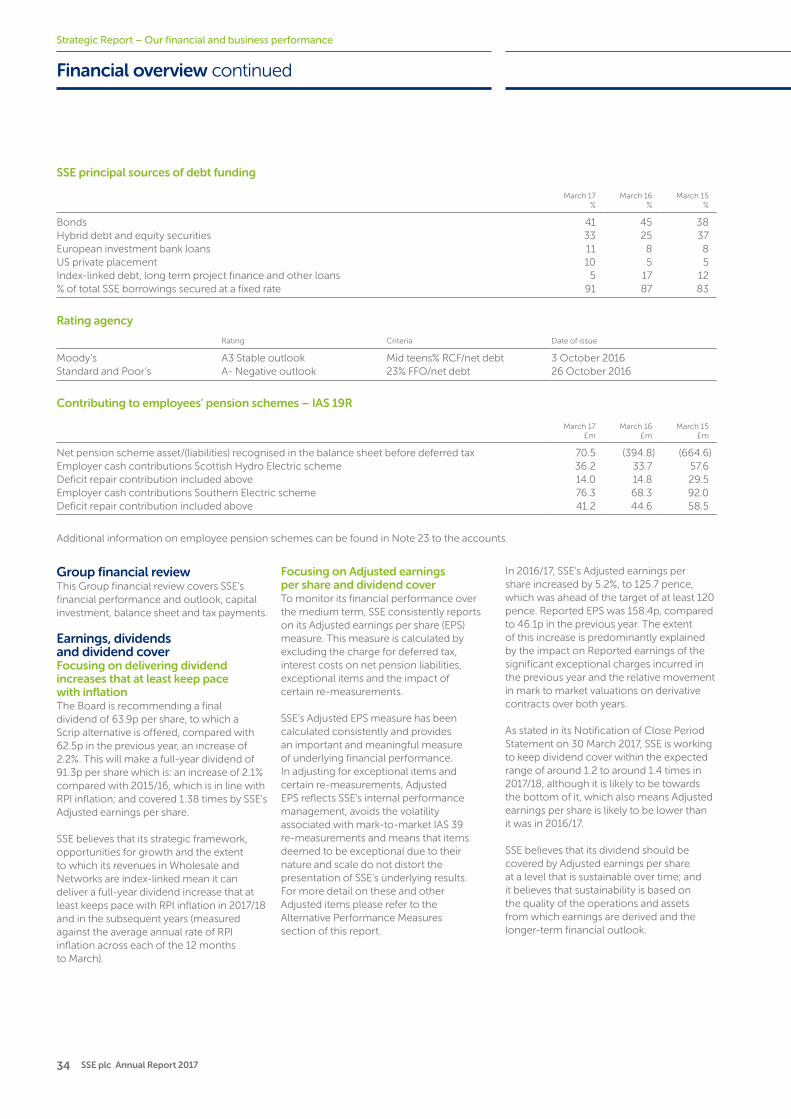
34 SSE plc Annual Report 2017
Strategic Report – Our financial and business performance
Financial overview continued
SSE principal sources of debt funding
March 17 %
March 16 %
March 15 %
Bonds 41 45 38Hybrid debt and equity securities 33 25 37European investment bank loans 11 8 8US private placement 10 5 5Index-linked debt, long term project finance and other loans 5 17 12% of total SSE borrowings secured at a fixed rate 91 87 83
Rating agency
Rating Criteria Date of issue
Moody’s A3 Stable outlook Mid teens% RCF/net debt 3 October 2016Standard and Poor’s A- Negative outlook 23% FFO/net debt 26 October 2016
Contributing to employees’ pension schemes – IAS 19R
March 17 £m
March 16 £m
March 15 £m
Net pension scheme asset/(liabilities) recognised in the balance sheet before deferred tax 70.5 (394.8) (664.6)Employer cash contributions Scottish Hydro Electric scheme 36.2 33.7 57.6Deficit repair contribution included above 14.0 14.8 29.5Employer cash contributions Southern Electric scheme 76.3 68.3 92.0Deficit repair contribution included above 41.2 44.6 58.5
Additional information on employee pension schemes can be found in Note 23 to the accounts.
Group financial reviewThis Group financial review covers SSE’s financial performance and outlook, capital investment, balance sheet and tax payments.
Earnings, dividends and dividend coverFocusing on delivering dividend increases that at least keep pace with inflationThe Board is recommending a final dividend of 63.9p per share, to which a Scrip alternative is offered, compared with 62.5p in the previous year, an increase of 2.2%. This will make a full-year dividend of 91.3p per share which is: an increase of 2.1% compared with 2015/16, which is in line with RPI inflation; and covered 1.38 times by SSE’s Adjusted earnings per share.
SSE believes that its strategic framework, opportunities for growth and the extent to which its revenues in Wholesale and Networks are index-linked mean it can deliver a full-year dividend increase that at least keeps pace with RPI inflation in 2017/18 and in the subsequent years (measured against the average annual rate of RPI inflation across each of the 12 months to March).
Focusing on Adjusted earnings per share and dividend coverTo monitor its financial performance over the medium term, SSE consistently reports on its Adjusted earnings per share (EPS) measure. This measure is calculated by excluding the charge for deferred tax, interest costs on net pension liabilities, exceptional items and the impact of certain re-measurements.
SSE’s Adjusted EPS measure has been calculated consistently and provides an important and meaningful measure of underlying financial performance. In adjusting for exceptional items and certain re-measurements, Adjusted EPS reflects SSE’s internal performance management, avoids the volatility associated with mark-to-market IAS 39 re-measurements and means that items deemed to be exceptional due to their nature and scale do not distort the presentation of SSE’s underlying results. For more detail on these and other Adjusted items please refer to the Alternative Performance Measures section of this report.
In 2016/17, SSE’s Adjusted earnings per share increased by 5.2%, to 125.7 pence, which was ahead of the target of at least 120 pence. Reported EPS was 158.4p, compared to 46.1p in the previous year. The extent of this increase is predominantly explained by the impact on Reported earnings of the significant exceptional charges incurred in the previous year and the relative movement in mark to market valuations on derivative contracts over both years.
As stated in its Notification of Close Period Statement on 30 March 2017, SSE is working to keep dividend cover within the expected range of around 1.2 to around 1.4 times in 2017/18, although it is likely to be towards the bottom of it, which also means Adjusted earnings per share is likely to be lower than it was in 2016/17.
SSE believes that its dividend should be covered by Adjusted earnings per share at a level that is sustainable over time; and it believes that sustainability is based on the quality of the operations and assets from which earnings are derived and the longer-term financial outlook.
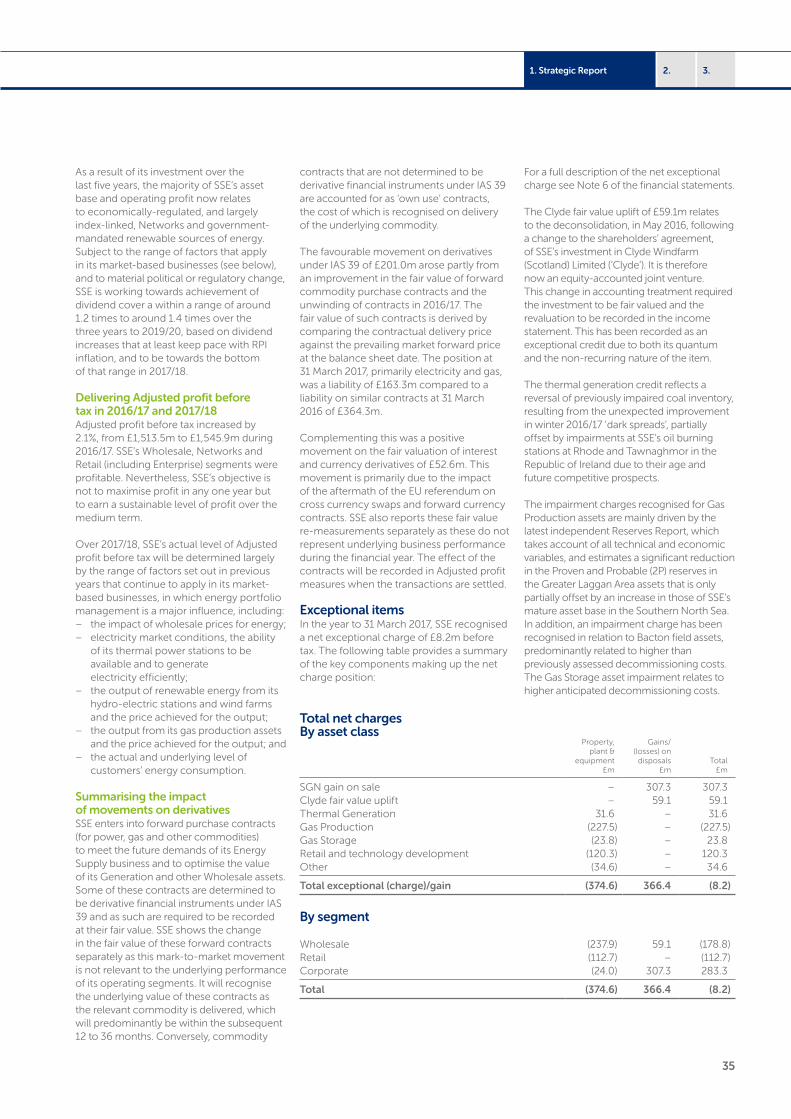
35
3.1. Strategic Report 2.
As a result of its investment over the last five years, the majority of SSE’s asset base and operating profit now relates to economically-regulated, and largely index-linked, Networks and government-mandated renewable sources of energy. Subject to the range of factors that apply in its market-based businesses (see below), and to material political or regulatory change, SSE is working towards achievement of dividend cover a within a range of around 1.2 times to around 1.4 times over the three years to 2019/20, based on dividend increases that at least keep pace with RPI inflation, and to be towards the bottom of that range in 2017/18.
Delivering Adjusted profit before tax in 2016/17 and 2017/18Adjusted profit before tax increased by 2.1%, from £1,513.5m to £1,545.9m during 2016/17. SSE’s Wholesale, Networks and Retail (including Enterprise) segments were profitable. Nevertheless, SSE’s objective is not to maximise profit in any one year but to earn a sustainable level of profit over the medium term.
Over 2017/18, SSE’s actual level of Adjusted profit before tax will be determined largely by the range of factors set out in previous years that continue to apply in its market-based businesses, in which energy portfolio management is a major influence, including:
– the impact of wholesale prices for energy; – electricity market conditions, the ability
of its thermal power stations to be available and to generate electricity efficiently;
– the output of renewable energy from its hydro-electric stations and wind farms and the price achieved for the output;
– the output from its gas production assets and the price achieved for the output; and
– the actual and underlying level of customers’ energy consumption.
Summarising the impact of movements on derivativesSSE enters into forward purchase contracts (for power, gas and other commodities) to meet the future demands of its Energy Supply business and to optimise the value of its Generation and other Wholesale assets. Some of these contracts are determined to be derivative financial instruments under IAS 39 and as such are required to be recorded at their fair value. SSE shows the change in the fair value of these forward contracts separately as this mark-to-market movement is not relevant to the underlying performance of its operating segments. It will recognise the underlying value of these contracts as the relevant commodity is delivered, which will predominantly be within the subsequent 12 to 36 months. Conversely, commodity
contracts that are not determined to be derivative financial instruments under IAS 39 are accounted for as ‘own use’ contracts, the cost of which is recognised on delivery of the underlying commodity.
The favourable movement on derivatives under IAS 39 of £201.0m arose partly from an improvement in the fair value of forward commodity purchase contracts and the unwinding of contracts in 2016/17. The fair value of such contracts is derived by comparing the contractual delivery price against the prevailing market forward price at the balance sheet date. The position at 31 March 2017, primarily electricity and gas, was a liability of £163.3m compared to a liability on similar contracts at 31 March 2016 of £364.3m.
Complementing this was a positive movement on the fair valuation of interest and currency derivatives of £52.6m. This movement is primarily due to the impact of the aftermath of the EU referendum on cross currency swaps and forward currency contracts. SSE also reports these fair value re-measurements separately as these do not represent underlying business performance during the financial year. The effect of the contracts will be recorded in Adjusted profit measures when the transactions are settled.
Exceptional itemsIn the year to 31 March 2017, SSE recognised a net exceptional charge of £8.2m before tax. The following table provides a summary of the key components making up the net charge position:
For a full description of the net exceptional charge see Note 6 of the financial statements.
The Clyde fair value uplift of £59.1m relates to the deconsolidation, in May 2016, following a change to the shareholders’ agreement, of SSE’s investment in Clyde Windfarm (Scotland) Limited (‘Clyde’). It is therefore now an equity-accounted joint venture. This change in accounting treatment required the investment to be fair valued and the revaluation to be recorded in the income statement. This has been recorded as an exceptional credit due to both its quantum and the non-recurring nature of the item.
The thermal generation credit reflects a reversal of previously impaired coal inventory, resulting from the unexpected improvement in winter 2016/17 ‘dark spreads’, partially offset by impairments at SSE’s oil burning stations at Rhode and Tawnaghmor in the Republic of Ireland due to their age and future competitive prospects.
The impairment charges recognised for Gas Production assets are mainly driven by the latest independent Reserves Report, which takes account of all technical and economic variables, and estimates a significant reduction in the Proven and Probable (2P) reserves in the Greater Laggan Area assets that is only partially offset by an increase in those of SSE’s mature asset base in the Southern North Sea. In addition, an impairment charge has been recognised in relation to Bacton field assets, predominantly related to higher than previously assessed decommissioning costs. The Gas Storage asset impairment relates to higher anticipated decommissioning costs.
Total net charges By asset class
Property, plant &
equipment £m
Gains/(losses) on
disposals £m
Total £m
SGN gain on sale – 307.3 307.3Clyde fair value uplift – 59.1 59.1Thermal Generation 31.6 – 31.6Gas Production (227.5) – (227.5)Gas Storage (23.8) – 23.8Retail and technology development (120.3) – 120.3Other (34.6) – 34.6
Total exceptional (charge)/gain (374.6) 366.4 (8.2)
By segment
Wholesale (237.9) 59.1 (178.8)Retail (112.7) – (112.7)Corporate (24.0) 307.3 283.3
Total (374.6) 366.4 (8.2)
36 SSE plc Annual Report 2017
Strategic Report – Our financial and business performance
Financial overview continued
The exceptional charges for Retail and other technology developments reflect impairments of capitalised costs following the decision taken to cease development of a replacement customer service and billing system and related technology development projects.
The Other exceptional charges are primarily the impairment of goodwill associated with the purchase of the Energy Solutions Group and offsetting changes in provisions relating to disputes and claims.
Reported profit before tax and earnings per shareReported results for 2016/17 are significantly higher than those for 2015/16 due to the impact on Reported profit before tax of the significant exceptional charges incurred in 2015/16. These related mainly to the write down of wholesale generation, gas storage and production assets in 2015/16 compared to the gain on sale of a stake in SGN plus lower asset write downs in 2016/17. This together with the relative movement in mark to market valuations on forward purchase contracts for commodities over both years (which at March 2017 were still ‘out of the money’) contributed to a net Reported gain before tax of £247.5m in 2016/17 compared to a loss before tax on those items of (£904.3m) in 2015/16.
This swing is explained in more detail in the relevant sections throughout this report and is the main driver for:
– Reported profit before tax increasing to £1,776.6m in 2016/17 compared to £593.3m in 2015/16, due to the movement in non-recurring exceptional items; and
– Reported earnings per share increasing to 158.4p in 2016/17 compared to 46.1p in 2015/16, again due to the movement in non-recurring exceptional items.
Investment and capital expenditureCentral to SSE’s strategic framework is efficient and disciplined investment in building a balanced range of economically-regulated and market-based energy assets that it also generally owns and operates. This means that investment should be in line with SSE’s commitment to strong financial management and consistent with the maintenance of a balanced range of assets within SSE’s businesses.
Investing efficiently in energy assets that the UK and Ireland need in 2016/17SSE invests in a balanced range of businesses and invests only in assets for which returns are expected to be clearly greater than the cost of capital. All projects complement SSE’s existing portfolio of assets and are governed and executed in an efficient manner and in
line with SSE’s commitment to strong financial management.
During 2016/17, SSE’s investment and capital expenditure totalled £1,726.2m. This included:
– a major investment programme in electricity networks: the switching on of the first section of an overhead link between Knocknagael and Kintore represented a key milestone in the Caithness-Moray electricity transmission link project. The project is the largest capital project ever undertaken by SSE and is on schedule for completion in 2018. This investment, alongside continued upgrading of the electricity distribution network to meet the changing needs of customers, will further increase the total Regulated Asset Value (RAV) of SSE’s networks businesses; and
– further investment in renewable energy in GB and Ireland: progress was made to increase SSE’s renewable energy portfolio in GB with projects to be delivered through the Renewables Obligation (RO), which also applies in Northern Ireland, Contracts for Difference (CfD) and Renewable Energy Feed in Tariff 2 in Ireland. Progress has been made at projects including the Clyde Extension (173MW); Stronelairg (225MW); the Beatrice offshore wind farm (SSE share 235MW); and Galway Wind Park (SSE share 120MW), which is the largest wind farm in Ireland. These projects, along with further onshore wind projects in construction or pre-construction and the recently delivered Tievenameenta (34MW) wind farm, will add just over 1GW to SSE’s renewable energy portfolio, taking SSE’s total renewable energy capacity 4.3GW including pumped storage.
In addition, SSE is fulfilling a regulatory obligation to install smart meters for its Energy Supply customers. At 31 March 2017 SSE had installed over 500,000 smart meters in customers’ homes. Post installation, SSE’s meters will transfer to a contracted Meter Asset Provider, therefore SSE’s investment and capital expenditure excludes the capital cost of installation and meter assets. Subject to the delivery timetable of the critical central infrastructure, and other GB-wide technical constraints affecting the progress of smart metering, SSE intends to ramp up its rollout significantly over 2017/18.
SSE is maintaining investment momentum, with capital and investment expenditure of around £1.7bn planned for 2017/18, similar levels currently expected for 2018/19 and around £6bn as a whole over the four years to 2020. Around £5bn of that is already committed, predominantly in building, owning and operating economically-
regulated electricity networks and government-mandated renewable energy projects. The revenue derived from those assets is generally index-linked.
Simplifying and re-shaping the SSE groupAs part of its long-standing strategic commitment to efficiency and disciplined investment, SSE is maintaining the significant downward pressure on its operating costs that it started in 2014.
Also in 2014 SSE commenced what was called a value programme to dispose of assets which were not core to its future plans, which resulted in a disproportionate burden, or which could release capital for future investment – all in the interests of simplifying and re-shaping the SSE group. The sale in March 2017 of its equity holding in the last of 11 PFI streetlighting contracts means the programme is now complete, and over the period between 2014 and 2017 SSE secured disposal proceeds and debt reduction as a result of this value programme totalling over £1.1bn.
The sale in October 2016 of a 16.7% stake in SGN for £621m is in addition to the £1.1bn received as a result of the value programme launched in 2014; but the SGN stake sale and the value programme both demonstrate that timely disposals to create value for shareholders should always be an option for SSE where they help to simplify and streamline the SSE group.
Financial management and balance sheetKeeping SSE well-financedAs a long-term business, SSE believes that it should maintain a strong balance sheet, illustrated by its commitment to robust ratios for retained cash flow and funds from operations/debt. SSE believes that a strong balance sheet enables it to secure funding from debt investors at competitive and efficient rates and take decisions that are focused on the long term – all of which supports the delivery of annual increases in the dividend of at least RPI inflation and the maintenance of an appropriate level of dividend cover. In October 2016, Moody’s Investors Service affirmed SSE’s senior credit rating of A3, changed SSE’s outlook from negative to stable and raised SSE’s threshold for retained cash flow/debt ratio of ‘mid teens’ (previously 13%). In the same month, Standard & Poor’s affirmed SSE’s A-rating and negative outlook, while also raising SSE’s threshold for funds from operations/debt ratio to 23% (previously 20-23%).
37
3.1. Strategic Report 2.
SSE has a long-standing commitment to maintaining financial discipline and diversity of funding sources and to moving quickly to select financial options that are consistent with this, including issuing new bonds and loans. In line with this, in March 2017, it successfully issued £1.03bn of hybrid debt. The dual tranche issue comprised £300m with a coupon of 3.625% and $900m with a coupon of 4.75%. The $900m tranche has been swapped back to both Euros and Sterling, bringing the all-in rate down to 2.72% and resulting in an all-in funding cost for both tranches to SSE of 3.02% per annum. The intent is to use the proceeds to replace SSE’s hybrid issued in 2012 (at an all-in rate of 5.6%), which has an issuer first call date on 1 October 2017. This will result in an annualised cash saving of around £26m from 2018/19. The combined hybrid coupon and hybrid interest payments in 2017/18 are expected to be £128m falling to around £80m in 2018/19. The new £1.03bn hybrids have a fixed redemption date and are therefore debt accounted and included within Loans and Other Borrowings while the existing £2.2bn of hybrids are perpetual instruments and are therefore equity accounted.
SSE has confirmed that the criteria applied by the rating agencies, Moody’s, and Standard and Poor’s, will result in broadly the same value of hybrid equity treatment as that of previous years.
During the year the £300m Scottish Hydro Electric Transmission plc facility with the European Investment Bank was drawn into a 10 year fixed rate term loan at a rate of 2.076% while a new £200m facility with the European Investment Bank was secured. The new facility is split evenly between SSE plc and Scottish Hydro Electric Transmission plc and will be drawn during 2017/18 at which point it will convert to 10 year term loans. The first of the one year extension options on the £1.5bn of bank facilities was exercised in 2016 meaning these facilities now mature in 2021 while the second one year option is likely to be exercised during 2017 which will take these maturities to 2022.
Maintaining a prudent treasury policy following the EU referendumSSE’s treasury policy is designed to be prudent and flexible. In line with that, cash from operations is first used to finance maintenance capital expenditure and then dividend payments, with further growth in capital expenditure and investment generally financed by a combination of: cash from operations; bank borrowings and bond issuance.
As a matter of policy, a minimum of 50% of SSE’s debt is subject to fixed rates of interest. Within this policy framework, SSE borrows as required on different interest bases, with financial instruments being used to achieve the desired out-turn interest rate profile. At 31 March 2017, 91% of SSE’s borrowings were at fixed rates.
Borrowings are mainly made in Sterling and Euros to reflect the underlying currency denomination of assets and cashflows within SSE. All other foreign currency borrowings are swapped back into either Sterling or Euros.
Transactional foreign exchange risk arises in respect of: procurement contracts; fuel and carbon purchasing; commodity hedging and energy portfolio management operations; and long-term service agreements for plant.
SSE’s policy is to hedge any material transactional foreign exchange risks through the use of forward currency purchases and/or financial instruments. This means that all its major project capex requirements are hedged, including the Stronelairg wind farm that was approved in 2016. Translational foreign exchange risk arises in respect of overseas investments, hedging in respect of such exposures is determined as appropriate to the circumstances on a case-by-case basis. Overall, while SSE has kept its treasury policy under review following the result of the EU Referendum, it has so far identified no need for change.
Managing net debt and maintaining cash flowSSE’s Adjusted net debt and hybrid capital was £8.5bn at 31 March 2017, compared with £9.0bn at 30 September 2016 and £8.4bn on 31 March 2016. The overall level of net debt and hybrid capital reflects SSE’s ongoing investment programme however it also includes an accounting increase of around £212m as a result of fair value adjustments. The fair value adjustment relates to marked-to-market movements on cross currency swaps and floating rate swaps that are classed as fair value hedges under IFRS and as a result of Sterling weakness and lower interest rates during 2016/17 these have become more ’in the money’ to SSE therefore increasing the net debt position. This accounting movement in debt is offset by an equivalent movement in derivative financial liabilities held on SSE’s balance sheet.
Adjusted net debt and hybrids at 31 March 2017 also includes £369m of the £500m proceeds identified for the share buy back from the sale of a 16.7% stake in SGN. Of this, £65m was deployed during the irrevocable, non-discretionary programme that continued during the close period from 1 April 2017 which means as at 17 May 2017 SSE has directed £196m towards the buy back, re-purchasing around 13.4m shares. It still expects the process to be completed by the end of December 2017. Adjusted net debt and hybrids is forecast to be around £9.5bn at March 2018.
Adjusted net debt excludes finance leases and includes outstanding liquid funds that relate to wholesale energy transactions.
As noted above SSE’s existing £2.2bn of hybrid equity is accounted for as equity within the Financial Statements but, as in previous years, has been included within SSE’s ‘Adjusted net debt and hybrid capital’ to aid comparability. SSE’s new £1.03bn of hybrid debt issued during 2016/17 is treated as debt. A reconciliation of Adjusted net debt and hybrid capital to Reported net debt is provided in the table headed Adjusted net debt and hybrid capital, due to the different accounting treatments, only the £2.2bn of hybrid equity is part of that reconciliation.
The level of Reported net debt also reflects SSE’s ongoing capital expenditure programme along with the impact of movements in foreign exchange rates.
Ensuring a strong debt structure through medium- and long-term borrowingsSSE’s objective is to maintain a reasonable range of debt maturities. Its average debt maturity, excluding hybrid securities, at 31 March 2017 was 8.8 years, compared with 8.9 years at 31 March 2016.
SSE’s debt structure remains strong, with around £8.7bn of medium/long term borrowings in the form of issued bonds, European Investment Bank debt and other loans. This includes £1.03bn of hybrid equity with their first call date on 2 October 2017, which it is intended will be redeemed using the proceeds of the most recent hybrid issuance.
The balance of SSE’s Adjusted net debt is financed with short-term bank debt. SSE’s Adjusted net debt includes cash and cash equivalents totalling £1.4bn and around £1.2bn of medium-term borrowings which will mature in the period to March 2018, including the hybrid bonds mentioned above.
38 SSE plc Annual Report 2017
Strategic Report – Our financial and business performance
Financial overview continued
Operating a Scrip Dividend SchemeThe Scrip Dividend Scheme, approved by SSE’s shareholders most recently in 2015, gives shareholders the option to receive new, fully paid Ordinary shares in the company in place of their cash dividend payments. It therefore reduces cash outflow and so supports the balance sheet. The Scrip dividend take-up:
– in August 2016 (relating to the final dividend for the year to 31 March 2016) resulted in a reduction in cash dividend funding of £142.6m, with 9.4 million new ordinary shares, fully paid, being issued; and
– in February 2017 (relating to the interim dividend for 2016/17) resulted in a reduction in cash dividend funding of £95.3m, with 6.3m new ordinary shares, fully paid, being issued.
This means that the cumulative cash dividend saving or additional equity capital resulting from the introduction of SSE’s Scrip Dividend Scheme in 2010 now stands at £1,289m and has resulted in the issue of 93.4 million Ordinary shares.
Managing net finance costsSSE believes Adjusted net finance costs provide the most useful measure of performance and a reconciliation of Adjusted and Reported net finance costs is provided in the table headed Net Finance Costs. SSE’s Adjusted net finance costs in 2016/17 were £328.1m, compared to £310.9m in 2015/16 reflecting the increase in net debt in the year. Reported net finance costs were £163.9m, compared to £192.1m. This reduction reflects a positive movement in finance derivatives of £52.6m in 2016/17 compared to £14.3m in 2015/16.
The coupon payments relating to the existing £2.2bn hybrid equity are presented as distributions to other equity holders and are reflected within Adjusted earnings per share when paid. In 2016/17 these totalled £119.3m, compared to £124.6m in the previous year. The coupon payments on the new £1.03bn hybrid debt issuance are treated as finance costs under IFRS and were £1.3m in 2016/17.
TaxSSE is one of the UK’s biggest taxpayers, and in the survey published in November 2016 was ranked 14th out of the 100 Group of Companies in 2016 in terms of taxes paid. In the year to 31 March 2017, SSE paid £385.0m of taxes on profits, property taxes, environmental taxes, and employment taxes in the UK, compared with £453.9m in the previous year. Total taxes paid in 2016/17 were lower than the previous year, primarily due to:
– reduced taxable profits from Gas Production as a result of lower gas prices and capital allowances from the Greater Laggan acquisition in 2015/16;
– the reduction in the Petroleum Revenue Tax rate to 0% from 1 January 2016;
– a one-off Land & Buildings Transaction Tax liability in 2015/16 on the Greater Laggan acquisition; and
– lower Climate Change Levy liabilities through reduced coal consumption.
SSE also paid €16.5 million of taxes in the Republic of Ireland, being the only country outside of the UK in which it has any trading operations.
SSE considers being a responsible taxpayer a core element of being a responsible member of society. SSE seeks to pay the right amount of tax on its profits, in the right place, at the right time, and continues to be the only FTSE 100 company to have been awarded the Fair Tax Mark. While SSE has an obligation to its customers and shareholders to efficiently manage its total tax liability, it does not seek to use the tax system in a way it does not consider it was meant to operate, or use “tax havens” to reduce its tax liabilities.
SSE understands it also has an obligation to the society in which it operates, and from which it benefits – for example, tax receipts are vital for the public services SSE relies upon. Therefore SSE’s tax policy is to operate within both the letter and spirit of the law at all times.
For reasons already stated above, SSE’s focus is on Adjusted profit before tax, and in line with that, SSE believes that the Adjusted current tax charge on that profit is the tax measure that best reflects underlying performance. SSE’s Adjusted current tax rate, based on Adjusted profit before tax, is 10.2%, as compared with 12.8% in 2015/16 on the same basis.
As would be expected for a Company of SSE’s size, the SSE group has a small number of tax enquiries ongoing with HMRC at any one time. In addition, under Corporate Tax Self Assessment, SSE adopts a filing position on matters in its tax returns that may be large or complex, with the position then being discussed with HMRC after the tax returns have been filed. SSE engages proactively with HMRC on such matters, but where SSE considers there to be a risk that HMRC may disagree with its view, and that additional tax may become payable as a result, a provision is made for the potential liability, which is then released once the matter has been agreed with HMRC. SSE considers this to be in line with the overall prudent approach to its tax responsibilities.
Group financial overview – conclusion and prioritiesSSE’s first financial objective is to deliver annual increases in the dividend that at least keep pace with RPI inflation. SSE believes that its strategic framework, opportunities for growth and effective financial management mean it can continue to deliver this in 2017/18 and beyond. Its financial priorities for 2017/18 as a whole include:
– delivering an annual increase in the dividend that at least keep pace with RPI inflation;
– maintaining dividend cover in a range from around 1.2 times to around 1.4 times, albeit towards the bottom of it;
– continuing a disciplined approach to investment in building, owning and operating a balanced range of energy related assets and delivering assets within the established investment programme, especially in economically-regulated Networks and government-mandated renewables;
– maintaining a strong balance sheet, with robust ratios for retained cash flow and funds from operations/debt; and
– completing deployment of the SGN stake sale proceeds by way of the on market share buy back, a process which could continue until the end of 2017.
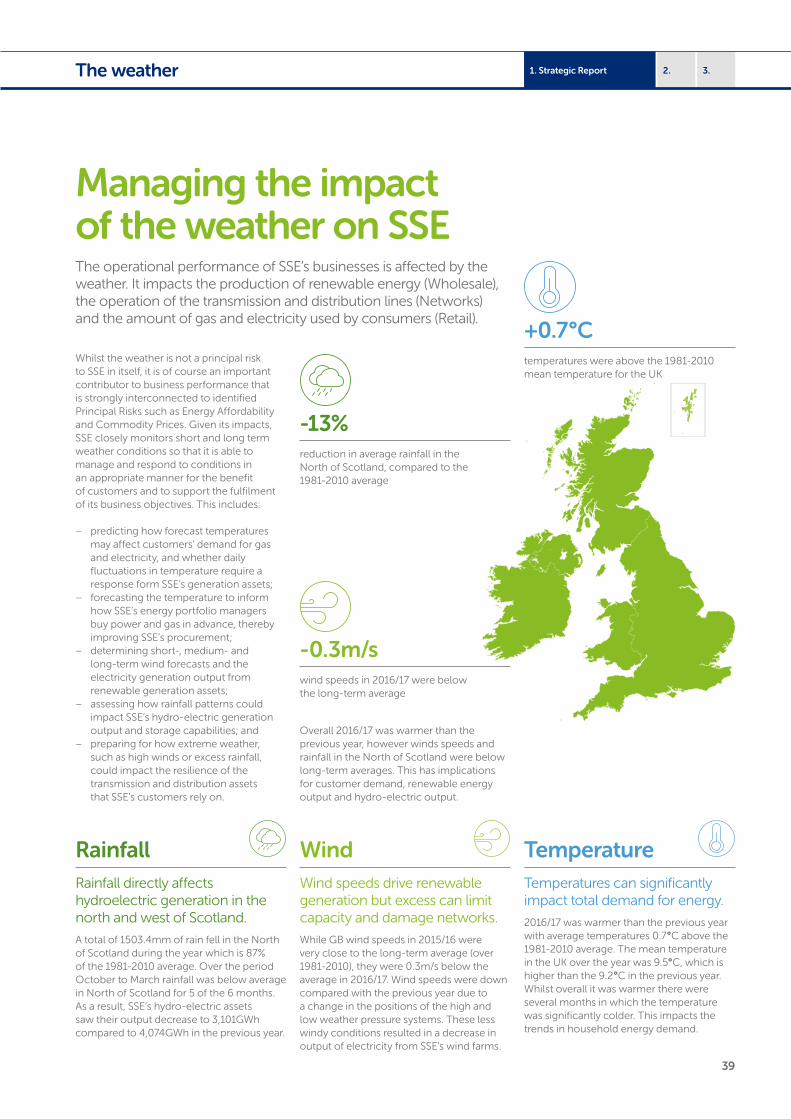
39
3.1. Strategic Report 2.The weather
The operational performance of SSE’s businesses is affected by the weather. It impacts the production of renewable energy (Wholesale), the operation of the transmission and distribution lines (Networks) and the amount of gas and electricity used by consumers (Retail).
Whilst the weather is not a principal risk to SSE in itself, it is of course an important contributor to business performance that is strongly interconnected to identified Principal Risks such as Energy Affordability and Commodity Prices. Given its impacts, SSE closely monitors short and long term weather conditions so that it is able to manage and respond to conditions in an appropriate manner for the benefit of customers and to support the fulfilment of its business objectives. This includes:
– predicting how forecast temperatures may affect customers’ demand for gas and electricity, and whether daily fluctuations in temperature require a response form SSE’s generation assets;
– forecasting the temperature to inform how SSE’s energy portfolio managers buy power and gas in advance, thereby improving SSE’s procurement;
– determining short-, medium- and long-term wind forecasts and the electricity generation output from renewable generation assets;
– assessing how rainfall patterns could impact SSE’s hydro-electric generation output and storage capabilities; and
– preparing for how extreme weather, such as high winds or excess rainfall, could impact the resilience of the transmission and distribution assets that SSE’s customers rely on.
Rainfall Rainfall directly affects hydroelectric generation in the north and west of Scotland.
A total of 1503.4mm of rain fell in the North of Scotland during the year which is 87% of the 1981-2010 average. Over the period October to March rainfall was below average in North of Scotland for 5 of the 6 months. As a result, SSE’s hydro-electric assets saw their output decrease to 3,101GWh compared to 4,074GWh in the previous year.
Wind Wind speeds drive renewable generation but excess can limit capacity and damage networks.
While GB wind speeds in 2015/16 were very close to the long-term average (over 1981-2010), they were 0.3m/s below the average in 2016/17. Wind speeds were down compared with the previous year due to a change in the positions of the high and low weather pressure systems. These less windy conditions resulted in a decrease in output of electricity from SSE’s wind farms.
Temperature Temperatures can significantly impact total demand for energy.
2016/17 was warmer than the previous year with average temperatures 0.7°C above the 1981-2010 average. The mean temperature in the UK over the year was 9.5°C, which is higher than the 9.2°C in the previous year. Whilst overall it was warmer there were several months in which the temperature was significantly colder. This impacts the trends in household energy demand.
-13%reduction in average rainfall in the North of Scotland, compared to the 1981-2010 average
+0.7°Ctemperatures were above the 1981-2010 mean temperature for the UK
-0.3m/swind speeds in 2016/17 were below the long-term average
Overall 2016/17 was warmer than the previous year, however winds speeds and rainfall in the North of Scotland were below long-term averages. This has implications for customer demand, renewable energy output and hydro-electric output.
Managing the impact of the weather on SSE
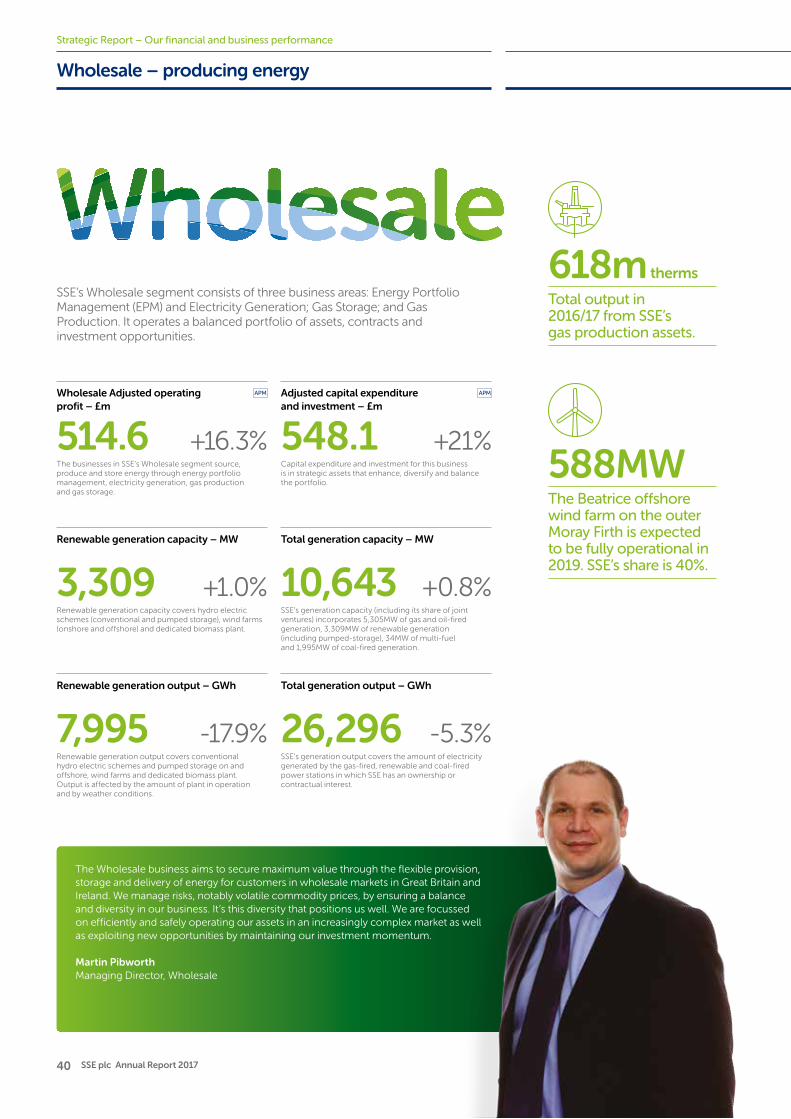
40 SSE plc Annual Report 2017
Wholesale – producing energy
SSE’s Wholesale segment consists of three business areas: Energy Portfolio Management (EPM) and Electricity Generation; Gas Storage; and Gas Production. It operates a balanced portfolio of assets, contracts and investment opportunities.
The Wholesale business aims to secure maximum value through the flexible provision, storage and delivery of energy for customers in wholesale markets in Great Britain and Ireland. We manage risks, notably volatile commodity prices, by ensuring a balance and diversity in our business. It’s this diversity that positions us well. We are focussed on efficiently and safely operating our assets in an increasingly complex market as well as exploiting new opportunities by maintaining our investment momentum.
Martin Pibworth Managing Director, Wholesale
Wholesale Adjusted operating profit – £m
514.6 +16.3%The businesses in SSE’s Wholesale segment source, produce and store energy through energy portfolio management, electricity generation, gas production and gas storage.
Adjusted capital expenditure and investment – £m
548.1 +21%Capital expenditure and investment for this business is in strategic assets that enhance, diversify and balance the portfolio.
Renewable generation capacity – MW
3,309 +1.0%Renewable generation capacity covers hydro electric schemes (conventional and pumped storage), wind farms (onshore and offshore) and dedicated biomass plant.
Total generation capacity – MW
10,643 +0.8%SSE’s generation capacity (including its share of joint ventures) incorporates 5,305MW of gas and oil-fired generation, 3,309MW of renewable generation (including pumped-storage), 34MW of multi-fuel and 1,995MW of coal-fired generation.
Renewable generation output – GWh
7,995 -17.9%Renewable generation output covers conventional hydro electric schemes and pumped storage on and offshore, wind farms and dedicated biomass plant. Output is affected by the amount of plant in operation and by weather conditions.
Total generation output – GWh
26,296 -5.3%SSE’s generation output covers the amount of electricity generated by the gas-fired, renewable and coal-fired power stations in which SSE has an ownership or contractual interest.
618m therms
Total output in 2016/17 from SSE’s gas production assets.
588MW The Beatrice offshore wind farm on the outer Moray Firth is expected to be fully operational in 2019. SSE’s share is 40%.
Strategic Report – Our financial and business performance
1. Strategic Report 2. 3.
41
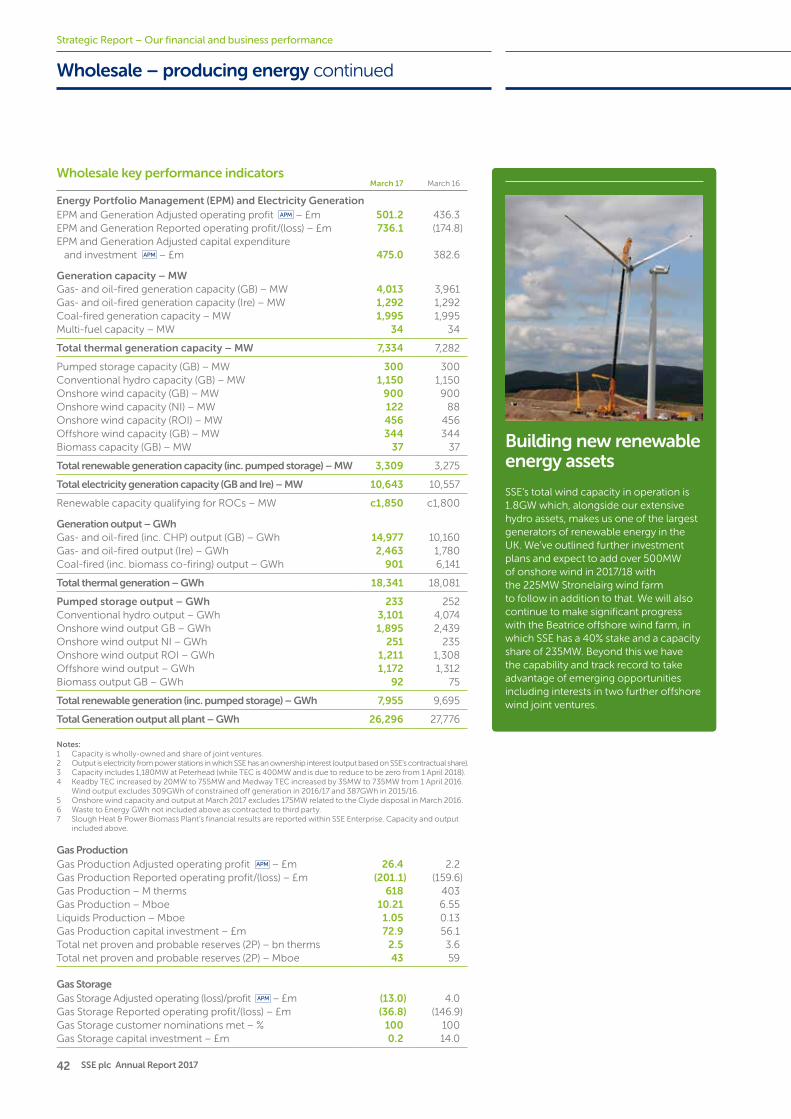
42 SSE plc Annual Report 2017
Wholesale – producing energy continued
Building new renewable energy assets
SSE’s total wind capacity in operation is 1.8GW which, alongside our extensive hydro assets, makes us one of the largest generators of renewable energy in the UK. We’ve outlined further investment plans and expect to add over 500MW of onshore wind in 2017/18 with the 225MW Stronelairg wind farm to follow in addition to that. We will also continue to make significant progress with the Beatrice offshore wind farm, in which SSE has a 40% stake and a capacity share of 235MW. Beyond this we have the capability and track record to take advantage of emerging opportunities including interests in two further offshore wind joint ventures.
Strategic Report – Our financial and business performance
Wholesale key performance indicatorsMarch 17 March 16
Energy Portfolio Management (EPM) and Electricity GenerationEPM and Generation Adjusted operating profit – £m 501.2 436.3EPM and Generation Reported operating profit/(loss) – £m 736.1 (174.8)EPM and Generation Adjusted capital expenditure
and investment – £m 475.0 382.6
Generation capacity – MWGas- and oil-fired generation capacity (GB) – MW 4,013 3,961Gas- and oil-fired generation capacity (Ire) – MW 1,292 1,292Coal-fired generation capacity – MW 1,995 1,995Multi-fuel capacity – MW 34 34
Total thermal generation capacity – MW 7,334 7,282
Pumped storage capacity (GB) – MW 300 300Conventional hydro capacity (GB) – MW 1,150 1,150Onshore wind capacity (GB) – MW 900 900Onshore wind capacity (NI) – MW 122 88Onshore wind capacity (ROI) – MW 456 456Offshore wind capacity (GB) – MW 344 344Biomass capacity (GB) – MW 37 37
Total renewable generation capacity (inc. pumped storage) – MW 3,309 3,275
Total electricity generation capacity (GB and Ire) – MW 10,643 10,557
Renewable capacity qualifying for ROCs – MW c1,850 c1,800
Generation output – GWhGas- and oil-fired (inc. CHP) output (GB) – GWh 14,977 10,160Gas- and oil-fired output (Ire) – GWh 2,463 1,780Coal-fired (inc. biomass co-firing) output – GWh 901 6,141
Total thermal generation – GWh 18,341 18,081
Pumped storage output – GWh 233 252Conventional hydro output – GWh 3,101 4,074Onshore wind output GB – GWh 1,895 2,439Onshore wind output NI – GWh 251 235Onshore wind output ROI – GWh 1,211 1,308Offshore wind output – GWh 1,172 1,312Biomass output GB – GWh 92 75
Total renewable generation (inc. pumped storage) – GWh 7,955 9,695
Total Generation output all plant – GWh 26,296 27,776
Notes:1 Capacity is wholly-owned and share of joint ventures.2 Output is electricity from power stations in which SSE has an ownership interest (output based on SSE’s contractual share).3 Capacity includes 1,180MW at Peterhead (while TEC is 400MW and is due to reduce to be zero from 1 April 2018).4 Keadby TEC increased by 20MW to 755MW and Medway TEC increased by 35MW to 735MW from 1 April 2016.
Wind output excludes 309GWh of constrained off generation in 2016/17 and 387GWh in 2015/16.5 Onshore wind capacity and output at March 2017 excludes 175MW related to the Clyde disposal in March 2016. 6 Waste to Energy GWh not included above as contracted to third party.7 Slough Heat & Power Biomass Plant’s financial results are reported within SSE Enterprise. Capacity and output
included above.
Gas ProductionGas Production Adjusted operating profit – £m 26.4 2.2Gas Production Reported operating profit/(loss) – £m (201.1) (159.6)Gas Production – M therms 618 403Gas Production – Mboe 10.21 6.55Liquids Production – Mboe 1.05 0.13Gas Production capital investment – £m 72.9 56.1Total net proven and probable reserves (2P) – bn therms 2.5 3.6Total net proven and probable reserves (2P) – Mboe 43 59
Gas StorageGas Storage Adjusted operating (loss)/profit – £m (13.0) 4.0Gas Storage Reported operating profit/(loss) – £m (36.8) (146.9)Gas Storage customer nominations met – % 100 100Gas Storage capital investment – £m 0.2 14.0
43
3.1. Strategic Report 2.
What is the role of the Wholesale business within SSE’s strategic framework? Wholesale makes a significant contribution to overall Group operating profit. It is a business which is impacted by many different changing external factors, from commodity prices, exchange rates, the shift to a low-carbon economy to regulatory and political change. The business has a diverse asset portfolio and investment opportunities. This means that whilst overall there was lower output from renewable sources of energy in 2016/17, due to the weather, and gas storage remains a very challenged business, there was improved financial performance from thermal generation and Energy Portfolio Management. There is also a significant investment programme continuing in a range of technologies including offshore wind, onshore wind and multi-fuel.
The energy market is changing – has the Wholesale businesses strategy adapted? Yes. Change is a fact of life for this business and we must embrace it. One of the starkest changes is how lower carbon forms of generation are displacing coal and the scale of the cost reductions in some low carbon technologies is notable. As a business we continue to adapt, review and shape our portfolio of assets, contractual positions and investments in the context of an uncertain market. In doing so diversity and flexibility is important, particularly given the volatility in the electricity market. This business works to ensure it has the options it needs to adapt to changing market conditions and to act as opportunities emerge. In offshore wind or new gas-fired generation investment, for example, SSE has good options for the future. We also have a portfolio of gas production assets including the Greater Laggan area assets acquired in 2015, which now produce significant volumes and contribute to the profitability of the business and will do so for years to come.
Renewable energy has been core to SSE’s investment pipeline, but with no available subsidy for new onshore wind in the UK what is the outlook for your generation capital expenditure? Looking ahead we retain a number of options in on- and offshore wind. The Beatrice offshore wind project, which we own 40% of, is one of the largest infrastructure projects ever seen in Scotland. While it remains a complex project to deliver, it is on course to be operational in 2019. Alongside this we have interests in offshore wind projects at Dogger Bank and Seagreen which we are hopeful can progress towards bidding for support contracts. In onshore wind we have sites in construction, including Stronelairg wind farm in Scotland. The future regulatory and policy framework is developing and we will continue to adapt to it, however, we think renewables in the UK has a bright future and, as the sector grows, it brings major industrial and supply chain benefits too. In short, we have plenty of options for the future but, as always with capital investment decisions, will apply our disciplined approach.
The decline in coal-fired generation is a major trend across the sector, so what are the implications for your portfolio of assets and investments? SSE operates a balanced portfolio of energy generation assets. This includes the coal-fired power station at Fiddler’s Ferry in Cheshire, hydro, on and offshore wind, and gas generation as well as multi-fuel. Coal output has significantly declined but the UK Government’s commitment to phasing out coal by 2025 means it still has a role to play. Operating the electricity system is an immensely complex task, and over the next few years there will still be points at which coal-fired power stations will be needed to keep it stable and secure for the customers who depend on it.
The acquisition of gas production assets in the Greater Laggan area completed in 2015 and has already been subject to impairment charges. Is SSE still positive about these assets? Yes. There has been a significant rise in SSE’s gas production this year primarily due to the ramp up of output from the newly commissioned fields in the Greater Laggan Area (GLA), partially offset by the natural decline in output from the more mature fields in SSE’s gas production portfolio. GLA started in 2016 with production rates peaking at up to 90,000 boe a day. Assets of this type are subject to assessments at least annually by independent reserves auditors who found that the GLA’s Proven plus Probable (2P) reserves are estimated to have reduced, resulting in an exceptional impairment of £180.5m at the 2016/17 year end. While this is clearly disappointing, movement in the technical assessment of 2P reserves is a well-known occurrence, particularly for new fields. This decrease reflects current best, but early stage, understanding of the fields, it now appears there is greater compartmentalisation of gas than expected, which could require some further capital investment to extract. Consequently, this also means the level of Contingent Reserves (2C) has increased. Overall, these gas production assets are long-term assets and are expected to make an important contribution to EBITDA with SSE’s average annual volumes of gas and liquids produced expected to average around 500 million therms of gas per year in the three years to March 2020.
What are the Wholesale businesses principal strategic priorities for the year ahead? Our priorities are to operate our assets safely, reliably and efficiently; deliver new assets in construction, as well as develop new opportunities to build, own and operate assets in the future; ensure efficient delivery of gas from the offshore fields in which SSE has a shared ownership; and secure value, where appropriate, through the risk-managed trading of energy- related commodities.
For the full analysis of SSE’s Wholesale business in 2016/17, see the Full-Year Results Statement (2016/17) available on sse.com.
Key questions and answers about SSE’s Wholesale business
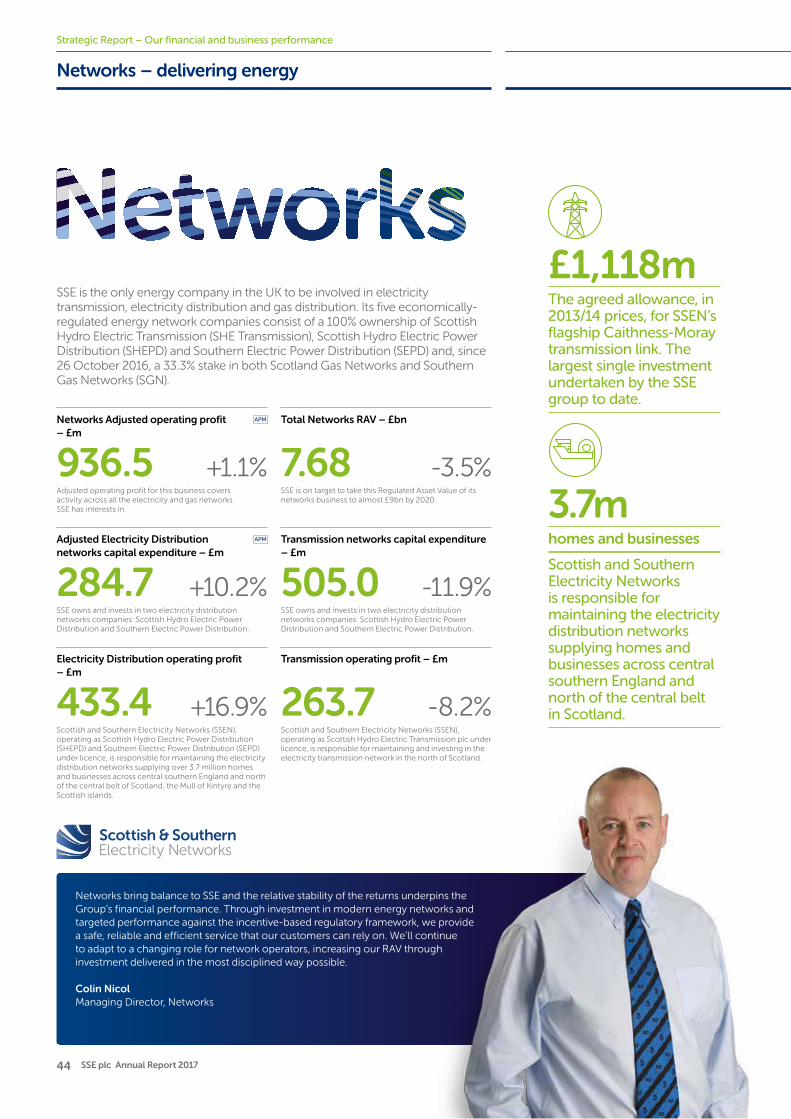
44 SSE plc Annual Report 2017
Networks – delivering energy
SSE is the only energy company in the UK to be involved in electricity transmission, electricity distribution and gas distribution. Its five economically-regulated energy network companies consist of a 100% ownership of Scottish Hydro Electric Transmission (SHE Transmission), Scottish Hydro Electric Power Distribution (SHEPD) and Southern Electric Power Distribution (SEPD) and, since 26 October 2016, a 33.3% stake in both Scotland Gas Networks and Southern Gas Networks (SGN).
Networks bring balance to SSE and the relative stability of the returns underpins the Group’s financial performance. Through investment in modern energy networks and targeted performance against the incentive-based regulatory framework, we provide a safe, reliable and efficient service that our customers can rely on. We’ll continue to adapt to a changing role for network operators, increasing our RAV through investment delivered in the most disciplined way possible.
Colin Nicol Managing Director, Networks
Networks Adjusted operating profit – £m
936.5 +1.1%Adjusted operating profit for this business covers activity across all the electricity and gas networks SSE has interests in.
Total Networks RAV – £bn
7.68 -3.5%SSE is on target to take this Regulated Asset Value of its networks business to almost £9bn by 2020.
Adjusted Electricity Distribution networks capital expenditure – £m
284.7 +10.2%SSE owns and invests in two electricity distribution networks companies: Scottish Hydro Electric Power Distribution and Southern Electric Power Distribution.
Transmission networks capital expenditure – £m
505.0 -11.9%SSE owns and invests in two electricity distribution networks companies: Scottish Hydro Electric Power Distribution and Southern Electric Power Distribution.
Electricity Distribution operating profit – £m
433.4 +16.9%Scottish and Southern Electricity Networks (SSEN), operating as Scottish Hydro Electric Power Distribution (SHEPD) and Southern Electric Power Distribution (SEPD) under licence, is responsible for maintaining the electricity distribution networks supplying over 3.7 million homes and businesses across central southern England and north of the central belt of Scotland, the Mull of Kintyre and the Scottish islands.
Transmission operating profit – £m
263.7 -8.2%Scottish and Southern Electricity Networks (SSEN), operating as Scottish Hydro Electric Transmission plc under licence, is responsible for maintaining and investing in the electricity transmission network in the north of Scotland.
£1,118m The agreed allowance, in 2013/14 prices, for SSEN’s flagship Caithness-Moray transmission link. The largest single investment undertaken by the SSE group to date.
Strategic Report – Our financial and business performance
3.7mhomes and businesses
Scottish and Southern Electricity Networks is responsible for maintaining the electricity distribution networks supplying homes and businesses across central southern England and north of the central belt in Scotland.

1. Strategic Report 2. 3.
45
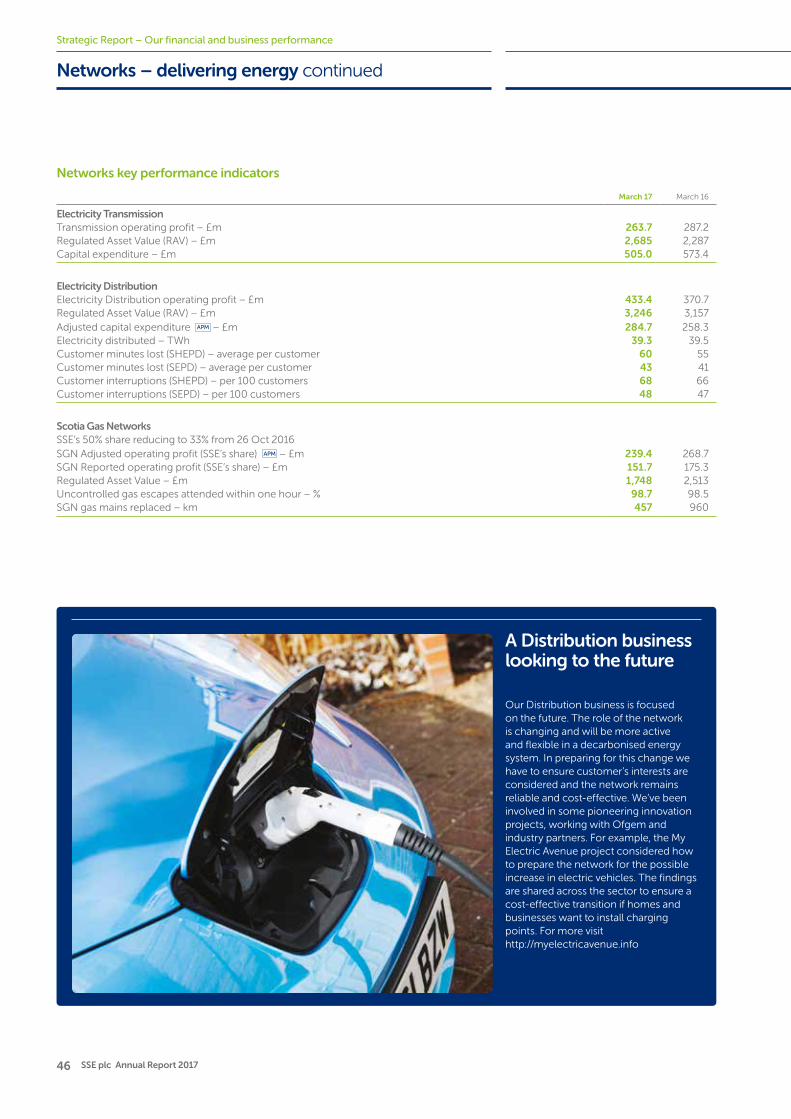
46 SSE plc Annual Report 2017
Networks – delivering energy continued
A Distribution business looking to the future
Our Distribution business is focused on the future. The role of the network is changing and will be more active and flexible in a decarbonised energy system. In preparing for this change we have to ensure customer’s interests are considered and the network remains reliable and cost-effective. We’ve been involved in some pioneering innovation projects, working with Ofgem and industry partners. For example, the My Electric Avenue project considered how to prepare the network for the possible increase in electric vehicles. The findings are shared across the sector to ensure a cost-effective transition if homes and businesses want to install charging points. For more visit http://myelectricavenue.info
Strategic Report – Our financial and business performance
Networks key performance indicators
March 17 March 16
Electricity TransmissionTransmission operating profit – £m 263.7 287.2Regulated Asset Value (RAV) – £m 2,685 2,287Capital expenditure – £m 505.0 573.4
Electricity DistributionElectricity Distribution operating profit – £m 433.4 370.7Regulated Asset Value (RAV) – £m 3,246 3,157Adjusted capital expenditure – £m 284.7 258.3Electricity distributed – TWh 39.3 39.5Customer minutes lost (SHEPD) – average per customer 60 55Customer minutes lost (SEPD) – average per customer 43 41Customer interruptions (SHEPD) – per 100 customers 68 66Customer interruptions (SEPD) – per 100 customers 48 47
Scotia Gas NetworksSSE’s 50% share reducing to 33% from 26 Oct 2016SGN Adjusted operating profit (SSE’s share) – £m 239.4 268.7SGN Reported operating profit (SSE’s share) – £m 151.7 175.3Regulated Asset Value – £m 1,748 2,513Uncontrolled gas escapes attended within one hour – % 98.7 98.5SGN gas mains replaced – km 457 960

47
3.1. Strategic Report 2.
How would describe 2016/17 for SSE’s Networks business? It was a year of important progress at Scottish and Southern Electricity Networks (SSEN). We have moved forward in areas such as innovation, investment and customer service, as well as continuing to provide a safe and reliable electricity supply to homes and businesses across our networks. We are also undertaking a business-wide change programme to improve the efficiency and capability of our business and set ourselves up well for a successful future. Networks remains central to the fulfilment of SSE’s strategy and underpins SSE’s commitment to annual dividend growth through stable returns and index-linked RAV, which bring balance and investment options to SSE.
Excellence in customer and stakeholder engagement is an increasingly important component of the RIIO regulatory framework, so, is SSEN expanding its capabilities in this area? Yes. SSEN is a customer-focused business. We transmit and distribute electricity to over 3.7 million customers and have to be focused on their needs first and foremost. Ofgem also recognise this and the RIIO framework was created to make sure the needs of the customer is considered and our financial incentives or penalties are judged against that. This includes power restoration times, the support for vulnerable customers, efficient connection management and stakeholder involvement in decision making. We’ve significantly invested in this area to ensure we continue to deliver to meet the needs of our customers. In September we rebranded our business to Scottish and Southern Electricity Networks so the business more accurately reflects what we do and where we do it. We have launched several initiatives that have increased our stakeholders’ voice in our business decisions, including stakeholder feedback on the visual impact of our transmission assets in Scotland, which presents an opportunity to look again at the visual impact of our existing infrastructure in Scotland’s National Parks and National Scenic Areas; similar to a scheme for our distribution networks which invites stakeholders to nominate areas for undergrounding of 90km of distribution power lines in National Parks, Areas of Natural Beauty and National Scenic Areas; and the launch of our independent Stakeholder Advisory Panel.
How is SSEN preparing for a changing energy market? There is no doubt that technology improvements, decarbonisation of electricity generation and increasing levels of demand-side response and energy storage will further transform the way network operators do business, with distribution companies in particular required to adapt to a new active and flexible distribution system operator role. From SSEN’s perspective, we are well positioned to maximise opportunities from this change, having led the way in innovations such as Active Network Management on Orkney, considering the impact of electric vehicles through our Electric Avenue initiative and the six-year long Thames Valley Vision project. We’ll continue to engage constructively with policy-makers, the regulator and industry to ensure that a phased transition to a flexible role is delivered in the best interests of customers.
How is the Caithness-Moray transmission link, SSE’s largest ever construction project, progressing and what’s next for capital expenditure in Transmission? Good progress has been made. The sheer scale of the project is remarkable and with the manufacture of the subsea cable now complete, we expect its installation on the Moray Firth seabed later this year. Progress remains on track with completion expected by the end of 2018. We’ve developed significant construction capabilities and see major opportunities from the low-carbon transition. Our capabilities and opportunities arising mean we expect the RAV of this business to reach around £3bn by 2018.
We are now four years into the Transmission Price Control, so is SSE’s Networks business now thinking about the future? Absolutely. The mid-point of Transmission’s price control means that thoughts now turn to the arrangements after 2021. We’re starting to consider our business plan and how we can meet the needs of customers in the north of Scotland in the next decade. We’ll be working with stakeholders to help shape our thinking and ensure that our plan is as robust and customer focused as possible.
What is SSEN’s principal priority for the year ahead? SSEN’s core priority is always to provide a safe and reliable supply of electricity to the communities we serve from the Scottish islands to the Isle of Wight. We never lose sight of our role to provide a reliable energy network those homes and businesses can rely on. Our investment plans will also continue and our committed plans mean that the total RAV of SSE’s network businesses is well placed to reach almost £9bn by 2020.
Has demand for renewable energy connections in Scotland continued and what is the outlook? In advance of the closure of the Renewables Obligations Scheme, there has been an increased demand for SSEN to provide connections to its transmission network for renewable energy developers. In fact it’s been a record year. Including that connected at distribution level, SSEN connected over 500MW of renewable electricity to its networks in 2016/17, the highest combined capacity to connect to the north of Scotland network in a single year since electricity privatisation. This continues the rapid growth of renewable energy in the north of Scotland, and low-carbon sources now make up 4.5GW of generation capacity in our licence area. Alongside this increase in connections SSEN was able to maintain 99.9% network reliability, giving customers a reliable and safe supply of electricity. Going forward we expect a significant number of new renewable energy projects to connect to the transmission network throughout the remainder of the transmission price control to March 2021, subject to developers reaching financial close.
For the full analysis of SSE’s Networks business in 2016/17, see the Full-Year Results Statement (2016/17) available on sse.com.
Key questions and answers about SSE’s Networks business
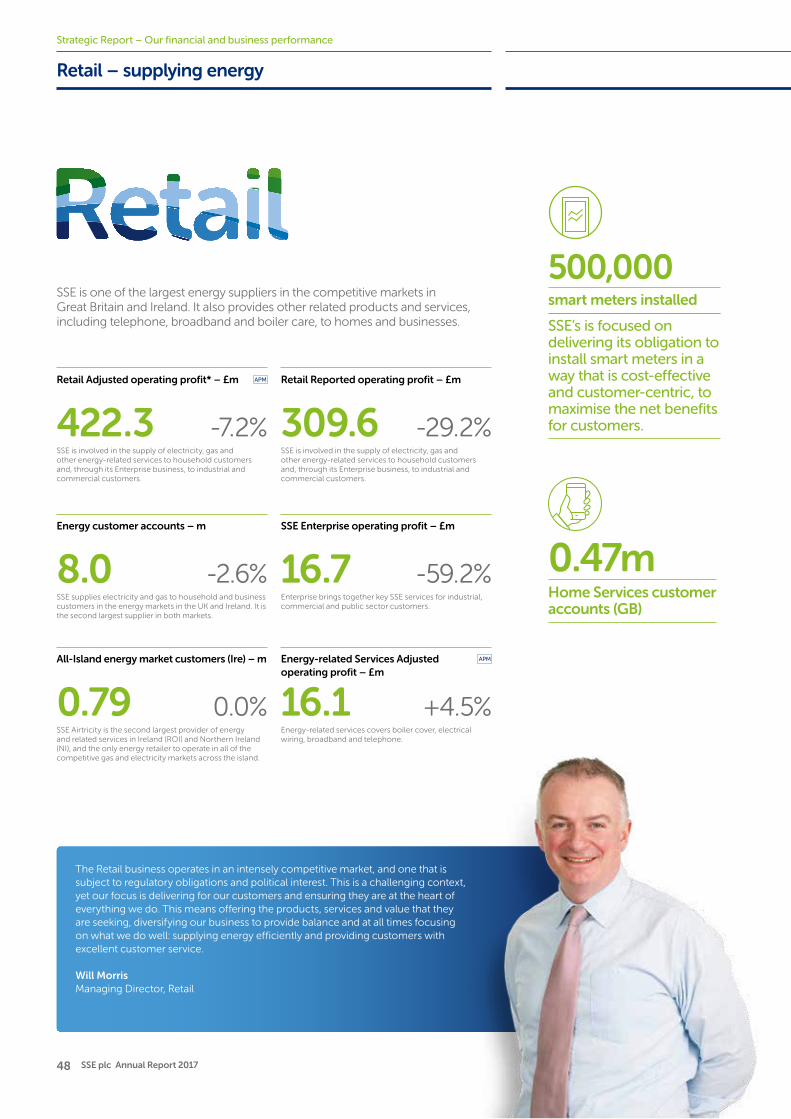
48 SSE plc Annual Report 2017
Retail Adjusted operating profit* – £m
422.3 -7.2%SSE is involved in the supply of electricity, gas and other energy-related services to household customers and, through its Enterprise business, to industrial and commercial customers.
Retail – supplying energy
SSE is one of the largest energy suppliers in the competitive markets in Great Britain and Ireland. It also provides other related products and services, including telephone, broadband and boiler care, to homes and businesses.
The Retail business operates in an intensely competitive market, and one that is subject to regulatory obligations and political interest. This is a challenging context, yet our focus is delivering for our customers and ensuring they are at the heart of everything we do. This means offering the products, services and value that they are seeking, diversifying our business to provide balance and at all times focusing on what we do well: supplying energy efficiently and providing customers with excellent customer service.
Will Morris Managing Director, Retail
Retail Reported operating profit – £m
309.6 -29.2%SSE is involved in the supply of electricity, gas and other energy-related services to household customers and, through its Enterprise business, to industrial and commercial customers.
All-Island energy market customers (Ire) – m
0.79 0.0%SSE Airtricity is the second largest provider of energy and related services in Ireland (ROI) and Northern Ireland (NI), and the only energy retailer to operate in all of the competitive gas and electricity markets across the island.
SSE Enterprise operating profit – £m
16.7 -59.2%Enterprise brings together key SSE services for industrial, commercial and public sector customers.
Energy customer accounts – m
8.0 -2.6%SSE supplies electricity and gas to household and business customers in the energy markets in the UK and Ireland. It is the second largest supplier in both markets.
500,000smart meters installed
0.47mHome Services customer accounts (GB)
Strategic Report – Our financial and business performance
Energy-related Services Adjusted operating profit – £m
16.1 +4.5%Energy-related services covers boiler cover, electrical wiring, broadband and telephone.
SSE’s is focused on delivering its obligation to install smart meters in a way that is cost-effective and customer-centric, to maximise the net benefits for customers.

1. Strategic Report 2. 3.
49
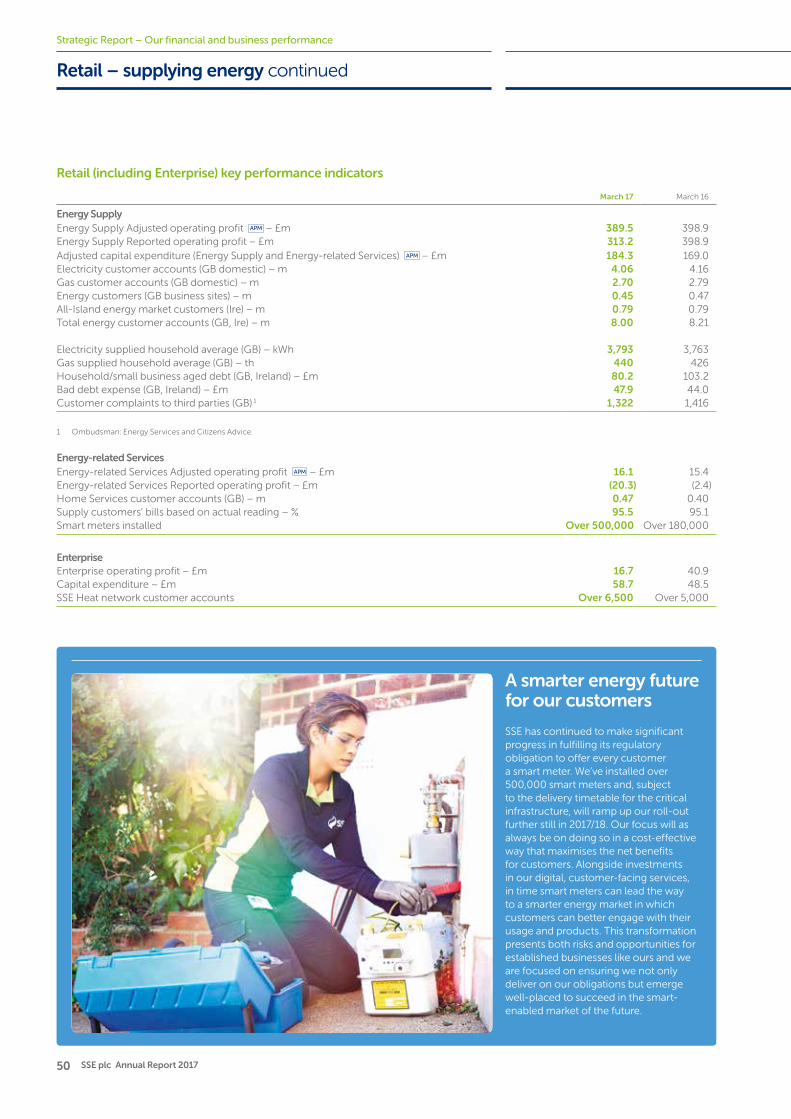
50 SSE plc Annual Report 2017
Retail – supplying energy continued
A smarter energy future for our customers
SSE has continued to make significant progress in fulfilling its regulatory obligation to offer every customer a smart meter. We’ve installed over 500,000 smart meters and, subject to the delivery timetable for the critical infrastructure, will ramp up our roll-out further still in 2017/18. Our focus will as always be on doing so in a cost-effective way that maximises the net benefits for customers. Alongside investments in our digital, customer-facing services, in time smart meters can lead the way to a smarter energy market in which customers can better engage with their usage and products. This transformation presents both risks and opportunities for established businesses like ours and we are focused on ensuring we not only deliver on our obligations but emerge well-placed to succeed in the smart-enabled market of the future.
Strategic Report – Our financial and business performance
Retail (including Enterprise) key performance indicators
March 17 March 16
Energy SupplyEnergy Supply Adjusted operating profit – £m 389.5 398.9Energy Supply Reported operating profit – £m 313.2 398.9Adjusted capital expenditure (Energy Supply and Energy-related Services) – £m 184.3 169.0Electricity customer accounts (GB domestic) – m 4.06 4.16Gas customer accounts (GB domestic) – m 2.70 2.79Energy customers (GB business sites) – m 0.45 0.47All-Island energy market customers (Ire) – m 0.79 0.79Total energy customer accounts (GB, Ire) – m 8.00 8.21
Electricity supplied household average (GB) – kWh 3,793 3,763Gas supplied household average (GB) – th 440 426Household/small business aged debt (GB, Ireland) – £m 80.2 103.2Bad debt expense (GB, Ireland) – £m 47.9 44.0Customer complaints to third parties (GB) 1 1,322 1,416
1 Ombudsman: Energy Services and Citizens Advice.
Energy-related ServicesEnergy-related Services Adjusted operating profit – £m 16.1 15.4Energy-related Services Reported operating profit – £m (20.3) (2.4)Home Services customer accounts (GB) – m 0.47 0.40Supply customers’ bills based on actual reading – % 95.5 95.1Smart meters installed Over 500,000 Over 180,000
EnterpriseEnterprise operating profit – £m 16.7 40.9Capital expenditure – £m 58.7 48.5SSE Heat network customer accounts Over 6,500 Over 5,000
51
3.1. Strategic Report 2.
How would you describe the performance of the Retail business in 2016/17? We have to acknowledge that operating profit fell and that we experienced a decline in household energy customer numbers. We are, however, pleased with the positive aspects of performance this year. We have continued to expand our customer propositions, whilst maintaining our good record in customer service. The net loss of customer accounts was the lowest we’ve seen for a number of years and we showed we can compete successfully for new customers, while also working hard to retain customers in greater numbers. Good progress is being made in our investments in digital, customer-facing systems and in diversifying our products and services. We took the difficult decision to increase standard electricity prices for household customers in GB from April 2017, although were able to hold gas prices. The business faces two prevailing headwinds: regulatory and political scrutiny of energy costs, to which we need to respond as constructively as we can, and the increasingly competitive market.
Customer account numbers have fallen, so how are you responding to that? The energy retail market is the most competitive it has ever been and this year switching levels were at their highest rate since Energy UK began its records. There are over 50 suppliers and a range of products and services are available to customers. We don’t have a specific target for customer numbers – the market is too complex and fast moving to allow for that. Nevertheless, winning and retaining customers in a fiercely competitive market is central to this business. That’s why our focus is on ensuring we are doing the right things to treat customers fairly and to give them what they are looking for in products, service and value.
Consumer habits and expectations are changing and competition is fierce. How is the Retail business adapting to this? It’s true that the market is changing. Smart metering, faster switching and the increasing connectivity of customers’ homes will have a transformative effect. This also presents us with an opportunity to enhance service levels,
drive further engagement and reduce costs. We are digitalising our business to meet the changing expectations that people have about how they want to engage with products such as energy and essential services. Importantly we also have to get the basics right, listening to, and engaging with, our customers; so providing excellent customer service is critical. Our track record in this, notably complaint handling, remains strong and we want to maintain our leadership position in this area.
What are the growth areas for SSE’s Retail business? We see two prominent areas for growth. Firstly, we want to expand our I&C customer base and build upon the progress we’ve made in recent years. Secondly, our business is increasingly focused on diversifying into new markets; that’s why we’re particularly pleased that our Home Services business now has a national presence, and we’ve now grown to nearly 500k non-energy customers across broadband, telephone and home services. We are targeting further growth in this area as we continue with our strategy of becoming more than a retailer of gas and electricity.
The price of energy has again risen up the political agenda, with potential government interventions, how is the business managing this risk? Energy is an essential service and customers, and the affordability of energy, are at the heart of every decision we make. We regret having to take the difficult decision to increase electricity tariffs, but without this increase SSE would have been supplying electricity at a financial loss. At the same time, we also have outlined major plans to engage customers with the products, services and rewards we offer, we continue to take costs out of the business and we work closely with the regulator and our stakeholders on issues affecting customers. Governments should be mindful of the progress the market has made in any interventions they make.
What does SSE’s Retail business do to help vulnerable customers?As an essential service provider, looking after our vulnerable customers is central to how we operate. That’s why we became the first energy supplier in Great Britain to commit publically to achieving the British Standard for Inclusive Service Provision. This represents the gold standard in recognising and catering for vulnerability. In addition to this, we have a wide range of practical services to help people who are struggling with their energy bills. The key point for any customer who is vulnerable at any time is: if you have any worries or concerns about paying for your energy, get in touch with us. There are many ways in which we can help. One of the initiatives we are particularly proud of is our advisers referring customers for Benefit Entitlements Checks. The outcome of these checks can transform people’s lives for the better.
What are Retail’s principal strategic priorities for the year ahead? We are focused on doing the right things to give customers what they are looking for in terms of products, service and value. The net loss of customer accounts in 2016/17 was lower than in previous years, and our service, programmes of engagement, products and investment in digitalising front-end, customer-facing systems will continue. We also need to fulfil our existing regulatory obligations and work with the regulator on the CMA remedies and other reforms from government to ensure the competitive market works in a way that benefits all customers and, critically, make sure we are well positioned to compete successfully for customers in the future market.
For the full analysis of SSE’s Retail business in 2016/17, see the Full-Year Results Statement (2016/17) available on sse.com.
Key questions and answers about SSE’s Retail business
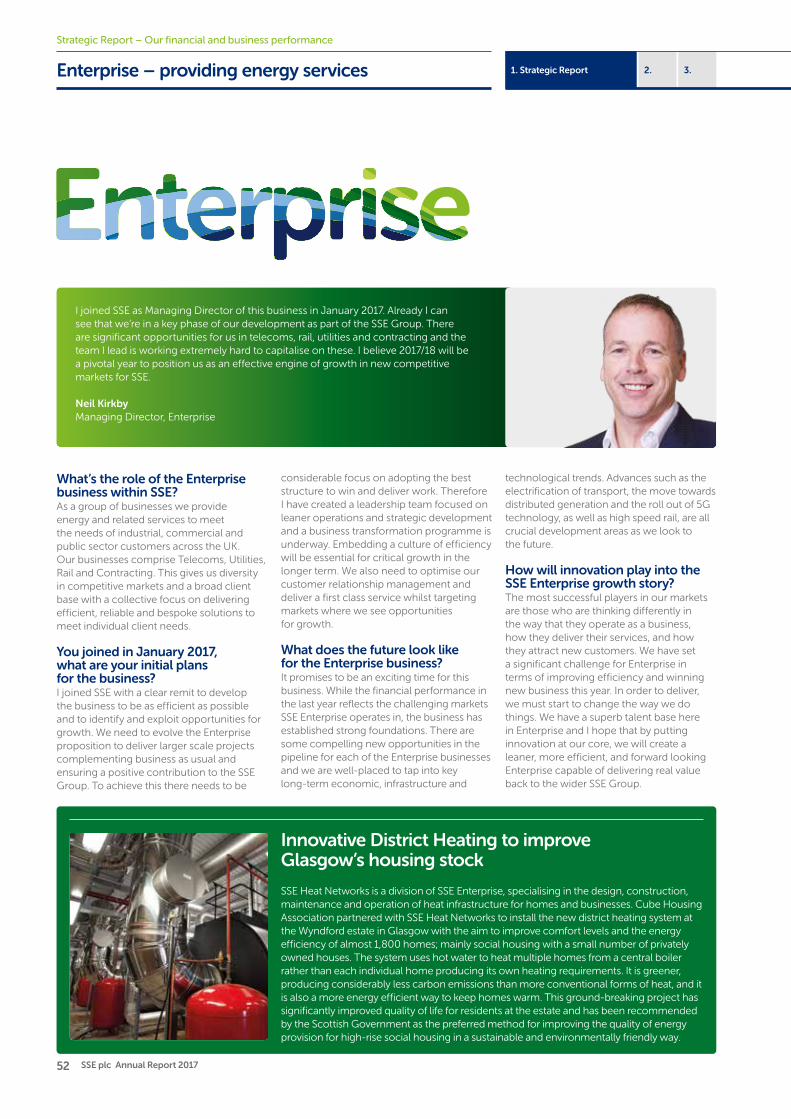
52 SSE plc Annual Report 2017
3.1. Strategic Report 2.Enterprise – providing energy services
I joined SSE as Managing Director of this business in January 2017. Already I can see that we’re in a key phase of our development as part of the SSE Group. There are significant opportunities for us in telecoms, rail, utilities and contracting and the team I lead is working extremely hard to capitalise on these. I believe 2017/18 will be a pivotal year to position us as an effective engine of growth in new competitive markets for SSE.
Neil KirkbyManaging Director, Enterprise
What’s the role of the Enterprise business within SSE? As a group of businesses we provide energy and related services to meet the needs of industrial, commercial and public sector customers across the UK. Our businesses comprise Telecoms, Utilities, Rail and Contracting. This gives us diversity in competitive markets and a broad client base with a collective focus on delivering efficient, reliable and bespoke solutions to meet individual client needs.
You joined in January 2017, what are your initial plans for the business?I joined SSE with a clear remit to develop the business to be as efficient as possible and to identify and exploit opportunities for growth. We need to evolve the Enterprise proposition to deliver larger scale projects complementing business as usual and ensuring a positive contribution to the SSE Group. To achieve this there needs to be
considerable focus on adopting the best structure to win and deliver work. Therefore I have created a leadership team focused on leaner operations and strategic development and a business transformation programme is underway. Embedding a culture of efficiency will be essential for critical growth in the longer term. We also need to optimise our customer relationship management and deliver a first class service whilst targeting markets where we see opportunities for growth.
What does the future look like for the Enterprise business? It promises to be an exciting time for this business. While the financial performance in the last year reflects the challenging markets SSE Enterprise operates in, the business has established strong foundations. There are some compelling new opportunities in the pipeline for each of the Enterprise businesses and we are well-placed to tap into key long-term economic, infrastructure and
technological trends. Advances such as the electrification of transport, the move towards distributed generation and the roll out of 5G technology, as well as high speed rail, are all crucial development areas as we look to the future.
How will innovation play into the SSE Enterprise growth story?The most successful players in our markets are those who are thinking differently in the way that they operate as a business, how they deliver their services, and how they attract new customers. We have set a significant challenge for Enterprise in terms of improving efficiency and winning new business this year. In order to deliver, we must start to change the way we do things. We have a superb talent base here in Enterprise and I hope that by putting innovation at our core, we will create a leaner, more efficient, and forward looking Enterprise capable of delivering real value back to the wider SSE Group.
Strategic Report – Our financial and business performance
Innovative District Heating to improve Glasgow’s housing stock
SSE Heat Networks is a division of SSE Enterprise, specialising in the design, construction, maintenance and operation of heat infrastructure for homes and businesses. Cube Housing Association partnered with SSE Heat Networks to install the new district heating system at the Wyndford estate in Glasgow with the aim to improve comfort levels and the energy efficiency of almost 1,800 homes; mainly social housing with a small number of privately owned houses. The system uses hot water to heat multiple homes from a central boiler rather than each individual home producing its own heating requirements. It is greener, producing considerably less carbon emissions than more conventional forms of heat, and it is also a more energy efficient way to keep homes warm. This ground-breaking project has significantly improved quality of life for residents at the estate and has been recommended by the Scottish Government as the preferred method for improving the quality of energy provision for high-rise social housing in a sustainable and environmentally friendly way.
53
3.2. Directors’ Report1.
Chairman’s introduction 54
Board of Directors 56
Leadership 58
Effectiveness 64Nomination Committee Report 67
Accountability 70Audit Committee Report 70
Stakeholder engagement and responsible stewardship 76
Safety, Health and Environment Advisory Committee Report 78
Remuneration 80
Other statutory information 98
Statement of Directors’ responsibilities 100
Directors’ Report

54 SSE plc Annual Report 201754 SSE plc Annual Report 2017
Directors’ Report – Corporate governance
Chairman’s introduction
The Board is committed to ensuring good corporate governance and effective Board practice in support of SSE’s sustainable success over the long term
The UK Corporate Governance CodeThrough the Listing Rules, the UK Corporate Governance Code (the ‘Code’) underpins the overarching corporate governance framework for premium listed companies within the UK.
It contains principles and provisions which set out standards of good practice in relation to Board leadership, effectiveness, accountability, relations with stakeholders and remuneration and this Directors’ Report is structured accordingly.
The Code is published by the FRC and is available to view on their website.
Each year, through this Directors' Report, we describe how we have applied the Main Principles of the Code and in line with its ‘comply or explain’ model detail any departures from its specific provisions. A departure is only ever made when it is deemed appropriate to do so, and good governance can be achieved by other means.
For 2016/17 we are again reporting against the 2014 version of the Code and confirm compliance with its provisions with the exception of C.3.7 – that the external audit contract be put out to tender at least every ten years. This remains unchanged from last year and a full explanation of our reasons for non-compliance, including details of the timeline to address the position are set out in the Audit Committee Report on page 74.
55
3.2. Directors’ Report1.
Dear Shareholder,As outlined in my earlier letter on pages 6 and 7 and as evidenced throughout the Strategic Report, the Board have considered a wide range of matters throughout 2016/17. These have covered current investments in capital projects, to support the maintenance of a balanced portfolio of assets, through to reviewing the risks associated with operating such a diverse range of businesses. We have also considered our people and stakeholders, which has been both explicit – through a review of cultural matters, talent and succession plans; and implicit – when assessing the impact of all our decisions on our customers, society at large and in delivering value for our shareholders. All of these deliberations have been against a backdrop of change, as we acknowledge the existence of some political uncertainty, the move towards a low-carbon future and the impact of changing energy markets on our businesses and customers. In line with our stewardship position, we continually monitor and reflect upon all of these external developments when discharging our role as a Board.
Corporate governance The Directors’ Report which follows explains the different elements of our Corporate Governance Framework, which has been designed to ensure that as a Board we fulfil our responsibilities effectively and create value for the longer term. This is achieved by ensuring that we have appropriate oversight of all matters affecting the Group and that all risks and opportunities are identified and considered by the correct individuals, for example by one of our supporting Committees, the Executive Committee or management teams below. The dedicated work of the Board Committees is set out in each of their respective reports which follow.
The relationships between the Board and its sub-Committees, and the Executive team and the business, are central to the Group’s effective operation, and we continually nurture these relationships to ensure that all of our decisions are informed and transparent. I believe this is an area in which we have seen continued development throughout the year, as demonstrated through inviting members of senior management to attend and present at Board meetings, and through specific engagements such as site visits, technical teach-ins and the strategy development process.
RiskOver the last year, focus has again been given to the iterative development of SSE’s Risk Management Framework, and the wider review of the Group’s system of internal
dedicated advisory panels and customer forums and also meetings with shareholders and the relevant regulatory bodies.
Corporate cultureCorporate culture within SSE is an area which has received our specific focus this year, although the behavioural aspects and impacts of agenda items have long been an integral part of the Board’s discussion. Our work in this area has included the launch of a new guide to ethical business conduct for SSE employees, as well as updating the Matters Reserved for the Board and the terms of reference of the Board’s Committees, to explicitly consider the impact of decisions on culture and to reinforce our ultimate responsibility to set the tone for the Group. We have agreed that our initial work in this area has formed a platform for further initiatives in 2017/18, with culture being an area which we will continue to monitor and assess, in recognition of its fundamental role in the successful and responsible delivery of our strategic priorities, our values and our financial objectives.
I hope you find the report that follows an interesting explanation of our work throughout the year and supportive of our continued commitment to deliver transparent and sustainable value to our shareholders.
Richard Gillingwater CBEChairman16 May 2017
control. Further information on our work and responsibilities in these areas can be found on pages 24 to 27 in the Strategic Report and within our section on accountability on pages 70 to 75, which includes a description of the work of the Audit Committee.
Talent and successionAs outlined in the Nomination Committee Report there have been no changes to the Board this year, as we have continued to benefit from our experienced and diverse membership. Increased focus has however been provided to reviewing the internal talent pipeline, including the work which is being carried out to support inclusion and diversity throughout the Group. During the year I had the opportunity to attend a number of employee events, including one which was held at our new visitor centre in Pitlochry, and these allowed me to meet and understand the issues which are important to our workforce. We have a highly skilled and committed group of people who underpin the operations and future success of the Group and as a Board we have a responsibility to ensure the appropriate opportunities, development and support are available to them.
Stakeholder engagementEnergy is an essential requirement of everyday life and SSE’s role in its generation, transmission, distribution, and supply means that as a Company, we must interact with, and acknowledge the potential impact of our operations upon a wide range of stakeholders. In our duty as a responsible Company each matter considered by the Board therefore has to be in the context of relevant economic, social and environmental factors, and in order for the Board to understand what these are, constructive engagement is required. The ways in which this is achieved is explained on pages 76 and 77 and includes the use of
Board members and meetings
Member PositionMember
sinceAttended/scheduled
Richard Gillingwater Chairman 2007 7/7
Gregor Alexander Finance Director 2002 7/7
Jeremy Beeton Independent non-Executive Director 2011 7/7
Katie Bickerstaffe Independent non-Executive Director 2011 7/7
Sue Bruce Independent non-Executive Director 2013 7/7
Crawford Gillies Senior Independent Director (SID) 2015 7/7
Peter Lynas Independent non-Executive Director 2014 7/7
Helen Mahy Independent non-Executive Director 2016 7/7
Alistair Phillips-Davies Chief Executive 2002 7/7

56 SSE plc Annual Report 201756 SSE plc Annual Report 2017
Katie Bickerstaffe
Alistair Phillips-DaviesCrawford Gillies Jeremy Beeton
Dame Sue Bruce
Directors’ Report – Corporate governance
Board of Directors
Richard Gillingwater CBEChairman
Alistair Phillips-DaviesChief Executive
Gregor AlexanderFinance Director
Crawford GilliesSenior Independent Director
Career, skills and competencies
Richard has varied experience with a wide range of organisations giving him an excellent understanding of the policy and regulatory framework within which SSE operates, as well as broad financial skills and City experience. For over 20 years he worked in corporate finance and investment banking, latterly as Chairman of European Investment Banking at CSFB. He served as Chief Executive of the Shareholder Executive and was Dean of Cass Business School, London. He has extensive board experience and was previously Senior Independent Director of Hiscox Ltd and a non-Executive Director of Wm Morrison Supermarkets plc.
Alistair is a Chartered Accountant and this together with his operational experience and leadership skills means he brings significant knowledge and commerciality to the Board. Alistair has 20 years’ service with the Group, where he has held leadership roles in the Wholesale, Retail and Enterprise areas, as well as Corporate Finance. In addition, he has led many of the Group’s most significant transactions since the merger in 1998 when SSE plc was formed. Prior to 1997 he worked for HSBC and National Westminster Bank in corporate finance and business development roles in London and New York.
Gregor is a Chartered Accountant and has over 25 years’ service with the Group, joining Scottish Hydro-Electric plc in 1990. He therefore has the benefit of experiencing much change in the energy sector and his detailed understanding of the different aspects of the SSE Group and its operating environment is invaluable. He was SSE’s Group Treasurer and Tax Manager before being appointed as Finance Director in 2002. The responsibilities of this role were first expanded in 2010. He has been instrumental in many of SSE’s major investments including SSE’s investment in SGN. Prior to 1990, Gregor worked for Arthur Andersen.
Crawford’s varied career means he brings extensive commercial and governance knowledge to the Board including particular expertise in matters of finance and risk management. Crawford has over three decades of business experience in a variety of organisations and extensive public company board experience, making him an excellent appointment as Senior Independent Director. Crawford’s business experience includes working with major companies in the UK, Europe and North America across multiple sectors. He has also held public sector posts in the UK, including Chairman of Scottish Enterprise for 7 years until 2015.
Date of appointment Non-Executive Director since May 2007.
Chairman since July 2015.
Executive Director since January 2002 and Chief Executive from July 2013.
Finance Director since October 2002.
Non-Executive Director since August 2015.
Committee membership N/A N/A
Key current appointments Chairman of Henderson Group plc.
Senior Independent Director of Helical Bar plc.
Pro-Chancellor of Open University.
Member of the Accenture Global Energy Board.
Vice President of Eurelectric.
Non-Executive Director of Stagecoach Group plc.
Chairman of Scotia Gas Networks Ltd.
Non-Executive Director of Barclays plc.
Non-Executive Director of The Edrington Group Limited.
Nomination Committee
Audit Committee
Safety, Health and Environment Advisory Committee
Remuneration Committee
Committee Chair

57
3.2. Directors’ Report1.
57
3.2. Directors’ Report1.
Richard GillingwaterGregor Alexander
Peter Lynas
Helen Mahy
Jeremy Beeton CBNon-Executive Director
Katie BickerstaffeNon-Executive Director
Dame Sue Bruce DBENon-Executive Director
Peter LynasNon-Executive Director
Helen Mahy CBENon-Executive Director
Jeremy is a Civil Engineer and brings extensive knowledge of project management and related areas including safety, complex project structures and contractual negotiations. Jeremy’s career comprises over 40 years in managing large, multi-site projects. He has worked with a wide range of organisations including governments, and both private and public companies. Jeremy held various positions at Bechtel Ltd., Haden Maclellan Holdings PLC and Cleveland Bridge Engineering UK Middle East Ltd. He was the Director General of the UK Government Olympic Executive from 2007 to 2012.
Katie has experience in a variety of roles in different customer-facing retailers and fast-changing markets and has an invaluable understanding of customers’ needs. This combined with her experience in HR, marketing and other business areas gives her a wide-range of skills relevant to SSE’s business. From 2008 to 2012, Katie expanded and consolidated her varied business experience while serving as Director of Marketing, People and Property (Dixons). In 2012 she was promoted to the role of Chief Executive, UK and Ireland Dixons Carphone plc and also joined the Group Board.
Sue’s extensive career in the public sector enhances the diversity of the Board; she held a variety of roles in local government in a career which spanned 40 years. Her operational experience of leading organisations, with large numbers of employees, significant assets, construction projects and an important place in the community they serve, make her an excellent source of knowledge on these matters for the Board. She was Chief Executive at both East Dunbartonshire Council and Aberdeen City Council before taking up the role of Chief Executive at the City of Edinburgh Council.
Peter has over 30 years of business experience spanning all areas of finance. He is a Fellow of the Chartered Association of Certified Accountants and brings up to date financial knowledge and experience to the Board as well as general business knowledge and board experience. In 1998 he was appointed Finance Director of Marconi Electronic Systems prior to the completion of the British Aerospace/Marconi merger and also has been Chairman of the trustee Board of a major pension scheme. He has been Group Finance Director of BAE Systems plc since 2011.
Helen’s career, including relevant sector experience, puts her in the ideal position to understand the legal, risk, compliance, commercial and governance issues SSE faces. She has significant public company board experience in a number of sectors in the UK and abroad and brings a detailed knowledge of, and interest in, the areas of inclusion and diversity. She was Company Secretary and General Counsel for both Babcock International Group PLC and more recently National Grid plc. Helen was also a non-executive Director of Stagecoach Group plc.
Non-Executive Director since July 2011.
Non-Executive Director since July 2011.
Non-Executive Director since September 2013.
Non-Executive Director since July 2014.
Non-Executive Director since March 2016.
Chairman of Merseylink Ltd.
Senior Independent Director of WYG plc.
Non-Executive Director of John Laing Group plc.
Non-Executive Director of OPG Power Ventures plc.
Chief Executive, UK and Ireland Dixons Carphone plc.
Chair of the Royal Scottish National Orchestra.
Chair of Young Scot.
Electoral Commissioner, The Electoral Commission.
Group Finance Director of BAE Systems plc.
Member of the BAE Systems Inc Board in the US.
Chairman of The Renewables Infrastructure Group Limited.
Non-Executive Director of Bonheur ASA.
Non-Executive Director of MedicX Fund Limited.
SVG Capital plc (until approximately 2017).
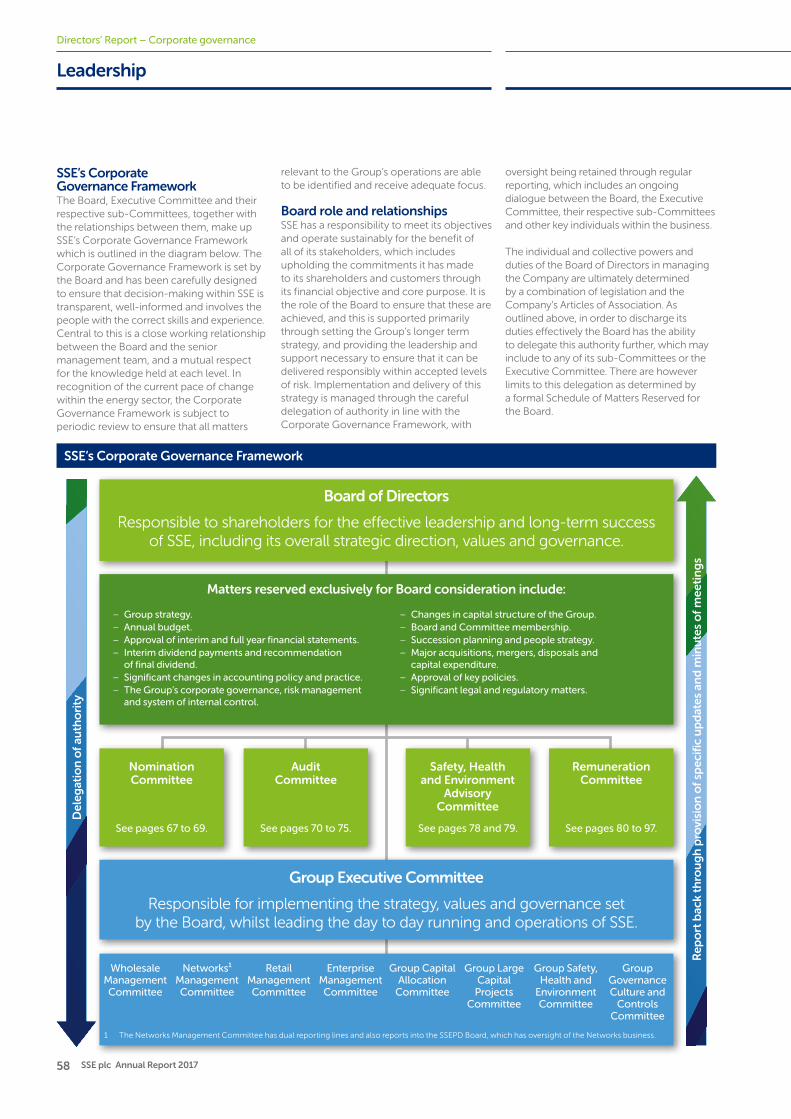
58 SSE plc Annual Report 2017
Directors’ Report – Corporate governance
SSE’s Corporate Governance Framework
Audit Committee
Nomination Committee
Remuneration Committee
See pages 80 to 97.See pages 78 and 79.See pages 70 to 75.See pages 67 to 69.
Safety, Health and Environment
Advisory Committee
Leadership
SSE’s Corporate Governance FrameworkThe Board, Executive Committee and their respective sub-Committees, together with the relationships between them, make up SSE’s Corporate Governance Framework which is outlined in the diagram below. The Corporate Governance Framework is set by the Board and has been carefully designed to ensure that decision-making within SSE is transparent, well-informed and involves the people with the correct skills and experience. Central to this is a close working relationship between the Board and the senior management team, and a mutual respect for the knowledge held at each level. In recognition of the current pace of change within the energy sector, the Corporate Governance Framework is subject to periodic review to ensure that all matters
relevant to the Group’s operations are able to be identified and receive adequate focus.
Board role and relationshipsSSE has a responsibility to meet its objectives and operate sustainably for the benefit of all of its stakeholders, which includes upholding the commitments it has made to its shareholders and customers through its financial objective and core purpose. It is the role of the Board to ensure that these are achieved, and this is supported primarily through setting the Group’s longer term strategy, and providing the leadership and support necessary to ensure that it can be delivered responsibly within accepted levels of risk. Implementation and delivery of this strategy is managed through the careful delegation of authority in line with the Corporate Governance Framework, with
oversight being retained through regular reporting, which includes an ongoing dialogue between the Board, the Executive Committee, their respective sub-Committees and other key individuals within the business.
The individual and collective powers and duties of the Board of Directors in managing the Company are ultimately determined by a combination of legislation and the Company’s Articles of Association. As outlined above, in order to discharge its duties effectively the Board has the ability to delegate this authority further, which may include to any of its sub-Committees or the Executive Committee. There are however limits to this delegation as determined by a formal Schedule of Matters Reserved for the Board.
Board of Directors
Responsible to shareholders for the effective leadership and long-term success of SSE, including its overall strategic direction, values and governance.
– Group strategy. – Annual budget. – Approval of interim and full year financial statements. – Interim dividend payments and recommendation
of final dividend. – Significant changes in accounting policy and practice. – The Group’s corporate governance, risk management
and system of internal control.
– Changes in capital structure of the Group. – Board and Committee membership. – Succession planning and people strategy. – Major acquisitions, mergers, disposals and
capital expenditure. – Approval of key policies. – Significant legal and regulatory matters.
Matters reserved exclusively for Board consideration include:
Group Executive Committee
Responsible for implementing the strategy, values and governance set by the Board, whilst leading the day to day running and operations of SSE.
Rep
ort
bac
k th
rou
gh
pro
visi
on
of s
pec
ific
up
dat
es a
nd
min
ute
s o
f mee
tin
gs
Del
egat
ion
of a
uth
ori
ty
Wholesale Management Committee
Networks¹ Management Committee
Retail Management Committee
Enterprise Management Committee
Group Capital Allocation
Committee
Group Large Capital Projects
Committee
Group Safety, Health and
Environment Committee
Group Governance Culture and
Controls Committee
1 The Networks Management Committee has dual reporting lines and also reports into the SSEPD Board, which has oversight of the Networks business.
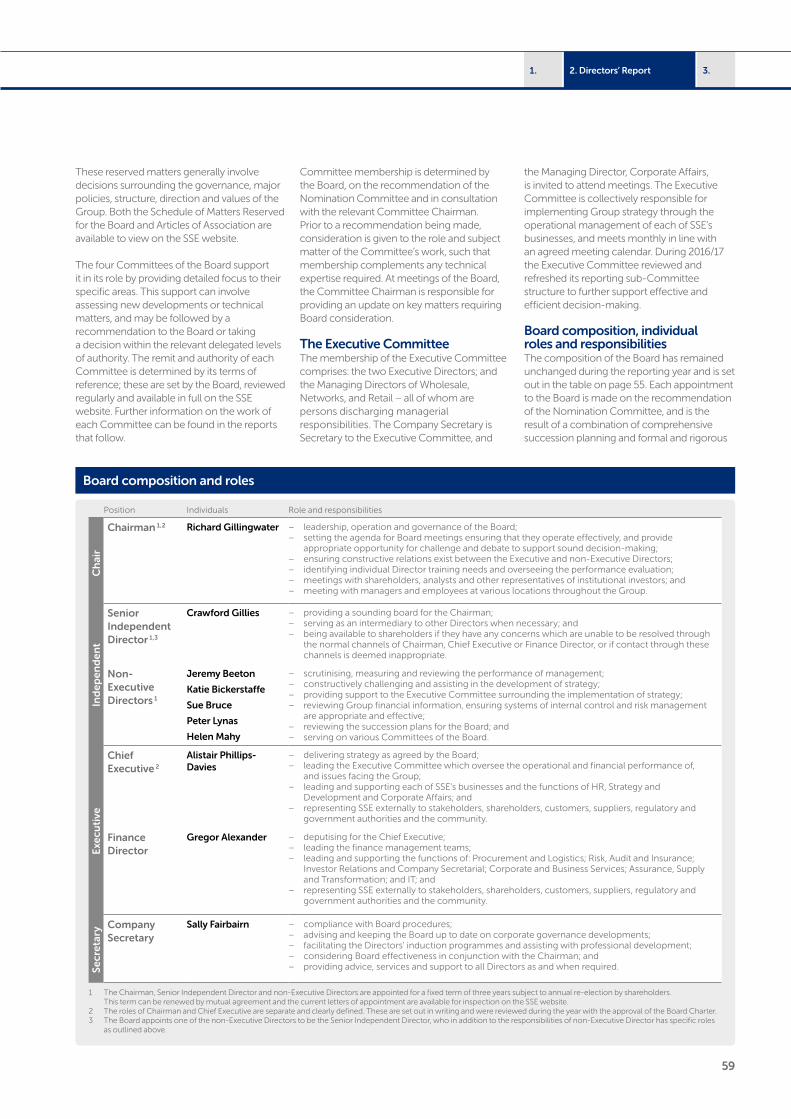
59
3.2. Directors’ Report1.
These reserved matters generally involve decisions surrounding the governance, major policies, structure, direction and values of the Group. Both the Schedule of Matters Reserved for the Board and Articles of Association are available to view on the SSE website.
The four Committees of the Board support it in its role by providing detailed focus to their specific areas. This support can involve assessing new developments or technical matters, and may be followed by a recommendation to the Board or taking a decision within the relevant delegated levels of authority. The remit and authority of each Committee is determined by its terms of reference; these are set by the Board, reviewed regularly and available in full on the SSE website. Further information on the work of each Committee can be found in the reports that follow.
Committee membership is determined by the Board, on the recommendation of the Nomination Committee and in consultation with the relevant Committee Chairman. Prior to a recommendation being made, consideration is given to the role and subject matter of the Committee’s work, such that membership complements any technical expertise required. At meetings of the Board, the Committee Chairman is responsible for providing an update on key matters requiring Board consideration.
The Executive CommitteeThe membership of the Executive Committee comprises: the two Executive Directors; and the Managing Directors of Wholesale, Networks, and Retail – all of whom are persons discharging managerial responsibilities. The Company Secretary is Secretary to the Executive Committee, and
the Managing Director, Corporate Affairs, is invited to attend meetings. The Executive Committee is collectively responsible for implementing Group strategy through the operational management of each of SSE’s businesses, and meets monthly in line with an agreed meeting calendar. During 2016/17 the Executive Committee reviewed and refreshed its reporting sub-Committee structure to further support effective and efficient decision-making.
Board composition, individual roles and responsibilities The composition of the Board has remained unchanged during the reporting year and is set out in the table on page 55. Each appointment to the Board is made on the recommendation of the Nomination Committee, and is the result of a combination of comprehensive succession planning and formal and rigorous
Board composition and roles
Position Individuals Role and responsibilities
Ch
air
Chairman 1,2 Richard Gillingwater – leadership, operation and governance of the Board; – setting the agenda for Board meetings ensuring that they operate effectively, and provide
appropriate opportunity for challenge and debate to support sound decision-making; – ensuring constructive relations exist between the Executive and non-Executive Directors; – identifying individual Director training needs and overseeing the performance evaluation; – meetings with shareholders, analysts and other representatives of institutional investors; and – meeting with managers and employees at various locations throughout the Group.
Ind
epen
den
t
Senior Independent Director 1,3
Crawford Gillies – providing a sounding board for the Chairman; – serving as an intermediary to other Directors when necessary; and – being available to shareholders if they have any concerns which are unable to be resolved through
the normal channels of Chairman, Chief Executive or Finance Director, or if contact through these channels is deemed inappropriate.
Non-Executive Directors 1
Jeremy Beeton
Katie Bickerstaffe
Sue Bruce
Peter Lynas
Helen Mahy
– scrutinising, measuring and reviewing the performance of management; – constructively challenging and assisting in the development of strategy; – providing support to the Executive Committee surrounding the implementation of strategy; – reviewing Group financial information, ensuring systems of internal control and risk management
are appropriate and effective; – reviewing the succession plans for the Board; and – serving on various Committees of the Board.
Exe
cuti
ve
Chief Executive 2
Alistair Phillips-Davies
– delivering strategy as agreed by the Board; – leading the Executive Committee which oversee the operational and financial performance of,
and issues facing the Group; – leading and supporting each of SSE’s businesses and the functions of HR, Strategy and
Development and Corporate Affairs; and – representing SSE externally to stakeholders, shareholders, customers, suppliers, regulatory and
government authorities and the community.
Finance Director
Gregor Alexander – deputising for the Chief Executive; – leading the finance management teams; – leading and supporting the functions of: Procurement and Logistics; Risk, Audit and Insurance;
Investor Relations and Company Secretarial; Corporate and Business Services; Assurance, Supply and Transformation; and IT; and
– representing SSE externally to stakeholders, shareholders, customers, suppliers, regulatory and government authorities and the community.
Secr
etar
y Company Secretary
Sally Fairbairn – compliance with Board procedures; – advising and keeping the Board up to date on corporate governance developments; – facilitating the Directors’ induction programmes and assisting with professional development; – considering Board effectiveness in conjunction with the Chairman; and – providing advice, services and support to all Directors as and when required.
1 The Chairman, Senior Independent Director and non-Executive Directors are appointed for a fixed term of three years subject to annual re-election by shareholders. This term can be renewed by mutual agreement and the current letters of appointment are available for inspection on the SSE website.
2 The roles of Chairman and Chief Executive are separate and clearly defined. These are set out in writing and were reviewed during the year with the approval of the Board Charter.3 The Board appoints one of the non-Executive Directors to be the Senior Independent Director, who in addition to the responsibilities of non-Executive Director has specific roles
as outlined above.
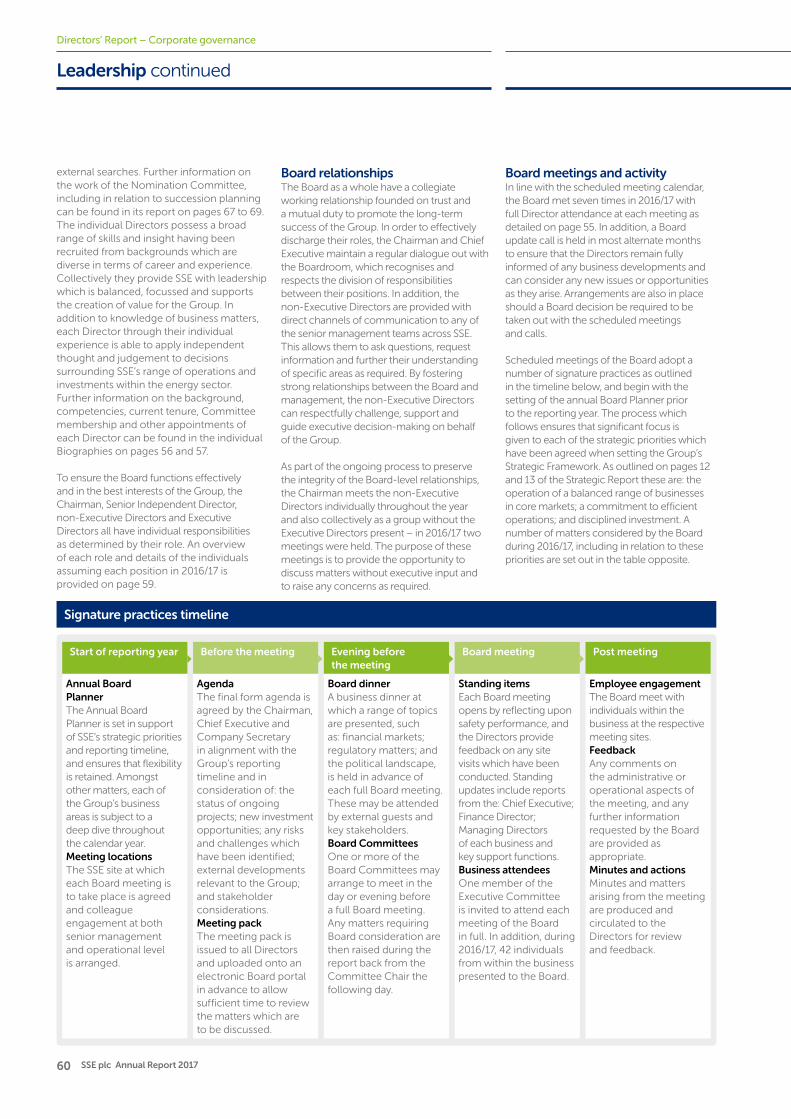
60 SSE plc Annual Report 2017
Directors’ Report – Corporate governance
Signature practices timeline
Start of reporting year Before the meeting Evening before the meeting
Board meeting Post meeting
Annual Board PlannerThe Annual Board Planner is set in support of SSE’s strategic priorities and reporting timeline, and ensures that flexibility is retained. Amongst other matters, each of the Group’s business areas is subject to a deep dive throughout the calendar year.Meeting locationsThe SSE site at which each Board meeting is to take place is agreed and colleague engagement at both senior management and operational level is arranged.
AgendaThe final form agenda is agreed by the Chairman, Chief Executive and Company Secretary in alignment with the Group’s reporting timeline and in consideration of: the status of ongoing projects; new investment opportunities; any risks and challenges which have been identified; external developments relevant to the Group; and stakeholder considerations.Meeting packThe meeting pack is issued to all Directors and uploaded onto an electronic Board portal in advance to allow sufficient time to review the matters which are to be discussed.
Board dinnerA business dinner at which a range of topics are presented, such as: financial markets; regulatory matters; and the political landscape, is held in advance of each full Board meeting. These may be attended by external guests and key stakeholders.Board CommitteesOne or more of the Board Committees may arrange to meet in the day or evening before a full Board meeting. Any matters requiring Board consideration are then raised during the report back from the Committee Chair the following day.
Standing itemsEach Board meeting opens by reflecting upon safety performance, and the Directors provide feedback on any site visits which have been conducted. Standing updates include reports from the: Chief Executive; Finance Director; Managing Directors of each business and key support functions. Business attendeesOne member of the Executive Committee is invited to attend each meeting of the Board in full. In addition, during 2016/17, 42 individuals from within the business presented to the Board.
Employee engagementThe Board meet with individuals within the business at the respective meeting sites. FeedbackAny comments on the administrative or operational aspects of the meeting, and any further information requested by the Board are provided as appropriate.Minutes and actionsMinutes and matters arising from the meeting are produced and circulated to the Directors for review and feedback.
external searches. Further information on the work of the Nomination Committee, including in relation to succession planning can be found in its report on pages 67 to 69. The individual Directors possess a broad range of skills and insight having been recruited from backgrounds which are diverse in terms of career and experience. Collectively they provide SSE with leadership which is balanced, focussed and supports the creation of value for the Group. In addition to knowledge of business matters, each Director through their individual experience is able to apply independent thought and judgement to decisions surrounding SSE’s range of operations and investments within the energy sector. Further information on the background, competencies, current tenure, Committee membership and other appointments of each Director can be found in the individual Biographies on pages 56 and 57.
To ensure the Board functions effectively and in the best interests of the Group, the Chairman, Senior Independent Director, non-Executive Directors and Executive Directors all have individual responsibilities as determined by their role. An overview of each role and details of the individuals assuming each position in 2016/17 is provided on page 59.
Board relationshipsThe Board as a whole have a collegiate working relationship founded on trust and a mutual duty to promote the long-term success of the Group. In order to effectively discharge their roles, the Chairman and Chief Executive maintain a regular dialogue out with the Boardroom, which recognises and respects the division of responsibilities between their positions. In addition, the non-Executive Directors are provided with direct channels of communication to any of the senior management teams across SSE. This allows them to ask questions, request information and further their understanding of specific areas as required. By fostering strong relationships between the Board and management, the non-Executive Directors can respectfully challenge, support and guide executive decision-making on behalf of the Group.
As part of the ongoing process to preserve the integrity of the Board-level relationships, the Chairman meets the non-Executive Directors individually throughout the year and also collectively as a group without the Executive Directors present – in 2016/17 two meetings were held. The purpose of these meetings is to provide the opportunity to discuss matters without executive input and to raise any concerns as required.
Leadership continued
Board meetings and activityIn line with the scheduled meeting calendar, the Board met seven times in 2016/17 with full Director attendance at each meeting as detailed on page 55. In addition, a Board update call is held in most alternate months to ensure that the Directors remain fully informed of any business developments and can consider any new issues or opportunities as they arise. Arrangements are also in place should a Board decision be required to be taken out with the scheduled meetings and calls.
Scheduled meetings of the Board adopt a number of signature practices as outlined in the timeline below, and begin with the setting of the annual Board Planner prior to the reporting year. The process which follows ensures that significant focus is given to each of the strategic priorities which have been agreed when setting the Group’s Strategic Framework. As outlined on pages 12 and 13 of the Strategic Report these are: the operation of a balanced range of businesses in core markets; a commitment to efficient operations; and disciplined investment. A number of matters considered by the Board during 2016/17, including in relation to these priorities are set out in the table opposite.
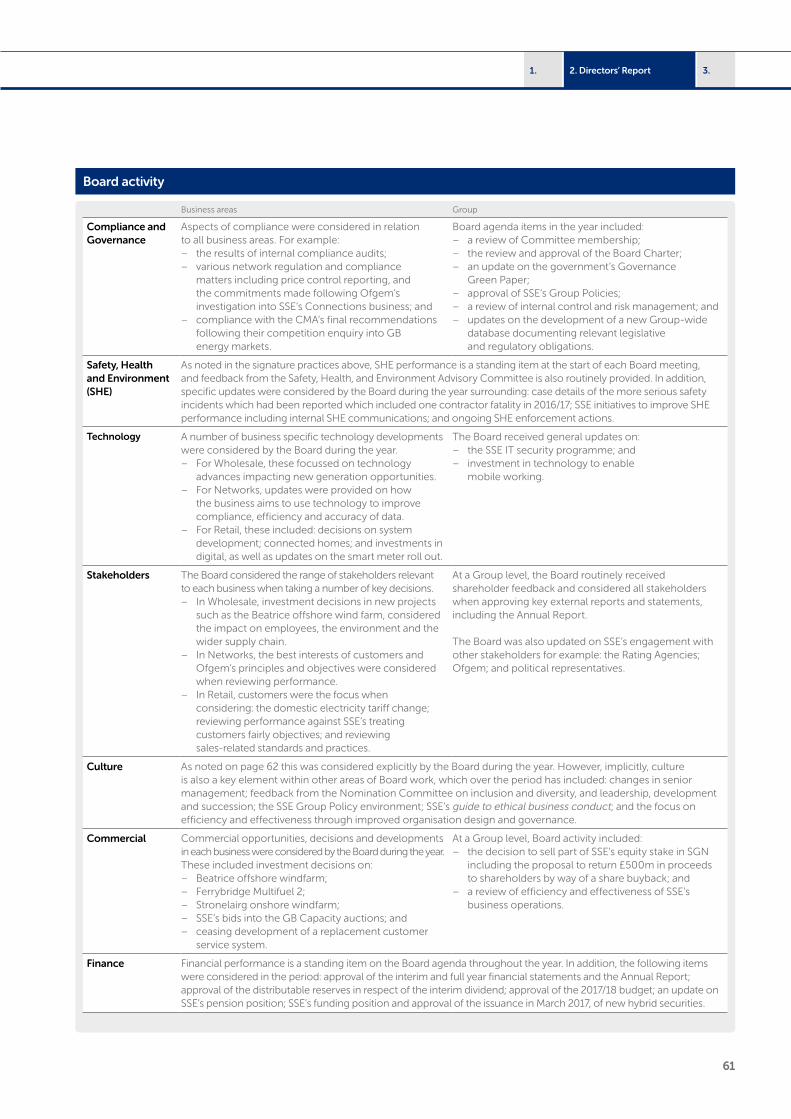
61
3.2. Directors’ Report1.
Business areas Group
Compliance and Governance
Aspects of compliance were considered in relation to all business areas. For example:
– the results of internal compliance audits; – various network regulation and compliance
matters including price control reporting, and the commitments made following Ofgem’s investigation into SSE’s Connections business; and
– compliance with the CMA’s final recommendations following their competition enquiry into GB energy markets.
Board agenda items in the year included: – a review of Committee membership; – the review and approval of the Board Charter; – an update on the government’s Governance
Green Paper; – approval of SSE’s Group Policies; – a review of internal control and risk management; and – updates on the development of a new Group-wide
database documenting relevant legislative and regulatory obligations.
Safety, Health and Environment (SHE)
As noted in the signature practices above, SHE performance is a standing item at the start of each Board meeting, and feedback from the Safety, Health, and Environment Advisory Committee is also routinely provided. In addition, specific updates were considered by the Board during the year surrounding: case details of the more serious safety incidents which had been reported which included one contractor fatality in 2016/17; SSE initiatives to improve SHE performance including internal SHE communications; and ongoing SHE enforcement actions.
Technology A number of business specific technology developments were considered by the Board during the year.
– For Wholesale, these focussed on technology advances impacting new generation opportunities.
– For Networks, updates were provided on how the business aims to use technology to improve compliance, efficiency and accuracy of data.
– For Retail, these included: decisions on system development; connected homes; and investments in digital, as well as updates on the smart meter roll out.
The Board received general updates on: – the SSE IT security programme; and – investment in technology to enable
mobile working.
Stakeholders The Board considered the range of stakeholders relevant to each business when taking a number of key decisions.
– In Wholesale, investment decisions in new projects such as the Beatrice offshore wind farm, considered the impact on employees, the environment and the wider supply chain.
– In Networks, the best interests of customers and Ofgem’s principles and objectives were considered when reviewing performance.
– In Retail, customers were the focus when considering: the domestic electricity tariff change; reviewing performance against SSE’s treating customers fairly objectives; and reviewing sales-related standards and practices.
At a Group level, the Board routinely received shareholder feedback and considered all stakeholders when approving key external reports and statements, including the Annual Report.
The Board was also updated on SSE’s engagement with other stakeholders for example: the Rating Agencies; Ofgem; and political representatives.
Culture As noted on page 62 this was considered explicitly by the Board during the year. However, implicitly, culture is also a key element within other areas of Board work, which over the period has included: changes in senior management; feedback from the Nomination Committee on inclusion and diversity, and leadership, development and succession; the SSE Group Policy environment; SSE’s guide to ethical business conduct; and the focus on efficiency and effectiveness through improved organisation design and governance.
Commercial Commercial opportunities, decisions and developments in each business were considered by the Board during the year. These included investment decisions on:
– Beatrice offshore windfarm; – Ferrybridge Multifuel 2; – Stronelairg onshore windfarm; – SSE’s bids into the GB Capacity auctions; and – ceasing development of a replacement customer
service system.
At a Group level, Board activity included: – the decision to sell part of SSE’s equity stake in SGN
including the proposal to return £500m in proceeds to shareholders by way of a share buyback; and
– a review of efficiency and effectiveness of SSE’s business operations.
Finance Financial performance is a standing item on the Board agenda throughout the year. In addition, the following items were considered in the period: approval of the interim and full year financial statements and the Annual Report; approval of the distributable reserves in respect of the interim dividend; approval of the 2017/18 budget; an update on SSE’s pension position; SSE’s funding position and approval of the issuance in March 2017, of new hybrid securities.
Board activity
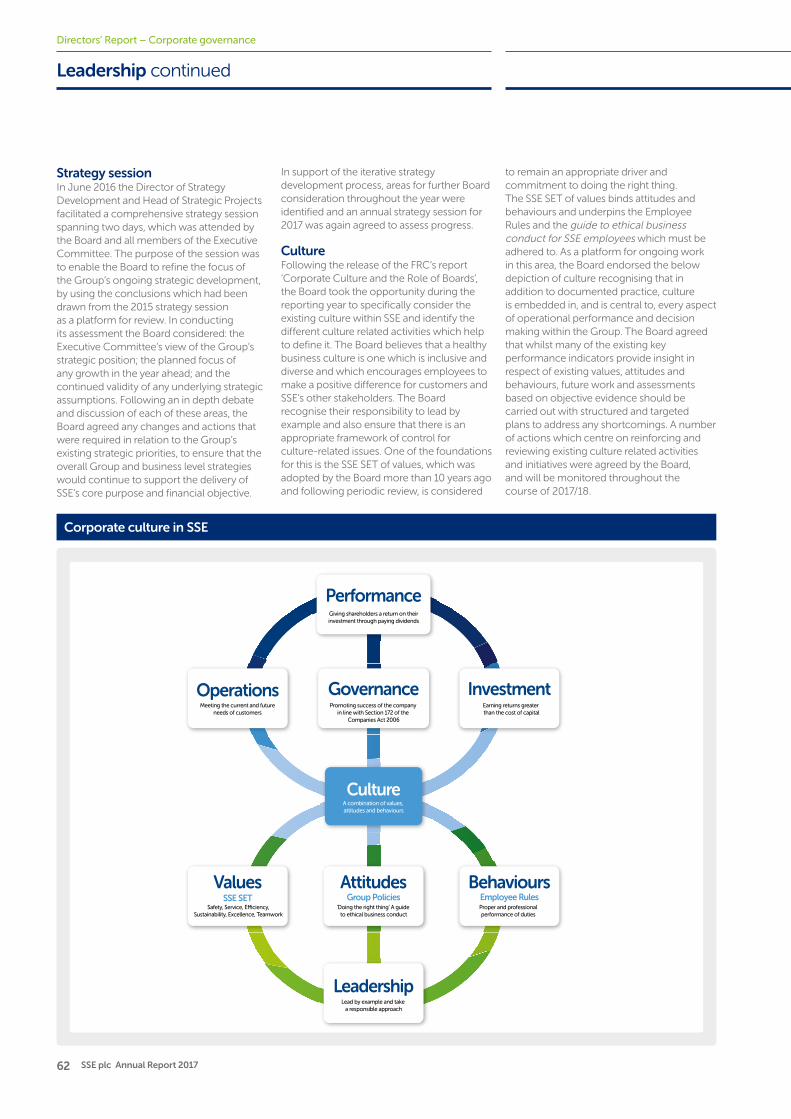
62 SSE plc Annual Report 2017
Giving shareholders a return on theirinvestment through paying dividends
Promoting success of the company in line with Section 172 of the
Companies Act 2006
Earning returns greater than the cost of capital
Meeting the current and futureneeds of customers
Safety, Service, E�ciency,Sustainability, Excellence, Teamwork
‘Doing the right thing’ A guide to ethical business conduct
A combination of values, attitudes and behaviours
Proper and professionalperformance of duties
Lead by example and take a responsible approach
Directors’ Report – Corporate governance
Leadership continued
Strategy sessionIn June 2016 the Director of Strategy Development and Head of Strategic Projects facilitated a comprehensive strategy session spanning two days, which was attended by the Board and all members of the Executive Committee. The purpose of the session was to enable the Board to refine the focus of the Group’s ongoing strategic development, by using the conclusions which had been drawn from the 2015 strategy session as a platform for review. In conducting its assessment the Board considered: the Executive Committee’s view of the Group’s strategic position; the planned focus of any growth in the year ahead; and the continued validity of any underlying strategic assumptions. Following an in depth debate and discussion of each of these areas, the Board agreed any changes and actions that were required in relation to the Group’s existing strategic priorities, to ensure that the overall Group and business level strategies would continue to support the delivery of SSE’s core purpose and financial objective.
In support of the iterative strategy development process, areas for further Board consideration throughout the year were identified and an annual strategy session for 2017 was again agreed to assess progress.
Culture Following the release of the FRC’s report ‘Corporate Culture and the Role of Boards’, the Board took the opportunity during the reporting year to specifically consider the existing culture within SSE and identify the different culture related activities which help to define it. The Board believes that a healthy business culture is one which is inclusive and diverse and which encourages employees to make a positive difference for customers and SSE’s other stakeholders. The Board recognise their responsibility to lead by example and also ensure that there is an appropriate framework of control for culture-related issues. One of the foundations for this is the SSE SET of values, which was adopted by the Board more than 10 years ago and following periodic review, is considered
to remain an appropriate driver and commitment to doing the right thing. The SSE SET of values binds attitudes and behaviours and underpins the Employee Rules and the guide to ethical business conduct for SSE employees which must be adhered to. As a platform for ongoing work in this area, the Board endorsed the below depiction of culture recognising that in addition to documented practice, culture is embedded in, and is central to, every aspect of operational performance and decision making within the Group. The Board agreed that whilst many of the existing key performance indicators provide insight in respect of existing values, attitudes and behaviours, future work and assessments based on objective evidence should be carried out with structured and targeted plans to address any shortcomings. A number of actions which centre on reinforcing and reviewing existing culture related activities and initiatives were agreed by the Board, and will be monitored throughout the course of 2017/18.
Corporate culture in SSE
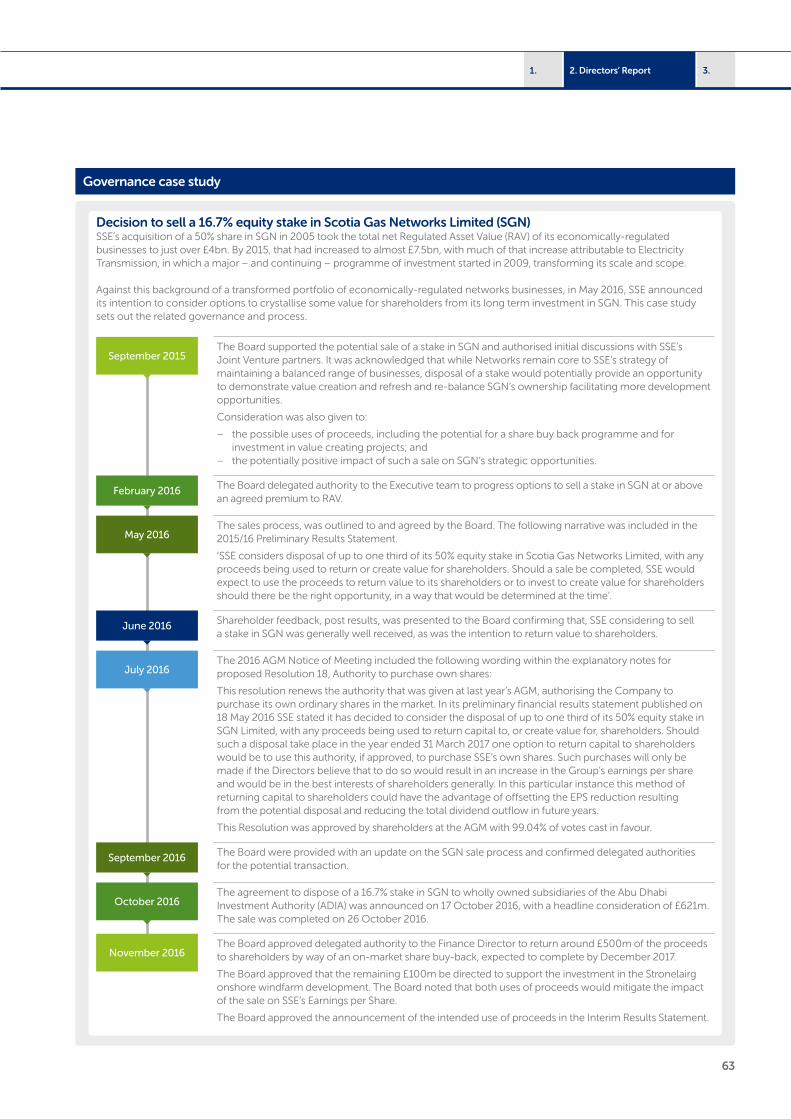
63
3.2. Directors’ Report1.
Decision to sell a 16.7% equity stake in Scotia Gas Networks Limited (SGN)SSE’s acquisition of a 50% share in SGN in 2005 took the total net Regulated Asset Value (RAV) of its economically-regulated businesses to just over £4bn. By 2015, that had increased to almost £7.5bn, with much of that increase attributable to Electricity Transmission, in which a major – and continuing – programme of investment started in 2009, transforming its scale and scope.
Against this background of a transformed portfolio of economically-regulated networks businesses, in May 2016, SSE announced its intention to consider options to crystallise some value for shareholders from its long term investment in SGN. This case study sets out the related governance and process.
September 2015The Board supported the potential sale of a stake in SGN and authorised initial discussions with SSE’s Joint Venture partners. It was acknowledged that while Networks remain core to SSE’s strategy of maintaining a balanced range of businesses, disposal of a stake would potentially provide an opportunity to demonstrate value creation and refresh and re-balance SGN’s ownership facilitating more development opportunities.
Consideration was also given to:
– the possible uses of proceeds, including the potential for a share buy back programme and for investment in value creating projects; and
– the potentially positive impact of such a sale on SGN’s strategic opportunities.
February 2016 The Board delegated authority to the Executive team to progress options to sell a stake in SGN at or above an agreed premium to RAV.
May 2016The sales process, was outlined to and agreed by the Board. The following narrative was included in the 2015/16 Preliminary Results Statement.
‘SSE considers disposal of up to one third of its 50% equity stake in Scotia Gas Networks Limited, with any proceeds being used to return or create value for shareholders. Should a sale be completed, SSE would expect to use the proceeds to return value to its shareholders or to invest to create value for shareholders should there be the right opportunity, in a way that would be determined at the time’.
June 2016 Shareholder feedback, post results, was presented to the Board confirming that, SSE considering to sell a stake in SGN was generally well received, as was the intention to return value to shareholders.
July 2016The 2016 AGM Notice of Meeting included the following wording within the explanatory notes for proposed Resolution 18, Authority to purchase own shares:
This resolution renews the authority that was given at last year’s AGM, authorising the Company to purchase its own ordinary shares in the market. In its preliminary financial results statement published on 18 May 2016 SSE stated it has decided to consider the disposal of up to one third of its 50% equity stake in SGN Limited, with any proceeds being used to return capital to, or create value for, shareholders. Should such a disposal take place in the year ended 31 March 2017 one option to return capital to shareholders would be to use this authority, if approved, to purchase SSE’s own shares. Such purchases will only be made if the Directors believe that to do so would result in an increase in the Group’s earnings per share and would be in the best interests of shareholders generally. In this particular instance this method of returning capital to shareholders could have the advantage of offsetting the EPS reduction resulting from the potential disposal and reducing the total dividend outflow in future years.
This Resolution was approved by shareholders at the AGM with 99.04% of votes cast in favour.
September 2016 The Board were provided with an update on the SGN sale process and confirmed delegated authorities for the potential transaction.
October 2016The agreement to dispose of a 16.7% stake in SGN to wholly owned subsidiaries of the Abu Dhabi Investment Authority (ADIA) was announced on 17 October 2016, with a headline consideration of £621m. The sale was completed on 26 October 2016.
November 2016The Board approved delegated authority to the Finance Director to return around £500m of the proceeds to shareholders by way of an on-market share buy-back, expected to complete by December 2017.
The Board approved that the remaining £100m be directed to support the investment in the Stronelairg onshore windfarm development. The Board noted that both uses of proceeds would mitigate the impact of the sale on SSE’s Earnings per Share.
The Board approved the announcement of the intended use of proceeds in the Interim Results Statement.
Governance case study
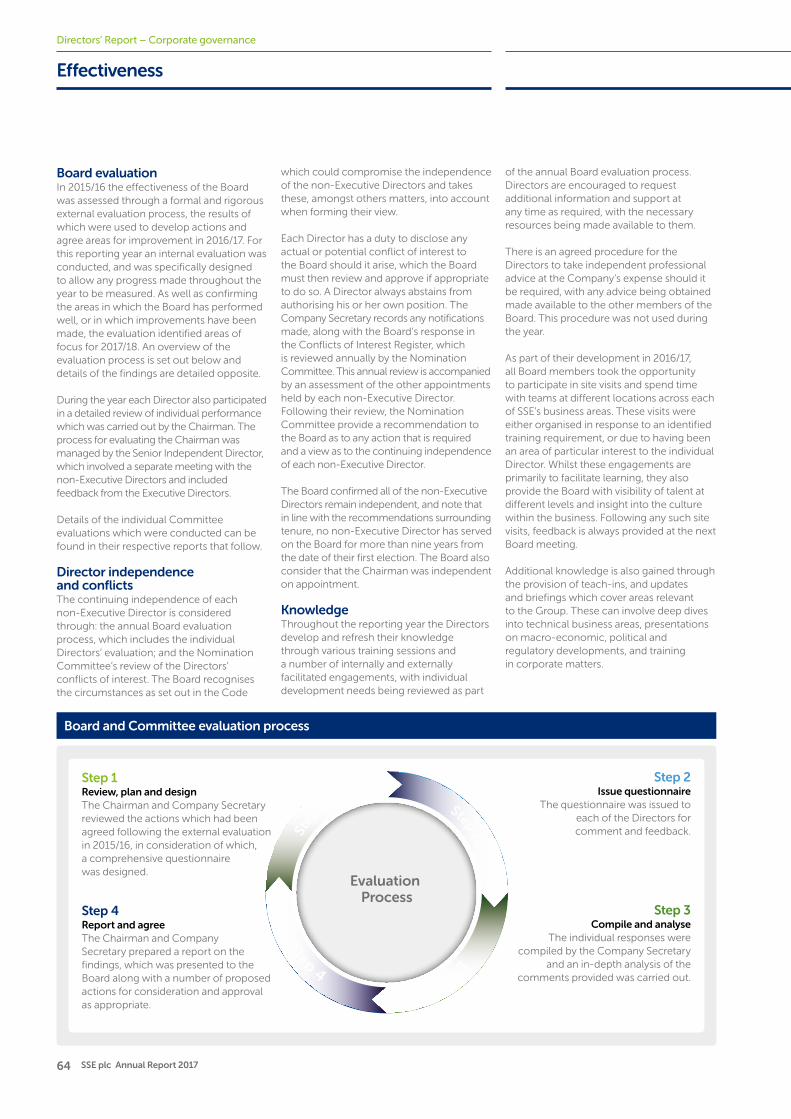
64 SSE plc Annual Report 2017
Briefing and
Scope
Interviewand
Review
Discussionand
Objectives
ResultCollation
External Evaluation Process
Evaluation Process
St
ep 1
Step 2
Step 4
Step 3
Individual interviews were held by Boardroom Dialogue Ltd with each of the Directors, the
Company Secretary, Deputy Company Secretary and members of the
Executive Committee. A review of Board documentation including
meeting packs and agendas from the past 12 months was
also conducted.
The findings of the evaluation process were compiled and reported to the Board via an
in-depth report.
A meeting was held with Boardroom Dialogue Ltd, the Chairman and Company Secretary, at which the scope and format of the evaluation process was decided.
Boardroom Dialogue Ltd attended the Board meeting in January and presented the findings of the evaluation process. The recommendations made were considered by the Board and actions identified for the coming year.
Step 1 Step 2 Step 3 Step 4
Directors’ Report – Corporate governance
Effectiveness
Board evaluationIn 2015/16 the effectiveness of the Board was assessed through a formal and rigorous external evaluation process, the results of which were used to develop actions and agree areas for improvement in 2016/17. For this reporting year an internal evaluation was conducted, and was specifically designed to allow any progress made throughout the year to be measured. As well as confirming the areas in which the Board has performed well, or in which improvements have been made, the evaluation identified areas of focus for 2017/18. An overview of the evaluation process is set out below and details of the findings are detailed opposite.
During the year each Director also participated in a detailed review of individual performance which was carried out by the Chairman. The process for evaluating the Chairman was managed by the Senior Independent Director, which involved a separate meeting with the non-Executive Directors and included feedback from the Executive Directors.
Details of the individual Committee evaluations which were conducted can be found in their respective reports that follow.
Director independence and conflictsThe continuing independence of each non-Executive Director is considered through: the annual Board evaluation process, which includes the individual Directors’ evaluation; and the Nomination Committee’s review of the Directors’ conflicts of interest. The Board recognises the circumstances as set out in the Code
which could compromise the independence of the non-Executive Directors and takes these, amongst others matters, into account when forming their view.
Each Director has a duty to disclose any actual or potential conflict of interest to the Board should it arise, which the Board must then review and approve if appropriate to do so. A Director always abstains from authorising his or her own position. The Company Secretary records any notifications made, along with the Board’s response in the Conflicts of Interest Register, which is reviewed annually by the Nomination Committee. This annual review is accompanied by an assessment of the other appointments held by each non-Executive Director. Following their review, the Nomination Committee provide a recommendation to the Board as to any action that is required and a view as to the continuing independence of each non-Executive Director.
The Board confirmed all of the non-Executive Directors remain independent, and note that in line with the recommendations surrounding tenure, no non-Executive Director has served on the Board for more than nine years from the date of their first election. The Board also consider that the Chairman was independent on appointment.
Knowledge Throughout the reporting year the Directors develop and refresh their knowledge through various training sessions and a number of internally and externally facilitated engagements, with individual development needs being reviewed as part
Step 1Review, plan and designThe Chairman and Company Secretary reviewed the actions which had been agreed following the external evaluation in 2015/16, in consideration of which, a comprehensive questionnaire was designed.
Step 4Report and agreeThe Chairman and Company Secretary prepared a report on the findings, which was presented to the Board along with a number of proposed actions for consideration and approval as appropriate.
Step 2Issue questionnaire
The questionnaire was issued to each of the Directors for comment and feedback.
Step 3Compile and analyse
The individual responses were compiled by the Company Secretary
and an in-depth analysis of the comments provided was carried out.
of the annual Board evaluation process. Directors are encouraged to request additional information and support at any time as required, with the necessary resources being made available to them.
There is an agreed procedure for the Directors to take independent professional advice at the Company’s expense should it be required, with any advice being obtained made available to the other members of the Board. This procedure was not used during the year.
As part of their development in 2016/17, all Board members took the opportunity to participate in site visits and spend time with teams at different locations across each of SSE’s business areas. These visits were either organised in response to an identified training requirement, or due to having been an area of particular interest to the individual Director. Whilst these engagements are primarily to facilitate learning, they also provide the Board with visibility of talent at different levels and insight into the culture within the business. Following any such site visits, feedback is always provided at the next Board meeting.
Additional knowledge is also gained through the provision of teach-ins, and updates and briefings which cover areas relevant to the Group. These can involve deep dives into technical business areas, presentations on macro-economic, political and regulatory developments, and training in corporate matters.
Board and Committee evaluation process
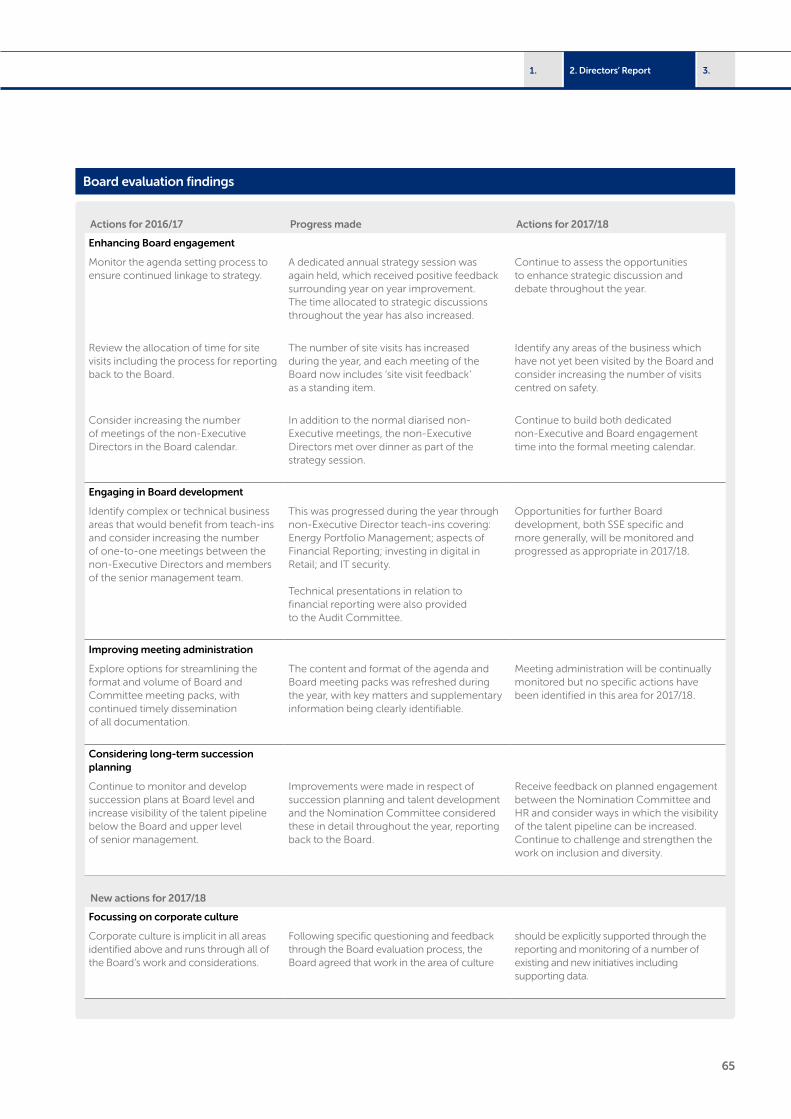
65
3.2. Directors’ Report1.
Actions for 2016/17 Progress made Actions for 2017/18
Enhancing Board engagement
Monitor the agenda setting process to ensure continued linkage to strategy.
A dedicated annual strategy session was again held, which received positive feedback surrounding year on year improvement. The time allocated to strategic discussions throughout the year has also increased.
Continue to assess the opportunities to enhance strategic discussion and debate throughout the year.
Review the allocation of time for site visits including the process for reporting back to the Board.
The number of site visits has increased during the year, and each meeting of the Board now includes ‘site visit feedback’ as a standing item.
Identify any areas of the business which have not yet been visited by the Board and consider increasing the number of visits centred on safety.
Consider increasing the number of meetings of the non-Executive Directors in the Board calendar.
In addition to the normal diarised non-Executive meetings, the non-Executive Directors met over dinner as part of the strategy session.
Continue to build both dedicated non-Executive and Board engagement time into the formal meeting calendar.
Engaging in Board development
Identify complex or technical business areas that would benefit from teach-ins and consider increasing the number of one-to-one meetings between the non-Executive Directors and members of the senior management team.
This was progressed during the year through non-Executive Director teach-ins covering: Energy Portfolio Management; aspects of Financial Reporting; investing in digital in Retail; and IT security.
Technical presentations in relation to financial reporting were also provided to the Audit Committee.
Opportunities for further Board development, both SSE specific and more generally, will be monitored and progressed as appropriate in 2017/18.
Improving meeting administration
Explore options for streamlining the format and volume of Board and Committee meeting packs, with continued timely dissemination of all documentation.
The content and format of the agenda and Board meeting packs was refreshed during the year, with key matters and supplementary information being clearly identifiable.
Meeting administration will be continually monitored but no specific actions have been identified in this area for 2017/18.
Considering long-term succession planning
Continue to monitor and develop succession plans at Board level and increase visibility of the talent pipeline below the Board and upper level of senior management.
Improvements were made in respect of succession planning and talent development and the Nomination Committee considered these in detail throughout the year, reporting back to the Board.
Receive feedback on planned engagement between the Nomination Committee and HR and consider ways in which the visibility of the talent pipeline can be increased. Continue to challenge and strengthen the work on inclusion and diversity.
New actions for 2017/18
Focussing on corporate culture
Corporate culture is implicit in all areas identified above and runs through all of the Board’s work and considerations.
Following specific questioning and feedback through the Board evaluation process, the Board agreed that work in the area of culture
should be explicitly supported through the reporting and monitoring of a number of existing and new initiatives including supporting data.
Board evaluation findings
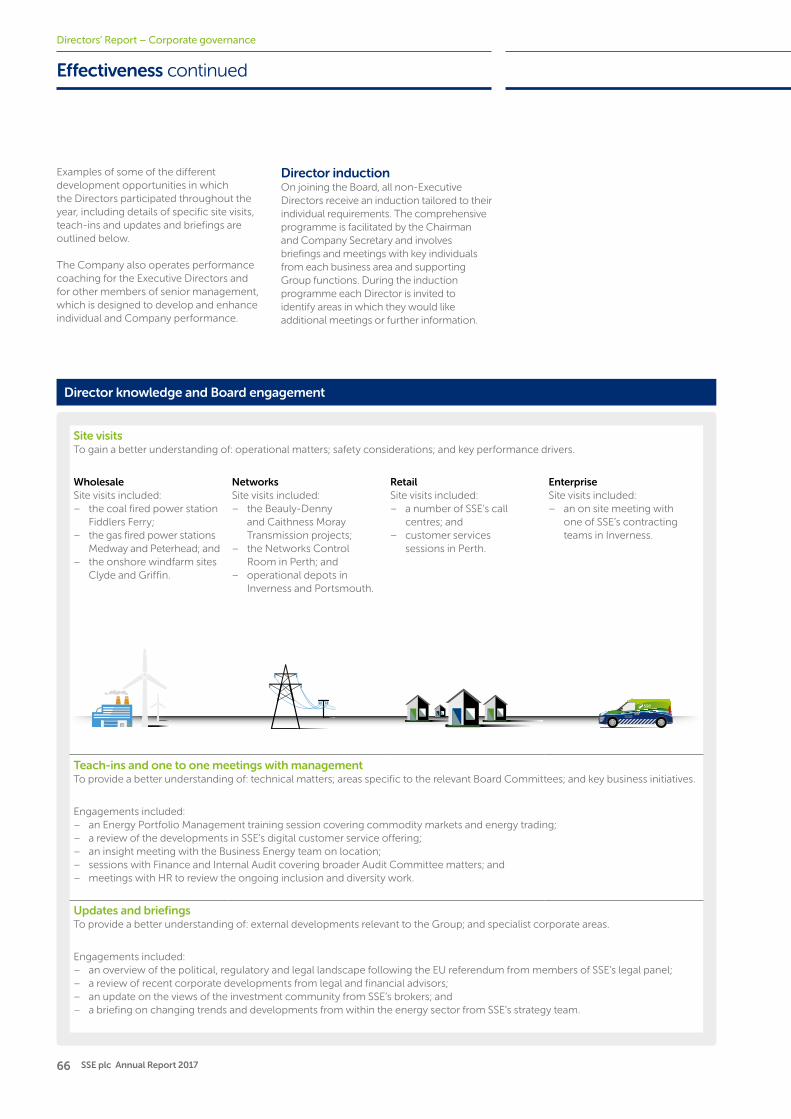
66 SSE plc Annual Report 2017
Directors’ Report – Corporate governance
Examples of some of the different development opportunities in which the Directors participated throughout the year, including details of specific site visits, teach-ins and updates and briefings are outlined below.
The Company also operates performance coaching for the Executive Directors and for other members of senior management, which is designed to develop and enhance individual and Company performance.
Director induction On joining the Board, all non-Executive Directors receive an induction tailored to their individual requirements. The comprehensive programme is facilitated by the Chairman and Company Secretary and involves briefings and meetings with key individuals from each business area and supporting Group functions. During the induction programme each Director is invited to identify areas in which they would like additional meetings or further information.
Director knowledge and Board engagement
Site visits To gain a better understanding of: operational matters; safety considerations; and key performance drivers.
WholesaleSite visits included:
– the coal fired power station Fiddlers Ferry;
– the gas fired power stations Medway and Peterhead; and
– the onshore windfarm sites Clyde and Griffin.
NetworksSite visits included:
– the Beauly-Denny and Caithness Moray Transmission projects;
– the Networks Control Room in Perth; and
– operational depots in Inverness and Portsmouth.
RetailSite visits included:
– a number of SSE’s call centres; and
– customer services sessions in Perth.
EnterpriseSite visits included:
– an on site meeting with one of SSE’s contracting teams in Inverness.
Teach-ins and one to one meetings with managementTo provide a better understanding of: technical matters; areas specific to the relevant Board Committees; and key business initiatives.
Engagements included: – an Energy Portfolio Management training session covering commodity markets and energy trading; – a review of the developments in SSE’s digital customer service offering; – an insight meeting with the Business Energy team on location; – sessions with Finance and Internal Audit covering broader Audit Committee matters; and – meetings with HR to review the ongoing inclusion and diversity work.
Updates and briefingsTo provide a better understanding of: external developments relevant to the Group; and specialist corporate areas.
Engagements included: – an overview of the political, regulatory and legal landscape following the EU referendum from members of SSE’s legal panel; – a review of recent corporate developments from legal and financial advisors; – an update on the views of the investment community from SSE’s brokers; and – a briefing on changing trends and developments from within the energy sector from SSE’s strategy team.
Effectiveness continued
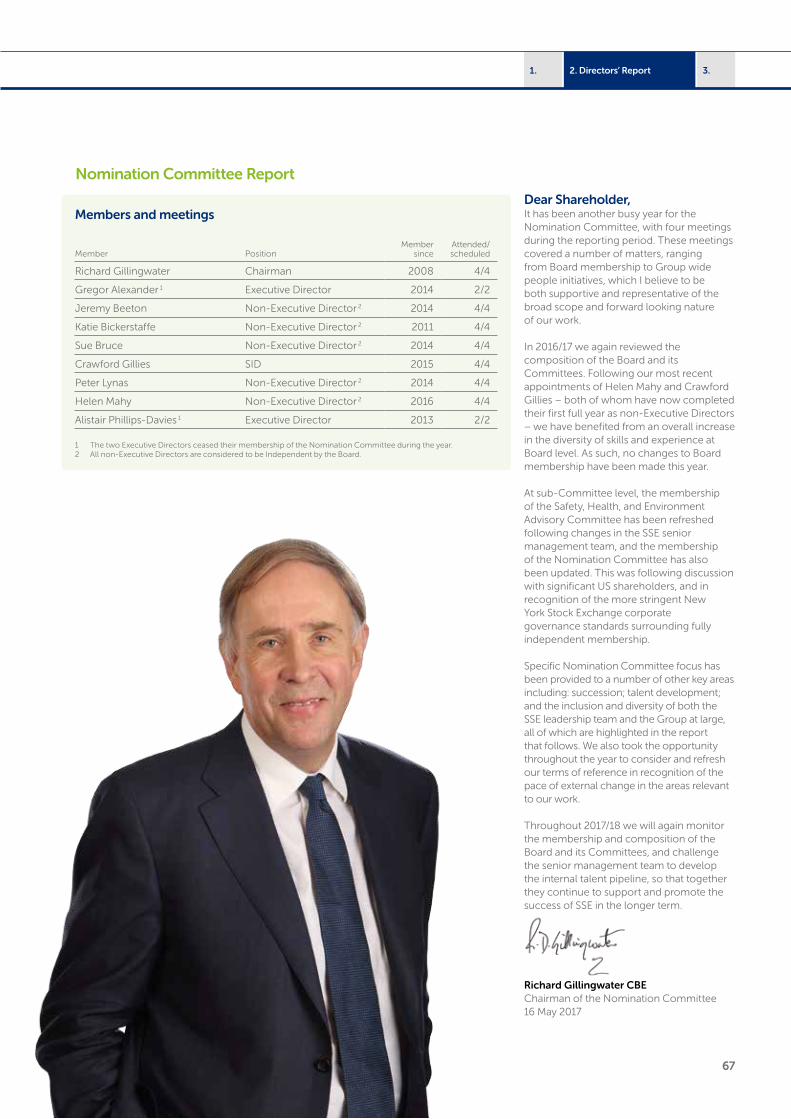
67
3.2. Directors’ Report1.
Dear Shareholder,It has been another busy year for the Nomination Committee, with four meetings during the reporting period. These meetings covered a number of matters, ranging from Board membership to Group wide people initiatives, which I believe to be both supportive and representative of the broad scope and forward looking nature of our work.
In 2016/17 we again reviewed the composition of the Board and its Committees. Following our most recent appointments of Helen Mahy and Crawford Gillies – both of whom have now completed their first full year as non-Executive Directors – we have benefited from an overall increase in the diversity of skills and experience at Board level. As such, no changes to Board membership have been made this year.
At sub-Committee level, the membership of the Safety, Health, and Environment Advisory Committee has been refreshed following changes in the SSE senior management team, and the membership of the Nomination Committee has also been updated. This was following discussion with significant US shareholders, and in recognition of the more stringent New York Stock Exchange corporate governance standards surrounding fully independent membership.
Specific Nomination Committee focus has been provided to a number of other key areas including: succession; talent development; and the inclusion and diversity of both the SSE leadership team and the Group at large, all of which are highlighted in the report that follows. We also took the opportunity throughout the year to consider and refresh our terms of reference in recognition of the pace of external change in the areas relevant to our work.
Throughout 2017/18 we will again monitor the membership and composition of the Board and its Committees, and challenge the senior management team to develop the internal talent pipeline, so that together they continue to support and promote the success of SSE in the longer term.
Richard Gillingwater CBEChairman of the Nomination Committee16 May 2017
Members and meetings
Member PositionMember
sinceAttended/scheduled
Richard Gillingwater Chairman 2008 4/4
Gregor Alexander 1 Executive Director 2014 2/2
Jeremy Beeton Non-Executive Director 2 2014 4/4
Katie Bickerstaffe Non-Executive Director 2 2011 4/4
Sue Bruce Non-Executive Director 2 2014 4/4
Crawford Gillies SID 2015 4/4
Peter Lynas Non-Executive Director 2 2014 4/4
Helen Mahy Non-Executive Director 2 2016 4/4
Alistair Phillips-Davies 1 Executive Director 2013 2/2
1 The two Executive Directors ceased their membership of the Nomination Committee during the year.2 All non-Executive Directors are considered to be Independent by the Board.
Nomination Committee Report
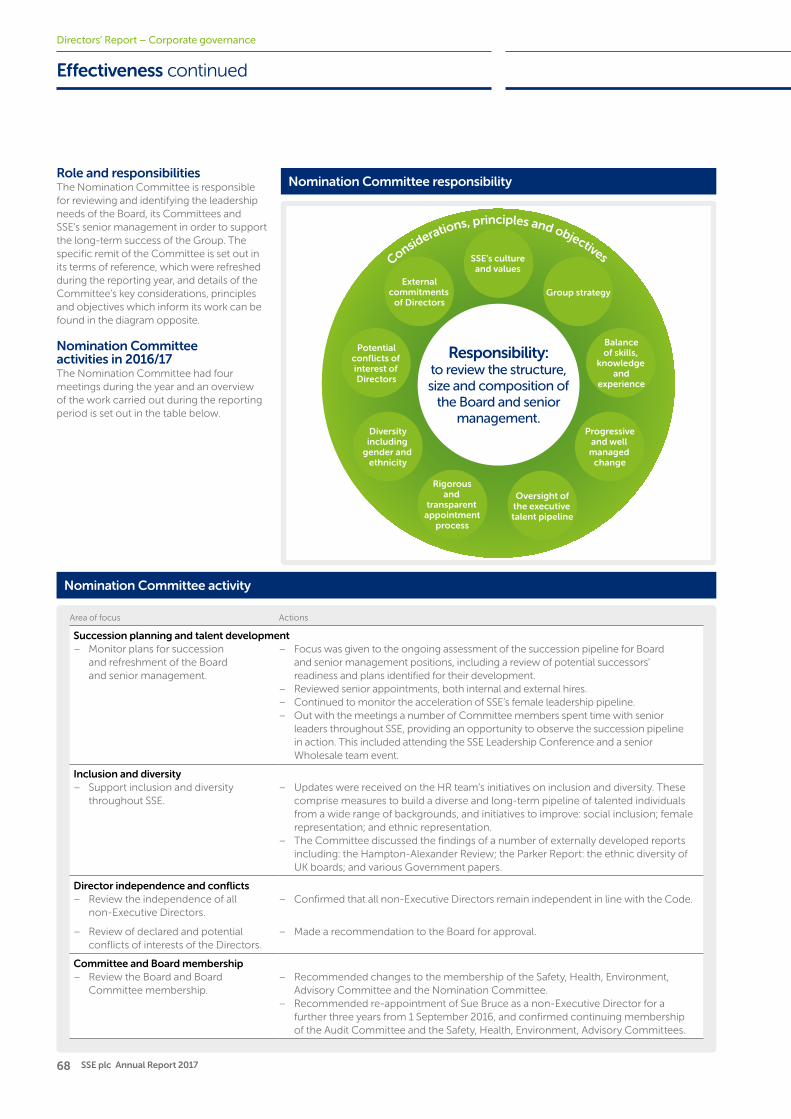
68 SSE plc Annual Report 2017
Responsibility:to review the structure, size and composition of
the Board and senior management.
Progressive and well managed
change
Diversity including
gender and ethnicity
Balance of skills,
knowledge and
experience
Potential conflicts of interest of Directors
Group strategyExternal
commitments of Directors
Oversight of the executive talent pipeline
Rigorous and
transparent appointment
process
SSE’s culture and values
Considerations, principles and objectives
Directors’ Report – Corporate governance
Role and responsibilitiesThe Nomination Committee is responsible for reviewing and identifying the leadership needs of the Board, its Committees and SSE’s senior management in order to support the long-term success of the Group. The specific remit of the Committee is set out in its terms of reference, which were refreshed during the reporting year, and details of the Committee’s key considerations, principles and objectives which inform its work can be found in the diagram opposite.
Nomination Committee activities in 2016/17The Nomination Committee had four meetings during the year and an overview of the work carried out during the reporting period is set out in the table below.
Area of focus Actions
Succession planning and talent development – Monitor plans for succession
and refreshment of the Board and senior management.
– Focus was given to the ongoing assessment of the succession pipeline for Board and senior management positions, including a review of potential successors’ readiness and plans identified for their development.
– Reviewed senior appointments, both internal and external hires. – Continued to monitor the acceleration of SSE’s female leadership pipeline. – Out with the meetings a number of Committee members spent time with senior
leaders throughout SSE, providing an opportunity to observe the succession pipeline in action. This included attending the SSE Leadership Conference and a senior Wholesale team event.
Inclusion and diversity – Support inclusion and diversity
throughout SSE. – Updates were received on the HR team’s initiatives on inclusion and diversity. These
comprise measures to build a diverse and long-term pipeline of talented individuals from a wide range of backgrounds, and initiatives to improve: social inclusion; female representation; and ethnic representation.
– The Committee discussed the findings of a number of externally developed reports including: the Hampton-Alexander Review; the Parker Report: the ethnic diversity of UK boards; and various Government papers.
Director independence and conflicts – Review the independence of all
non-Executive Directors. – Confirmed that all non-Executive Directors remain independent in line with the Code.
– Review of declared and potential conflicts of interests of the Directors.
– Made a recommendation to the Board for approval.
Committee and Board membership – Review the Board and Board
Committee membership. – Recommended changes to the membership of the Safety, Health, Environment,
Advisory Committee and the Nomination Committee. – Recommended re-appointment of Sue Bruce as a non-Executive Director for a
further three years from 1 September 2016, and confirmed continuing membership of the Audit Committee and the Safety, Health, Environment, Advisory Committees.
Nomination Committee activity
Effectiveness continued
Nomination Committee responsibility
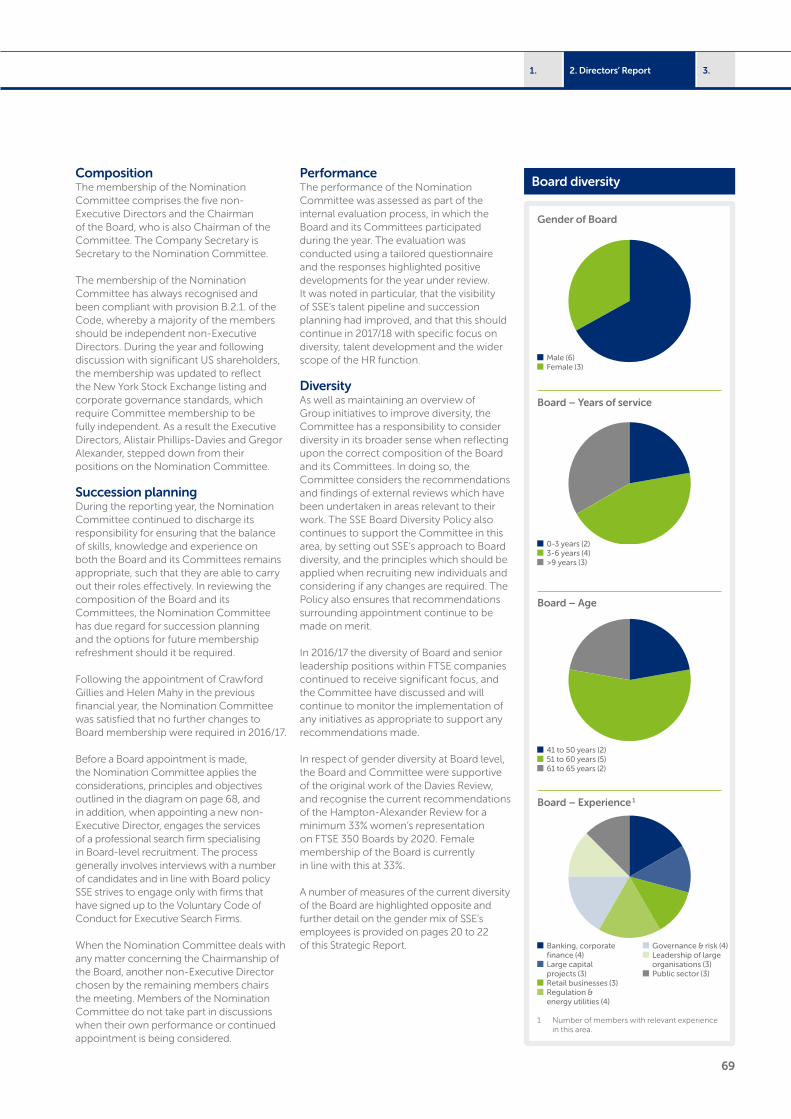
69
3.2. Directors’ Report1.
Composition The membership of the Nomination Committee comprises the five non-Executive Directors and the Chairman of the Board, who is also Chairman of the Committee. The Company Secretary is Secretary to the Nomination Committee.
The membership of the Nomination Committee has always recognised and been compliant with provision B.2.1. of the Code, whereby a majority of the members should be independent non-Executive Directors. During the year and following discussion with significant US shareholders, the membership was updated to reflect the New York Stock Exchange listing and corporate governance standards, which require Committee membership to be fully independent. As a result the Executive Directors, Alistair Phillips-Davies and Gregor Alexander, stepped down from their positions on the Nomination Committee.
Succession planningDuring the reporting year, the Nomination Committee continued to discharge its responsibility for ensuring that the balance of skills, knowledge and experience on both the Board and its Committees remains appropriate, such that they are able to carry out their roles effectively. In reviewing the composition of the Board and its Committees, the Nomination Committee has due regard for succession planning and the options for future membership refreshment should it be required.
Following the appointment of Crawford Gillies and Helen Mahy in the previous financial year, the Nomination Committee was satisfied that no further changes to Board membership were required in 2016/17.
Before a Board appointment is made, the Nomination Committee applies the considerations, principles and objectives outlined in the diagram on page 68, and in addition, when appointing a new non-Executive Director, engages the services of a professional search firm specialising in Board-level recruitment. The process generally involves interviews with a number of candidates and in line with Board policy SSE strives to engage only with firms that have signed up to the Voluntary Code of Conduct for Executive Search Firms.
When the Nomination Committee deals with any matter concerning the Chairmanship of the Board, another non-Executive Director chosen by the remaining members chairs the meeting. Members of the Nomination Committee do not take part in discussions when their own performance or continued appointment is being considered.
Performance The performance of the Nomination Committee was assessed as part of the internal evaluation process, in which the Board and its Committees participated during the year. The evaluation was conducted using a tailored questionnaire and the responses highlighted positive developments for the year under review. It was noted in particular, that the visibility of SSE’s talent pipeline and succession planning had improved, and that this should continue in 2017/18 with specific focus on diversity, talent development and the wider scope of the HR function.
DiversityAs well as maintaining an overview of Group initiatives to improve diversity, the Committee has a responsibility to consider diversity in its broader sense when reflecting upon the correct composition of the Board and its Committees. In doing so, the Committee considers the recommendations and findings of external reviews which have been undertaken in areas relevant to their work. The SSE Board Diversity Policy also continues to support the Committee in this area, by setting out SSE’s approach to Board diversity, and the principles which should be applied when recruiting new individuals and considering if any changes are required. The Policy also ensures that recommendations surrounding appointment continue to be made on merit.
In 2016/17 the diversity of Board and senior leadership positions within FTSE companies continued to receive significant focus, and the Committee have discussed and will continue to monitor the implementation of any initiatives as appropriate to support any recommendations made.
In respect of gender diversity at Board level, the Board and Committee were supportive of the original work of the Davies Review, and recognise the current recommendations of the Hampton-Alexander Review for a minimum 33% women’s representation on FTSE 350 Boards by 2020. Female membership of the Board is currently in line with this at 33%.
A number of measures of the current diversity of the Board are highlighted opposite and further detail on the gender mix of SSE’s employees is provided on pages 20 to 22 of this Strategic Report.
Gender of Board
Board – Years of service
Board – Age
Board – Experience 1
Male (6) Female (3)
0-3 years (2) 3-6 years (4) >9 years (3)
41 to 50 years (2) 51 to 60 years (5) 61 to 65 years (2)
Banking, corporate finance (4)
Large capital projects (3)
Retail businesses (3) Regulation & energy utilities (4)
Governance & risk (4) Leadership of large organisations (3)
Public sector (3)
1 Number of members with relevant experience in this area.
Board diversity
70 SSE plc Annual Report 201770 SSE plc Annual Report 2017
Directors’ Report – Corporate governance
Accountability
Dear Shareholder,On behalf of the Audit Committee, I am pleased to present the Audit Committee’s Report for the year ended 31 March 2017.
Over the following pages we provide insight into the workings and activity of the Audit Committee throughout the reporting year, in support of our role, which is to assist the Board discharge it’s responsibilities in relation to: the integrity of Financial Reporting; the relationship with the External Auditor; the effectiveness of the Internal Audit function; and the effectiveness of the System of Internal Control and Risk Management Framework.
The Audit Committee held four meetings in 2016/17 in line with the financial and audit calendars. Amongst a range of matters, the Audit Committee conducted a comprehensive review of the system of internal control and risk management framework, including the related assurance processes. We agreed to recommend to the Board that the number of Principal Risks be increased from nine to ten, following the split of the ‘Cyber and Networks Failure’ into two separate risks. The ‘Human and Relationship Capital’ risk was also expanded and renamed to ‘People and Culture’. We were pleased with the positive progress which has been made in this area, and further details of these changes are set out on pages 24 to 27.
Over the next 12 months the Audit Committee will continue to focus on the audit, assurance and risk processes to enhance the overall effectiveness of the System of Internal Control.
Peter LynasChairman of the Audit Committee16 May 2017
Audit Committee Report
Members and meetings
Member PositionMember
sinceAttended/scheduled
Peter Lynas 1 Non-Executive Director 2014 4/4
Sue Bruce Non-Executive Director 2014 4/4
Crawford Gillies Non-Executive Director 2015 4/4
Helen Mahy 2 Non-Executive Director 2016 4/4
The Board has confirmed that each member of the Audit Committee is independent and that membership meets the requirements of the Code in terms of recent and relevant financial experience and competence relevant to the sector in which the company operates.
1 Recent and relevant financial experience as the current Group Finance Director of BAE Systems plc and a Fellow of the Chartered Association of Certified Accountants.
2 Energy sector experience through previous role as Company Secretary and General Counsel of National Grid plc.
71
3.2. Directors’ Report1.
RoleThe key matters considered by the Audit Committee during the year are explained in the report that follows, and principally fell under the following areas.
Financial reporting – review the integrity of the interim and
annual financial statements; – review the appropriateness of accounting
policies and practices; – review the significant issues and
judgements considered in relation to the financial statements, including how each was addressed; and
– review the content of the Annual Report and Accounts and advise the Board on whether taken as a whole, it is fair, balanced and understandable.
Internal Audit – review and monitor the effectiveness
of the Internal Audit function, including approval of the audit plan.
External Audit – review and monitor the objectivity and
independence of the External Auditor, including the policy to govern the provision of non-audit services;
– review and monitor the effectiveness of the external audit process and the ongoing relationship with the External Auditor; and
– review and make recommendations to the Board on: the tendering of the external audit contract; and the appointment, remuneration and terms of engagement of the External Auditor.
Risk management and internal control – review and monitor the effectiveness
of the risk management and internal control framework;
– review the framework and analysis to support the long-term viability statement; and
– establish and oversee appropriate whistleblowing and fraud prevention arrangements.
Meetings and activities in 2016/17Meetings of the Audit Committee are scheduled at key times in the Group’s financial reporting and audit calendar, and take place in advance of Board meetings. The matters considered at each meeting are guided by an annual plan of business which is designed to ensure the Audit Committee discharges its responsibilities in accordance with its terms of reference which were updated during the year.
The Audit Committee met four times during the year, and has met once since the end of the financial year. Meetings of the Audit Committee are also routinely attended by the: Company Chairman; Finance Director; Director of Risk, Audit and Insurance; the External Auditor; and the Deputy Company Secretary who is secretary to the Audit Committee. Throughout the year, a number of other senior finance and business managers were invited to attend certain meetings to provide a deeper level of insight into particular items of business. This gave the Audit Committee the opportunity to meet management and discuss, debate and challenge on a range of matters.
The Chairman of the Audit Committee meets separately with the Finance Director, Director of Risk, Audit and Insurance, other senior management, and the External Auditor to ensure the work of the Audit Committee is focused on key and emerging issues. During the course of the year, regular challenge and engagement with management, Internal Audit and the External Auditor, together with the timely circulation of reports and information, has enabled the Audit Committee to discharge its duties and responsibilities effectively. The internal Board and Committee evaluation process
which was carried out during the year confirmed that the Audit Committee continued to operate effectively.
Financial reporting and significant financial judgementsFinancial reporting The Annual Report and Accounts seek to provide the information necessary to enable an assessment of the Company’s position and performance, business model and strategy. The Directors’ statement set out on page 100 recognises and confirms the Board’s responsibility for preparing the Annual Report and Accounts and to present a fair, balanced and understandable assessment of the Group’s position and prospects.
The Audit Committee assists the Board with the effective discharge of its responsibilities for financial reporting. During the year, the Audit Committee reviewed:
– the integrity of the interim and annual financial statements and accompanying reports to shareholders;
– the appropriateness of the accounting policies and practices used;
– the clarity of the disclosures, in addition to compliance with financial reporting standards and governance reporting requirements, including Alternative Performance Measures;
– the Group’s tax position, including ongoing HMRC enquiries, and areas of potential tax exposure;
– regular reports on the status of various accounting projects including: the transition to FRS 101 for subsidiary companies; IFRS15 – Revenue from Contracts with Customers; and IFRS9 – Financial Instruments;
– areas in which significant judgements had been applied and other matters raised for discussion by the External Auditor;
Fair, balanced and understandable assurance framework
The Audit Committee reviewed and the Board approved the assurance framework used to assist the Directors discharge their requirement to state that the Annual Report and Accounts are fair, balanced and understandable. The components of the assurance framework which were used to assist with the preparation of 2017 Annual Report and Accounts included:
– comprehensive guidance issued to contributors, including the FRC Letter, ‘Summary of key developments for 2016 annual reports’, which was issued to Audit Committee Chairman and Finance Director in October 2016;
– a verification process dealing with the factual content; – comprehensive reviews undertaken independently by senior management in Legal and Regulation to consider messaging
and balance; – comprehensive reviews undertaken by the Company’s brokers to ensure consistency and balance; – reporting by the External Auditor of any material inconsistencies; and – comprehensive review by the Directors and the senior management team.
The Audit Committee and Board received confirmation from management that the assurance framework had been adhered to for the preparation of the 2017 Annual Report.
72 SSE plc Annual Report 2017
Directors’ Report – Corporate governance
– reports from the External Auditor on its audit of the full year results and its review of the half year results;
– matters which informed the Board’s assessment that it was appropriate to prepare the accounts on a going concern basis;
– letters of representation issued by management to the External Auditor for the full year and half year results prior to them being signed on behalf of the Board;
– the content of the Annual Report and Accounts and advised the Board on whether they were fair, balanced and understandable and provide the information necessary for shareholders to assess the company’s performance, business model and strategy; and
– the governance arrangements to assist the Directors discharge their responsibilities in relation to: the disclosure of information to the External Auditor; and the fair, balanced and understandable assurance framework.
In carrying out the review of these matters, the Audit Committee received reports from management and the External Auditor setting out their views on the accounting treatments and judgements included in the Financial Statements.
Significant financial judgementsIn preparing the Financial Statements, there are a number of areas requiring the exercise by management of judgement or a high degree of estimation. After discussion with management and the External Auditor, the significant areas of judgement reviewed and considered by the Audit Committee in relation to the 2017 Financial Statements, and how these were addressed are set out in the table below.
Going concernAfter making appropriate enquiries, the Directors have a reasonable expectation that the Company and the Group have adequate resources to continue in operational existence for the foreseeable future (12 months). The financial statements are therefore prepared on
a going concern basis. Further details of the Group’s liquidity position and going concern review are provided in Note 1 to the Financial Statements. The Directors’ statement of longer term viability can be found on page 27.
Internal AuditThe Director of Risk, Audit and Insurance has management responsibility for the Internal Audit function. In addition to the normal corporate reporting structure, he has the right of direct access to the Audit Committee, Chief Executive, and Company Chairman. The Internal Audit function operates a risk-based methodology to review internal control and risk management processes and procedures. During the year, the Audit Committee:
– reviewed progress against the 2016/17 Internal Audit Plan, including significant findings, the adequacy of management’s response and overdue actions;
– received reports on the assessment of the system of internal control, including risk management;
Significant financial judgements for the year ended 31 March 2017 How the Audit Committee addressed these significant financial judgements
Carrying value of certain non-current assets: The carrying value of certain non-current assets in the Group – including power generation plants and goodwill – are assessed by reference to the recoverable value (value-in-use or fair value less costs to sell) of the asset or the associated CGU (cash generating unit). An annual valuation/impairment exercise is carried out. The assumptions applied in this exercise require judgements on the economic factors associated with the assets under review. Further details are provided in Notes 4.1 (i) and Note 15 to the Financial Statements.
The basis and outcome of this review is presented to the Audit Committee by management, and includes a description of the assumptions applied in deriving the recoverable values. The Audit Committee reviewed and challenged the assumptions and projections and also considered the findings of the External Auditor. Following this review, the Audit Committee supported the recommendation to recognise exceptional charges of £374.6m in relation to certain assets in the financial year.
Accounting for estimated revenue: Revenue from energy sales in the Retail division include estimates of the value of electricity and gas supplied to customers between the date of the last meter reading and the financial year end. These are based on estimates and assumptions in relation to the consumption and valuation of that consumption. Further details are provided in Notes 4.1 (ii) and Note 18 to the Financial Statements.
The Audit Committee reviewed the practical process issues and assumptions applied in determining the basis of recognition of ‘unbilled’ debtors, with particular reference to domestic electricity and gas. The Audit Committee also considered the findings of the External Auditor. Following this review, the Audit Committee supported this judgement.
Valuation of receivables: The recoverability of the Group’s billed energy receivables in the Retail division is a key judgement area given the risk of customer insolvency or default. The level of the Group’s aged debt is monitored with allowances for doubtful debt being based on assumptions derived from experience and industry knowledge. Further details are provided in Notes 4.1 (iii) to the Financial Statements.
The Audit Committee considered the assumptions impacting doubtful debt allowances and charges, and were updated on the activities of the Retail Debts Committee (whose members include the Finance Director) and the processes for receivables collection and provisioning. The Audit Committee also considered the findings of the External Auditor in this area. Following this review, the Audit Committee supported this judgement.
Accounting for Group pension obligations: The assumptions in relation to the cost to the Group of providing future post-retirement benefits are set after consultation with qualified actuaries and can have a significant material impact on the financial position of the Group. Further details are provided in Notes 4.1 (iv) and Note 23 to the Financial Statements.
The costs, assets and liabilities of the Group’s defined benefit retirement schemes are regularly reviewed. Advice is taken from independent actuaries on the IAS 19R valuation of the schemes. The Audit Committee were updated on the schemes’ valuation and also considered the findings of the External Auditor particularly in relation to the scheme’s key assumptions relative to market practice. Following this review, the Audit Committee supported this judgement.
Accountability continued
Significant financial judgements

73
3.2. Directors’ Report1.
– considered the independence, authority and responsibilities of the Internal Audit function and approved an updated version of the Internal Audit Charter;
– assessed the expertise and level of resources available to the Internal Audit function; and
– approved the Internal Audit Plan for 2017/18 which comprises both fixed and flexible elements in order to provide capacity to respond to any changing business requirements.
The Audit Committee is responsible for reviewing and monitoring the effectiveness of the Internal Audit function. During the year, the Audit Committee considered:
– the views of the Director of Risk, Audit and Insurance on the level of resourcing and areas for future development of the Internal Audit function;
– progress on delivery of the audit plan, together with post-audit management feedback;
– progress of the actions identified in the Quality and Standards Assessment of the Internal Audit function undertaken by KPMG in 2015;
– the output of a senior management survey obtaining feedback on the overall value and quality of the service provided by Internal Audit; and
– the views of the External Auditor on the effectiveness of the Internal Audit function.
After taking into account all of the above matters, the Audit Committee concluded that it is satisfied with the effectiveness of the Internal Audit function.
External AuditKPMG were appointed as the External Auditor in 1999 through a competitive tender process following the merger which formed SSE. At the 2016 AGM, shareholders re-appointed KPMG as the External Auditor of the Company for the year ended 31 March 2017, and authorised the Audit Committee to fix their remuneration. KPMG has acted as the External Auditor of the Group throughout the year. The External Auditor is required to rotate the lead Audit Partner every five years. The Audit Committee monitors this rotation, and confirms the current lead Audit Partner – Bill Meredith – is in the third year of his term.
Objectivity and independence The External Auditor has provided specific assurance to the Audit Committee on the arrangements it has in place to maintain its objectivity and independence, including confirmation of compliance with FRC Auditing and Ethical Standards in relation to the audit engagement. The Audit Committee also considered reports from management which did not raise any concerns in respect of the External Auditors’ objectivity and independence. In addition,
the Audit Committee oversees a policy to govern the non-audit services provided by the External Auditor. Details of the policy and fees paid to the External Auditor in 2016/17 are provided below. After taking into account all the above matters, the Audit Committee concluded that it is satisfied with the objectivity and independence of the External Auditor.
Effectiveness and ongoing relationshipDuring the year, the Audit Committee reviewed:
– the approach, scope, areas of focus, level of materiality and remuneration for the audit of the financial year ended 31 March 2017;
– regular reports on progress against the 2016/17 External Audit Plan, significant findings, the adequacy of management’s response and the time taken to resolve;
– the competence with which the External Auditor handled and communicated the key accounting and audit judgements;
– the effectiveness of the overall external audit process for 2016/17, including meeting with the External Auditor and management separately to get feedback on the relationship and assess the effectiveness of the external audit process;
– the quality of the External Auditor’s engagement with the Audit Committee;
– the qualifications, expertise and resources of the External Auditor;
Fees paid to External Auditor
£1.2m
£0.7m
Audit and Audit Related Services Permitted Non-Audit Services
The Non-Audit Services Policy applicable during the financial year recognises that the external audit contract will be subject to mandatory rotation from time-to-time, and provides a safeguard to ensure that potential audit firms are not restricted in their ability to tender for the external audit contract going forward. For the purposes of approval, non-audit services are divided into 3 categories:
– Audit-Related Services, where the approval of the Finance Director is needed; – Permitted Non-Audit Services, where approval can be obtained from the Finance Director up to £150,000 and the Audit
Committee Chairman above this amount; and – Prohibited Non-Audit Services.
The Audit Committee reviews a report at each meeting on the services being provided by the External Auditor. Fees for Audit and Audit-Related Services incurred during the year amounted to £1.2m and £0.7m for Permitted Non-Audit Services. Details of the fees paid to the External Auditor during the year are made in Note 6 to the Financial Statements. Significant categories of engagement for Permitted Non-Audit Services awarded during the year include £0.5m for transaction support in relation to the part disposal of SGN, £0.1m for review of various regulatory returns and information requests arising in the Networks business and £0.1m for tax advisory and compliance services. In line with the Non-Audit Services Policy, in each case the Audit Committee was satisfied that the work was best handled by the External Auditor because of their knowledge of the Group and the skills and expertise brought to the assignment.
During the year, the Non-Audit Services Policy was reviewed and updated (with effect from 1 April 2017) to ensure compliance with the changes introduced as part of EU Audit Reform.
Non-Audit Services Policy
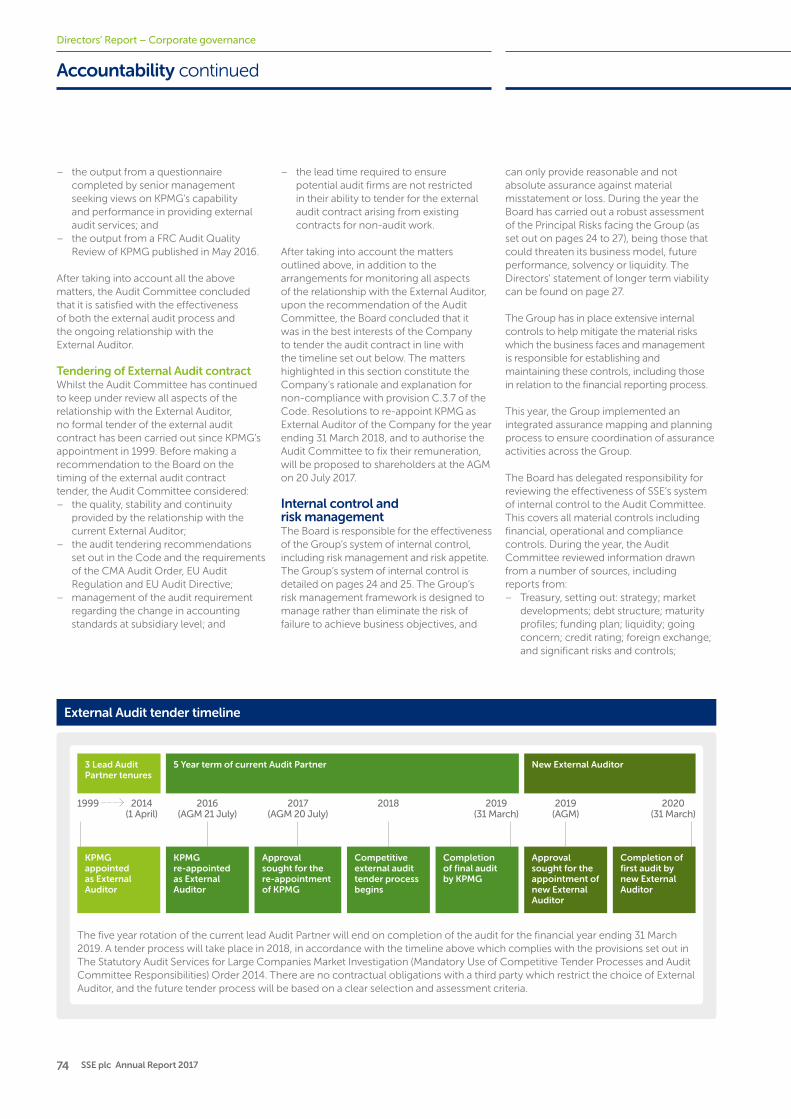
74 SSE plc Annual Report 2017
Directors’ Report – Corporate governance
– the output from a questionnaire completed by senior management seeking views on KPMG’s capability and performance in providing external audit services; and
– the output from a FRC Audit Quality Review of KPMG published in May 2016.
After taking into account all the above matters, the Audit Committee concluded that it is satisfied with the effectiveness of both the external audit process and the ongoing relationship with the External Auditor.
Tendering of External Audit contractWhilst the Audit Committee has continued to keep under review all aspects of the relationship with the External Auditor, no formal tender of the external audit contract has been carried out since KPMG’s appointment in 1999. Before making a recommendation to the Board on the timing of the external audit contract tender, the Audit Committee considered:
– the quality, stability and continuity provided by the relationship with the current External Auditor;
– the audit tendering recommendations set out in the Code and the requirements of the CMA Audit Order, EU Audit Regulation and EU Audit Directive;
– management of the audit requirement regarding the change in accounting standards at subsidiary level; and
– the lead time required to ensure potential audit firms are not restricted in their ability to tender for the external audit contract arising from existing contracts for non-audit work.
After taking into account the matters outlined above, in addition to the arrangements for monitoring all aspects of the relationship with the External Auditor, upon the recommendation of the Audit Committee, the Board concluded that it was in the best interests of the Company to tender the audit contract in line with the timeline set out below. The matters highlighted in this section constitute the Company’s rationale and explanation for non-compliance with provision C.3.7 of the Code. Resolutions to re-appoint KPMG as External Auditor of the Company for the year ending 31 March 2018, and to authorise the Audit Committee to fix their remuneration, will be proposed to shareholders at the AGM on 20 July 2017.
Internal control and risk managementThe Board is responsible for the effectiveness of the Group’s system of internal control, including risk management and risk appetite. The Group’s system of internal control is detailed on pages 24 and 25. The Group’s risk management framework is designed to manage rather than eliminate the risk of failure to achieve business objectives, and
can only provide reasonable and not absolute assurance against material misstatement or loss. During the year the Board has carried out a robust assessment of the Principal Risks facing the Group (as set out on pages 24 to 27), being those that could threaten its business model, future performance, solvency or liquidity. The Directors’ statement of longer term viability can be found on page 27.
The Group has in place extensive internal controls to help mitigate the material risks which the business faces and management is responsible for establishing and maintaining these controls, including those in relation to the financial reporting process.
This year, the Group implemented an integrated assurance mapping and planning process to ensure coordination of assurance activities across the Group.
The Board has delegated responsibility for reviewing the effectiveness of SSE’s system of internal control to the Audit Committee. This covers all material controls including financial, operational and compliance controls. During the year, the Audit Committee reviewed information drawn from a number of sources, including reports from:
– Treasury, setting out: strategy; market developments; debt structure; maturity profiles; funding plan; liquidity; going concern; credit rating; foreign exchange; and significant risks and controls;
KPMG appointed as External Auditor
3 Lead Audit Partner tenures
5 Year term of current Audit Partner New External Auditor
Completion of first audit by new External Auditor
KPMG re-appointed as External Auditor
Approval sought for the re-appointment of KPMG
Competitive external audit tender process begins
Completion of final audit by KPMG
Approval sought for the appointment of new External Auditor
1999 2014 (1 April)
2016 (AGM 21 July)
2017 (AGM 20 July)
2018 2019 (AGM)
2020 (31 March)
2019 (31 March)
The five year rotation of the current lead Audit Partner will end on completion of the audit for the financial year ending 31 March 2019. A tender process will take place in 2018, in accordance with the timeline above which complies with the provisions set out in The Statutory Audit Services for Large Companies Market Investigation (Mandatory Use of Competitive Tender Processes and Audit Committee Responsibilities) Order 2014. There are no contractual obligations with a third party which restrict the choice of External Auditor, and the future tender process will be based on a clear selection and assessment criteria.
External Audit tender timeline
Accountability continued

75
3.2. Directors’ Report1.
– Internal Audit on cyber security risks and vulnerabilities, including the development of the IT security programme;
– Energy Portfolio Management setting out: strategy; market prices and analysis; financial regulation developments; energy portfolio and counterparty credit exposures; and significant risks and controls;
– Group Risk on the framework for the identification, evaluation and monitoring of Principal Risks, including assessment of the risk management framework and internal control environment;
– Group Risk on the framework and analysis to support the long-term viability statement;
– Group Compliance updates on the development and implementation of a comprehensive obligations matrix, documenting legislative and regulatory obligations that govern SSE’s operations;
– Company Secretarial on governance developments relating to the work of the Audit Committee;
– Internal Audit on the work undertaken to identify Group-level fraud risks, and the development of a focused fraud risk audit plan;
– Internal Audit and Human Resources on the review and effectiveness of whistleblowing arrangements;
– Internal Audit highlighting investigations into allegations and incidents of fraud across the Group;
– the External Auditor, on its assessment of significant risks and the internal control environment in so far as is necessary to form an opinion on the true and fair view of the Financial Statements; and
– Group Risk on the information to provide assurance to the Audit Committee and Board on the key areas which form the system of internal control, together with a view from the Finance Director on the overall effectiveness of the system of internal control.
These reports provided the Audit Committee with invaluable insights into the risks facing the Group and the management of them, and inform the Board in its review of the effectiveness of the Group’s system of internal control, including risk management.
Review of system of internal controlThe Board and Audit Committee have reviewed the effectiveness of the Group’s system of internal control, including risk management, in accordance with the requirements of the FRC Guidance on Risk Management, Internal Control and related Financial and Business Reporting. The Board confirms that no significant failings or weaknesses were identified during the year and up to the date of this Annual Report. Where areas for improvement were identified, processes are in place to ensure that the necessary action is taken and that progress is monitored.
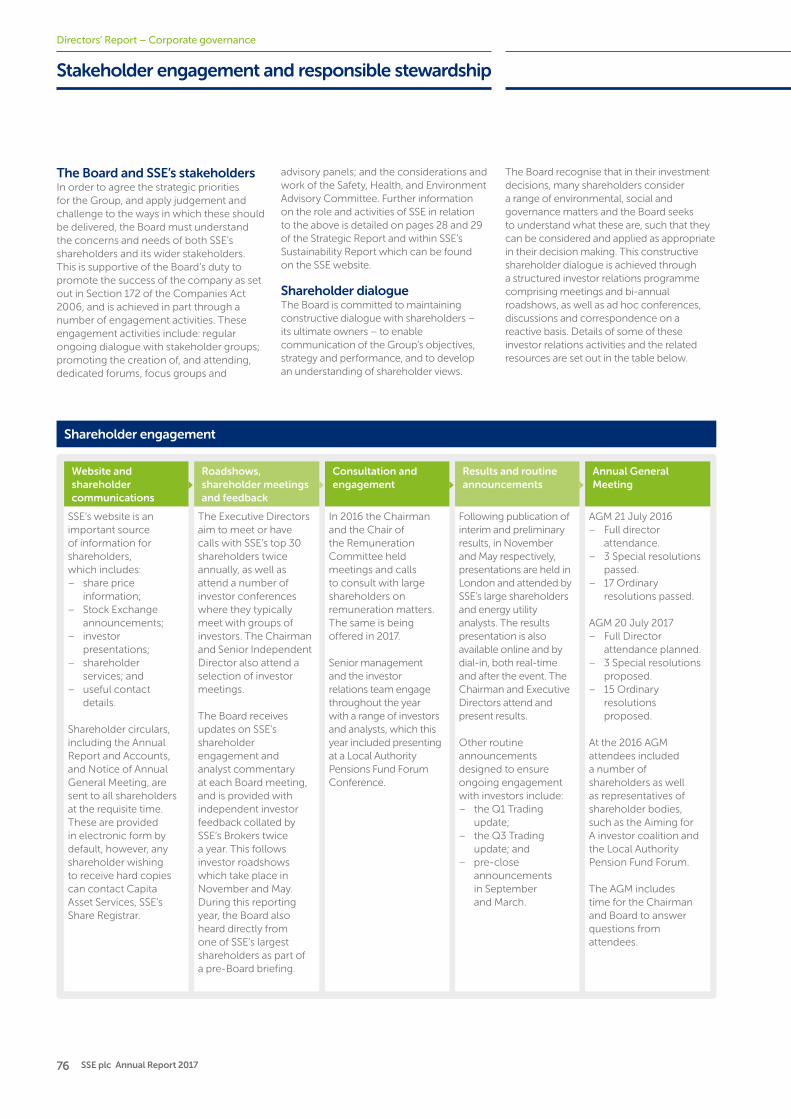
76 SSE plc Annual Report 2017
Directors’ Report – Corporate governance
Stakeholder engagement and responsible stewardship
The Board and SSE’s stakeholdersIn order to agree the strategic priorities for the Group, and apply judgement and challenge to the ways in which these should be delivered, the Board must understand the concerns and needs of both SSE’s shareholders and its wider stakeholders. This is supportive of the Board’s duty to promote the success of the company as set out in Section 172 of the Companies Act 2006, and is achieved in part through a number of engagement activities. These engagement activities include: regular ongoing dialogue with stakeholder groups; promoting the creation of, and attending, dedicated forums, focus groups and
advisory panels; and the considerations and work of the Safety, Health, and Environment Advisory Committee. Further information on the role and activities of SSE in relation to the above is detailed on pages 28 and 29 of the Strategic Report and within SSE’s Sustainability Report which can be found on the SSE website.
Shareholder dialogueThe Board is committed to maintaining constructive dialogue with shareholders – its ultimate owners – to enable communication of the Group’s objectives, strategy and performance, and to develop an understanding of shareholder views.
The Board recognise that in their investment decisions, many shareholders consider a range of environmental, social and governance matters and the Board seeks to understand what these are, such that they can be considered and applied as appropriate in their decision making. This constructive shareholder dialogue is achieved through a structured investor relations programme comprising meetings and bi-annual roadshows, as well as ad hoc conferences, discussions and correspondence on a reactive basis. Details of some of these investor relations activities and the related resources are set out in the table below.
Website and shareholder communications
Roadshows, shareholder meetings and feedback
Consultation and engagement
Results and routine announcements
Annual General Meeting
SSE’s website is an important source of information for shareholders, which includes:
– share price information;
– Stock Exchange announcements;
– investor presentations;
– shareholder services; and
– useful contact details.
Shareholder circulars, including the Annual Report and Accounts, and Notice of Annual General Meeting, are sent to all shareholders at the requisite time. These are provided in electronic form by default, however, any shareholder wishing to receive hard copies can contact Capita Asset Services, SSE’s Share Registrar.
The Executive Directors aim to meet or have calls with SSE’s top 30 shareholders twice annually, as well as attend a number of investor conferences where they typically meet with groups of investors. The Chairman and Senior Independent Director also attend a selection of investor meetings.
The Board receives updates on SSE’s shareholder engagement and analyst commentary at each Board meeting, and is provided with independent investor feedback collated by SSE’s Brokers twice a year. This follows investor roadshows which take place in November and May. During this reporting year, the Board also heard directly from one of SSE’s largest shareholders as part of a pre-Board briefing.
In 2016 the Chairman and the Chair of the Remuneration Committee held meetings and calls to consult with large shareholders on remuneration matters. The same is being offered in 2017.
Senior management and the investor relations team engage throughout the year with a range of investors and analysts, which this year included presenting at a Local Authority Pensions Fund Forum Conference.
Following publication of interim and preliminary results, in November and May respectively, presentations are held in London and attended by SSE’s large shareholders and energy utility analysts. The results presentation is also available online and by dial-in, both real-time and after the event. The Chairman and Executive Directors attend and present results.
Other routine announcements designed to ensure ongoing engagement with investors include:
– the Q1 Trading update;
– the Q3 Trading update; and
– pre-close announcements in September and March.
AGM 21 July 2016 – Full director
attendance. – 3 Special resolutions
passed. – 17 Ordinary
resolutions passed.
AGM 20 July 2017 – Full Director
attendance planned. – 3 Special resolutions
proposed. – 15 Ordinary
resolutions proposed.
At the 2016 AGM attendees included a number of shareholders as well as representatives of shareholder bodies, such as the Aiming for A investor coalition and the Local Authority Pension Fund Forum.
The AGM includes time for the Chairman and Board to answer questions from attendees.
Shareholder engagement
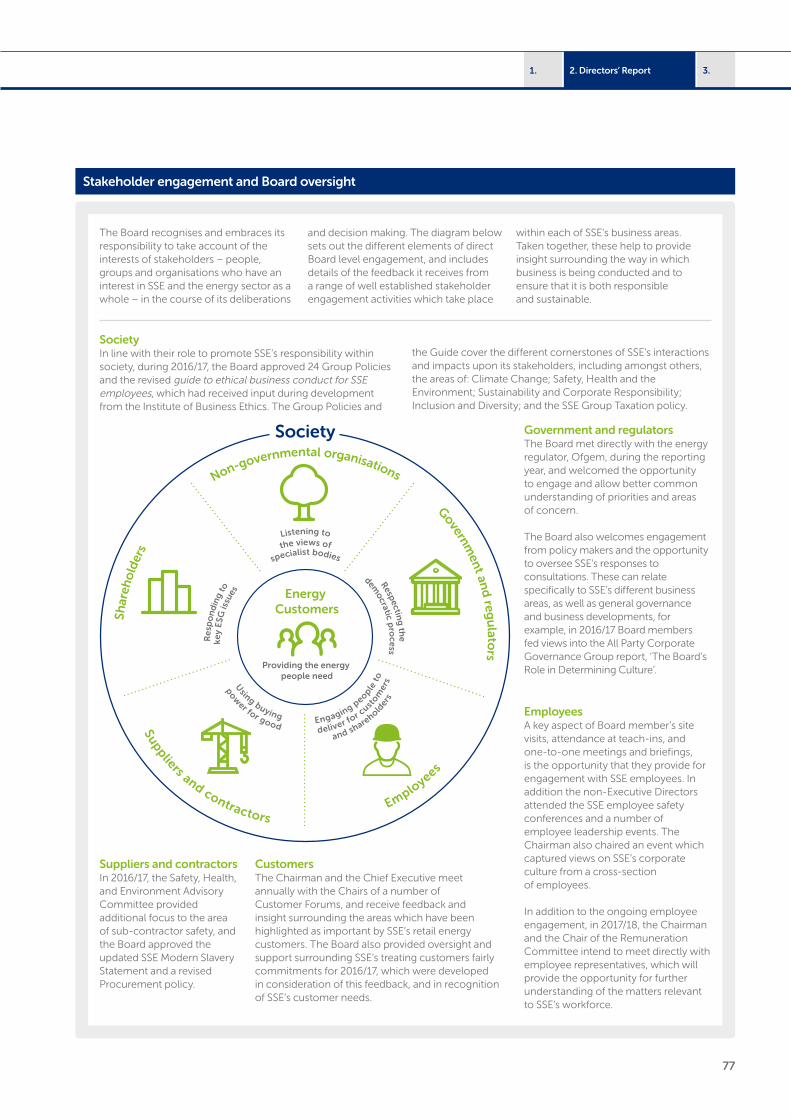
77
3.2. Directors’ Report1.
Providing the energy people need
Non-governmental organisations
Suppliers and contractorsEmplo
yees
specialist bodiesthe views ofListening to
key
ESG
issu
es
Res
po
nd
ing
to
democratic p
rocess
Respecting
the
Engaging people
to
deliver for c
ustom
ers
and sharehold
ers
Using buying
pow
er for good
Shar
eho
lder
s
Government an
d reg
ulato
rs
Energy Customers
Society Government and regulatorsThe Board met directly with the energy regulator, Ofgem, during the reporting year, and welcomed the opportunity to engage and allow better common understanding of priorities and areas of concern.
The Board also welcomes engagement from policy makers and the opportunity to oversee SSE’s responses to consultations. These can relate specifically to SSE’s different business areas, as well as general governance and business developments, for example, in 2016/17 Board members fed views into the All Party Corporate Governance Group report, ‘The Board’s Role in Determining Culture’.
Stakeholder engagement and Board oversight
The Board recognises and embraces its responsibility to take account of the interests of stakeholders – people, groups and organisations who have an interest in SSE and the energy sector as a whole – in the course of its deliberations
and decision making. The diagram below sets out the different elements of direct Board level engagement, and includes details of the feedback it receives from a range of well established stakeholder engagement activities which take place
within each of SSE’s business areas. Taken together, these help to provide insight surrounding the way in which business is being conducted and to ensure that it is both responsible and sustainable.
SocietyIn line with their role to promote SSE’s responsibility within society, during 2016/17, the Board approved 24 Group Policies and the revised guide to ethical business conduct for SSE employees, which had received input during development from the Institute of Business Ethics. The Group Policies and
the Guide cover the different cornerstones of SSE’s interactions and impacts upon its stakeholders, including amongst others, the areas of: Climate Change; Safety, Health and the Environment; Sustainability and Corporate Responsibility; Inclusion and Diversity; and the SSE Group Taxation policy.
Employees A key aspect of Board member’s site visits, attendance at teach-ins, and one-to-one meetings and briefings, is the opportunity that they provide for engagement with SSE employees. In addition the non-Executive Directors attended the SSE employee safety conferences and a number of employee leadership events. The Chairman also chaired an event which captured views on SSE’s corporate culture from a cross-section of employees.
In addition to the ongoing employee engagement, in 2017/18, the Chairman and the Chair of the Remuneration Committee intend to meet directly with employee representatives, which will provide the opportunity for further understanding of the matters relevant to SSE’s workforce.
Customers The Chairman and the Chief Executive meet annually with the Chairs of a number of Customer Forums, and receive feedback and insight surrounding the areas which have been highlighted as important by SSE’s retail energy customers. The Board also provided oversight and support surrounding SSE’s treating customers fairly commitments for 2016/17, which were developed in consideration of this feedback, and in recognition of SSE’s customer needs.
Suppliers and contractorsIn 2016/17, the Safety, Health, and Environment Advisory Committee provided additional focus to the area of sub-contractor safety, and the Board approved the updated SSE Modern Slavery Statement and a revised Procurement policy.
78 SSE plc Annual Report 201778 SSE plc Annual Report 2017
Directors’ Report – Corporate governance
Dear Shareholder,On behalf of the Board, I am pleased to present the report from the Safety, Health and Environment Advisory Committee (SHEAC).
During this reporting year, members of the SHEAC have taken the opportunity to visit various operational sites throughout the UK and Ireland, which has allowed us to meet a number of front-line employees, and gain insight into the culture relating to safety, heath and environment across SSE’s businesses.
These meetings and visits have provided a backdrop for our increased focus on the unique challenges facing each of SSE’s business areas through the framework of the Enduring Goals. The Enduring Goals were rolled out in 2015/16 and subsequently updated in 2016/17. They are designed to improve safety, health and environmental performance across the Group and I am pleased to report that overall performance has improved during 2016/17.
Looking forward over the next 12 months, the SHEAC have agreed to continue work in this area, through the review and implementation of, existing and new initiatives to drive improvements in the following Enduring Goals: Contractor Safety; Safety Family; Operational Safety; and Occupational Health and Well-being.
I hope you find the report that follows an interesting explanation of our work and SHE performance during the year.
Jeremy Beeton CBChairman of the SHEAC16 May 2017
Members and meetings
Member Position Member sinceAttended/scheduled
Jeremy Beeton Non-Executive Director ¹ 2011 3/3
Sue Bruce Non-Executive Director ¹ 2013 3/3
Helen Mahy Non-Executive Director ¹ 2016 3/3
Colin Nicol 2 Senior Executive 2016 2/2
Jim Smith 2 Senior Executive 2016 2/2
Mark Patterson Senior Executive 2013 3/3
Jim McPhillimy 3 Senior Executive 2008 1/1
Paul Smith 4 Senior Executive 2008 -/-
1 All non-Executive Directors are considered to be independent by the Board.2 Colin Nicol and Jim Smith joined the SHEAC on 31 May 2016.3 Jim McPhillimy retried from SSE and as a member of the SHEAC on 31 October 2016.4 Paul Smith retried from SSE and as a member of the SHEAC on 31 May 2016.
Safety, Health and Environment AdvisoryCommittee Report
Stakeholder engagement and responsible stewardship continued
79
3.2. Directors’ Report1.
of SSE. SSE’s total recordable injury rate for SSE and Contractors was 0.22 per 100,000 hours worked in 2016/17, compared to 0.23 in 2015/16.
In this financial year there have been 102 incidents that have harmed individuals and most tragically this includes a fatality on one of our major construction projects. This compares to 113 incidents for the same period in 2015/16. On balance, this performance shows some progress; but it also still represents a significant number of incidents and accidents.
One area of continuing concern is the number of serious incidents involving company vehicles with 19 Class 1 Road Traffic Collision Accountable incidents in 2016/17, compared with 29 in the previous year. Following on from the successful implementation of Project Drive in 2015/16 SSE has continued to improve the management of road risk in 2016/17. This has had a positive impact on driving related safety and the management of road risk will continue to be a key area of focus going forward.
Health SSE’s Health and Well-Being Action Plan provides the basis for workplace health programmes and initiatives, all designed to help promote the physical and mental health of employees. SSE deals with sickness absence in a sympathetic and constructive
RoleThe SHEAC advises the Board on matters relating to safety, health and environment. The remit of the SHEAC is set out in its terms of reference which were updated during the year, and include responsibility for:
– ensuring adherence to SSE’s safety, health and environmental policies;
– setting Group targets and monitoring performance against these targets;
– developing strategy to drive improvements in performance;
– promoting a culture, and enhancing the awareness, of safety, health and environmental management; and
– making recommendations to the Board where action or improvement is needed.
Composition The membership of the SHEAC currently comprises three non-Executive Directors, two Senior Managers with significant operational responsibilities in Wholesale and Networks and the Group Safety, Health and Environment Manager. Members of the SHEAC are appointed by the Board following recommendation by the Nomination Committee. During the year, Colin Nicol and Jim Smith were appointed to the SHEAC and replaced Jim McPhillimy and Paul Smith, both of whom retried from SSE. The Chief Executive routinely attends meetings and the Deputy Company Secretary is Secretary to the SHEAC.
The SHEAC provides a leadership forum for the non-Executive Directors to share their knowledge and expertise with senior management. Jeremy Beeton brings a depth of experience from his background in engineering and major construction projects. Sue Bruce provides valuable insights from various senior roles in the public sector. Helen Mahy brings a wealth of knowledge from her career in the energy industry.
Meetings and activities in 2016/17During the year, the SHEAC had three meetings, with one of these being held at Clyde Windfarm. The SHEAC has an annual work plan with standing items covering safety, health and environmental: performance; incidents and trends; risks and priorities. Other matters which the SHEAC has focused on during the year include: strategy to improve SSE’s SHE performance over multiple years; contractor safety; decommissioning and demolition; driving; and SHE-related training. The Board and Committee evaluation process which was carried out during the year confirmed that the SHEAC continued to operate effectively.
Performance in 2016/17SafetySSE’s overall safety goal is 100% injury free working by those working for and on behalf
way, helping employees make a speedy return to health and to work. During 2016/17, the average number of days of sickness absence from work was 9.8 days per person.
EnvironmentDeveloping and upgrading the energy infrastructure in the UK is an essential part of providing the energy people need. With the transition towards a low carbon economy, it is increasingly important that this infrastructure has sufficient capacity to deliver ‘greener’ energy. Developing, building, owning and operating this infrastructure can have both positive and negative impacts on people’s lives. It is therefore important to develop these projects responsibly, listening to stakeholders and responding in a balanced way.
SSE’s main environmental impact arises from emissions of CO
2 associated with electricity
generation, and the reporting of greenhouse gas emissions is set out on pages 18 and 19. SSE’s focus remains on minimising the impact of operations and adhering to environmental based permit conditions associated with its operations and minimising the impact of operations and projects.
Further information relating to safety, health and environmental performance during 2016/17 is contained on pages 1 to 53 and also included in SSE’s Sustainability Report which is available on the SSE website.
SSE’s first priority in everything it does is to prevent harm to people or places. In support of that, SSE’s first core value is Safety – we believe all accidents are preventable, so we do everything safely and responsibly or not at all. Due to the diversity of operations across SSE’s businesses, this core Safety value is supported by a set of Enduring Goals, which provide a framework for each business to focus attention on its unique safety, health and environmental challenges. The work of the SHEAC is designed around these Enduring Goals which are set out below.
1 Safety Family Being our brother’s keeper with everyone working to high standards.
2 Driving Creating a company of lower risk drivers.
3 Process Safety Carrying out our duty of care diligently and preventing major incidents.
4 Contractor Safety Working with our contractors to be ‘best in class’ on Safety.
5 Occupational Health and Well-being
Protecting our team’s health and promoting their well-being.
6 Environment Protecting the environment and operating in a sustainable way.
7 Crisis Management Staying well prepared and responding brilliantly when things go wrong.
8 Operational Safety Ensuring a robust safe system of work.
The Enduring Goals
80 SSE plc Annual Report 201780 SSE plc Annual Report 2017
Directors’ Report – Corporate governance
Dear Shareholder,The objective of the Directors’ Remuneration Report for 2016/17 is to set out in a simple and transparent way how SSE pays its Directors (executive and non-executive); the decisions made on their pay and how much they received in relation to 2016/17 performance. The report also describes how this links to the Company’s purpose and strategy; how the Remuneration Committee works, and how it has given due consideration to the perspectives of SSE’s stakeholders.
Linking Executive Directors’ remuneration with SSE’s purpose and strategyIt is key that our overall remuneration policy is aligned to SSE’s core purpose of providing energy in a reliable and sustainable way; energy is a long-term business requiring effective stewardship. It must also be aligned to SSE’s strategy of efficient operations and disciplined investment, which requires genuine customer focus and strong delivery capability, across a balanced range of energy businesses. In addition, it must be consistent with SSE’s wider commitment to being a responsible company, which, in remuneration terms, means a policy characterised by simplicity to enable effective stakeholder scrutiny and balance to take account of a broad range of considerations. Finally, remuneration policy must be characterised by fairness: fair to the Executive Directors themselves; fair relative to the rest of the SSE team; fair in terms of the value delivered to SSE’s investors by its Executive team; and fair in terms of SSE’s contribution to society as a whole. Together, stewardship, customer focus,
In this section:
Chairman’s Statement 80
A snapshot of SSE’s approach to pay 82
Annual report on remuneration 86Single total figure of remuneration 862016/17 AIP 872014/17 PSP 89Other remuneration disclosures 89Pay ratio 91Governance 94Implementation for 2017/18 95
Summary of remuneration policy 96
Members and meetings
Member Position Member sinceAttended/scheduled
Katie Bickerstaffe Non-Executive Director ¹ 2011 3/3
Jeremy Beeton Non-Executive Director ¹ 2014 3/3
Crawford Gillies SID 2015 3/3
Richard Gillingwater CBE Chairman of the Board 2007 3/3
1 All non-Executive Directors are considered to be independent by the Board.
Remuneration
Remuneration Committee Report
81
3.2. Directors’ Report1.
Performance related pay out-turns in 2016/17In a difficult trading environment SSE performed robustly against its key metrics with DPS, Adjusted PBT, Adjusted EPS, customer performance and cashflow all at or ahead of expectations as shown on page 83.
The PBT target was adjusted to remove the impact of SGN earnings after the part-disposal earlier in the year to ensure consistency of measurement.
– Annual Incentive Plan (AIP): The out-turn under the AIP was determined against a range of financial, strategic and personal targets set at the beginning of the year. This resulted in an outcome of 72% of the maximum opportunity. We have set out details of SSE’s performance against the AIP measures and targets on page 87.
– Performance Share Plan (PSP): For PSP awards granted in 2014, which were due to vest following the end of the 2016/17 financial year, measurement of performance over the three year period resulted in a 45.5% out-turn against the PSP measures and targets on page 89. This is the first vesting of the PSP, including revised measures from 2014.
For both plans the Committee considered in detail, whether any adjustments were merited and decided, taking into account overall performance, to make a downward adjustment to the AIP total, reducing the overall pay out for both Executive Directors from 76% to 72%. The Committee decided to leave the PSP performance unadjusted.
Improved performance under both the AIP and PSP means that the level of total remuneration earned by the Chief Executive has increased significantly, by 72% year-on-year. This increase also includes the PSP vesting for the first time in three years together with last year’s approval by shareholders to increase the maximum opportunity under the AIP. To put this into context, however, total remuneration in 2015/16 decreased compared with the previous year, which demonstrates that there is a clear link between business performance and remuneration out-turn in any given year.
Implementation for 2017/18The current Directors’ Remuneration Policy was approved with 99% of votes cast in favour at the 2016 AGM. During the year the Committee reviewed the policy and determined that it remained appropriately aligned to SSE’s strategy.
delivery, simplicity, balance and fairness provide the pillars of our overall remuneration policy.
The Committee is very mindful of the public debate on executive pay and the Company as a whole has sought to maintain a clear and consistent approach to pay, with simple, transparent arrangements which are easily understood and consistent with SSE’s commitment to being a responsible employer. We are also aware of employees’ views on executive pay and general employment issues. As part of this process the HR Director and Head of Reward meet with recognised employee representatives annually and provide feedback to the Committee following the meeting. It is my intention over the next 12 months that I will meet directly with the employee representatives.
The extent and impact of their responsibilities means Executive Directors are well-paid; the remuneration policy of SSE is designed, amongst other things, to ensure they are fairly paid but not overpaid.
As part of our commitment to transparency, we have again voluntarily disclosed a CEO pay ratio (see page 91). We have also provided detailed disclosure on the gender pay gap (see our Sustainability Report) and the measures we are taking as a Company to understand and address it over the long term. Using these additional reference points and taking a broader view of pay and employment conditions is as important to us as the use of external benchmark data when setting executive pay levels.
As part of its responsibilities, the Remuneration Committee regularly reviews the remuneration policy to ensure it remains appropriate for the business and is at the forefront of developments in good corporate governance. The Committee has been following the wide range of investor guidance that has been released in the last 12 months and the consultation process for the UK Government’s Green Paper on Corporate Governance. We accept that this may have an impact on UK market practice over time. Where relevant, we have implemented a number of these suggestions on a voluntary basis. However, the Committee does not believe it is appropriate to make material changes to the policy only a year into the current policy period, although this is an area which will be kept under review to ensure we are best supporting the long-term interests of the business, applying a consistent approach across the senior executive team and developing and retaining the best talent.
The Committee agreed to base salary increases for the Executive Directors of 2.4% which are in line with those provided to the wider SSE workforce.
Next stepsIn light of the continuing debate on executive pay and our desire to enhance the effectiveness of pay in support of SSE’s strategy, the Committee intends to spend time during 2017/18 considering how we can operate the policy more effectively, which will include amongst other things:
– The operation of the PSP and alignment of approach with below board participants to ensure consistency of approach.
– Moving the primary AIP financial measure from Adjusted PBT to Adjusted EPS to align with the key measure and general approach SSE take when issuing financial performance guidance.
Finally, it is worth noting from SSE’s preliminary results statement in May 2017 and from this Annual Report that SSE expects this to be a challenging year. Taking this into account it is the role of the Committee to continue to set challenging but fair performance measures and targets that incentivise strong performance and delivery by the Executive Directors and the wider SSE team.
As always, I appreciate any feedback or comments on this Report. We will endeavour to report remuneration matters with clarity and transparency and welcome any suggestions on how we can improve this.
Katie Bickerstaffe Chairman of the Remuneration Committee
Summary of activities during the year
– Setting of performance metrics for 2016/17
– Review of Committee advisors – Review of performance – Analysis of proposed governance
reforms

82 SSE plc Annual Report 2017
Directors’ Report – Corporate governance
A snapshot of SSE’s approach to payRemuneration principles and strategy
A summary of our pay policy in action
Element Max 2016/17 2017/18 2020/21 2022/23
Fixed pay
Salary Increases normally limited to those of wider employee base
Salary paid
Benefits Market competitive
Benefits paid
Pension Final salary and top up (with pensionable pay increases capped at RPI+1%)
Pension accrual
Variable pay – at risk
Annual Incentive Plan (AIP)
CEO 150% of salary FD 130% of salary 67% cash/33% career shares
AIP cash paid
AIP career share award granted
Award vests
Performance Share Plan (PSP)
CEO 200% of salary FD 175% of salary 2 Year holding period
PSP awards granted
PSP awards vests
Holding period ends
Additional governance
Share ownership requirement
200% of salary Share ownership requirement
Recovery and withholding
All incentives Clawback: misstatement, serious misconduct, error in calculation Malus: misstatement, misconduct, serious reputational damage, error in calculation
Post-employment
Career shares Holding requirement for career shares until one year after cessation of employment
Remuneration continued
SimplicityPay comprises just four elements – base salary, benefits (including pension), an annual incentive and a long-term incentive.
Customer focusCustomer service measures are included in both the annual incentive and PSP.
BalanceA balanced range of measures used to ensure all aspects of Executive Directors’ overall performance is covered.
DeliveryDividends and Total Shareholder Return (TSR) measures align Executive Directors’ interests with those of shareholders.
StewardshipExecutive Directors are expected to look to the long term and build and maintain significant personal shareholdings in the business even after they retire.
FairnessOur transparent approach to setting and reporting pay levels which takes into account a range of stakeholder views.
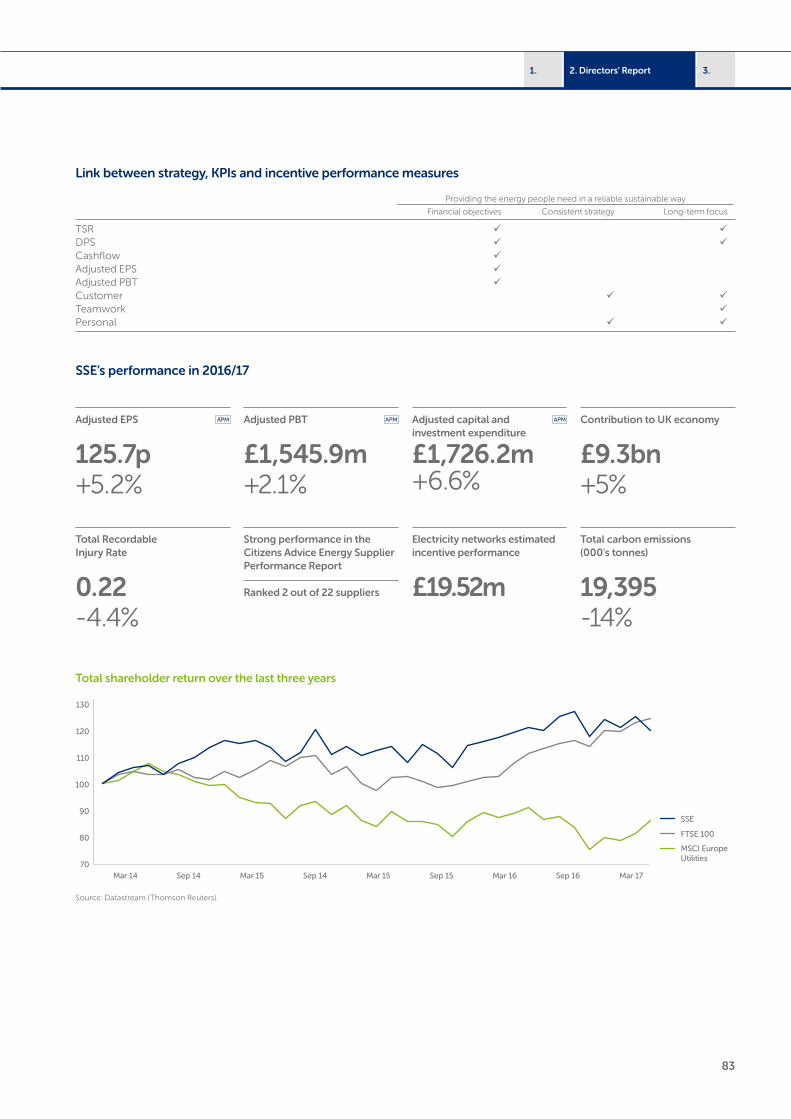
83
3.2. Directors’ Report1.
Link between strategy, KPIs and incentive performance measures
Providing the energy people need in a reliable sustainable way
Financial objectives Consistent strategy Long-term focus
TSR ü üDPS ü üCashflow üAdjusted EPS üAdjusted PBT üCustomer ü üTeamwork üPersonal ü ü
Adjusted EPS
125.7p+5.2%
Total Recordable Injury Rate
0.22-4.4%
Adjusted PBT
£1,545.9m +2.1%
Strong performance in the Citizens Advice Energy Supplier Performance Report
Ranked 2 out of 22 suppliers
Adjusted capital and investment expenditure
£1,726.2m +6.6%
Electricity networks estimated incentive performance
£19.52m
Contribution to UK economy
£9.3bn+5%
Total carbon emissions (000's tonnes)
19,395-14%
Total shareholder return over the last three years
Mar 14 Sep 14 Mar 15 Sep 14 Mar 15 Sep 15 Sep 16
SSE
Mar 16 Mar 17
FTSE 100
MSCI Europe Utilities
70
80
90
100
110
120
130
Source: Datastream (Thomson Reuters).
SSE’s performance in 2016/17
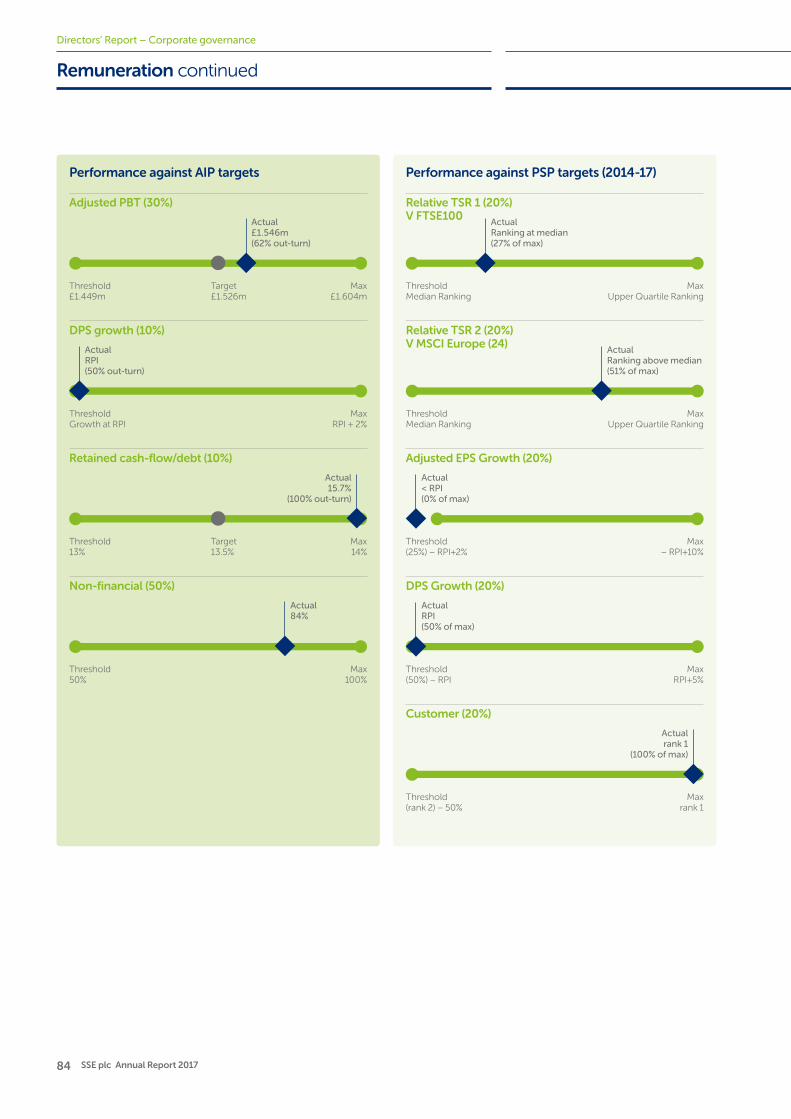
84 SSE plc Annual Report 2017
Directors’ Report – Corporate governance
Performance against PSP targets (2014-17)
Threshold Median Ranking
Max Upper Quartile Ranking
Actual Ranking at median(27% of max)
Relative TSR 1 (20%)V FTSE100
Threshold Median Ranking
Max Upper Quartile Ranking
Actual Ranking above median(51% of max)
Relative TSR 2 (20%)V MSCI Europe (24)
Threshold (25%) – RPI+2%
Max – RPI+10%
Actual < RPI(0% of max)
Adjusted EPS Growth (20%)
Threshold (50%) – RPI
Max RPI+5%
Actual RPI(50% of max)
DPS Growth (20%)
Threshold (rank 2) – 50%
Max rank 1
Actual rank 1
(100% of max)
Customer (20%)
Remuneration continued
Threshold £1.449m
Target £1.526m
Max £1.604m
Actual £1.546m(62% out-turn)
Performance against AIP targets
Adjusted PBT (30%)
Threshold 13%
Target 13.5%
Max 14%
Actual 15.7%
(100% out-turn)
Retained cash-flow/debt (10%)
Threshold Growth at RPI
Max RPI + 2%
Actual RPI(50% out-turn)
DPS growth (10%)
Threshold 50%
Max 100%
Actual 84%
Non-financial (50%)
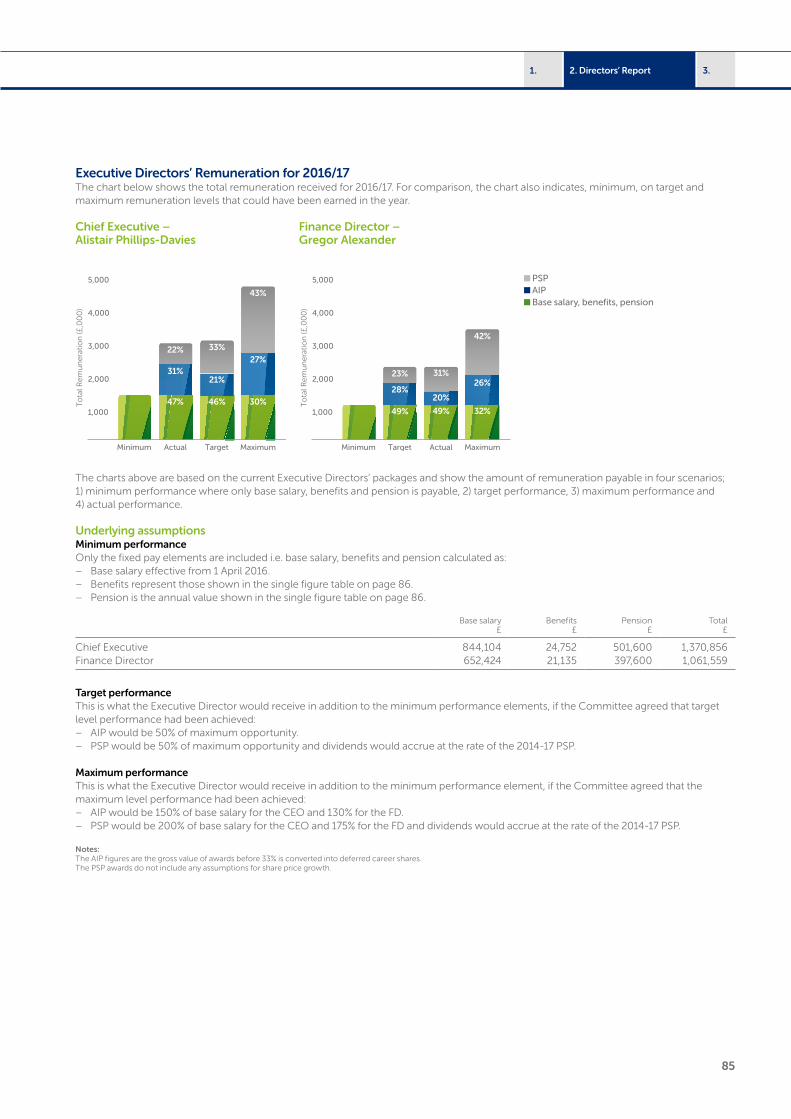
85
3.2. Directors’ Report1.
Executive Directors’ Remuneration for 2016/17The chart below shows the total remuneration received for 2016/17. For comparison, the chart also indicates, minimum, on target and maximum remuneration levels that could have been earned in the year.
Chief Executive – Finance Director – Alistair Phillips-Davies Gregor Alexander
1,000
2,000
3,000
4,000
5,000
43%
27%
30%
22%
31%
47% 46%
21%
33%
To
tal R
emu
ner
atio
n (£
,00
0)
MaximumMinimum Actual Target
1,000
2,000
3,000
4,000
5,000
31%
20%
49%
23%
28%
49% 32%
26%
42%
To
tal R
emu
ner
atio
n (£
,00
0)
Target MaximumActualMinimum
PSP AIP Base salary, benefits, pension
The charts above are based on the current Executive Directors’ packages and show the amount of remuneration payable in four scenarios; 1) minimum performance where only base salary, benefits and pension is payable, 2) target performance, 3) maximum performance and 4) actual performance.
Underlying assumptionsMinimum performanceOnly the fixed pay elements are included i.e. base salary, benefits and pension calculated as:
– Base salary effective from 1 April 2016. – Benefits represent those shown in the single figure table on page 86. – Pension is the annual value shown in the single figure table on page 86.
Base salary£
Benefits£
Pension£
Total£
Chief Executive 844,104 24,752 501,600 1,370,856Finance Director 652,424 21,135 397,600 1,061,559
Target performanceThis is what the Executive Director would receive in addition to the minimum performance elements, if the Committee agreed that target level performance had been achieved:
– AIP would be 50% of maximum opportunity. – PSP would be 50% of maximum opportunity and dividends would accrue at the rate of the 2014-17 PSP.
Maximum performanceThis is what the Executive Director would receive in addition to the minimum performance element, if the Committee agreed that the maximum level performance had been achieved:
– AIP would be 150% of base salary for the CEO and 130% for the FD. – PSP would be 200% of base salary for the CEO and 175% for the FD and dividends would accrue at the rate of the 2014-17 PSP.
Notes:The AIP figures are the gross value of awards before 33% is converted into deferred career shares.The PSP awards do not include any assumptions for share price growth.
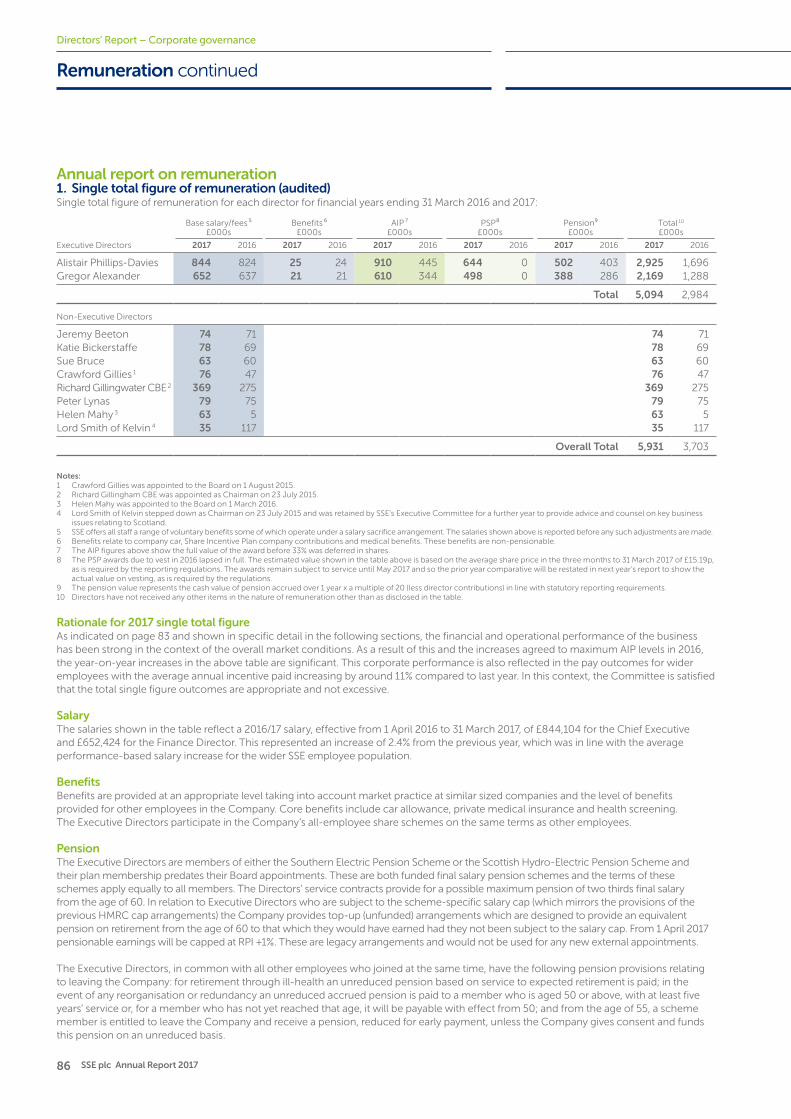
86 SSE plc Annual Report 2017
Directors’ Report – Corporate governance
Annual report on remuneration1. Single total figure of remuneration (audited)Single total figure of remuneration for each director for financial years ending 31 March 2016 and 2017 :
Base salary/fees ⁵ £000s
Benefits ⁶ £000s
AIP ⁷ £000s
PSP⁸ £000s
Pension⁹ £000s
Total 10 £000s
Executive Directors 2017 2016 2017 2016 2017 2016 2017 2016 2017 2016 2017 2016
Alistair Phillips-Davies 844 824 25 24 910 445 644 0 502 403 2,925 1,696Gregor Alexander 652 637 21 21 610 344 498 0 388 286 2,169 1,288
Total 5,094 2,984
Non-Executive Directors
Jeremy Beeton 74 71 74 71Katie Bickerstaffe 78 69 78 69Sue Bruce 63 60 63 60Crawford Gillies 1 76 47 76 47Richard Gillingwater CBE 2 369 275 369 275Peter Lynas 79 75 79 75Helen Mahy 3 63 5 63 5Lord Smith of Kelvin 4 35 117 35 117
Overall Total 5,931 3,703
Notes:1 Crawford Gillies was appointed to the Board on 1 August 2015.2 Richard Gillingham CBE was appointed as Chairman on 23 July 2015.3 Helen Mahy was appointed to the Board on 1 March 2016.4 Lord Smith of Kelvin stepped down as Chairman on 23 July 2015 and was retained by SSE’s Executive Committee for a further year to provide advice and counsel on key business
issues relating to Scotland.5 SSE offers all staff a range of voluntary benefits some of which operate under a salary sacrifice arrangement. The salaries shown above is reported before any such adjustments are made.6 Benefits relate to company car, Share Incentive Plan company contributions and medical benefits. These benefits are non-pensionable. 7 The AIP figures above show the full value of the award before 33% was deferred in shares.8 The PSP awards due to vest in 2016 lapsed in full. The estimated value shown in the table above is based on the average share price in the three months to 31 March 2017 of £15.19p,
as is required by the reporting regulations. The awards remain subject to service until May 2017 and so the prior year comparative will be restated in next year’s report to show the actual value on vesting, as is required by the regulations.
9 The pension value represents the cash value of pension accrued over 1 year x a multiple of 20 (less director contributions) in line with statutory reporting requirements.10 Directors have not received any other items in the nature of remuneration other than as disclosed in the table.
Rationale for 2017 single total figureAs indicated on page 83 and shown in specific detail in the following sections, the financial and operational performance of the business has been strong in the context of the overall market conditions. As a result of this and the increases agreed to maximum AIP levels in 2016, the year-on-year increases in the above table are significant. This corporate performance is also reflected in the pay outcomes for wider employees with the average annual incentive paid increasing by around 11% compared to last year. In this context, the Committee is satisfied that the total single figure outcomes are appropriate and not excessive.
SalaryThe salaries shown in the table reflect a 2016/17 salary, effective from 1 April 2016 to 31 March 2017, of £844,104 for the Chief Executive and £652,424 for the Finance Director. This represented an increase of 2.4% from the previous year, which was in line with the average performance-based salary increase for the wider SSE employee population.
BenefitsBenefits are provided at an appropriate level taking into account market practice at similar sized companies and the level of benefits provided for other employees in the Company. Core benefits include car allowance, private medical insurance and health screening. The Executive Directors participate in the Company’s all-employee share schemes on the same terms as other employees.
PensionThe Executive Directors are members of either the Southern Electric Pension Scheme or the Scottish Hydro-Electric Pension Scheme and their plan membership predates their Board appointments. These are both funded final salary pension schemes and the terms of these schemes apply equally to all members. The Directors’ service contracts provide for a possible maximum pension of two thirds final salary from the age of 60. In relation to Executive Directors who are subject to the scheme-specific salary cap (which mirrors the provisions of the previous HMRC cap arrangements) the Company provides top-up (unfunded) arrangements which are designed to provide an equivalent pension on retirement from the age of 60 to that which they would have earned had they not been subject to the salary cap. From 1 April 2017 pensionable earnings will be capped at RPI +1%. These are legacy arrangements and would not be used for any new external appointments.
The Executive Directors, in common with all other employees who joined at the same time, have the following pension provisions relating to leaving the Company: for retirement through ill-health an unreduced pension based on service to expected retirement is paid; in the event of any reorganisation or redundancy an unreduced accrued pension is paid to a member who is aged 50 or above, with at least five years’ service or, for a member who has not yet reached that age, it will be payable with effect from 50; and from the age of 55, a scheme member is entitled to leave the Company and receive a pension, reduced for early payment, unless the Company gives consent and funds this pension on an unreduced basis.
Remuneration continued
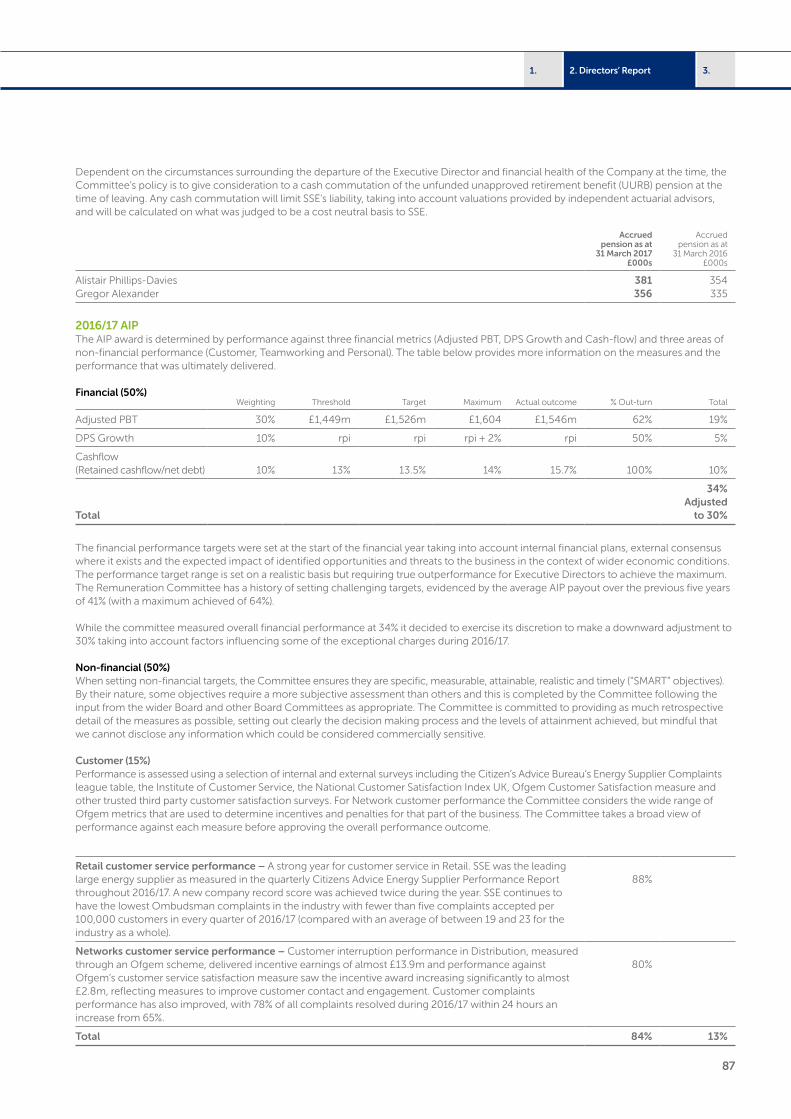
87
3.2. Directors’ Report1.
Dependent on the circumstances surrounding the departure of the Executive Director and financial health of the Company at the time, the Committee’s policy is to give consideration to a cash commutation of the unfunded unapproved retirement benefit (UURB) pension at the time of leaving. Any cash commutation will limit SSE’s liability, taking into account valuations provided by independent actuarial advisors, and will be calculated on what was judged to be a cost neutral basis to SSE.
Accrued pension as at
31 March 2017 £000s
Accrued pension as at
31 March 2016 £000s
Alistair Phillips-Davies 381 354Gregor Alexander 356 335
2016/17 AIP The AIP award is determined by performance against three financial metrics (Adjusted PBT, DPS Growth and Cash-flow) and three areas of non-financial performance (Customer, Teamworking and Personal). The table below provides more information on the measures and the performance that was ultimately delivered.
Financial (50%) Weighting Threshold Target Maximum Actual outcome % Out-turn Total
Adjusted PBT 30% £1,449m £1,526m £1,604 £1,546m 62% 19%
DPS Growth 10% rpi rpi rpi + 2% rpi 50% 5%
Cashflow (Retained cashflow/net debt) 10% 13% 13.5% 14% 15.7% 100% 10%
Total
34% Adjusted
to 30%
The financial performance targets were set at the start of the financial year taking into account internal financial plans, external consensus where it exists and the expected impact of identified opportunities and threats to the business in the context of wider economic conditions.The performance target range is set on a realistic basis but requiring true outperformance for Executive Directors to achieve the maximum. The Remuneration Committee has a history of setting challenging targets, evidenced by the average AIP payout over the previous five years of 41% (with a maximum achieved of 64%).
While the committee measured overall financial performance at 34% it decided to exercise its discretion to make a downward adjustment to 30% taking into account factors influencing some of the exceptional charges during 2016/17.
Non-financial (50%) When setting non-financial targets, the Committee ensures they are specific, measurable, attainable, realistic and timely (“SMART” objectives). By their nature, some objectives require a more subjective assessment than others and this is completed by the Committee following the input from the wider Board and other Board Committees as appropriate. The Committee is committed to providing as much retrospective detail of the measures as possible, setting out clearly the decision making process and the levels of attainment achieved, but mindful that we cannot disclose any information which could be considered commercially sensitive.
Customer (15%) Performance is assessed using a selection of internal and external surveys including the Citizen’s Advice Bureau’s Energy Supplier Complaints league table, the Institute of Customer Service, the National Customer Satisfaction Index UK, Ofgem Customer Satisfaction measure and other trusted third party customer satisfaction surveys. For Network customer performance the Committee considers the wide range of Ofgem metrics that are used to determine incentives and penalties for that part of the business. The Committee takes a broad view of performance against each measure before approving the overall performance outcome.
Retail customer service performance – A strong year for customer service in Retail. SSE was the leading large energy supplier as measured in the quarterly Citizens Advice Energy Supplier Performance Report throughout 2016/17. A new company record score was achieved twice during the year. SSE continues to have the lowest Ombudsman complaints in the industry with fewer than five complaints accepted per 100,000 customers in every quarter of 2016/17 (compared with an average of between 19 and 23 for the industry as a whole).
88%
Networks customer service performance – Customer interruption performance in Distribution, measured through an Ofgem scheme, delivered incentive earnings of almost £13.9m and performance against Ofgem’s customer service satisfaction measure saw the incentive award increasing significantly to almost £2.8m, reflecting measures to improve customer contact and engagement. Customer complaints performance has also improved, with 78% of all complaints resolved during 2016/17 within 24 hours an increase from 65%.
80%
Total 84% 13%
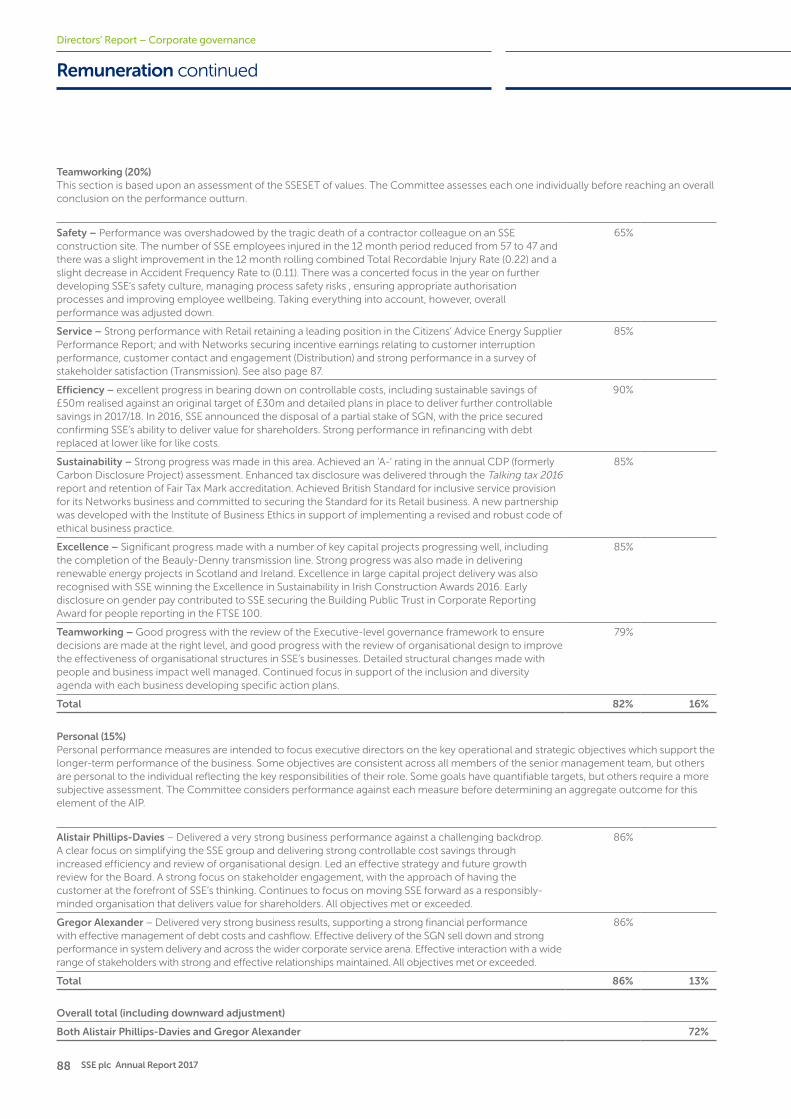
88 SSE plc Annual Report 2017
Directors’ Report – Corporate governance
Teamworking (20%) This section is based upon an assessment of the SSESET of values. The Committee assesses each one individually before reaching an overall conclusion on the performance outturn.
Safety – Performance was overshadowed by the tragic death of a contractor colleague on an SSE construction site. The number of SSE employees injured in the 12 month period reduced from 57 to 47 and there was a slight improvement in the 12 month rolling combined Total Recordable Injury Rate (0.22) and a slight decrease in Accident Frequency Rate to (0.11). There was a concerted focus in the year on further developing SSE’s safety culture, managing process safety risks , ensuring appropriate authorisation processes and improving employee wellbeing. Taking everything into account, however, overall performance was adjusted down.
65%
Service – Strong performance with Retail retaining a leading position in the Citizens’ Advice Energy Supplier Performance Report; and with Networks securing incentive earnings relating to customer interruption performance, customer contact and engagement (Distribution) and strong performance in a survey of stakeholder satisfaction (Transmission). See also page 87.
85%
Efficiency – excellent progress in bearing down on controllable costs, including sustainable savings of £50m realised against an original target of £30m and detailed plans in place to deliver further controllable savings in 2017/18. In 2016, SSE announced the disposal of a partial stake of SGN, with the price secured confirming SSE’s ability to deliver value for shareholders. Strong performance in refinancing with debt replaced at lower like for like costs.
90%
Sustainability – Strong progress was made in this area. Achieved an ‘A-‘ rating in the annual CDP (formerly Carbon Disclosure Project) assessment. Enhanced tax disclosure was delivered through the Talking tax 2016 report and retention of Fair Tax Mark accreditation. Achieved British Standard for inclusive service provision for its Networks business and committed to securing the Standard for its Retail business. A new partnership was developed with the Institute of Business Ethics in support of implementing a revised and robust code of ethical business practice.
85%
Excellence – Significant progress made with a number of key capital projects progressing well, including the completion of the Beauly-Denny transmission line. Strong progress was also made in delivering renewable energy projects in Scotland and Ireland. Excellence in large capital project delivery was also recognised with SSE winning the Excellence in Sustainability in Irish Construction Awards 2016. Early disclosure on gender pay contributed to SSE securing the Building Public Trust in Corporate Reporting Award for people reporting in the FTSE 100.
85%
Teamworking – Good progress with the review of the Executive-level governance framework to ensure decisions are made at the right level, and good progress with the review of organisational design to improve the effectiveness of organisational structures in SSE’s businesses. Detailed structural changes made with people and business impact well managed. Continued focus in support of the inclusion and diversity agenda with each business developing specific action plans.
79%
Total 82% 16%
Personal (15%) Personal performance measures are intended to focus executive directors on the key operational and strategic objectives which support the longer-term performance of the business. Some objectives are consistent across all members of the senior management team, but others are personal to the individual reflecting the key responsibilities of their role. Some goals have quantifiable targets, but others require a more subjective assessment. The Committee considers performance against each measure before determining an aggregate outcome for this element of the AIP.
Alistair Phillips-Davies – Delivered a very strong business performance against a challenging backdrop. A clear focus on simplifying the SSE group and delivering strong controllable cost savings through increased efficiency and review of organisational design. Led an effective strategy and future growth review for the Board. A strong focus on stakeholder engagement, with the approach of having the customer at the forefront of SSE’s thinking. Continues to focus on moving SSE forward as a responsibly-minded organisation that delivers value for shareholders. All objectives met or exceeded.
86%
Gregor Alexander – Delivered very strong business results, supporting a strong financial performance with effective management of debt costs and cashflow. Effective delivery of the SGN sell down and strong performance in system delivery and across the wider corporate service arena. Effective interaction with a wide range of stakeholders with strong and effective relationships maintained. All objectives met or exceeded.
86%
Total 86% 13%
Overall total (including downward adjustment)
Both Alistair Phillips-Davies and Gregor Alexander 72%
Remuneration continued
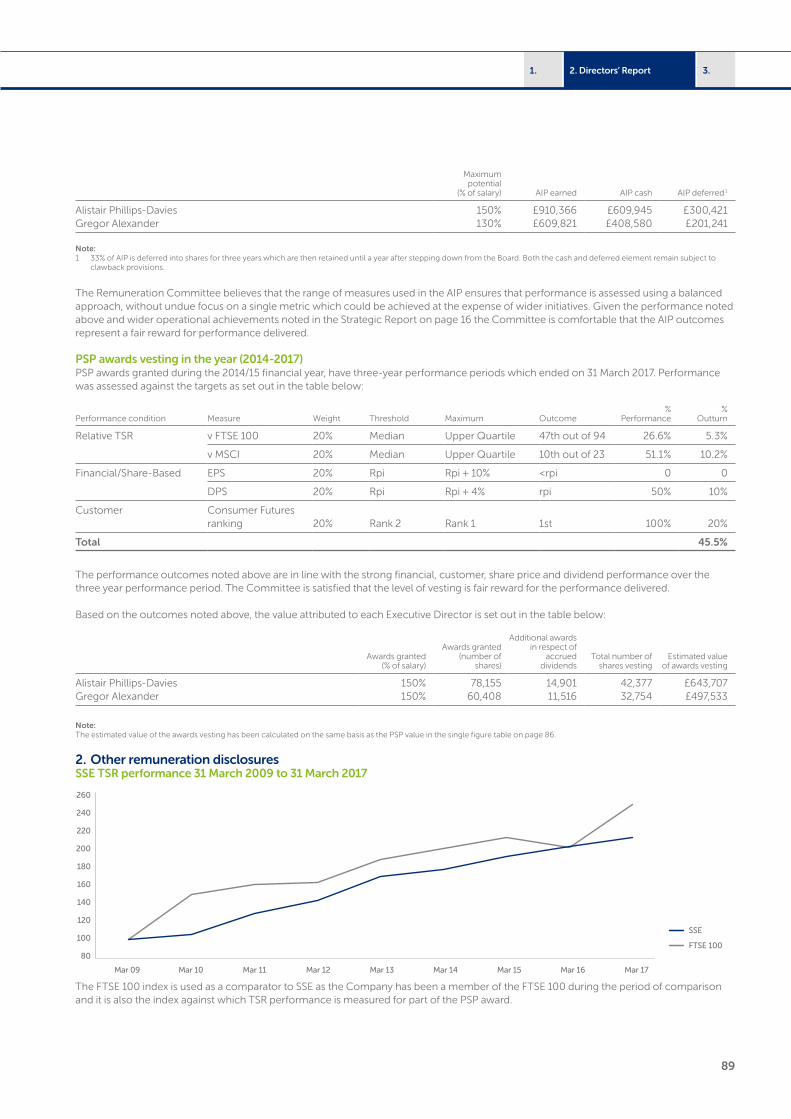
89
3.2. Directors’ Report1.
Maximum potential
(% of salary) AIP earned AIP cash AIP deferred 1
Alistair Phillips-Davies 150% £910,366 £609,945 £300,421Gregor Alexander 130% £609,821 £408,580 £201,241
Note:1 33% of AIP is deferred into shares for three years which are then retained until a year after stepping down from the Board. Both the cash and deferred element remain subject to
clawback provisions.
The Remuneration Committee believes that the range of measures used in the AIP ensures that performance is assessed using a balanced approach, without undue focus on a single metric which could be achieved at the expense of wider initiatives. Given the performance noted above and wider operational achievements noted in the Strategic Report on page 16 the Committee is comfortable that the AIP outcomes represent a fair reward for performance delivered.
PSP awards vesting in the year (2014-2017)PSP awards granted during the 2014/15 financial year, have three-year performance periods which ended on 31 March 2017. Performance was assessed against the targets as set out in the table below:
Performance condition Measure Weight Threshold Maximum Outcome%
Performance%
Outturn
Relative TSR v FTSE 100 20% Median Upper Quartile 47th out of 94 26.6% 5.3%
v MSCI 20% Median Upper Quartile 10th out of 23 51.1% 10.2%
Financial/Share-Based EPS 20% Rpi Rpi + 10% <rpi 0 0
DPS 20% Rpi Rpi + 4% rpi 50% 10%
Customer Consumer Futures ranking 20% Rank 2 Rank 1 1st 100% 20%
Total 45.5%
The performance outcomes noted above are in line with the strong financial, customer, share price and dividend performance over the three year performance period. The Committee is satisfied that the level of vesting is fair reward for the performance delivered.
Based on the outcomes noted above, the value attributed to each Executive Director is set out in the table below:
Awards granted(% of salary)
Awards granted(number of
shares)
Additional awards in respect of
accrued dividends
Total number of shares vesting
Estimated value of awards vesting
Alistair Phillips-Davies 150% 78,155 14,901 42,377 £643,707Gregor Alexander 150% 60,408 11,516 32,754 £497,533
Note:The estimated value of the awards vesting has been calculated on the same basis as the PSP value in the single figure table on page 86.
2. Other remuneration disclosuresSSE TSR performance 31 March 2009 to 31 March 2017
Mar 09 Mar 10 Mar 11 Mar 12 Mar 13 Mar 14 Mar 16
SSE
Mar 15 Mar 17
FTSE 10080
100
120
140
160
180
200
220
240
260
The FTSE 100 index is used as a comparator to SSE as the Company has been a member of the FTSE 100 during the period of comparison and it is also the index against which TSR performance is measured for part of the PSP award.
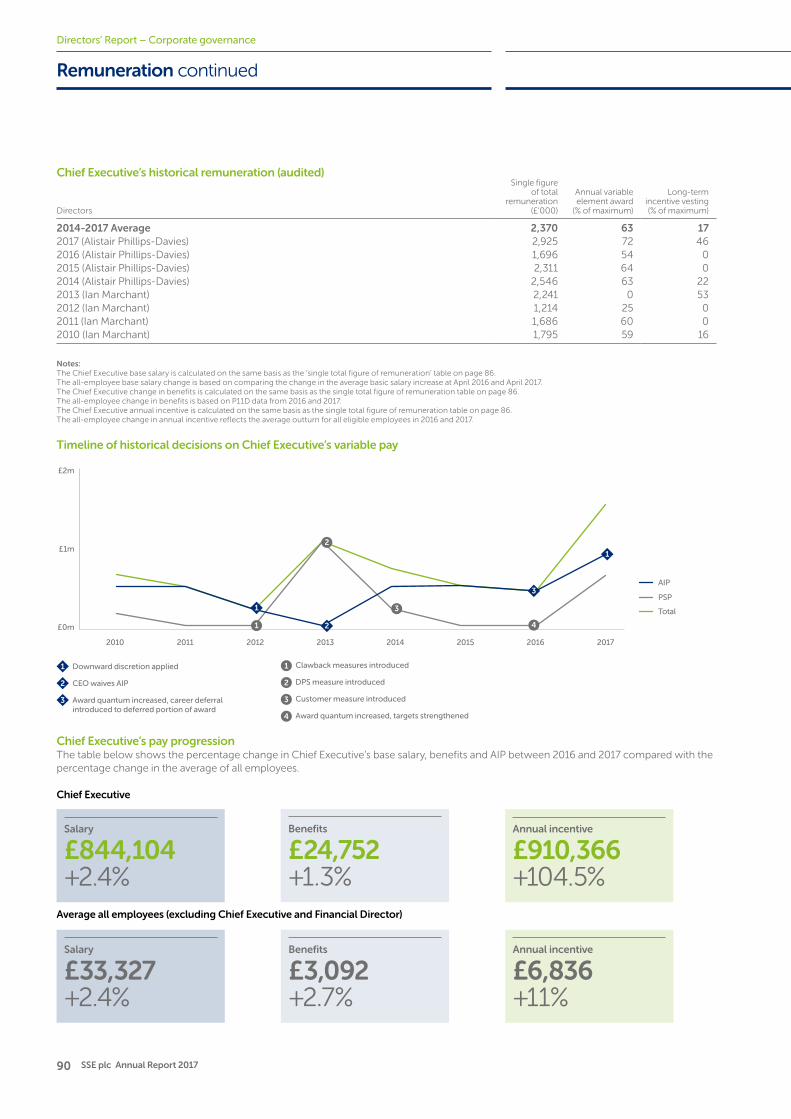
90 SSE plc Annual Report 2017
Directors’ Report – Corporate governance
Chief Executive’s historical remuneration (audited)
Directors
Single figure of total
remuneration (£’000)
Annual variable element award
(% of maximum)
Long-term incentive vesting (% of maximum)
2014-2017 Average 2,370 63 172017 (Alistair Phillips-Davies) 2,925 72 462016 (Alistair Phillips-Davies) 1,696 54 02015 (Alistair Phillips-Davies) 2,311 64 02014 (Alistair Phillips-Davies) 2,546 63 222013 (Ian Marchant) 2,241 0 532012 (Ian Marchant) 1,214 25 02011 (Ian Marchant) 1,686 60 02010 (Ian Marchant) 1,795 59 16
Notes: The Chief Executive base salary is calculated on the same basis as the ‘single total figure of remuneration’ table on page 86. The all-employee base salary change is based on comparing the change in the average basic salary increase at April 2016 and April 2017.The Chief Executive change in benefits is calculated on the same basis as the single total figure of remuneration table on page 86.The all-employee change in benefits is based on P11D data from 2016 and 2017. The Chief Executive annual incentive is calculated on the same basis as the single total figure of remuneration table on page 86.The all-employee change in annual incentive reflects the average outturn for all eligible employees in 2016 and 2017.
Timeline of historical decisions on Chief Executive’s variable pay
2010 2011 2012 2013 2014 2016
AIP
2015 2017
PSP
Total
£0m
£1m
£2m
3
2
1
1
2
3
4
1
1 Downward discretion applied
2 CEO waives AIP
3 Award quantum increased, career deferral introduced to deferred portion of award
1 Clawback measures introduced
2 DPS measure introduced
3 Customer measure introduced
4 Award quantum increased, targets strengthened
Chief Executive’s pay progressionThe table below shows the percentage change in Chief Executive’s base salary, benefits and AIP between 2016 and 2017 compared with the percentage change in the average of all employees.
Chief Executive
Salary
£844,104 +2.4%
Benefits
£24,752 +1.3%
Annual incentive
£910,366 +104.5%
Average all employees (excluding Chief Executive and Financial Director)
Salary
£33,327 +2.4%
Benefits
£3,092 +2.7%
Annual incentive
£6,836 +11%
Remuneration continued
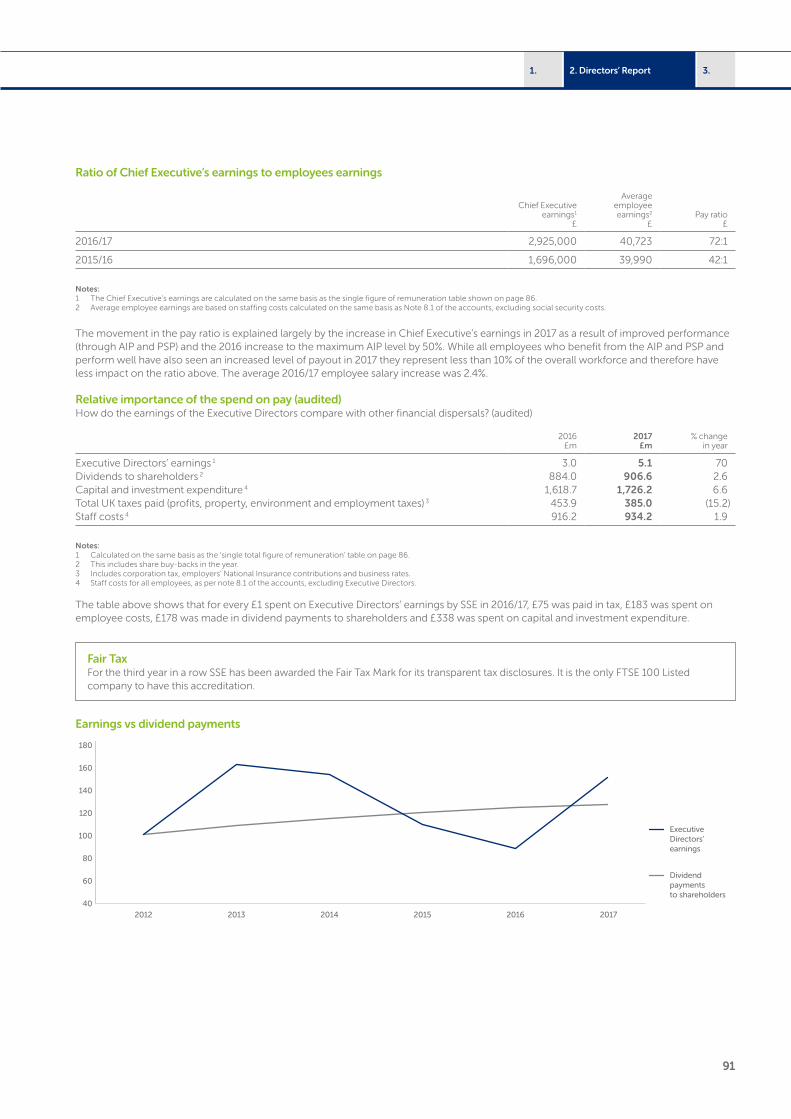
91
3.2. Directors’ Report1.
Ratio of Chief Executive’s earnings to employees earnings
Chief Executive earnings1
£
Average employee earnings2
£Pay ratio
£
2016/17 2,925,000 40,723 72:1
2015/16 1,696,000 39,990 42:1
Notes:1 The Chief Executive’s earnings are calculated on the same basis as the single figure of remuneration table shown on page 86. 2 Average employee earnings are based on staffing costs calculated on the same basis as Note 8.1 of the accounts, excluding social security costs.
The movement in the pay ratio is explained largely by the increase in Chief Executive’s earnings in 2017 as a result of improved performance (through AIP and PSP) and the 2016 increase to the maximum AIP level by 50%. While all employees who benefit from the AIP and PSP and perform well have also seen an increased level of payout in 2017 they represent less than 10% of the overall workforce and therefore have less impact on the ratio above. The average 2016/17 employee salary increase was 2.4%.
Relative importance of the spend on pay (audited)How do the earnings of the Executive Directors compare with other financial dispersals? (audited)
2016 £m
2017 £m
% change in year
Executive Directors’ earnings 1 3.0 5.1 70Dividends to shareholders 2 884.0 906.6 2.6Capital and investment expenditure 4 1,618.7 1,726.2 6.6Total UK taxes paid (profits, property, environment and employment taxes) 3 453.9 385.0 (15.2)Staff costs 4 916.2 934.2 1.9
Notes: 1 Calculated on the same basis as the ‘single total figure of remuneration’ table on page 86. 2 This includes share buy-backs in the year. 3 Includes corporation tax, employers’ National Insurance contributions and business rates.4 Staff costs for all employees, as per note 8.1 of the accounts, excluding Executive Directors.
The table above shows that for every £1 spent on Executive Directors’ earnings by SSE in 2016/17, £75 was paid in tax, £183 was spent on employee costs, £178 was made in dividend payments to shareholders and £338 was spent on capital and investment expenditure.
Fair Tax For the third year in a row SSE has been awarded the Fair Tax Mark for its transparent tax disclosures. It is the only FTSE 100 Listed company to have this accreditation.
Earnings vs dividend payments
2012 2013 2014 2015
Executive Directors’ earnings
20172016
Dividendpaymentsto shareholders
40
60
80
100
120
140
160
180
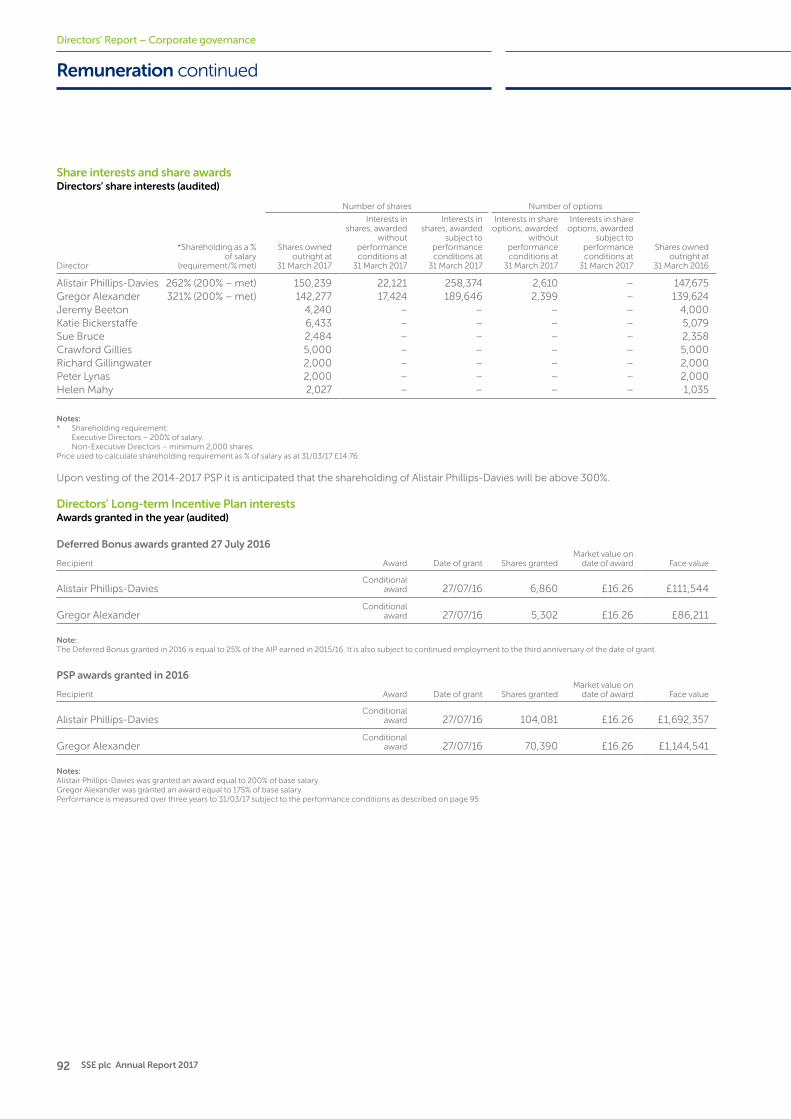
92 SSE plc Annual Report 2017
Directors’ Report – Corporate governance
Share interests and share awardsDirectors’ share interests (audited)
Number of shares Number of options
Director
*Shareholding as a % of salary
(requirement/% met)
Shares owned outright at
31 March 2017
Interests in shares, awarded
without performance conditions at
31 March 2017
Interests in shares, awarded
subject to performance conditions at
31 March 2017
Interests in share options, awarded
without performance conditions at
31 March 2017
Interests in share options, awarded
subject to performance conditions at
31 March 2017
Shares owned outright at
31 March 2016
Alistair Phillips-Davies 262% (200% – met) 150,239 22,121 258,374 2,610 – 147,675Gregor Alexander 321% (200% – met) 142,277 17,424 189,646 2,399 – 139,624Jeremy Beeton 4,240 – – – – 4,000Katie Bickerstaffe 6,433 – – – – 5,079Sue Bruce 2,484 – – – – 2,358Crawford Gillies 5,000 – – – – 5,000Richard Gillingwater 2,000 – – – – 2,000Peter Lynas 2,000 – – – – 2,000Helen Mahy 2,027 – – – – 1,035
Notes:* Shareholding requirement: Executive Directors – 200% of salary. Non-Executive Directors – minimum 2,000 shares.Price used to calculate shareholding requirement as % of salary as at 31/03/17 £14.76.
Upon vesting of the 2014-2017 PSP it is anticipated that the shareholding of Alistair Phillips-Davies will be above 300%.
Directors’ Long-term Incentive Plan interestsAwards granted in the year (audited)
Deferred Bonus awards granted 27 July 2016
Recipient Award Date of grant Shares grantedMarket value on
date of award Face value
Alistair Phillips-DaviesConditional
award 27/07/16 6,860 £16.26 £111,544
Gregor AlexanderConditional
award 27/07/16 5,302 £16.26 £86,211
Note:The Deferred Bonus granted in 2016 is equal to 25% of the AIP earned in 2015/16. It is also subject to continued employment to the third anniversary of the date of grant.
PSP awards granted in 2016
Recipient Award Date of grant Shares grantedMarket value on
date of award Face value
Alistair Phillips-DaviesConditional
award 27/07/16 104,081 £16.26 £1,692,357
Gregor AlexanderConditional
award 27/07/16 70,390 £16.26 £1,144,541
Notes:Alistair Phillips-Davies was granted an award equal to 200% of base salary.Gregor Alexander was granted an award equal to 175% of base salary.Performance is measured over three years to 31/03/17 subject to the performance conditions as described on page 95.
Remuneration continued
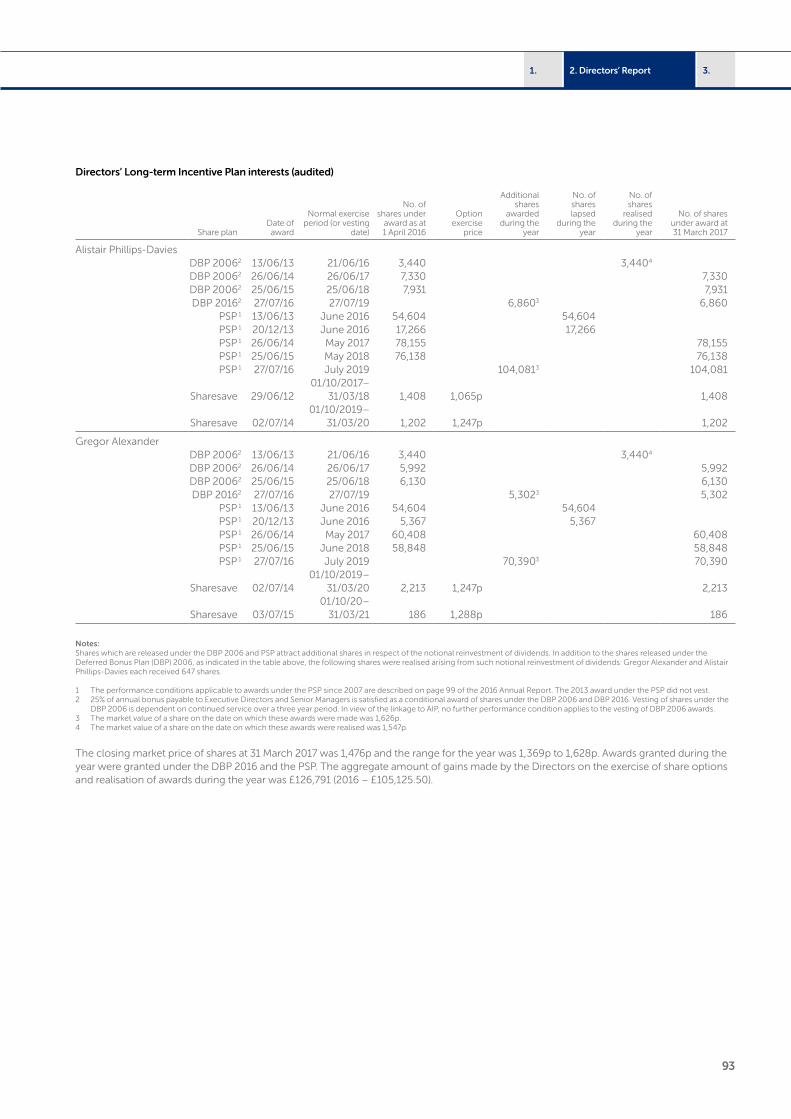
93
3.2. Directors’ Report1.
Directors’ Long-term Incentive Plan interests (audited)
Share planDate of award
Normal exercise period (or vesting
date)
No. of shares under
award as at 1 April 2016
Option exercise
price
Additional shares
awarded during the
year
No. of shares lapsed
during the year
No. of shares
realised during the
year
No. of shares under award at 31 March 2017
Alistair Phillips-DaviesDBP 20062 13/06/13 21/06/16 3,440 3,4404
DBP 20062 26/06/14 26/06/17 7,330 7,330DBP 20062 25/06/15 25/06/18 7,931 7,931DBP 20162 27/07/16 27/07/19 6,8603 6,860
PSP 1 13/06/13 June 2016 54,604 54,604PSP 1 20/12/13 June 2016 17,266 17,266PSP 1 26/06/14 May 2017 78,155 78,155PSP 1 25/06/15 May 2018 76,138 76,138PSP 1 27/07/16 July 2019 104,0813 104,081
Sharesave 29/06/1201/10/2017–
31/03/18 1,408 1,065p 1,408
Sharesave 02/07/1401/10/2019–
31/03/20 1,202 1,247p 1,202
Gregor AlexanderDBP 20062 13/06/13 21/06/16 3,440 3,4404
DBP 20062 26/06/14 26/06/17 5,992 5,992DBP 20062 25/06/15 25/06/18 6,130 6,130DBP 20162 27/07/16 27/07/19 5,3023 5,302
PSP 1 13/06/13 June 2016 54,604 54,604PSP 1 20/12/13 June 2016 5,367 5,367PSP 1 26/06/14 May 2017 60,408 60,408PSP 1 25/06/15 June 2018 58,848 58,848PSP 1 27/07/16 July 2019 70,3903 70,390
Sharesave 02/07/1401/10/2019–
31/03/20 2,213 1,247p 2,213
Sharesave 03/07/1501/10/20–
31/03/21 186 1,288p 186
Notes:Shares which are released under the DBP 2006 and PSP attract additional shares in respect of the notional reinvestment of dividends. In addition to the shares released under the Deferred Bonus Plan (DBP) 2006, as indicated in the table above, the following shares were realised arising from such notional reinvestment of dividends: Gregor Alexander and Alistair Phillips-Davies each received 647 shares.
1 The performance conditions applicable to awards under the PSP since 2007 are described on page 99 of the 2016 Annual Report. The 2013 award under the PSP did not vest.2 25% of annual bonus payable to Executive Directors and Senior Managers is satisfied as a conditional award of shares under the DBP 2006 and DBP 2016. Vesting of shares under the
DBP 2006 is dependent on continued service over a three year period. In view of the linkage to AIP, no further performance condition applies to the vesting of DBP 2006 awards.3 The market value of a share on the date on which these awards were made was 1,626p.4 The market value of a share on the date on which these awards were realised was 1,547p.
The closing market price of shares at 31 March 2017 was 1,476p and the range for the year was 1,369p to 1,628p. Awards granted during the year were granted under the DBP 2016 and the PSP. The aggregate amount of gains made by the Directors on the exercise of share options and realisation of awards during the year was £126,791 (2016 – £105,125.50).
94 SSE plc Annual Report 2017
Directors’ Report – Corporate governance
External appointments (audited)Executive Directors are able to accept a non-Executive appointment outside the Company with the consent of the Board, as such appointments can enhance Directors’ experience and value to the Company. Any fees received are retained by the Director. Gregor Alexander is a non-Executive Director with Stagecoach Group plc during 2016 and received £59,700 in fees. Gregor Alexander is also Chairman of Scotia Gas Networks and receives no additional fees for this.
Payments for loss of office and payments to past Directors There were no payments for loss of office or to former Directors during the year.
3. GovernanceThe Remuneration Committee The members of the Committee and the meetings attended is set out on page 80.
The terms of reference for the Committee are available on the Company’s website http://sse.com/media/276013/tofr_remunerationcommitteenov14.pdf. In summary, the Committee determines and agrees with the Board, the Company’s framework and policy for executive remuneration including setting remuneration for all Executive Directors, the Company Chairman and Company Secretary. The Committee also monitors the level and structure of remuneration across the senior management team.
During the year the Committee met 3 times where it considered the following:
Meeting Date Agenda Items
May 2016 AGM season overview, AIP and PSP performance discussions, below-board remuneration, 2015/16 DRR, clawback and malus review, remuneration advisors annual performance review, draft agenda items for 2016/17.
November 2016 Appointment of new remuneration advisor, executive remuneration governance review, mid-year performance update.
March 2017 AIP and PSP performance update, 2016/17 draft DRR, chairman fee and Executive Director base salary reviews, below-board pay, 2017/18 planning.
Advice to the Committee The Chief Executive, the Director of Human Resources and Head of Reward advised the Committee on certain remuneration matters for the Executive Directors and senior executives although they were not present for any discussions on their own remuneration.
The Director of Human Resources and Head of Reward advised on HR strategy and the application of HR policies across the wider organisation.
During the year the Committee undertook a comprehensive retendering process for external advisors. As a result, FIT Remuneration Consultants LLP (FIT) were appointed as the Committee’s independent advisors in November 2016. Until FIT’s appointment Deloitte LLP acted as the Committee’s advisors. Both advisors have provided a range of information to the Committee which included market data drawn from published surveys, governance developments and their application to the Company, advice on remuneration disclosures and regulations and comparator group pay. FIT and Deloitte received fees of £33,578 and £35,520 respectively in relation to their work for the Committee, calculated on a time and materials basis. Both FIT and Deloitte are founding members of, and adhere to, the Remuneration Consultants’ Group Code of Conduct. The Code defines the roles of consultants, including the requirement to have due regard to the organisation’s strategy, financial situation, pay philosophy, the Board’s statutory duties and the views of investors and other stakeholders. The Committee reviews the advisers’ performance annually to determine that it is satisfied with the quality, relevance, objectivity and independence of advice being provided. FIT provides no other services to the Company.
Morgan Stanley and Co International Plc provided analysis on comparator performance, but did not receive fees specifically for these services as they are retained as SSE’s brokers.
Freshfields LLP also provided advice on legal matters, such as share plan rules, during the year.
Evaluation The external Board evaluation process which was carried out during the year confirmed the Remuneration Committee continued to operate effectively. Details of the evaluation process are set out on pages 64 and 65.
Remuneration continued
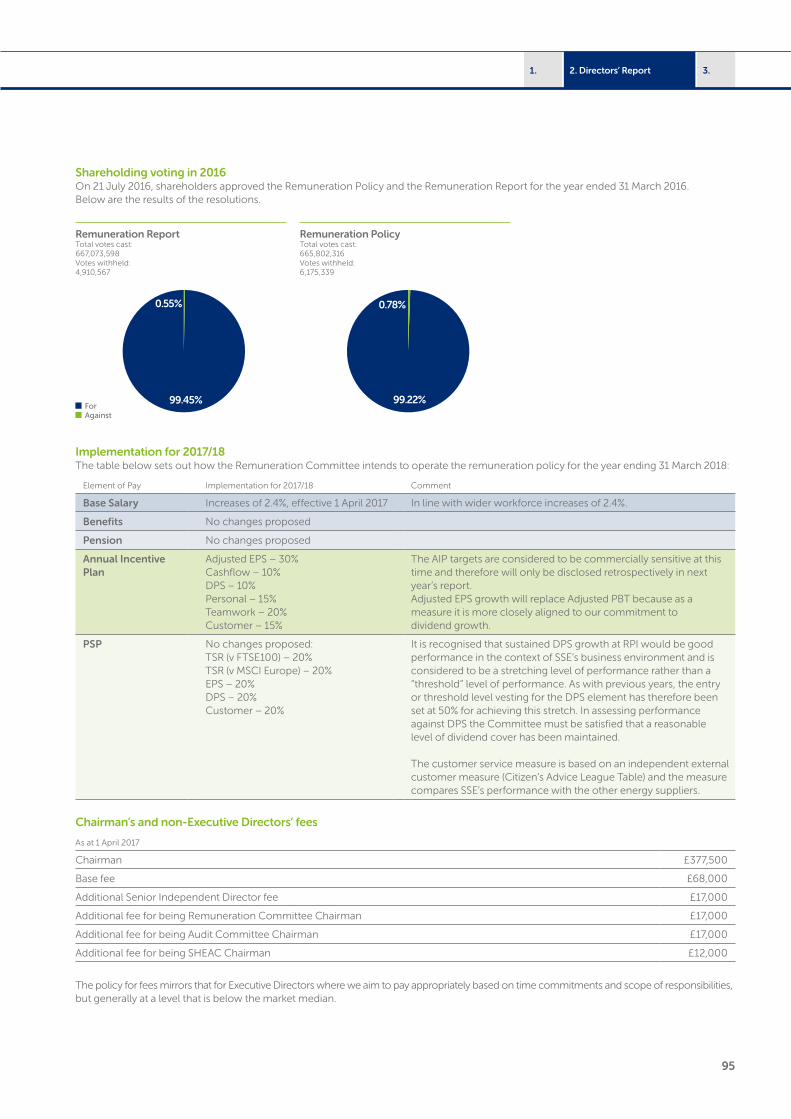
95
3.2. Directors’ Report1.
Shareholding voting in 2016On 21 July 2016, shareholders approved the Remuneration Policy and the Remuneration Report for the year ended 31 March 2016. Below are the results of the resolutions.
0.55%
99.45%
0.78%
99.22%
Remuneration ReportTotal votes cast:667,073,598Votes withheld: 4,910,567
Remuneration PolicyTotal votes cast: 665,802,316Votes withheld: 6,175,339
For Against
Implementation for 2017/18The table below sets out how the Remuneration Committee intends to operate the remuneration policy for the year ending 31 March 2018:
Element of Pay Implementation for 2017/18 Comment
Base Salary Increases of 2.4%, effective 1 April 2017 In line with wider workforce increases of 2.4%.
Benefits No changes proposed
Pension No changes proposed
Annual Incentive Plan
Adjusted EPS – 30%Cashflow – 10%DPS – 10%Personal – 15%Teamwork – 20%Customer – 15%
The AIP targets are considered to be commercially sensitive at this time and therefore will only be disclosed retrospectively in next year’s report.Adjusted EPS growth will replace Adjusted PBT because as a measure it is more closely aligned to our commitment to dividend growth.
PSP No changes proposed:TSR (v FTSE100) – 20%TSR (v MSCI Europe) – 20%EPS – 20%DPS – 20%Customer – 20%
It is recognised that sustained DPS growth at RPI would be good performance in the context of SSE’s business environment and is considered to be a stretching level of performance rather than a “threshold” level of performance. As with previous years, the entry or threshold level vesting for the DPS element has therefore been set at 50% for achieving this stretch. In assessing performance against DPS the Committee must be satisfied that a reasonable level of dividend cover has been maintained.
The customer service measure is based on an independent external customer measure (Citizen’s Advice League Table) and the measure compares SSE’s performance with the other energy suppliers.
Chairman’s and non-Executive Directors’ fees
As at 1 April 2017
Chairman £377,500
Base fee £68,000
Additional Senior Independent Director fee £17,000
Additional fee for being Remuneration Committee Chairman £17,000
Additional fee for being Audit Committee Chairman £17,000
Additional fee for being SHEAC Chairman £12,000
The policy for fees mirrors that for Executive Directors where we aim to pay appropriately based on time commitments and scope of responsibilities, but generally at a level that is below the market median.
96 SSE plc Annual Report 2017
Directors’ Report – Corporate governance
The Chairman’s fee is determined by the Remuneration Committee. The fees for non-Executive Directors are a matter for the Chairman and Executive Directors. Care is taken to ensure no director is present when their own remuneration is discussed.
As highlighted as an action in last year’s report, time was taken during the 2016/17 year to review the Chairman’s and non-Executive Directors’ fee levels. The Committee and Board as a whole, are aware that fee increases in recent years have not kept pace with the increasing time demands required for each role. The increased time commitments reflect the ever growing level of regulation and compliance. The review further highlighted that the fee levels were considerably lower than those of other companies of a similar size and complexity. A decision was therefore taken to increase fee levels effective from 1 January 2017. The new levels remain considerably below the market median but are felt to be appropriately positioned in line with our stated policy.
Summary of Directors’ Remuneration PolicyFor ease of reference we have set out below a summary of the Remuneration Policy (the “Policy”) which was approved by shareholders at SSE’s AGM on 21 July 2016 and applies, in the normal course of events, for a period of three years. The full policy report is available on the Company’s website at http://sse.com/media/404875/sse_AnnualReport.pdf.
Element of remuneration Link to strategy Framework (Operation and maximum opportunity) Performance measures
Base Salary Supports the retention and recruitment of Executive Directors of the calibre required to develop the Company’s strategy.
Normally reviewed annually with changes effective from 1 April.
No maximum salary level, but salary increases will normally be in line with the typical level of increase awarded to other employees in the Company.
Broad review of performance is included in the annual review process.
Benefits To provide a market-competitive level of benefits for Executive Directors.
Benefits currently provided are: – Core benefits – car allowance, private
medical insurance and health screening. – All-employee share plans. – Relocation – additional reasonable
benefits as necessary.
The cost will depend on the cost to the Company of providing individual items.
Not applicable.
Pension The pension provision is consistent with the long-term goals and horizons of the business.
Funded final salary and top-up unfunded arrangements (“UURBS”) up to the maximum pension of two-thirds of final salary, normally at age 60.
From 1 April 2017, future pensionable pay increases capped at RPI + 1%.
Alternative pension provisions may operate for new appointments to the Board.
Not applicable.
Annual Incentive Plan (AIP)
Reward Executive Directors’ for achievement of annual performance targets linked to SSE’s strategy and core purpose.
Maximum annual incentive opportunity is 150% of base salary for the Chief Executive and 130% of base salary for the Finance Director.
Award delivered: – 67% in cash; and – 33% in a career share award.
Career share awards vest after three years (with accrual of dividends). The after-tax number of shares are retained until the first anniversary of the cessation of the Executive Director’s employment.
Subject to malus and clawback provisions.
Based on a mix of financial and strategic performance measures.
A minimum of 50% of the annual incentive will be based on financial performance.
The strategic performance will normally include matters such as safety, customer service in the Retail and Networks divisions and investment decision-making and execution, as well as the personal performance of the Executive Directors.
Remuneration continued
97
3.2. Directors’ Report1.
Element of remuneration Link to strategy Framework (Operation and maximum opportunity) Performance measures
Performance Share Plan (PSP)
Reward Executive Directors, for delivering sustained success and align interests with those of the shareholders.
Maximum annual award of 200% of base salary for the Chief Executive and 175% of base salary for the Finance Director.
Awards normally vest based on performance over a period of three years (with accrual of dividends).
Post-tax number of shares vesting will be subject to an additional two year holding period.
Subject to malus and clawback provisions.
Awards vest based on relative total shareholder return, financial based measures and customer satisfaction.
At least 70% of the award will be based on financial and relative total shareholder return measures.
Targets set each year to ensure they are stretching and represent value creation for shareholders.
Share ownership policy
Aligns the interests of Executive Directors with those of shareholders.
Executive Directors are expected to maintain a shareholding equivalent to two times base salary.
Normally built up via shares vesting through the PSP, deferred shares from the AIP and all employee share schemes.
Vested career shares may also count towards the Executive Director’s shareholding.
Not applicable.
Chairman’s and non-Executive Directors’ fees
Reward for undertaking the role and are sufficient to attract and retain individuals with the calibre and experience to contribute effectively at Board level.
Fees are reviewed at appropriate intervals against companies of a similar size and complexity.
The fee structure may be made of: – a basic Board fee or Chairman’s fee; – an additional fee for any committee
chairmanship or membership; and – an additional fee for further responsibilities
e.g. Senior Independent Director, or periods of increased activity.
The aggregate level of non-Executive Directors’ fees shall not exceed the maximum limit set out in the Articles of Association.
All non-Executive Directors should build up a minimum of 2,000 shares in the Company.
Not applicable.
Further information on policyThe full policy approved by shareholders at the 2016 AGM is set out in last year’s Directors’ Remuneration Report and includes further information on:
– loss of office; – recruitment; – recovery provisions (clawback and malus); – committee discretions; – legacy commitments; – Directors’ service contracts and non-Executive Directors’ letters of appointment; – shareholders’ views; – remuneration engagement across the Company; and – illustration of the remuneration policy.
This report was approved by the Board and signed on its behalf by:
Katie BickerstaffeRemuneration Committee Chairman 16 May 2017
98 SSE plc Annual Report 2017
Directors’ Report – Corporate governance
Other statutory information
Directors’ ReportThe Directors submit their Annual Report and Accounts for SSE plc, together with the consolidated Financial Statements of the SSE group of companies, for the year ended 31 March 2017.
The Strategic Report is set out on pages 1 to 53 and the Directors’ Report is set out on pages 54 to 104. The Strategic Report and the Directors’ Report together constitute the management report as required under Rule 4.1.8R of the Disclosure Guidance and Transparency Rules. As permitted by the Companies Act 2006, the Directors’ Report includes the disclosures in the Strategic Report on:
– An indication of likely future development in the business of the Company see pages 1 to 53.
– Greenhouse gas emissions on pages 18 to 19.
– Employment of disabled people on page 22.
– Employee involvement on pages 20 to 22. – A summary of the principal risks facing
the Company on pages 24 to 27.
Results and dividendsThe Group’s results and performance highlights for the year are set out on page 1. An interim dividend of 27.4p per Ordinary Share was paid on 17 March 2017. The Directors propose a final dividend of 63.9p per Ordinary Share. Subject to approval at the 2017 AGM, the final dividend will be paid on 22 September 2017 to shareholders on the Register of Members at close of business on 28 July 2017. The company operates a Scrip Dividend Scheme.
Share capitalThe Company has a single share class which is divided into Ordinary Shares of 50 pence each. The issued share capital of the Company as at 31 March 2017, together with details of any changes during the year, is set out in Note 22 to the Financial Statements. As at 16 May 2017, the issued share capital of the Company consisted of 1,011,111,781 Ordinary Shares.
The Company was authorised at the 2016 AGM to allot up to 335,865,605 Ordinary Shares, representing one-third of its issued share capital. A renewal of this authority will be proposed at the 2017 AGM.
The Company was authorised at the 2016 AGM to allot up to 50,379,840 Ordinary Shares (representing 5% of the issued share capital) for cash without first offering them to existing shareholders in proportion to their holding. A renewal of this authority will be proposed at the 2017 AGM.
Substantial shareholdingsAs at 16 May 2017 (being the last practical date prior to the publication of the Annual Report) the Company has been notified under Rule 5 of the Disclosure Guidance and Transparency Rules of the interests in its shares as shown in the table above.
Authority to purchase sharesAt the 2016 AGM, the Company obtained shareholders approval to purchase up to 100,759,681 of its own ordinary shares (representing 10% of its issued share capital) up until the earlier of the conclusion of the 2017 AGM and close of business on 30 September 2017.
The Company announced that it had commenced a discretionary programme to purchase up to £500m of its shares for cancellation or to be held in treasury, during the period commencing on 11 November 2016 and ending no later than 31 December 2017.
Between 11 November 2016 and 31 March 2017, the Company purchased 8,898,023 ordinary shares with a notional cost of £4,449,011.50 and an aggregate consideration of £130,731,941 under the discretionary programme. The 8,898,023 shares purchased represent 0.88% of the issued share capital as at 31 March 2017. Between the 1 April 2017 and 16 May 2017 (being the last practical date prior to the publication of the Annual Report), the Company purchased a further 4,491,990 ordinary shares with a notional cost of £2,245,995 and an aggregate consideration of £64,999,993 under the discretionary programme. The 4,491,990 shares purchased represent 0.44% of the issued share capital as at 16 May 2017. All shares purchased during the year and up to 16 May 2017 were cancelled.
The Directors will, again, seek renewal of their authority to purchase in the market the Company’s own shares at the 2017 AGM. Further details are provided in the Notice of Annual General Meeting for 2017.
Accounting policies, financial instruments and riskDetails of the Group’s accounting policies, together with details of financial instruments and risk, are provided in Note 24 to the Financial Statements and Supplementary Information, A6 to A8.
Indemnification of Directors and insuranceThe Directors have the benefit of the indemnity provision contained in the Company’s Articles of Association. They also have been granted a qualifying third party indemnity provision which was in force throughout the financial year and remains in force. The Company also purchased and maintained throughout the financial year Directors’ and Officers’ liability insurance in respect of itself and for its Directors and Officers.
Research and developmentSSE is involved in a range of innovative projects and programmes which are designed to progressively transform the energy system. A numbers of these projects and programmes are referred to in the Strategic Report in pages 1 to 53.
Political donations and expenditureSSE operates on a politically neutral basis and does not make any donations to political parties, political organisations or independent election candidates. During the year, no political expenditure was incurred and no political donations were made by the Group.
Related party transactionsRelated party transactions are set out in Supplementary Information, A5 on page 176.
Annual General Meeting (AGM)The AGM will be held on 20 July 2017 at 12 noon at the Perth Concert Hall, Mill Street, Perth PH1 5HZ. Details of the resolutions to be proposed are set out in a separate Notice of Meeting which accompanies this report for shareholders receiving hard copy documents and which is available at sse.com for those who elected to receive documents electronically.
EntityNumber of
shares* Percentage*Nature of
holding
The Capital Group Companies, Inc. 150,096,415 14.75% Indirect
BlackRock, Inc. 65,483,121 6.47% Indirect
UBS Investment Bank 52,003,155 5.17% Indirect
Invesco Limited 45,775,918 4.69% Indirect
* At date of disclosure by relevant entity.
99
3.2. Directors’ Report1.
Additional informationWhere not provided elsewhere in the Directors’ Report, the following provides the information required to be disclosed by Section 992 of the Companies Act 2006.
Each Ordinary Share of the Company carries one vote at general meetings of the Company. There are no restrictions on the transfer of Ordinary Shares in the capital of the Company other than certain restrictions which may from time-to-time be imposed by law.
A shareholder entitled to attend, speak and vote at a general meeting may exercise their right to vote in person, by proxy, or in relation to corporate members, by corporate representatives. To be valid, notification of the appointment of a proxy must be received not less than 48 hours before the general meeting at which the person named in the proxy notice proposes to vote. The Directors may in their discretion determine that in calculating the 48 hour period, no account be taken of any part of a day which is not a working day.
Employees who participate in the Share Incentive Plan whose shares remain in the schemes’ trusts give directions to the trustees to vote on their behalf by way of a Form of Direction.
The Company is not aware of any agreements between shareholders that may result in restrictions on the transfer of securities and/or voting rights.
The Company’s Articles of Association were adopted at the 2010 AGM, and may only be amended by a special resolution at a general meeting of shareholders.
The rules governing the appointment and replacement of Directors are set out in the Company’s Articles of Association.
The Company is not aware of any significant agreements to which it is party that take effect, alter or terminate upon a change of control of the Company following a takeover.
Each of the Directors who held office at the date of approval of this Directors’ Report confirms that, so far as each Director is aware, there is no relevant audit information of which the Company’s Auditors are unaware and each Director has taken all the steps that ought to have been taken in his or her duty as a Director to make himself or herself aware of any relevant audit information and to establish that the Company’s Auditors are aware of that information.
The Directors’ Report set out on pages 54 to 104 has been approved by the Board of Directors in accordance with the Companies Act 2006.
Disclosures required under Listing Rule 9.8.4RThe Company is required to disclose certain information under Listing Rule 9.8.4R in the Directors’ Report or advise where such relevant information is contained. The other information that may be relevant to the Directors’ Report can be found in the following sections of the 2017 Annual Report and Accounts:
No. Information required by LR9.8.4R Page Reference
1. Statement of amount of interest capitalised by the Group during the financial year
129 to 130
2. Details of any long-term incentive schemes 80 to 97
By order of the Board
Sally FairbairnCompany Secretary16 May 2017
100 SSE plc Annual Report 2017
3.2. Directors’ Report1.
Directors’ Report – Corporate governance
Statement of Directors’ responsibilities
Statement of Directors’ responsibilities in respect of the Annual Report and the Financial Statements The Directors are responsible for preparing the Annual Report and the group and parent company financial statements in accordance with applicable law and regulations.
Company law requires the Directors to prepare group and parent company financial statements for each financial year. Under that law they are required to prepare the group financial statements in accordance with IFRSs as adopted by the EU and applicable law and have elected to prepare the parent company financial statements in accordance with UK Accounting Standards, including FRS 101 Reduced Disclosure Framework.
Under company law the Directors must not approve the financial statements unless they are satisfied that they give a true and fair view of the state of affairs of the group and parent company and of their profit or loss for that period. In preparing each of the group and parent company financial statements, the directors are required to:
– select suitable accounting policies and then apply them consistently; – make judgements and estimates that are reasonable and prudent; – for the group financial statements, state whether they have been prepared in accordance with IFRSs as adopted by the EU; – for the parent company financial statements, state whether applicable UK Accounting Standards have been followed, subject to any
material departures disclosed and explained in the parent company financial statements; and – prepare the financial statements on the going concern basis unless it is inappropriate to presume that the group and the parent company
will continue in business.
The Directors are responsible for keeping adequate accounting records that are sufficient to show and explain the parent company’s transactions and disclose with reasonable accuracy at any time the financial position of the parent company and enable them to ensure that its financial statements comply with the Companies Act 2006. They have general responsibility for taking such steps as are reasonably open to them to safeguard the assets of the group and to prevent and detect fraud and other irregularities.
Under applicable law and regulations, the directors are also responsible for preparing a Strategic Report, Directors’ Report, Directors’ Remuneration Report and Corporate Governance Statement that complies with that law and those regulations.
The Directors are responsible for the maintenance and integrity of the corporate and financial information included on the company’s website. Legislation in the UK governing the preparation and dissemination of financial statements may differ from legislation in other jurisdictions.
Responsibility statement of the directors in respect of the annual financial reportWe confirm that to the best of our knowledge:
– the financial statements, prepared in accordance with the applicable set of accounting standards, give a true and fair view of the assets, liabilities, financial position and profit or loss of the company and the undertakings included in the consolidation taken as a whole; and
– the strategic report includes a fair review of the development and performance of the business and the position of the issuer and the undertakings included in the consolidation taken as a whole, together with a description of the principal risks and uncertainties that they face.
We consider the annual report and accounts, taken as a whole, is fair, balanced and understandable and provides the information necessary for shareholders to assess the group’s position and performance, business model and strategy.
Alistair Phillips-DaviesChief Executive
Gregor AlexanderFinance Director
16 May 2017
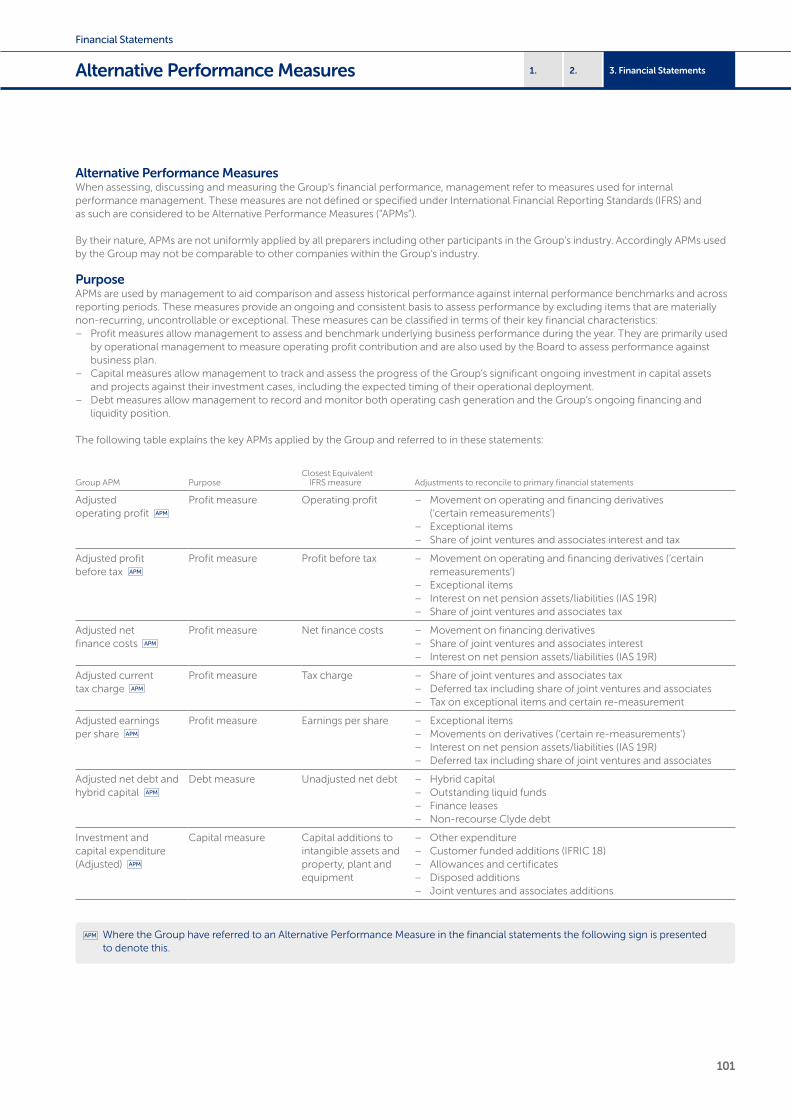
101
3. Financial Statements2.1.Alternative Performance Measures
Alternative Performance MeasuresWhen assessing, discussing and measuring the Group’s financial performance, management refer to measures used for internal performance management. These measures are not defined or specified under International Financial Reporting Standards (IFRS) and as such are considered to be Alternative Performance Measures (“APMs”).
By their nature, APMs are not uniformly applied by all preparers including other participants in the Group’s industry. Accordingly APMs used by the Group may not be comparable to other companies within the Group’s industry.
PurposeAPMs are used by management to aid comparison and assess historical performance against internal performance benchmarks and across reporting periods. These measures provide an ongoing and consistent basis to assess performance by excluding items that are materially non-recurring, uncontrollable or exceptional. These measures can be classified in terms of their key financial characteristics:
– Profit measures allow management to assess and benchmark underlying business performance during the year. They are primarily used by operational management to measure operating profit contribution and are also used by the Board to assess performance against business plan.
– Capital measures allow management to track and assess the progress of the Group’s significant ongoing investment in capital assets and projects against their investment cases, including the expected timing of their operational deployment.
– Debt measures allow management to record and monitor both operating cash generation and the Group’s ongoing financing and liquidity position.
The following table explains the key APMs applied by the Group and referred to in these statements:
Group APM PurposeClosest Equivalent
IFRS measure Adjustments to reconcile to primary financial statements
Adjusted operating profit
Profit measure Operating profit – Movement on operating and financing derivatives (‘certain remeasurements’)
– Exceptional items – Share of joint ventures and associates interest and tax
Adjusted profit before tax
Profit measure Profit before tax – Movement on operating and financing derivatives (‘certain remeasurements’)
– Exceptional items – Interest on net pension assets/liabilities (IAS 19R) – Share of joint ventures and associates tax
Adjusted net finance costs
Profit measure Net finance costs – Movement on financing derivatives – Share of joint ventures and associates interest – Interest on net pension assets/liabilities (IAS 19R)
Adjusted current tax charge
Profit measure Tax charge – Share of joint ventures and associates tax – Deferred tax including share of joint ventures and associates – Tax on exceptional items and certain re-measurement
Adjusted earnings per share
Profit measure Earnings per share – Exceptional items – Movements on derivatives (‘certain re-measurements’) – Interest on net pension assets/liabilities (IAS 19R) – Deferred tax including share of joint ventures and associates
Adjusted net debt and hybrid capital
Debt measure Unadjusted net debt – Hybrid capital – Outstanding liquid funds – Finance leases – Non-recourse Clyde debt
Investment and capital expenditure (Adjusted)
Capital measure Capital additions to intangible assets and property, plant and equipment
– Other expenditure – Customer funded additions (IFRIC 18) – Allowances and certificates – Disposed additions – Joint ventures and associates additions
Where the Group have referred to an Alternative Performance Measure in the financial statements the following sign is presented to denote this.
Financial Statements
102 SSE plc Annual Report 2017
Financial Statements
Rationale for adjustmentsA) Adjustments to profit measure1 Movement on operating and financing derivatives (‘certain re-measurements’)This adjustment can be split between operating and financing derivatives.
Operating derivatives are where the Group enters into forward contracts to buy (or sell) electricity, gas and other commodities to meet the future demand requirements of its Energy Supply business or to optimise the value of its Wholesale assets. Certain of these contracts are determined to be derivative financial instruments under IAS 39 and as such are required to be recorded at their fair value. Changes in the fair value of those commodity contracts designated as IAS 39 financial instruments are reflected in the income statement (as part of ‘certain re-measurements’).The Group shows the change in the fair value of these forward contracts separately as this mark-to-market movement is not relevant to the underlying performance of its operating segments. The Group will recognise the underlying value of these contracts as the relevant commodity is delivered, which will predominately be within the subsequent 12 to 18 months. Conversely, commodity contracts that are not financial instruments under IAS 39 are accounted for as ‘own use’ contracts.
Financing derivatives include all fair value and cash flow interest rate hedges, non-hedge accounted (mark-to-market) interest rate derivatives, cash flow foreign exchange hedges and non-hedge accounted foreign exchange contracts entered into by the Group to manage its banking and liquidity requirements as well as risk management relating to interest rate and foreign exchange exposures. Changes in the fair value of those financing derivatives are reflected in the income statement (as part of ‘certain re-measurements’).The Group shows the change in the fair value of these forward contracts separately as this mark-to-market movement is not relevant to the underlying performance of its operating segments.
The re-measurements arising from operating and financing derivatives, and the tax effects thereof, are disclosed separately to aid understanding of the underlying performance of the Group.
2 Exceptional itemsExceptional charges or credits, and the tax effects thereof, are considered unusual by nature or scale and of such significance that separate disclosure is required for the underlying performance of the Group to be properly understood. Further explanation of the rationale for deciding whether an item is exceptional is included in Note 2 of the Financial Statements.
3 Share of joint ventures and associates interest and taxThis adjustment can be split between the share of interest and the share of tax.
The Group is required to report profit before interest and tax (‘operating profit’) including its share of the profit after tax of its equity-accounted joint ventures and associates. However, for internal performance management purposes and for consistency of treatment, SSE reports its Adjusted profit measures before its share of the interest and/or tax on joint ventures and associates.
4 Interest on net pension assets/liabilities (IAS 19R)The Group’s interest charges relating to defined benefit pension schemes are derived from the net assets/liabilities of the schemes as valued under IAS 19R. This will mean that the charge recognised in any given year will be dependent on the impact of actuarial assumptions such as inflation and discount rates. To avoid income statement volatility derived from this basis of measurement and reflecting the non-cash nature of these charges, the Group excludes these from its Adjusted profit measures.
5 Deferred taxIn line with its long standing approach, SSE adjusts for deferred tax when arriving at Adjusted profit after tax and its Adjusted effective rate of tax. SSE believes consistency of presentation is essential for investors and other users of its statements and does not therefore believe that changing these measures would result in improved clarity or transparency.
B) Adjustments to debt measure6 Hybrid capitalThe characteristics of hybrid capital securities mean they qualify for recognition as equity rather than debt under IFRSs. Consequently, their coupon payments are presented within dividends rather than within finance costs. As a result, the coupon payments are not included in SSE’s Adjusted PBT measure. In order to present total funding provided from sources other than ordinary shareholders, SSE presents its Adjusted net debt measure inclusive of hybrid capital to better reflect the Group’s funding position.
7 Outstanding liquid fundsOutstanding liquid funds are SSE cash balances held by counterparties as collateral at the year end. SSE includes these as cash until they are utilised. Loans with a maturity of less than three months are also included in this adjustment. The Group includes this adjustment in order to better reflect the immediate cash resources it has access, which in turn better reflects the Group’s funding position.
8 Finance leasesSSE’s Reported loans and borrowings include finance lease liabilities, most significantly in relation to its tolling contract with Marchwood Power Limited, which are not directly related to the external financing of the Group. The Group excludes these liabilities from its Adjusted net debt and hybrid capital measure to better reflect the Group’s underlying funding position with its primary sources of capital.
Alternative Performance Measures continued
103
3. Financial Statements2.1.
9 Non-recourse Clyde debtAt 31 March 2016, prior to the change in consolidation treatment for the venture, an adjustment was made to exclude non-recourse debt associated with Clyde Windfarm (Scotland) Limited. Further explanation of the rationale is included in Note 4.2(iii).
C) Adjustments to capex measure10 Other expenditureOther expenditure primarily represents subsequently derecognised development expenditure which is excluded to better reflect the Group’s underlying capital position.
11 Customer funded additionsCustomer funded additions represents additions to electricity and other networks funded by customer contributions and accounted for under IFRIC 18. Given this is directly funded by customers, this has been excluded to better reflect the Group’s underlying investment position.
12 Allowances and certificatesAllowances and certificates consist of purchased carbon emissions allowances and generated or purchased renewable obligations certificates (ROCs) and are not included in the Group’s capital expenditure and investment Alternative Performance Measure to better reflect the Group’s investment in enduring operational assets.
13 Disposed additionsDisposed additions represents capital additions related to smart meter installations which were subsequently disposed to the Meter Fit 2 Limited (see Note 12). This has been excluded to better reflect the Group’s net capital investment.
14 Joint ventures and associates additionsJoint ventures and associates additions represent funding provided to joint venture arrangements in relation to capital expenditure projects. This has been included to better reflect the Group’s use of directly funded equity-accounted vehicles to grow the Group’s asset base. Project finance raised by the Group’s joint ventures and associates is not included in this adjustment.
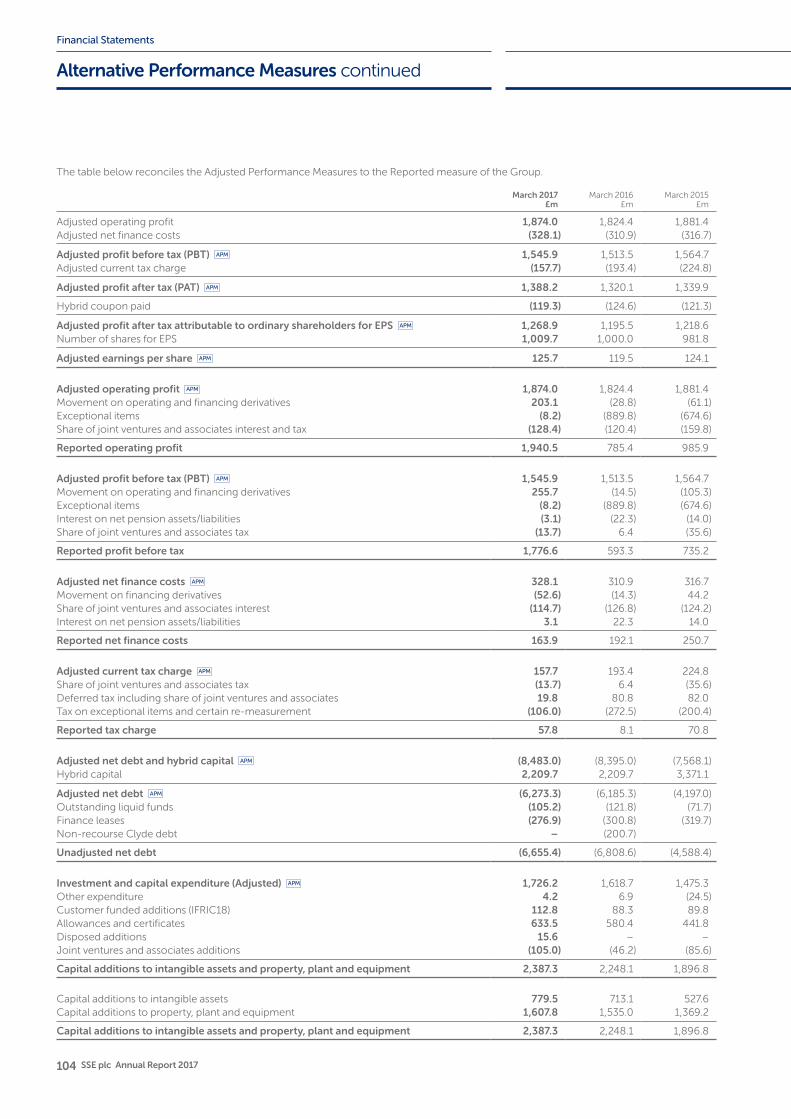
104 SSE plc Annual Report 2017
Financial Statements
The table below reconciles the Adjusted Performance Measures to the Reported measure of the Group.
March 2017£m
March 2016£m
March 2015£m
Adjusted operating profit 1,874.0 1,824.4 1,881.4Adjusted net finance costs (328.1) (310.9) (316.7)
Adjusted profit before tax (PBT) 1,545.9 1,513.5 1,564.7Adjusted current tax charge (157.7) (193.4) (224.8)
Adjusted profit after tax (PAT) 1,388.2 1,320.1 1,339.9
Hybrid coupon paid (119.3) (124.6) (121.3)
Adjusted profit after tax attributable to ordinary shareholders for EPS 1,268.9 1,195.5 1,218.6Number of shares for EPS 1,009.7 1,000.0 981.8
Adjusted earnings per share 125.7 119.5 124.1
Adjusted operating profit 1,874.0 1,824.4 1,881.4Movement on operating and financing derivatives 203.1 (28.8) (61.1)Exceptional items (8.2) (889.8) (674.6)Share of joint ventures and associates interest and tax (128.4) (120.4) (159.8)
Reported operating profit 1,940.5 785.4 985.9
Adjusted profit before tax (PBT) 1,545.9 1,513.5 1,564.7Movement on operating and financing derivatives 255.7 (14.5) (105.3)Exceptional items (8.2) (889.8) (674.6)Interest on net pension assets/liabilities (3.1) (22.3) (14.0)Share of joint ventures and associates tax (13.7) 6.4 (35.6)
Reported profit before tax 1,776.6 593.3 735.2
Adjusted net finance costs 328.1 310.9 316.7Movement on financing derivatives (52.6) (14.3) 44.2Share of joint ventures and associates interest (114.7) (126.8) (124.2)Interest on net pension assets/liabilities 3.1 22.3 14.0
Reported net finance costs 163.9 192.1 250.7
Adjusted current tax charge 157.7 193.4 224.8Share of joint ventures and associates tax (13.7) 6.4 (35.6)Deferred tax including share of joint ventures and associates 19.8 80.8 82.0Tax on exceptional items and certain re-measurement (106.0) (272.5) (200.4)
Reported tax charge 57.8 8.1 70.8
Adjusted net debt and hybrid capital (8,483.0) (8,395.0) (7,568.1)Hybrid capital 2,209.7 2,209.7 3,371.1
Adjusted net debt (6,273.3) (6,185.3) (4,197.0)Outstanding liquid funds (105.2) (121.8) (71.7)Finance leases (276.9) (300.8) (319.7)Non-recourse Clyde debt – (200.7)
Unadjusted net debt (6,655.4) (6,808.6) (4,588.4)
Investment and capital expenditure (Adjusted) 1,726.2 1,618.7 1,475.3Other expenditure 4.2 6.9 (24.5)Customer funded additions (IFRIC18) 112.8 88.3 89.8Allowances and certificates 633.5 580.4 441.8Disposed additions 15.6 – –Joint ventures and associates additions (105.0) (46.2) (85.6)
Capital additions to intangible assets and property, plant and equipment 2,387.3 2,248.1 1,896.8
Capital additions to intangible assets 779.5 713.1 527.6Capital additions to property, plant and equipment 1,607.8 1,535.0 1,369.2
Capital additions to intangible assets and property, plant and equipment 2,387.3 2,248.1 1,896.8
Alternative Performance Measures continued
105
3. Financial Statements2.1.Financial Statements
Consolidated financial statements
Consolidated income statement 106
Consolidated statement of comprehensive income 107
Consolidated balance sheet 108
Consolidated statement of changes in equity 109
Consolidated cash flow statement 110
Notes to the consolidated financial statements
1. General information and basis of preparation 111
2. New accounting policies and reporting changes 112
3. Adjusted accounting measures 113
4. Accounting judgements and estimation uncertainty 114
5. Segmental information 117
6. Other operating income and cost 123
7. Exceptional items and certain remeasurements 124
8. Directors and employees 127
9. Finance income and costs 129
10. Taxation 130
11. Dividends and earnings per share 132
12. Acquisitions, disposals and held for sale assets 133
13. Intangible assets 136
14. Property, plant and equipment 138
15. Impairment testing 139
16. Investments 143
17. Inventories 145
18. Trade and other receivables 145
19. Trade and other payables 146
20. Provisions 146
21. Sources of finance 147
22. Equity 151
23. Retirement benefit obligations 152
24. Financial instruments 157
25. Commitments and contingencies 158
Accompanying information
A1. Basis of consolidation and significant accounting policies 159
A2. Taxation 167
A3. Related undertakings 170
A4. Joint ventures and associates 174
A5. Related party transactions 176
A6. Financial risk management 176
A7. Fair value of financial instruments 185
A8. Hedge accounting 186
Company financial statements
Company balance sheet 187
Company statement of changes in equity 188
Notes to the Company financial statements
1. Principal accounting policies 189
2. Supplementary financial information 190
3. Investments 190
4. Subsidiary undertakings 191
5. Trade and other receivables 191
6. Trade and other payables 191
7. Taxation 191
8. Loans and borrowings 192
9. Equity 194
10. Retirement benefit obligations 195
11. Financial instruments 198
12. Commitments and contingencies 198
Independent Auditor’s Report 199
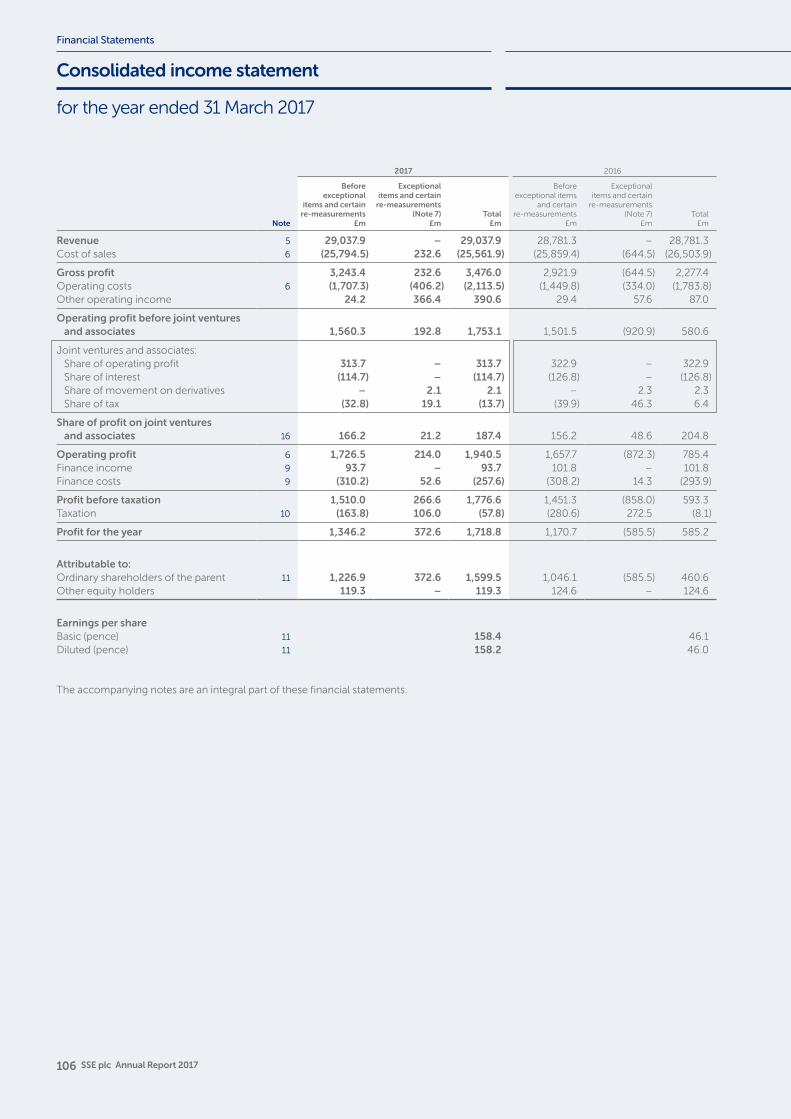
106 SSE plc Annual Report 2017
Financial Statements
for the year ended 31 March 2017
Consolidated income statement
2017 2016
Note
Before exceptional
items and certain re-measurements
£m
Exceptional items and certain
re-measurements (Note 7)
£mTotal
£m
Before exceptional items
and certain re-measurements
£m
Exceptional items and certain
re-measurements (Note 7)
£mTotal
£m
Revenue 5 29,037.9 – 29,037.9 28,781.3 – 28,781.3Cost of sales 6 (25,794.5) 232.6 (25,561.9) (25,859.4) (644.5) (26,503.9)
Gross profit 3,243.4 232.6 3,476.0 2,921.9 (644.5) 2,277.4Operating costs 6 (1,707.3) (406.2) (2,113.5) (1,449.8) (334.0) (1,783.8)Other operating income 24.2 366.4 390.6 29.4 57.6 87.0
Operating profit before joint ventures and associates 1,560.3 192.8 1,753.1 1,501.5 (920.9) 580.6
Joint ventures and associates:Share of operating profit 313.7 – 313.7 322.9 – 322.9Share of interest (114.7) – (114.7) (126.8) – (126.8)Share of movement on derivatives – 2.1 2.1 – 2.3 2.3Share of tax (32.8) 19.1 (13.7) (39.9) 46.3 6.4
Share of profit on joint ventures and associates 16 166.2 21.2 187.4 156.2 48.6 204.8
Operating profit 6 1,726.5 214.0 1,940.5 1,657.7 (872.3) 785.4Finance income 9 93.7 – 93.7 101.8 – 101.8Finance costs 9 (310.2) 52.6 (257.6) (308.2) 14.3 (293.9)
Profit before taxation 1,510.0 266.6 1,776.6 1,451.3 (858.0) 593.3Taxation 10 (163.8) 106.0 (57.8) (280.6) 272.5 (8.1)
Profit for the year 1,346.2 372.6 1,718.8 1,170.7 (585.5) 585.2
Attributable to:Ordinary shareholders of the parent 11 1,226.9 372.6 1,599.5 1,046.1 (585.5) 460.6Other equity holders 119.3 – 119.3 124.6 – 124.6
Earnings per shareBasic (pence) 11 158.4 46.1Diluted (pence) 11 158.2 46.0
The accompanying notes are an integral part of these financial statements.
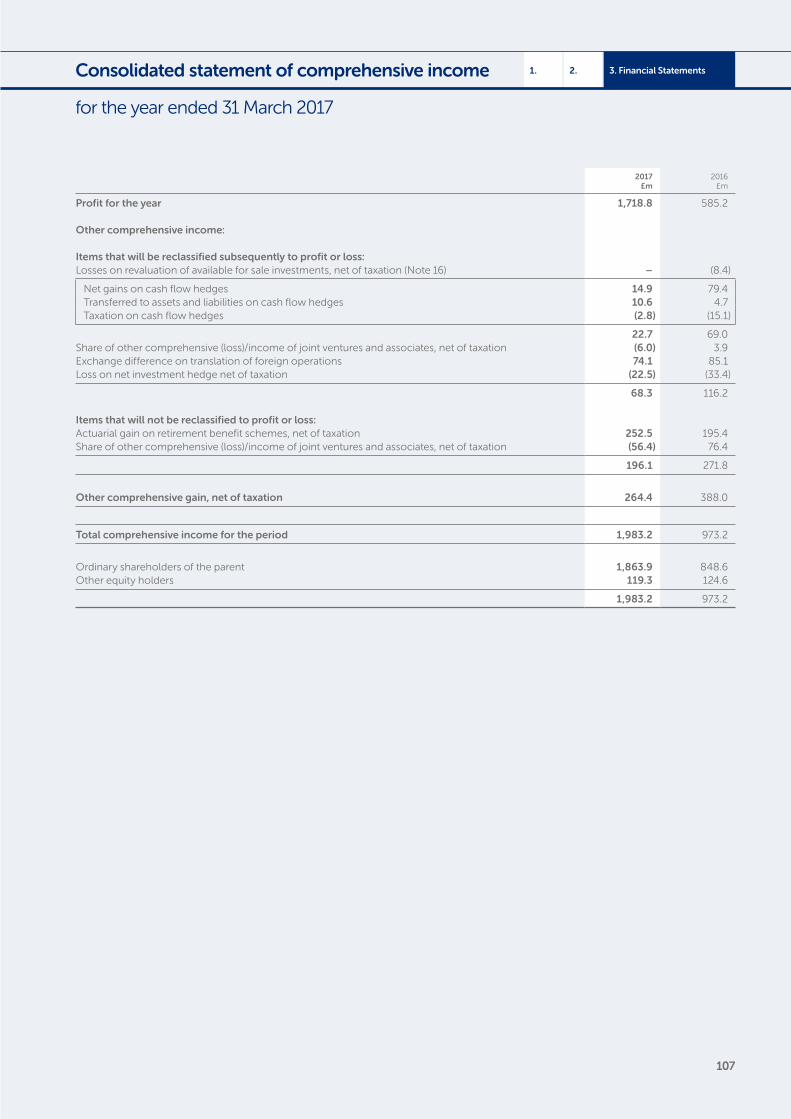
107
3. Financial Statements2.1.
for the year ended 31 March 2017
Consolidated statement of comprehensive income
2017£m
2016 £m
Profit for the year 1,718.8 585.2
Other comprehensive income:
Items that will be reclassified subsequently to profit or loss:Losses on revaluation of available for sale investments, net of taxation (Note 16) – (8.4)
Net gains on cash flow hedges 14.9 79.4Transferred to assets and liabilities on cash flow hedges 10.6 4.7Taxation on cash flow hedges (2.8) (15.1)
22.7 69.0Share of other comprehensive (loss)/income of joint ventures and associates, net of taxation (6.0) 3.9Exchange difference on translation of foreign operations 74.1 85.1Loss on net investment hedge net of taxation (22.5) (33.4)
68.3 116.2
Items that will not be reclassified to profit or loss:Actuarial gain on retirement benefit schemes, net of taxation 252.5 195.4Share of other comprehensive (loss)/income of joint ventures and associates, net of taxation (56.4) 76.4
196.1 271.8
Other comprehensive gain, net of taxation 264.4 388.0
Total comprehensive income for the period 1,983.2 973.2
Ordinary shareholders of the parent 1,863.9 848.6Other equity holders 119.3 124.6
1,983.2 973.2
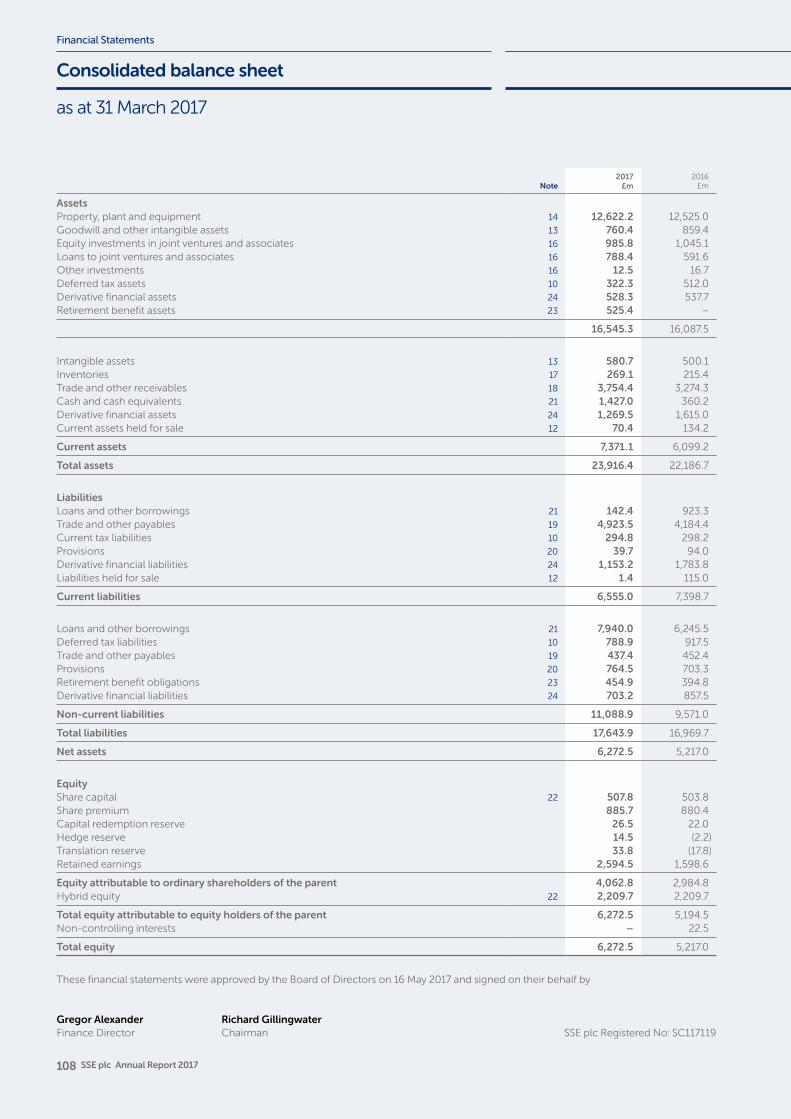
108 SSE plc Annual Report 2017
Financial Statements
as at 31 March 2017
Consolidated balance sheet
Note2017
£m2016
£m
AssetsProperty, plant and equipment 14 12,622.2 12,525.0Goodwill and other intangible assets 13 760.4 859.4Equity investments in joint ventures and associates 16 985.8 1,045.1Loans to joint ventures and associates 16 788.4 591.6Other investments 16 12.5 16.7Deferred tax assets 10 322.3 512.0Derivative financial assets 24 528.3 537.7Retirement benefit assets 23 525.4 –
16,545.3 16,087.5
Intangible assets 13 580.7 500.1Inventories 17 269.1 215.4Trade and other receivables 18 3,754.4 3,274.3Cash and cash equivalents 21 1,427.0 360.2Derivative financial assets 24 1,269.5 1,615.0Current assets held for sale 12 70.4 134.2
Current assets 7,371.1 6,099.2
Total assets 23,916.4 22,186.7
LiabilitiesLoans and other borrowings 21 142.4 923.3Trade and other payables 19 4,923.5 4,184.4Current tax liabilities 10 294.8 298.2Provisions 20 39.7 94.0Derivative financial liabilities 24 1,153.2 1,783.8Liabilities held for sale 12 1.4 115.0
Current liabilities 6,555.0 7,398.7
Loans and other borrowings 21 7,940.0 6,245.5Deferred tax liabilities 10 788.9 917.5Trade and other payables 19 437.4 452.4Provisions 20 764.5 703.3Retirement benefit obligations 23 454.9 394.8Derivative financial liabilities 24 703.2 857.5
Non-current liabilities 11,088.9 9,571.0
Total liabilities 17,643.9 16,969.7
Net assets 6,272.5 5,217.0
EquityShare capital 22 507.8 503.8Share premium 885.7 880.4Capital redemption reserve 26.5 22.0Hedge reserve 14.5 (2.2)Translation reserve 33.8 (17.8)Retained earnings 2,594.5 1,598.6
Equity attributable to ordinary shareholders of the parent 4,062.8 2,984.8Hybrid equity 22 2,209.7 2,209.7
Total equity attributable to equity holders of the parent 6,272.5 5,194.5Non-controlling interests – 22.5
Total equity 6,272.5 5,217.0
These financial statements were approved by the Board of Directors on 16 May 2017 and signed on their behalf by
Gregor Alexander Finance Director
Richard Gillingwater Chairman SSE plc Registered No: SC117119
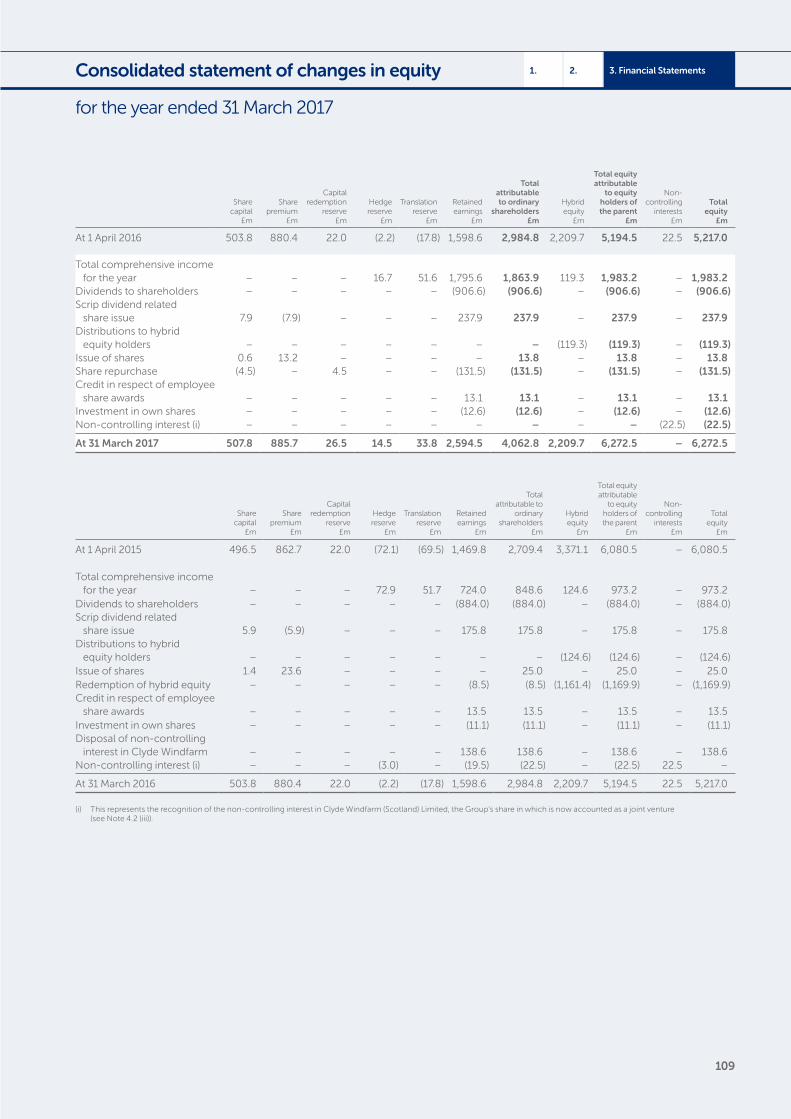
109
3. Financial Statements2.1.
for the year ended 31 March 2017
Consolidated statement of changes in equity
Share capital
£m
Share premium
£m
Capital redemption
reserve£m
Hedge reserve
£m
Translation reserve
£m
Retained earnings
£m
Total attributable to ordinary
shareholders£m
Hybrid equity
£m
Total equity attributable
to equity holders of the parent
£m
Non-controlling
interests£m
Total equity
£m
At 1 April 2016 503.8 880.4 22.0 (2.2) (17.8) 1,598.6 2,984.8 2,209.7 5,194.5 22.5 5,217.0
Total comprehensive income for the year – – – 16.7 51.6 1,795.6 1,863.9 119.3 1,983.2 – 1,983.2
Dividends to shareholders – – – – – (906.6) (906.6) – (906.6) – (906.6)Scrip dividend related
share issue 7.9 (7.9) – – – 237.9 237.9 – 237.9 – 237.9Distributions to hybrid
equity holders – – – – – – – (119.3) (119.3) – (119.3)Issue of shares 0.6 13.2 – – – – 13.8 – 13.8 – 13.8Share repurchase (4.5) – 4.5 – – (131.5) (131.5) – (131.5) – (131.5)Credit in respect of employee
share awards – – – – – 13.1 13.1 – 13.1 – 13.1Investment in own shares – – – – – (12.6) (12.6) – (12.6) – (12.6)Non-controlling interest (i) – – – – – – – – – (22.5) (22.5)
At 31 March 2017 507.8 885.7 26.5 14.5 33.8 2,594.5 4,062.8 2,209.7 6,272.5 – 6,272.5
Share capital
£m
Share premium
£m
Capital redemption
reserve£m
Hedge reserve
£m
Translation reserve
£m
Retained earnings
£m
Total attributable to
ordinary shareholders
£m
Hybrid equity
£m
Total equity attributable
to equity holders of the parent
£m
Non-controlling
interests£m
Total equity
£m
At 1 April 2015 496.5 862.7 22.0 (72.1) (69.5) 1,469.8 2,709.4 3,371.1 6,080.5 – 6,080.5
Total comprehensive income for the year – – – 72.9 51.7 724.0 848.6 124.6 973.2 – 973.2
Dividends to shareholders – – – – – (884.0) (884.0) – (884.0) – (884.0)Scrip dividend related
share issue 5.9 (5.9) – – – 175.8 175.8 – 175.8 – 175.8Distributions to hybrid
equity holders – – – – – – – (124.6) (124.6) – (124.6)Issue of shares 1.4 23.6 – – – – 25.0 – 25.0 – 25.0Redemption of hybrid equity – – – – – (8.5) (8.5) (1,161.4) (1,169.9) – (1,169.9)Credit in respect of employee
share awards – – – – – 13.5 13.5 – 13.5 – 13.5Investment in own shares – – – – – (11.1) (11.1) – (11.1) – (11.1)Disposal of non-controlling
interest in Clyde Windfarm – – – – – 138.6 138.6 – 138.6 – 138.6Non-controlling interest (i) – – – (3.0) – (19.5) (22.5) – (22.5) 22.5 –
At 31 March 2016 503.8 880.4 22.0 (2.2) (17.8) 1,598.6 2,984.8 2,209.7 5,194.5 22.5 5,217.0
(i) This represents the recognition of the non-controlling interest in Clyde Windfarm (Scotland) Limited, the Group’s share in which is now accounted as a joint venture (see Note 4.2 (iii)).
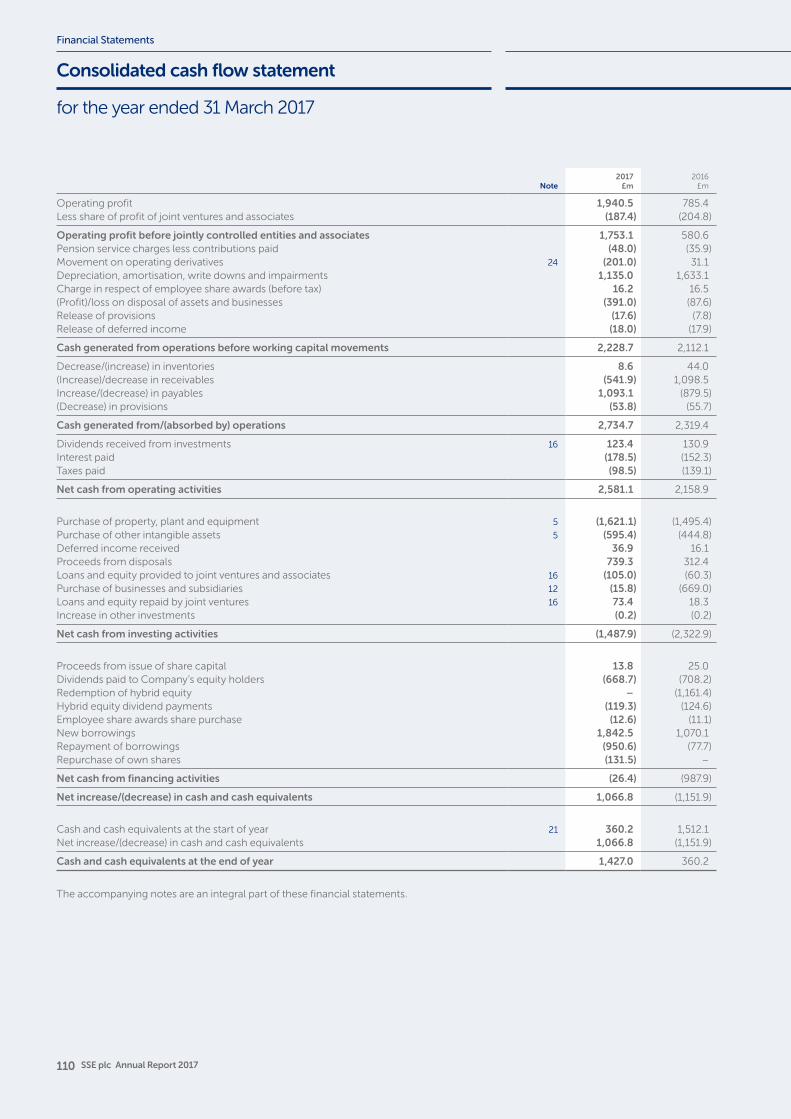
110 SSE plc Annual Report 2017
Financial Statements
for the year ended 31 March 2017
Consolidated cash flow statement
Note2017
£m2016
£m
Operating profit 1,940.5 785.4Less share of profit of joint ventures and associates (187.4) (204.8)
Operating profit before jointly controlled entities and associates 1,753.1 580.6Pension service charges less contributions paid (48.0) (35.9)Movement on operating derivatives 24 (201.0) 31.1Depreciation, amortisation, write downs and impairments 1,135.0 1,633.1Charge in respect of employee share awards (before tax) 16.2 16.5(Profit)/loss on disposal of assets and businesses (391.0) (87.6)Release of provisions (17.6) (7.8)Release of deferred income (18.0) (17.9)
Cash generated from operations before working capital movements 2,228.7 2,112.1
Decrease/(increase) in inventories 8.6 44.0(Increase)/decrease in receivables (541.9) 1,098.5Increase/(decrease) in payables 1,093.1 (879.5)(Decrease) in provisions (53.8) (55.7)
Cash generated from/(absorbed by) operations 2,734.7 2,319.4
Dividends received from investments 16 123.4 130.9Interest paid (178.5) (152.3)Taxes paid (98.5) (139.1)
Net cash from operating activities 2,581.1 2,158.9
Purchase of property, plant and equipment 5 (1,621.1) (1,495.4)Purchase of other intangible assets 5 (595.4) (444.8)Deferred income received 36.9 16.1Proceeds from disposals 739.3 312.4Loans and equity provided to joint ventures and associates 16 (105.0) (60.3)Purchase of businesses and subsidiaries 12 (15.8) (669.0)Loans and equity repaid by joint ventures 16 73.4 18.3Increase in other investments (0.2) (0.2)
Net cash from investing activities (1,487.9) (2,322.9)
Proceeds from issue of share capital 13.8 25.0Dividends paid to Company’s equity holders (668.7) (708.2)Redemption of hybrid equity – (1,161.4)Hybrid equity dividend payments (119.3) (124.6)Employee share awards share purchase (12.6) (11.1)New borrowings 1,842.5 1,070.1Repayment of borrowings (950.6) (77.7)Repurchase of own shares (131.5) –
Net cash from financing activities (26.4) (987.9)
Net increase/(decrease) in cash and cash equivalents 1,066.8 (1,151.9)
Cash and cash equivalents at the start of year 21 360.2 1,512.1Net increase/(decrease) in cash and cash equivalents 1,066.8 (1,151.9)
Cash and cash equivalents at the end of year 1,427.0 360.2
The accompanying notes are an integral part of these financial statements.
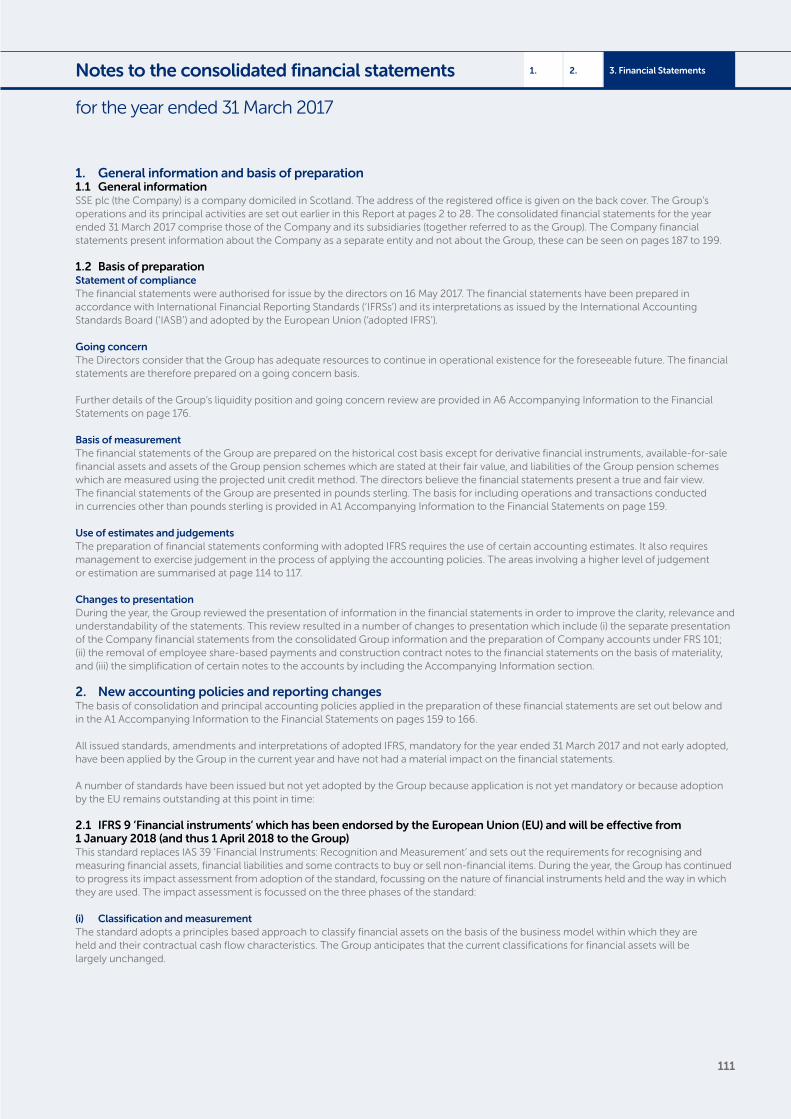
111
3. Financial Statements2.1.
for the year ended 31 March 2017
Notes to the consolidated financial statements
1. General information and basis of preparation1.1 General informationSSE plc (the Company) is a company domiciled in Scotland. The address of the registered office is given on the back cover. The Group’s operations and its principal activities are set out earlier in this Report at pages 2 to 28. The consolidated financial statements for the year ended 31 March 2017 comprise those of the Company and its subsidiaries (together referred to as the Group). The Company financial statements present information about the Company as a separate entity and not about the Group, these can be seen on pages 187 to 199.
1.2 Basis of preparationStatement of complianceThe financial statements were authorised for issue by the directors on 16 May 2017. The financial statements have been prepared in accordance with International Financial Reporting Standards (‘IFRSs’) and its interpretations as issued by the International Accounting Standards Board (‘IASB’) and adopted by the European Union (‘adopted IFRS’).
Going concernThe Directors consider that the Group has adequate resources to continue in operational existence for the foreseeable future. The financial statements are therefore prepared on a going concern basis.
Further details of the Group’s liquidity position and going concern review are provided in A6 Accompanying Information to the Financial Statements on page 176.
Basis of measurementThe financial statements of the Group are prepared on the historical cost basis except for derivative financial instruments, available-for-sale financial assets and assets of the Group pension schemes which are stated at their fair value, and liabilities of the Group pension schemes which are measured using the projected unit credit method. The directors believe the financial statements present a true and fair view. The financial statements of the Group are presented in pounds sterling. The basis for including operations and transactions conducted in currencies other than pounds sterling is provided in A1 Accompanying Information to the Financial Statements on page 159.
Use of estimates and judgementsThe preparation of financial statements conforming with adopted IFRS requires the use of certain accounting estimates. It also requires management to exercise judgement in the process of applying the accounting policies. The areas involving a higher level of judgement or estimation are summarised at page 114 to 117.
Changes to presentationDuring the year, the Group reviewed the presentation of information in the financial statements in order to improve the clarity, relevance and understandability of the statements. This review resulted in a number of changes to presentation which include (i) the separate presentation of the Company financial statements from the consolidated Group information and the preparation of Company accounts under FRS 101; (ii) the removal of employee share-based payments and construction contract notes to the financial statements on the basis of materiality, and (iii) the simplification of certain notes to the accounts by including the Accompanying Information section.
2. New accounting policies and reporting changes The basis of consolidation and principal accounting policies applied in the preparation of these financial statements are set out below and in the A1 Accompanying Information to the Financial Statements on pages 159 to 166.
All issued standards, amendments and interpretations of adopted IFRS, mandatory for the year ended 31 March 2017 and not early adopted, have been applied by the Group in the current year and have not had a material impact on the financial statements.
A number of standards have been issued but not yet adopted by the Group because application is not yet mandatory or because adoption by the EU remains outstanding at this point in time:
2.1 IFRS 9 ‘Financial instruments’ which has been endorsed by the European Union (EU) and will be effective from 1 January 2018 (and thus 1 April 2018 to the Group)This standard replaces IAS 39 ‘Financial Instruments: Recognition and Measurement’ and sets out the requirements for recognising and measuring financial assets, financial liabilities and some contracts to buy or sell non-financial items. During the year, the Group has continued to progress its impact assessment from adoption of the standard, focussing on the nature of financial instruments held and the way in which they are used. The impact assessment is focussed on the three phases of the standard:
(i) Classification and measurementThe standard adopts a principles based approach to classify financial assets on the basis of the business model within which they are held and their contractual cash flow characteristics. The Group anticipates that the current classifications for financial assets will be largely unchanged.
112 SSE plc Annual Report 2017
Financial Statements
for the year ended 31 March 2017
Notes to the consolidated financial statements continued
2. New accounting policies and reporting changes continued2.1 IFRS 9 ‘Financial instruments’ which has been endorsed by the European Union (EU) and will be effective from 1 January 2018 (and thus 1 April 2018 to the Group) continued(ii) ImpairmentThe standard includes the requirement that impairment models also consider the expected credit losses on an entity’s financial assets held at amortised cost and commitments to extend credit. The Group anticipates that this will not have a material impact on the Group’s results given the low exposure to counterparty default risk as a result of the credit risk management processes that are in place.
(iii) Hedge accountingThe standard does not materially change the amounts recognised in relation to existing hedging arrangements but does simplify the requirements for measuring hedge effectiveness, and thus the eligibility conditions for hedge accounting. The Group anticipates that there will be minimal impact from adoption on the current Capital and Financial Risk Management structure adopted by the Group.
A detailed and complete impact assessment has not yet been finalised, and will be completed during the course of the next financial year. The Group has no plans for early adoption.
2.2 IFRS 15 ‘Revenue from contracts with customers’ which has been endorsed by the EU and will be effective from 1 January 2018 (and thus 1 April 2018 to the Group)This standard replaces IAS 11 ‘Construction contracts’, IAS 18 ‘Revenue’, IFRIC 18 ‘Transfers of Assets from Customers’ and a number of other revenue related interpretations previously adopted by the Group. The core principle of IFRS 15 is that an entity recognises revenue to present the transfer of promised goods or services to customers reflecting the consideration to which the entity expects to be entitled in exchange for those goods or services. The standard has introduced a five-step model as the framework for applying that core principle.
The Group has continued to progress its assessment of the impact adoption of the standard. This assessment has been focussed on reviewing the contractual terms of the Group’s various revenue streams under the five-step model, and highlighting anticipated differences in the recognition and disclosure of revenue. Whilst any accounting policy changes resulting from adoption of this standard have yet to be confirmed, the indicative Group impact can be summarised as follows:
– The majority of revenue from energy generation and related trading is managed through the Group’s Energy Portfolio Management (EPM) business utilising energy commodity contracts which are either designated as executory ‘own use’ contracts or are deemed to constitute financial instruments under IAS 39 and which are therefore outside the scope of IFRS 15. The presentation of revenue outside the scope of IFRS 15 will be considered as a consequence of IFRS 15 adoption. This is not expected to have a significant impact the Group’s results.
– Recognition of revenue from the supply of energy is based on the enforceable right to bill customers based on their consumption of energy and is not expected to change under IFRS 15. However, the agent/principal distinction within IFRS 15 may determine that only the net consideration on certain revenue items such as agent commission or energy delivery service costs may be recognised rather than the gross consideration as currently presented. This is not expected to impact the Group’s results.
– The majority of revenue from use of electricity networks is based on tariffs derived from allowed revenue calculations as regulated by the Office of Gas and Electricity Markets (Ofgem). No change to recognition or measurement of revenue is expected under IFRS 15.
– Construction and service contract revenue is currently based by reference to the stage of completion of overall contract activity or performance of the relevant service, however IFRS 15 requires the separation of a contract into separate performance obligations and recognition of revenue when the customer obtains control (either over time or at a certain point in time). Therefore, depending on management’s assessment of the separation or combination of performance standards under IFRS 15, there could be changes in timing and measurement of revenue and cost recognition. Furthermore, IFRS 15 allows the capitalisation of costs directly related to obtaining, and expected to be recovered through, a customer contract which is currently expensed as incurred. Whilst our review is currently in progress, we do not expect that these changes will have any significant impact on the Group’s results.
A detailed and complete impact assessment has not yet been finalised, and will be completed during the course of the next financial year. The Group will look to confirm accounting policy decisions, and implement necessary processes to capture any adjustments and additional disclosures required, during the course of the next financial year. The Group anticipates that it will be applying the “modified retrospective” approach in adopting the standard, and has no plans for early adoption.
2.3 IFRS 16 ‘Leases’ is effective from 1 January 2019 (and thus 1 April 2019 to the Group), and is subject to EU endorsementThis standard replaces IAS 17 ‘Leases’ and sets out the principles for the recognition, measurement, presentation and disclosure of leases. The principal change from the previous standard is the introduction of a single lessee accounting model which requires a lessee to recognise assets and liabilities for all leases with a term of more than 12 months, unless the underlying asset is of low value.
The Group has commenced its initial assessment of the impact from this standard and, whilst this assessment is in the early stages, the indicative Group impact from adopting the standard can be summarised in two areas:
(i) Identification of a leaseThe standard introduces a distinction between a lease and a service contract on the basis of whether a customer is able to control an identifiable asset. The Group anticipates some existing operating and finance leases may fail to meet this definition, and therefore would be treated as service contracts. However, the Groups’ initial view is that this is not expected to have a material impact on the Group’s results.
113
3. Financial Statements2.1.
2. New accounting policies and reporting changes continued2.3 IFRS 16 ‘Leases’ is effective from 1 January 2019 (and thus 1 April 2019 to the Group), and is subject to EU endorsement continued(ii) Recognition of right-of-use assets and lease liabilities for existing operating leasesThe standard removes the previous distinction between operating leases and finance leases and requires that, where a lease is identified in a contract, a right-of-use asset and lease liability are recognised. The Group anticipates that adoption is likely to result in the majority of arrangements currently accounted for as operating leases being recognised on the Consolidated Balance Sheet as right-of-use assets and lease liabilities.
The majority of the Group’s detailed impact assessment work will be performed during the forthcoming financial year and therefore it has not been practicable at this stage to quantify the full implementation effect of the standard. The Group has no plans for early adoption.
2.4 Other interpretations and amendmentsIn addition to these issued standards, there are a number of other interpretations, amendments and annual improvement project recommendations that have been issued but not yet adopted by the Group because application is not yet mandatory or because adoption by the EU remains outstanding at this point in time. These are not anticipated to have a material impact on the Group’s consolidated financial statements.
3. Adjusted accounting measuresThe Group applies the use of Adjusted accounting measures throughout the Annual Report and Financial Statements. These measures enable the Directors to present the underlying performance of the Group and its segments to the users of the statements in a consistent and meaningful manner. The adjustments applied and certain terms such as ‘Adjusted operating profit’, ‘Adjusted EPS’ and ‘Adjusted net debt and hybrid equity’ are not defined under IFRS and are explained in more detail below.
3.1 Adjusted measuresThe Directors assess the performance of the Group and its reportable segments based on ‘Adjusted measures’. These measures are used for internal performance management and are believed to be appropriate for explaining underlying performance to users of the accounts. These measures are also deemed the most useful for the ordinary shareholders of the Company and for other stakeholders.
The performance of the reportable segments is reported based on Adjusted profit before interest and tax (‘Adjusted operating profit’). This is reconciled to Reported profit before interest and tax by adding back exceptional items and certain re-measurements (see Note 3.2 below) and after the removal of interest and taxation on profits from equity-accounted joint ventures and associates.
The performance of the Group is reported based on Adjusted profit before tax which excludes exceptional items and certain re-measurements (see below), the net interest costs associated with defined benefit schemes and taxation on profits from equity-accounted joint ventures and associates. The interest costs removed are non-cash and are subject to variation based on actuarial valuations of scheme liabilities.
The Group’s key performance measure is Adjusted earnings per share (EPS), which is based on basic earnings per share before exceptional items and certain re-measurements (see below), the net interest costs associated with defined benefit schemes and after the removal of deferred taxation. Adjusted profit after tax is presented on a basis consistent with Adjusted EPS except for the exclusion of payments to holders of hybrid equity.
The financial statements also include an ‘Adjusted net debt and hybrid equity’ measure. This presents financing information on the basis used for internal liquidity risk management. This measure excludes obligations due under finance leases and includes cash held as collateral on commodity trading exchanges and other short-term loans. At 31 March 2016, prior to the change in consolidation treatment for the venture, this measure excluded non-recourse debt associated with Clyde Windfarm (Scotland) Limited (see Note 4.2 (iii)). The measure represents the capital owed to investors, lenders and equity holders other than the ordinary shareholders. As with ‘Adjusted earnings per share’, this measure is considered to be of particular relevance to the ordinary shareholders of the Group as well as other stakeholders and interested parties.
Finally, the financial statements include an ‘investment and capital expenditure’ measure. This metric represents the capital invested by the Group in projects that are anticipated to provide a return on investment over future years and is consistent with internally applied metrics. This therefore includes capital additions to Property, Plant and Equipment and Intangible Assets and also the Group’s funding of joint venture and associates capital projects. The Group has considered it appropriate to report these values both internally and externally in this manner due to its use of equity-accounted investment vehicles to grow the Group’s asset base, where the Group is providing the source of funding to the vehicle through either loans or equity. The Group does not include project-funded ventures in this metric. In addition, the Group excludes from this metric additions to its Property, Plant and Equipment funded by Customer Contributions and additions to Intangible Assets associated with Allowances and Certificates. As with ‘Adjusted earnings per share’, this measure is considered to be of particular relevance to the ordinary shareholders of the Group as well as other stakeholders and interested parties.
Reconciliations from Reported measures to Adjusted measures along with further description of the rationale for those adjustments are included in the ‘Alternative Performance Measures’ section at pages 101 to 104.
Where the Group have referred to an Alternative Performance Measure in the financial statements the following sign is presented to denote this.
114 SSE plc Annual Report 2017
Financial Statements
for the year ended 31 March 2017
Notes to the consolidated financial statements continued
3. Adjusted accounting measures continued3.2 Exceptional items and certain re-measurementsExceptional items are those charges or credits that are considered unusual by nature and scale and of such significance that separate disclosure is required for the financial statements to be properly understood. The trigger points for exceptional items will tend to be non-recurring although exceptional charges may impact the same asset class or segment over time. Market conditions that have deteriorated significantly over time will only be captured to the extent observable at the balance sheet date. Examples of items that may be considered exceptional include material asset or business impairment charges, business restructuring costs, significant gains or losses on disposal and contractual settlements following significant disputes and claims. The Directors consider that any individual gain or loss on disposal of greater than £30.0m would be disclosed as being exceptional by nature of its scale. Other gains or losses on disposal below this level may be considered to be exceptional by reference to specific circumstances which will be explained on a case-by-case basis.
Certain re-measurements are re-measurements arising on certain commodity, interest rate and currency contracts which are accounted for as held for trading or as fair value hedges in accordance with the Group’s policy for such financial instruments. The amounts shown in the before exceptional items and certain re-measurements results for these contracts is the amount settled in the year as disclosed in Note 24.1. This excludes commodity contracts not treated as financial instruments under IAS 39 where held for the Group’s own use requirements which are not recorded until the underlying commodity is delivered.
3.3 Other additional disclosuresAs permitted by IAS 1 ‘Presentation of financial statements’, the Group’s income statement discloses additional information in respect of joint ventures and associates, exceptional items and certain re-measurements to aid understanding of the Group’s financial performance and to present results clearly and consistently.
4. Accounting judgements and estimation uncertaintyIn the process of applying the Group’s accounting policies, management necessarily makes judgements and estimates that have a significant effect on the amounts recognised in the financial statements. Changes in the assumptions underlying the estimates could result in a significant impact to the financial statements. The Group’s key accounting judgement and estimation areas are noted with the most Significant Financial Judgement areas as specifically discussed by the Audit Committee being highlighted separately.
4.1 Significant financial judgements – estimation uncertaintiesThe preparation of these Financial Statements has specifically considered the following significant financial judgements all of which are areas of estimation uncertainty.
(i) Impairment testing and valuation of certain non-current assets – estimation uncertaintyThe Group reviews the carrying amounts of its goodwill, other intangible assets and specific property, plant and equipment assets to determine whether any impairment of the carrying value of those assets requires to be recorded. The specific assets under review in the year ended 31 March 2017 are goodwill, intangible development assets and specific property, plant and equipment assets related to gas production, retail and technology development, gas storage, thermal power generation and wind power generation. In conducting its reviews, the Group makes judgements and estimates in considering both the level of cash generating unit (CGU) at which common assets such as goodwill are assessed against, as well as the estimates and assumptions behind the calculation of recoverable amount of the respective assets or CGUs.
During the year, the Group performed a review of its CGUs based upon the current Group operating structure and economic characteristics of similar assets. The review resulted in two CGUs – GB Wind and Ireland Wind – being combined into a Wind Generation CGU. The other CGUs were unchanged following this review.
Changes to the estimates and assumptions on factors such as regulation and legislation changes, power, gas, carbon and other commodity prices, volatility of gas prices, plant running regimes and load factors, expected proven and probable reserves, discount rates and other inputs could impact the assessed recoverable value of assets and CGUs and consequently impact the Group’s income statement and balance sheet.
Further detail of the calculation basis and key assumptions used in the impairment review, the resulting impairment charges and the sensitivity of this assessment to key assumptions is disclosed at Note 15. Detail on the accounting policies applied is included in the Accompanying Information section A1.
(ii) Revenue recognition – estimated energy consumption – estimation uncertaintyRevenue from Retail energy supply activities includes an estimate of the value of electricity or gas supplied to customers between the date of the last meter reading and the year end. This estimation will comprise of values for i) billed revenue in relation to consumption from unread meters based on estimated consumption taking account of various factors including usage patterns and weather trends (disclosed as trade receivables) and ii) unbilled revenue (disclosed as accrued income). The volume of unbilled electricity or gas is calculated by assessing a number of factors such as externally notified aggregated volumes supplied to customers from national settlements bodies, amounts billed to customers and other adjustments.
Unbilled revenue is therefore calculated by applying the tariffs associated with estimated customers to the calculated volume of electricity or gas consumed. This estimation methodology is subject to an internal corroboration process that provides support for the judgements made by management. This process requires the comparison of calculated unbilled volumes to a ‘benchmark’ measure of unbilled volumes which is derived using independently verified data and by assessing historical weather-adjusted consumption patterns and actual meter data that is used in industry reconciliation processes for total consumption by supplier. This aspect of the corroboration process, which requires a comparison of the estimated supplied quantity of electricity or gas that is deemed to have been delivered to customers and the aggregate supplied quantity of electricity or gas applicable to the Group’s customers that is measured by industry system operators, is a key judgement.
115
3. Financial Statements2.1.
4. Accounting judgements and estimation uncertainty continued4.1 Significant financial judgements – estimation uncertainties continuedThe assessment of electricity unbilled revenue is further influenced by the impact on estimated electricity or gas supplied of national settlements data or, for electricity only, feed-in-tariff supported volumes and spill from solar PV generation.
The Group’s policy is to recognise unbilled revenue only where the economic benefits are expected to flow to the Group. As a result, the judgements applied, and the assumptions underpinning the judgements, are considered to be appropriate. Change in these assumptions would have an impact on the amount of revenue recognised in any given period. In the year, in relation to electricity, the Group has been able to resolve a number of long-standing issues relating to the quality of grid supply point metering and national settlements data. As a result, while significant estimation uncertainty remains, the aggregate level of non-half-hourly and half-hourly volume associated with such factors has reduced in the year. This improvement in confidence in estimation has enabled an additional revenue amount of c. £60m (1.1% of unbilled energy income) to be recognised in the year. In relation to unbilled gas revenue estimation, the experience of the Group is that the industry estimated supplied quantities of gas consumed have historically been higher than actual metered supply. To take account of this, the Group has applied a further judgement, being a percentage reduction to unbilled consumption volume, to the measurement of its unbilled revenue in the financial statements. It is expected that this judgement will become less critical as the industry transitions to smart meter technology. The sensitivity associated with this judgement factor is disclosed at Note 18.
(iii) Valuation of trade receivables – estimation uncertaintyThe Group’s exposure to credit risk, and therefore the basis of determining the provisions for bad and doubtful debts, is explained within the Accompanying Information section A6 at pages 176 to 184. While the provisions are considered to be appropriate, changes in estimation basis or in economic conditions could lead to a change in the level of provisions recorded and consequently on the charge or credit to the income statement.
The analysis of the ageing of trade receivables, movement in the provision for bad and doubtful debts and the net trade receivables expected to be recoverable is detailed within the Accompanying Information section A6 at pages 176 to 184.
(iv) Retirement benefit obligations – estimation uncertaintyThe assumptions in relation to the cost of providing post-retirement benefits during the period are based on the Group’s best estimates and are set after consultation with qualified actuaries. While these assumptions are believed to be appropriate, a change in these assumptions would impact the level of the retirement benefit obligation recorded and the cost to the Group of administering the schemes. Further detail of the calculation basis and key assumptions used, the resulting movements in obligations and the sensitivity of key assumptions to the obligation is disclosed at Note 23.
4.2 Other key accounting judgements Other key accounting judgements applied in the preparation of these Financial Statements include the following:
(i) Business Combinations and acquisitions – accounting judgementBusiness combinations and acquisitions require a fair value exercise to be undertaken to allocate the purchase price to the fair value of the identifiable assets acquired and the liabilities assumed. The determination of the fair value of the assets and liabilities is based, to a certain extent, on management’s judgement. The amount of goodwill initially recognised as a result of a business combination is dependent on the allocation of this purchase price to the identifiable assets and liabilities with any unallocated portion being recorded as goodwill. Business combinations are disclosed in Note 12.
(ii) Treatment of disputes and claims – accounting judgementThe Group is exposed to the risk of litigation, regulatory judgements and contractual disputes through the course of its normal operations. The Group considers each instance separately in accordance with legal advice and will provide or disclose information as deemed appropriate. Changes in the assumptions around the likelihood of an outflow of economic resources or the estimation of any obligation would change the values recognised in the financial statements. Provisions for disputes and claims are disclosed in Note 20.
(iii) Consolidation of interest in investments and trading arrangements – accounting judgementJudgement is often required in assessing the level of control held by the Group in its investments or trading arrangements. Depending on the balance of facts and circumstances in each case, the Group may either have control, joint control or significant influence over the entity or arrangement. Where the Group has joint control of an arrangement, judgement is also required to assess whether the arrangement is a joint operation or a joint venture.
Clyde Windfarm (Scotland)In the prior financial year, the Group completed the sale of 49.9% of the equity in Clyde Windfarm (Scotland) Limited (‘Clyde’). Details of this transaction are included at Note 12. As part of the Group providing project and contract management services for and 100% of the funding for the construction of the 172.8MW extension of the wind farm, the Group had retained rights around the engineering, procurement and construction of the extension and therefore concluded to confer power to control the relevant activities of Clyde to the Group. As a consequence, this entity was fully consolidated into the Group’s financial statements as a subsidiary at 31 March 2016.
On 13 May 2016, the Group agreed to waive those contractual rights which gave rise to the judgement that power to control the relevant activities existed over Clyde. All other contractual arrangements remained in place. As a consequence, the Group has since accounted for its interest in Clyde as that of an investment in an equity-accounted joint venture. One of the impacts of the change to the consolidation basis was to remove the equivalent to the £200.7m of non-recourse borrowings held by Clyde at 31 March 2016 from the Group’s consolidated
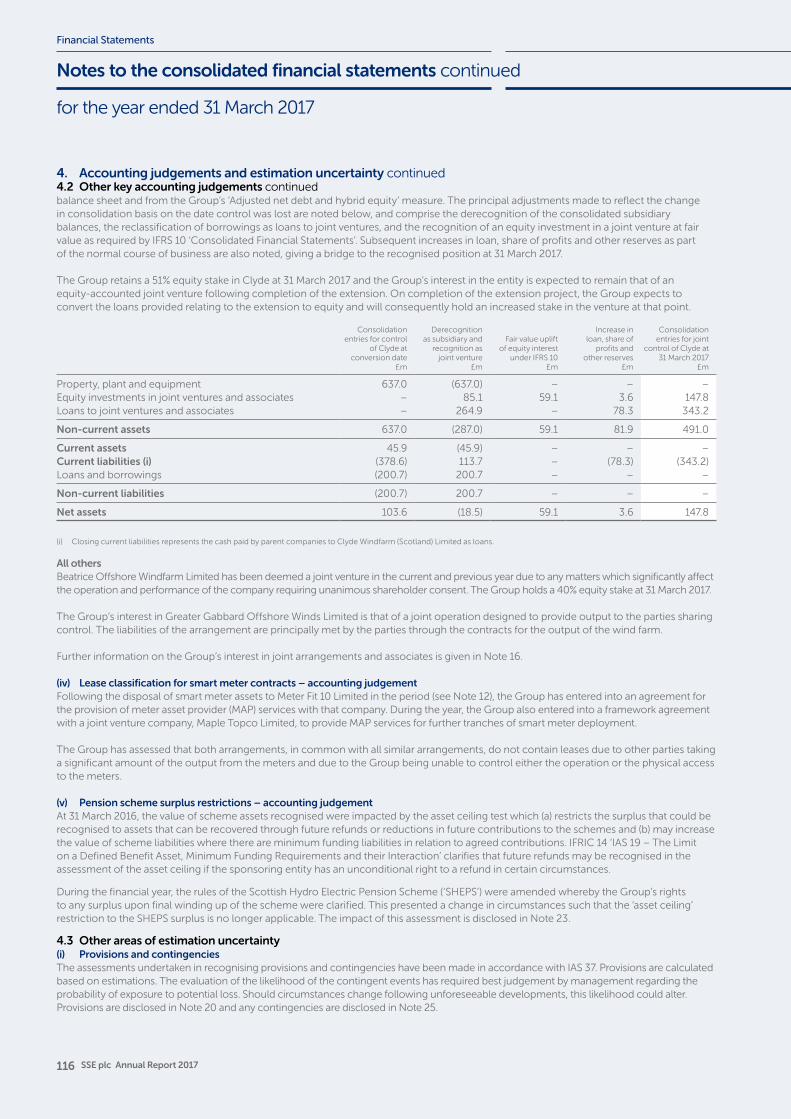
116 SSE plc Annual Report 2017
Financial Statements
for the year ended 31 March 2017
Notes to the consolidated financial statements continued
4. Accounting judgements and estimation uncertainty continued4.2 Other key accounting judgements continuedbalance sheet and from the Group’s ‘Adjusted net debt and hybrid equity’ measure. The principal adjustments made to reflect the change in consolidation basis on the date control was lost are noted below, and comprise the derecognition of the consolidated subsidiary balances, the reclassification of borrowings as loans to joint ventures, and the recognition of an equity investment in a joint venture at fair value as required by IFRS 10 ‘Consolidated Financial Statements’. Subsequent increases in loan, share of profits and other reserves as part of the normal course of business are also noted, giving a bridge to the recognised position at 31 March 2017.
The Group retains a 51% equity stake in Clyde at 31 March 2017 and the Group’s interest in the entity is expected to remain that of an equity-accounted joint venture following completion of the extension. On completion of the extension project, the Group expects to convert the loans provided relating to the extension to equity and will consequently hold an increased stake in the venture at that point.
Consolidation entries for control
of Clyde at conversion date
£m
Derecognition as subsidiary and
recognition as joint venture
£m
Fair value uplift of equity interest
under IFRS 10£m
Increase in loan, share of
profits and other reserves
£m
Consolidation entries for joint
control of Clyde at 31 March 2017
£m
Property, plant and equipment 637.0 (637.0) – – –Equity investments in joint ventures and associates – 85.1 59.1 3.6 147.8Loans to joint ventures and associates – 264.9 – 78.3 343.2
Non-current assets 637.0 (287.0) 59.1 81.9 491.0
Current assets 45.9 (45.9) – – –Current liabilities (i) (378.6) 113.7 – (78.3) (343.2)Loans and borrowings (200.7) 200.7 – – –
Non-current liabilities (200.7) 200.7 – – –
Net assets 103.6 (18.5) 59.1 3.6 147.8
(i) Closing current liabilities represents the cash paid by parent companies to Clyde Windfarm (Scotland) Limited as loans.
All othersBeatrice Offshore Windfarm Limited has been deemed a joint venture in the current and previous year due to any matters which significantly affect the operation and performance of the company requiring unanimous shareholder consent. The Group holds a 40% equity stake at 31 March 2017.
The Group’s interest in Greater Gabbard Offshore Winds Limited is that of a joint operation designed to provide output to the parties sharing control. The liabilities of the arrangement are principally met by the parties through the contracts for the output of the wind farm.
Further information on the Group’s interest in joint arrangements and associates is given in Note 16.
(iv) Lease classification for smart meter contracts – accounting judgementFollowing the disposal of smart meter assets to Meter Fit 10 Limited in the period (see Note 12), the Group has entered into an agreement for the provision of meter asset provider (MAP) services with that company. During the year, the Group also entered into a framework agreement with a joint venture company, Maple Topco Limited, to provide MAP services for further tranches of smart meter deployment.
The Group has assessed that both arrangements, in common with all similar arrangements, do not contain leases due to other parties taking a significant amount of the output from the meters and due to the Group being unable to control either the operation or the physical access to the meters.
(v) Pension scheme surplus restrictions – accounting judgementAt 31 March 2016, the value of scheme assets recognised were impacted by the asset ceiling test which (a) restricts the surplus that could be recognised to assets that can be recovered through future refunds or reductions in future contributions to the schemes and (b) may increase the value of scheme liabilities where there are minimum funding liabilities in relation to agreed contributions. IFRIC 14 ‘IAS 19 – The Limit on a Defined Benefit Asset, Minimum Funding Requirements and their Interaction’ clarifies that future refunds may be recognised in the assessment of the asset ceiling if the sponsoring entity has an unconditional right to a refund in certain circumstances.
During the financial year, the rules of the Scottish Hydro Electric Pension Scheme (‘SHEPS’) were amended whereby the Group’s rights to any surplus upon final winding up of the scheme were clarified. This presented a change in circumstances such that the ‘asset ceiling’ restriction to the SHEPS surplus is no longer applicable. The impact of this assessment is disclosed in Note 23.
4.3 Other areas of estimation uncertainty(i) Provisions and contingenciesThe assessments undertaken in recognising provisions and contingencies have been made in accordance with IAS 37. Provisions are calculated based on estimations. The evaluation of the likelihood of the contingent events has required best judgement by management regarding the probability of exposure to potential loss. Should circumstances change following unforeseeable developments, this likelihood could alter. Provisions are disclosed in Note 20 and any contingencies are disclosed in Note 25.
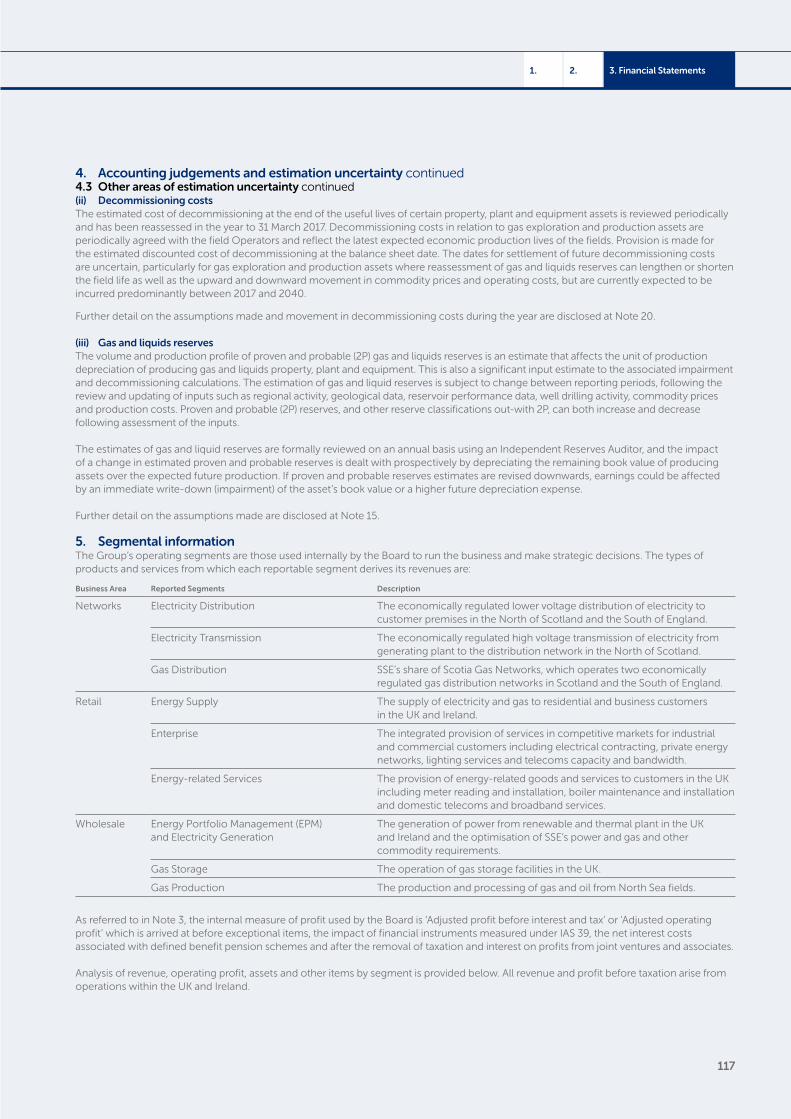
117
3. Financial Statements2.1.
4. Accounting judgements and estimation uncertainty continued4.3 Other areas of estimation uncertainty continued(ii) Decommissioning costsThe estimated cost of decommissioning at the end of the useful lives of certain property, plant and equipment assets is reviewed periodically and has been reassessed in the year to 31 March 2017. Decommissioning costs in relation to gas exploration and production assets are periodically agreed with the field Operators and reflect the latest expected economic production lives of the fields. Provision is made for the estimated discounted cost of decommissioning at the balance sheet date. The dates for settlement of future decommissioning costs are uncertain, particularly for gas exploration and production assets where reassessment of gas and liquids reserves can lengthen or shorten the field life as well as the upward and downward movement in commodity prices and operating costs, but are currently expected to be incurred predominantly between 2017 and 2040.
Further detail on the assumptions made and movement in decommissioning costs during the year are disclosed at Note 20.
(iii) Gas and liquids reservesThe volume and production profile of proven and probable (2P) gas and liquids reserves is an estimate that affects the unit of production depreciation of producing gas and liquids property, plant and equipment. This is also a significant input estimate to the associated impairment and decommissioning calculations. The estimation of gas and liquid reserves is subject to change between reporting periods, following the review and updating of inputs such as regional activity, geological data, reservoir performance data, well drilling activity, commodity prices and production costs. Proven and probable (2P) reserves, and other reserve classifications out-with 2P, can both increase and decrease following assessment of the inputs.
The estimates of gas and liquid reserves are formally reviewed on an annual basis using an Independent Reserves Auditor, and the impact of a change in estimated proven and probable reserves is dealt with prospectively by depreciating the remaining book value of producing assets over the expected future production. If proven and probable reserves estimates are revised downwards, earnings could be affected by an immediate write-down (impairment) of the asset’s book value or a higher future depreciation expense.
Further detail on the assumptions made are disclosed at Note 15.
5. Segmental informationThe Group’s operating segments are those used internally by the Board to run the business and make strategic decisions. The types of products and services from which each reportable segment derives its revenues are:
Business Area Reported Segments Description
Networks Electricity Distribution The economically regulated lower voltage distribution of electricity to customer premises in the North of Scotland and the South of England.
Electricity Transmission The economically regulated high voltage transmission of electricity from generating plant to the distribution network in the North of Scotland.
Gas Distribution SSE’s share of Scotia Gas Networks, which operates two economically regulated gas distribution networks in Scotland and the South of England.
Retail Energy Supply The supply of electricity and gas to residential and business customers in the UK and Ireland.
Enterprise The integrated provision of services in competitive markets for industrial and commercial customers including electrical contracting, private energy networks, lighting services and telecoms capacity and bandwidth.
Energy-related Services The provision of energy-related goods and services to customers in the UK including meter reading and installation, boiler maintenance and installation and domestic telecoms and broadband services.
Wholesale Energy Portfolio Management (EPM) and Electricity Generation
The generation of power from renewable and thermal plant in the UK and Ireland and the optimisation of SSE’s power and gas and other commodity requirements.
Gas Storage The operation of gas storage facilities in the UK.
Gas Production The production and processing of gas and oil from North Sea fields.
As referred to in Note 3, the internal measure of profit used by the Board is ‘Adjusted profit before interest and tax’ or ‘Adjusted operating profit’ which is arrived at before exceptional items, the impact of financial instruments measured under IAS 39, the net interest costs associated with defined benefit pension schemes and after the removal of taxation and interest on profits from joint ventures and associates.
Analysis of revenue, operating profit, assets and other items by segment is provided below. All revenue and profit before taxation arise from operations within the UK and Ireland.
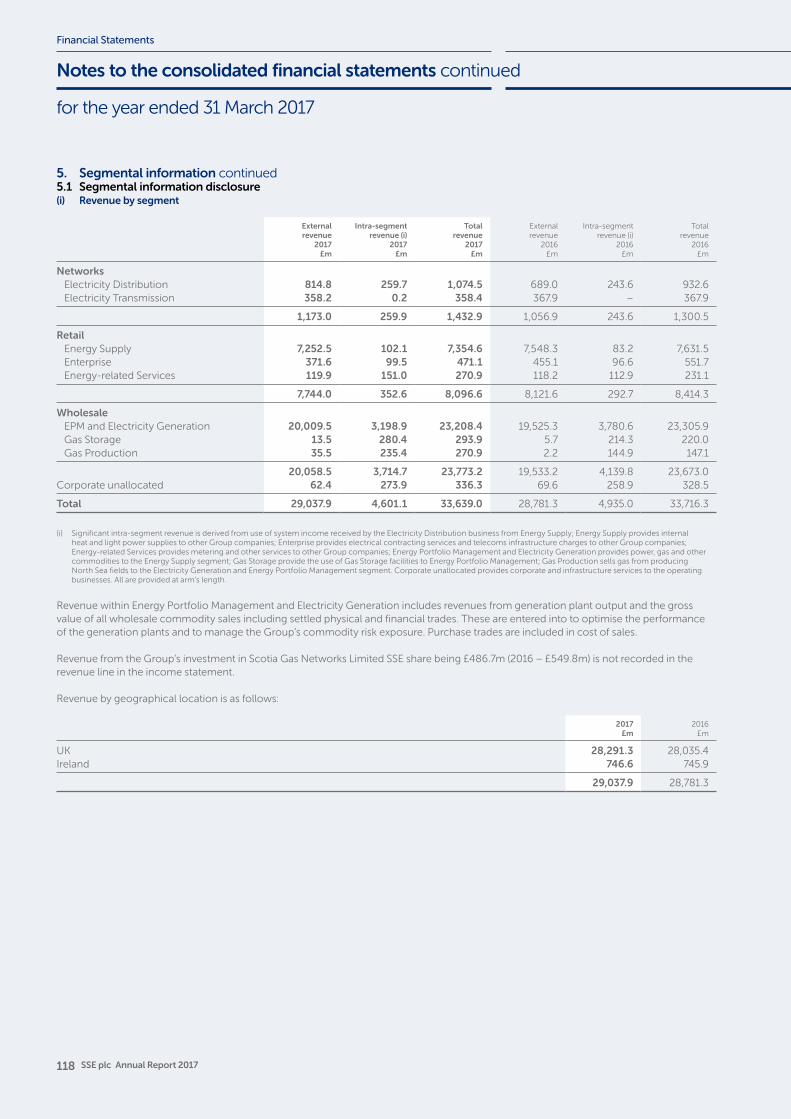
118 SSE plc Annual Report 2017
Financial Statements
for the year ended 31 March 2017
Notes to the consolidated financial statements continued
5. Segmental information continued5.1 Segmental information disclosure(i) Revenue by segment
Externalrevenue
2017£m
Intra-segment revenue (i)
2017£m
Totalrevenue
2017£m
Externalrevenue
2016£m
Intra-segment revenue (i)
2016£m
Totalrevenue
2016£m
NetworksElectricity Distribution 814.8 259.7 1,074.5 689.0 243.6 932.6Electricity Transmission 358.2 0.2 358.4 367.9 – 367.9
1,173.0 259.9 1,432.9 1,056.9 243.6 1,300.5
RetailEnergy Supply 7,252.5 102.1 7,354.6 7,548.3 83.2 7,631.5Enterprise 371.6 99.5 471.1 455.1 96.6 551.7Energy-related Services 119.9 151.0 270.9 118.2 112.9 231.1
7,744.0 352.6 8,096.6 8,121.6 292.7 8,414.3
WholesaleEPM and Electricity Generation 20,009.5 3,198.9 23,208.4 19,525.3 3,780.6 23,305.9Gas Storage 13.5 280.4 293.9 5.7 214.3 220.0Gas Production 35.5 235.4 270.9 2.2 144.9 147.1
20,058.5 3,714.7 23,773.2 19,533.2 4,139.8 23,673.0Corporate unallocated 62.4 273.9 336.3 69.6 258.9 328.5
Total 29,037.9 4,601.1 33,639.0 28,781.3 4,935.0 33,716.3
(i) Significant intra-segment revenue is derived from use of system income received by the Electricity Distribution business from Energy Supply; Energy Supply provides internal heat and light power supplies to other Group companies; Enterprise provides electrical contracting services and telecoms infrastructure charges to other Group companies; Energy-related Services provides metering and other services to other Group companies; Energy Portfolio Management and Electricity Generation provides power, gas and other commodities to the Energy Supply segment; Gas Storage provide the use of Gas Storage facilities to Energy Portfolio Management; Gas Production sells gas from producing North Sea fields to the Electricity Generation and Energy Portfolio Management segment. Corporate unallocated provides corporate and infrastructure services to the operating businesses. All are provided at arm’s length.
Revenue within Energy Portfolio Management and Electricity Generation includes revenues from generation plant output and the gross value of all wholesale commodity sales including settled physical and financial trades. These are entered into to optimise the performance of the generation plants and to manage the Group’s commodity risk exposure. Purchase trades are included in cost of sales.
Revenue from the Group’s investment in Scotia Gas Networks Limited SSE share being £486.7m (2016 – £549.8m) is not recorded in the revenue line in the income statement.
Revenue by geographical location is as follows:
2017£m
2016£m
UK 28,291.3 28,035.4Ireland 746.6 745.9
29,037.9 28,781.3
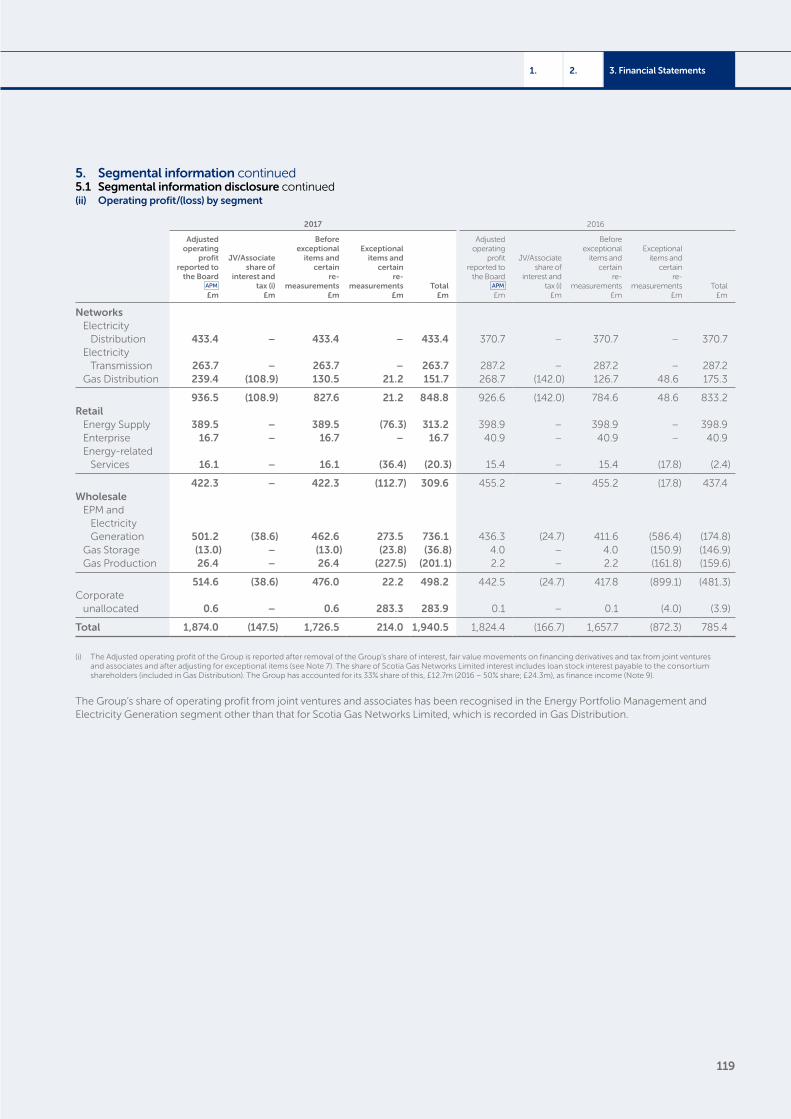
119
3. Financial Statements2.1.
5. Segmental information continued5.1 Segmental information disclosure continued(ii) Operating profit/(loss) by segment
2017 2016
Adjusted operating
profit reported to
the Board
£m
JV/Associate share of
interest and tax (i)
£m
Before exceptional
items and certain
re-measurements
£m
Exceptional items and
certain re-
measurements£m
Total£m
Adjusted operating
profit reported to
the Board
£m
JV/Associate share of
interest and tax (i)
£m
Before exceptional
items and certain
re-measurements
£m
Exceptional items and
certain re-
measurements£m
Total£m
NetworksElectricity
Distribution 433.4 – 433.4 – 433.4 370.7 – 370.7 – 370.7Electricity
Transmission 263.7 – 263.7 – 263.7 287.2 – 287.2 – 287.2Gas Distribution 239.4 (108.9) 130.5 21.2 151.7 268.7 (142.0) 126.7 48.6 175.3
936.5 (108.9) 827.6 21.2 848.8 926.6 (142.0) 784.6 48.6 833.2Retail
Energy Supply 389.5 – 389.5 (76.3) 313.2 398.9 – 398.9 – 398.9Enterprise 16.7 – 16.7 – 16.7 40.9 – 40.9 – 40.9Energy-related
Services 16.1 – 16.1 (36.4) (20.3) 15.4 – 15.4 (17.8) (2.4)
422.3 – 422.3 (112.7) 309.6 455.2 – 455.2 (17.8) 437.4Wholesale
EPM and Electricity Generation 501.2 (38.6) 462.6 273.5 736.1 436.3 (24.7) 411.6 (586.4) (174.8)
Gas Storage (13.0) – (13.0) (23.8) (36.8) 4.0 – 4.0 (150.9) (146.9)Gas Production 26.4 – 26.4 (227.5) (201.1) 2.2 – 2.2 (161.8) (159.6)
514.6 (38.6) 476.0 22.2 498.2 442.5 (24.7) 417.8 (899.1) (481.3)Corporate
unallocated 0.6 – 0.6 283.3 283.9 0.1 – 0.1 (4.0) (3.9)
Total 1,874.0 (147.5) 1,726.5 214.0 1,940.5 1,824.4 (166.7) 1,657.7 (872.3) 785.4
(i) The Adjusted operating profit of the Group is reported after removal of the Group’s share of interest, fair value movements on financing derivatives and tax from joint ventures and associates and after adjusting for exceptional items (see Note 7). The share of Scotia Gas Networks Limited interest includes loan stock interest payable to the consortium shareholders (included in Gas Distribution). The Group has accounted for its 33% share of this, £12.7m (2016 – 50% share; £24.3m), as finance income (Note 9).
The Group’s share of operating profit from joint ventures and associates has been recognised in the Energy Portfolio Management and Electricity Generation segment other than that for Scotia Gas Networks Limited, which is recorded in Gas Distribution.
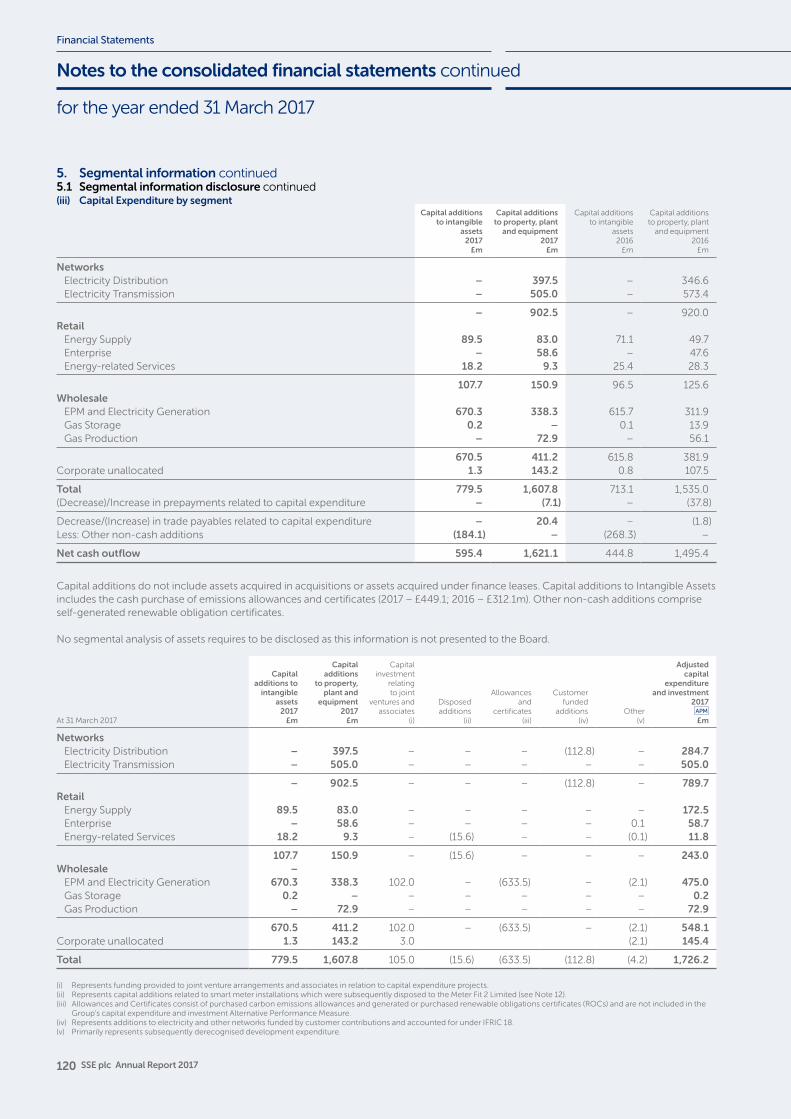
120 SSE plc Annual Report 2017
Financial Statements
for the year ended 31 March 2017
Notes to the consolidated financial statements continued
5. Segmental information continued5.1 Segmental information disclosure continued(iii) Capital Expenditure by segment
Capital additions to intangible
assets 2017
£m
Capital additions to property, plant
and equipment2017
£m
Capital additions to intangible
assets 2016
£m
Capital additions to property, plant
and equipment2016
£m
NetworksElectricity Distribution – 397.5 – 346.6Electricity Transmission – 505.0 – 573.4
– 902.5 – 920.0Retail
Energy Supply 89.5 83.0 71.1 49.7Enterprise – 58.6 – 47.6Energy-related Services 18.2 9.3 25.4 28.3
107.7 150.9 96.5 125.6Wholesale
EPM and Electricity Generation 670.3 338.3 615.7 311.9Gas Storage 0.2 – 0.1 13.9Gas Production – 72.9 – 56.1
670.5 411.2 615.8 381.9Corporate unallocated 1.3 143.2 0.8 107.5
Total 779.5 1,607.8 713.1 1,535.0(Decrease)/Increase in prepayments related to capital expenditure – (7.1) – (37.8)
Decrease/(Increase) in trade payables related to capital expenditure – 20.4 – (1.8)Less: Other non-cash additions (184.1) – (268.3) –
Net cash outflow 595.4 1,621.1 444.8 1,495.4
Capital additions do not include assets acquired in acquisitions or assets acquired under finance leases. Capital additions to Intangible Assets includes the cash purchase of emissions allowances and certificates (2017 – £449.1; 2016 – £312.1m). Other non-cash additions comprise self-generated renewable obligation certificates.
No segmental analysis of assets requires to be disclosed as this information is not presented to the Board.
At 31 March 2017
Capital additions to
intangible assets
2017£m
Capital additions
to property, plant and
equipment2017
£m
Capital investment
relating to joint
ventures and associates
(i)
Disposed additions
(ii)
Allowances and
certificates (iii)
Customer funded
additions (iv)
Other(v)
Adjustedcapital
expenditure and investment
2017
£m
NetworksElectricity Distribution – 397.5 – – – (112.8) – 284.7Electricity Transmission – 505.0 – – – – – 505.0
– 902.5 – – – (112.8) – 789.7Retail
Energy Supply 89.5 83.0 – – – – – 172.5Enterprise – 58.6 – – – – 0.1 58.7Energy-related Services 18.2 9.3 – (15.6) – – (0.1) 11.8
107.7 150.9 – (15.6) – – – 243.0Wholesale –
EPM and Electricity Generation 670.3 338.3 102.0 – (633.5) – (2.1) 475.0Gas Storage 0.2 – – – – – – 0.2Gas Production – 72.9 – – – – – 72.9
670.5 411.2 102.0 – (633.5) – (2.1) 548.1Corporate unallocated 1.3 143.2 3.0 (2.1) 145.4
Total 779.5 1,607.8 105.0 (15.6) (633.5) (112.8) (4.2) 1,726.2
(i) Represents funding provided to joint venture arrangements and associates in relation to capital expenditure projects.(ii) Represents capital additions related to smart meter installations which were subsequently disposed to the Meter Fit 2 Limited (see Note 12).(iii) Allowances and Certificates consist of purchased carbon emissions allowances and generated or purchased renewable obligations certificates (ROCs) and are not included in the
Group’s capital expenditure and investment Alternative Performance Measure.(iv) Represents additions to electricity and other networks funded by customer contributions and accounted for under IFRIC 18.(v) Primarily represents subsequently derecognised development expenditure.
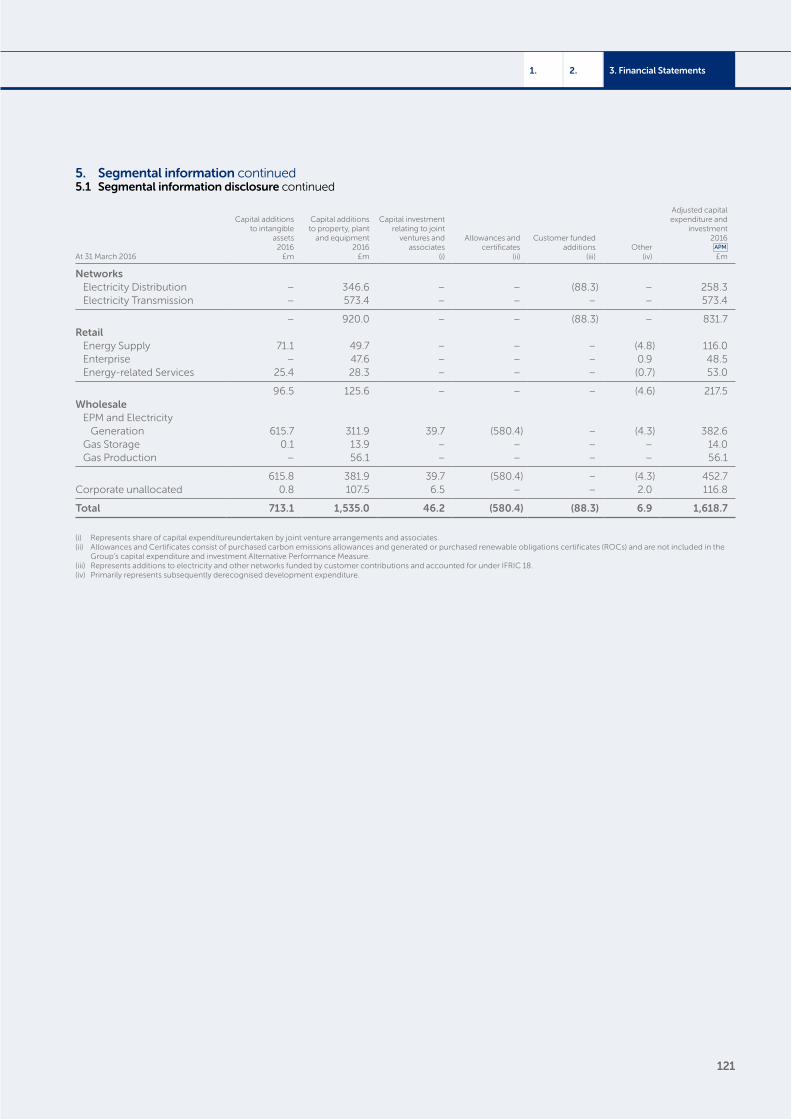
121
3. Financial Statements2.1.
5. Segmental information continued5.1 Segmental information disclosure continued
At 31 March 2016
Capital additions to intangible
assets 2016
£m
Capital additions to property, plant
and equipment2016
£m
Capital investment relating to joint
ventures and associates
(i)
Allowances and certificates
(ii)
Customer funded additions
(iii)Other
(iv)
Adjusted capital expenditure and
investment2016
£m
NetworksElectricity Distribution – 346.6 – – (88.3) – 258.3Electricity Transmission – 573.4 – – – – 573.4
– 920.0 – – (88.3) – 831.7Retail
Energy Supply 71.1 49.7 – – – (4.8) 116.0Enterprise – 47.6 – – – 0.9 48.5Energy-related Services 25.4 28.3 – – – (0.7) 53.0
96.5 125.6 – – – (4.6) 217.5Wholesale
EPM and Electricity Generation 615.7 311.9 39.7 (580.4) – (4.3) 382.6
Gas Storage 0.1 13.9 – – – – 14.0Gas Production – 56.1 – – – – 56.1
615.8 381.9 39.7 (580.4) – (4.3) 452.7Corporate unallocated 0.8 107.5 6.5 – – 2.0 116.8
Total 713.1 1,535.0 46.2 (580.4) (88.3) 6.9 1,618.7
(i) Represents share of capital expenditureundertaken by joint venture arrangements and associates.(ii) Allowances and Certificates consist of purchased carbon emissions allowances and generated or purchased renewable obligations certificates (ROCs) and are not included in the
Group’s capital expenditure and investment Alternative Performance Measure.(iii) Represents additions to electricity and other networks funded by customer contributions and accounted for under IFRIC 18.(iv) Primarily represents subsequently derecognised development expenditure.
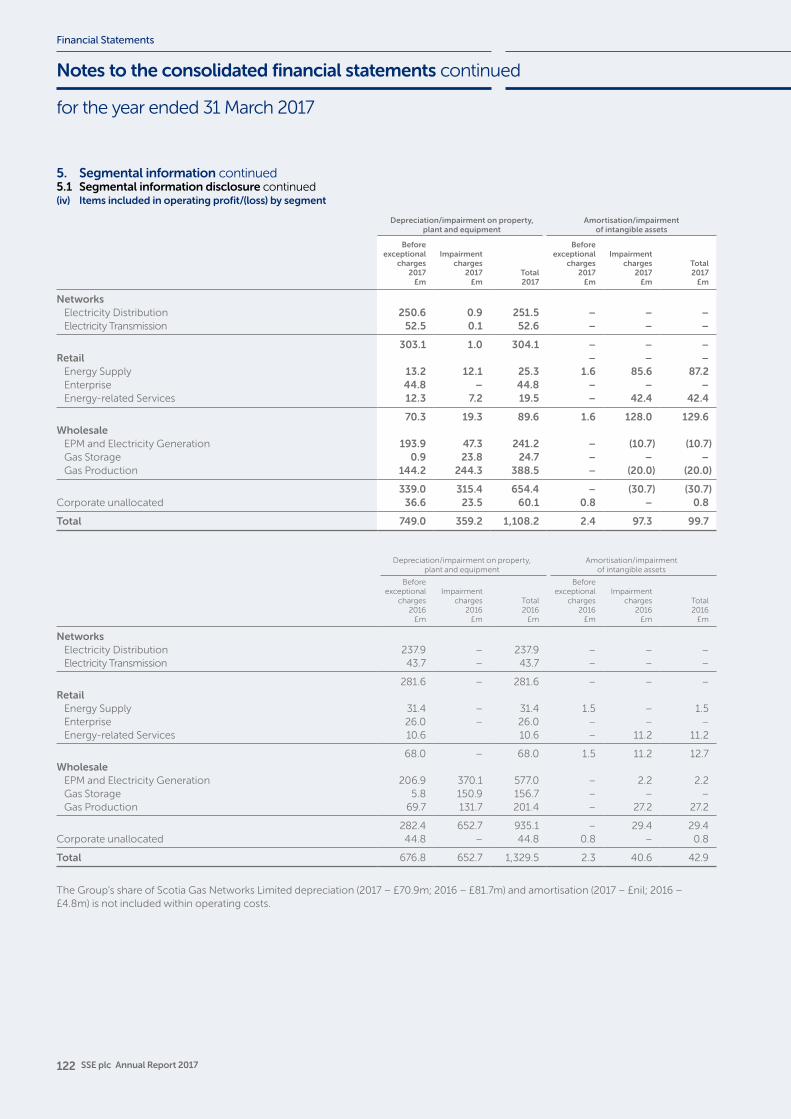
122 SSE plc Annual Report 2017
Financial Statements
Notes to the consolidated financial statements continued
for the year ended 31 March 2017
5. Segmental information continued5.1 Segmental information disclosure continued(iv) Items included in operating profit/(loss) by segment
Depreciation/impairment on property, plant and equipment
Amortisation/impairment of intangible assets
Before exceptional
charges 2017
£m
Impairment charges
2017£m
Total2017
Before exceptional
charges 2017
£m
Impairment charges
2017£m
Total2017
£m
NetworksElectricity Distribution 250.6 0.9 251.5 – – –Electricity Transmission 52.5 0.1 52.6 – – –
303.1 1.0 304.1 – – –Retail – – –
Energy Supply 13.2 12.1 25.3 1.6 85.6 87.2Enterprise 44.8 – 44.8 – – –Energy-related Services 12.3 7.2 19.5 – 42.4 42.4
70.3 19.3 89.6 1.6 128.0 129.6Wholesale
EPM and Electricity Generation 193.9 47.3 241.2 – (10.7) (10.7)Gas Storage 0.9 23.8 24.7 – – –Gas Production 144.2 244.3 388.5 – (20.0) (20.0)
339.0 315.4 654.4 – (30.7) (30.7)Corporate unallocated 36.6 23.5 60.1 0.8 – 0.8
Total 749.0 359.2 1,108.2 2.4 97.3 99.7
Depreciation/impairment on property, plant and equipment
Amortisation/impairment of intangible assets
Before exceptional
charges 2016
£m
Impairment charges
2016£m
Total2016
£m
Before exceptional
charges 2016
£m
Impairment charges
2016£m
Total2016
£m
NetworksElectricity Distribution 237.9 – 237.9 – – –Electricity Transmission 43.7 – 43.7 – – –
281.6 – 281.6 – – –Retail
Energy Supply 31.4 – 31.4 1.5 – 1.5Enterprise 26.0 – 26.0 – – –Energy-related Services 10.6 10.6 – 11.2 11.2
68.0 – 68.0 1.5 11.2 12.7Wholesale
EPM and Electricity Generation 206.9 370.1 577.0 – 2.2 2.2Gas Storage 5.8 150.9 156.7 – – –Gas Production 69.7 131.7 201.4 – 27.2 27.2
282.4 652.7 935.1 – 29.4 29.4Corporate unallocated 44.8 – 44.8 0.8 – 0.8
Total 676.8 652.7 1,329.5 2.3 40.6 42.9
The Group’s share of Scotia Gas Networks Limited depreciation (2017 – £70.9m; 2016 – £81.7m) and amortisation (2017 – £nil; 2016 – £4.8m) is not included within operating costs.
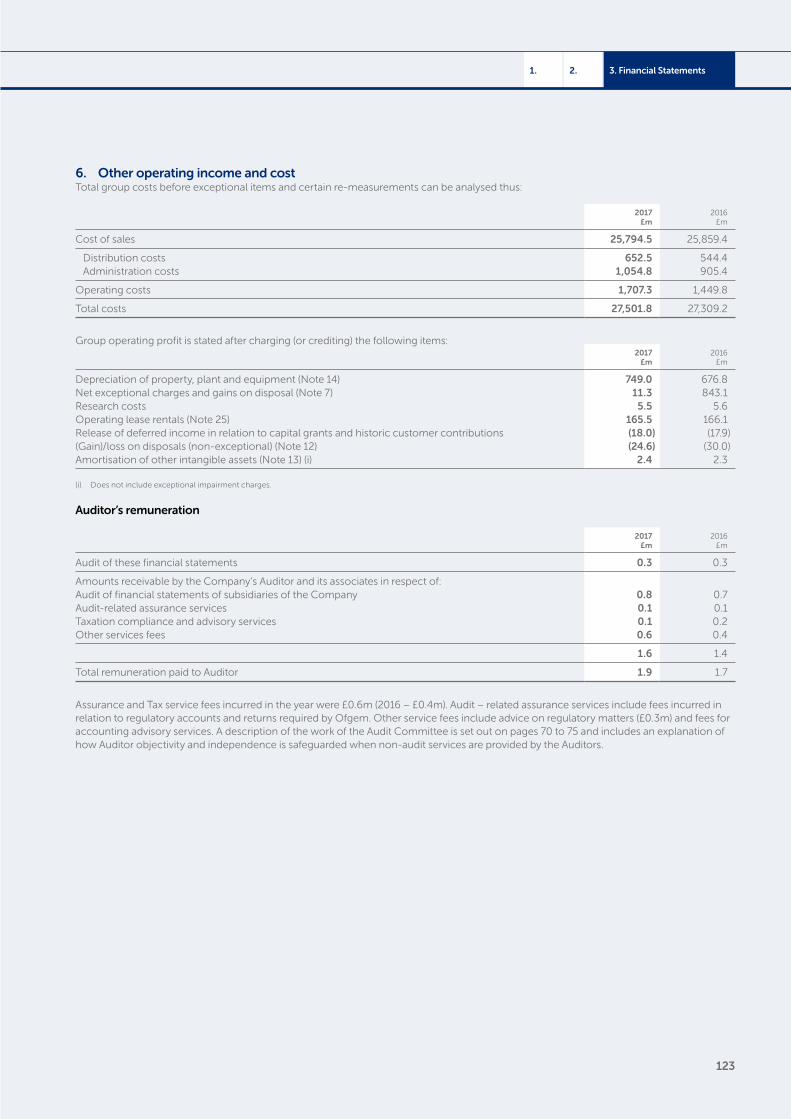
123
3. Financial Statements2.1.
6. Other operating income and costTotal group costs before exceptional items and certain re-measurements can be analysed thus:
2017£m
2016£m
Cost of sales 25,794.5 25,859.4
Distribution costs 652.5 544.4Administration costs 1,054.8 905.4
Operating costs 1,707.3 1,449.8
Total costs 27,501.8 27,309.2
Group operating profit is stated after charging (or crediting) the following items: 2017
£m2016
£m
Depreciation of property, plant and equipment (Note 14) 749.0 676.8Net exceptional charges and gains on disposal (Note 7) 11.3 843.1Research costs 5.5 5.6Operating lease rentals (Note 25) 165.5 166.1Release of deferred income in relation to capital grants and historic customer contributions (18.0) (17.9)(Gain)/loss on disposals (non-exceptional) (Note 12) (24.6) (30.0)Amortisation of other intangible assets (Note 13) (i) 2.4 2.3
(i) Does not include exceptional impairment charges.
Auditor’s remuneration
2017£m
2016£m
Audit of these financial statements 0.3 0.3
Amounts receivable by the Company’s Auditor and its associates in respect of:Audit of financial statements of subsidiaries of the Company 0.8 0.7Audit-related assurance services 0.1 0.1Taxation compliance and advisory services 0.1 0.2Other services fees 0.6 0.4
1.6 1.4
Total remuneration paid to Auditor 1.9 1.7
Assurance and Tax service fees incurred in the year were £0.6m (2016 – £0.4m). Audit – related assurance services include fees incurred in relation to regulatory accounts and returns required by Ofgem. Other service fees include advice on regulatory matters (£0.3m) and fees for accounting advisory services. A description of the work of the Audit Committee is set out on pages 70 to 75 and includes an explanation of how Auditor objectivity and independence is safeguarded when non-audit services are provided by the Auditors.
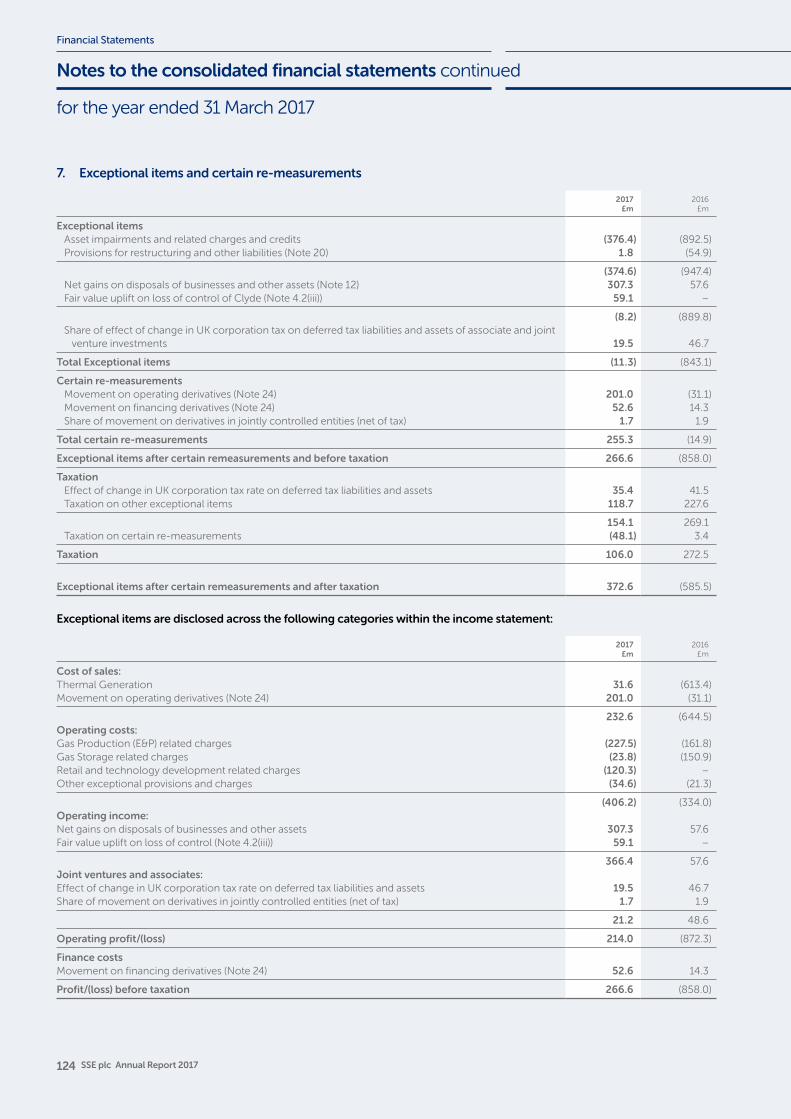
124 SSE plc Annual Report 2017
Financial Statements
for the year ended 31 March 2017
Notes to the consolidated financial statements continued
7. Exceptional items and certain re-measurements
2017£m
2016£m
Exceptional items Asset impairments and related charges and credits (376.4) (892.5)Provisions for restructuring and other liabilities (Note 20) 1.8 (54.9)
(374.6) (947.4)Net gains on disposals of businesses and other assets (Note 12) 307.3 57.6Fair value uplift on loss of control of Clyde (Note 4.2(iii)) 59.1 –
(8.2) (889.8)Share of effect of change in UK corporation tax on deferred tax liabilities and assets of associate and joint
venture investments 19.5 46.7
Total Exceptional items (11.3) (843.1)
Certain re-measurements Movement on operating derivatives (Note 24) 201.0 (31.1)Movement on financing derivatives (Note 24) 52.6 14.3Share of movement on derivatives in jointly controlled entities (net of tax) 1.7 1.9
Total certain re-measurements 255.3 (14.9)
Exceptional items after certain remeasurements and before taxation 266.6 (858.0)
Taxation Effect of change in UK corporation tax rate on deferred tax liabilities and assets 35.4 41.5Taxation on other exceptional items 118.7 227.6
154.1 269.1Taxation on certain re-measurements (48.1) 3.4
Taxation 106.0 272.5
Exceptional items after certain remeasurements and after taxation 372.6 (585.5)
Exceptional items are disclosed across the following categories within the income statement:
2017£m
2016£m
Cost of sales:Thermal Generation 31.6 (613.4)Movement on operating derivatives (Note 24) 201.0 (31.1)
232.6 (644.5)Operating costs:Gas Production (E&P) related charges (227.5) (161.8)Gas Storage related charges (23.8) (150.9)Retail and technology development related charges (120.3) –Other exceptional provisions and charges (34.6) (21.3)
(406.2) (334.0)Operating income:Net gains on disposals of businesses and other assets 307.3 57.6Fair value uplift on loss of control (Note 4.2(iii)) 59.1 –
366.4 57.6Joint ventures and associates:Effect of change in UK corporation tax rate on deferred tax liabilities and assets 19.5 46.7Share of movement on derivatives in jointly controlled entities (net of tax) 1.7 1.9
21.2 48.6
Operating profit/(loss) 214.0 (872.3)
Finance costsMovement on financing derivatives (Note 24) 52.6 14.3
Profit/(loss) before taxation 266.6 (858.0)
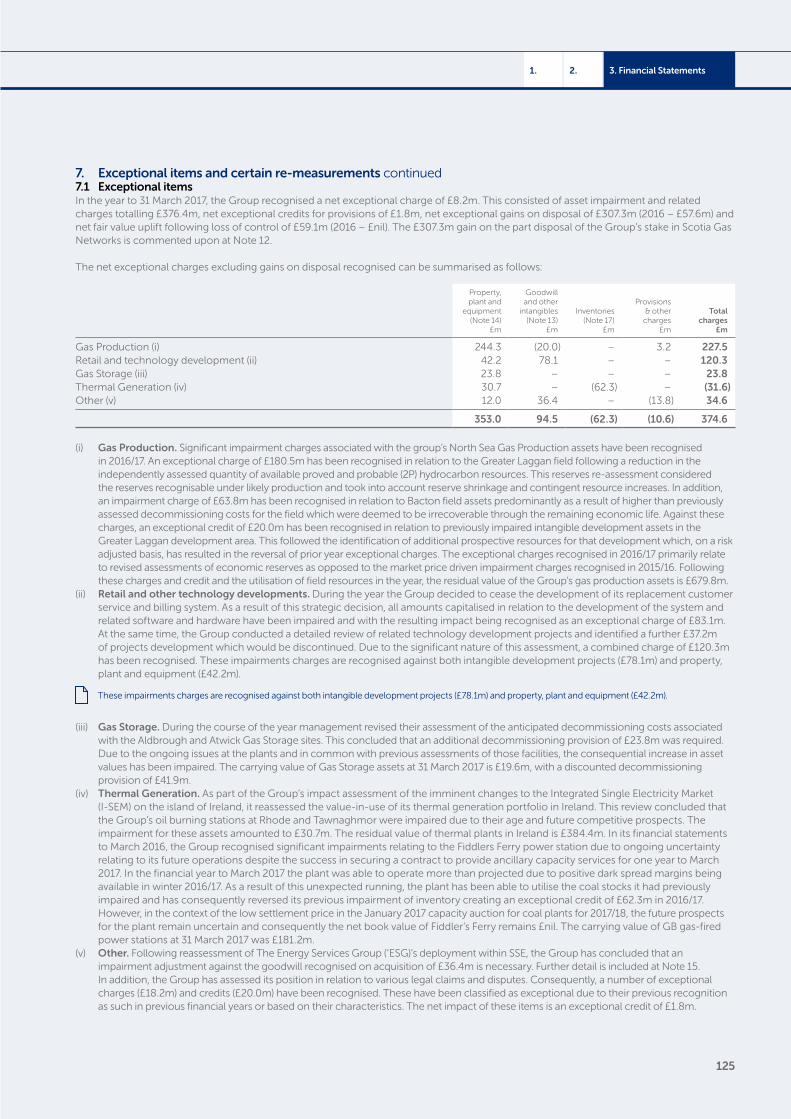
125
3. Financial Statements2.1.
7. Exceptional items and certain re-measurements continued7.1 Exceptional itemsIn the year to 31 March 2017, the Group recognised a net exceptional charge of £8.2m. This consisted of asset impairment and related charges totalling £376.4m, net exceptional credits for provisions of £1.8m, net exceptional gains on disposal of £307.3m (2016 – £57.6m) and net fair value uplift following loss of control of £59.1m (2016 – £nil). The £307.3m gain on the part disposal of the Group’s stake in Scotia Gas Networks is commented upon at Note 12.
The net exceptional charges excluding gains on disposal recognised can be summarised as follows:
Property, plant and
equipment (Note 14)
£m
Goodwill and other
intangibles (Note 13)
£m
Inventories (Note 17)
£m
Provisions & other
charges£m
Totalcharges
£m
Gas Production (i) 244.3 (20.0) – 3.2 227.5Retail and technology development (ii) 42.2 78.1 – – 120.3Gas Storage (iii) 23.8 – – – 23.8Thermal Generation (iv) 30.7 – (62.3) – (31.6)Other (v) 12.0 36.4 – (13.8) 34.6
353.0 94.5 (62.3) (10.6) 374.6
(i) Gas Production. Significant impairment charges associated with the group’s North Sea Gas Production assets have been recognised in 2016/17. An exceptional charge of £180.5m has been recognised in relation to the Greater Laggan field following a reduction in the independently assessed quantity of available proved and probable (2P) hydrocarbon resources. This reserves re-assessment considered the reserves recognisable under likely production and took into account reserve shrinkage and contingent resource increases. In addition, an impairment charge of £63.8m has been recognised in relation to Bacton field assets predominantly as a result of higher than previously assessed decommissioning costs for the field which were deemed to be irrecoverable through the remaining economic life. Against these charges, an exceptional credit of £20.0m has been recognised in relation to previously impaired intangible development assets in the Greater Laggan development area. This followed the identification of additional prospective resources for that development which, on a risk adjusted basis, has resulted in the reversal of prior year exceptional charges. The exceptional charges recognised in 2016/17 primarily relate to revised assessments of economic reserves as opposed to the market price driven impairment charges recognised in 2015/16. Following these charges and credit and the utilisation of field resources in the year, the residual value of the Group’s gas production assets is £679.8m.
(ii) Retail and other technology developments. During the year the Group decided to cease the development of its replacement customer service and billing system. As a result of this strategic decision, all amounts capitalised in relation to the development of the system and related software and hardware have been impaired and with the resulting impact being recognised as an exceptional charge of £83.1m. At the same time, the Group conducted a detailed review of related technology development projects and identified a further £37.2m of projects development which would be discontinued. Due to the significant nature of this assessment, a combined charge of £120.3m has been recognised. These impairments charges are recognised against both intangible development projects (£78.1m) and property, plant and equipment (£42.2m).
These impairments charges are recognised against both intangible development projects (£78.1m) and property, plant and equipment (£42.2m).
(iii) Gas Storage. During the course of the year management revised their assessment of the anticipated decommissioning costs associated with the Aldbrough and Atwick Gas Storage sites. This concluded that an additional decommissioning provision of £23.8m was required. Due to the ongoing issues at the plants and in common with previous assessments of those facilities, the consequential increase in asset values has been impaired. The carrying value of Gas Storage assets at 31 March 2017 is £19.6m, with a discounted decommissioning provision of £41.9m.
(iv) Thermal Generation. As part of the Group’s impact assessment of the imminent changes to the Integrated Single Electricity Market (I-SEM) on the island of Ireland, it reassessed the value-in-use of its thermal generation portfolio in Ireland. This review concluded that the Group’s oil burning stations at Rhode and Tawnaghmor were impaired due to their age and future competitive prospects. The impairment for these assets amounted to £30.7m. The residual value of thermal plants in Ireland is £384.4m. In its financial statements to March 2016, the Group recognised significant impairments relating to the Fiddlers Ferry power station due to ongoing uncertainty relating to its future operations despite the success in securing a contract to provide ancillary capacity services for one year to March 2017. In the financial year to March 2017 the plant was able to operate more than projected due to positive dark spread margins being available in winter 2016/17. As a result of this unexpected running, the plant has been able to utilise the coal stocks it had previously impaired and has consequently reversed its previous impairment of inventory creating an exceptional credit of £62.3m in 2016/17. However, in the context of the low settlement price in the January 2017 capacity auction for coal plants for 2017/18, the future prospects for the plant remain uncertain and consequently the net book value of Fiddler’s Ferry remains £nil. The carrying value of GB gas-fired power stations at 31 March 2017 was £181.2m.
(v) Other. Following reassessment of The Energy Services Group (‘ESG)’s deployment within SSE, the Group has concluded that an impairment adjustment against the goodwill recognised on acquisition of £36.4m is necessary. Further detail is included at Note 15. In addition, the Group has assessed its position in relation to various legal claims and disputes. Consequently, a number of exceptional charges (£18.2m) and credits (£20.0m) have been recognised. These have been classified as exceptional due to their previous recognition as such in previous financial years or based on their characteristics. The net impact of these items is an exceptional credit of £1.8m.
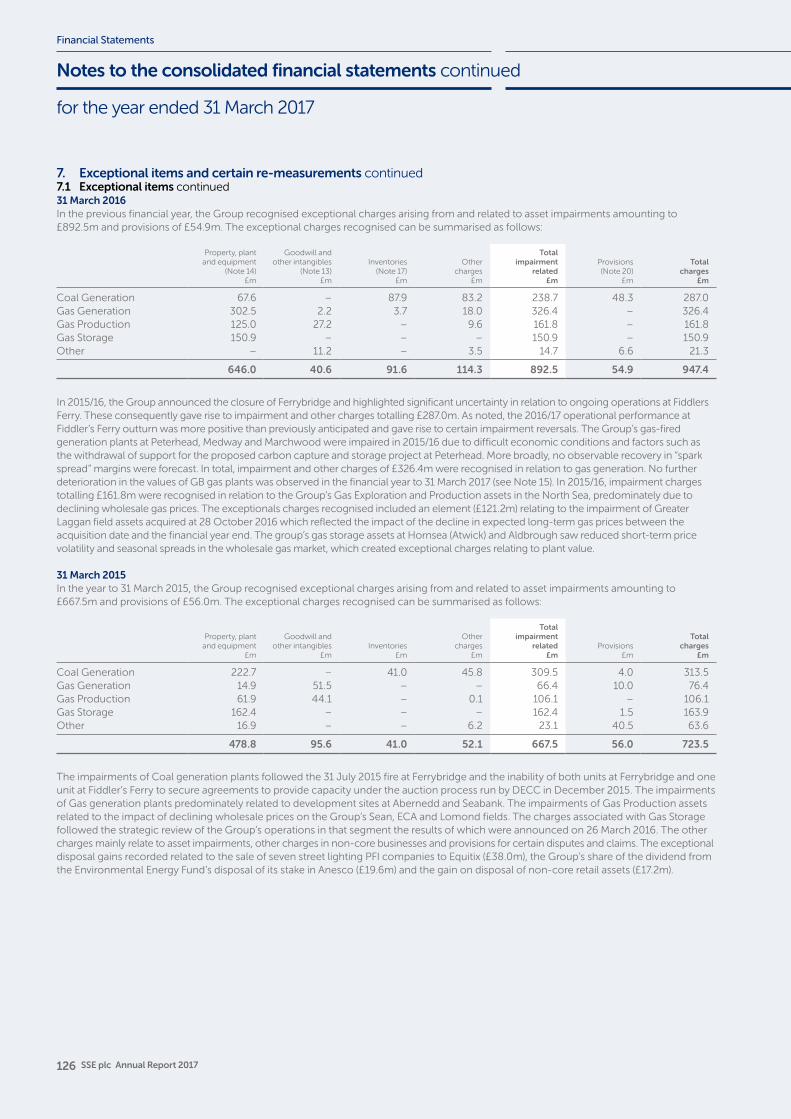
126 SSE plc Annual Report 2017
Financial Statements
for the year ended 31 March 2017
Notes to the consolidated financial statements continued
7. Exceptional items and certain re-measurements continued7.1 Exceptional items continued31 March 2016In the previous financial year, the Group recognised exceptional charges arising from and related to asset impairments amounting to £892.5m and provisions of £54.9m. The exceptional charges recognised can be summarised as follows:
Property, plant and equipment
(Note 14)£m
Goodwill and other intangibles
(Note 13)£m
Inventories (Note 17)
£m
Other charges
£m
Totalimpairment
related£m
Provisions (Note 20)
£m
Total charges
£m
Coal Generation 67.6 – 87.9 83.2 238.7 48.3 287.0Gas Generation 302.5 2.2 3.7 18.0 326.4 – 326.4Gas Production 125.0 27.2 – 9.6 161.8 – 161.8Gas Storage 150.9 – – – 150.9 – 150.9Other – 11.2 – 3.5 14.7 6.6 21.3
646.0 40.6 91.6 114.3 892.5 54.9 947.4
In 2015/16, the Group announced the closure of Ferrybridge and highlighted significant uncertainty in relation to ongoing operations at Fiddlers Ferry. These consequently gave rise to impairment and other charges totalling £287.0m. As noted, the 2016/17 operational performance at Fiddler’s Ferry outturn was more positive than previously anticipated and gave rise to certain impairment reversals. The Group’s gas-fired generation plants at Peterhead, Medway and Marchwood were impaired in 2015/16 due to difficult economic conditions and factors such as the withdrawal of support for the proposed carbon capture and storage project at Peterhead. More broadly, no observable recovery in “spark spread” margins were forecast. In total, impairment and other charges of £326.4m were recognised in relation to gas generation. No further deterioration in the values of GB gas plants was observed in the financial year to 31 March 2017 (see Note 15). In 2015/16, impairment charges totalling £161.8m were recognised in relation to the Group’s Gas Exploration and Production assets in the North Sea, predominately due to declining wholesale gas prices. The exceptionals charges recognised included an element (£121.2m) relating to the impairment of Greater Laggan field assets acquired at 28 October 2016 which reflected the impact of the decline in expected long-term gas prices between the acquisition date and the financial year end. The group’s gas storage assets at Hornsea (Atwick) and Aldbrough saw reduced short-term price volatility and seasonal spreads in the wholesale gas market, which created exceptional charges relating to plant value.
31 March 2015In the year to 31 March 2015, the Group recognised exceptional charges arising from and related to asset impairments amounting to £667.5m and provisions of £56.0m. The exceptional charges recognised can be summarised as follows:
Property, plant and equipment
£m
Goodwill and other intangibles
£mInventories
£m
Other charges
£m
Totalimpairment
related£m
Provisions £m
Total charges
£m
Coal Generation 222.7 – 41.0 45.8 309.5 4.0 313.5Gas Generation 14.9 51.5 – – 66.4 10.0 76.4Gas Production 61.9 44.1 – 0.1 106.1 – 106.1Gas Storage 162.4 – – – 162.4 1.5 163.9Other 16.9 – – 6.2 23.1 40.5 63.6
478.8 95.6 41.0 52.1 667.5 56.0 723.5
The impairments of Coal generation plants followed the 31 July 2015 fire at Ferrybridge and the inability of both units at Ferrybridge and one unit at Fiddler’s Ferry to secure agreements to provide capacity under the auction process run by DECC in December 2015. The impairments of Gas generation plants predominately related to development sites at Abernedd and Seabank. The impairments of Gas Production assets related to the impact of declining wholesale prices on the Group’s Sean, ECA and Lomond fields. The charges associated with Gas Storage followed the strategic review of the Group’s operations in that segment the results of which were announced on 26 March 2016. The other charges mainly relate to asset impairments, other charges in non-core businesses and provisions for certain disputes and claims. The exceptional disposal gains recorded related to the sale of seven street lighting PFI companies to Equitix (£38.0m), the Group’s share of the dividend from the Environmental Energy Fund’s disposal of its stake in Anesco (£19.6m) and the gain on disposal of non-core retail assets (£17.2m).
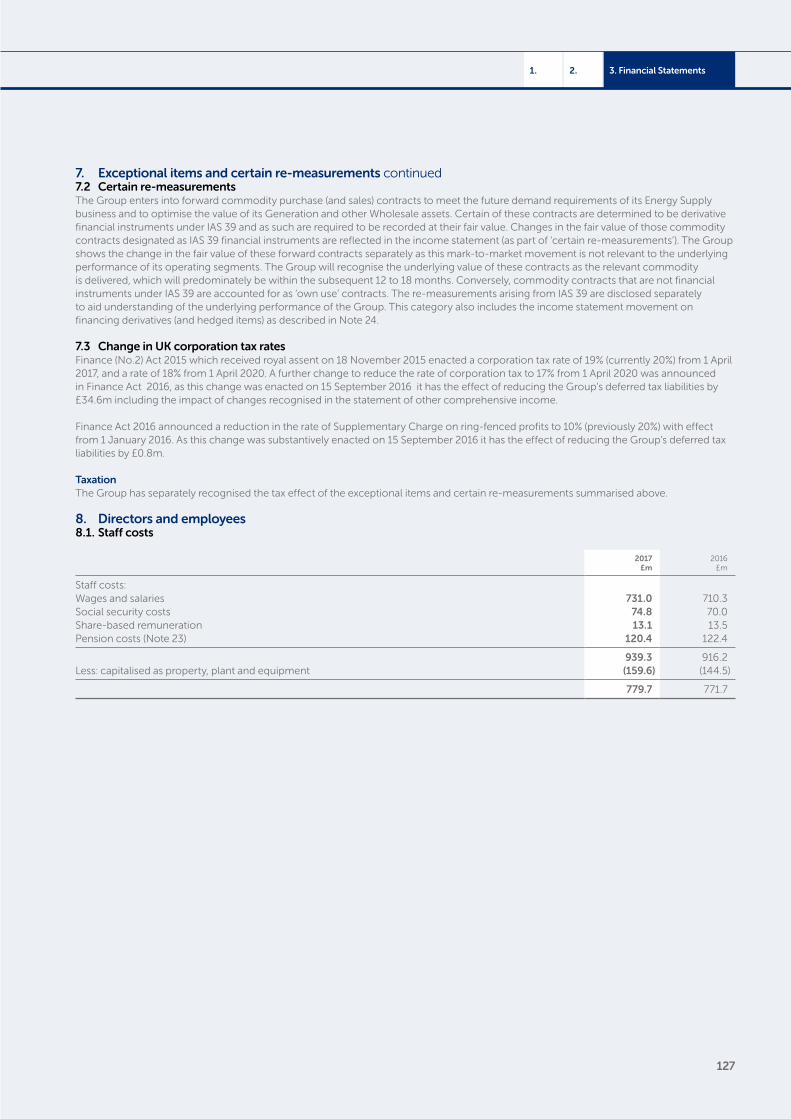
127
3. Financial Statements2.1.
7. Exceptional items and certain re-measurements continued7.2 Certain re-measurementsThe Group enters into forward commodity purchase (and sales) contracts to meet the future demand requirements of its Energy Supply business and to optimise the value of its Generation and other Wholesale assets. Certain of these contracts are determined to be derivative financial instruments under IAS 39 and as such are required to be recorded at their fair value. Changes in the fair value of those commodity contracts designated as IAS 39 financial instruments are reflected in the income statement (as part of ‘certain re-measurements’). The Group shows the change in the fair value of these forward contracts separately as this mark-to-market movement is not relevant to the underlying performance of its operating segments. The Group will recognise the underlying value of these contracts as the relevant commodity is delivered, which will predominately be within the subsequent 12 to 18 months. Conversely, commodity contracts that are not financial instruments under IAS 39 are accounted for as ‘own use’ contracts. The re-measurements arising from IAS 39 are disclosed separately to aid understanding of the underlying performance of the Group. This category also includes the income statement movement on financing derivatives (and hedged items) as described in Note 24.
7.3 Change in UK corporation tax ratesFinance (No.2) Act 2015 which received royal assent on 18 November 2015 enacted a corporation tax rate of 19% (currently 20%) from 1 April 2017, and a rate of 18% from 1 April 2020. A further change to reduce the rate of corporation tax to 17% from 1 April 2020 was announced in Finance Act 2016, as this change was enacted on 15 September 2016 it has the effect of reducing the Group’s deferred tax liabilities by £34.6m including the impact of changes recognised in the statement of other comprehensive income.
Finance Act 2016 announced a reduction in the rate of Supplementary Charge on ring-fenced profits to 10% (previously 20%) with effect from 1 January 2016. As this change was substantively enacted on 15 September 2016 it has the effect of reducing the Group’s deferred tax liabilities by £0.8m.
TaxationThe Group has separately recognised the tax effect of the exceptional items and certain re-measurements summarised above.
8. Directors and employees8.1. Staff costs
2017£m
2016£m
Staff costs:Wages and salaries 731.0 710.3Social security costs 74.8 70.0 Share-based remuneration 13.1 13.5Pension costs (Note 23) 120.4 122.4
939.3 916.2Less: capitalised as property, plant and equipment (159.6) (144.5)
779.7 771.7
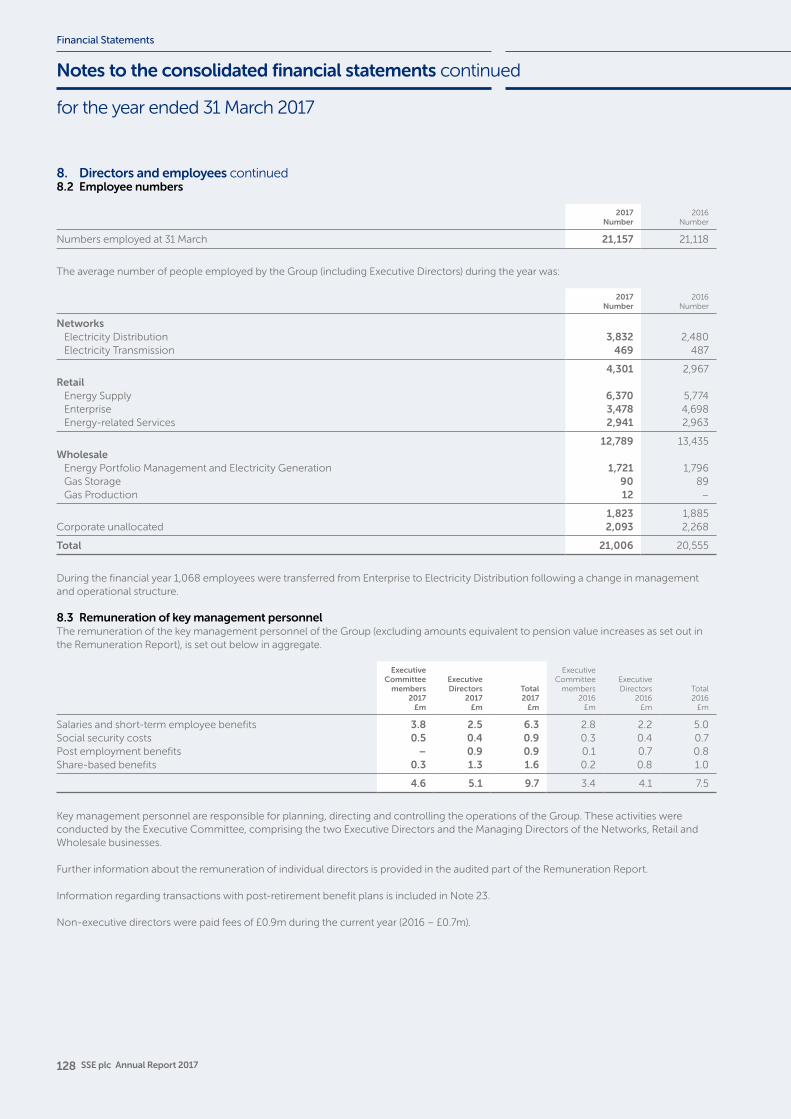
128 SSE plc Annual Report 2017
Financial Statements
for the year ended 31 March 2017
Notes to the consolidated financial statements continued
8. Directors and employees continued8.2 Employee numbers
2017Number
2016Number
Numbers employed at 31 March 21,157 21,118
The average number of people employed by the Group (including Executive Directors) during the year was:
2017Number
2016Number
NetworksElectricity Distribution 3,832 2,480Electricity Transmission 469 487
4,301 2,967Retail
Energy Supply 6,370 5,774Enterprise 3,478 4,698Energy-related Services 2,941 2,963
12,789 13,435Wholesale
Energy Portfolio Management and Electricity Generation 1,721 1,796Gas Storage 90 89Gas Production 12 –
1,823 1,885Corporate unallocated 2,093 2,268
Total 21,006 20,555
During the financial year 1,068 employees were transferred from Enterprise to Electricity Distribution following a change in management and operational structure.
8.3 Remuneration of key management personnelThe remuneration of the key management personnel of the Group (excluding amounts equivalent to pension value increases as set out in the Remuneration Report), is set out below in aggregate.
Executive Committee
members2017
£m
Executive Directors
2017£m
Total2017
£m
Executive Committee
members2016
£m
Executive Directors
2016£m
Total2016
£m
Salaries and short-term employee benefits 3.8 2.5 6.3 2.8 2.2 5.0Social security costs 0.5 0.4 0.9 0.3 0.4 0.7Post employment benefits – 0.9 0.9 0.1 0.7 0.8Share-based benefits 0.3 1.3 1.6 0.2 0.8 1.0
4.6 5.1 9.7 3.4 4.1 7.5
Key management personnel are responsible for planning, directing and controlling the operations of the Group. These activities were conducted by the Executive Committee, comprising the two Executive Directors and the Managing Directors of the Networks, Retail and Wholesale businesses.
Further information about the remuneration of individual directors is provided in the audited part of the Remuneration Report.
Information regarding transactions with post-retirement benefit plans is included in Note 23.
Non-executive directors were paid fees of £0.9m during the current year (2016 – £0.7m).
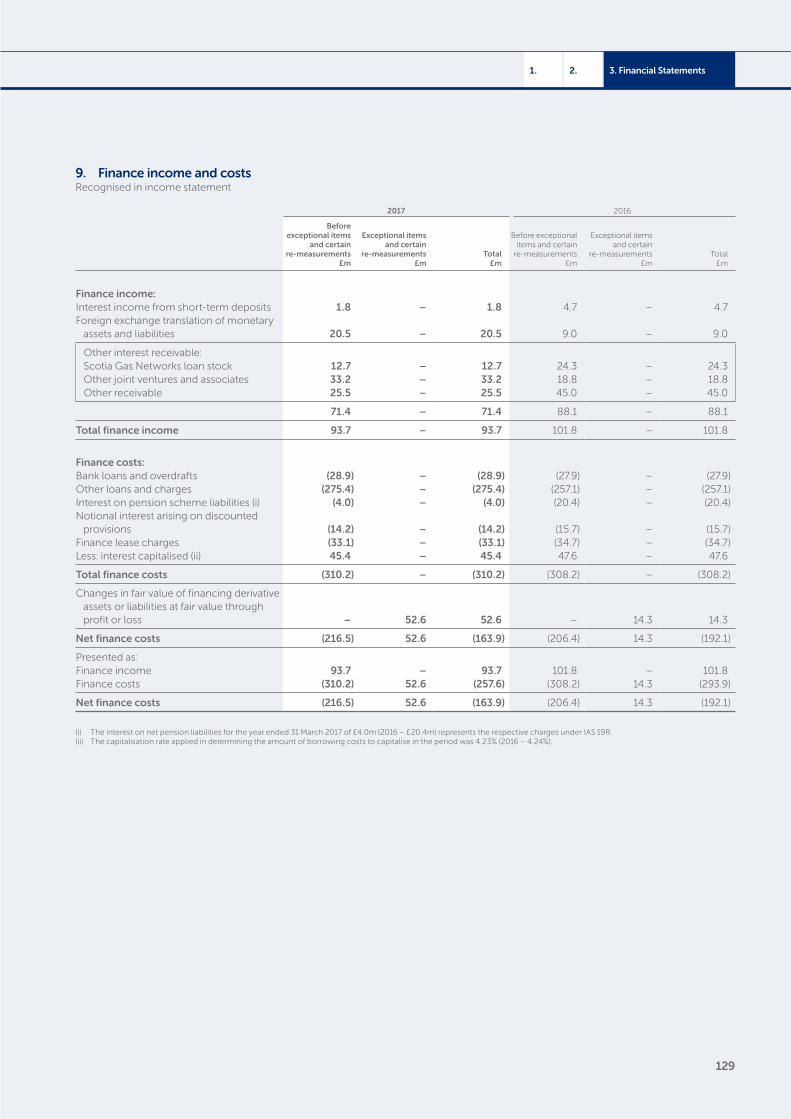
129
3. Financial Statements2.1.
9. Finance income and costsRecognised in income statement
2017 2016
Before exceptional items
and certain re-measurements
£m
Exceptional items and certain
re-measurements £m
Total£m
Before exceptional items and certain
re-measurements £m
Exceptional items and certain
re-measurements £m
Total£m
Finance income:Interest income from short-term deposits 1.8 – 1.8 4.7 – 4.7Foreign exchange translation of monetary
assets and liabilities 20.5 – 20.5 9.0 – 9.0
Other interest receivable:Scotia Gas Networks loan stock 12.7 – 12.7 24.3 – 24.3Other joint ventures and associates 33.2 – 33.2 18.8 – 18.8Other receivable 25.5 – 25.5 45.0 – 45.0
71.4 – 71.4 88.1 – 88.1
Total finance income 93.7 – 93.7 101.8 – 101.8
Finance costs:Bank loans and overdrafts (28.9) – (28.9) (27.9) – (27.9)Other loans and charges (275.4) – (275.4) (257.1) – (257.1)Interest on pension scheme liabilities (i) (4.0) – (4.0) (20.4) – (20.4)Notional interest arising on discounted
provisions (14.2) – (14.2) (15.7) – (15.7)Finance lease charges (33.1) – (33.1) (34.7) – (34.7)Less: interest capitalised (ii) 45.4 – 45.4 47.6 – 47.6
Total finance costs (310.2) – (310.2) (308.2) – (308.2)
Changes in fair value of financing derivative assets or liabilities at fair value through profit or loss – 52.6 52.6 – 14.3 14.3
Net finance costs (216.5) 52.6 (163.9) (206.4) 14.3 (192.1)
Presented as:Finance income 93.7 – 93.7 101.8 – 101.8Finance costs (310.2) 52.6 (257.6) (308.2) 14.3 (293.9)
Net finance costs (216.5) 52.6 (163.9) (206.4) 14.3 (192.1)
(i) The interest on net pension liabilities for the year ended 31 March 2017 of £4.0m (2016 – £20.4m) represents the respective charges under IAS 19R.(ii) The capitalisation rate applied in determining the amount of borrowing costs to capitalise in the period was 4.23% (2016 – 4.24%).
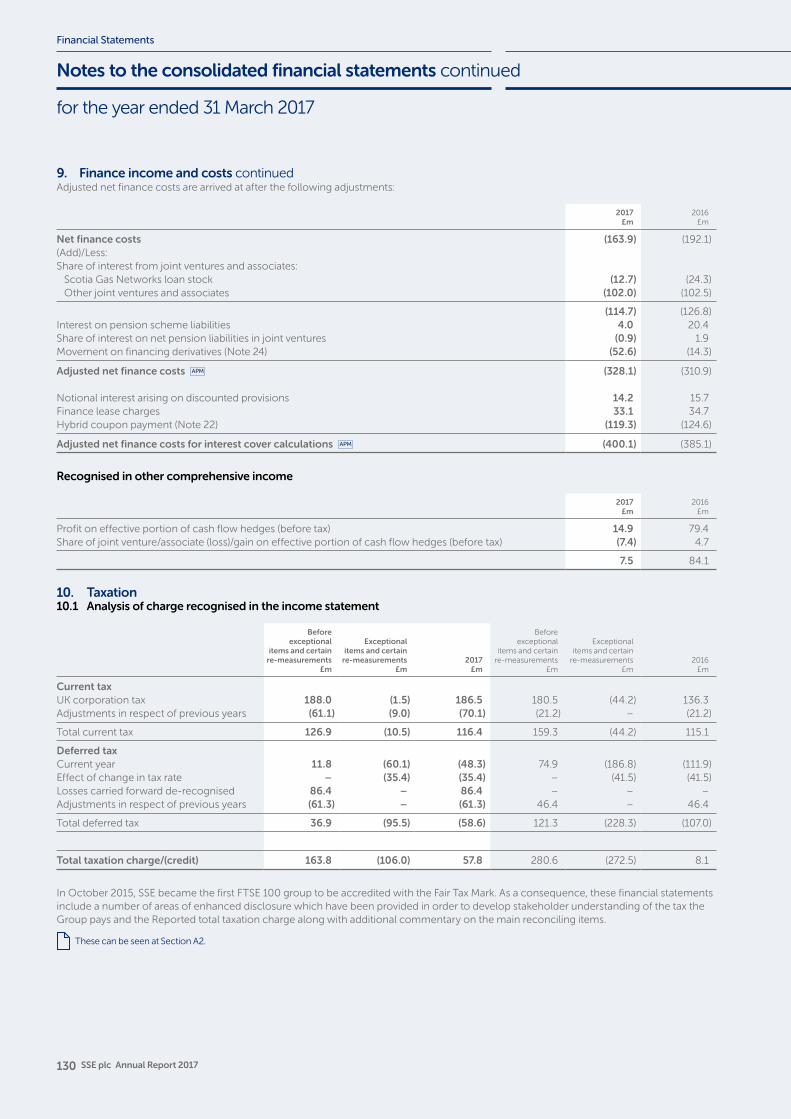
130 SSE plc Annual Report 2017
Financial Statements
for the year ended 31 March 2017
Notes to the consolidated financial statements continued
9. Finance income and costs continuedAdjusted net finance costs are arrived at after the following adjustments:
2017£m
2016£m
Net finance costs (163.9) (192.1)(Add)/Less:Share of interest from joint ventures and associates:
Scotia Gas Networks loan stock (12.7) (24.3)Other joint ventures and associates (102.0) (102.5)
(114.7) (126.8)Interest on pension scheme liabilities 4.0 20.4Share of interest on net pension liabilities in joint ventures (0.9) 1.9Movement on financing derivatives (Note 24) (52.6) (14.3)
Adjusted net finance costs (328.1) (310.9)
Notional interest arising on discounted provisions 14.2 15.7Finance lease charges 33.1 34.7Hybrid coupon payment (Note 22) (119.3) (124.6)
Adjusted net finance costs for interest cover calculations (400.1) (385.1)
Recognised in other comprehensive income
2017£m
2016£m
Profit on effective portion of cash flow hedges (before tax) 14.9 79.4Share of joint venture/associate (loss)/gain on effective portion of cash flow hedges (before tax) (7.4) 4.7
7.5 84.1
10. Taxation10.1 Analysis of charge recognised in the income statement
Beforeexceptional
items and certain re-measurements
£m
Exceptionalitems and certain
re-measurements £m
2017£m
Beforeexceptional
items and certain re-measurements
£m
Exceptionalitems and certain
re-measurements £m
2016£m
Current taxUK corporation tax 188.0 (1.5) 186.5 180.5 (44.2) 136.3Adjustments in respect of previous years (61.1) (9.0) (70.1) (21.2) – (21.2)
Total current tax 126.9 (10.5) 116.4 159.3 (44.2) 115.1
Deferred taxCurrent year 11.8 (60.1) (48.3) 74.9 (186.8) (111.9)Effect of change in tax rate – (35.4) (35.4) – (41.5) (41.5)Losses carried forward de-recognised 86.4 – 86.4 – – –Adjustments in respect of previous years (61.3) – (61.3) 46.4 – 46.4
Total deferred tax 36.9 (95.5) (58.6) 121.3 (228.3) (107.0)
Total taxation charge/(credit) 163.8 (106.0) 57.8 280.6 (272.5) 8.1
In October 2015, SSE became the first FTSE 100 group to be accredited with the Fair Tax Mark. As a consequence, these financial statements include a number of areas of enhanced disclosure which have been provided in order to develop stakeholder understanding of the tax the Group pays and the Reported total taxation charge along with additional commentary on the main reconciling items.
These can be seen at Section A2.
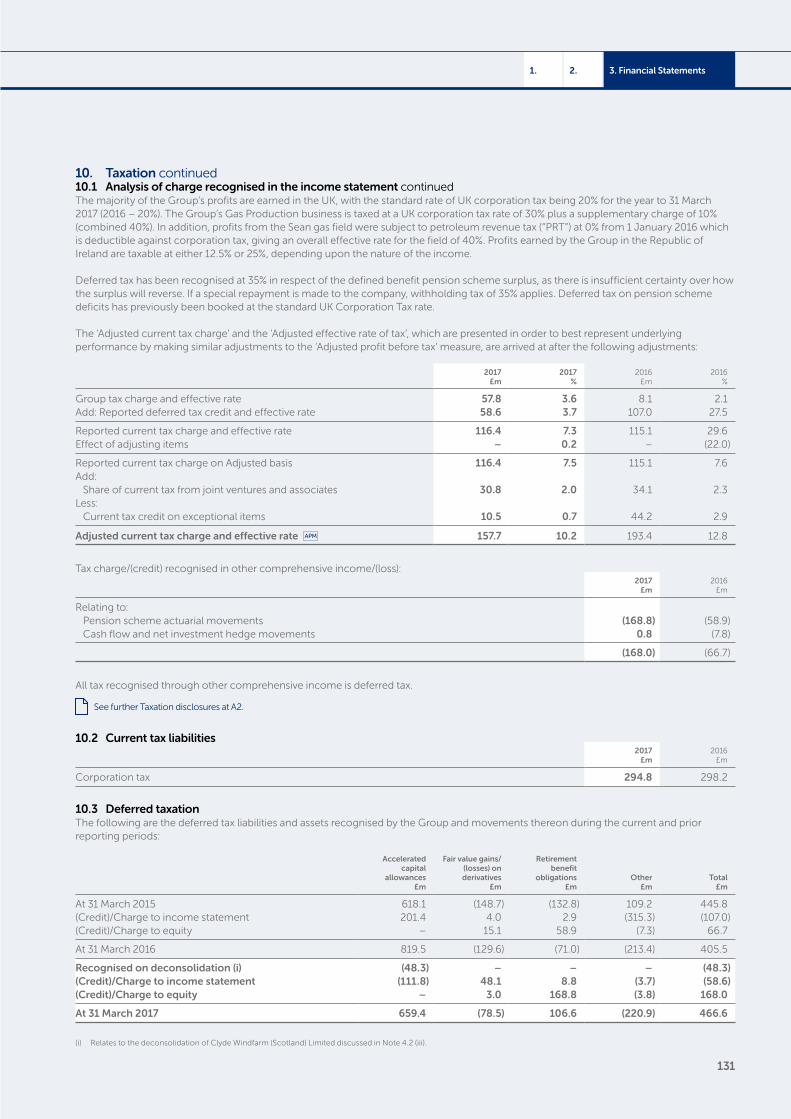
131
3. Financial Statements2.1.
10. Taxation continued10.1 Analysis of charge recognised in the income statement continuedThe majority of the Group’s profits are earned in the UK, with the standard rate of UK corporation tax being 20% for the year to 31 March 2017 (2016 – 20%). The Group’s Gas Production business is taxed at a UK corporation tax rate of 30% plus a supplementary charge of 10% (combined 40%). In addition, profits from the Sean gas field were subject to petroleum revenue tax (“PRT”) at 0% from 1 January 2016 which is deductible against corporation tax, giving an overall effective rate for the field of 40%. Profits earned by the Group in the Republic of Ireland are taxable at either 12.5% or 25%, depending upon the nature of the income.
Deferred tax has been recognised at 35% in respect of the defined benefit pension scheme surplus, as there is insufficient certainty over how the surplus will reverse. If a special repayment is made to the company, withholding tax of 35% applies. Deferred tax on pension scheme deficits has previously been booked at the standard UK Corporation Tax rate.
The ‘Adjusted current tax charge’ and the ‘Adjusted effective rate of tax’, which are presented in order to best represent underlying performance by making similar adjustments to the ‘Adjusted profit before tax’ measure, are arrived at after the following adjustments:
2017£m
2017%
2016£m
2016%
Group tax charge and effective rate 57.8 3.6 8.1 2.1Add: Reported deferred tax credit and effective rate 58.6 3.7 107.0 27.5
Reported current tax charge and effective rate 116.4 7.3 115.1 29.6Effect of adjusting items – 0.2 – (22.0)
Reported current tax charge on Adjusted basis 116.4 7.5 115.1 7.6Add:
Share of current tax from joint ventures and associates 30.8 2.0 34.1 2.3Less:
Current tax credit on exceptional items 10.5 0.7 44.2 2.9
Adjusted current tax charge and effective rate 157.7 10.2 193.4 12.8
Tax charge/(credit) recognised in other comprehensive income/(loss):2017
£m2016
£m
Relating to:Pension scheme actuarial movements (168.8) (58.9)Cash flow and net investment hedge movements 0.8 (7.8)
(168.0) (66.7)
All tax recognised through other comprehensive income is deferred tax.
See further Taxation disclosures at A2.
10.2 Current tax liabilities2017
£m2016
£m
Corporation tax 294.8 298.2
10.3 Deferred taxationThe following are the deferred tax liabilities and assets recognised by the Group and movements thereon during the current and prior reporting periods:
Acceleratedcapital
allowances£m
Fair value gains/(losses) on derivatives
£m
Retirementbenefit
obligations£m
Other£m
Total£m
At 31 March 2015 618.1 (148.7) (132.8) 109.2 445.8(Credit)/Charge to income statement 201.4 4.0 2.9 (315.3) (107.0)(Credit)/Charge to equity – 15.1 58.9 (7.3) 66.7
At 31 March 2016 819.5 (129.6) (71.0) (213.4) 405.5
Recognised on deconsolidation (i) (48.3) – – – (48.3)(Credit)/Charge to income statement (111.8) 48.1 8.8 (3.7) (58.6)(Credit)/Charge to equity – 3.0 168.8 (3.8) 168.0
At 31 March 2017 659.4 (78.5) 106.6 (220.9) 466.6
(i) Relates to the deconsolidation of Clyde Windfarm (Scotland) Limited discussed in Note 4.2 (iii).
132 SSE plc Annual Report 2017
Financial Statements
for the year ended 31 March 2017
Notes to the consolidated financial statements continued
10. Taxation continued10.3 Deferred taxation continuedCertain deferred tax assets and liabilities have been offset, including the asset balances analysed in the tables above. The following is an analysis of the deferred tax balances (after offset) for financial reporting purposes:
2017£m
2016£m
Deferred tax liabilities 788.9 917.5Deferred tax assets (322.3) (512.0)
Net deferred tax liabilities/(assets) 466.6 405.5
The deferred tax assets disclosed include the deferred tax relating to the Group’s pension scheme liabilities.
Temporary differences arising in connection with interests in associates and joint ventures are recorded as part of the Group’s share of investment in those entities. The aggregate amount of these is a charge, excluding exceptional items and re-measurement, of £6.5m (2016 – £40.5m charge).
A deferred tax asset of £112.2m (2016 – £21.1m) has not been recognised on trading losses due to uncertainty around the availability of future profits in the companies concerned.
11. Dividends and earnings per share11.1 Ordinary dividends
2017Total
£m
Settled via scrip
£m
Pence per ordinary
share
2016Total
£m
Settled via scrip
£m
Pence per ordinary
share
Interim – year ended 31 March 2017 277.1 95.3 27.4 – – –Final – year ended 31 March 2016 629.5 142.6 62.5 – – –Interim – year ended 31 March 2016 – – – 270.5 16.3 26.9Final – year ended 31 March 2015 – – – 613.5 159.5 61.8
906.6 237.9 884.0 175.8
The final dividend of 62.5p per ordinary share declared in the financial year ended 31 March 2016 (2015 – 61.8p) was approved at the Annual General Meeting on 21 July 2016 and was paid to shareholders on 23 September 2016. Shareholders were able to elect to receive ordinary shares credited as fully paid instead of the cash dividend under the terms of the Company’s scrip dividend scheme.
An interim dividend of 27.4p per ordinary share (2016 – 26.9p) was declared and paid on 17 March 2017 to those shareholders on the SSE plc share register on 20 January 2017. Shareholders were able to elect to receive ordinary shares credited as fully paid instead of the interim cash dividend under the terms of the Company’s scrip dividend scheme.
The proposed final dividend of 63.9p per ordinary share based on the number of issued ordinary shares at 31 March 2017 is subject to approval by shareholders at the Annual General Meeting and has not been included as a liability in these financial statements. Based on shares in issue at 31 March 2017, this would equate to a final dividend of £649.0m.
11.2 Basic and Adjusted earnings per shareThe calculation of basic earnings per ordinary share at 31 March 2017 is based on the net profit attributable to Ordinary shareholders and a weighted average number of ordinary shares outstanding during the year ended 31 March 2017. All earnings are from continuing operations.
Adjusted earnings per share has been calculated by excluding the charge for deferred tax, interest on net pension liabilities under IAS 19R and the impact of exceptional items and certain re-measurements (Note 7).
133
3. Financial Statements2.1.
11. Dividends and earnings per share continued11.2 Basic and Adjusted earnings per share continued
2017Earnings
£m
2017Earnings
per sharepence
2016Earnings
£m
2016Earnings
per sharepence
Basic 1,599.5 158.4 460.6 46.1Exceptional items and certain re-measurements (Note 7) (372.6) (36.9) 585.5 58.5
Basic excluding exceptional items and certain re-measurements 1,226.9 121.5 1,046.1 104.6Adjusted for:Interest on net pension scheme liabilities (Note 9) 4.0 0.4 20.4 2.0Share of interest on net pension scheme liabilities in joint venture (Note 9) (0.9) (0.1) 1.9 0.2Deferred tax 36.9 3.7 121.3 12.1Deferred tax from share of joint ventures and associates 2.0 0.2 5.8 0.6
Adjusted 1,268.9 125.7 1,195.5 119.5
Basic 1,599.5 158.4 460.6 46.1Dilutive effect of outstanding share options – (0.2) – (0.1)
Diluted 1,599.5 158.2 460.6 46.0
The weighted average number of shares used in each calculation is as follows:
31 March 2017Number of
shares(millions)
31 March 2016Number of
shares(millions)
For basic and Adjusted earnings per share 1,009.7 1,000.0Effect of exercise of share options 1.4 1.2
For diluted earnings per share 1,011.1 1,001.2
11.3 Dividend coverThe Group’s Adjusted dividend cover metric is calculated by comparing Adjusted earnings per share to the projected dividend per share payable to ordinary shareholders.
2017Earnings
per share (pence)
2017Dividend per share
(pence)
2017Dividend
cover (times)
2016Earnings
per share (pence)
2016Dividend per share
(pence)
2016Dividend
cover (times)
Reported 158.4 91.3 1.74 46.1 89.4 0.51
Adjusted 125.7 91.3 1.38 119.5 89.4 1.34
12. Acquisitions, disposals and held-for-sale assets12.1 Acquisitions The Group increased its share in the Dogger Bank Offshore Wind development on 24 March 2017 following an acquisition of an additional 12.5% stake from former consortium partner Statkraft for consideration of £15.8m. This takes SSE’s share of the project to 37.5%. In addition the Group reversed a previous impairment of £10.7m in respect of the project within other intangible assets (Note 13). The Dogger Bank offshore wind development comprises four projects which are located in the North Sea off the east coast of England and has a potential generating capacity of up to 4,800MW. Due to the development being assessed as being a joint operation, the purchase price has been wholly allocated against development assets within intangible assets.
12.2 Disposals(i) Significant disposalsOn 26 October 2016, the Group completed the disposal of a 16.7% equity stake in Scotia Gas Networks (SGN) to wholly owned subsidiaries of the Abu Dhabi Investment Authority (ADIA). After transaction costs and adjustments, cash consideration received was £615.1m and an exceptional gain on sale of £307.3m was recognised on disposal. Following the divestment, the Group will retain a 33.3% equity stake in SGN. These assets were not held for sale at 31 March 2016. The 16.7% stake of SGN sold contributed £34.2m to the Group’s Reported profits in the current financial year.
(ii) Other disposalsOn 21 January 2016, the company sold a 10% share in Beatrice Offshore Windfarm Limited to CI Beatrice I Limited and CI Beatrice II Limited split equally between the two entities for total consideration of £31.7m of which £21.2m was deferred. The deferred element of the consideration was contingent on certain events occurring after the balance sheet date. Following confirmation of those events, in May 2016, the Group received net cash proceeds of £31.7m which also included an element of deferred consideration associated with a prior divestment (£10.5m).
134 SSE plc Annual Report 2017
Financial Statements
for the year ended 31 March 2017
Notes to the consolidated financial statements continued
12. Acquisitions, disposals and held-for-sale assets12.2 Disposals continuedThe Group consequently recognised a £20.3m gain on disposal in the current year. This was deemed not to be exceptional due to the value being below the Group’s stated criteria for such items (see Note 2 (ii)).
On 26 May 2016, the Group disposed of £43.5m of smart meter assets to Meter Fit 10 Limited for cash consideration equal to book value resulting in £nil gain/(loss) on disposal and, at the same time, entered into a contract with the purchaser for meter asset services. The assets disposed were held for sale at 31 March 2016.
On 30 March 2017, the Group completed the disposal of its stake in three Tay Valley Streetlighting joint ventures in Leeds, Stoke and Newcastle to DIF Infra 4 UK Limited for net consideration of £40.4m, resulting in a gain on sale of £2.2m. This was deemed not to be exceptional due to the value being below the Group’s stated criteria for such items (see Note 3.2). This disposal reduced the Group’s Reported net debt by £129.4m. These assets were held for sale at 31 March 2016.
(iii) Disposal reconciliationThe following table summarises all businesses and assets disposed of during the financial year, including those not previously ‘held for sale’ and including other assets and investments disposed of as part of the normal course of business and which are noted in the relevant respective notes to the financial statements.
2017 2016
Held for sale at
March 2017£m
Not held for sale at
March 2017£m
Total£m
Total£m
Net assets disposed:Property, plant and equipment – 15.5 15.5 44.3Intangible and biological assets 43.5 – 43.5 11.7Investments and loans – joint ventures – 326.9 326.9 –Trade and other receivables 104.5 1.3 105.8 1.4Trade and other payables (0.9) (6.4) (7.3) 28.8Provisions 16.2 – 16.2 –Loans and borrowings (90.4) – (90.4) –
Net assets 72.9 337.3 410.2 86.2
Proceeds of disposal:Consideration 213.4 672.6 886.0 542.2Debt reduction (129.4) – (129.4) (23.5)Non-recourse loan (i) – – – (200.7)Costs of disposal (6.1) (5.6) (11.7) (5.6)Provisions (2.8) – (2.8) –
Net proceeds (i) 75.1 667.0 742.1 312.4
Gain on disposal after provisions 2.2 329.7 331.9 226.2
Presentation:Equity – – – 138.6Income statement exceptional credit – 307.3 307.3 57.6Income statement non-exceptional credit 2.2 22.4 24.6 30.0
2017£m
2016£m
Net proceeds of disposal (i) 742.1 312.4Provisions (2.8) –
Proceeds of disposal per cash flow statement 739.3 312.4Cash from Clyde transaction recorded as New Borrowings (i) – 200.7
Total cash proceeds 739.3 513.1
The debt reduction items £129.4m (2016 – £23.5m) are associated with the disposal of PFI Lighting Services companies.
(i) Due to the consolidation, at 31 March 2016, of Clyde Windfarm (Scotland) Limited, the Group required to recognise £200.7m of non-recourse borrowings due from Clyde to other shareholders. Consequently, this balance was excluded from Adjusted net debt and hybrids at that date with cash proceeds from the Clyde transaction being presented gross. The change in consolidation status of Clyde from 13 May 2016 means that this presentation is not applicable to the 31 March 2017. Further commentary is provided at Note 4.2 (iii).
135
3. Financial Statements2.1.
12. Acquisitions, disposals and held-for-sale assets continued12.3 Held-for-sale assets and liabilitiesA number of assets and liabilities associated with activities are deemed available for immediate sale and have been separately presented on the face of the balance sheet at 31 March 2017. The assets have been stated at their fair value less costs to sell.
The assets and liabilities classified as held for sale, and the comparative balances at 31 March 2017, are as follows:
2017£m
2016£m
Property, plant and equipment 63.6 –Other intangible – 27.9Derivative financial assets 2.7 –
Non-current assets 66.3 27.9
Trade and other receivables – 106.3
Derivative financial assets 4.1 –
Current assets 4.1 106.3
Total assets 70.4 134.2
Loans and borrowings – (11.2)Trade and other payables – (5.9)
Current liabilities – (17.1)
Loans and borrowings – (97.9)Deferred tax liabilities (1.4) –
Non-current liabilities (1.4) (97.9)
Total liabilities (1.4) (115.0)
Net assets 69.0 19.2
The Group has recognised £14.3m of operating wind farm assets as held for sale at 31 March 2017. The other held for sale items relate to 50% of the assets and liabilities of Ferrybridge MFE 2 Limited. This subsidiary is responsible for the development of a 70MW multi fuel power plant situated close to the operating multi fuel joint venture at Ferrybridge in which SSE has a 50% stake. SSE currently owns 100% of Ferrybridge MFE 2 Limited but has a contractual agreement, subject to various contingent matters, to dispose of 50% of the share capital of the company to the joint venture partner of the initial multi fuel facility. This transaction is anticipated to take place within the next year.
The aggregated pre-tax profit contribution of the held for sale assets and businesses in the year to 31 March 2017 was £nil (2016 – £1.8m).
During the prior items held for sale related to the remaining streetlighting activities of the group, these assets were sold during March 2017. Other assets held for sale were smart meter assets, these were sold to Meter Fit 10 Limited in April 2016.
12.4 Acquisitions and disposals in the previous year(i) Acquisitions in the previous yearOn 28 October 2015, the Group through its wholly owned subsidiary, SSE E&P UK Limited, acquired a 20% interest in the four gas fields known as the Greater Laggan Area, along with a 20% interest in the Shetland Gas Terminal, from Total E&P UK Limited. The cash consideration paid for the business was £669.0m.
(ii) Disposals in the previous yearOn 29 October 2015, the Group agreed to sell its shareholding in Galloper Wind Farm Limited to its co-venturer RWE Innogy for cash consideration of £18.3m. The gain on the disposal of £18.3m was recorded as an exceptional item. On 28 May 2015, the Group also agreed to sell three onshore wind development sites (Cour, Blackcraig, Whiteside Hill, 98MW) to Blue Energy. Total consideration for these assets was £52.4m. Consequently, an exceptional gain on disposal of £39.3m was recorded.
On 18 March 2016, the Group sold a 49.9% stake in its wholly owned operational 349.6MW Clyde Windfarm (Scotland) Limited to Greencoat UK Wind Holdco Limited (“UKW”) and GLIL Corporate Holdings Limited (“GLIL”) for cash consideration of £339.2 million after costs. At 31 March 2016, the stake held by the co-investors was deemed to be that of a non-controlling interest in an entity under the Group’s control. This key accounting judgement is explained at Note 4.2 (iii). The consequence of that judgement was that the gain recorded on disposal of £138.6m was recognised directly in equity instead of in the income statement and the non-recourse to SSE loans in the entity required to be recorded on the Group balance sheet. Following amendments to the shareholders agreements between SSE, UKW and GLIL on 13 May 2016, SSE changed its accounting of Clyde Windfarm to an equity accounted joint venture.
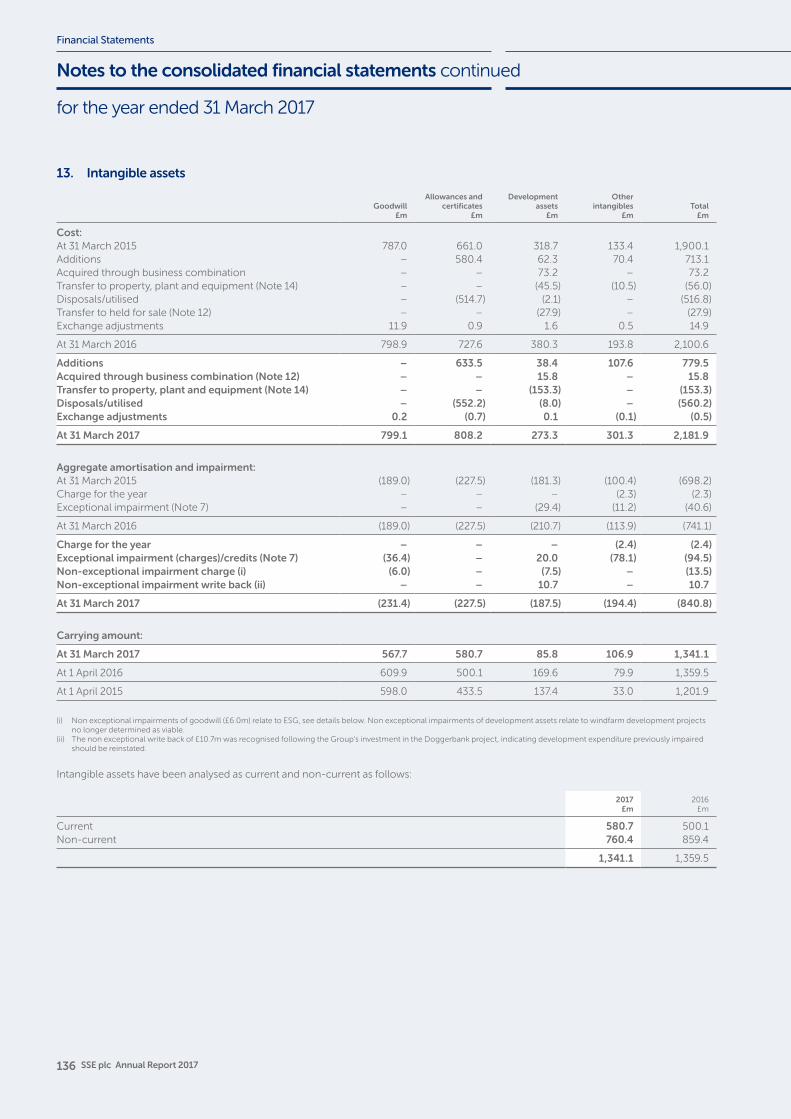
136 SSE plc Annual Report 2017
Financial Statements
for the year ended 31 March 2017
Notes to the consolidated financial statements continued
13. Intangible assets
Goodwill£m
Allowances and certificates
£m
Developmentassets
£m
Otherintangibles
£mTotal
£m
Cost:At 31 March 2015 787.0 661.0 318.7 133.4 1,900.1Additions – 580.4 62.3 70.4 713.1Acquired through business combination – – 73.2 – 73.2Transfer to property, plant and equipment (Note 14) – – (45.5) (10.5) (56.0)Disposals/utilised – (514.7) (2.1) – (516.8)Transfer to held for sale (Note 12) – – (27.9) – (27.9)Exchange adjustments 11.9 0.9 1.6 0.5 14.9
At 31 March 2016 798.9 727.6 380.3 193.8 2,100.6
Additions – 633.5 38.4 107.6 779.5Acquired through business combination (Note 12) – – 15.8 – 15.8Transfer to property, plant and equipment (Note 14) – – (153.3) – (153.3)Disposals/utilised – (552.2) (8.0) – (560.2)Exchange adjustments 0.2 (0.7) 0.1 (0.1) (0.5)
At 31 March 2017 799.1 808.2 273.3 301.3 2,181.9
Aggregate amortisation and impairment:At 31 March 2015 (189.0) (227.5) (181.3) (100.4) (698.2)Charge for the year – – – (2.3) (2.3)Exceptional impairment (Note 7) – – (29.4) (11.2) (40.6)
At 31 March 2016 (189.0) (227.5) (210.7) (113.9) (741.1)
Charge for the year – – – (2.4) (2.4)Exceptional impairment (charges)/credits (Note 7) (36.4) – 20.0 (78.1) (94.5)Non-exceptional impairment charge (i) (6.0) – (7.5) – (13.5)Non-exceptional impairment write back (ii) – – 10.7 – 10.7
At 31 March 2017 (231.4) (227.5) (187.5) (194.4) (840.8)
Carrying amount:
At 31 March 2017 567.7 580.7 85.8 106.9 1,341.1
At 1 April 2016 609.9 500.1 169.6 79.9 1,359.5
At 1 April 2015 598.0 433.5 137.4 33.0 1,201.9
(i) Non exceptional impairments of goodwill (£6.0m) relate to ESG, see details below. Non exceptional impairments of development assets relate to windfarm development projects no longer determined as viable.
(ii) The non exceptional write back of £10.7m was recognised following the Group’s investment in the Doggerbank project, indicating development expenditure previously impaired should be reinstated.
Intangible assets have been analysed as current and non-current as follows:
2017£m
2016£m
Current 580.7 500.1Non-current 760.4 859.4
1,341.1 1,359.5
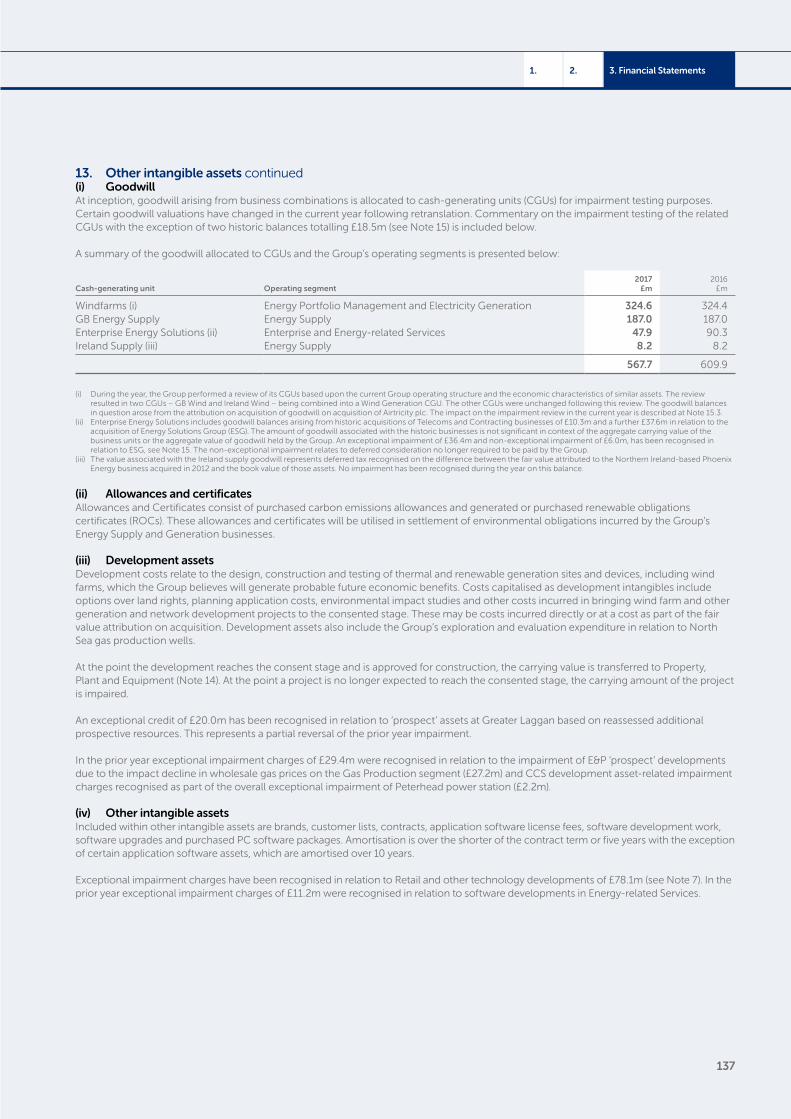
137
3. Financial Statements2.1.
13. Other intangible assets continued(i) GoodwillAt inception, goodwill arising from business combinations is allocated to cash-generating units (CGUs) for impairment testing purposes. Certain goodwill valuations have changed in the current year following retranslation. Commentary on the impairment testing of the related CGUs with the exception of two historic balances totalling £18.5m (see Note 15) is included below.
A summary of the goodwill allocated to CGUs and the Group’s operating segments is presented below:
Cash-generating unit Operating segment2017
£m2016
£m
Windfarms (i) Energy Portfolio Management and Electricity Generation 324.6 324.4GB Energy Supply Energy Supply 187.0 187.0Enterprise Energy Solutions (ii) Enterprise and Energy-related Services 47.9 90.3Ireland Supply (iii) Energy Supply 8.2 8.2
567.7 609.9
(i) During the year, the Group performed a review of its CGUs based upon the current Group operating structure and the economic characteristics of similar assets. The review resulted in two CGUs – GB Wind and Ireland Wind – being combined into a Wind Generation CGU. The other CGUs were unchanged following this review. The goodwill balances in question arose from the attribution on acquisition of goodwill on acquisition of Airtricity plc. The impact on the impairment review in the current year is described at Note 15.3.
(ii) Enterprise Energy Solutions includes goodwill balances arising from historic acquisitions of Telecoms and Contracting businesses of £10.3m and a further £37.6m in relation to the acquisition of Energy Solutions Group (ESG). The amount of goodwill associated with the historic businesses is not significant in context of the aggregate carrying value of the business units or the aggregate value of goodwill held by the Group. An exceptional impairment of £36.4m and non-exceptional impairment of £6.0m, has been recognised in relation to ESG, see Note 15. The non-exceptional impairment relates to deferred consideration no longer required to be paid by the Group.
(iii) The value associated with the Ireland supply goodwill represents deferred tax recognised on the difference between the fair value attributed to the Northern Ireland-based Phoenix Energy business acquired in 2012 and the book value of those assets. No impairment has been recognised during the year on this balance.
(ii) Allowances and certificatesAllowances and Certificates consist of purchased carbon emissions allowances and generated or purchased renewable obligations certificates (ROCs). These allowances and certificates will be utilised in settlement of environmental obligations incurred by the Group’s Energy Supply and Generation businesses.
(iii) Development assetsDevelopment costs relate to the design, construction and testing of thermal and renewable generation sites and devices, including wind farms, which the Group believes will generate probable future economic benefits. Costs capitalised as development intangibles include options over land rights, planning application costs, environmental impact studies and other costs incurred in bringing wind farm and other generation and network development projects to the consented stage. These may be costs incurred directly or at a cost as part of the fair value attribution on acquisition. Development assets also include the Group’s exploration and evaluation expenditure in relation to North Sea gas production wells.
At the point the development reaches the consent stage and is approved for construction, the carrying value is transferred to Property, Plant and Equipment (Note 14). At the point a project is no longer expected to reach the consented stage, the carrying amount of the project is impaired.
An exceptional credit of £20.0m has been recognised in relation to ‘prospect’ assets at Greater Laggan based on reassessed additional prospective resources. This represents a partial reversal of the prior year impairment.
In the prior year exceptional impairment charges of £29.4m were recognised in relation to the impairment of E&P ‘prospect’ developments due to the impact decline in wholesale gas prices on the Gas Production segment (£27.2m) and CCS development asset-related impairment charges recognised as part of the overall exceptional impairment of Peterhead power station (£2.2m).
(iv) Other intangible assetsIncluded within other intangible assets are brands, customer lists, contracts, application software license fees, software development work, software upgrades and purchased PC software packages. Amortisation is over the shorter of the contract term or five years with the exception of certain application software assets, which are amortised over 10 years.
Exceptional impairment charges have been recognised in relation to Retail and other technology developments of £78.1m (see Note 7). In the prior year exceptional impairment charges of £11.2m were recognised in relation to software developments in Energy-related Services.
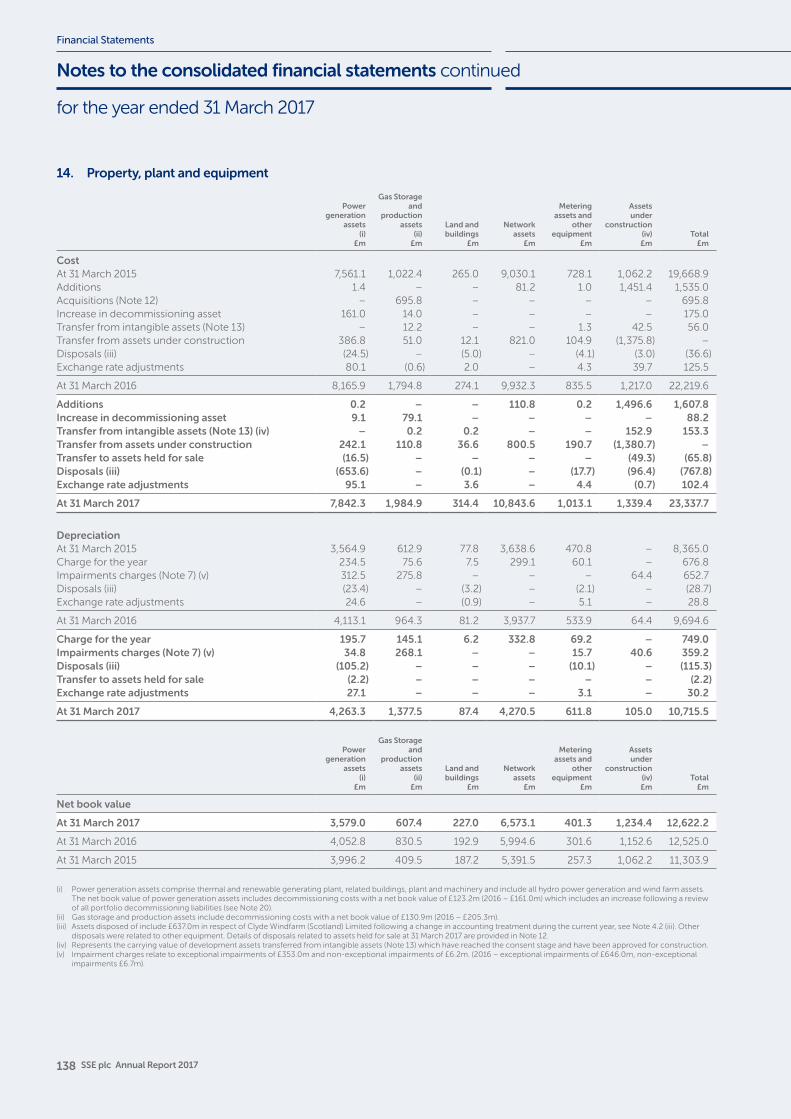
138 SSE plc Annual Report 2017
Financial Statements
for the year ended 31 March 2017
Notes to the consolidated financial statements continued
14. Property, plant and equipment
Power generation
assets(i)
£m
Gas Storage and
production assets
(ii)£m
Land and buildings
£m
Network assets
£m
Metering assets and
other equipment
£m
Assetsunder
construction(iv)£m
Total£m
CostAt 31 March 2015 7,561.1 1,022.4 265.0 9,030.1 728.1 1,062.2 19,668.9Additions 1.4 – – 81.2 1.0 1,451.4 1,535.0Acquisitions (Note 12) – 695.8 – – – – 695.8Increase in decommissioning asset 161.0 14.0 – – – – 175.0Transfer from intangible assets (Note 13) – 12.2 – – 1.3 42.5 56.0Transfer from assets under construction 386.8 51.0 12.1 821.0 104.9 (1,375.8) –Disposals (iii) (24.5) – (5.0) – (4.1) (3.0) (36.6)Exchange rate adjustments 80.1 (0.6) 2.0 – 4.3 39.7 125.5
At 31 March 2016 8,165.9 1,794.8 274.1 9,932.3 835.5 1,217.0 22,219.6
Additions 0.2 – – 110.8 0.2 1,496.6 1,607.8Increase in decommissioning asset 9.1 79.1 – – – – 88.2Transfer from intangible assets (Note 13) (iv) – 0.2 0.2 – – 152.9 153.3Transfer from assets under construction 242.1 110.8 36.6 800.5 190.7 (1,380.7) –Transfer to assets held for sale (16.5) – – – – (49.3) (65.8)Disposals (iii) (653.6) – (0.1) – (17.7) (96.4) (767.8)Exchange rate adjustments 95.1 – 3.6 – 4.4 (0.7) 102.4
At 31 March 2017 7,842.3 1,984.9 314.4 10,843.6 1,013.1 1,339.4 23,337.7
DepreciationAt 31 March 2015 3,564.9 612.9 77.8 3,638.6 470.8 – 8,365.0Charge for the year 234.5 75.6 7.5 299.1 60.1 – 676.8Impairments charges (Note 7) (v) 312.5 275.8 – – – 64.4 652.7Disposals (iii) (23.4) – (3.2) – (2.1) – (28.7)Exchange rate adjustments 24.6 – (0.9) – 5.1 – 28.8
At 31 March 2016 4,113.1 964.3 81.2 3,937.7 533.9 64.4 9,694.6
Charge for the year 195.7 145.1 6.2 332.8 69.2 – 749.0Impairments charges (Note 7) (v) 34.8 268.1 – – 15.7 40.6 359.2Disposals (iii) (105.2) – – – (10.1) – (115.3)Transfer to assets held for sale (2.2) – – – – – (2.2)Exchange rate adjustments 27.1 – – – 3.1 – 30.2
At 31 March 2017 4,263.3 1,377.5 87.4 4,270.5 611.8 105.0 10,715.5
Power generation
assets(i)
£m
Gas Storage and
production assets
(ii)£m
Land and buildings
£m
Network assets
£m
Metering assets and
other equipment
£m
Assetsunder
construction(iv)£m
Total£m
Net book value
At 31 March 2017 3,579.0 607.4 227.0 6,573.1 401.3 1,234.4 12,622.2
At 31 March 2016 4,052.8 830.5 192.9 5,994.6 301.6 1,152.6 12,525.0
At 31 March 2015 3,996.2 409.5 187.2 5,391.5 257.3 1,062.2 11,303.9
(i) Power generation assets comprise thermal and renewable generating plant, related buildings, plant and machinery and include all hydro power generation and wind farm assets. The net book value of power generation assets includes decommissioning costs with a net book value of £123.2m (2016 – £161.0m) which includes an increase following a review of all portfolio decommissioning liabilities (see Note 20).
(ii) Gas storage and production assets include decommissioning costs with a net book value of £130.9m (2016 – £205.3m).(iii) Assets disposed of include £637.0m in respect of Clyde Windfarm (Scotland) Limited following a change in accounting treatment during the current year, see Note 4.2 (iii). Other
disposals were related to other equipment. Details of disposals related to assets held for sale at 31 March 2017 are provided in Note 12.(iv) Represents the carrying value of development assets transferred from intangible assets (Note 13) which have reached the consent stage and have been approved for construction.(v) Impairment charges relate to exceptional impairments of £353.0m and non-exceptional impairments of £6.2m. (2016 – exceptional impairments of £646.0m, non-exceptional
impairments £6.7m).
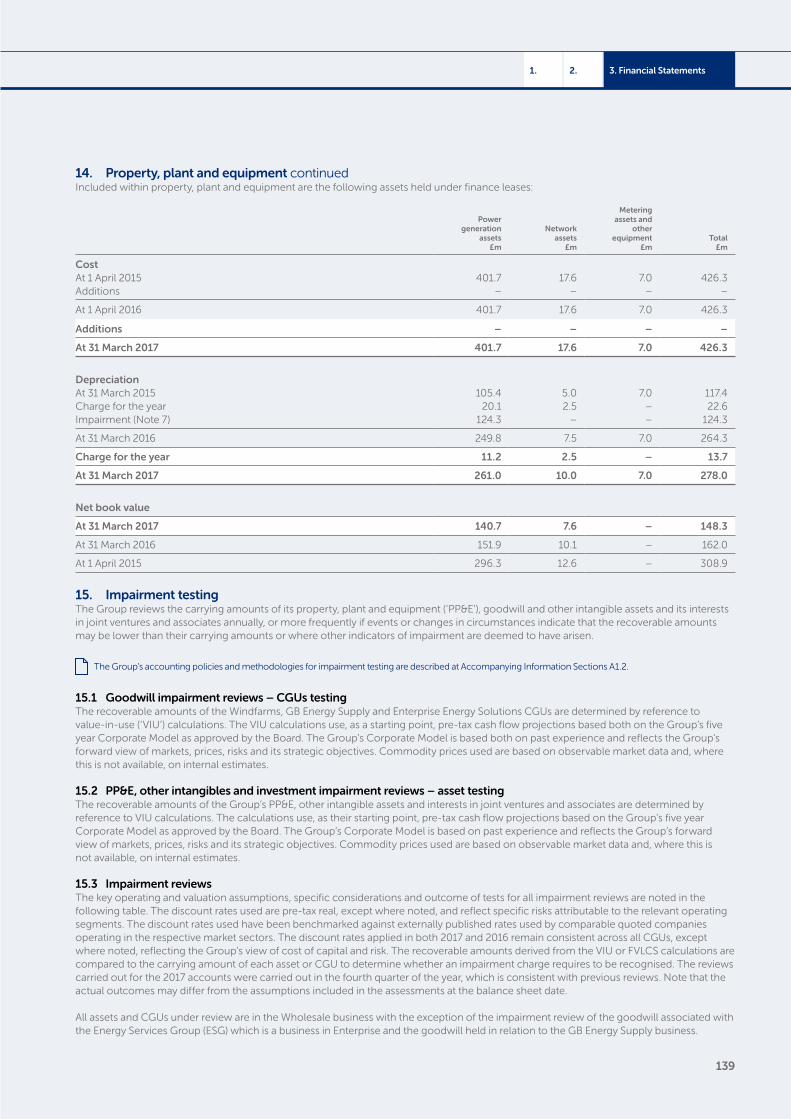
139
3. Financial Statements2.1.
14. Property, plant and equipment continuedIncluded within property, plant and equipment are the following assets held under finance leases:
Powergeneration
assets£m
Network assets
£m
Metering assets and
other equipment
£mTotal
£m
CostAt 1 April 2015 401.7 17.6 7.0 426.3Additions – – – –
At 1 April 2016 401.7 17.6 7.0 426.3
Additions – – – –
At 31 March 2017 401.7 17.6 7.0 426.3
DepreciationAt 31 March 2015 105.4 5.0 7.0 117.4Charge for the year 20.1 2.5 – 22.6Impairment (Note 7) 124.3 – – 124.3
At 31 March 2016 249.8 7.5 7.0 264.3
Charge for the year 11.2 2.5 – 13.7
At 31 March 2017 261.0 10.0 7.0 278.0
Net book value
At 31 March 2017 140.7 7.6 – 148.3
At 31 March 2016 151.9 10.1 – 162.0
At 1 April 2015 296.3 12.6 – 308.9
15. Impairment testingThe Group reviews the carrying amounts of its property, plant and equipment (‘PP&E’), goodwill and other intangible assets and its interests in joint ventures and associates annually, or more frequently if events or changes in circumstances indicate that the recoverable amounts may be lower than their carrying amounts or where other indicators of impairment are deemed to have arisen.
The Group’s accounting policies and methodologies for impairment testing are described at Accompanying Information Sections A1.2.
15.1 Goodwill impairment reviews – CGUs testingThe recoverable amounts of the Windfarms, GB Energy Supply and Enterprise Energy Solutions CGUs are determined by reference to value-in-use (‘VIU’) calculations. The VIU calculations use, as a starting point, pre-tax cash flow projections based both on the Group’s five year Corporate Model as approved by the Board. The Group’s Corporate Model is based both on past experience and reflects the Group’s forward view of markets, prices, risks and its strategic objectives. Commodity prices used are based on observable market data and, where this is not available, on internal estimates.
15.2 PP&E, other intangibles and investment impairment reviews – asset testingThe recoverable amounts of the Group’s PP&E, other intangible assets and interests in joint ventures and associates are determined by reference to VIU calculations. The calculations use, as their starting point, pre-tax cash flow projections based on the Group’s five year Corporate Model as approved by the Board. The Group’s Corporate Model is based on past experience and reflects the Group’s forward view of markets, prices, risks and its strategic objectives. Commodity prices used are based on observable market data and, where this is not available, on internal estimates.
15.3 Impairment reviewsThe key operating and valuation assumptions, specific considerations and outcome of tests for all impairment reviews are noted in the following table. The discount rates used are pre-tax real, except where noted, and reflect specific risks attributable to the relevant operating segments. The discount rates used have been benchmarked against externally published rates used by comparable quoted companies operating in the respective market sectors. The discount rates applied in both 2017 and 2016 remain consistent across all CGUs, except where noted, reflecting the Group’s view of cost of capital and risk. The recoverable amounts derived from the VIU or FVLCS calculations are compared to the carrying amount of each asset or CGU to determine whether an impairment charge requires to be recognised. The reviews carried out for the 2017 accounts were carried out in the fourth quarter of the year, which is consistent with previous reviews. Note that the actual outcomes may differ from the assumptions included in the assessments at the balance sheet date.
All assets and CGUs under review are in the Wholesale business with the exception of the impairment review of the goodwill associated with the Energy Services Group (ESG) which is a business in Enterprise and the goodwill held in relation to the GB Energy Supply business.
140 SSE plc Annual Report 2017
Financial Statements
for the year ended 31 March 2017
Notes to the consolidated financial statements continued
15. Impairment testing continued15.3 Impairment reviews continued
Assets/CGUsCash flow period assumption Operating and other valuation assumptions Commentary and impairment conclusions
Windfarms Period to end of life of portfolio assets
The VIU assessment is based on the discounted pre-tax cash flows expected to be generated by the specific wind farm assets included in the CGU across the remaining useful lives of those assets. This includes over 50 operating assets in both the UK and Republic of Ireland.
Cash inflows for the CGU are based on the expected average annual generation GWh output based on technical assessment and past experience and are valued based on forward power prices. These factors are subject to management review on an annual basis. The prices applied to projected outputs are based either on observable market information during that period, which is deemed to be 3 years, or on internal estimations beyond the observable market period (a Level 3 basis as defined by IFRS 13 Fair Value Measurement). The projections are also dependent on the UK and Irish government’s continuing support for existing qualifying wind assets through ROCs or REFIT. Cash outflows are based on planned and expected maintenance profiles and other capital or replacement costs. The cash flow projections have been discounted applying a pre tax discount rate between 5.0% and 6.6% (2016 – between 7.5% and 9.5%) based on technology and market risks. The change in discount rates represents management’s revised view of the cost of capital of these government mandated projects.
The Windfarm CGU includes wind farms in operation and projects in the construction and development phase which apply appropriate risk adjustments to cash flows or discount rates.
The recoverable amount of the Windfarms CGU continues to exceed the carrying value of the CGU based on the impairment test.
While cash flow projections are subject to inherent uncertainty, reasonably possible changes in the key assumptions applied in assessing the VIU would not cause a change to the conclusion reached. This view is supported by the Group’s recent experience of disposal of wind assets which, as FVLCS, is secondary corroboration of this assessment.
During the year, as described at Note 4.1(i), the Group consolidated the previously separate GB and Ireland Windfarm CGUs into a single measurable CGU due to consideration of operational structure and economic characteristics. While there is significant ‘headroom’ in the combined CGU which is more than sufficient to cover the carrying value of all assets attributable to the CGU. The revised CGU is not exposed to impairment risk based on current assumptions.
The carrying value of goodwill is provided in Note 13.
GB Energy Supply
5 years Goodwill is carried in relation to the acquisition of the SWALEC supply business and is attributed to the Group’s GB retail electricity and gas supply business CGU.
The main assumptions in the VIU assessment for the impairment test are derived from the Group’s 5 year Corporate Model and is principally based on the net margins achieved from current and new customers based on current experience. The derivation of the net margins applied include assumptions for power and gas prices, credit losses, acquisition and retention costs, sales and marketing costs, government schemes such as ECO and other impacts of competition and regulation. The projected cash flows derived are discounted by applying a discount rate of 10.8%, which is consistent with the previous year.
The recoverable amount of the GB Energy Supply CGU significantly exceeded the carrying values of goodwill and other non-current assets at the time of the impairment test.
While cash flow projections are subject to inherent uncertainty, reasonably possible changes in the key assumptions applied in assessing the value-in-use would not cause a change to the conclusion reached.
The carrying value of goodwill is provided in Note 13.
141
3. Financial Statements2.1.
15. Impairment testing continued15.3 Impairment reviews continued
Assets/CGUsCash flow period assumption Operating and other valuation assumptions Commentary and impairment conclusions
Thermal Generation
Period to end of life of specific assets
The specific impairment reviews of thermal power generation plant and other assets at Fiddler’s Ferry, Keadby, Medway, Peterhead and Marchwood have been conducted applying consistent VIU methodology as with prior years. In addition, the Group has conducted a similar exercise to assess the fair value of its thermal generation plants in Ireland.
The VIU assessment for each plant is based on projected ‘spark’ or ‘dark’ spread margins arising from profiled power generation or from capacity market contracts and ancillary services. The cost projections are based on assumptions on employee costs, operational maintenance costs, capital expenditure, rates, insurance and other operational overheads.
Cash flows have been discounted based on a discount rate of 7.8% (2016 – 7.3%).
No book value is retained in relation to Fiddler’s Ferry, the Group’s remaining operational coal-fired generation plant. Foreseeable trading conditions do not indicate any future value in the plants and as a result no impairment write back of value has been recognised.
The review of the Group’s GB gas plants did not provide any indication of further impairment. However, the review identified some potential for impairment reversal of c. £20m. Due to management’s view on the variability of input factors and experience of impairment over previous years, the Group has not recognised an impairment write back in the year to 31 March 2017.
The review of thermal assets in Ireland concluded that deterioration in operating conditions for the Group’s oil-burning plants should result in an exceptional charge of £30.7m.
Adverse changes to the key assumptions applied may imply further impairment. For example, withdrawal of capacity mechanism support for certain plants would have a significant negative impact.
An increase in 1% in the discount rate would result in an impairment charge of £40.0m. Details of residual values are provided in Note 7.
Gas Storage Period to end of life of specific assets
The FVLC of the Group’s gas storage facilities at Aldbrough and Atwick (Hornsea) was assessed based on internal estimations of demand for the facilities in the 5 year Corporate Model period. Cash flow projections were subject to a discount rate of 7.8% (2016 – 10%). Estimations for demand growth in the business beyond the 5 year model period were modest.
Exceptional charges of £23.8m were recognised in the current year following increases to decommissioning liabilities (2016 – £150.9m (all impairment of PP&E assets)).
Due to the significant difficulties encountered by the business, no reasonably probable changes in the short to medium-term prospects for the assets are anticipated that would result in a significant reduction in the residual value. Detail on residual values are provided at Note 7.
142 SSE plc Annual Report 2017
Financial Statements
for the year ended 31 March 2017
Notes to the consolidated financial statements continued
15. Impairment testing continued15.3 Impairment reviews continued
Assets/CGUsCash flow period assumption Operating and other valuation assumptions Commentary and impairment conclusions
Gas Production Period to end of life of field assets
The FVLCS of the Gas Production assets is based on the projected gas or distillate production profiles up to the date of the expected cessation of production for SSE’s interests in the Greater Laggan, Sean, ECA and Bacton fields set against the expected selling price of the hydrocarbons produced and the impact of tax allowances.
The assessment of projected gas or distillate reserves for all fields is formally reviewed on an annual basis using an Independent Reserves Auditor. This review considers the regional activity, geological data, reservoir performance data, well drilling activity, commodity prices and production costs to determine the expected total volume and production profile of gas and liquid reserves. This is a significant input estimate that is subject to change between reporting periods.
Cash inflows are based on forward commodity prices and are subject to management review on an annual basis. The prices applied to projected outputs are based either on observable market information during that period, or on internal estimation beyond the observable market period (a Level 3 basis as defined by IFRS 13 Fair Value Measurement).
Operating cash outflows are based upon projections from the Independent Reserves Auditor, with future capital and decommissioning costs determined through periodic third party review.
The discount rate applied to the projected cash flows was between 10% and 12.5% based on market and construction risks (2016 – 10%).
The result of the review is a combined exceptional impairment charge of £227.5m (2016 – £161.8m) which is predominately associated with Greater Laggan (£180.5m) driven by a reduction in the independently assessed quantity of available proved and probable (2P) hydrocarbon reserves, and Bacton (£63.8m) driven by higher than previously assessed decommissioning costs.
A 10% reduction in the volume and production profile of proven and probable (2P) gas and liquids reserves would result in a £88m further impairment charge, and a 10% increase would result in a £71m reduction in the current year impairment charge, and an additional £40m write-back of historical impairment charges. The measurement of gas and liquids reserves is an area of estimation uncertainty, as detailed in Note 4.3 (iii).
A 5% reduction to commodity prices would result in a £41m further impairment charge, and a 5% increase would result in a £35m reduction in the current year impairment charge, and an additional £34m write-back of historical impairment charges.
A 1% increase to the discount rate would result in a £13m further impairment charge, with a 1% decrease resulting in a £12m reduction in the current year impairment charge.
Note 7 provides further detail on the exceptional charge taken, as well as residual values for Gas production assets.
Glendoe Period to end of life
The VIU of the Groups Glendoe Hydro Power station was based on pre-tax discounted cash flows expected to be generated by the plant based on managements view of the plants operating prospects and operational flexibility within the GB wholesale market. Cash flows are subject to a discount rate of 7.2% (2016 – 7.2%).
Management consider that Glendoe retains long-term strategic and operational value for the Group and the detailed VIU exercise conducted did not indicate impairment was required. However, reasonably possible changes to valuation assumptions could result in impairment charges of up to £40m.
Enterprise Energy Solutions
5 years The Group recognised goodwill of £80.0m on acquisition of the Energy Solutions Group in 2016. The business designs, installs and optimises building management technologies which deliver efficient operating environments for its customers. The VIU of the business CGU has been based on a 10% post-tax discount rate and includes growth assumptions of 2% per annum.
Following consideration of the business’ performance and review of the prospects for growth as part of the Group’s business to business proposition, an exceptional charge of £36.4m (2016 – £nil) was recognised relating to goodwill in the current year. Growth is still anticipated within the business following a strategic repositioning of the business within the SSE group. The carrying value of goodwill remaining is provided in Note 13. A 1% increase in the discount rate would result in an additional of £5.9m impairment charge.
143
3. Financial Statements2.1.
16. Investments 16.1 Associates and joint ventures
2017 2016
Equity£m
Loans£m
Total£m
Equity£m
Loans£m
Total£m
Share of net assets/costAt 1 April 1,045.1 591.6 1,636.7 875.2 559.4 1,434.6Additions 10.6 94.4 105.0 9.8 50.5 60.3Deconsolidation of Clyde (i) 144.2 264.9 409.1 – – –Repayment of shareholder loans – (73.4) (73.4) – (18.3) (18.3)Dividends received (123.1) – (123.1) (130.9) – (130.9)Share of profit/(loss) after tax 187.4 – 187.4 204.8 – 204.8Share of other reserves adjustments (62.4) – (62.4) 80.3 – 80.3Disposal of equity (Note 12) (218.2) (89.1) (307.3) (1.1) – (1.1)Transfer – – – 1.5 – 1.5Impairment (0.4) – (0.4) – – –Exchange rate adjustments 2.6 – 2.6 5.5 – 5.5
At 31 March 985.8 788.4 1,774.2 1,045.1 591.6 1,636.7
(i) On 13 May 2016, the Group agreed to waive certain contractual rights that gave rise to the accounting judgement that the Group had power to control the “relevant activities” of Clyde Windfarm (Scotland) Limited (‘Clyde’). As a consequence during the year the Group changed its accounting for Clyde to that of an investment in an equity-accounted joint venture. In the above, equity of £144.2m and loans of £264.9m were recognised on deconsolidation. Subsequent to 13 May 2016, the Group has provided loan investment of £78.3m in relation to the extension project. Further reconciliation of these movements and previous treatment is in Note 4.2(iii).
On 17 October 2016, the Group announced it had entered into an agreement to sell the group’s 16.7% equity stake in Scotia Gas Networks Limited (SGN) stake to wholly owned subsidiaries of the Abu Dhabi Investment Authority (ADIA) following the divestment, the Group will retain a 33.3% equity stake in SGN, see further details within Note 12.
Under IFRS 12 Disclosure of Interests in Other Entities, the Group has evaluated the key joint ventures and associates it holds with the purpose of disclosing any which are materially significant in order to identify the impact it has on its financial position, performance and cash flows, whilst identifying the nature of the risks associated with these interests. A full listing of the Group’s incorporated joint ventures, joint operations, associates and investments are included in the Accompanying Information (A3).
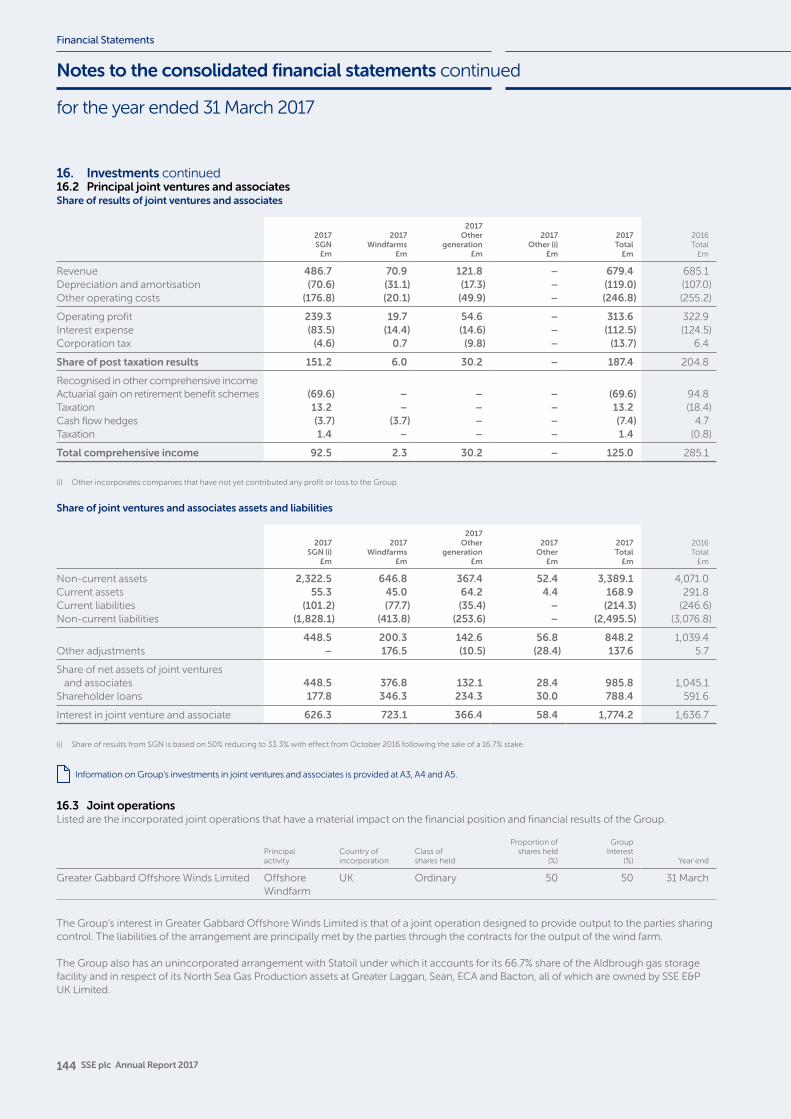
144 SSE plc Annual Report 2017
Financial Statements
for the year ended 31 March 2017
Notes to the consolidated financial statements continued
16. Investments continued16.2 Principal joint ventures and associatesShare of results of joint ventures and associates
2017SGN
£m
2017Windfarms
£m
2017Other
generation£m
2017Other (i)
£m
2017Total
£m
2016Total
£m
Revenue 486.7 70.9 121.8 – 679.4 685.1Depreciation and amortisation (70.6) (31.1) (17.3) – (119.0) (107.0)Other operating costs (176.8) (20.1) (49.9) – (246.8) (255.2)
Operating profit 239.3 19.7 54.6 – 313.6 322.9Interest expense (83.5) (14.4) (14.6) – (112.5) (124.5)Corporation tax (4.6) 0.7 (9.8) – (13.7) 6.4
Share of post taxation results 151.2 6.0 30.2 – 187.4 204.8
Recognised in other comprehensive incomeActuarial gain on retirement benefit schemes (69.6) – – – (69.6) 94.8Taxation 13.2 – – – 13.2 (18.4)Cash flow hedges (3.7) (3.7) – – (7.4) 4.7Taxation 1.4 – – – 1.4 (0.8)
Total comprehensive income 92.5 2.3 30.2 – 125.0 285.1
(i) Other incorporates companies that have not yet contributed any profit or loss to the Group.
Share of joint ventures and associates assets and liabilities
2017SGN (i)
£m
2017Windfarms
£m
2017Other
generation£m
2017Other
£m
2017Total
£m
2016Total
£m
Non-current assets 2,322.5 646.8 367.4 52.4 3,389.1 4,071.0Current assets 55.3 45.0 64.2 4.4 168.9 291.8Current liabilities (101.2) (77.7) (35.4) – (214.3) (246.6)Non-current liabilities (1,828.1) (413.8) (253.6) – (2,495.5) (3,076.8)
448.5 200.3 142.6 56.8 848.2 1,039.4Other adjustments – 176.5 (10.5) (28.4) 137.6 5.7
Share of net assets of joint ventures and associates 448.5 376.8 132.1 28.4 985.8 1,045.1
Shareholder loans 177.8 346.3 234.3 30.0 788.4 591.6
Interest in joint venture and associate 626.3 723.1 366.4 58.4 1,774.2 1,636.7
(i) Share of results from SGN is based on 50% reducing to 33.3% with effect from October 2016 following the sale of a 16.7% stake.
Information on Group’s investments in joint ventures and associates is provided at A3, A4 and A5.
16.3 Joint operationsListed are the incorporated joint operations that have a material impact on the financial position and financial results of the Group.
Principalactivity
Country ofincorporation
Class of shares held
Proportion of shares held
(%)
Group Interest
(%) Year end
Greater Gabbard Offshore Winds Limited OffshoreWindfarm
UK Ordinary 50 50 31 March
The Group’s interest in Greater Gabbard Offshore Winds Limited is that of a joint operation designed to provide output to the parties sharing control. The liabilities of the arrangement are principally met by the parties through the contracts for the output of the wind farm.
The Group also has an unincorporated arrangement with Statoil under which it accounts for its 66.7% share of the Aldbrough gas storage facility and in respect of its North Sea Gas Production assets at Greater Laggan, Sean, ECA and Bacton, all of which are owned by SSE E&P UK Limited.
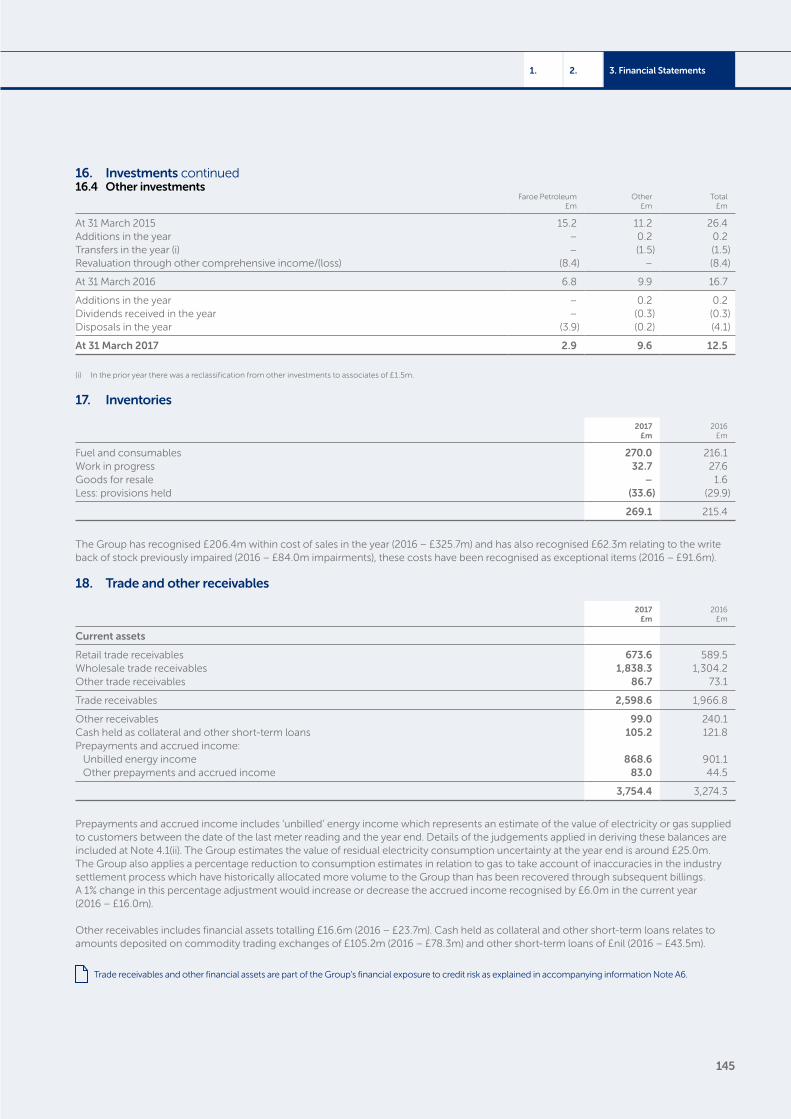
145
3. Financial Statements2.1.
16. Investments continued16.4 Other investments
Faroe Petroleum£m
Other£m
Total£m
At 31 March 2015 15.2 11.2 26.4Additions in the year – 0.2 0.2Transfers in the year (i) – (1.5) (1.5)Revaluation through other comprehensive income/(loss) (8.4) – (8.4)
At 31 March 2016 6.8 9.9 16.7
Additions in the year – 0.2 0.2Dividends received in the year – (0.3) (0.3)Disposals in the year (3.9) (0.2) (4.1)
At 31 March 2017 2.9 9.6 12.5
(i) In the prior year there was a reclassification from other investments to associates of £1.5m.
17. Inventories
2017£m
2016£m
Fuel and consumables 270.0 216.1Work in progress 32.7 27.6Goods for resale – 1.6Less: provisions held (33.6) (29.9)
269.1 215.4
The Group has recognised £206.4m within cost of sales in the year (2016 – £325.7m) and has also recognised £62.3m relating to the write back of stock previously impaired (2016 – £84.0m impairments), these costs have been recognised as exceptional items (2016 – £91.6m).
18. Trade and other receivables
2017£m
2016£m
Current assets
Retail trade receivables 673.6 589.5Wholesale trade receivables 1,838.3 1,304.2Other trade receivables 86.7 73.1
Trade receivables 2,598.6 1,966.8
Other receivables 99.0 240.1Cash held as collateral and other short-term loans 105.2 121.8Prepayments and accrued income:
Unbilled energy income 868.6 901.1Other prepayments and accrued income 83.0 44.5
3,754.4 3,274.3
Prepayments and accrued income includes ‘unbilled’ energy income which represents an estimate of the value of electricity or gas supplied to customers between the date of the last meter reading and the year end. Details of the judgements applied in deriving these balances are included at Note 4.1(ii). The Group estimates the value of residual electricity consumption uncertainty at the year end is around £25.0m. The Group also applies a percentage reduction to consumption estimates in relation to gas to take account of inaccuracies in the industry settlement process which have historically allocated more volume to the Group than has been recovered through subsequent billings. A 1% change in this percentage adjustment would increase or decrease the accrued income recognised by £6.0m in the current year (2016 – £16.0m).
Other receivables includes financial assets totalling £16.6m (2016 – £23.7m). Cash held as collateral and other short-term loans relates to amounts deposited on commodity trading exchanges of £105.2m (2016 – £78.3m) and other short-term loans of £nil (2016 – £43.5m).
Trade receivables and other financial assets are part of the Group’s financial exposure to credit risk as explained in accompanying information Note A6.
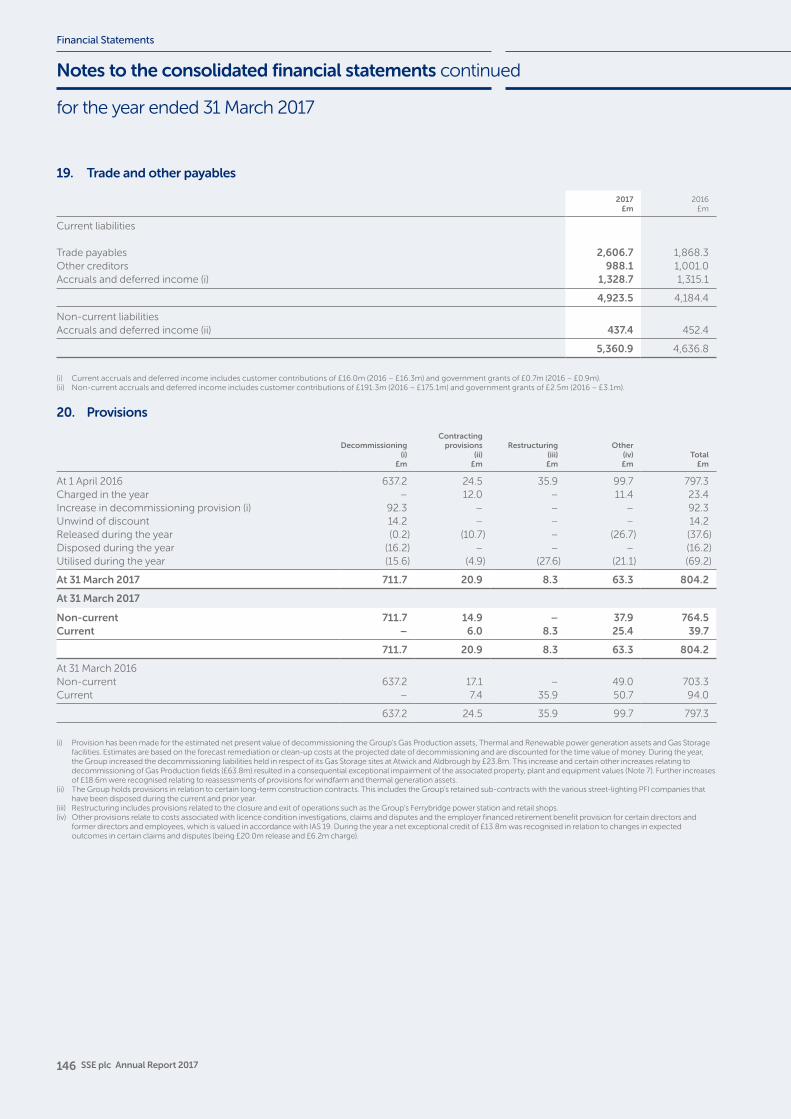
146 SSE plc Annual Report 2017
Financial Statements
for the year ended 31 March 2017
Notes to the consolidated financial statements continued
19. Trade and other payables
2017£m
2016£m
Current liabilities
Trade payables 2,606.7 1,868.3Other creditors 988.1 1,001.0Accruals and deferred income (i) 1,328.7 1,315.1
4,923.5 4,184.4
Non-current liabilitiesAccruals and deferred income (ii) 437.4 452.4
5,360.9 4,636.8
(i) Current accruals and deferred income includes customer contributions of £16.0m (2016 – £16.3m) and government grants of £0.7m (2016 – £0.9m). (ii) Non-current accruals and deferred income includes customer contributions of £191.3m (2016 – £175.1m) and government grants of £2.5m (2016 – £3.1m).
20. Provisions
Decommissioning(i)
£m
Contracting provisions
(ii)£m
Restructuring(iii)£m
Other(iv)£m
Total£m
At 1 April 2016 637.2 24.5 35.9 99.7 797.3Charged in the year – 12.0 – 11.4 23.4Increase in decommissioning provision (i) 92.3 – – – 92.3Unwind of discount 14.2 – – – 14.2Released during the year (0.2) (10.7) – (26.7) (37.6)Disposed during the year (16.2) – – – (16.2)Utilised during the year (15.6) (4.9) (27.6) (21.1) (69.2)
At 31 March 2017 711.7 20.9 8.3 63.3 804.2
At 31 March 2017
Non-current 711.7 14.9 – 37.9 764.5Current – 6.0 8.3 25.4 39.7
711.7 20.9 8.3 63.3 804.2
At 31 March 2016Non-current 637.2 17.1 – 49.0 703.3Current – 7.4 35.9 50.7 94.0
637.2 24.5 35.9 99.7 797.3
(i) Provision has been made for the estimated net present value of decommissioning the Group’s Gas Production assets, Thermal and Renewable power generation assets and Gas Storage facilities. Estimates are based on the forecast remediation or clean-up costs at the projected date of decommissioning and are discounted for the time value of money. During the year, the Group increased the decommissioning liabilities held in respect of its Gas Storage sites at Atwick and Aldbrough by £23.8m. This increase and certain other increases relating to decommissioning of Gas Production fields (£63.8m) resulted in a consequential exceptional impairment of the associated property, plant and equipment values (Note 7). Further increases of £18.6m were recognised relating to reassessments of provisions for windfarm and thermal generation assets.
(ii) The Group holds provisions in relation to certain long-term construction contracts. This includes the Group’s retained sub-contracts with the various street-lighting PFI companies that have been disposed during the current and prior year.
(iii) Restructuring includes provisions related to the closure and exit of operations such as the Group’s Ferrybridge power station and retail shops. (iv) Other provisions relate to costs associated with licence condition investigations, claims and disputes and the employer financed retirement benefit provision for certain directors and
former directors and employees, which is valued in accordance with IAS 19. During the year a net exceptional credit of £13.8m was recognised in relation to changes in expected outcomes in certain claims and disputes (being £20.0m release and £6.2m charge).
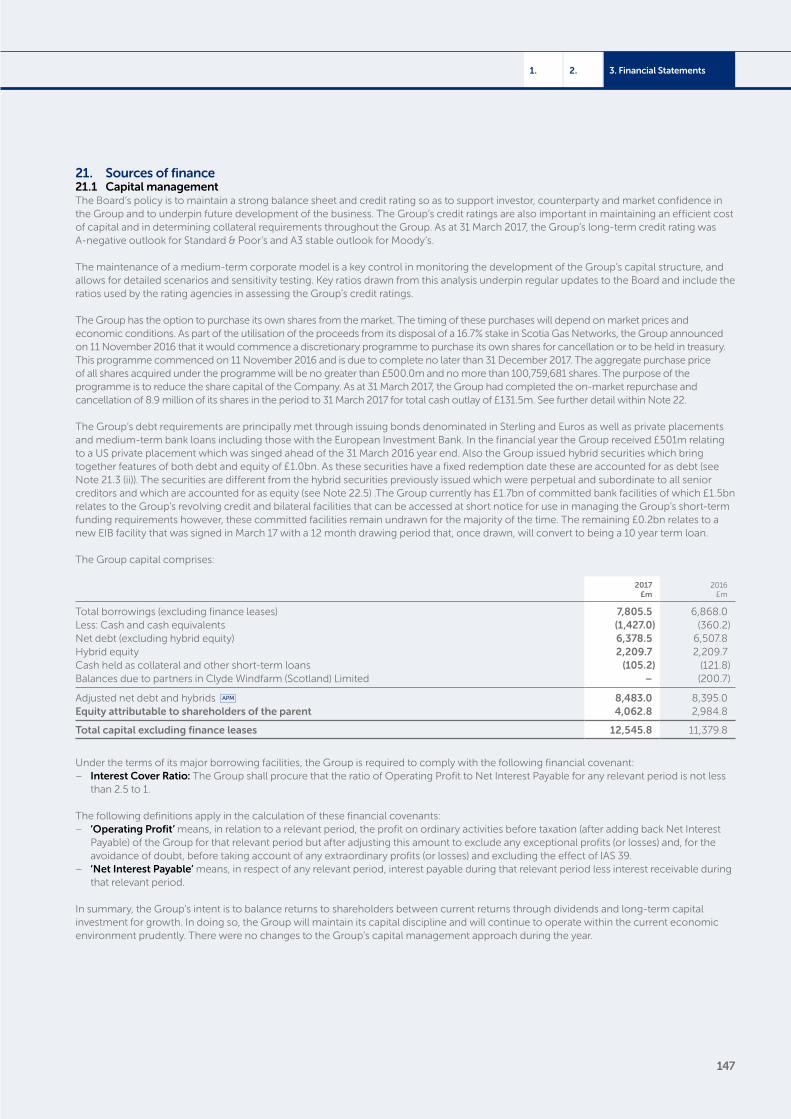
147
3. Financial Statements2.1.
21. Sources of finance21.1 Capital managementThe Board’s policy is to maintain a strong balance sheet and credit rating so as to support investor, counterparty and market confidence in the Group and to underpin future development of the business. The Group’s credit ratings are also important in maintaining an efficient cost of capital and in determining collateral requirements throughout the Group. As at 31 March 2017, the Group’s long-term credit rating was A-negative outlook for Standard & Poor’s and A3 stable outlook for Moody’s.
The maintenance of a medium-term corporate model is a key control in monitoring the development of the Group’s capital structure, and allows for detailed scenarios and sensitivity testing. Key ratios drawn from this analysis underpin regular updates to the Board and include the ratios used by the rating agencies in assessing the Group’s credit ratings.
The Group has the option to purchase its own shares from the market. The timing of these purchases will depend on market prices and economic conditions. As part of the utilisation of the proceeds from its disposal of a 16.7% stake in Scotia Gas Networks, the Group announced on 11 November 2016 that it would commence a discretionary programme to purchase its own shares for cancellation or to be held in treasury. This programme commenced on 11 November 2016 and is due to complete no later than 31 December 2017. The aggregate purchase price of all shares acquired under the programme will be no greater than £500.0m and no more than 100,759,681 shares. The purpose of the programme is to reduce the share capital of the Company. As at 31 March 2017, the Group had completed the on-market repurchase and cancellation of 8.9 million of its shares in the period to 31 March 2017 for total cash outlay of £131.5m. See further detail within Note 22.
The Group’s debt requirements are principally met through issuing bonds denominated in Sterling and Euros as well as private placements and medium-term bank loans including those with the European Investment Bank. In the financial year the Group received £501m relating to a US private placement which was singed ahead of the 31 March 2016 year end. Also the Group issued hybrid securities which bring together features of both debt and equity of £1.0bn. As these securities have a fixed redemption date these are accounted for as debt (see Note 21.3 (ii)). The securities are different from the hybrid securities previously issued which were perpetual and subordinate to all senior creditors and which are accounted for as equity (see Note 22.5) .The Group currently has £1.7bn of committed bank facilities of which £1.5bn relates to the Group’s revolving credit and bilateral facilities that can be accessed at short notice for use in managing the Group’s short-term funding requirements however, these committed facilities remain undrawn for the majority of the time. The remaining £0.2bn relates to a new EIB facility that was signed in March 17 with a 12 month drawing period that, once drawn, will convert to being a 10 year term loan.
The Group capital comprises:
2017£m
2016£m
Total borrowings (excluding finance leases) 7,805.5 6,868.0Less: Cash and cash equivalents (1,427.0) (360.2)Net debt (excluding hybrid equity) 6,378.5 6,507.8Hybrid equity 2,209.7 2,209.7Cash held as collateral and other short-term loans (105.2) (121.8)Balances due to partners in Clyde Windfarm (Scotland) Limited – (200.7)
Adjusted net debt and hybrids 8,483.0 8,395.0Equity attributable to shareholders of the parent 4,062.8 2,984.8
Total capital excluding finance leases 12,545.8 11,379.8
Under the terms of its major borrowing facilities, the Group is required to comply with the following financial covenant: – Interest Cover Ratio: The Group shall procure that the ratio of Operating Profit to Net Interest Payable for any relevant period is not less
than 2.5 to 1.
The following definitions apply in the calculation of these financial covenants: – ‘Operating Profit’ means, in relation to a relevant period, the profit on ordinary activities before taxation (after adding back Net Interest
Payable) of the Group for that relevant period but after adjusting this amount to exclude any exceptional profits (or losses) and, for the avoidance of doubt, before taking account of any extraordinary profits (or losses) and excluding the effect of IAS 39.
– ‘Net Interest Payable’ means, in respect of any relevant period, interest payable during that relevant period less interest receivable during that relevant period.
In summary, the Group’s intent is to balance returns to shareholders between current returns through dividends and long-term capital investment for growth. In doing so, the Group will maintain its capital discipline and will continue to operate within the current economic environment prudently. There were no changes to the Group’s capital management approach during the year.
148 SSE plc Annual Report 2017
Financial Statements
Notes to the consolidated financial statements continued
for the year ended 31 March 2017
21. Sources of finance continued21.2 Loans and other borrowings
2017£m
2016£m
CurrentShort-term loans 118.8 898.8Obligations under finance leases 23.6 24.5
142.4 923.3
Non-current Loans 7,686.7 5,969.2Obligations under finance leases 253.3 276.3
7,940.0 6,245.5
Total loans and borrowings 8,082.4 7,168.8
Cash and cash equivalents (1,427.0) (360.2)
Unadjusted net debt 6,655.4 6,808.6
Add/(less):Hybrid equity 2,209.7 2,209.7Obligations under finance leases (276.9) (300.8)Cash held as collateral and other short-term loans (105.2) (121.8)Balances due to partners in Clyde Windfarm (Scotland) Limited (Note 4.2 (iii)) – (200.7)
Adjusted net debt and hybrids 8,483.0 8,395.0
Cash and cash equivalents (which are presented as a single class of assets on the face of the balance sheet) comprise cash at bank and short-term highly liquid investments with a maturity of six months or less. The cash and cash equivalents are higher year on year due to the early refinancing of £1.0bn hybrids maturing in October 17.
On 13 May 2016, following amendments to the shareholders agreement for Clyde Windfarm (Scotland) Limited, the Group’s investment is now recorded as an equity accounted joint venture. Consequently, the non-recourse debt associated with the non-controlling interests in the entity is not consolidated in the Group balance sheet and is therefore no longer a reconciling item between Reported and Adjusted net debt and hybrids. Please see further detail at Note 4.2(iii).
21.3 Borrowing facilitiesThe Group has an established €1.5bn Euro commercial paper programme (paper can be issued in a range of currencies and swapped into sterling) and as at 31 March 2017 no commercial paper was outstanding (2016 – £198.8m). During the year the Group extended its existing £1.5bn revolving credit and bilateral facilities by invoking the one year extension options with the facilities now maturing in August 2021 (£1.3bn) and November 2021 (£0.2bn). These facilities continue to provide back up to the commercial paper programme and, as at 31 March 2017, they were undrawn. The Group has a further £200m facility available with the European Investment Bank which will be fully drawn during 2017 when it will become a 10 year term loan.
149
3. Financial Statements2.1.
21. Sources of finance continued21.3 Borrowing facilities continuedAnalysis of borrowingsLoans and borrowings
2017Weighted
average interest rate
(iii)
2017Face value
£m
2017Fair value
£m
2017Carrying amount
£m
2016Weighted
average interest rate
(iii)
2016Face value
£m
2016Fair value
£m
2016Carrying amount
£m
CurrentCommercial paper and cash advances – – – – 0.9% 198.8 199.0 198.8Bank loans – non-amortising (i) 1.8% 106.0 106.1 106.0 1.0% 700.0 701.6 700.0US Private Placement 16 April 2017 3.2% 12.8 16.2 12.8 – – – –
Total current 118.8 122.3 118.8 898.8 900.6 898.8
Non-currentBank loans – non-amortising (i) 1.9% 676.7 709.1 676.7 2.1% 632.6 683.4 632.6US Private Placement 16 April 2017 – – – – 3.2% 12.8 14.2 12.7US Private Placement 16 April 2019 3.7% 67.0 86.4 66.9 3.7% 67.0 75.7 66.95.00% Eurobond repayable 1 October 2018 5.0% 500.0 530.0 499.2 5.0% 500.0 542.2 498.62.00% 600m Eurobond repayable 17 June 2020 2.0% 511.8 540.1 509.4 2.0% 474.4 498.8 471.34.25% Eurobond repayable 14 September 2021 4.3% 300.0 339.2 298.2 – – – –2.375% €500m Eurobond repayable
10 February 2022 2.4% 415.0 453.8 414.5 – – – –
Between two and five years 2,470.5 2,658.6 2,464.9 1,686.8 1,814.3 1,682.1
Bank loans – non-amortising (i) 2.4% 500.2 524.9 499.8 2.2% 350.0 364.5 350.0Non-recourse funding – – – – 5.8% 200.7 200.7 200.7US Private Placement 16 April 2022 4.3% 162.7 213.8 162.4 4.3% 162.7 187.8 162.3US Private Placement 28 April 2023 2.8% 35.0 36.6 34.3 – – – –US Private Placement 6 September 2023 2.9% 120.0 124.8 117.1 – – – –US Private Placement 16 April 2024 4.4% 204.1 268.0 203.7 4.4% 204.1 235.8 203.6US Private Placement 8 June 2026 3.1% 64.0 68.0 62.5 – – – –US Private Placement 6 September 2026 3.2% 247.1 270.7 241.2 – – – –US Private Placement 6 September 2027 3.2% 35.0 37.4 34.2 – – – –5.875% Eurobond repayable 22 September 2022 5.9% 300.0 368.9 298.5 5.9% 300.0 361.3 298.21.75% €700m Eurobond repayable
8 September 2023 (v) 1.8% 514.6 544.7 513.2 1.8% 514.6 533.0 513.08.375% Eurobond repayable on
20 November 2028 8.4% 500.0 800.9 495.1 8.4% 500.0 752.2 494.75.50% Eurobond repayable on 7 June 2032 5.5% 350.0 483.2 350.2 5.5% 350.0 441.2 350.24.625% Eurobond repayable on 20 February 2037 4.6% 325.0 423.2 323.8 4.6% 325.0 372.9 323.86.25% Eurobond repayable on 27 August 2038 6.3% 350.0 536.5 346.6 6.3% 350.0 465.1 346.44.454% Index linked loan repayable on
27 February 2044 4.5% 122.9 239.6 122.4 4.5% 121.3 201.5 119.71.429% Index linked bond repayable on
20 October 2056 1.9% 132.7 242.7 132.7 1.9% 130.4 181.0 130.44.25% Eurobond repayable 14 September 2021 – – – – 4.3% 300.0 331.7 297.92.375% €500m Eurobond repayable
10 February 2022 (iv) – – – – 2.4% 415.0 446.9 414.44.75% $900m NC5.5 hybrid debt maturing
16 September 2077 (vi) 4.8% 730.9 734.0 727.9 – – – –3.625% NC5.5 hybrid maturing 16 September 2077 3.6% 300.0 300.0 298.8 – – – –
Over five years 4,994.2 6,217.9 4,964.4 4,223.8 5,075.6 4,205.3
Fair value adjustment (ii) – – 257.4 – – 81.8
Total non-current 7,464.7 8,876.5 7,686.7 5,910.6 6,889.9 5,969.2
Total 7,583.5 8,998.8 7,805.5 6,809.4 7,790.5 6,868.0
150 SSE plc Annual Report 2017
Financial Statements
for the year ended 31 March 2017
Notes to the consolidated financial statements continued
21. Sources of finance continued21.3 Borrowing facilities continued
(i) Balances include term loans and EIB debt and is a mixture of fixed and floating rate debt.(ii) The fair value adjustment relates to the change in the carrying amount of the borrowings as a result of fair value hedges that are in place. The movement in the fair value adjustment
is recognised in the income statement with a corresponding movement on the hedging instrument also being recognised in the income statement.(iii) The weighted average interest rates (including the effect of interest rate swaps) for the year ended 31 March 2017 was 3.66% (2016 – 3.73%). (iv) The 2.375% €500m Eurobond maturing 10 February 2022 has been swapped to Sterling giving an effective interest rate of 3.53%.(v) The 1.75% €700m Eurobond maturing 8 September 2023 has been swapped to Sterling giving an effective interest rate of 3.16%.(vi) The 4.75% $900m non call 5.5 year hybrid debt maturing 16 September 2077 has been swapped to Euros ($605m) and Sterling ($295m) giving an effective interest rate of 2.25% and
3.29% respectively.
(i) Finance lease liabilitiesFuture finance lease commitments are as follows:
Minimum lease paymentsPresent value of minimum
lease payments
2017£m
2016£m
2017£m
2016£m
Amounts payable:Within one year 55.5 53.9 23.6 24.5Between one and five years 206.3 215.2 118.3 110.9After five years 177.3 225.8 135.0 165.4
439.1 494.9 276.9 300.8
Less: future finance charge (162.2) (194.1)
Present value of lease obligations 276.9 300.8
The Group has a power purchase agreement with a related party, Marchwood Power Limited, which is categorised as a finance lease. The lease is for use of Marchwood Power’s main asset, an 890MW Gas powered CCGT Electricity Generating Plant. The term of the lease is 15 years with the Group having the option for a further 5 years extension at the end of this period. £23.6m (2016 – £19.0m) of contingent rents paid under the lease were included within cost of sales for the period. Contingent rent consists of £/MWh charges for availability of the plant for energy production and a £/MWh charge for actual ‘nominated’ energy produced.
Of the remaining finance leases held by the group, the average remaining term of the telecom leases is 6 years. No arrangements have been entered into for contingent rental payments for these leases.
The fair value of the Group’s lease obligations approximates their carrying amount. The Group’s obligations under finance leases are secured by the lessors’ rights over the leased assets. The Company does not have any obligations under finance leases.
(ii) Hybrid debtOn 16 March 2017, the Group issued £1.0bn of new hybrid debt securities. Those hybrid debt securities have an issuer first call date on 1 October 2017 and are able to be redeemed at the Group’s discretion. This dual tranche issue comprises £300m with a coupon of 3.625% and $900m with a coupon of 4.75%. The $900m tranche has been swapped back to both Euros and Sterling, bringing the all-in rate down to 2.72% and resulting in an all-in funding cost for both tranches to SSE of 3.02% per annum. This compares favourably to the all-in funding cost of 4.02% achieved on SSE’s most recent hybrid equity securities issued in 2015. The intent is to use the proceeds to replace SSE’s hybrid issued in 2012 (at an all-in rate of 5.6%), which has an issuer first call date on 1 October 2017. Due to the hybrids having a fixed redemption date, they have been accounted for as a debt item and are included within Loans and Other Borrowings in Note 21.2. This is in contrast to the previous hybrid issues which have no fixed redemption date and are accounted for as Equity, see Note 22.5.
21.4 Reconciliation of net increase in cash and cash equivalents to movement in Adjusted net debt and hybrid equity
Note2017
£m2016
£m
Increase/(decrease) in cash and cash equivalents 1,066.8 (1,151.9)Add/(less): Redemption of hybrid equity – 1,161.4New borrowings (1,842.5) (1,070.1)Repayment of borrowings 950.6 77.7Non-cash movement on borrowings (246.3) (94.8)(Decrease)/increase in cash held as collateral and other short-term loans 21 (16.6) 50.1Balances due to partners in Clyde Windfarm (Scotland) Limited – 200.7
Movement in Adjusted net debt and hybrids (88.0) (826.9)
Cash held as collateral refers to amounts deposited on commodity trading exchanges and loans provided with a less than three month maturity which are reported within trade and other receivables on the face of the balance sheet.
151
3. Financial Statements2.1.
22. Equity22.1 Share capital
Number(millions) £m
Allotted, called up and fully paid:At 1 April 2016 1,007.6 503.8
Issue of shares (i) 16.9 8.5Shares repurchased (ii) (8.9) (4.5)
At 31 March 2017 1,015.6 507.8
The Company has one class of ordinary share which carries no right to fixed income. The holders of ordinary shares are entitled to receive dividends as declared and are entitled to one vote per share at meetings of the Company.
(i) Shareholders were able to elect to receive ordinary shares in place of the final dividend of 62.5p per ordinary share (in relation to year ended 31 March 2016) and the interim dividend of 27.4p (in relation to the current year) under the terms of the Company’s scrip dividend scheme. This resulted in the issue of 9,395,092 and 6,324,986 new fully paid ordinary shares respectively (2016 – 10,600,639 and 1,172,973). In addition, the Company issued 1.2m (2016 – 2.8m) shares during the year under the savings-related share option schemes for a consideration of £13.8m (2016 – £25.0m).
(ii) As referred to at Note 21.1, during the current financial year following the disposal of a stake in Scotia Gas Networks, the Company initiated a share buy back programme under which 8.9m shares were repurchased by 31 March 2017 for total consideration of £131.5m. The programme was announced on 11 November 2016 and the group plan to continue this activity until December 2017. The nominal value of share capital repurchased and cancelled is transferred out of share capital and into the capital redemption reserve.
During the year, on behalf of the Company, the employee share trust purchased 0.8m shares for a total consideration of £12.6m (2016 – 0.8m shares, consideration of £11.1m). At 31 March 2017, the trust held 2.9m shares (2016 – 3.0m) which had a market value of £42.5m (2016 – £45.5m).
22.2 Capital redemption reserveThe capital redemption reserve comprises the value of shares redeemed or purchased by the Company from distributable profits.
22.3 Hedge reserveThe hedge reserve comprises the effective portion of the cumulative net change in the fair value of cash flow hedge derivative instruments related to hedged transactions that have not yet occurred.
22.4 Translation reserveComprises exchange translation differences on foreign currency net investments offset by exchange translation differences on borrowings and derivatives classified as net investment hedges under IAS 39.
22.5 Hybrid equity2017
£m2016
£m
USD 700m 5.625% perpetual subordinated capital securities (i) 427.2 427.2EUR 750m 5.625% perpetual subordinated capital securities (i) 598.2 598.2GBP 750m 3.875% perpetual subordinated capital securities (ii) 748.3 748.3EUR 600m 2.375% perpetual subordinated capital securities (ii) 436.0 436.0
2,209.7 2,209.7
(i) 18 September 2012 €750m and US$700m hybrid equity bondsEach bond has no fixed redemption date but the Company may, at its sole discretion, redeem all, but not part, of these capital securities at their principal amount. The date for the discretionary redemption of the capital issued on 18 September 2012 is 1 October 2017 and every five years thereafter. As noted at Note 21.3 (ii), the Group anticipate that proceeds from the 16 March 2017 issuance of hybrid debt securities will be utilised in the discretionary redemption of both 2012 bonds.
For the €750m capital issued on 18 September 2012, coupon payments are expected to be made annually in arrears on 1 October in each year. For the US$700m capital issued on 18 September 2012, coupon payments are expected to be made bi-annually in arrears on 1 April and 1 October each year.
(ii) 10 March 2015 £750m and €600m hybrid equity bondsOn 10 March 2016, the Company issued £750m and €600m hybrid equity bonds with no fixed redemption date, but the Company may, at its sole discretion, redeem all, but not part, of the capital securities at their principal amount. The date for the first potential discretionary redemption of the £750m hybrid equity bond is 10 September 2020 and then these can occur every 5 years thereafter. The date for the first discretionary redemption of the €600m hybrid equity bond is 1 April 2021 and then these can occur every 5 years thereafter. The purpose of the outstanding issues was to strengthen SSE’s capital base and fund the Group’s ongoing capital investment and acquisitions.
For the £750m hybrid equity bond issued on 10 March 2015 the first coupon payment was made on 10 September 2016 and are expected to be made annually in arrears thereafter, and for the €600m hybrid equity bond issued on 10 March 2015, the first coupon payment was made on 1 April 2016 and expected to be made annually in arrears thereafter.
152 SSE plc Annual Report 2017
Financial Statements
for the year ended 31 March 2017
Notes to the consolidated financial statements continued
22. Equity continued22.5 Hybrid capital continued(iii) Coupon paymentsCoupon payments in relation to the $700m hybrid equity bond were paid on 1 April 2016 and 1 October 2016 totalling £23.3m (2016 – £24.9m). A coupon payment of £33.6m (2016 – £36.2m) in relation to the €750m hybrid equity bond was paid on 1 October 2016.
For the €600m hybrid equity bond the first coupon payment of £18.6m was paid on 1 April 2016 and for the £750m hybrid equity bond the first coupon payment of £43.8m was paid on 10 September 2016, both were for first long coupon periods from 10 March 2016.
The Company has the option to defer coupon payments on the bonds on any relevant payment date, as long as a dividend on the ordinary shares has not been declared. Deferred coupons shall be satisfied only in the following circumstances, all of which occur at the sole option of the Company:
– redemption; or – dividend payment on ordinary shares.
Interest will accrue on any deferred coupon.
23. Retirement benefit obligationsDefined benefit schemesThe Group has two funded final salary pension schemes which provide defined benefits based on final pensionable pay. The schemes are subject to independent valuations at least every three years. The future benefit obligations are valued by actuarial methods on the basis of an appropriate assessment of the relevant parameters. The Company operates one of these schemes, being the Scottish Hydro-Electric scheme.
The Group also has an Employer Financed Retirement Benefit scheme and a Group Personal Pension Plan. The Group Personal Pension Plan operates on a Money purchase basis and has been arranged with Friends Provident. The Group matches employee contributions up to a specified limit, in most circumstances this is set at 6%. The Group may also provide additional contributions of 3% after five years and a further 3% after ten year’s continuous Group service.
Pension summary:Net actuarial (loss)/gain recognised in
respect of the pension asset in the Statement of Comprehensive Income Net pension (liability)
Scheme type2017
£m2016
£m2017
£m2016
£m
Scottish Hydro Electric Defined benefit 235.4 191.3 525.4 272.7Southern Electric Defined benefit (76.8) 112.5 (454.9) (404.8)
158.6 303.8 70.5 (132.1)IFRIC 14 movement 262.7 (49.5) – (262.7)
Net actuarial gain/(loss) and movement in IFRIC 14 liability 421.3 254.3 70.5 (394.8)
IFRC 14During the financial year the Group agreed with the trustees to the Scottish Hydro Electric pensions scheme an amendment to the scheme rules to clarify that the Company has a clear right to any surplus upon final winding up of the scheme. Under IFRIC 14, this amendment removes the previous restriction on recognition of any surplus and as such the previously applied restriction is no longer recognised. The net pension asset of the Scottish Hydro Electric Scheme at 31 March 2017 was equal to £525.4m (2016 – net asset of £10.0m presented after an IFRIC 14 minimum funding requirement of £262.7m).
The individual pension scheme details based on the latest formal actuarial valuations are as follows:
Scottish Hydro Electric Southern Electric
Latest formal actuarial valuation 31 March 2015 31 March 2016Valuation carried out by Hymans Robertson Aon HewittValue of assets based on valuation £1,916.0m £1,828.4mValue of liabilities based on valuation £1,964.7m £2,245.5mValuation method adopted Projected Unit Projected UnitAverage salary increase Inflation curve plus 1.0% pa RPI+1%Average pension increase RPI RPIValue of fund assets/accrued benefits 97.5% 81.4%
153
3. Financial Statements2.1.
23. Retirement benefit obligations continuedFuture contributionsScottish Hydro Electric SchemeThe last actuarial valuation of the scheme was carried out at 31 March 2015 and showed a deficit of £48.7m. In line with this funding valuation the Group has agreed a schedule of contributions until September 2019 which is expected to adequately fund the scheme and reduce any shortfall. The next funding valuation will be carried out as at 31 March 2018. The Group has also set out an agreed schedule of contributions in respect of current accrual. Based on this schedule of contributions, total contributions of approximately £33.1m are expected to be paid by the Company during the year ending on 31 March 2018, included within the amounts are deficit repair contributions of £14m, the Company has agreed to pay this amount annually until March 2019.
Southern Electric Pension SchemeThe last actuarial valuation of the Scheme as at 31 March 2016 and showed a deficit of £417.1m. The Group is paying deficit contributions which, along with investment returns from return-seeking assets, is expected to make good this shortfall by 31 March 2028. The next funding valuation will be carried out as at 31 March 2019. The Company also pays contributions in respect of current accrual, with some active members also paying contributions. Total contributions of approximately £70.6m are expected to be paid by the Company during the year ending on 31 March 2018, these include deficit repair contributions of £43.2m, which will be made annually until March 2020.
23.1 Pension scheme assumptionsBoth schemes have been updated to 31 March 2017 by qualified independent actuaries. The valuations have been prepared for the purposes of meeting the requirements of IAS 19. The major assumptions used by the actuaries in both schemes were:
At 31 March2017
At 31 March2016
Rate of increase in pensionable salaries 4.3% 4.1%Rate of increase in pension payments 3.3% 3.1%Discount rate 2.7% 3.6%Inflation rate 3.3% 3.1%
23.2 Sensitivity analysisThe assumptions relating to longevity underlying the pension liabilities at 31 March 2017 are based on standard actuarial mortality tables, and include an allowance for future improvements in longevity. The assumptions, equivalent to future longevity for members in normal health at age 65, are as follows:
Scottish Hydro ElectricAt 31 March
2017Male
At 31 March2017
Female
At 31 March2016Male
At 31 March2016
Female
Currently aged 65 23 24 26 26Currently aged 45 25 28 29 29
The impact on the schemes liabilities of changing certain of the major assumptions is as follows:
At 31 March 2017 At 31 March 2016
Increase/decrease in assumption
Effect onscheme
liabilities
Increase/decrease in assumption
Effect on schemeliabilities
Rate of increase in pensionable salaries 0.1% +/- 0.2% 0.1% +/- 0.2%Rate of increase in pension payments 0.1% +/- 1.2% 0.1% +/- 1.6%Discount rate 0.1% +/- 2.2% 0.1% +/- 2.0%Longevity 1 year +/- 4.5% 1 year +/- 2.9%
154 SSE plc Annual Report 2017
Financial Statements
for the year ended 31 March 2017
Notes to the consolidated financial statements continued
23.2 Sensitivity Analysis continuedSouthern Electric
At 31 March2017Male
At 31 March2017
Female
At 31 March2016Male
At 31 March2016
Female
Currently aged 65 23 25 24 26Currently aged 45 25 27 26 28
The impact on the schemes liabilities of changing certain of the major assumptions is as follows:
At 31 March 2017 At 31 March 2016
Increase/decrease in assumption
Effect onscheme
liabilities
Increase/decrease in assumption
Effect on schemeliabilities
Rate of increase in pensionable salaries 0.1% +/- 0.3% 0.1% +/- 0.3%Rate of increase in pension payments 0.1% +/- 1.5% 0.1% +/- 1.6%Discount rate 0.1% +/- 1.7% 0.1% +/- 1.7%Longevity 1 year +/- 4.0% 1 year +/- 3.2%
23.3 Valuation of combined pension schemes
Quoted£m
Unquoted£m
Value at 31 March
2017£m
Long-term rate of return
expected at 31 March
2017%
Quoted£m
Unquoted£m
Value at 31 March
2016£m
Long-term rate of return
expected at 31 March
2016%
Equities 1,203.9 – 1,203.9 5.5 1,049.6 – 1,049.6 5.5Government bonds 1,079.9 – 1,079.9 0.0 1,001.7 – 1,001.7 1.2Corporate bonds 1,288.6 – 1,288.6 2.7 1,069.7 – 1,069.7 3.0Insurance contracts (i) – 221.3 221.3 2.7 – – – –Other investments 591.9 – 591.9 3.4 581.9 – 581.9 1.7
Total fair value of plan assets 4,164.3 221.3 4,385.6 3,702.9 3,702.9Present value of defined benefit obligation (4,315.1) (3,835.0)
Pension asset/(liability) (pre-IFRIC 14) 70.5 (132.1)IFRIC 14 adjustment (ii) – (262.7)
Surplus/(deficit) in the schemes 70.5 (394.8)Deferred tax thereon (106.6) 71.0
Net pension liability (iii) (36.1) (323.8)
(i) See details of valuations of insurance contracts in Note 23.6(iv).(ii) The IFRIC 14 adjustment represents the restriction on Group’s ability to recognise scheme surplus under the ‘asset ceiling’ test. The application of this adjustment changed in the
current year following a change to scheme rules (see Note 4.2(v)). (iii) Deferred tax rate of 35% applied to pension surpluses, whilst 17% applied to pension deficits.
155
3. Financial Statements2.1.
23. Retirement benefit obligations continued23.4 Movements in the combined defined benefit asset obligations and assets during the year:
2017 2016
Assets£m
Obligations (i) £m Total
Assets£m
Obligations (i) £m Total
at 1 April 3,702.9 (3,835.0) (132.1) 3,751.0 (4,209.1) (458.1) Included in income statementCurrent service cost – (50.9) (50.9) – (61.8) (61.8)Past service cost – (13.6) (13.6) – (4.3) (4.3)Interest income/(cost) 130.9 (134.9) (4.0) 121.2 (134.9) (13.7)
130.9 (199.4) (68.5) 121.2 (201.0) (79.8)
Included in other comprehensive incomeActuarial (loss)/gain arising from:Demographic assumptions – 259.6 259.6 – 48.0 48.0Financial assumptions – (807.9) (807.9) – 277.4 277.4Experience assumptions – 31.4 31.4 – 101.5 101.5Return on plan assets excluding
interest income 675.5 – 675.5 (123.1) – (123.1)
675.5 (516.9) 158.6 (123.1) 426.9 303.8
OtherContributions paid by the employer 112.5 – 112.5 102.0 – 102.0Scheme participants contributions 0.2 (0.2) – 0.3 (0.3) –Benefits paid (236.4) 236.4 – (148.5) 148.5 –
(123.7) 236.2 112.5 (46.2) 148.2 102.0
Balance at 31 March 4,385.6 (4,315.1) 70.5 3,702.9 (3,835.0) (132.1)
(i) The IFRIC 14 adjustment represents the restriction on Group’s ability to recognise scheme surplus under the ‘asset ceiling’ test. The application of this adjustment changed in the current year following a change to scheme rules (see Note 4.2(v)).
Pension scheme contributions and costsCharges/(credits) recognised:
2017£m
2016£m
Current service cost (charged to operating profit) 64.5 66.1
64.5 66.1
Charged/(credited) to finance costs:Interest from pension scheme assets (130.9) (121.2)Interest on pension scheme liabilities 134.9 134.9
IFRIC 14 impact on net interest – 6.7
4.0 20.4
The return on pension scheme assets is as follows:
2017£m
2016£m
Return/(loss) on pension scheme assets 806.4 (1.9)
Defined contribution schemeThe total contribution paid by the Group to defined contribution pension schemes was £55.9m (2016 – £56.3m).
Employer financed retirement benefit (EFRB) pension costs The increase in the year in relation EFRB was £5.4m (2016 – £0.7m decrease). This is included in other provisions (Note 20).
156 SSE plc Annual Report 2017
Financial Statements
23. Retirement benefit obligations continued23.4 Movements in the defined benefit asset obligations and assets during the year continuedStaff costs analysisThe pension costs in Note 8 can be analysed thus;
2017£m
2016£m
Service costs 64.5 66.1Defined contribution scheme payments 55.9 56.3
120.4 122.4
23.5 Pension scheme risk assessment and mitigationRisks to which the pension schemes exposes the group The nature of the Groups’ defined benefit pension schemes expose the Group to the risk of paying unanticipated additional contributions to the schemes in times of adverse experience. The most financially significant risks are likely to be:
(i) Asset volatilityThe liabilities are calculated using a discount rate set with reference to corporate bond yields; if assets underperform this yield, this will create a deficit. The schemes hold a significant proportion of growth assets (equities, diversified growth fund and global absolute return fund) which, though expected to outperform corporate bonds in the long term, create volatility and risk in the short term. The allocation to growth assets is monitored to ensure it remains appropriate given the schemes’ long-term objectives.
(ii) Changes in bond yieldsA decrease in corporate bond yields will increase the value placed on the schemes’ liabilities for accounting purposes. However, this will be partially offset by and increase in the value of the schemes’ bond holdings.
(iii) Inflation riskThe majority of the schemes benefit obligations are linked to inflation, and higher inflation will lead to higher liabilities (although, in most cases, caps on the level of inflationary increases are in place to protect against extreme inflation). The majority of the assets are either unaffected by or only loosely correlated with inflation, meaning that an increase in inflation will also increase the deficit.
(iv) Life expectancyThe majority of the schemes’ obligations are to provide benefits for the life of the members, so an increase in the life expectancy will result in an increase in the liabilities. The sensitivity analysis disclosed is intended to provide an indication of the impact on the value of the schemes’ liabilities of the risks highlighted.
(v) Liability vs asset riskThe risk that movement in the value of the schemes’ liabilities are not met by corresponding movements in the value of the schemes’ assets.
Risk MitigationDe-riskingThe trustees have taken a number of steps to control the level of investment risk including reducing the schemes’ exposures to higher risk assets and increasing the level of protection against adverse movements in interest rates and inflation. The trustees of both schemes continue to review the risk exposures in light of the longer term objectives of the respective schemes.
Asset-liability matching strategies used by the scheme The Company and trustees of the schemes have agreed a long-term investment strategy that seeks to reduce investment risk as and when appropriate. The asset-liability matching strategy is part of this approach which aims to reduce the volatility of the funding level of the pension schemes by investing in assets which perform in line with the liabilities of the schemes so as to protect against inflation being higher than expected. This has been adopted for a proportion of the schemes’ assets, which is designed to provide partial protection against adverse movements in interest rates and inflation. The trustees of the respective schemes review the schemes’ asset allocation on an ongoing basis in light of changes in the funding position and market opportunities.
Risk assessmentMaturity profile of the defined benefit obligationsThe weighted average duration of the defined benefit obligation is 22 years (2016 – 21 years) for the Scottish Hydro Electric Pension Scheme and 18 years (2016 – 17 years) for the Southern Electric Pension Scheme.
for the year ended 31 March 2017
Notes to the consolidated financial statements continued
157
3. Financial Statements2.1.
23. Retirement benefit obligations continued23.5 Pension scheme risk assessment and mitigation continuedInformation about the defined benefit obligationsStatus of members is weighted by the liabilities of each scheme
Scottish Hydro Electric
%
Southern Electric Scheme
%
Active members 41.0 39.0Deferred members 12.0 9.0Pensioners 47.0 52.0
100.0 100.0
23.6 Pension scheme policies(i) Recognition of gains and lossesThe Group recognises actuarial gains and losses in the Statement of Other Comprehensive Income following the re-measurement of the net defined benefit liabilities of the schemes.
(ii) Methods and assumptions used in preparing the sensitivity analyses The sensitivities disclosed are calculated using approximate methods taking into account the duration of the schemes’ liabilities. While these have been calculated consistently with the previous financial year, the method applied may change over time with financial conditions and assumptions.
(iii) Asset recognition The Group has recognised net pension assets in relation to the Scottish Hydro Electric pension scheme due to a surplus existing under IAS 19 accounting. The Group will only recognise a surplus should it have rights to that surplus under the rules of the pension scheme. During the financial year the company has no longer applied the ‘asset ceiling’ restriction mandated by IFRIC 14 in respect of the Scottish Hydro Pension scheme. Details on this key accounting consideration are provided at Note 4.2 (v) and above.
(iv) Fair value assessment of scheme assetsThe Group seeks to assess whether there is a quotable market value (referenced as ‘quotable’ above) in relation to pension scheme assets held. This assessment is based on regular reviews conducted in conjunction with the trustees of the schemes. For assets where no quotable market value exists, these assets will be valued based on a set methodology agreed by trustees and scheme advisors and then regularly assessed.
Currently only one unquotable value exists within the two pension schemes of the Group, this being insurance contracts held by the Scottish Hydro Electric Scheme which were entered into during the current financial year. These assets are currently valued consistently with the scheme’s liabilities with the expected return on these assets being set equal to the discount rate.
24. Financial instrumentsFor financial reporting purposes, the Group has classified derivative financial instruments into two categories, operating derivatives and financing derivatives. Operating derivatives include all qualifying commodity contracts including those for electricity, gas, oil, coal and carbon. Financing derivatives include all fair value and cash flow interest rate hedges, non-hedge accounted (mark-to-market) interest rate derivatives, cash flow foreign exchange hedges and non-hedge accounted foreign exchange contracts. Non-hedge accounted contracts are treated as held for trading.
24.1 Financial instruments – income statement
2017£m
2016£m
Operating derivativesTotal result on operating derivatives (i) (438.6) (1,375.4)
Less: Amounts settled (ii) 639.6 1,344.3
Movement in unrealised derivatives 201.0 (31.1)
Financing derivatives (and hedged items)Total result on financing derivatives (i) (136.3) (214.9)
Less: Amounts settled (ii) 188.9 229.2
Movement in unrealised derivatives 52.6 14.3
Net income statement impact 253.6 (16.8)
(i) Total result on derivatives in the income statement represents the total amounts (charged) or credited to the income statement in respect of operating and financial derivatives.(ii) Amounts settled in the year represent the result on derivatives transacted which have matured or been delivered and have been included within the total result on derivatives.
158 SSE plc Annual Report 2017
Financial Statements
24. Financial instruments continued24.2 Financial instruments – balance sheetThe derivative financial assets and (liabilities) are represented as follows:
2017£m
2016£m
Derivative financial assetsNon-current 528.3 537.7Current 1,269.5 1,615.0
1,797.8 2,152.7Derivative liabilities
Non-current (703.2) (857.5)Current (1,153.2) (1,783.8)
Total derivative liabilities (1,856.4) (2,641.3)
Net liability (58.6) (488.6)
Information on the Group’s financial risk management and the fair value of financial instruments is available at A6 and A7.
25. Commitments and contingencies25.1 Capital commitments
2017£m
2016£m
Capital expenditure:Contracted for but not provided 949.0 898.4
Contracted for but not provided capital commitments include the fixed contracted costs of the Group’s major capital projects. In practice contractual variations may arise on the final settlement of these contractual costs.
25.2 Operating lease commitments(i) Leases as lessee:
2017£m
2016£m
Amount included in the income statement relating to the current year leasing arrangementsMinimum lease payments – power purchase agreement 80.3 93.1Other lease payments 85.2 73.0
165.5 166.1
At the balance sheet date, the Group had outstanding commitments for future minimum lease payments under non-cancellable operating leases, which fall due as follows:
2017 2016
PPAs£m
Other£m
Total£m
PPAs£m
Other£m
Total£m
Within one year 86.0 65.9 151.9 78.6 76.9 155.5Two to five years – 153.5 153.5 86.8 134.9 221.7After five years – 240.8 240.8 – 244.5 244.5
86.0 460.2 546.2 165.4 456.3 621.7
The average power purchase agreement (PPA) lease term is 1 year (2016 – 4 years).
Certain obligations under power purchase agreements with various power generating companies are not deemed to qualify as finance leases as the lease term is not judged to be substantially all of the economic life of the power station and the present value of the minimum lease payments at the inception of the agreements did not amount to substantially all of the fair value of the power stations at that time.
(ii) Leases as lessor:The Group have no operating lease commitments as a lessor.
for the year ended 31 March 2017
Notes to the consolidated financial statements continued
159
3. Financial Statements2.1.
A1. Basis of consolidation and significant accounting policies A1.1 Basis of consolidation The financial statements consolidate the financial statements of the Company and its subsidiaries together with the Group’s share of the results and net assets of its interests in joint arrangements and associates. Where necessary to ensure consistency, the accounting policies of the subsidiaries, joint arrangements or associates have been adjusted to align to the accounting policies of the Group. Intra-Group balances and any unrealised gains and losses or income and expenses arising from Intra-Group transactions, are eliminated in preparing the consolidated financial statements. Unrealised gains and losses arising from transactions with joint arrangements and associates are eliminated to the extent of the Group’s interest in the entity. Non-controlling interests represent the equity in subsidiaries that is not attributable, either directly or indirectly, to SSE plc shareholders.
Subsidiaries (Note 4.2 (iii), Accompanying information A3)Subsidiaries are those entities controlled by the Group or the Company. Control exists when the Group has the power, directly or indirectly, to govern the financial and operating policies of an entity in order to obtain variable returns from its activities. In assessing control, potential voting rights that are currently exercisable or convertible are taken into account. The financial statements of subsidiaries acquired are consolidated in the financial statements of the Group from the date that control commences until the date control ceases. Transactions with non-controlling interests that relate to their ownership interests and do not result in a loss of control are accounted for as equity transactions.
Interests in joint arrangements and associates (Note 4.2 (iii), Note 16 and Accompanying information A3)Joint arrangements, as defined by IFRS 11, are those arrangements that convey to two or more parties ‘ joint control’. Joint control exists when decisions about the ‘relevant activities’, being the financial, operational or strategic policies of the arrangement, are made with the unanimous consent of the parties sharing control. The Group’s investments in joint arrangements are classified as either joint operations or joint ventures depending on the investor’s contractual rights and obligations.
Associates are those investments over which the Group has significant influence but neither control nor joint control.
The Group’s interests in its joint operations are accounted for by recognising its share of the assets, liabilities, revenue and expenses of the operation. In these arrangements, the Group’s share of the revenue will be eliminated as it relates to its purchased share of the output from the arrangement.
The Group’s joint ventures and associates are accounted for using the equity method of accounting where the joint venture and associate investments are carried at historical cost plus the Group’s share of post-acquisition results, less any impairment in value. The Group recognises its share of the results of these equity-accounted operations after tax and interest in the income statement.
Foreign currenciesThe consolidated financial statements are presented in pounds sterling, which is the functional currency of the Group’s presentational currency. Each entity in the Group determines its own functional currency and items included in the financial statements of each entity are measured accordingly.
Transactions in foreign currencies are recorded at the rate ruling at the date of the transaction. Monetary assets and liabilities denominated in foreign currencies are translated at the rate of exchange ruling at the balance sheet date. Any gain or loss arising on the restatement of such items is taken to the income statement with the exception of exchange gains or losses on foreign currency borrowings that provide a hedge against a net investment in a foreign entity or exchange gains or losses incurred as part of a qualifying cash flow hedge which are transferred to the translation reserve to the extent the hedge is effective. Non-monetary assets that are measured in terms of historical cost in a foreign currency are translated at the historic rate at the date of transaction.
For the purpose of presenting the consolidated financial statements, the assets and liabilities of the Group’s foreign operations are translated into pounds sterling at the balance sheet closing rate. The results of these operations are translated at the average rate in the relevant period. Exchange differences on retranslation of the opening net assets and the results of foreign operations are transferred to the translation reserve and are reported in the consolidated statement of comprehensive income.
A1.2 Significant accounting policiesRevenue (Note 5)Revenue is recognised to the extent that it is probable that economic benefits from the provision of goods and services in the normal course of business will flow to the Group, and that the revenue can be reliably measured. Revenue principally comprises energy generation and related trading, supply of energy, use of electricity networks, production of gas, gas storage facility services, construction contracts, contracted services and sale of goods.
Revenue from energy generation and related trading comprises power generated during the year including related physical energy and commodity trades to optimise generation plant performance. Revenue from energy generation is recognised as generated and supplied during the year. Revenue from optimisation trades in physical and financial energy and commodity contracts is recognised gross in the income statement.
Revenue on the supply of energy comprises sales to retail end-user customers based on actual energy consumption including an estimate of the value of electricity and gas supplied to customers between the date of the last meter reading and the year end. Details of the estimation process for the value of electricity and gas supplied to customers is given within Note 4.1 (ii).
Accompanying information
160 SSE plc Annual Report 2017
Financial Statements
A1. Basis of consolidation and significant accounting policies continuedA1.2 Significant accounting policies continuedRevenue from use of electricity networks is derived from the allowed revenue as defined by the parameters in the relevant electricity distribution or transmission licence regulations, which informs the tariffs we set. Electricity distribution revenue recognised is based on the volume of electricity distributed and the set customer tariff. Where this revenue differs from the allowed revenue, there may be an over- or under-recovery of revenue which will be reflected in future financial year’s allowed revenue as set out in the regulatory licence and relevant industry codes. No accounting adjustment is made for over-or under-recoveries in the year that they arise. Electricity transmission revenue is determined in accordance with its regulatory licence, is subject to approval of the industry regulator Ofgem and is charged to National Grid. As with Electricity Distribution revenue, any revenue adjustments assessed by Ofgem are reflected in future financial year’s allowed revenue.
Revenue from the production of natural gas, crude oil and condensates arises from the Group’s interest in various joint ventures and associates and is based on the entitlement method; whereby the Group’s share of interest and production sharing terms are used to determine the allocation of production to each party in the arrangement. Revenue is recognised when title passes to the customer, with any short-term imbalances between cumulative production entitlement and cumulative sales (known as overlift and underlift) recognised at the balance sheet date as a payable or receivable measured at market value.
Gas storage facilities revenues are recognised evenly over the contract period, whilst revenues for the injection and withdrawal of gas are recognised at the point of gas flowing into or out of the storage facilities.
Where the outcome of a construction contract can be estimated reliably, revenue and costs are recognised by reference to the stage of completion of the contract activity at the balance sheet date. This is normally measured as the proportion of cost incurred on work performed to date compared to the estimated total contract cost, except where this would not be representative of the stage of completion. Variations in contract work, claims and incentive payments are included to the extent that they have been agreed with the customer. When it becomes probable that total contract costs will exceed total contract revenue, the expected loss is recognised as an expense immediately in the income statement.
Where the Group has an ongoing obligation to provide contracted services, revenues are recognised as the service is performed with amounts billed in advance or arrears treated as either deferred income or accrued income and excluded from current revenue. Where a contract includes capital works and ongoing services (such as for network connections activity), revenue is recognised upon completion of the associated capital works where there is either no ongoing service obligation or where any future service obligations are clearly separable. Revenue from fixed-fee service contracts is recognised over the life of the contract, in relation to the benefit received by the customer.
Sales of goods are recognised when goods are delivered and title has passed, along with the risks and rewards of ownership, to the customer.
Finance income and costs (Note 9)Finance income comprises interest receivable on funds invested in short-term deposits and the Group’s interests in jointly controlled entities and associates and from interest rate derivative receipts. Finance costs comprise interest payable on borrowings and finance leases, the release of discounting on provisions, interest on net pension scheme liabilities, interest rate derivative payments and accretion of the debt component on the convertible loan less capitalised interest.
Interest on the funding attributable to major capital projects is capitalised during the years of construction and depreciated as part of the total cost over the useful life of the asset.
Interest income and costs are recognised in the income statement as they accrue, on an effective interest method. The issue costs and interest payable on bonds and all other interest payable and receivable is reflected in the income statement on the same basis.
Taxation (Note 10)Taxation on the profit for the year comprises current and deferred tax. Taxation is recognised in the income statement unless it relates to items recognised directly in equity, in which case it is recognised in other comprehensive income.
Current tax is the expected tax payable on the taxable income for the year, using tax rates enacted or substantively enacted at the balance sheet date, and any adjustment to tax payable in respect of previous years.
Deferred tax is calculated using the balance sheet liability method, providing for temporary differences between the carrying amounts of assets and liabilities for financial reporting purposes and the amounts used for taxation purposes. The following temporary differences are not provided for: goodwill not deductible for tax purposes, the initial recognition of assets or liabilities other than in business combinations that affect neither accounting nor taxable profit, and differences relating to investments in subsidiaries to the extent that they will probably not reverse in the foreseeable future. The amount of deferred tax provided is based on the expected manner of realisation or settlement of the carrying amount of assets and liabilities, using tax rates enacted or substantively enacted at the balance sheet date.
Deferred tax assets and liabilities are offset where there is a legally enforceable right of offset within the same tax authority and where the Group intends to either settle them on a net basis, or to realise the asset and settle the liability simultaneously. A deferred tax asset is recognised only to the extent that it is probable that future taxable profits will be available against which the asset can be utilised. Deferred tax assets are reduced to the extent that it is no longer probable that the related tax benefit will be realised.
Accompanying information continued
161
3. Financial Statements2.1.
A1. Basis of consolidation and significant accounting policies continuedA1.2 Significant accounting policies continuedBusiness combinations (Note 12) The acquisition of subsidiaries, and joint operations that meet the definition of a business, is accounted for under the acquisition method as defined by IFRS 3.
The cost of acquisition is measured as being the aggregate fair value of consideration to be transferred at the date control is obtained. Contingent consideration is classified as a liability and subsequently re-measured through the income statement. Acquisition costs are expensed as incurred.
Held for sale assets and liabilities (Note 12)Non-current assets are classified as held for sale if their recoverable value is likely to be recovered via a sale opposed to continued use by the Group. In order to be classified as non-current assets held for sale, assets must meet all of the following conditions; the sale is highly probable, it is available for immediate sale, it is being actively marketed and the sale is likely to occur within one year.
Non-current assets determined as held for sale are measured at the lower of carrying value and fair value less costs to sell, no depreciation is charged in respect of these assets after classification as held for sale.
Intangible assets (Note 13)Goodwill and impairment testingGoodwill arising on a business combination represents the excess of the cost of acquisition over the Group’s interest in the fair value of the identifiable assets, liabilities and contingent liabilities of a subsidiary, associate or joint venture at the date of acquisition. Following initial recognition, goodwill is measured at cost less any accumulated impairment losses. Goodwill is reviewed for impairment at least on an annual basis.
For the purpose of impairment testing, goodwill is allocated on initial recognition to those cash-generating units (CGUs) expected to benefit from the combination’s synergies. The cash-generating units used for goodwill impairment testing purposes will represent how goodwill was attributed but may not represent reportable business segments.
Goodwill may also arise upon investments in joint arrangements and associates. Goodwill arising on a joint operation is recorded as a separate asset and any impairment loss is recognised in the income statement. Goodwill arising on a joint venture or associate is recorded within the carrying amount of the Group’s investment and any impairment loss is included within the share of result from joint ventures and associates. On disposal or closure of a previously acquired investment or business, any attributed goodwill will be included in determining the profit or loss on disposal.
Research and developmentExpenditure on research activities is charged to the income statement as incurred. Expenditure on development activities, whereby research findings are applied to a plan or design for the production of new or substantially improved products or processes, is capitalised if the product or process is considered to be technically and commercially feasible and the Group intends to complete the product or process for use or for sale.
Allowances and emissionsThe European Emissions trading scheme (EU ETS) has been in operation since 1 January 2005. The IASB withdrew IFRIC 3 Emission Rights in June 2005 and it has not been replaced with definitive guidance or interpretation for CO
2 (‘carbon’) emissions trading. Carbon allowances
purchased are recorded at cost within intangible assets. A liability is recognised based on the level of emissions recorded. Up to the level of allowances held, the liability is measured at the cost of purchase. When the carbon emission liability exceeds the carbon allowances held, the net liability is measured at market value selling price. Movements in the market value of the liability are recognised in operating profit. Forward carbon contracts are measured at fair value with gains or losses arising on re-measurement being recognised in the income statement.
The carbon allowance intangible asset is surrendered at the end of the compliance period to the extent requested reflecting the consumption of the economic benefit and is recorded as being utilised. As a result, no amortisation is booked but an impairment charge may be recognised should the carrying value of allowances exceed market or fair value.
Under the Renewable Obligations Certificates (ROCs) scheme, certificates obtained from own generation are awarded by a third party, Ofgem. Self-generated certificates are recorded at market value and purchased certificates are recognised at cost, both within intangible assets. The liability under the renewables obligation is recognised based on electricity supplied to customers, the percentages set by Ofgem and the prevailing market price. The intangible asset is surrendered at the end of the compliance period reflecting the consumption of economic benefit. As a result no amortisation is recorded during the period.
162 SSE plc Annual Report 2017
Financial Statements
A1. Basis of consolidation and significant accounting policies continuedA1.2 Significant accounting policies continuedDevelopment assetsCosts capitalised as development intangibles represent the costs incurred in bringing individual projects to the consented stage. These include wind farm developments, thermal generation and gas storage projects, prospective gas production assets and other developments relating to proven technologies. Costs associated with reaching the consent stage include options over land rights, planning application costs and environmental impact studies. These may be costs incurred directly or part of the fair value exercise on acquisition of an interest in a project. The asset is subject to impairment testing on an annual basis. At the point that the project reaches the consent stage and is approved by the Board, the carrying value of the project is transferred to property, plant and equipment as assets under construction. Once in operation, depreciation will be charged over the expected useful life of the asset. The asset is derecognised on disposal, or when no future economic benefits are expected to arise.
Other intangible assetsOther intangible assets that have been acquired separately by the Group are stated at cost less accumulated amortisation and impairment losses. Expenditure on internally generated brands or customer lists are expensed as incurred. Expenditure on internally developed software assets and application software licences includes contractors’ fees and directly attributable labour and overheads. Amortisation is charged to the income statement on a straight-line basis over the estimated useful life of these assets. The amortisation periods utilised are as follows:
Years
Brands 10Customer lists Shorter of contract term or 5Developed software assets and application software licences 5-10
The useful lives of all the intangible assets are reviewed annually and amended, as required, on a prospective basis. Intangible assets are derecognised on disposal, or when no future economic benefits are expected from their use.
Property, plant and equipment (Note 14)Owned assetsItems of property, plant and equipment are stated at cost less accumulated depreciation and impairments. The cost of self-constructed assets includes the cost of materials, direct labour and other directly attributable costs. Where the asset is a qualifying asset, for which a considerable period of time is required to prepare the asset for use or sale, borrowing costs will be capitalised as part of the asset’s cost. Where an item of property, plant and equipment comprises major components having different useful lives, the components are accounted for as separate items of property, plant and equipment, and depreciated accordingly. An item of property, plant and equipment is derecognised on disposal or when no future economic benefits are expected to arise from the continued use of the asset.
Leased assetsLeases where the Group assumes substantially all the risks and rewards of ownership are classified as finance leases.
Assets held under finance leases are recognised as part of the property, plant and equipment of the Group at the fair value or, if lower, at the present value of the minimum lease payments, each determined at the inception of the lease. The corresponding liability is included in the balance sheet as a finance lease obligation. Lease payments are apportioned between finance charges and reduction of lease obligation so as to achieve a constant rate of interest on the remaining balance of the liability. Finance charges are charged directly against income unless they are directly attributable to qualifying assets, in which case they are capitalised as part of the asset cost.
Hydro civil assetsThe Group is obliged under the Reservoirs Act 1975 to maintain its hydro infrastructure network, including its dams, tunnels and other hydro civil engineering structures (hydro civil assets). All items of property, plant and equipment within hydro civil assets, with the exception of land, are subject to depreciation.
In accordance with the transition provisions of IFRS 1, the Group identified the carrying value of these assets at privatisation and has treated this value as deemed cost. Following this assessment, the assets, and all subsequent enhancement and replacement expenditure, has been subject to depreciation over a useful economic life of 100 years. All subsequent maintenance expenditure is chargeable directly to the income statement.
Accompanying information continued
163
3. Financial Statements2.1.
A1. Basis of consolidation and significant accounting policies continuedA1.2 Significant accounting policies continuedDepreciationDepreciation is charged to the income statement to write off cost, less residual values, on a straight line basis over their estimated useful lives with the exception of Gas Production Assets which are depreciated on the Units of Production basis. Heritable and freehold land is not depreciated. Depreciation policy, useful lives and residual values are reviewed at least annually, for all asset classes to ensure that the current method is the most appropriate. Depreciation commences following the asset commissioning period and when the asset is available for commercial operation. The estimated useful lives for assets depreciated on a straight line basis are as follows:
Years
Wholesale specific assetsHydro civil assets 100Thermal and hydro power stations including electrical and mechanical assets 20 to 60Operating wind farms 20 to 25Gas storage facilities 25 to 50E&P common infrastructure assets 25 to 50
Networks specific assetsOverhead lines, underground cables and other network assets 40 to 80Other transmission and distribution buildings, plant and equipment 10 to 45
Group wide assetsOffice buildings 30 to 40Fixtures, IT assets, vehicles and mobile plant 3 to 10
Assets held under finance leases are depreciated over their expected useful lives on the same basis as owned assets or, where shorter, over the term of the relevant lease.
Subsequent expenditureIt is the Group policy to capitalise qualifying replacement expenditure and depreciate it over the expected useful life of the replaced asset. Replaced assets are derecognised at this point and the costs recorded as costs of disposal. Where an item of property, plant and equipment is replaced and it is not practicable to determine the carrying amount of the replaced part, the cost of the replacement adjusted for inflation will be used as an approximation of the cost of the replaced part at the time it was acquired or constructed.
Expenditure incurred to replace a component of an item of property, plant and equipment that is accounted for separately is capitalised. Other subsequent expenditure is capitalised only when it increases the future economic benefits of the item of property, plant and equipment to which it relates. Maintenance and repair costs are expensed as incurred.
DerecognitionAn item of property, plant or equipment is derecognised upon disposal or when no future economic benefits are expected to arise from the continued use of the asset. Gains and losses on disposals are determined by comparing the proceeds received with the carrying amount of the asset and are included in the income statement. Any gain or loss on derecognition of the asset is included in the income statement in the period of derecognition.
Exploration, evaluation and production assets (Notes 13 and 14)The Group uses the successful efforts method of accounting for exploration and evaluation expenditure associated with exploration wells or ‘prospects’. This expenditure will be capitalised initially within intangible assets and will include licence acquisition costs associated with the prospects. Upon recognition of proved and probable reserves and internal approval for development, the relevant expenditure will be transferred to property, plant and equipment and depreciated on a unit of production basis. If the prospects are determined to be unsuccessful, and no future activity is planned, the intangible asset will be expensed in the period in which that determination is made.
All field development costs, including rights and concessions related to production activities, are capitalised as property, plant and equipment. Capitalised costs relate to the acquisition and installation of production assets and facilities and include specialist engineering, drilling and technical services costs. These property, plant and equipment assets are depreciated from the commencement of production in the fields concerned, using the unit of production method, based on the estimated proven and probable reserves of those fields. Changes in these estimates are dealt with prospectively.
All common infrastructure costs, such as production facilities or pipelines that are common to more than one field, are depreciated on a straight line basis, reflecting their shared usage unrelated to the production of any one field.
All exploration and production assets are reviewed annually for indicators of impairment. Where indicators of impairment are identified, the carrying value of the field assets are compared with the expected discounted future net cash flows associated with the remaining estimated commercial reserves. An impairment loss will be recognised where it is considered that recorded amounts are unlikely to be fully recovered from the net present value of future net cash flows.
164 SSE plc Annual Report 2017
Financial Statements
A1. Basis of consolidation and significant accounting policies continuedA1.2 Significant accounting policies continuedLeases (Notes 14 and 25)The determination of whether an arrangement contains a lease is dependent on whether the arrangement relates to use and control of a specific asset. Leases are classified as finance leases if the arrangement transfers substantially all the risks and rewards of ownership to the lessee. All other leases are categorised as operating leases.
Finance lease obligationsAssets held under finance leases are capitalised and held as part of property, plant and equipment. The accounting policy for such arrangements is described on page 162.
Operating lease obligationsPayments made under operating leases are recognised in the income statement on a straight-line basis over the term of the lease. Lease incentives received are recognised in the income statement as an integral part of the total lease expense.
Impairment review (Note 15)The carrying amounts of the Group’s PP&E and other intangible assets and the Group’s investments in joint ventures and associates, are reviewed for impairment whenever events or changes in circumstances indicate that the carrying amount may not be recoverable. For PP&E assets that have previously been identified as exhibiting indications of impairment, the review of impairment will be performed annually until there is sufficient evidence to confirm that any potential impairment loss has been appropriately recognised. For goodwill and other intangible assets with an indefinite life or which are not yet ready for use, the test for impairment is carried out annually. In addition, financial assets measured at amortised cost are also reviewed for impairment annually.
For assets subject to impairment testing, the asset’s carrying value is compared to the asset’s (or cash-generating unit (CGU)’s, in the case of goodwill), recoverable amount. The recoverable amount is determined to be the higher of the fair value less costs to sell (FVLCS) and the value-in-use (VIU) of the asset or CGU. For financial assets measured at amortised cost the impairment is measured as the difference between the asset’s carrying amount and the present value of estimated future cash flows discounted at the financial asset’s original effective interest rate.
If the carrying amount of the asset or CGU exceeds its recoverable amount, an impairment charge will be recognised immediately in the income statement and, in relation to the impairment of goodwill, will not be subsequently reversed.
Value in use (VIU) calculations require the estimation of future cash flows to be derived from the respective assets (or CGUs) and the selection of an appropriate discount rate in order to calculate their present value. The VIU methodology is consistent with the approach taken by management to evaluate economic value and is deemed to be the most appropriate for reviews of PP&E asset and the Group’s identified goodwill-related CGUs. The methodology is based on the pre-tax cash flows arising from the specific assets, underlying assets or CGUs, and discounted using a pre-tax discount rate based on the Group’s cost of funding and adjusted for any specific risks. The estimation of the timing and value of underlying projected cash flows and the selection of appropriate discount rates involves management judgement. Subsequent changes to these estimates or judgements may impact the carrying value of the assets.
The fair value less costs to sell methodology also uses a present value technique, unless there is a quoted price in an active market for that asset. The methodology is based on the post-tax cash flows arising from the specific assets, underlying assets or CGUs, and discounted using a post-tax discount rate determined in the same manner as the rates used in the VIU calculations, adjusted for the relevant taxation rate.
For goodwill, the impairment charge will initially be adjusted against the goodwill allocated to the cash-generating unit. Thereafter, the remaining assets of the cash-generating unit will be written-down proportionately. Impairments of other intangible or PP&E assets will only reversed only if there has been a significant increase in the recoverable amount associated with the asset. Impairments of Goodwill are not written back.
Inventories and work in progress (Note 17)Inventories are valued at the lower of cost (on a first-in, first-out basis) and net realisable value. Net realisable value is the estimated selling price in the ordinary course of business, less the estimated costs of completion and selling expenses. The cost of fuel stocks is based on the weighted average principle. The valuation of work in progress is based on the direct costs of labour, contractors, materials plus other directly attributable overheads.
Provisions (Note 20)A provision is recognised in the balance sheet when the Group has a present legal or constructive obligation as a result of a past event, and it is probable that an outflow of economic benefits will be required to settle the obligation. If the effect is material, provisions are determined by discounting the expected future cash flows at a pre-tax rate that reflects current market assessments of the time value of money and, where appropriate, the risks specific to the liability.
Accompanying information continued
165
3. Financial Statements2.1.
A1. Basis of consolidation and significant accounting policies continuedA1.2 Significant accounting policies continuedDecommissioningThe estimated cost of decommissioning at the end of the useful lives of certain assets is reviewed periodically. Provision is made for the net present value of the estimated cost of decommissioning gas production facilities at the end of the producing lives of fields, and gas storage facilities, offshore wind farms and power stations at the end of the useful life of the facilities. The estimates are based on technology and prices at the balance sheet date. A corresponding decommissioning asset is recognised and is included within property, plant and equipment when the provision gives access to future economic benefits. Changes in these provisions are recognised prospectively. The unwinding of the discount on the provision is included in finance costs and the depreciation for the asset is straight-line over the expected useful life of the asset or, for gas production facilities, is amortised on the unit of production method.
Employee benefit obligations (Note 23)Defined benefit pension schemesThe Group operates two defined benefit pension schemes, one of which is operated by the Company. Pension scheme assets are measured using bid market values. Pension scheme liabilities are measured using the projected unit credit actuarial method and are discounted at the current rate of return on a high quality corporate bond of equivalent term and currency to the liability.
Any increase in the present value of liabilities within the Group’s defined benefit pension schemes expected to arise from employee service in the year is charged as service costs to operating profit.
Net interest costs are based on net schemes’ liabilities adjusted for minimum funding requirement and pension surplus restrictions under IFRIC 14. Actuarial gains and losses are recognised in full in the consolidated statement of comprehensive income. Pension scheme surpluses, to the extent that they are considered recoverable, or deficits are recognised in full and presented on the face of the balance sheet.
Defined contribution pension schemesThe Group also operates a number of defined contribution pension schemes. The assets of the schemes are held separately from those of the Group in independently administered funds. The amounts charged represent the contributions payable to the schemes in the year and are charged directly to the income statement.
Equity and equity-related compensation benefitsThe Group operates a number of employee share schemes as described in the Remuneration Report. These schemes enable Group employees to acquire shares of the Company.
The exercise prices of the sharesave scheme are set at a discount to market price at the date of the grant. The fair value of the sharesave scheme option granted is measured at the grant date by use of a Black-Scholes model. The fair value of the options granted is recognised as an expense on a straight-line basis over the period that the scheme vests. Estimates are updated for non-market conditions at each balance sheet date with any adjustment in respect of the current and prior years being recognised in the income statement. The costs associated with the other main employee schemes are recognised over the period to which they relate. The charge related to the equity shares in the Company awarded under the share schemes is treated as an increase in the cost of investment held by the Company in the subsidiary companies of the Group. Following an assessment of the Group’s disclosures, the disclosures on equity and equity-related compensation benefits have been removed in the current year on the grounds of materiality in relation to the Group.
Financial instruments (Note 24)The Group uses a range of financial instruments to hedge exposures to financial risks, such as interest rate, foreign exchange and energy price fluctuations in its normal course of business and in accordance with the Group’s risk management policies. The Group’s risk management policies are further explained in A6.
Interest rate and foreign exchange derivativesFinancial derivative instruments are used by the Group to hedge interest rate and currency exposures. All such derivatives are recognised at fair value and are re-measured to fair value each reporting period. Certain derivative financial instruments are designated as being held for hedging purposes. The designation of the hedge relationship is established at the inception of the hedge and procedures are applied to ensure the derivative is highly effective in achieving its objective and that the effectiveness of the hedge can be reliably measured. The treatment of gains and losses on re-measurement is dependent on the classification of the hedge and whether the hedge relationship is designated as either a ‘fair value’ or ‘cash flow’ hedge. Derivatives that are not designated as hedges are treated as if held for trading, with all fair value movements being recorded through the income statement.
A derivative classified as a ‘fair value’ hedge recognises gains and losses from re-measurement immediately in the income statement. Loans and borrowings are measured at cost except where they form the underlying transaction in an effective fair value hedge relationship. In such cases, the carrying value of the loan or borrowing is adjusted to reflect fair value movements with the gain or loss being reported in the income statement.
166 SSE plc Annual Report 2017
Financial Statements
A1. Basis of consolidation and significant accounting policies continuedA1.2 Significant accounting policies continuedA derivative classified as a ‘cash flow’ hedge recognises the portion of gains or losses on the derivative which are deemed to be effective directly in equity in the hedge reserve. Any ineffective portion of the gains or losses is recognised in the consolidated income statement. When hedged cash flows result in the recognition of a non-financial asset or liability, the associated gains or losses previously recognised in equity are included in the initial measurement of the asset or liability. For all other cash flow hedges, the gains or losses that are recognised in equity are transferred to the income statement in the same period in which the hedged cash flows affect the income statement.
Hedge accounting is discontinued when the hedging instrument expires or is sold, terminated or exercised, or no longer qualifies for hedge accounting. At the point of discontinuation, any cumulative gain or loss on the hedging instrument recognised in equity remains in equity until the forecast transaction affects profit or loss. On settlement, the cumulative gain or loss recognised in equity is recognised in the income statement.
Commodity derivativesWithin its regular course of business, the Group routinely enters into sale and purchase derivative contracts for commodities such as electricity, gas, coal, carbon allowances and oil. Where the contract was entered into and continues to be held for the purpose of receipt or delivery in accordance with the Group’s expected sale, purchase or usage requirements, the contracts are designated as ‘own use’ contracts and are measured at cost. These contracts are not within the scope of IAS 39.
Derivative commodity contracts which are not designated as own use contracts are accounted for as trading derivatives and are recognised in the balance sheet at fair value. Where a hedge accounting relationship is designated and is proven to be effective, the changes in fair value will be recognised in accordance with the rules noted in part (i) to this note. There are currently no designated hedge relationships in relation to commodity contracts.
Other commodity contracts, where own use is not established and a hedge accounting relationship is not designated, are measured at fair value with gains and losses on re-measurement being recognised in the income statement in cost of sales.
Embedded derivativesDerivatives embedded in other financial instruments or other host contracts are treated as separate derivatives where the characteristics of the derivatives are not closely related to those of the host contracts.
Net investment hedgesHedges of net investments in foreign operations are accounted in a manner similar to effective cash flow hedges. Any gain or loss on the effective portion of the hedge is recognised in equity, in the translation reserve, and any gain or loss on the ineffective portion of the hedge is recognised in the income statement. On disposal of the foreign operation, the cumulative value of any gains or losses recognised directly in equity is transferred to the income statement.
Cash and cash equivalentsCash and cash equivalents comprise cash balances and call deposits. Bank overdrafts that are repayable on demand and form an integral part of the Group’s cash management are included as a component of cash and cash equivalents for the purpose of the statement of cash flows.
Trade receivables Trade receivables do not carry any interest and are measured at cost less an appropriate allowance for irrecoverable receivables.
Interest-bearing loans and borrowingsAll such loans and borrowings are initially recognised at fair value including transaction costs and are subsequently measured at amortised cost, except where the loan or borrowing is the hedged item in an effective fair value hedge relationship.
Share capitalOrdinary shares are accounted for as equity. Incremental costs directly attributable to the issue of new shares are shown in equity as a deduction from the proceeds received. Own equity instruments that are reacquired are deducted from equity. No gain or loss is recognised in the Group Income Statement on the purchase, sale, issue or cancellation of the Group’s own equity instruments.
Hybrid equityHybrid equity comprises issued bonds that qualify for recognition as equity. Accordingly, any coupon payments are accounted for as dividends and are recognised directly in equity at the time the payment obligation arises. This is because the coupon payments are discretionary and relate to equity. Coupon payments consequently do not have any impact on the income statement. Coupon payments are recognised in the cash flow statement in the same way as dividends to ordinary shareholders. Tax credits in relation to the coupon payments are linked to the past transactions or events that support the coupon payments and consequently the tax credits are reported in the income statement.
Hybrid debtHybrid debt comprises issued bonds that have a fixed redemption date and are accounted within Loans and Borrowings. Coupon payments are recognised within the income statement as a finance cost.
Accompanying information continued
167
3. Financial Statements2.1.
A1. Basis of consolidation and significant accounting policies continuedA1.3 Service concession arrangementsIn 50:50 partnership with Royal Bank Leasing Limited, the Group established three companies to provide street lighting services to councils under the Private Finance Initiative (PFI). These services are thereafter sub-contracted to SSE Contracting Limited, a wholly owned subsidiary of the Group. The companies established are as follows:
Company Council
Tay Valley Lighting (Stoke-on-Trent) Limited Stoke-on-TrentTay Valley Lighting (Newcastle and North Tyneside) Limited Newcastle and North TynesideTay Valley Lighting (Leeds) Limited Leeds City Council
Under IFRS 10, despite being 50% owned, these companies are categorised as subsidiaries and deemed to be controlled by the Group due to the Group being assessed as bearing the majority of the risks and rewards associated with the companies. The debt associated with these companies is non-recourse to the Group. The arrangements for all three companies are materially similar. In March 2017, the Group disposed of its equity stake in all three companies but have retained operating subcontracts with those companies.
Characteristics of the arrangements DescriptionThe contracts are and were 25-year arrangements to replace ageing street-lighting stock and to subsequently maintain the new assets throughout each Council’s areas.
Significant termsThe cash flows under the PFI arrangements come from the unitary charge for these services paid by the Councils. The unitary charge can only be adjusted if performance under the contract falls below the required standards. Any significant change to the services proposed by either party is subject to a formal change procedure and agreement to such a change is required by the other party.
Nature and extent of rights and obligationsThe assets are part of the public highway and ownership of the assets remains with the Councils. The contract holding companies are licensed to replace and maintain the assets for the period of the contract. This obligation was (and is) passed down to SSE Contracting Limited or to other companies within the SSE Contracting group of companies through the operating sub-contract. Any failure to provide the services to the required standards will result in financial penalties which are taken from the unitary charge.
The companies have 25-year contracts with no extension options. Termination during this period can be initiated through a number of routes including service provider default, force majeure or the event of a risk becoming uninsurable, authority default, voluntary authority termination, or termination for a prohibited act or breach of refinancing provisions. In all cases, a formula exists for calculating compensation payments to the service provider.
Throughout the contract period there are a number of circumstances under which the companies could potentially be required to provide additional services:
Changes in the law If circumstances arise where by a change in legislation would mean a change in the way the services are to be provided the companies would be liable for part of the cost of this change. This liability is capped.
Final surveyThe Councils have the ability to deduct a percentage of the unitary charge in the last two years if an independent survey indicates the assets are unlikely to have a 5-year residual life.
A2. TaxationThe Group’s primary tax disclosures are included at Note 10. The following tables represent enhanced disclosures adopted in order to assist stakeholder understanding of the Group’s tax position and policies as part of the Group’s commitment to its Fair Tax Mark accredited status.
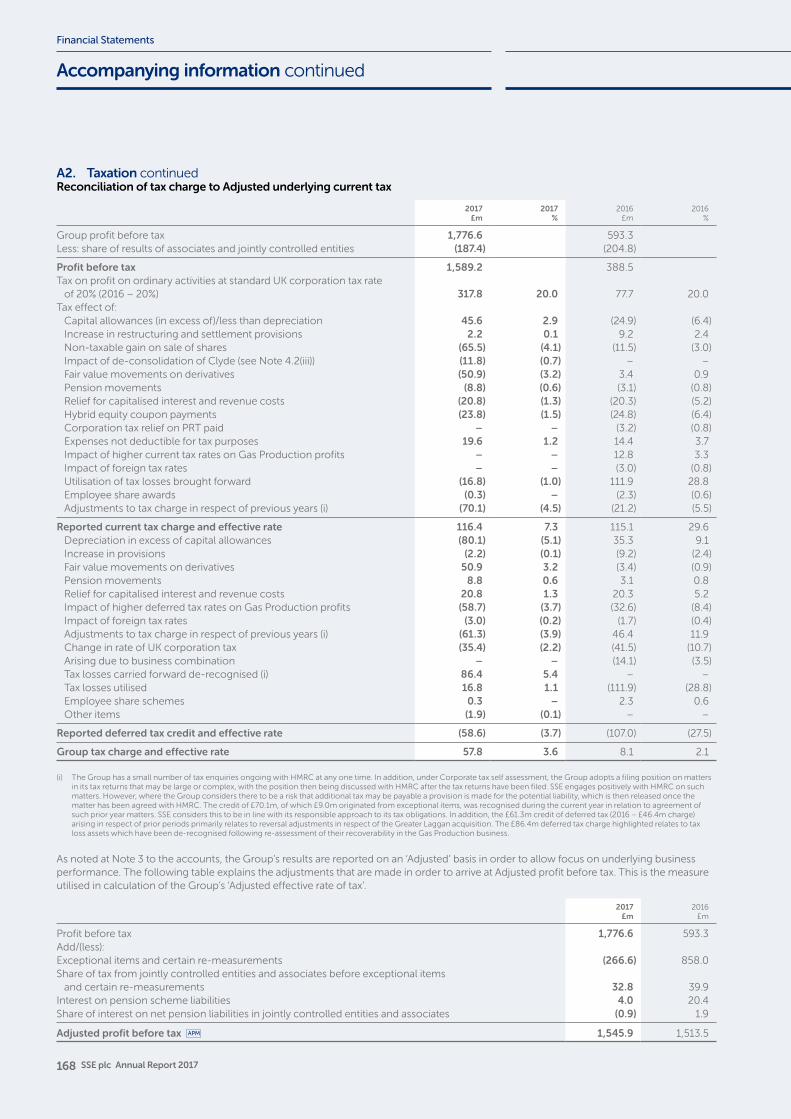
168 SSE plc Annual Report 2017
Financial Statements
A2. Taxation continuedReconciliation of tax charge to Adjusted underlying current tax
2017£m
2017%
2016£m
2016%
Group profit before tax 1,776.6 593.3Less: share of results of associates and jointly controlled entities (187.4) (204.8)
Profit before tax 1,589.2 388.5Tax on profit on ordinary activities at standard UK corporation tax rate
of 20% (2016 – 20%) 317.8 20.0 77.7 20.0Tax effect of:
Capital allowances (in excess of)/less than depreciation 45.6 2.9 (24.9) (6.4)Increase in restructuring and settlement provisions 2.2 0.1 9.2 2.4Non-taxable gain on sale of shares (65.5) (4.1) (11.5) (3.0)Impact of de-consolidation of Clyde (see Note 4.2(iii)) (11.8) (0.7) – –Fair value movements on derivatives (50.9) (3.2) 3.4 0.9Pension movements (8.8) (0.6) (3.1) (0.8)Relief for capitalised interest and revenue costs (20.8) (1.3) (20.3) (5.2)Hybrid equity coupon payments (23.8) (1.5) (24.8) (6.4)Corporation tax relief on PRT paid – – (3.2) (0.8)Expenses not deductible for tax purposes 19.6 1.2 14.4 3.7Impact of higher current tax rates on Gas Production profits – – 12.8 3.3Impact of foreign tax rates – – (3.0) (0.8)Utilisation of tax losses brought forward (16.8) (1.0) 111.9 28.8Employee share awards (0.3) – (2.3) (0.6)Adjustments to tax charge in respect of previous years (i) (70.1) (4.5) (21.2) (5.5)
Reported current tax charge and effective rate 116.4 7.3 115.1 29.6Depreciation in excess of capital allowances (80.1) (5.1) 35.3 9.1Increase in provisions (2.2) (0.1) (9.2) (2.4)Fair value movements on derivatives 50.9 3.2 (3.4) (0.9)Pension movements 8.8 0.6 3.1 0.8Relief for capitalised interest and revenue costs 20.8 1.3 20.3 5.2Impact of higher deferred tax rates on Gas Production profits (58.7) (3.7) (32.6) (8.4)Impact of foreign tax rates (3.0) (0.2) (1.7) (0.4)Adjustments to tax charge in respect of previous years (i) (61.3) (3.9) 46.4 11.9Change in rate of UK corporation tax (35.4) (2.2) (41.5) (10.7)Arising due to business combination – – (14.1) (3.5)Tax losses carried forward de-recognised (i) 86.4 5.4 – –Tax losses utilised 16.8 1.1 (111.9) (28.8)Employee share schemes 0.3 – 2.3 0.6Other items (1.9) (0.1) – –
Reported deferred tax credit and effective rate (58.6) (3.7) (107.0) (27.5)
Group tax charge and effective rate 57.8 3.6 8.1 2.1
(i) The Group has a small number of tax enquiries ongoing with HMRC at any one time. In addition, under Corporate tax self assessment, the Group adopts a filing position on matters in its tax returns that may be large or complex, with the position then being discussed with HMRC after the tax returns have been filed. SSE engages positively with HMRC on such matters. However, where the Group considers there to be a risk that additional tax may be payable a provision is made for the potential liability, which is then released once the matter has been agreed with HMRC. The credit of £70.1m, of which £9.0m originated from exceptional items, was recognised during the current year in relation to agreement of such prior year matters. SSE considers this to be in line with its responsible approach to its tax obligations. In addition, the £61.3m credit of deferred tax (2016 – £46.4m charge) arising in respect of prior periods primarily relates to reversal adjustments in respect of the Greater Laggan acquisition. The £86.4m deferred tax charge highlighted relates to tax loss assets which have been de-recognised following re-assessment of their recoverability in the Gas Production business.
As noted at Note 3 to the accounts, the Group’s results are reported on an ‘Adjusted’ basis in order to allow focus on underlying business performance. The following table explains the adjustments that are made in order to arrive at Adjusted profit before tax. This is the measure utilised in calculation of the Group’s ‘Adjusted effective rate of tax’.
2017£m
2016£m
Profit before tax 1,776.6 593.3Add/(less):Exceptional items and certain re-measurements (266.6) 858.0Share of tax from jointly controlled entities and associates before exceptional items
and certain re-measurements 32.8 39.9Interest on pension scheme liabilities 4.0 20.4Share of interest on net pension liabilities in jointly controlled entities and associates (0.9) 1.9
Adjusted profit before tax 1,545.9 1,513.5
Accompanying information continued
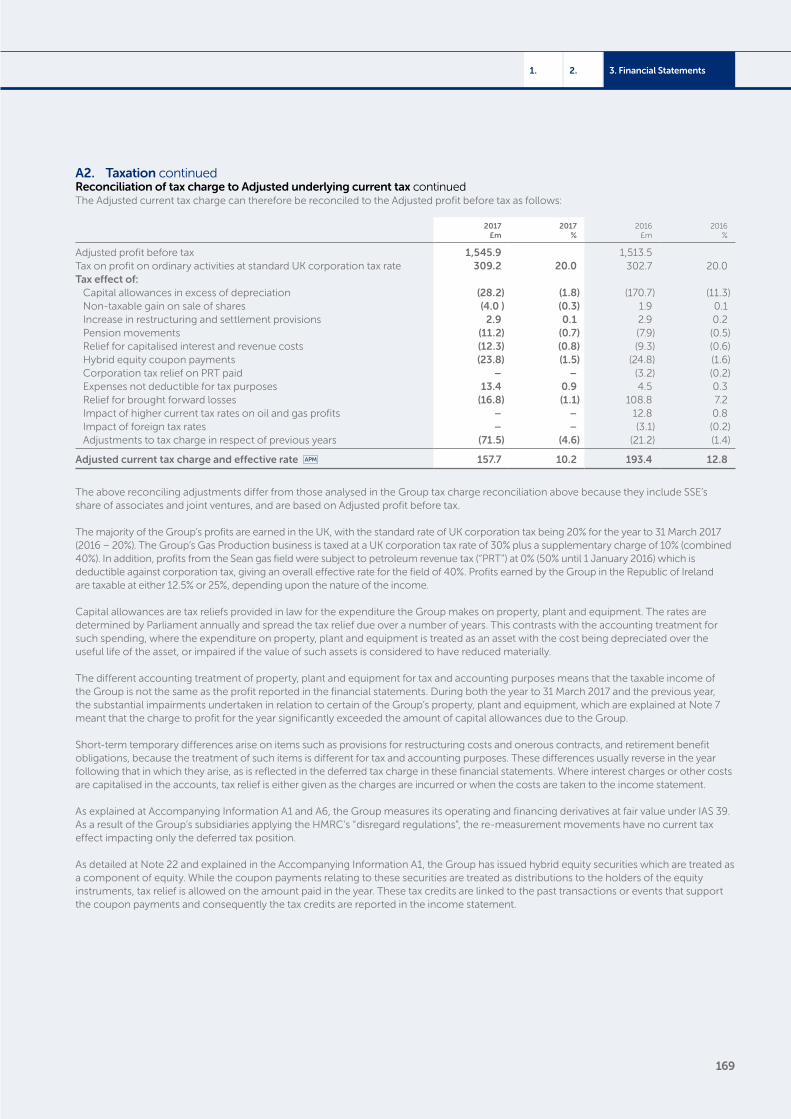
169
3. Financial Statements2.1.
A2. Taxation continuedReconciliation of tax charge to Adjusted underlying current tax continuedThe Adjusted current tax charge can therefore be reconciled to the Adjusted profit before tax as follows:
2017£m
2017%
2016£m
2016%
Adjusted profit before tax 1,545.9 1,513.5Tax on profit on ordinary activities at standard UK corporation tax rate 309.2 20.0 302.7 20.0Tax effect of:
Capital allowances in excess of depreciation (28.2) (1.8) (170.7) (11.3)Non-taxable gain on sale of shares (4.0 ) (0.3) 1.9 0.1Increase in restructuring and settlement provisions 2.9 0.1 2.9 0.2Pension movements (11.2) (0.7) (7.9) (0.5)Relief for capitalised interest and revenue costs (12.3) (0.8) (9.3) (0.6)Hybrid equity coupon payments (23.8) (1.5) (24.8) (1.6)Corporation tax relief on PRT paid – – (3.2) (0.2)Expenses not deductible for tax purposes 13.4 0.9 4.5 0.3Relief for brought forward losses (16.8) (1.1) 108.8 7.2Impact of higher current tax rates on oil and gas profits – – 12.8 0.8Impact of foreign tax rates – – (3.1) (0.2)Adjustments to tax charge in respect of previous years (71.5) (4.6) (21.2) (1.4)
Adjusted current tax charge and effective rate 157.7 10.2 193.4 12.8
The above reconciling adjustments differ from those analysed in the Group tax charge reconciliation above because they include SSE’s share of associates and joint ventures, and are based on Adjusted profit before tax.
The majority of the Group’s profits are earned in the UK, with the standard rate of UK corporation tax being 20% for the year to 31 March 2017 (2016 – 20%). The Group’s Gas Production business is taxed at a UK corporation tax rate of 30% plus a supplementary charge of 10% (combined 40%). In addition, profits from the Sean gas field were subject to petroleum revenue tax (“PRT”) at 0% (50% until 1 January 2016) which is deductible against corporation tax, giving an overall effective rate for the field of 40%. Profits earned by the Group in the Republic of Ireland are taxable at either 12.5% or 25%, depending upon the nature of the income.
Capital allowances are tax reliefs provided in law for the expenditure the Group makes on property, plant and equipment. The rates are determined by Parliament annually and spread the tax relief due over a number of years. This contrasts with the accounting treatment for such spending, where the expenditure on property, plant and equipment is treated as an asset with the cost being depreciated over the useful life of the asset, or impaired if the value of such assets is considered to have reduced materially.
The different accounting treatment of property, plant and equipment for tax and accounting purposes means that the taxable income of the Group is not the same as the profit reported in the financial statements. During both the year to 31 March 2017 and the previous year, the substantial impairments undertaken in relation to certain of the Group’s property, plant and equipment, which are explained at Note 7 meant that the charge to profit for the year significantly exceeded the amount of capital allowances due to the Group.
Short-term temporary differences arise on items such as provisions for restructuring costs and onerous contracts, and retirement benefit obligations, because the treatment of such items is different for tax and accounting purposes. These differences usually reverse in the year following that in which they arise, as is reflected in the deferred tax charge in these financial statements. Where interest charges or other costs are capitalised in the accounts, tax relief is either given as the charges are incurred or when the costs are taken to the income statement.
As explained at Accompanying Information A1 and A6, the Group measures its operating and financing derivatives at fair value under IAS 39. As a result of the Group’s subsidiaries applying the HMRC’s “disregard regulations”, the re-measurement movements have no current tax effect impacting only the deferred tax position.
As detailed at Note 22 and explained in the Accompanying Information A1, the Group has issued hybrid equity securities which are treated as a component of equity. While the coupon payments relating to these securities are treated as distributions to the holders of the equity instruments, tax relief is allowed on the amount paid in the year. These tax credits are linked to the past transactions or events that support the coupon payments and consequently the tax credits are reported in the income statement.
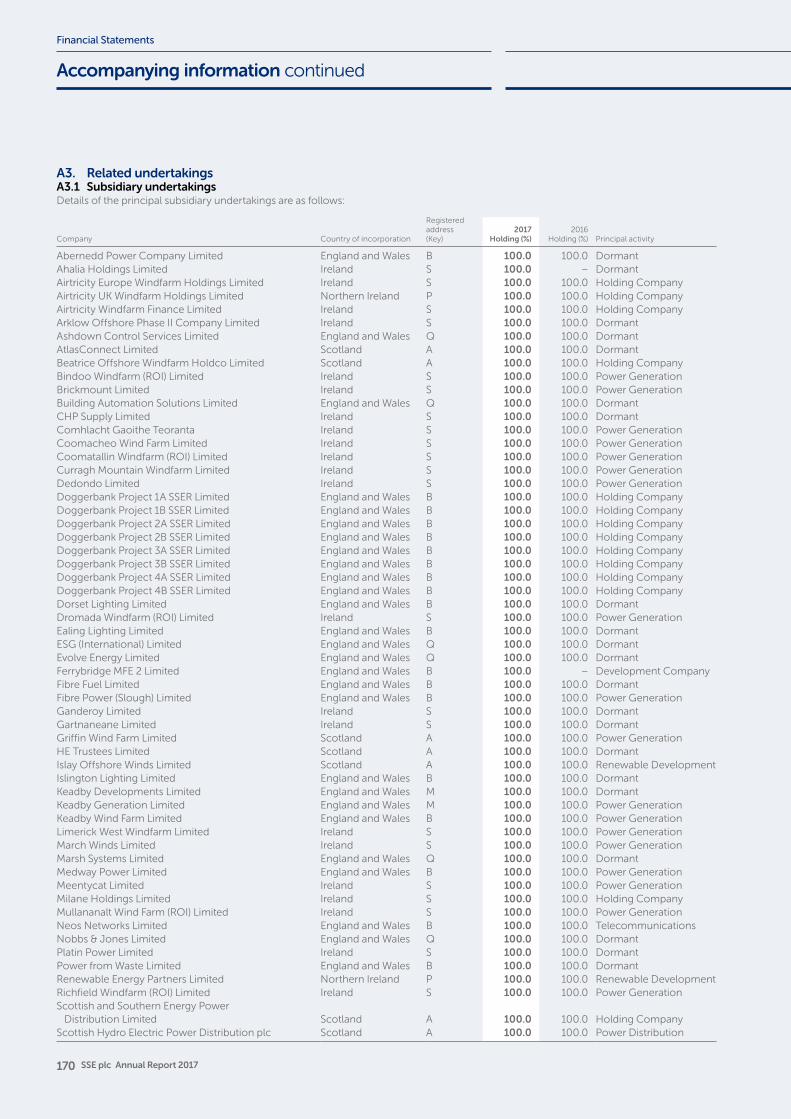
170 SSE plc Annual Report 2017
Financial Statements
A3. Related undertakingsA3.1 Subsidiary undertakingsDetails of the principal subsidiary undertakings are as follows:
Company Country of incorporation
Registeredaddress(Key)
2017Holding (%)
2016Holding (%) Principal activity
Abernedd Power Company Limited England and Wales B 100.0 100.0 DormantAhalia Holdings Limited Ireland S 100.0 – DormantAirtricity Europe Windfarm Holdings Limited Ireland S 100.0 100.0 Holding CompanyAirtricity UK Windfarm Holdings Limited Northern Ireland P 100.0 100.0 Holding CompanyAirtricity Windfarm Finance Limited Ireland S 100.0 100.0 Holding CompanyArklow Offshore Phase II Company Limited Ireland S 100.0 100.0 DormantAshdown Control Services Limited England and Wales Q 100.0 100.0 DormantAtlasConnect Limited Scotland A 100.0 100.0 DormantBeatrice Offshore Windfarm Holdco Limited Scotland A 100.0 100.0 Holding CompanyBindoo Windfarm (ROI) Limited Ireland S 100.0 100.0 Power GenerationBrickmount Limited Ireland S 100.0 100.0 Power GenerationBuilding Automation Solutions Limited England and Wales Q 100.0 100.0 DormantCHP Supply Limited Ireland S 100.0 100.0 DormantComhlacht Gaoithe Teoranta Ireland S 100.0 100.0 Power GenerationCoomacheo Wind Farm Limited Ireland S 100.0 100.0 Power GenerationCoomatallin Windfarm (ROI) Limited Ireland S 100.0 100.0 Power GenerationCurragh Mountain Windfarm Limited Ireland S 100.0 100.0 Power GenerationDedondo Limited Ireland S 100.0 100.0 Power GenerationDoggerbank Project 1A SSER Limited England and Wales B 100.0 100.0 Holding CompanyDoggerbank Project 1B SSER Limited England and Wales B 100.0 100.0 Holding CompanyDoggerbank Project 2A SSER Limited England and Wales B 100.0 100.0 Holding CompanyDoggerbank Project 2B SSER Limited England and Wales B 100.0 100.0 Holding CompanyDoggerbank Project 3A SSER Limited England and Wales B 100.0 100.0 Holding CompanyDoggerbank Project 3B SSER Limited England and Wales B 100.0 100.0 Holding CompanyDoggerbank Project 4A SSER Limited England and Wales B 100.0 100.0 Holding CompanyDoggerbank Project 4B SSER Limited England and Wales B 100.0 100.0 Holding CompanyDorset Lighting Limited England and Wales B 100.0 100.0 DormantDromada Windfarm (ROI) Limited Ireland S 100.0 100.0 Power GenerationEaling Lighting Limited England and Wales B 100.0 100.0 DormantESG (International) Limited England and Wales Q 100.0 100.0 DormantEvolve Energy Limited England and Wales Q 100.0 100.0 DormantFerrybridge MFE 2 Limited England and Wales B 100.0 – Development CompanyFibre Fuel Limited England and Wales B 100.0 100.0 DormantFibre Power (Slough) Limited England and Wales B 100.0 100.0 Power GenerationGanderoy Limited Ireland S 100.0 100.0 DormantGartnaneane Limited Ireland S 100.0 100.0 DormantGriffin Wind Farm Limited Scotland A 100.0 100.0 Power GenerationHE Trustees Limited Scotland A 100.0 100.0 DormantIslay Offshore Winds Limited Scotland A 100.0 100.0 Renewable DevelopmentIslington Lighting Limited England and Wales B 100.0 100.0 DormantKeadby Developments Limited England and Wales M 100.0 100.0 DormantKeadby Generation Limited England and Wales M 100.0 100.0 Power GenerationKeadby Wind Farm Limited England and Wales B 100.0 100.0 Power GenerationLimerick West Windfarm Limited Ireland S 100.0 100.0 Power GenerationMarch Winds Limited Ireland S 100.0 100.0 Power GenerationMarsh Systems Limited England and Wales Q 100.0 100.0 DormantMedway Power Limited England and Wales B 100.0 100.0 Power GenerationMeentycat Limited Ireland S 100.0 100.0 Power GenerationMilane Holdings Limited Ireland S 100.0 100.0 Holding CompanyMullananalt Wind Farm (ROI) Limited Ireland S 100.0 100.0 Power GenerationNeos Networks Limited England and Wales B 100.0 100.0 TelecommunicationsNobbs & Jones Limited England and Wales Q 100.0 100.0 DormantPlatin Power Limited Ireland S 100.0 100.0 DormantPower from Waste Limited England and Wales B 100.0 100.0 DormantRenewable Energy Partners Limited Northern Ireland P 100.0 100.0 Renewable DevelopmentRichfield Windfarm (ROI) Limited Ireland S 100.0 100.0 Power GenerationScottish and Southern Energy Power
Distribution Limited Scotland A 100.0 100.0 Holding CompanyScottish Hydro Electric Power Distribution plc Scotland A 100.0 100.0 Power Distribution
Accompanying information continued
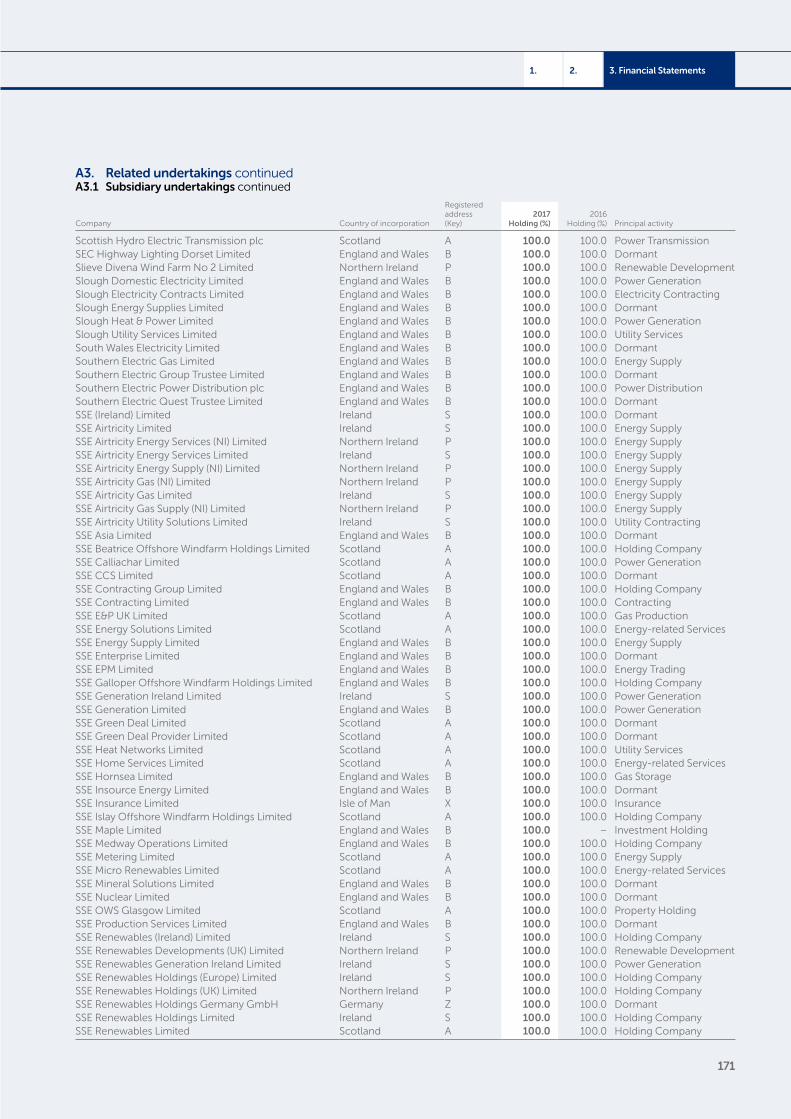
171
3. Financial Statements2.1.
Company Country of incorporation
Registeredaddress(Key)
2017Holding (%)
2016Holding (%) Principal activity
Scottish Hydro Electric Transmission plc Scotland A 100.0 100.0 Power TransmissionSEC Highway Lighting Dorset Limited England and Wales B 100.0 100.0 DormantSlieve Divena Wind Farm No 2 Limited Northern Ireland P 100.0 100.0 Renewable DevelopmentSlough Domestic Electricity Limited England and Wales B 100.0 100.0 Power GenerationSlough Electricity Contracts Limited England and Wales B 100.0 100.0 Electricity ContractingSlough Energy Supplies Limited England and Wales B 100.0 100.0 DormantSlough Heat & Power Limited England and Wales B 100.0 100.0 Power GenerationSlough Utility Services Limited England and Wales B 100.0 100.0 Utility ServicesSouth Wales Electricity Limited England and Wales B 100.0 100.0 DormantSouthern Electric Gas Limited England and Wales B 100.0 100.0 Energy SupplySouthern Electric Group Trustee Limited England and Wales B 100.0 100.0 DormantSouthern Electric Power Distribution plc England and Wales B 100.0 100.0 Power DistributionSouthern Electric Quest Trustee Limited England and Wales B 100.0 100.0 DormantSSE (Ireland) Limited Ireland S 100.0 100.0 DormantSSE Airtricity Limited Ireland S 100.0 100.0 Energy SupplySSE Airtricity Energy Services (NI) Limited Northern Ireland P 100.0 100.0 Energy SupplySSE Airtricity Energy Services Limited Ireland S 100.0 100.0 Energy SupplySSE Airtricity Energy Supply (NI) Limited Northern Ireland P 100.0 100.0 Energy SupplySSE Airtricity Gas (NI) Limited Northern Ireland P 100.0 100.0 Energy SupplySSE Airtricity Gas Limited Ireland S 100.0 100.0 Energy SupplySSE Airtricity Gas Supply (NI) Limited Northern Ireland P 100.0 100.0 Energy SupplySSE Airtricity Utility Solutions Limited Ireland S 100.0 100.0 Utility ContractingSSE Asia Limited England and Wales B 100.0 100.0 DormantSSE Beatrice Offshore Windfarm Holdings Limited Scotland A 100.0 100.0 Holding CompanySSE Calliachar Limited Scotland A 100.0 100.0 Power GenerationSSE CCS Limited Scotland A 100.0 100.0 DormantSSE Contracting Group Limited England and Wales B 100.0 100.0 Holding CompanySSE Contracting Limited England and Wales B 100.0 100.0 ContractingSSE E&P UK Limited Scotland A 100.0 100.0 Gas ProductionSSE Energy Solutions Limited Scotland A 100.0 100.0 Energy-related ServicesSSE Energy Supply Limited England and Wales B 100.0 100.0 Energy SupplySSE Enterprise Limited England and Wales B 100.0 100.0 DormantSSE EPM Limited England and Wales B 100.0 100.0 Energy TradingSSE Galloper Offshore Windfarm Holdings Limited England and Wales B 100.0 100.0 Holding CompanySSE Generation Ireland Limited Ireland S 100.0 100.0 Power GenerationSSE Generation Limited England and Wales B 100.0 100.0 Power GenerationSSE Green Deal Limited Scotland A 100.0 100.0 DormantSSE Green Deal Provider Limited Scotland A 100.0 100.0 DormantSSE Heat Networks Limited Scotland A 100.0 100.0 Utility ServicesSSE Home Services Limited Scotland A 100.0 100.0 Energy-related ServicesSSE Hornsea Limited England and Wales B 100.0 100.0 Gas StorageSSE Insource Energy Limited England and Wales B 100.0 100.0 DormantSSE Insurance Limited Isle of Man X 100.0 100.0 InsuranceSSE Islay Offshore Windfarm Holdings Limited Scotland A 100.0 100.0 Holding CompanySSE Maple Limited England and Wales B 100.0 – Investment HoldingSSE Medway Operations Limited England and Wales B 100.0 100.0 Holding CompanySSE Metering Limited Scotland A 100.0 100.0 Energy SupplySSE Micro Renewables Limited Scotland A 100.0 100.0 Energy-related ServicesSSE Mineral Solutions Limited England and Wales B 100.0 100.0 DormantSSE Nuclear Limited England and Wales B 100.0 100.0 DormantSSE OWS Glasgow Limited Scotland A 100.0 100.0 Property HoldingSSE Production Services Limited England and Wales B 100.0 100.0 DormantSSE Renewables (Ireland) Limited Ireland S 100.0 100.0 Holding CompanySSE Renewables Developments (UK) Limited Northern Ireland P 100.0 100.0 Renewable DevelopmentSSE Renewables Generation Ireland Limited Ireland S 100.0 100.0 Power GenerationSSE Renewables Holdings (Europe) Limited Ireland S 100.0 100.0 Holding CompanySSE Renewables Holdings (UK) Limited Northern Ireland P 100.0 100.0 Holding CompanySSE Renewables Holdings Germany GmbH Germany Z 100.0 100.0 DormantSSE Renewables Holdings Limited Ireland S 100.0 100.0 Holding CompanySSE Renewables Limited Scotland A 100.0 100.0 Holding Company
A3. Related undertakings continuedA3.1 Subsidiary undertakings continued
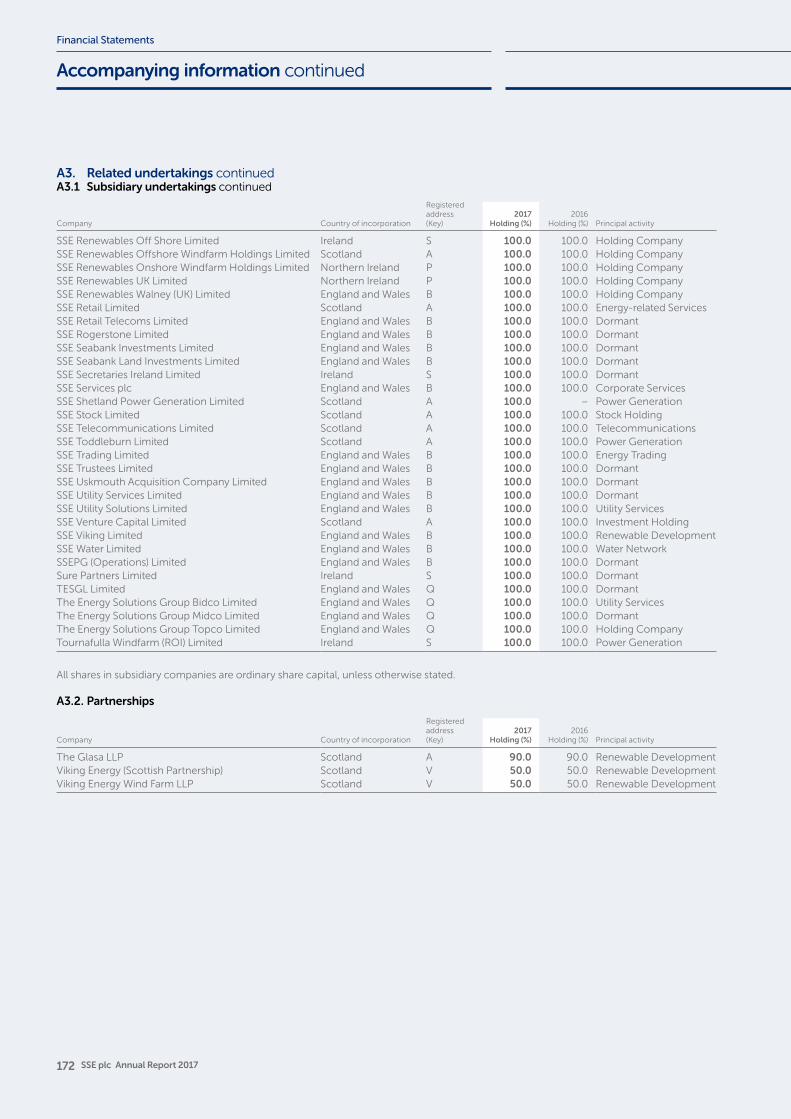
172 SSE plc Annual Report 2017
Financial Statements
Company Country of incorporation
Registeredaddress(Key)
2017Holding (%)
2016Holding (%) Principal activity
SSE Renewables Off Shore Limited Ireland S 100.0 100.0 Holding CompanySSE Renewables Offshore Windfarm Holdings Limited Scotland A 100.0 100.0 Holding CompanySSE Renewables Onshore Windfarm Holdings Limited Northern Ireland P 100.0 100.0 Holding CompanySSE Renewables UK Limited Northern Ireland P 100.0 100.0 Holding CompanySSE Renewables Walney (UK) Limited England and Wales B 100.0 100.0 Holding CompanySSE Retail Limited Scotland A 100.0 100.0 Energy-related ServicesSSE Retail Telecoms Limited England and Wales B 100.0 100.0 DormantSSE Rogerstone Limited England and Wales B 100.0 100.0 DormantSSE Seabank Investments Limited England and Wales B 100.0 100.0 DormantSSE Seabank Land Investments Limited England and Wales B 100.0 100.0 DormantSSE Secretaries Ireland Limited Ireland S 100.0 100.0 DormantSSE Services plc England and Wales B 100.0 100.0 Corporate ServicesSSE Shetland Power Generation Limited Scotland A 100.0 – Power GenerationSSE Stock Limited Scotland A 100.0 100.0 Stock HoldingSSE Telecommunications Limited Scotland A 100.0 100.0 TelecommunicationsSSE Toddleburn Limited Scotland A 100.0 100.0 Power GenerationSSE Trading Limited England and Wales B 100.0 100.0 Energy TradingSSE Trustees Limited England and Wales B 100.0 100.0 DormantSSE Uskmouth Acquisition Company Limited England and Wales B 100.0 100.0 DormantSSE Utility Services Limited England and Wales B 100.0 100.0 DormantSSE Utility Solutions Limited England and Wales B 100.0 100.0 Utility ServicesSSE Venture Capital Limited Scotland A 100.0 100.0 Investment HoldingSSE Viking Limited England and Wales B 100.0 100.0 Renewable DevelopmentSSE Water Limited England and Wales B 100.0 100.0 Water NetworkSSEPG (Operations) Limited England and Wales B 100.0 100.0 DormantSure Partners Limited Ireland S 100.0 100.0 DormantTESGL Limited England and Wales Q 100.0 100.0 DormantThe Energy Solutions Group Bidco Limited England and Wales Q 100.0 100.0 Utility ServicesThe Energy Solutions Group Midco Limited England and Wales Q 100.0 100.0 DormantThe Energy Solutions Group Topco Limited England and Wales Q 100.0 100.0 Holding CompanyTournafulla Windfarm (ROI) Limited Ireland S 100.0 100.0 Power Generation
All shares in subsidiary companies are ordinary share capital, unless otherwise stated.
A3.2. Partnerships
Company Country of incorporation
Registeredaddress(Key)
2017Holding (%)
2016Holding (%) Principal activity
The Glasa LLP Scotland A 90.0 90.0 Renewable DevelopmentViking Energy (Scottish Partnership) Scotland V 50.0 50.0 Renewable DevelopmentViking Energy Wind Farm LLP Scotland V 50.0 50.0 Renewable Development
A3. Related undertakings continuedA3.1 Subsidiary undertakings continued
Accompanying information continued
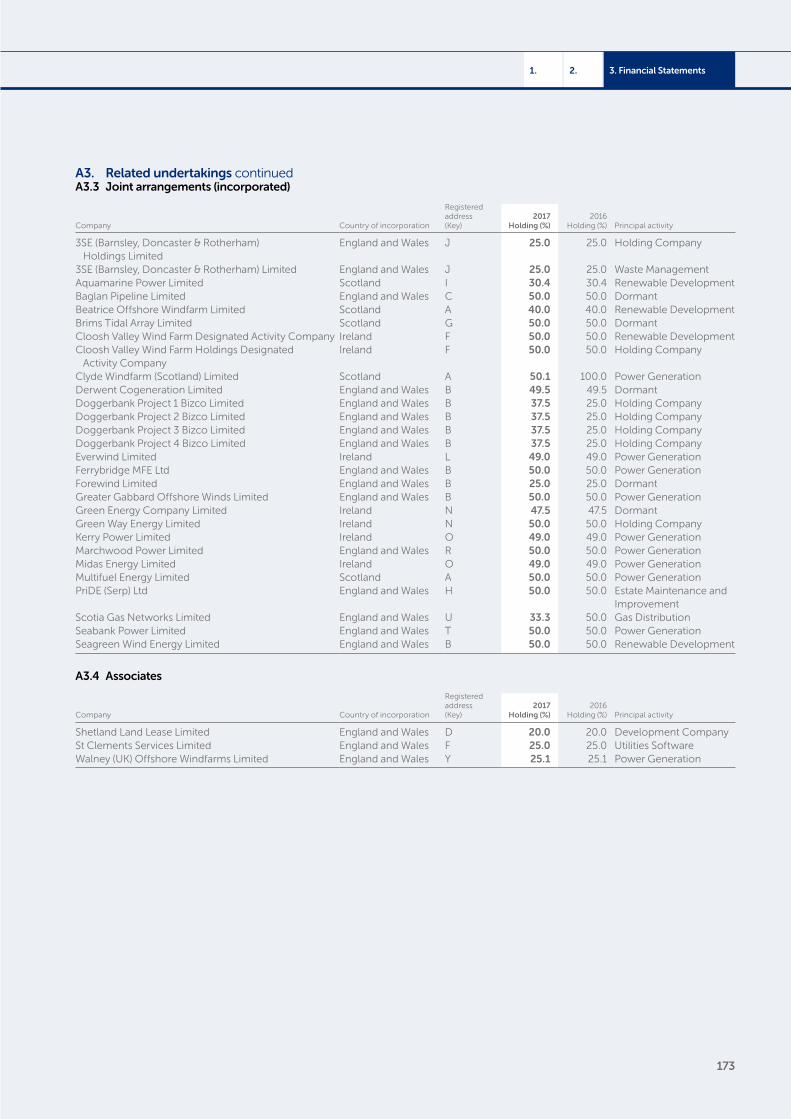
173
3. Financial Statements2.1.
A3. Related undertakings continuedA3.3 Joint arrangements (incorporated)
Company Country of incorporation
Registeredaddress(Key)
2017Holding (%)
2016Holding (%) Principal activity
3SE (Barnsley, Doncaster & Rotherham) Holdings Limited
England and Wales J 25.0 25.0 Holding Company
3SE (Barnsley, Doncaster & Rotherham) Limited England and Wales J 25.0 25.0 Waste ManagementAquamarine Power Limited Scotland I 30.4 30.4 Renewable DevelopmentBaglan Pipeline Limited England and Wales C 50.0 50.0 DormantBeatrice Offshore Windfarm Limited Scotland A 40.0 40.0 Renewable DevelopmentBrims Tidal Array Limited Scotland G 50.0 50.0 DormantCloosh Valley Wind Farm Designated Activity Company Ireland F 50.0 50.0 Renewable DevelopmentCloosh Valley Wind Farm Holdings Designated
Activity CompanyIreland F 50.0 50.0 Holding Company
Clyde Windfarm (Scotland) Limited Scotland A 50.1 100.0 Power GenerationDerwent Cogeneration Limited England and Wales B 49.5 49.5 DormantDoggerbank Project 1 Bizco Limited England and Wales B 37.5 25.0 Holding CompanyDoggerbank Project 2 Bizco Limited England and Wales B 37.5 25.0 Holding CompanyDoggerbank Project 3 Bizco Limited England and Wales B 37.5 25.0 Holding CompanyDoggerbank Project 4 Bizco Limited England and Wales B 37.5 25.0 Holding CompanyEverwind Limited Ireland L 49.0 49.0 Power GenerationFerrybridge MFE Ltd England and Wales B 50.0 50.0 Power GenerationForewind Limited England and Wales B 25.0 25.0 DormantGreater Gabbard Offshore Winds Limited England and Wales B 50.0 50.0 Power GenerationGreen Energy Company Limited Ireland N 47.5 47.5 DormantGreen Way Energy Limited Ireland N 50.0 50.0 Holding CompanyKerry Power Limited Ireland O 49.0 49.0 Power GenerationMarchwood Power Limited England and Wales R 50.0 50.0 Power GenerationMidas Energy Limited Ireland O 49.0 49.0 Power GenerationMultifuel Energy Limited Scotland A 50.0 50.0 Power GenerationPriDE (Serp) Ltd England and Wales H 50.0 50.0 Estate Maintenance and
ImprovementScotia Gas Networks Limited England and Wales U 33.3 50.0 Gas DistributionSeabank Power Limited England and Wales T 50.0 50.0 Power GenerationSeagreen Wind Energy Limited England and Wales B 50.0 50.0 Renewable Development
A3.4 Associates
Company Country of incorporation
Registeredaddress(Key)
2017Holding (%)
2016Holding (%) Principal activity
Shetland Land Lease Limited England and Wales D 20.0 20.0 Development CompanySt Clements Services Limited England and Wales F 25.0 25.0 Utilities SoftwareWalney (UK) Offshore Windfarms Limited England and Wales Y 25.1 25.1 Power Generation
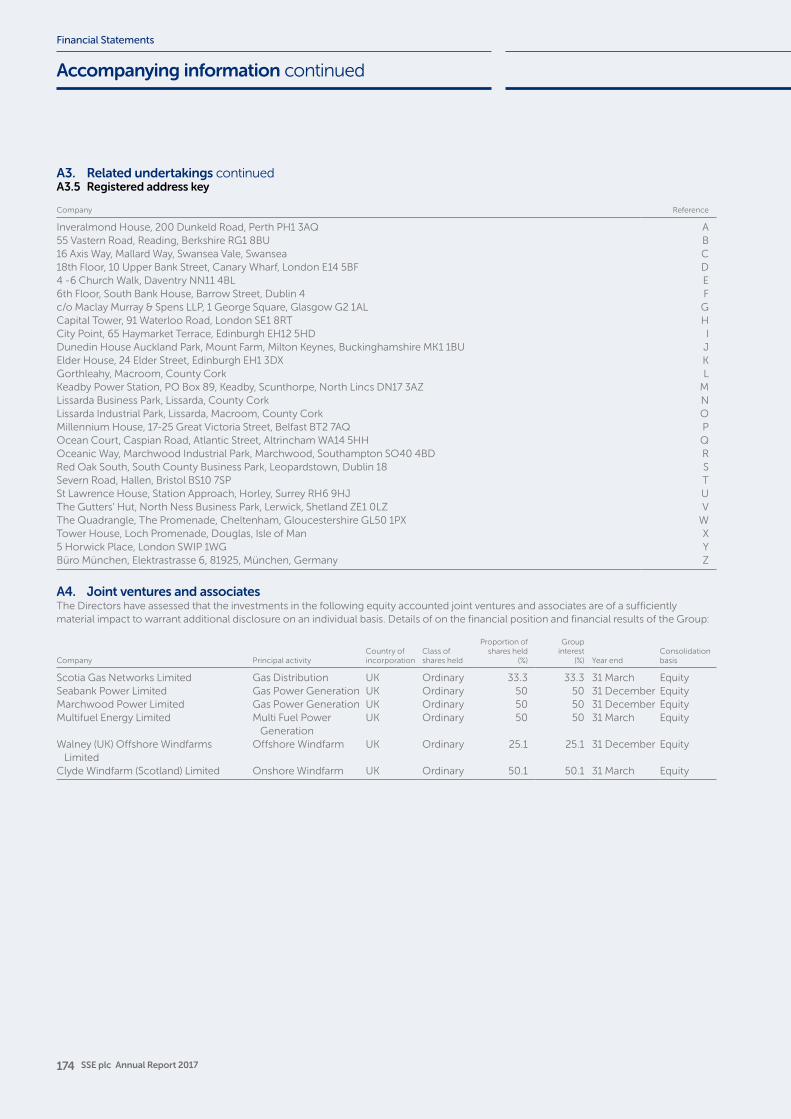
174 SSE plc Annual Report 2017
Financial Statements
A3. Related undertakings continuedA3.5 Registered address key
Company Reference
Inveralmond House, 200 Dunkeld Road, Perth PH1 3AQ A55 Vastern Road, Reading, Berkshire RG1 8BU B16 Axis Way, Mallard Way, Swansea Vale, Swansea C18th Floor, 10 Upper Bank Street, Canary Wharf, London E14 5BF D4 -6 Church Walk, Daventry NN11 4BL E6th Floor, South Bank House, Barrow Street, Dublin 4 Fc/o Maclay Murray & Spens LLP, 1 George Square, Glasgow G2 1AL GCapital Tower, 91 Waterloo Road, London SE1 8RT HCity Point, 65 Haymarket Terrace, Edinburgh EH12 5HD IDunedin House Auckland Park, Mount Farm, Milton Keynes, Buckinghamshire MK1 1BU JElder House, 24 Elder Street, Edinburgh EH1 3DX KGorthleahy, Macroom, County Cork LKeadby Power Station, PO Box 89, Keadby, Scunthorpe, North Lincs DN17 3AZ MLissarda Business Park, Lissarda, County Cork NLissarda Industrial Park, Lissarda, Macroom, County Cork OMillennium House, 17-25 Great Victoria Street, Belfast BT2 7AQ POcean Court, Caspian Road, Atlantic Street, Altrincham WA14 5HH QOceanic Way, Marchwood Industrial Park, Marchwood, Southampton SO40 4BD RRed Oak South, South County Business Park, Leopardstown, Dublin 18 SSevern Road, Hallen, Bristol BS10 7SP TSt Lawrence House, Station Approach, Horley, Surrey RH6 9HJ UThe Gutters’ Hut, North Ness Business Park, Lerwick, Shetland ZE1 0LZ VThe Quadrangle, The Promenade, Cheltenham, Gloucestershire GL50 1PX WTower House, Loch Promenade, Douglas, Isle of Man X5 Horwick Place, London SWIP 1WG YBüro München, Elektrastrasse 6, 81925, München, Germany Z
A4. Joint ventures and associatesThe Directors have assessed that the investments in the following equity accounted joint ventures and associates are of a sufficiently material impact to warrant additional disclosure on an individual basis. Details of on the financial position and financial results of the Group:
Company Principal activityCountry ofincorporation
Class ofshares held
Proportion of shares held
(%)
Group interest
(%) Year endConsolidationbasis
Scotia Gas Networks Limited Gas Distribution UK Ordinary 33.3 33.3 31 March EquitySeabank Power Limited Gas Power Generation UK Ordinary 50 50 31 December EquityMarchwood Power Limited Gas Power Generation UK Ordinary 50 50 31 December EquityMultifuel Energy Limited Multi Fuel Power
GenerationUK Ordinary 50 50 31 March Equity
Walney (UK) Offshore Windfarms Limited
Offshore Windfarm UK Ordinary 25.1 25.1 31 December Equity
Clyde Windfarm (Scotland) Limited Onshore Windfarm UK Ordinary 50.1 50.1 31 March Equity
Accompanying information continued
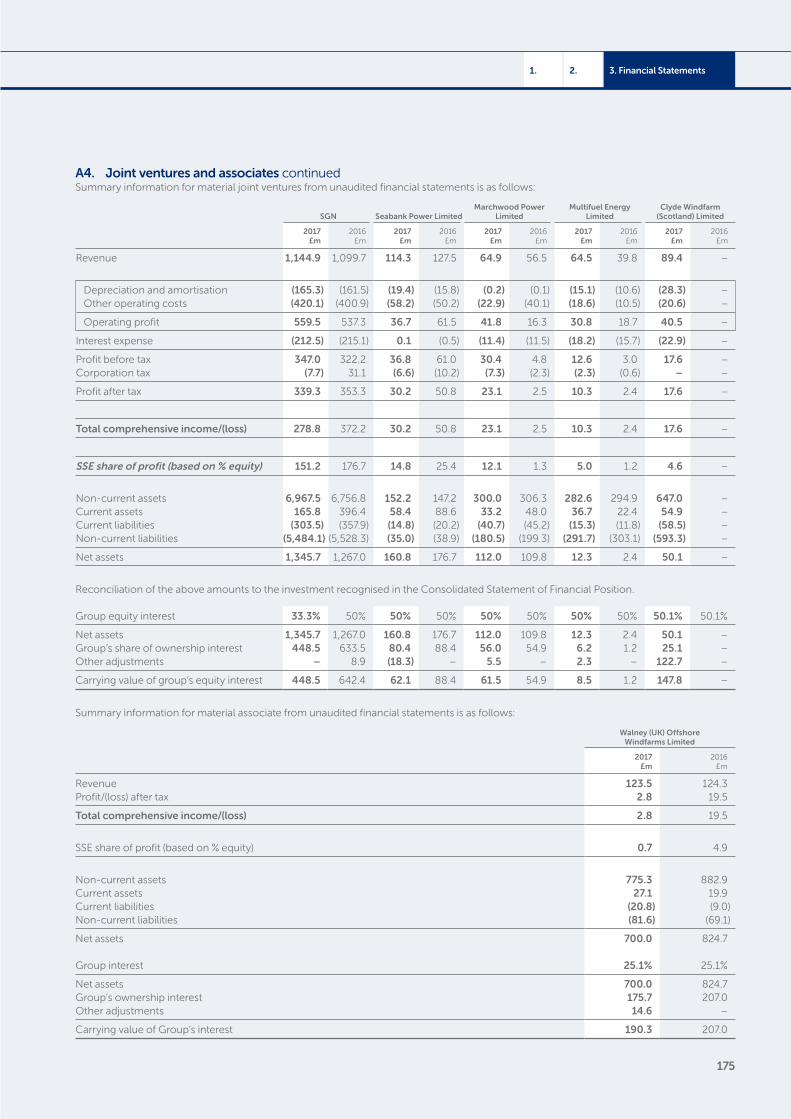
175
3. Financial Statements2.1.
A4. Joint ventures and associates continuedSummary information for material joint ventures from unaudited financial statements is as follows:
SGN Seabank Power LimitedMarchwood Power
LimitedMultifuel Energy
LimitedClyde Windfarm
(Scotland) Limited
2017£m
2016£m
2017£m
2016£m
2017£m
2016£m
2017£m
2016£m
2017£m
2016£m
Revenue 1,144.9 1,099.7 114.3 127.5 64.9 56.5 64.5 39.8 89.4 –
Depreciation and amortisation (165.3) (161.5) (19.4) (15.8) (0.2) (0.1) (15.1) (10.6) (28.3) –Other operating costs (420.1) (400.9) (58.2) (50.2) (22.9) (40.1) (18.6) (10.5) (20.6) –
Operating profit 559.5 537.3 36.7 61.5 41.8 16.3 30.8 18.7 40.5 –
Interest expense (212.5) (215.1) 0.1 (0.5) (11.4) (11.5) (18.2) (15.7) (22.9) –
Profit before tax 347.0 322.2 36.8 61.0 30.4 4.8 12.6 3.0 17.6 –Corporation tax (7.7) 31.1 (6.6) (10.2) (7.3) (2.3) (2.3) (0.6) – –
Profit after tax 339.3 353.3 30.2 50.8 23.1 2.5 10.3 2.4 17.6 –
Total comprehensive income/(loss) 278.8 372.2 30.2 50.8 23.1 2.5 10.3 2.4 17.6 –
SSE share of profit (based on % equity) 151.2 176.7 14.8 25.4 12.1 1.3 5.0 1.2 4.6 –
Non-current assets 6,967.5 6,756.8 152.2 147.2 300.0 306.3 282.6 294.9 647.0 –Current assets 165.8 396.4 58.4 88.6 33.2 48.0 36.7 22.4 54.9 –Current liabilities (303.5) (357.9) (14.8) (20.2) (40.7) (45.2) (15.3) (11.8) (58.5) –Non-current liabilities (5,484.1) (5,528.3) (35.0) (38.9) (180.5) (199.3) (291.7) (303.1) (593.3) –
Net assets 1,345.7 1,267.0 160.8 176.7 112.0 109.8 12.3 2.4 50.1 –
Reconciliation of the above amounts to the investment recognised in the Consolidated Statement of Financial Position.
Group equity interest 33.3% 50% 50% 50% 50% 50% 50% 50% 50.1% 50.1%
Net assets 1,345.7 1,267.0 160.8 176.7 112.0 109.8 12.3 2.4 50.1 –Group’s share of ownership interest 448.5 633.5 80.4 88.4 56.0 54.9 6.2 1.2 25.1 –Other adjustments – 8.9 (18.3) – 5.5 – 2.3 – 122.7 –
Carrying value of group’s equity interest 448.5 642.4 62.1 88.4 61.5 54.9 8.5 1.2 147.8 –
Summary information for material associate from unaudited financial statements is as follows:
Walney (UK) Offshore Windfarms Limited
2017£m
2016£m
Revenue 123.5 124.3Profit/(loss) after tax 2.8 19.5
Total comprehensive income/(loss) 2.8 19.5
SSE share of profit (based on % equity) 0.7 4.9
Non-current assets 775.3 882.9Current assets 27.1 19.9Current liabilities (20.8) (9.0)Non-current liabilities (81.6) (69.1)
Net assets 700.0 824.7
Group interest 25.1% 25.1%
Net assets 700.0 824.7Group’s ownership interest 175.7 207.0Other adjustments 14.6 –
Carrying value of Group’s interest 190.3 207.0
176 SSE plc Annual Report 2017
Financial Statements
A4. Joint ventures and associates continuedIn addition, at 31 March 2017, the Group was owed the following loans from its principal joint ventures: Scotia Gas Networks Limited £177.8m (2016 – £266.9m), Multifuel Energy Limited £144.0m (2016 – £151.9m), Marchwood Power Limited £90.3m (2016 – £100.0m), Seabank Power Limited £nil (2016 – £0.9m) and Clyde Windfarm (Scotland) Ltd £343.2m (2016 – £nil). This represents 96% (2016 – 88%) of the loans provided to equity-accounted joint ventures and associates.
A5. Related party transactionsThe immediate parent and ultimate controlling party of the Group is SSE plc (incorporated in Scotland). Balances and transactions between the Company and its subsidiaries, which are related parties of the Company, have been eliminated on consolidation and are not disclosed in this note. Details of transactions between the Group and other related parties are disclosed below.
Trading transactionsThe following transactions took place during the year between the Group and entities which are related to the Group but which are not members of the Group. Related parties are defined as those in which the Group has control, joint control or significant influence over.
2017 2016
Joint ventures
Sale of goods and
services£m
Purchase of goods and
services£m
Amounts owedfrom
£m
Amounts owed
to£m
Sale ofgoods and
services£m
Purchase of goods and
services£m
Amounts owedfrom
£m
Amounts owed
to£m
Seabank Power Ltd 11.0 (134.0) 0.1 17.0 13.7 (125.8) – 18.2Marchwood Power Ltd 16.8 (144.5) 0.5 12.6 12.7 (108.7) 0.1 15.5Scotia Gas Networks Ltd 45.5 (158.0) 0.9 0.9 46.3 (155.8) 15.9 0.9Clyde Windfarm (Scotland) Ltd 5.7 (0.1) – 11.1 – – – –Other Joint Ventures 10.4 – 2.3 – 8.1 (1.2) 8.4 –Associates 1.4 (53.4) 3.6 3.9 0.5 (59.7) 2.4 3.9
The transactions with Seabank Power Limited and Marchwood Power Limited relate to the contracts for the provision of energy or the tolling of energy under power purchase arrangements. Scotia Gas Networks Limited has operated the gas distribution networks in Scotland and the South of England from 1 June 2005. The Group’s gas supply activity incurs gas distribution charges while the Group also provides services to Scotia Gas Networks in the form of a management service agreement for corporate services, stock procurement services and the provision of the capital expenditure on the development of front office management information systems.
The amounts outstanding are trading balances, are unsecured and will be settled in cash. No guarantees have been given or received. No provisions have been made for doubtful debts in respect of the amounts owed by related parties. Aggregate capital loans to joint ventures and associates are shown in Note 16.
A6. Financial risk managementThis note presents information about the fair value of the Group’s financial instruments, the Group’s exposure to the risks associated with those instruments, the Group’s objectives, policies and processes for measuring and managing risk, and the Group’s management of capital. Further qualitative disclosures are included throughout these consolidated financial statements.
The Group has exposure to the following risks from its use of financial instruments: – Credit risk – Liquidity risk – Commodity risk – Currency risk – Interest rate risk
The Board has overall responsibility for the establishment and oversight of the Group’s risk management framework. The Risk Committee in the Wholesale and Retail divisions, both of which report directly to the Executive Committee to support the Group’s risk management responsibilities by reviewing the strategic, market, credit operational and liquidity risks and exposures that arise from the Group’s energy portfolio management, generation, energy supply and treasury operations. The Risk Committees of Wholesale and Retail are designed to ensure strict business separation requirements are maintained.
The Group’s policies for risk management are established to identify the risks faced by the Group, to set appropriate risk limits and controls, and to monitor risks and adherence to limits. These policies, and the systems used to monitor activities, are reviewed regularly by the Risk Committees in Wholesale and Retail.
Accompanying information continued
177
3. Financial Statements2.1.
A6. Financial risk management continuedExposure to the commodity, currency and interest rate risks noted arise in the normal course of the Group’s business and derivative financial instruments are entered into to hedge exposure to these risks. The objectives and policies for holding or issuing financial instruments and similar contracts, and the strategies for achieving those objectives that have been followed during the year are explained below.
A6.1 Credit riskCredit risk is the risk of financial loss to the Group if a customer or counterparty fails to meet its contractual obligations.
Credit risk arising from the Group’s normal commercial operations is controlled by individual business units operating in accordance with Group policies and procedures. Generally, for significant contracts, individual business units enter into contracts or agreements with counterparties having investment grade credit ratings only, or where suitable collateral or other security has been provided. Counterparty credit validation is undertaken prior to contractual commitment.
Credit risk management for the Group’s Networks businesses is performed in accordance with industry standards as set out by the Regulator and is financially controlled by the individual business units. The Group’s greatest credit risks lie with the operations of the Energy Supply business, the Wholesale procurement activities conducted by Energy Portfolio Management (‘EPM’) under a trust arrangement and the activities carried out by the Group’s Treasury function. In all cases, specific credit risk controls that match the risk profile of those activities are applied. Exposure to credit risk in the retail supply of electricity and gas to end user customers arises from the potential of a customer defaulting on their invoiced payables. The financial strength and creditworthiness of business customers is assessed prior to commencing, and for the duration of, their contract of supply. Domestic customers’ creditworthiness is reviewed from a variety of internal and external information.
Exposure to credit risk in the procurement of wholesale energy and fuel is managed by reference to agreed transaction credit limits which are determined by whether the counterparty:
– holds an investment grade credit rating; or – can be assessed as adequately creditworthy in accordance with internal credit rules using information from other external credit
agencies; or – can provide a guarantee from an investment grade rated entity or post suitable collateral or provide other acceptable assurances
in accordance with group procedures where they have failed to meet the above conditions; or – can be allocated a non-standard credit limit approved by the relevant Risk Committee within its authorised limits as delegated by
the Group Board.
Credit support clauses or side agreements are typically included or entered into to protect the Group against counterparty failure or non-delivery. As part of its normal activities, EPM transacts significant volumes of commodity derivative products through cleared exchanges to mitigate credit risk. Such exchanges are subject to strict regulation by the UK Financial Conduct Authority (FCA) and participants in these exchanges are obliged to meet rigorous capital adequacy requirements.
Individual counterparty credit exposures are monitored by category of credit risk and are subject to approved limits. At 31 March 2017, EPM had pledged £178.0m (2016 – £211.4m) of cash collateral and letters of credit and had received £66.0m (2016 – £44.5m) of cash collateral and letters of credit principally to reduce exposures on credit risk.
Bank credit exposures, which are monitored and reported on daily, are calculated on a mark-to-market basis and adjusted for future volatility and probability of default. Any issues relating to these credit exposures are presented for discussion and review by the Tax and Treasury Committee.
Cash and cash equivalents comprise cash in hand and deposits which are readily convertible to cash. These are subject to insignificant risk of change in value or credit risk.
Derivative financial instruments are entered into to cover the Group’s market risks – commodity risk, interest rate risk, currency risk – and are consequently covered elsewhere in this note.
Trade receivables represent the most significant exposure to credit risk and are stated after an allowance for impairment.
178 SSE plc Annual Report 2017
Financial Statements
A6. Financial risk management continuedA6.2 Concentrations of riskTrade receivables recorded by reported segment held at the 31 March were:
2017£m
2016£m
NetworksElectricity Distribution 59.5 72.2Electricity Transmission 27.2 0.9
86.7 73.1RetailEnergy Supply 524.8 524.2Enterprise 129.6 53.9Energy-related Services 19.2 11.4
673.6 589.5WholesaleEnergy Portfolio Management and Electricity Generation 1,817.6 1,291.5Gas Storage 1.0 1.1Gas Production 0.3 1.4
1,818.9 1,294.0
Corporate Unallocated 19.4 10.2
Total 2,598.6 1,966.8
The Retail segment accounts for 25.9% (2016 – 30.0%) of the Group’s trade receivables. Trade receivables associated with the Group’s 8.0 million electricity and gas customers are recorded in this segment. The Group also has significant receivables associated with its Wholesale activities which are generally settled within two to four weeks from invoicing. The Group’s exposure to credit risk is therefore subject to diversification with no exposure to individual retail customers totalling >10% of trade receivables. The biggest customer balance, due from a wholesale customer (also a wholesale supplier), is 9% (2016 – 8%) of the total trade receivables.
The ageing of trade receivables at the reporting date was:
2017£m
2016£m
Not past due 2,374.6 1,690.2Past due but not individually impaired:0-30 days 133.8 156.331-90 days 49.4 59.2Over 90 days 160.8 208.6
2,718.6 2,114.3Less: allowance for impairment (120.0) (147.5)
Net Trade receivables 2,598.6 1,966.8
The Group has past due debt which has not had an impairment allowance set aside to cover potential credit losses. The Group has certain procedures to pursue customers in significant arrears and believes its impairment policy in relation to such balances is appropriate. Those debts which are neither past due nor impaired are considered to be good and are expected to be recoverable.
The Group has other receivables which are financial assets totalling £16.6m (2016 – £23.7m).
The movement in the allowance for impairment of trade receivables was:
2017£m
2016£m
Balance at 1 April 147.5 154.3Increase in allowance for impairment 21.7 54.3Impairment losses recognised (49.2) (61.1)
Balance at 31 March 120.0 147.5
At the end of each reporting period a review of the provision for bad and doubtful debts is performed. It is an assessment of the potential amount of trade receivables which will not be paid by customers after the balance sheet date. This amount is calculated by reference to the age, status and risk of each class of receivable.
Accompanying information continued

179
3. Financial Statements2.1.
A6. Financial risk management continuedA6.3 Liquidity risk and going concernLiquidity risk, the risk that the Group will have insufficient funds to meet its liabilities, is managed by the Group’s Treasury function. The Group can be exposed to significant movements in its liquidity position due to changes in commodity prices, working capital requirements, the impact of the seasonal nature of the business and phasing of its capital investment and recycling programmes.
Treasury is responsible for managing the banking and liquidity requirements of the Group, risk management relating to interest rate and foreign exchange exposures, and for managing the credit risk relating to the banking counterparties with which it transacts. Short-term liquidity is reviewed daily by Treasury, while the longer term liquidity position is reviewed on a regular basis by the Board. The department’s operations are governed by policies determined by the Board and any breaches of these policies are reported to the Risk and Trading Committee and Audit Committee.
In relation to the Group’s liquidity risk, the Group’s policy is to ensure, as far as possible, that it will always have sufficient liquidity to meet its liabilities when due, under both normal and stressed conditions, without incurring unacceptable losses or risking damage to the Group’s reputation.
During the year, the Group’s approach to managing liquidity was to seek to ensure that the Group had available committed borrowings and facilities equal to at least 105% of forecast borrowings over a rolling 6 month period.
The Group uses cash flow forecasts to monitor its ongoing borrowing requirements. Typically, the Group will fund any short-term borrowing positions by issuing commercial paper or borrowing from uncommitted bank lines and will invest in money market funds when it has a cash surplus. Details of the group’s borrowings are disclosed at Note 21. In addition to the borrowing facilities listed at Note 21.2, the Group has £150m of uncommitted bank lines and a £15m overdraft facility.
The refinancing requirement in the 17/18 financial year is the intended redemption of £1.03bn of NC5 hybrids issued in 2012, the Group has already successfully issued a dual tranche hybrid debt in March 2017 in order to cover this refinancing. This dual tranche issue comprises £300m with a coupon of 3.625% and $900m with a coupon of 4.75%. The $900m tranche has been swapped back to both Euros and Sterling, bringing the all-in rate down to 2.72% and resulting in an all-in funding cost for both tranches to SSE of 3.02% per annum which compares favourably to the all-in funding cost of 4.02% achieved on SSE’s most recent hybrid equity securities issued in 2015. The Group has also signed a new £200m facility (£100m for SSE plc and £100m for Scottish Hydro Electric Transmission plc) with the European Investment Bank which will be drawn during 2017 at which point it will become a 10 year term loan. As a consequence, it is the view of the Directors that the Group’s 105% funding policy will be met out its forecast borrowing requirement to September 2017.
Given the committed bank facilities of £1.5bn maintained by the Group and the current capital market conditions, the Directors have concluded that the Group has sufficient headroom to continue as a going concern. In coming to this conclusion, the Directors have also taken into account the successful issuance of £4.5bn of medium to long-term debt and hybrid equity since February 2012, and the Group’s credit rating. The statement of going concern is included in the Directors’ Corporate Governance report on page 72.
Treasury also manage the Group’s interaction with its relationship banks (defined as those banks that support the Group’s financing activities through their ongoing participation in the committed lending facilities that are maintained by the Group). These are each allocated financial limits, subject to the maintenance of a minimum credit rating of investment grade or better allocated by a recognised major ratings group. In respect of short-term cash management, counterparties are subject to review and approval according to defined criteria.
As at 31 March 2017, the value of outstanding cash collateral in respect of mark-to-market related margin calls on exchange traded positions was £105.2m (2016 – £78.3m).
The contractual cash flows shown in the following tables are the contractual undiscounted cash flows under the relevant financial instruments. Where the contractual cash flows are variable based on a price, foreign exchange rate or index in the future, the contractual cash flows in the following tables have been determined with reference to the relevant price, foreign exchange rate, interest rate or index as at the balance sheet date. In determining the interest element of contractual cash flows in cases where the Group has a choice as to the length of interest calculation periods and the interest rate that applies varies with the period selected, the contractual cash flows have been calculated assuming the Group selects the shortest available interest calculation periods. Where the holder of an instrument has a choice of when to redeem, the amounts in the following tables are on the assumption the holder redeems at the earliest opportunity.
The numbers in the following tables have been included in the Group’s cash flow forecasts for the purposes of considering Liquidity Risk as noted above.
180 SSE plc Annual Report 2017
Financial Statements
A6. Financial risk management continuedA6.3 Liquidity risk and going concern continuedThe following are the undiscounted contractual maturities of financial liabilities, including interest and excluding the impact of netting agreements:
2017 2016
Liquidity risk
Carrying value
£m
Contractualcash flows
£m
0-12 months
£m1-2 years
£m2-5 years
£m> 5 years
£m
Carrying value
£m
Contractualcash flows
£m
0-12 months
£m1-2 years
£m2-5 years
£m> 5 years
£m
Financial liabilitiesLoans and borrowingsCommercial paper
and cash advances – – – – – – 198.8 (198.8) (198.8) – – –Loans – floating 556.2 (576.9) (111.7) (4.8) (460.4) – 1,256.0 (1,292.1) (710.2) (113.2) (317.6) (151.1)Loans – fixed 1,783.7 (2,332.0) (72.5) (186.5) (322.3) (1,750.7) 991.8 (1,352.0) (38.2) (50.7) (392.2) (870.9)Unsecured bonds –
fixed 5,208.2 (7,674.8) (220.9) (726.5) (1,821.1) (4,906.3) 4,138.9 (6,521.2) (183.6) (183.6) (1,000.8) (5,175.2)Non-recourse funding – – – – – – 200.7 (487.4) (22.8) (22.4) (67.0) (375.2)Fair value adjustment 257.4 – – – – – 81.8 – – – – –
7,805.5 (10,583.7) (405.1) (917.8) (2,603.8) (6,657.0) 6,868.0 (9,851.5) (1,153.6) (369.9) (1,777.6) (6,550.4)Finance lease
obligations 276.9 (439.1) (55.5) (53.3) (153.0) (177.3) 300.8 (494.9) (53.9) (55.2) (160.0) (225.8)
8,082.4 (11,022.8) (460.6) (971.1) (2,756.8) (6,834.3) 7,168.8 (10,346.4) (1,207.5) (425.1) (1,937.6) (6,776.2)
Derivative financial liabilities
Operating derivatives designated at fair value 1,443.1 250.3 820.6 (509.9) (60.4) – 2,218.3 5,667.0 4,645.5 951.4 70.1 –
Interest rate swaps used for hedging 40.9 (40.9) (17.4) (11.0) (9.2) (3.3) 58.4 (58.4) (19.7) (19.7) (16.6) (2.4)
Interest rate swaps designated at fair value 362.6 (362.6) (22.2) (21.1) (58.6) (260.7) 357.1 (357.1) (20.1) (19.9) (54.7) (262.4)
Forward exchange contracts held for hedging 9.8 (538.6) (538.6) – – – 7.4 (180.3) (89.9) (90.1) (0.3) –
Forward exchange contracts designated at fair value – – – – – – 0.1 (0.1) (0.1) – – –
1,856.4 (691.8) 242.4 (542.0) (128.2) (264.0) 2,641.3 5,071.1 4,515.7 821.7 (1.5) (264.8)
Other financial liabilities
Trade payables 2,606.7 (2,606.7) (2,606.7) – – – 1,868.3 (1,868.3) (1,868.3) – – –
2,606.7 (2,606.7) (2,606.7) – – – 1,868.3 (1,868.3) (1,868.3) – – –
Total 12,545.5 (14,321.3) (2,824.9) (1,513.1) (2,885.0) (7,098.3) 11,678.4 (7,143.6) 1,439.9 396.6 (1,939.1) (7,041.0)
Derivative financial assets
Financing derivatives (518.0) 86.2 (63.0) (46.8) 134.5 61.5 (298.7) (512.7) (519.6) (69.2) 37.6 38.5Operating derivatives
designated at fair value (1,279.8) (1,487.5) (1,027.9) (410.3) (49.3) – (1,854.0) (5,146.1) (4,082.9) (950.6) (112.6) –
(1,797.8) (1,401.3) (1,090.9) (457.1) 85.2 61.5 (2,152.7) (5,658.8) (4,602.5) (1,019.8) (75.0) 38.5
Net total (i) 10,747.7 (15,722.6) (3,915.8) (1,970.2) (2,799.8) (7,036.8) 9,525.7 (12,802.4) (3,162.6) (623.2) (2,014.1) (7,002.5)
(i) The Group believes the liquidity risk associated with out-of-the-money operating derivative contracts needs to be considered in conjunction with the profile of payments or receipts arising from derivative financial assets. It should be noted that cash flows associated with future energy sales and commodity contracts which are not IAS 39 financial instruments are not included in this analysis, which is prepared in accordance with IFRS 7.
Accompanying information continued
181
3. Financial Statements2.1.
A6. Financial risk management continuedA6.4 Commodity riskThe Group’s Energy Portfolio Management (‘EPM’) business manages the Group’s exposure to energy commodity price movements and requirement for the delivery of its physical commodity needs as part of its normal course of business. The risk management activity carried out by EPM arises from the Group’s requirement to source gas, electricity or other commodities such as renewable obligation certificates for Energy Supply, and to procure fuel and other commodities and provide a route-to-market for Electricity Generation.
The Group’s strategy is to manage all exposures to commodity risk through volumetric limits and to measure the exposure by use of Value at Risk (VaR) models. The exposure is subject to financial limits established by the Board and managed by reference to guidance agreed by the Risk Committees of Retail and Wholesale. Exposures are reported to the Committees on a monthly basis and to the Board when certain trigger levels are exceeded. Within this approach, only certain of the Group’s energy commodity contracts are deemed to constitute financial instruments under IAS 39. As a result, while the Group manages the commodity price risk associated with both financial and non-financial commodity contracts, it is only the fair value of IAS 39 financial instruments which represents the exposure of the Group’s commodity price risk under IFRS 7. This is a consequence of the Group’s accounting policy which stipulates that commodity contracts which are designated as financial instruments under IAS 39 should be accounted for on a fair value basis with changes in fair value reflected in profit or equity. Conversely, commodity contracts that are not designated as financial instruments under IAS 39 will be accounted for as ‘own use’ contracts. As fair value changes in own use contracts are not reflected through profit or equity, these do not represent the IFRS 7 commodity price risk. Therefore, as the overall Group VaRs associated with commodity risk will be monitored for internal risk management purposes and is outside the scope of IAS 39.
In EPM, the economic volatility that the Group is exposed to related to this risk is managed through a selection of longer and shorter term contracts for commodities such as gas, electricity, coal and carbon allowances, the arm’s length arrangements with the Group’s gas production business and through flexibility from the Group’s fleet of generation assets including assets such as pumped storage generating plant, flexible hydro generating plant, standby oil plant and contracts with the gas storage business.
Short-term exposures will arise from the requirement to match volumes of procured gas and electricity with demand for gas and electricity by Energy Supply customers. In addition, exposures can arise from matching fuel and other commodity procurement with demand for these commodities arising from the Group’s Generation assets. Both can vary from expectations and result in a requirement to close the contracted positions at unfavourable prices. Longer-term exposures are managed by EPM through longer term contracts (including forwards, futures contracts and other financial instruments). These, in turn, are used to reduce short-term market exposures.
As noted, certain commodity contracts are entered into primarily for own use purposes to supply to customers or to provide fuel to power stations. However, as noted, a number of these contracts do not qualify for own use treatment under IAS 39 and are subject to fair value measurement through the income statement. In addition to this, the Group enters into certain contracts to manage commodity price and volume risk. These are also subject to fair value measurement through the income statement. Finally, other physical contracts can be treated as the hedging instrument in documented cash flow hedging relationships where the hedged item is the forecast future purchase requirement to meet production or customer demand. The accounting policies associated with such items are explained in the Accompanying information Section A1.
The consequential commodity risk which derives from these activities is quantified by the use of a Value at Risk (VaR) model which considers exposures in all commodities and provides an estimate of the potential change to the Group’s forecast profits over a given period and to a given confidence level. The calculated financial risk is controlled through the imposition of a number of risk limits approved by the Board and monitored and managed by the Risk Committees of Retail and Wholesale. The Group’s exposure to Commodity risk is subsequently reported to and monitored by the relevant Risk Committees and to the Executive Committee by exception.
The Group’s exposure to commodity price risk according to IFRS 7 is measured by reference to the Group’s IAS 39 commodity contracts. IFRS 7 requires disclosure of a sensitivity analysis for market risks that is intended to illustrate the sensitivity of the Group’s financial position and performance to changes in market variables impacting upon the fair value or cash flows associated with the Group’s financial instruments.
Therefore, the sensitivity analysis provided discloses the effect on profit or loss and equity at the balance sheet date assuming that a reasonably possible change in the relevant commodity price had occurred, and been applied to the risk exposures in existence at that date. The reasonably possible changes in commodity prices used in the sensitivity analysis were determined based on calculated or implied volatilities where available, or historical data.
The sensitivity analysis has been calculated on the basis that the proportion of commodity contracts that are IAS 39 financial instruments remains consistent with those at that point. Excluded from this analysis are all commodity contracts that are not financial instruments under IAS 39.
182 SSE plc Annual Report 2017
Financial Statements
A6. Financial risk management continuedA6.4 Commodity risk continued
2017 2016
Commodity prices Base price (i)
Reasonably possible increase/
decrease in variable Base price (i)
Reasonably possible increase/
decrease in variable
UK gas (p/therm) 43 +/-11 33 +/-4UK power (£/MWh) 40 +/-10 33 +/-5UK coal (US$/tonne) 65 +/-10 42 +/-4UK emissions (€/tonne) 5 +/-2 5 +/-1UK oil (US$/bbl) 54 +/-9 49 +/-7
(i) The base price represents the average forward market price over the duration of the active market curve used to calculate the sensitivity analysis.
The impacts of reasonably possible changes in commodity prices on profit after taxation based on the rationale described are as follows:
Incremental profit/(loss)
2017Impact on profit and equity (£m)
2016Impact on profit and equity (£m)
Commodity prices combined – increase (239.0) 77.6Commodity prices combined – decrease 239.0 (77.6)
The sensitivity analysis provided is hypothetical and is based on the Group’s commodity contracts under IAS 39. This is analysis only and should be used with caution as the impacts disclosed are not necessarily indicative of the actual impacts that would be experienced. It should also be noted that these sensitivities impacts provided are indicative only and are based on calculations which do not consider all interrelationships, consequences and effects of such a change in those prices.
A6.5 Currency riskThe Group publishes its consolidated financial statements in Sterling but also conducts business in foreign currencies. As a result, it is subject to foreign currency exchange risk arising from exchange rate movements which will be reflected in the Group’s transaction costs or in the underlying foreign currency assets of its foreign operations.
The Group’s policy is to use forward contracts, swaps and options to manage its exposures to foreign exchange risk. All such exposures are transactional in nature, and relate primarily to procurement contracts, commodity purchasing and related freight requirements, commodity hedging, long-term plant servicing and maintenance agreements, and the purchase and sale of carbon emission certificates. The policy is to seek to hedge 100% of its currency requirements arising under all committed contracts excepting commodity hedge transactions, the requirements for which are significantly less predictable. The policy for these latter transactions is to assess the Group’s requirements on a rolling basis and to enter into cover contracts as appropriate.
The Group has foreign subsidiary operations with significant Euro-denominated net assets. The Group’s policy is to hedge its net investment in its foreign operations by ensuring the net assets whose functional currency cash flows are denominated in Euros are matched by borrowings in Euros. For the acquired net assets whose functional cash flows are in Sterling, the Group will ensure Sterling denominated borrowings are in place to minimise currency risk.
Significant exposures are reported to, and discussed by, the Risk and Trading Committee on an ongoing basis and additionally form part of the bi-annual Treasury report to the Audit Committee.
At the balance sheet date, the total nominal value of outstanding forward foreign exchange contracts that the Group has committed to is:
2017£m
2016£m
Forward foreign exchange contracts 2,580.2 2,783.8
Accompanying information continued
183
3. Financial Statements2.1.
A6. Financial risk management continuedA6.5 Currency risk continuedThe Group’s exposure to foreign currency risk was as follows:
2017 2016
¥mDKK
(million)SEK
(million) €m $mNOK
(million)CHF
(million) ¥mDKK
(million)SEK
(million) €m $mNOK
(million)CHF
(million)
Loans and borrowings 15,000.0 – – 2,375.3 1,994.0 – – 15,000.0 – – 2,063.3 850.0 – –
Purchase and commodity contract commitments – 390.1 360.2 540.2 (843.2) – 41.8 – 982.1 1,105.9 453.9 377.5 23.9 34.6
Gross exposure 15,000.0 390.1 360.2 2,915.5 1,150.8 – 41.8 15,000.0 982.1 1,105.9 2,517.2 1,227.5 23.9 34.6– – – – – – –
Forward exchange/swap contracts 15,000.0 390.1 360.2 1,700.3 1,144.0 – 41.8 15,000.0 982.1 1,105.9 2,029.1 1,239.0 23.9 34.6
Net exposure (in currency) – – – 1,215.2 6.8 – – – – – 488.1 (11.5) – –
Net exposure (in £m) – – – 1,036.5 5.4 – – – – – 386.0 (8.0) – –
This represents the net exposure to foreign currencies, reported in pounds Sterling, and arising from all Group activities. All sensitivity analysis has been prepared on the basis of the relative proportions of instruments in foreign currencies being consistent as at the balance sheet date. This includes only monetary assets and liabilities denominated in a currency other than Sterling and excludes the translation of the net assets of foreign operations but not the corresponding impact of the net investment hedge.
The sensitivity analysis is indicative only and it should be noted that the Group’s exposure to such market rate changes is continually changing. The calculations are based on linear extrapolations of rate changes which may not reflect the actual result which would impact upon the Group.
A 10% change in foreign currency exchange rates would have had the following impact on profit after taxation, based on the assumptions presented above:
Equity Income statement
At 31 March 2017
£m
At 31 March 2016
£m
At 31 March 2017
£m
At 31 March 2016
£m
US Dollars – – (0.5) 0.7Euro 87.1 43.2 6.2 (8.1)DKK – – – –¥ – – – –SEK – – – –NOK – – – –CHF – – – –
87.1 43.2 5.7 (7.4)
The impact of a decrease in rates would be an identical reduction in the annual charge.
A6.6 Interest rate riskInterest rate risk derives from the Group’s exposure to changes in the value of an asset or liability or future cash flows through changes in interest rates.
The Group’s policy is to manage this risk by stipulating that a minimum of 50% of Group borrowings be subject to fixed rates of interest, either directly through the debt instruments themselves or through the use of derivative financial instruments. The floating rate borrowings are provided by banks including the European Investment Bank (EIB). Such instruments include interest rate swaps and options, forward rate agreements and, in the case of debt raised in currencies other than Sterling, cross currency swaps. These practices serve to reduce the volatility of the Group’s financial performance.
Although interest rate derivatives are primarily used to hedge risk relating to current borrowings, under certain circumstances they may also be used to hedge future borrowings. Any such pre-hedging is unwound at the time of pricing the underlying debt, either through cash settlement on a net present value basis or by transacting offsetting trades. The floating rate borrowings mainly comprise cash advances from the European Investment Bank (EIB).
184 SSE plc Annual Report 2017
Financial Statements
A6. Financial risk management continuedA6.6 Interest rate risk continuedThe impact of a change in interest rates is dependent on the specific details of the financial asset or liability in question. Changes in fixed rate financial assets and liabilities, which account for the majority of cash, loans and borrowings, are not measured at fair value through the income statement. In addition to this, changes to fixed-to-floating hedging instruments which are recorded under cash flow hedge accounting also do not impact the income statement. Changes in variable rate instruments and hedging instruments and hedged items recorded under fair value hedge accounting are recorded through the income statement. The exposure measured is therefore based on variable rate debt and instruments.
The net exposure to interest rates at the balance sheet date can be summarised thus:
2017Carryingamount
£m
2016Carryingamount
£m
Interest bearing/earning assets and liabilities:– fixed (7,529.7) (5,613.9)– floating 942.6 (1,372.1)
(6,587.1) (6,986.0)
Represented by:
Cash and cash equivalents 1,427.0 360.2Derivative financial assets/(liabilities) 68.3 (177.4)Loans and borrowings (7,805.5) (6,868.0)Finance lease obligations (276.9) (300.8)
(6,587.1) (6,986.0)
Following from this, the table below represents the expected impact of a change of 100 basis points in short-term interest rates at the reporting date in relation to equity and income statement. The analysis assumes that all other variables, in particular foreign currency rates, remain constant. An increase in exchange rates would be a change to either the income statement or equity. The assessment is based on a revision of the fair value assumptions included in the calculated exposures in the previous table.
All sensitivity analysis has been prepared on the basis of the proportion of fixed to floating instruments being consistent as at the balance sheet date and is stated after the effect of taxation.
The sensitivity analysis is indicative only and it should be noted that the Group’s exposure to such market rate changes is continually changing. The calculations are based on linear extrapolations of rate changes which may not reflect the actual result which would impact upon the Group.
2017£m
2016£m
Income statement 4.9 14.3
4.9 14.3
The impact of a decrease in rates would be an identical reduction in the annual charge. There is no impact on equity as the analysis relates to the Group’s net exposure at the balance sheet date. Contracts qualifying for hedge accounting are, by definition, part of the Group’s covered position.
Accompanying information continued
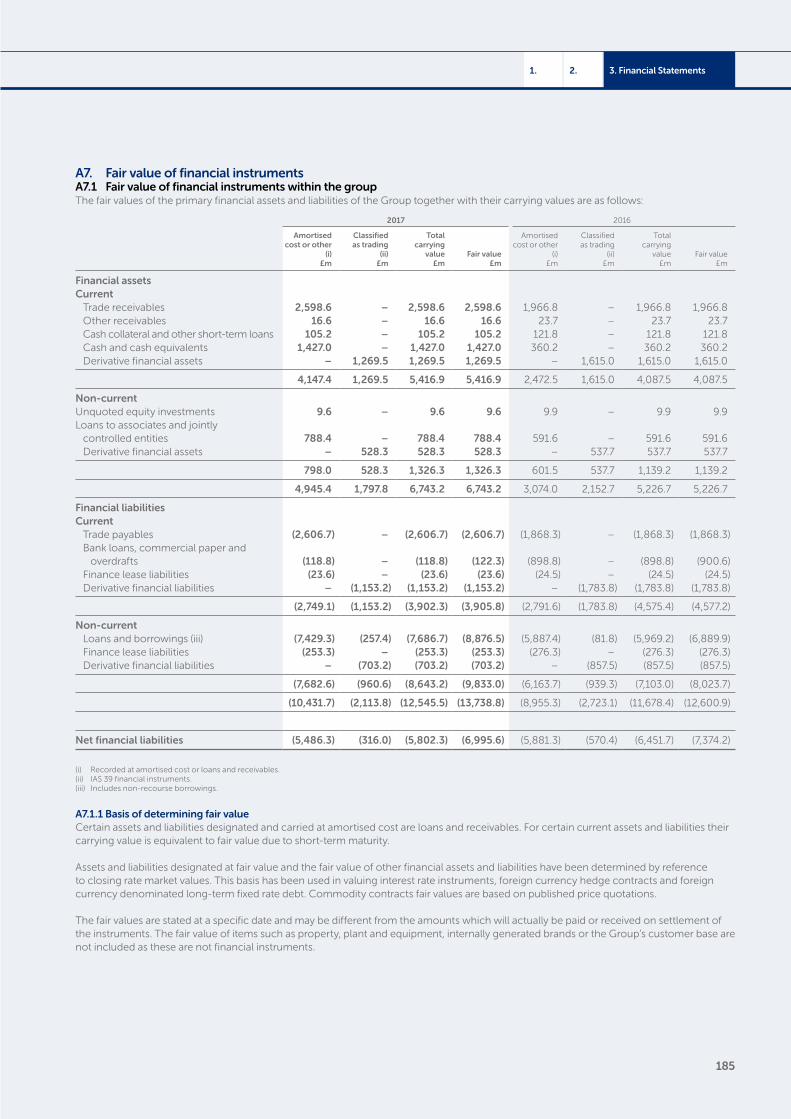
185
3. Financial Statements2.1.
A7. Fair value of financial instrumentsA7.1 Fair value of financial instruments within the groupThe fair values of the primary financial assets and liabilities of the Group together with their carrying values are as follows:
2017 2016
Amortised cost or other
(i) £m
Classified as trading
(ii) £m
Total carrying
value £m
Fair value£m
Amortised cost or other
(i) £m
Classified as trading
(ii) £m
Total carrying
value£m
Fair value £m
Financial assetsCurrent
Trade receivables 2,598.6 – 2,598.6 2,598.6 1,966.8 – 1,966.8 1,966.8Other receivables 16.6 – 16.6 16.6 23.7 – 23.7 23.7Cash collateral and other short-term loans 105.2 – 105.2 105.2 121.8 – 121.8 121.8Cash and cash equivalents 1,427.0 – 1,427.0 1,427.0 360.2 – 360.2 360.2Derivative financial assets – 1,269.5 1,269.5 1,269.5 – 1,615.0 1,615.0 1,615.0
4,147.4 1,269.5 5,416.9 5,416.9 2,472.5 1,615.0 4,087.5 4,087.5
Non-currentUnquoted equity investments 9.6 – 9.6 9.6 9.9 – 9.9 9.9Loans to associates and jointly
controlled entities 788.4 – 788.4 788.4 591.6 – 591.6 591.6Derivative financial assets – 528.3 528.3 528.3 – 537.7 537.7 537.7
798.0 528.3 1,326.3 1,326.3 601.5 537.7 1,139.2 1,139.2
4,945.4 1,797.8 6,743.2 6,743.2 3,074.0 2,152.7 5,226.7 5,226.7
Financial liabilitiesCurrent
Trade payables (2,606.7) – (2,606.7) (2,606.7) (1,868.3) – (1,868.3) (1,868.3)Bank loans, commercial paper and
overdrafts (118.8) – (118.8) (122.3) (898.8) – (898.8) (900.6)Finance lease liabilities (23.6) – (23.6) (23.6) (24.5) – (24.5) (24.5)Derivative financial liabilities – (1,153.2) (1,153.2) (1,153.2) – (1,783.8) (1,783.8) (1,783.8)
(2,749.1) (1,153.2) (3,902.3) (3,905.8) (2,791.6) (1,783.8) (4,575.4) (4,577.2)
Non-currentLoans and borrowings (iii) (7,429.3) (257.4) (7,686.7) (8,876.5) (5,887.4) (81.8) (5,969.2) (6,889.9)Finance lease liabilities (253.3) – (253.3) (253.3) (276.3) – (276.3) (276.3)Derivative financial liabilities – (703.2) (703.2) (703.2) – (857.5) (857.5) (857.5)
(7,682.6) (960.6) (8,643.2) (9,833.0) (6,163.7) (939.3) (7,103.0) (8,023.7)
(10,431.7) (2,113.8) (12,545.5) (13,738.8) (8,955.3) (2,723.1) (11,678.4) (12,600.9)
Net financial liabilities (5,486.3) (316.0) (5,802.3) (6,995.6) (5,881.3) (570.4) (6,451.7) (7,374.2)
(i) Recorded at amortised cost or loans and receivables.(ii) IAS 39 financial instruments.(iii) Includes non-recourse borrowings.
A7.1.1 Basis of determining fair valueCertain assets and liabilities designated and carried at amortised cost are loans and receivables. For certain current assets and liabilities their carrying value is equivalent to fair value due to short-term maturity.
Assets and liabilities designated at fair value and the fair value of other financial assets and liabilities have been determined by reference to closing rate market values. This basis has been used in valuing interest rate instruments, foreign currency hedge contracts and foreign currency denominated long-term fixed rate debt. Commodity contracts fair values are based on published price quotations.
The fair values are stated at a specific date and may be different from the amounts which will actually be paid or received on settlement of the instruments. The fair value of items such as property, plant and equipment, internally generated brands or the Group’s customer base are not included as these are not financial instruments.
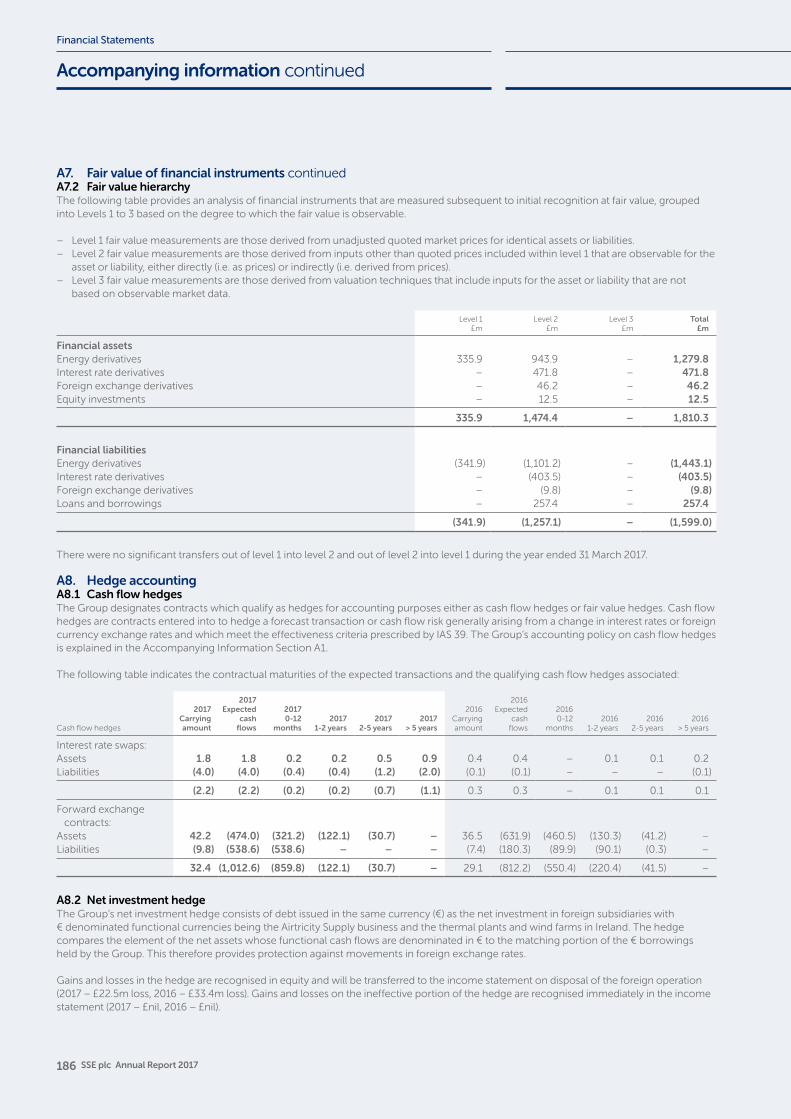
186 SSE plc Annual Report 2017
Financial Statements
A7. Fair value of financial instruments continuedA7.2 Fair value hierarchyThe following table provides an analysis of financial instruments that are measured subsequent to initial recognition at fair value, grouped into Levels 1 to 3 based on the degree to which the fair value is observable.
– Level 1 fair value measurements are those derived from unadjusted quoted market prices for identical assets or liabilities. – Level 2 fair value measurements are those derived from inputs other than quoted prices included within level 1 that are observable for the
asset or liability, either directly (i.e. as prices) or indirectly (i.e. derived from prices). – Level 3 fair value measurements are those derived from valuation techniques that include inputs for the asset or liability that are not
based on observable market data.
Level 1£m
Level 2£m
Level 3£m
Total£m
Financial assetsEnergy derivatives 335.9 943.9 – 1,279.8Interest rate derivatives – 471.8 – 471.8Foreign exchange derivatives – 46.2 – 46.2Equity investments – 12.5 – 12.5
335.9 1,474.4 – 1,810.3
Financial liabilitiesEnergy derivatives (341.9) (1,101.2) – (1,443.1)Interest rate derivatives – (403.5) – (403.5)Foreign exchange derivatives – (9.8) – (9.8)Loans and borrowings – 257.4 – 257.4
(341.9) (1,257.1) – (1,599.0)
There were no significant transfers out of level 1 into level 2 and out of level 2 into level 1 during the year ended 31 March 2017.
A8. Hedge accountingA8.1 Cash flow hedgesThe Group designates contracts which qualify as hedges for accounting purposes either as cash flow hedges or fair value hedges. Cash flow hedges are contracts entered into to hedge a forecast transaction or cash flow risk generally arising from a change in interest rates or foreign currency exchange rates and which meet the effectiveness criteria prescribed by IAS 39. The Group’s accounting policy on cash flow hedges is explained in the Accompanying Information Section A1.
The following table indicates the contractual maturities of the expected transactions and the qualifying cash flow hedges associated:
Cash flow hedges
2017Carrying amount
2017Expected
cash flows
20170-12
months2017
1-2 years2017
2-5 years2017
> 5 years
2016Carrying amount
2016Expected
cashflows
20160-12
months2016
1-2 years2016
2-5 years2016
> 5 years
Interest rate swaps:Assets 1.8 1.8 0.2 0.2 0.5 0.9 0.4 0.4 – 0.1 0.1 0.2Liabilities (4.0) (4.0) (0.4) (0.4) (1.2) (2.0) (0.1) (0.1) – – – (0.1)
(2.2) (2.2) (0.2) (0.2) (0.7) (1.1) 0.3 0.3 – 0.1 0.1 0.1
Forward exchange contracts:
Assets 42.2 (474.0) (321.2) (122.1) (30.7) – 36.5 (631.9) (460.5) (130.3) (41.2) –Liabilities (9.8) (538.6) (538.6) – – – (7.4) (180.3) (89.9) (90.1) (0.3) –
32.4 (1,012.6) (859.8) (122.1) (30.7) – 29.1 (812.2) (550.4) (220.4) (41.5) –
A8.2 Net investment hedgeThe Group’s net investment hedge consists of debt issued in the same currency (€) as the net investment in foreign subsidiaries with € denominated functional currencies being the Airtricity Supply business and the thermal plants and wind farms in Ireland. The hedge compares the element of the net assets whose functional cash flows are denominated in € to the matching portion of the € borrowings held by the Group. This therefore provides protection against movements in foreign exchange rates.
Gains and losses in the hedge are recognised in equity and will be transferred to the income statement on disposal of the foreign operation (2017 – £22.5m loss, 2016 – £33.4m loss). Gains and losses on the ineffective portion of the hedge are recognised immediately in the income statement (2017 – £nil, 2016 – £nil).
Accompanying information continued
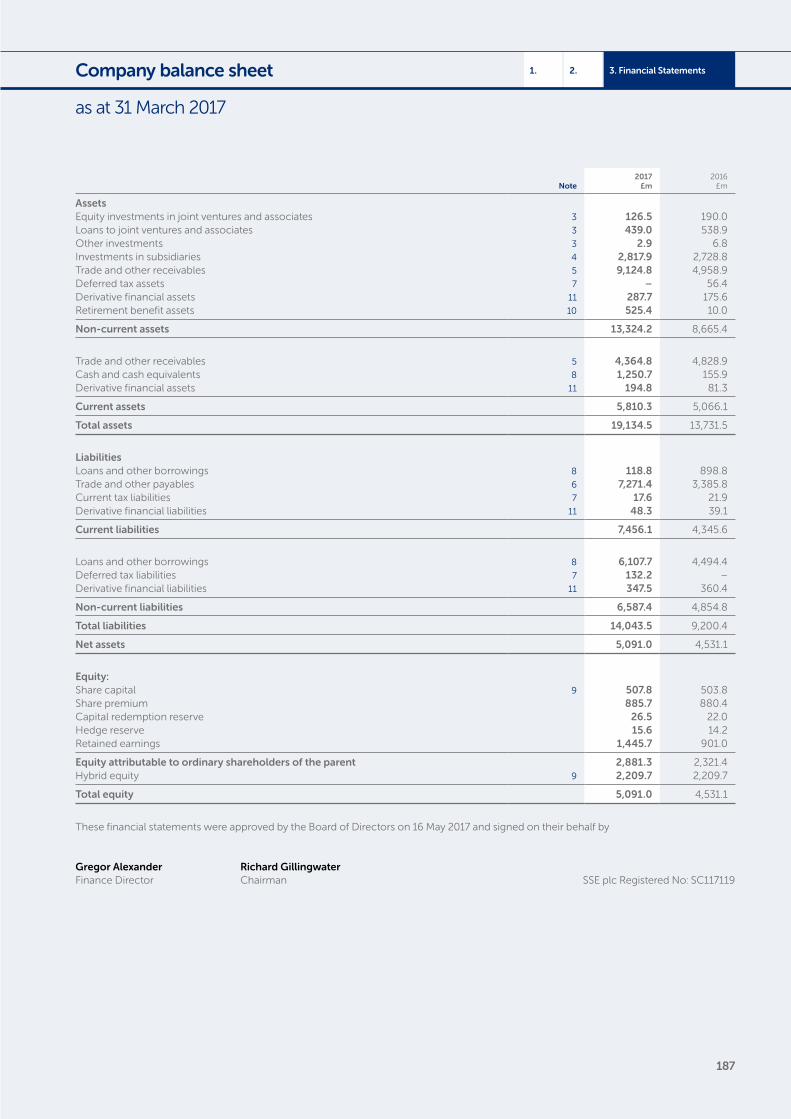
187
3. Financial Statements2.1.Company balance sheet
as at 31 March 2017
Note2017
£m2016
£m
AssetsEquity investments in joint ventures and associates 3 126.5 190.0Loans to joint ventures and associates 3 439.0 538.9Other investments 3 2.9 6.8Investments in subsidiaries 4 2,817.9 2,728.8Trade and other receivables 5 9,124.8 4,958.9Deferred tax assets 7 – 56.4Derivative financial assets 11 287.7 175.6Retirement benefit assets 10 525.4 10.0
Non-current assets 13,324.2 8,665.4
Trade and other receivables 5 4,364.8 4,828.9Cash and cash equivalents 8 1,250.7 155.9Derivative financial assets 11 194.8 81.3
Current assets 5,810.3 5,066.1
Total assets 19,134.5 13,731.5
LiabilitiesLoans and other borrowings 8 118.8 898.8Trade and other payables 6 7,271.4 3,385.8Current tax liabilities 7 17.6 21.9Derivative financial liabilities 11 48.3 39.1
Current liabilities 7,456.1 4,345.6
Loans and other borrowings 8 6,107.7 4,494.4Deferred tax liabilities 7 132.2 –Derivative financial liabilities 11 347.5 360.4
Non-current liabilities 6,587.4 4,854.8
Total liabilities 14,043.5 9,200.4
Net assets 5,091.0 4,531.1
Equity:Share capital 9 507.8 503.8Share premium 885.7 880.4Capital redemption reserve 26.5 22.0Hedge reserve 15.6 14.2Retained earnings 1,445.7 901.0
Equity attributable to ordinary shareholders of the parent 2,881.3 2,321.4Hybrid equity 9 2,209.7 2,209.7
Total equity 5,091.0 4,531.1
These financial statements were approved by the Board of Directors on 16 May 2017 and signed on their behalf by
Gregor Alexander Finance Director
Richard Gillingwater Chairman SSE plc Registered No: SC117119
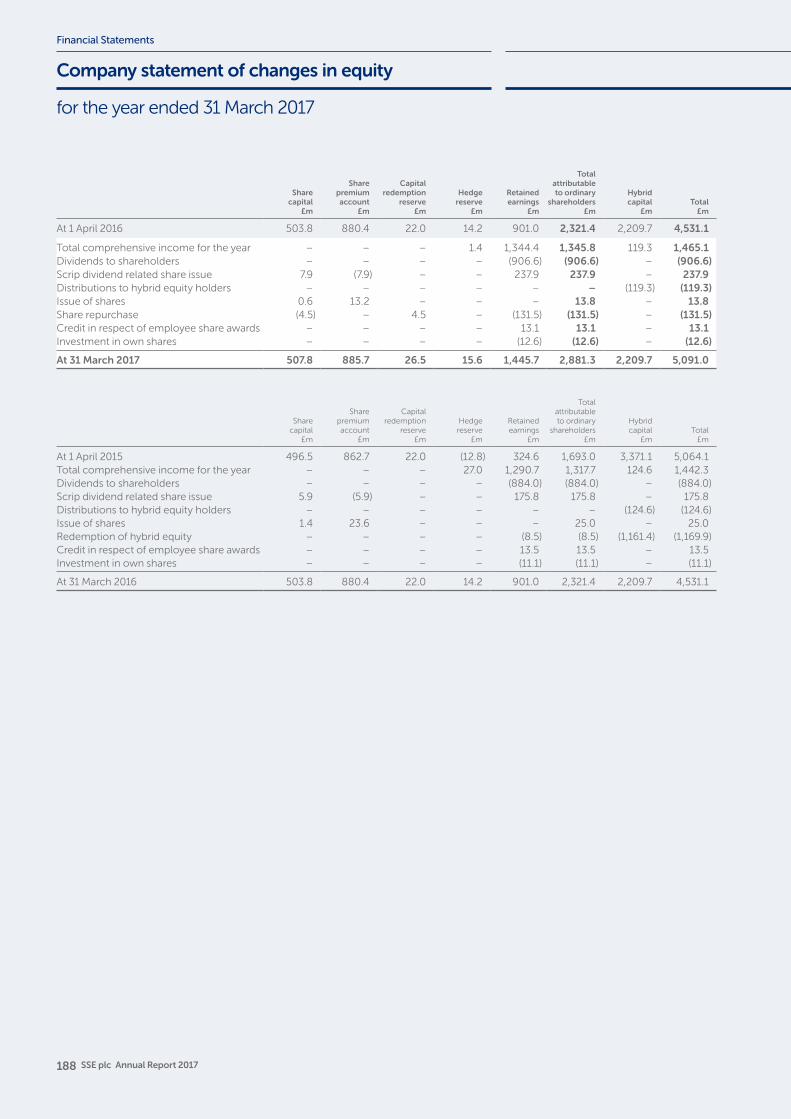
188 SSE plc Annual Report 2017
Financial Statements
for the year ended 31 March 2017
Company statement of changes in equity
Share capital
£m
Share premium account
£m
Capital redemption
reserve£m
Hedge reserve
£m
Retained earnings
£m
Total attributable to ordinary
shareholders£m
Hybrid capital
£mTotal
£m
At 1 April 2016 503.8 880.4 22.0 14.2 901.0 2,321.4 2,209.7 4,531.1
Total comprehensive income for the year – – – 1.4 1,344.4 1,345.8 119.3 1,465.1Dividends to shareholders – – – – (906.6) (906.6) – (906.6)Scrip dividend related share issue 7.9 (7.9) – – 237.9 237.9 – 237.9Distributions to hybrid equity holders – – – – – – (119.3) (119.3)Issue of shares 0.6 13.2 – – – 13.8 – 13.8Share repurchase (4.5) – 4.5 – (131.5) (131.5) – (131.5)Credit in respect of employee share awards – – – – 13.1 13.1 – 13.1Investment in own shares – – – – (12.6) (12.6) – (12.6)
At 31 March 2017 507.8 885.7 26.5 15.6 1,445.7 2,881.3 2,209.7 5,091.0
Share capital
£m
Share premium account
£m
Capital redemption
reserve£m
Hedge reserve
£m
Retained earnings
£m
Total attributable to ordinary
shareholders£m
Hybrid capital
£mTotal
£m
At 1 April 2015 496.5 862.7 22.0 (12.8) 324.6 1,693.0 3,371.1 5,064.1Total comprehensive income for the year – – – 27.0 1,290.7 1,317.7 124.6 1,442.3Dividends to shareholders – – – – (884.0) (884.0) – (884.0)Scrip dividend related share issue 5.9 (5.9) – – 175.8 175.8 – 175.8Distributions to hybrid equity holders – – – – – – (124.6) (124.6)Issue of shares 1.4 23.6 – – – 25.0 – 25.0Redemption of hybrid equity – – – – (8.5) (8.5) (1,161.4) (1,169.9)Credit in respect of employee share awards – – – – 13.5 13.5 – 13.5Investment in own shares – – – – (11.1) (11.1) – (11.1)
At 31 March 2016 503.8 880.4 22.0 14.2 901.0 2,321.4 2,209.7 4,531.1
189
3. Financial Statements2.1.Notes to the Company financial statements
1. Principal accounting policiesSSE plc (the Company) is a company domiciled in Scotland. The address of the registered office is given on the back cover. The Company financial statements present information about the Company as a separate entity and not about the Group.
Basis of preparationThe financial statements have been prepared in accordance with FRS 101 (Reduced Disclosures) (‘FRS 101’) and its interpretations as issued by the International Accounting Standards Board (‘IASB’) and adopted by the European Union (‘adopted IFRS’). This represents a change in accounting standards adopted as the Company previously adopted IFRS, as a result of the change no transitional adjustments were identified.
Under section 408 of the Companies Act 2006 the Company is exempt from the requirement to present its own income statement and related notes.
It has also taken advantage of the following disclosure exemptions available under FRS 101: – A Cash flow statement and related notes; – Related party disclosures; – Disclosures in respect of capital management; and – The effects of new but not yet effective IFRSs.
As the consolidated financial statements of SSE plc include the equivalent disclosure, the Company has also taken advantage of the exemptions, under FRS 101, available in respect of the following disclosure:
– Certain disclosures required by IFRS 13 Fair value measurement and the disclosures required by IFRS 7 Financial instrument disclosures. – Share-based payments required by paragraphs 45(b) and 46 to 52 of IFRS 2 Share-based Payment.
Going concernThe Directors consider that the Company has adequate resources to continue in operational existence for the foreseeable future. The financial statements are therefore prepared on a going concern basis.
Basis of measurementThe financial statements of the Company are prepared on the historical cost basis except for derivative financial instruments, available-for-sale financial assets and assets of the Company pension scheme which are stated at their fair value, and liabilities of the Company pension scheme which are measured using the projected unit credit method. The directors believe the financial statements present a true and fair view. The financial statements of the Company are presented in pounds sterling.
Critical accounting judgements and estimation uncertaintyIn the process of applying the Company’s accounting policies, management necessarily makes judgements and estimates that have a significant effect on the amounts recognised in the financial statements. Changes in the assumptions underlying the estimates could result in a significant impact to the financial statements. The Group’s key accounting judgement and estimation areas are noted in Note 4.1 of the consolidated financial statements, with the most significant financial judgement areas as specifically discussed by the Audit Committee being highlighted separately.
Significant accounting policiesThe significant accounting policies applied in the preparation of these individual financial statements are set out below. These policies have been applied consistently to all the years presented, unless otherwise stated.
InvestmentsIn the Company, investments in subsidiaries are carried at cost less any impairment charges.
Interests in joint arrangements and associates Associates are those investments over which the Company has significant influence but neither control nor joint control.
The Company’s interests in its joint operations are accounted for by recognising its share of the assets, liabilities, revenue and expenses of the operation. In these arrangements, the Company’s share of the revenue will be eliminated as it relates to its purchased share of the output from the arrangement.
The Company’s joint ventures and associates are accounted for using the equity method of accounting where the joint venture and associate investments are carried at historical cost plus the Company’s share of post-acquisition results, less any impairment in value. The Company recognises its share of the results of these equity-accounted operations after tax and interest in the income statement.
Applicable Group accounting policiesThe following significant accounting policies are consistent with those applied for the Group consolidated financial statements:
– Equity and equity-related compensation benefits (Supplementary information A1.2, page 165). – Defined benefit pension scheme (Supplementary information A1.2, page 165). – Taxation (Supplementary information A1.2, page 160). – Financial instruments (Supplementary information A1 and A6, pages 165 and 177).
190 SSE plc Annual Report 2017
Financial Statements
2. Supplementary financial information2.1 Result for the yearThe profit for the year attributable to ordinary shareholders dealt with in the financial statements of the Company was £1,144.3m (2016 – £1,182.2m).
2.2 Auditor remunerationThe amounts paid to the Company’s Auditor in respect of the audit of these financial statements was £0.3m (2016 – £0.3m).
Amounts paid to the Company’s Auditor in respect of services to the Company other than the audit of the Company’s financial statements have not been disclosed as the information is required instead to be disclosed on a consolidated basis.
2.3 Employee numbersThe average number of people employed by the Company (including Executive Directors) during the year was 2 (2016 – 2).
The costs associated with the employees of the Company, who are the Executive Directors of the Group, are borne by Group companies. No amounts are charged to the Company.
2.4 Directors’ remuneration and interestsInformation concerning Directors’ remuneration, shareholdings, options, long-term incentive schemes and pensions is shown in the Remuneration Report on pages 80 to 97. No Director had, during or at the end of the year, any material interest in any other contract of significance in relation to the Group’s business.
3. Investments 3.1 Associates and joint ventures
Equity Loans
SGN£m
Other JCEs and
associates£m
Equitytotal
£mSGN
£m
Other JCEs and
associates£m
Loanstotal
£mTotal
£m
Share of net assets/costAt 31 March 2015 190.0 – 190.0 266.9 277.5 544.4 734.4Increase in shareholder loans – – – – 30.6 30.6 30.6Repayment of shareholder loans – – – – (13.4) (13.4) (13.4)Transfer of loan to subsidiary – – – – (22.7) (22.7) (22.7)
At 31 March 2016 190.0 – 190.0 266.9 272.0 538.9 728.9Increase in shareholder loans – – – – 155.1 155.1 155.1Repayment of shareholder loans – – – – (14.3) (14.3) (14.3)Disposal (63.5) – (63.5) (89.1) (1.2) (90.3) (153.8)Transfer of loans to subsidiary – – – – (150.4) (150.4) (150.4)
At 31 March 2017 126.5 – 126.5 177.8 261.2 439.0 565.5
FaroePetroleum
£m
At 31 March 2015 15.2Revaluation through other comprehensive income/(loss) (8.4)At 31 March 2016 6.8
Disposals in the year (3.9)
At 31 March 2017 2.9
On 26 October 2016, the Group completed the disposal of a 16.7% equity stake in Scotia Gas Networks (SGN) to wholly owned subsidiaries of the Abu Dhabi Investment Authority (ADIA). After transaction costs and adjustments, cash consideration received was £615.1m and an exceptional gain on sale of £462.9m was recognised on disposal. Following the divestment, the Group will retain a 33.3% equity stake in SGN. These assets were not held for sale at 31 March 2016.
Notes to the Company financial statements continued
191
3. Financial Statements2.1.
4. Subsidiary undertakingsDetails of the Company’s subsidiary undertakings are disclosed in the Accompanying Information Section (A3) on page 170.
Investment in subsidiaries
Total£m
At 31 March 2016 2,728.8
Increase in existing investments (i) 89.1
At 31 March 2017 2,817.9
(i) The increase in existing investments held by the Company relates to the capitalisation of loan stocks held by the Company in Scottish and Southern Energy Power Distribution Limited and the equity shares in the Company awarded to the employees of the subsidiaries of the Group under the Group’s share schemes, which are recognised as an increase in the cost of investment in those subsidiaries as directed by IFRIC 11 (2017 – £16.2m; 2016 – £16.5m (both before tax)).
5. Trade and other receivablesAll current and non-current trade and other receivable balances in the current and prior financial year represent amounts owed by subsidiary undertakings.
6. Trade and other payablesAll current and non-current trade and other payable balances in the current and prior financial year represent amounts due to subsidiary undertakings.
7. TaxationCurrent tax liabilities
2017£m
2016£m
Corporation tax 17.6 21.9
Deferred taxationThe following are the deferred tax liabilities and assets recognised by the Company and movements thereon during the current and prior reporting periods:
Fair valuegains/(losses)on derivatives
£m
Retirement benefit
obligations£m
Other£m
Total£m
At 31 March 2015 (47.2) (26.1) (14.6) (87.9)Charge/(credit) to Income Statement 5.1 (0.4) (6.5) (1.8)Charge/(credit) to equity 5.0 28.3 – 33.3
At 31 March 2016 (37.1) 1.8 (21.1) (56.4)
Charge/(credit) to income statement 10.0 3.4 (4.4) 9.0Charge/(credit) to equity (2.1) 178.7 3.0 179.6
At 31 March 2017 (29.2) 183.9 (22.5) 132.2
192 SSE plc Annual Report 2017
Financial Statements
7. Taxation continuedDeferred taxation continuedCertain deferred tax assets and liabilities have been offset, including the asset balances analysed in the tables above. The following is an analysis of the deferred tax balances (after offset) for financial reporting purposes:
2017£m
2016£m
Deferred tax liabilities 132.2 –Deferred tax assets – (56.4)
Net deferred tax liabilities/(assets) 132.2 (56.4)
The deferred tax liabilities/assets disclosed include the deferred tax relating to the Company’s pension scheme liabilities.
8. Loans and borrowings
2017£m
2016£m
CurrentOther short-term loans 118.8 898.8
118.8 898.8
Non-current Loans 6,107.7 4,494.4
6,107.7 4,494.4
Total loans and borrowings 6,226.5 5,393.2
Cash and cash equivalents (1,250.7) (155.9)
Unadjusted net debt 4,975.8 5,237.3
Add/(less):Hybrid equity (Note 9) 2,209.7 2,209.7
Adjusted net debt and hybrids 7,185.5 7,447.0
Cash and cash equivalents (which are presented as a single class of assets in the face of the balance sheet) comprise cash at bank and short-term highly liquid investments with a maturity of six months or less.
8.1 Borrowing facilitiesThe Company has an established €1.5bn Euro commercial paper programme (paper can be issued in a range of currencies and swapped into sterling) and as at 31 March 2017 no commercial paper was outstanding (2016 – £198.8m). During the year the Company extended its existing £1.5bn of revolving credit and bilateral facilities by invoking the one year extension options with the facilities now maturing in August 2021 (£1.3bn) and November 2021 (£0.2bn). These facilities continue to provide back up to the commercial paper programme and, as at 31 March 2017 they were undrawn. The Company has a further £200m facility available with the European Investment Bank which will be fully drawn during 2017 when it will become a 10 year term loan.
Notes to the Company financial statements continued
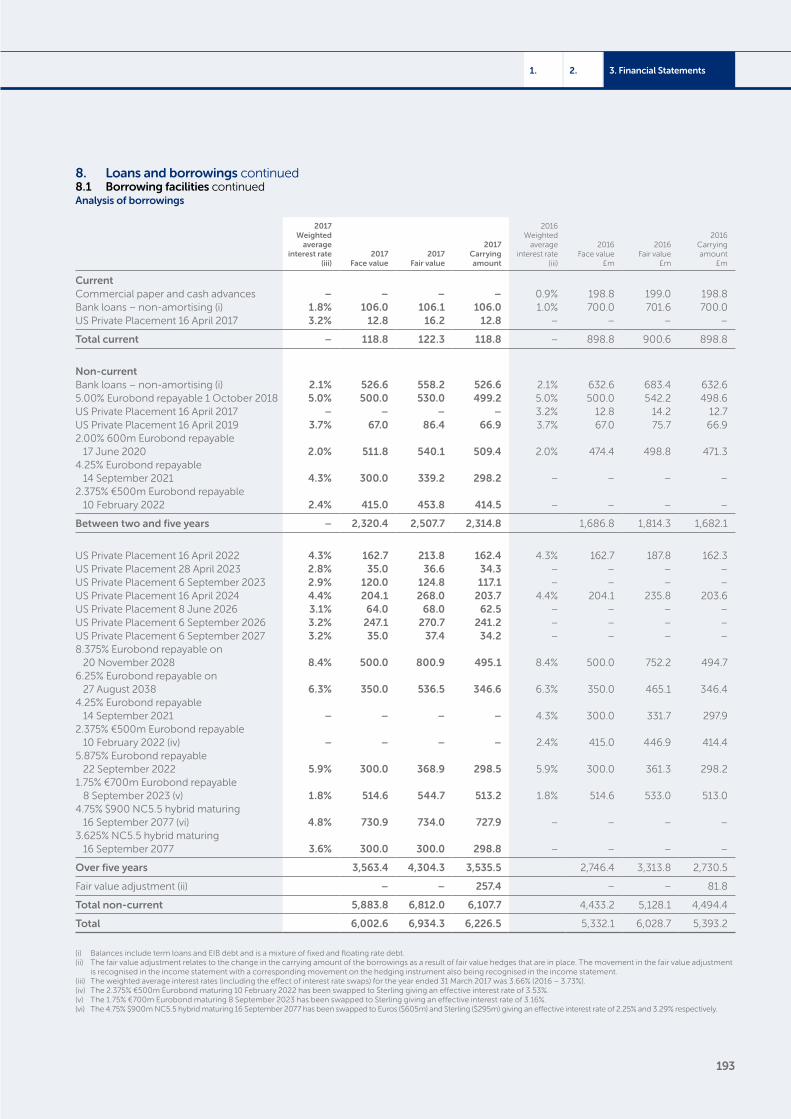
193
3. Financial Statements2.1.
8. Loans and borrowings continued8.1 Borrowing facilities continuedAnalysis of borrowings
2017Weighted
average interest rate
(iii)2017
Face value2017
Fair value
2017Carrying amount
2016Weighted
average interest rate
(iii)
2016Face value
£m
2016Fair value
£m
2016Carrying amount
£m
CurrentCommercial paper and cash advances – – – – 0.9% 198.8 199.0 198.8Bank loans – non-amortising (i) 1.8% 106.0 106.1 106.0 1.0% 700.0 701.6 700.0US Private Placement 16 April 2017 3.2% 12.8 16.2 12.8 – – – –
Total current – 118.8 122.3 118.8 – 898.8 900.6 898.8
Non-currentBank loans – non-amortising (i) 2.1% 526.6 558.2 526.6 2.1% 632.6 683.4 632.65.00% Eurobond repayable 1 October 2018 5.0% 500.0 530.0 499.2 5.0% 500.0 542.2 498.6US Private Placement 16 April 2017 – – – – 3.2% 12.8 14.2 12.7US Private Placement 16 April 2019 3.7% 67.0 86.4 66.9 3.7% 67.0 75.7 66.92.00% 600m Eurobond repayable
17 June 2020 2.0% 511.8 540.1 509.4 2.0% 474.4 498.8 471.34.25% Eurobond repayable
14 September 2021 4.3% 300.0 339.2 298.2 – – – –2.375% €500m Eurobond repayable
10 February 2022 2.4% 415.0 453.8 414.5 – – – –
Between two and five years – 2,320.4 2,507.7 2,314.8 1,686.8 1,814.3 1,682.1
US Private Placement 16 April 2022 4.3% 162.7 213.8 162.4 4.3% 162.7 187.8 162.3US Private Placement 28 April 2023 2.8% 35.0 36.6 34.3 – – – –US Private Placement 6 September 2023 2.9% 120.0 124.8 117.1 – – – –US Private Placement 16 April 2024 4.4% 204.1 268.0 203.7 4.4% 204.1 235.8 203.6US Private Placement 8 June 2026 3.1% 64.0 68.0 62.5 – – – –US Private Placement 6 September 2026 3.2% 247.1 270.7 241.2 – – – –US Private Placement 6 September 2027 3.2% 35.0 37.4 34.2 – – – –8.375% Eurobond repayable on
20 November 2028 8.4% 500.0 800.9 495.1 8.4% 500.0 752.2 494.76.25% Eurobond repayable on
27 August 2038 6.3% 350.0 536.5 346.6 6.3% 350.0 465.1 346.44.25% Eurobond repayable
14 September 2021 – – – – 4.3% 300.0 331.7 297.92.375% €500m Eurobond repayable
10 February 2022 (iv) – – – – 2.4% 415.0 446.9 414.45.875% Eurobond repayable
22 September 2022 5.9% 300.0 368.9 298.5 5.9% 300.0 361.3 298.21.75% €700m Eurobond repayable
8 September 2023 (v) 1.8% 514.6 544.7 513.2 1.8% 514.6 533.0 513.04.75% $900 NC5.5 hybrid maturing
16 September 2077 (vi) 4.8% 730.9 734.0 727.9 – – – –3.625% NC5.5 hybrid maturing
16 September 2077 3.6% 300.0 300.0 298.8 – – – –
Over five years 3,563.4 4,304.3 3,535.5 2,746.4 3,313.8 2,730.5
Fair value adjustment (ii) – – 257.4 – – 81.8
Total non-current 5,883.8 6,812.0 6,107.7 4,433.2 5,128.1 4,494.4
Total 6,002.6 6,934.3 6,226.5 5,332.1 6,028.7 5,393.2
(i) Balances include term loans and EIB debt and is a mixture of fixed and floating rate debt.(ii) The fair value adjustment relates to the change in the carrying amount of the borrowings as a result of fair value hedges that are in place. The movement in the fair value adjustment
is recognised in the income statement with a corresponding movement on the hedging instrument also being recognised in the income statement.(iii) The weighted average interest rates (including the effect of interest rate swaps) for the year ended 31 March 2017 was 3.66% (2016 – 3.73%). (iv) The 2.375% €500m Eurobond maturing 10 February 2022 has been swapped to Sterling giving an effective interest rate of 3.53%.(v) The 1.75% €700m Eurobond maturing 8 September 2023 has been swapped to Sterling giving an effective interest rate of 3.16%.(vi) The 4.75% $900m NC5.5 hybrid maturing 16 September 2077 has been swapped to Euros ($605m) and Sterling ($295m) giving an effective interest rate of 2.25% and 3.29% respectively.
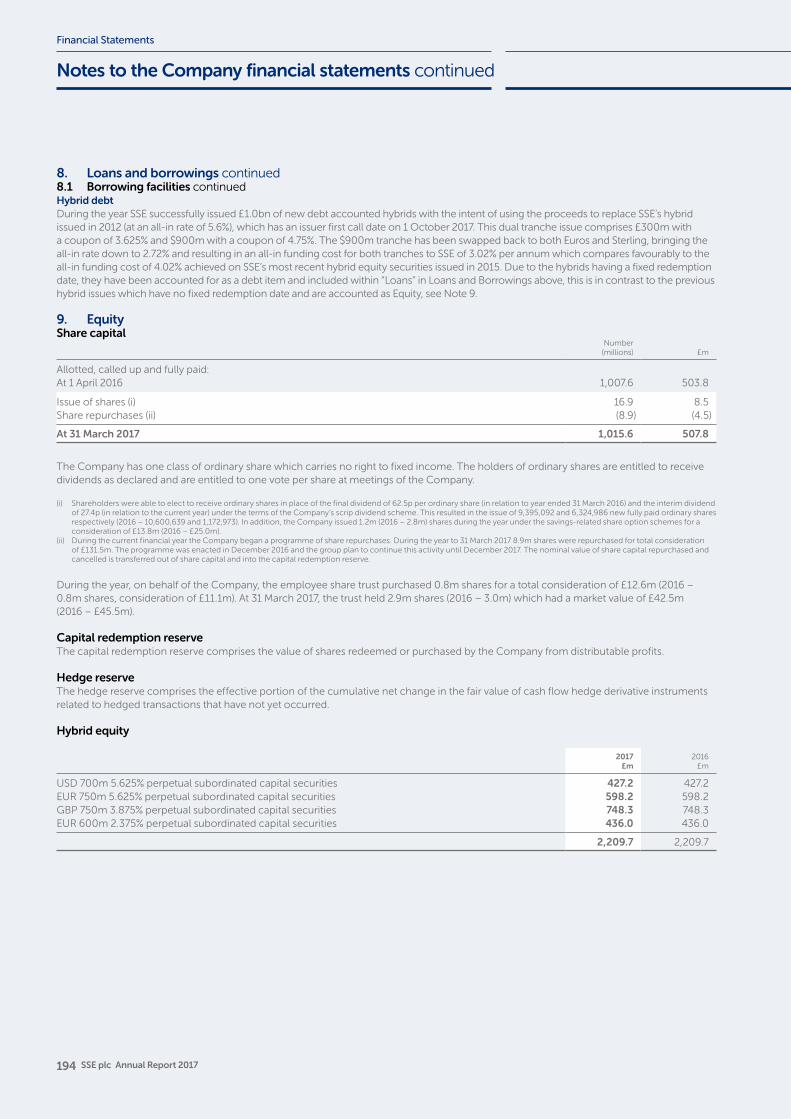
194 SSE plc Annual Report 2017
Financial Statements
8. Loans and borrowings continued8.1 Borrowing facilities continuedHybrid debtDuring the year SSE successfully issued £1.0bn of new debt accounted hybrids with the intent of using the proceeds to replace SSE’s hybrid issued in 2012 (at an all-in rate of 5.6%), which has an issuer first call date on 1 October 2017. This dual tranche issue comprises £300m with a coupon of 3.625% and $900m with a coupon of 4.75%. The $900m tranche has been swapped back to both Euros and Sterling, bringing the all-in rate down to 2.72% and resulting in an all-in funding cost for both tranches to SSE of 3.02% per annum which compares favourably to the all-in funding cost of 4.02% achieved on SSE’s most recent hybrid equity securities issued in 2015. Due to the hybrids having a fixed redemption date, they have been accounted for as a debt item and included within “Loans” in Loans and Borrowings above, this is in contrast to the previous hybrid issues which have no fixed redemption date and are accounted as Equity, see Note 9.
9. EquityShare capital
Number(millions) £m
Allotted, called up and fully paid:At 1 April 2016 1,007.6 503.8
Issue of shares (i) 16.9 8.5Share repurchases (ii) (8.9) (4.5)
At 31 March 2017 1,015.6 507.8
The Company has one class of ordinary share which carries no right to fixed income. The holders of ordinary shares are entitled to receive dividends as declared and are entitled to one vote per share at meetings of the Company.
(i) Shareholders were able to elect to receive ordinary shares in place of the final dividend of 62.5p per ordinary share (in relation to year ended 31 March 2016) and the interim dividend of 27.4p (in relation to the current year) under the terms of the Company’s scrip dividend scheme. This resulted in the issue of 9,395,092 and 6,324,986 new fully paid ordinary shares respectively (2016 – 10,600,639 and 1,172,973). In addition, the Company issued 1.2m (2016 – 2.8m) shares during the year under the savings-related share option schemes for a consideration of £13.8m (2016 – £25.0m).
(ii) During the current financial year the Company began a programme of share repurchases. During the year to 31 March 2017 8.9m shares were repurchased for total consideration of £131.5m. The programme was enacted in December 2016 and the group plan to continue this activity until December 2017. The nominal value of share capital repurchased and cancelled is transferred out of share capital and into the capital redemption reserve.
During the year, on behalf of the Company, the employee share trust purchased 0.8m shares for a total consideration of £12.6m (2016 – 0.8m shares, consideration of £11.1m). At 31 March 2017, the trust held 2.9m shares (2016 – 3.0m) which had a market value of £42.5m (2016 – £45.5m).
Capital redemption reserveThe capital redemption reserve comprises the value of shares redeemed or purchased by the Company from distributable profits.
Hedge reserveThe hedge reserve comprises the effective portion of the cumulative net change in the fair value of cash flow hedge derivative instruments related to hedged transactions that have not yet occurred.
Hybrid equity
2017£m
2016£m
USD 700m 5.625% perpetual subordinated capital securities 427.2 427.2EUR 750m 5.625% perpetual subordinated capital securities 598.2 598.2GBP 750m 3.875% perpetual subordinated capital securities 748.3 748.3EUR 600m 2.375% perpetual subordinated capital securities 436.0 436.0
2,209.7 2,209.7
Notes to the Company financial statements continued
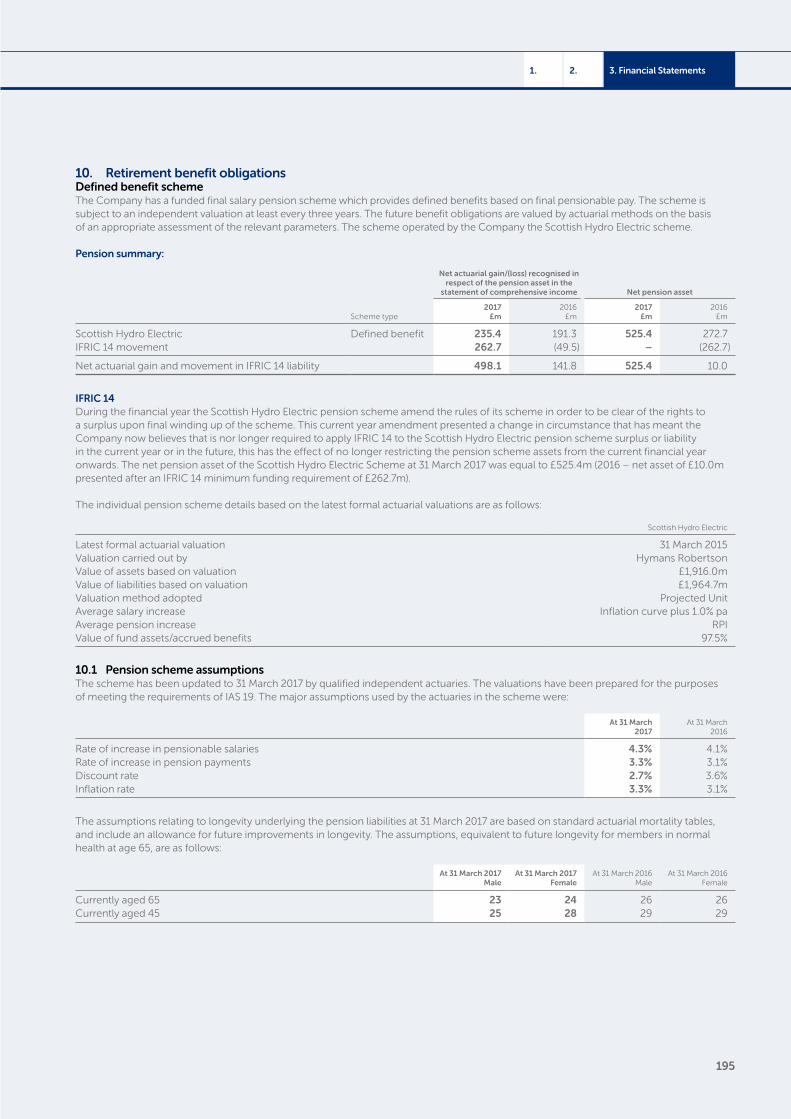
195
3. Financial Statements2.1.
10. Retirement benefit obligationsDefined benefit schemeThe Company has a funded final salary pension scheme which provides defined benefits based on final pensionable pay. The scheme is subject to an independent valuation at least every three years. The future benefit obligations are valued by actuarial methods on the basis of an appropriate assessment of the relevant parameters. The scheme operated by the Company the Scottish Hydro Electric scheme.
Pension summary:
Net actuarial gain/(loss) recognised in respect of the pension asset in the
statement of comprehensive income Net pension asset
Scheme type2017
£m2016
£m2017
£m2016
£m
Scottish Hydro Electric Defined benefit 235.4 191.3 525.4 272.7IFRIC 14 movement 262.7 (49.5) – (262.7)
Net actuarial gain and movement in IFRIC 14 liability 498.1 141.8 525.4 10.0
IFRIC 14During the financial year the Scottish Hydro Electric pension scheme amend the rules of its scheme in order to be clear of the rights to a surplus upon final winding up of the scheme. This current year amendment presented a change in circumstance that has meant the Company now believes that is nor longer required to apply IFRIC 14 to the Scottish Hydro Electric pension scheme surplus or liability in the current year or in the future, this has the effect of no longer restricting the pension scheme assets from the current financial year onwards. The net pension asset of the Scottish Hydro Electric Scheme at 31 March 2017 was equal to £525.4m (2016 – net asset of £10.0m presented after an IFRIC 14 minimum funding requirement of £262.7m).
The individual pension scheme details based on the latest formal actuarial valuations are as follows:
Scottish Hydro Electric
Latest formal actuarial valuation 31 March 2015Valuation carried out by Hymans RobertsonValue of assets based on valuation £1,916.0mValue of liabilities based on valuation £1,964.7mValuation method adopted Projected UnitAverage salary increase Inflation curve plus 1.0% paAverage pension increase RPIValue of fund assets/accrued benefits 97.5%
10.1 Pension scheme assumptionsThe scheme has been updated to 31 March 2017 by qualified independent actuaries. The valuations have been prepared for the purposes of meeting the requirements of IAS 19. The major assumptions used by the actuaries in the scheme were:
At 31 March 2017
At 31 March 2016
Rate of increase in pensionable salaries 4.3% 4.1%Rate of increase in pension payments 3.3% 3.1%Discount rate 2.7% 3.6%Inflation rate 3.3% 3.1%
The assumptions relating to longevity underlying the pension liabilities at 31 March 2017 are based on standard actuarial mortality tables, and include an allowance for future improvements in longevity. The assumptions, equivalent to future longevity for members in normal health at age 65, are as follows:
At 31 March 2017Male
At 31 March 2017Female
At 31 March 2016Male
At 31 March 2016Female
Currently aged 65 23 24 26 26Currently aged 45 25 28 29 29
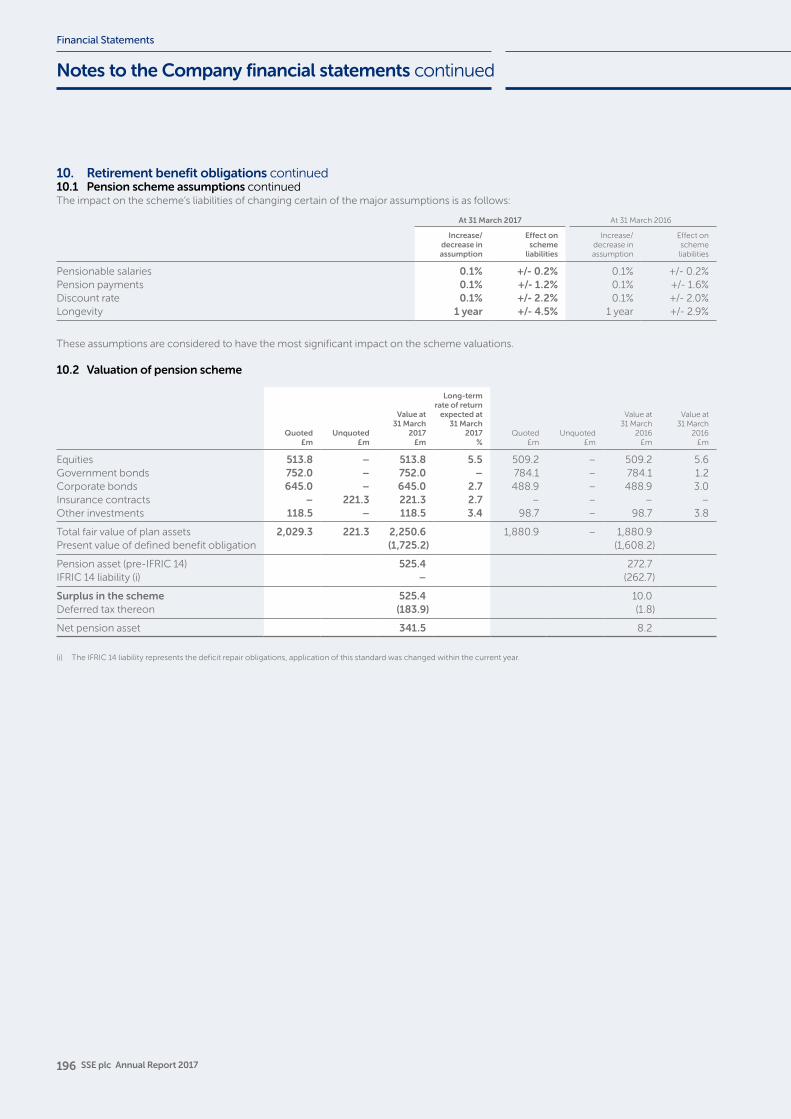
196 SSE plc Annual Report 2017
Financial Statements
10. Retirement benefit obligations continued10.1 Pension scheme assumptions continuedThe impact on the scheme’s liabilities of changing certain of the major assumptions is as follows:
At 31 March 2017 At 31 March 2016
Increase/decrease in assumption
Effect on scheme
liabilities
Increase/decrease in assumption
Effect onschemeliabilities
Pensionable salaries 0.1% +/- 0.2% 0.1% +/- 0.2%Pension payments 0.1% +/- 1.2% 0.1% +/- 1.6%Discount rate 0.1% +/- 2.2% 0.1% +/- 2.0%Longevity 1 year +/- 4.5% 1 year +/- 2.9%
These assumptions are considered to have the most significant impact on the scheme valuations.
10.2 Valuation of pension scheme
Quoted£m
Unquoted£m
Value at 31 March
2017£m
Long-term rate of return
expected at 31 March
2017%
Quoted£m
Unquoted£m
Value at 31 March
2016£m
Value at 31 March
2016£m
Equities 513.8 – 513.8 5.5 509.2 – 509.2 5.6Government bonds 752.0 – 752.0 – 784.1 – 784.1 1.2Corporate bonds 645.0 – 645.0 2.7 488.9 – 488.9 3.0Insurance contracts – 221.3 221.3 2.7 – – – –Other investments 118.5 – 118.5 3.4 98.7 – 98.7 3.8
Total fair value of plan assets 2,029.3 221.3 2,250.6 1,880.9 – 1,880.9Present value of defined benefit obligation (1,725.2) (1,608.2)
Pension asset (pre-IFRIC 14) 525.4 272.7IFRIC 14 liability (i) – (262.7)
Surplus in the scheme 525.4 10.0Deferred tax thereon (183.9) (1.8)
Net pension asset 341.5 8.2
(i) The IFRIC 14 liability represents the deficit repair obligations, application of this standard was changed within the current year.
Notes to the Company financial statements continued
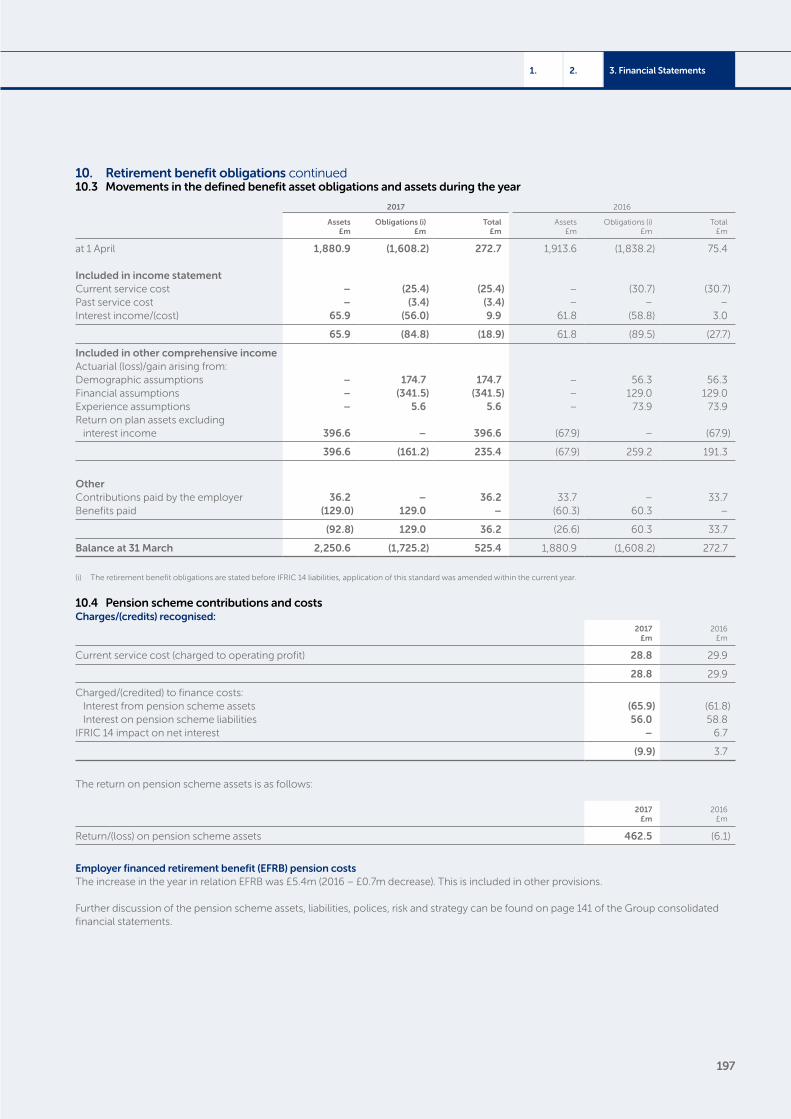
197
3. Financial Statements2.1.
10. Retirement benefit obligations continued10.3 Movements in the defined benefit asset obligations and assets during the year
2017 2016
Assets£m
Obligations (i)£m
Total£m
Assets£m
Obligations (i)£m
Total£m
at 1 April 1,880.9 (1,608.2) 272.7 1,913.6 (1,838.2) 75.4 Included in income statementCurrent service cost – (25.4) (25.4) – (30.7) (30.7)Past service cost – (3.4) (3.4) – – –Interest income/(cost) 65.9 (56.0) 9.9 61.8 (58.8) 3.0
65.9 (84.8) (18.9) 61.8 (89.5) (27.7)
Included in other comprehensive incomeActuarial (loss)/gain arising from:Demographic assumptions – 174.7 174.7 – 56.3 56.3Financial assumptions – (341.5) (341.5) – 129.0 129.0Experience assumptions – 5.6 5.6 – 73.9 73.9Return on plan assets excluding
interest income 396.6 – 396.6 (67.9) – (67.9)
396.6 (161.2) 235.4 (67.9) 259.2 191.3
OtherContributions paid by the employer 36.2 – 36.2 33.7 – 33.7Benefits paid (129.0) 129.0 – (60.3) 60.3 –
(92.8) 129.0 36.2 (26.6) 60.3 33.7
Balance at 31 March 2,250.6 (1,725.2) 525.4 1,880.9 (1,608.2) 272.7
(i) The retirement benefit obligations are stated before IFRIC 14 liabilities, application of this standard was amended within the current year.
10.4 Pension scheme contributions and costsCharges/(credits) recognised:
2017£m
2016£m
Current service cost (charged to operating profit) 28.8 29.9
28.8 29.9
Charged/(credited) to finance costs:Interest from pension scheme assets (65.9) (61.8)Interest on pension scheme liabilities 56.0 58.8
IFRIC 14 impact on net interest – 6.7
(9.9) 3.7
The return on pension scheme assets is as follows:
2017£m
2016£m
Return/(loss) on pension scheme assets 462.5 (6.1)
Employer financed retirement benefit (EFRB) pension costs The increase in the year in relation EFRB was £5.4m (2016 – £0.7m decrease). This is included in other provisions.
Further discussion of the pension scheme assets, liabilities, polices, risk and strategy can be found on page 141 of the Group consolidated financial statements.
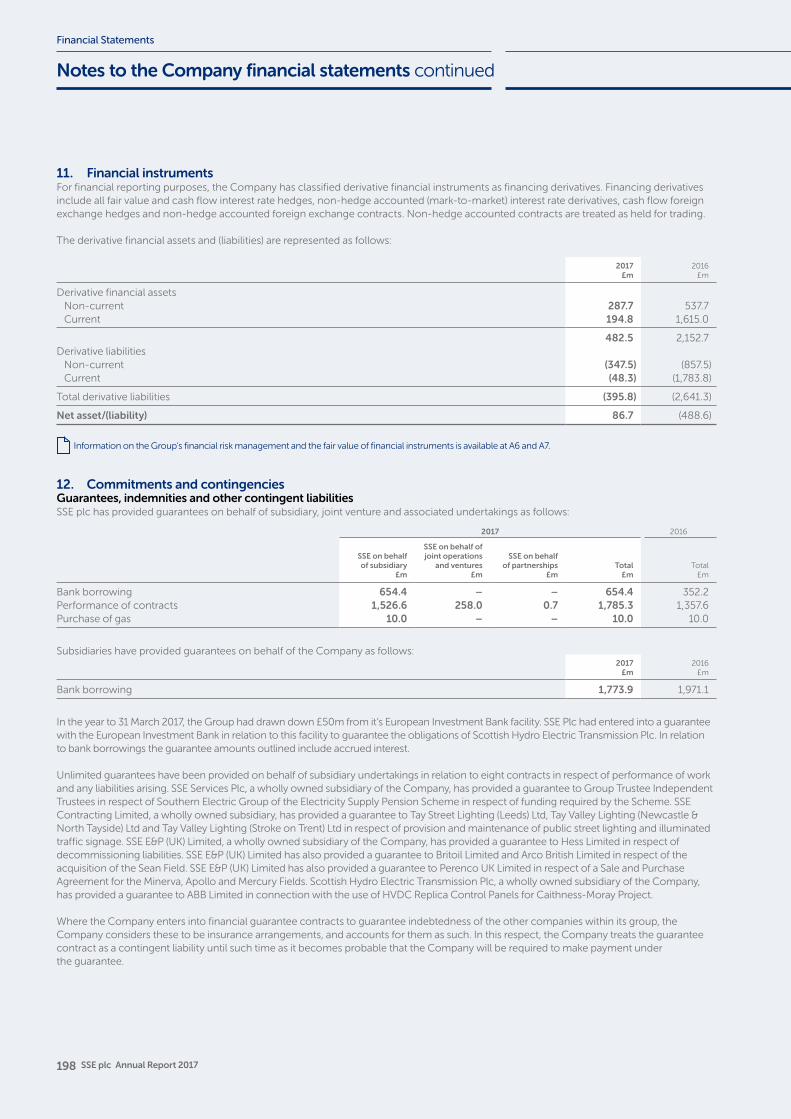
198 SSE plc Annual Report 2017
Financial Statements
11. Financial instrumentsFor financial reporting purposes, the Company has classified derivative financial instruments as financing derivatives. Financing derivatives include all fair value and cash flow interest rate hedges, non-hedge accounted (mark-to-market) interest rate derivatives, cash flow foreign exchange hedges and non-hedge accounted foreign exchange contracts. Non-hedge accounted contracts are treated as held for trading.
The derivative financial assets and (liabilities) are represented as follows:
2017£m
2016£m
Derivative financial assetsNon-current 287.7 537.7Current 194.8 1,615.0
482.5 2,152.7Derivative liabilities
Non-current (347.5) (857.5)Current (48.3) (1,783.8)
Total derivative liabilities (395.8) (2,641.3)
Net asset/(liability) 86.7 (488.6)
Information on the Group’s financial risk management and the fair value of financial instruments is available at A6 and A7.
12. Commitments and contingenciesGuarantees, indemnities and other contingent liabilitiesSSE plc has provided guarantees on behalf of subsidiary, joint venture and associated undertakings as follows:
2017 2016
SSE on behalf of subsidiary
£m
SSE on behalf of joint operations
and ventures£m
SSE on behalf of partnerships
£mTotal
£mTotal
£m
Bank borrowing 654.4 – – 654.4 352.2Performance of contracts 1,526.6 258.0 0.7 1,785.3 1,357.6 Purchase of gas 10.0 – – 10.0 10.0
Subsidiaries have provided guarantees on behalf of the Company as follows:2017
£m2016
£m
Bank borrowing 1,773.9 1,971.1
In the year to 31 March 2017, the Group had drawn down £50m from it’s European Investment Bank facility. SSE Plc had entered into a guarantee with the European Investment Bank in relation to this facility to guarantee the obligations of Scottish Hydro Electric Transmission Plc. In relation to bank borrowings the guarantee amounts outlined include accrued interest.
Unlimited guarantees have been provided on behalf of subsidiary undertakings in relation to eight contracts in respect of performance of work and any liabilities arising. SSE Services Plc, a wholly owned subsidiary of the Company, has provided a guarantee to Group Trustee Independent Trustees in respect of Southern Electric Group of the Electricity Supply Pension Scheme in respect of funding required by the Scheme. SSE Contracting Limited, a wholly owned subsidiary, has provided a guarantee to Tay Street Lighting (Leeds) Ltd, Tay Valley Lighting (Newcastle & North Tayside) Ltd and Tay Valley Lighting (Stroke on Trent) Ltd in respect of provision and maintenance of public street lighting and illuminated traffic signage. SSE E&P (UK) Limited, a wholly owned subsidiary of the Company, has provided a guarantee to Hess Limited in respect of decommissioning liabilities. SSE E&P (UK) Limited has also provided a guarantee to Britoil Limited and Arco British Limited in respect of the acquisition of the Sean Field. SSE E&P (UK) Limited has also provided a guarantee to Perenco UK Limited in respect of a Sale and Purchase Agreement for the Minerva, Apollo and Mercury Fields. Scottish Hydro Electric Transmission Plc, a wholly owned subsidiary of the Company, has provided a guarantee to ABB Limited in connection with the use of HVDC Replica Control Panels for Caithness-Moray Project.
Where the Company enters into financial guarantee contracts to guarantee indebtedness of the other companies within its group, the Company considers these to be insurance arrangements, and accounts for them as such. In this respect, the Company treats the guarantee contract as a contingent liability until such time as it becomes probable that the Company will be required to make payment under the guarantee.
Notes to the Company financial statements continued
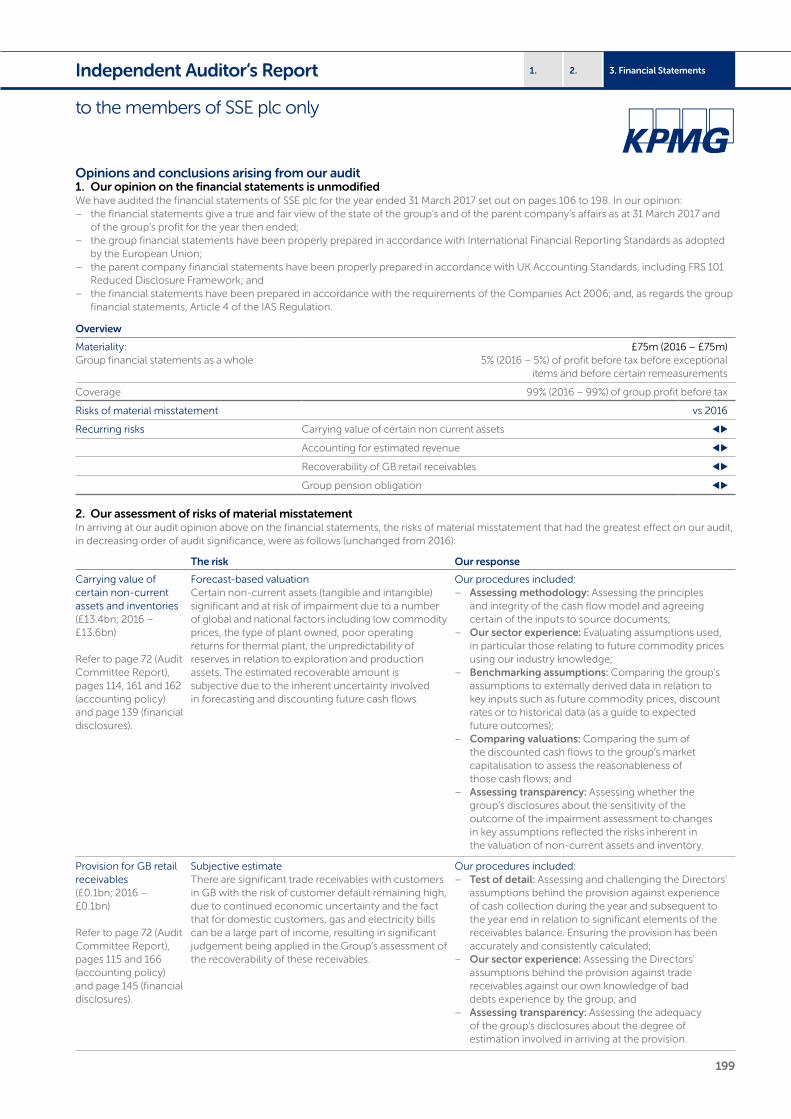
199
3. Financial Statements2.1.Independent Auditor’s Report
to the members of SSE plc only
Opinions and conclusions arising from our audit1. Our opinion on the financial statements is unmodifiedWe have audited the financial statements of SSE plc for the year ended 31 March 2017 set out on pages 106 to 198. In our opinion:
– the financial statements give a true and fair view of the state of the group’s and of the parent company’s affairs as at 31 March 2017 and of the group’s profit for the year then ended;
– the group financial statements have been properly prepared in accordance with International Financial Reporting Standards as adopted by the European Union;
– the parent company financial statements have been properly prepared in accordance with UK Accounting Standards, including FRS 101 Reduced Disclosure Framework; and
– the financial statements have been prepared in accordance with the requirements of the Companies Act 2006; and, as regards the group financial statements, Article 4 of the IAS Regulation.
Overview
Materiality: Group financial statements as a whole
£75m (2016 – £75m)5% (2016 – 5%) of profit before tax before exceptional
items and before certain remeasurements
Coverage 99% (2016 – 99%) of group profit before tax
Risks of material misstatement vs 2016
Recurring risks Carrying value of certain non current assets
Accounting for estimated revenue
Recoverability of GB retail receivables
Group pension obligation
2. Our assessment of risks of material misstatementIn arriving at our audit opinion above on the financial statements, the risks of material misstatement that had the greatest effect on our audit, in decreasing order of audit significance, were as follows (unchanged from 2016):
The risk Our response
Carrying value of certain non-current assets and inventories (£13.4bn; 2016 – £13.6bn)
Refer to page 72 (Audit Committee Report), pages 114, 161 and 162 (accounting policy) and page 139 (financial disclosures).
Forecast-based valuationCertain non-current assets (tangible and intangible) significant and at risk of impairment due to a number of global and national factors including low commodity prices, the type of plant owned, poor operating returns for thermal plant, the unpredictability of reserves in relation to exploration and production assets. The estimated recoverable amount is subjective due to the inherent uncertainty involved in forecasting and discounting future cash flows.
Our procedures included: – Assessing methodology: Assessing the principles
and integrity of the cash flow model and agreeing certain of the inputs to source documents;
– Our sector experience: Evaluating assumptions used, in particular those relating to future commodity prices using our industry knowledge;
– Benchmarking assumptions: Comparing the group’s assumptions to externally derived data in relation to key inputs such as future commodity prices, discount rates or to historical data (as a guide to expected future outcomes);
– Comparing valuations: Comparing the sum of the discounted cash flows to the group’s market capitalisation to assess the reasonableness of those cash flows; and
– Assessing transparency: Assessing whether the group’s disclosures about the sensitivity of the outcome of the impairment assessment to changes in key assumptions reflected the risks inherent in the valuation of non-current assets and inventory.
Provision for GB retail receivables(£0.1bn; 2016 – £0.1bn)
Refer to page 72 (Audit Committee Report), pages 115 and 166 (accounting policy) and page 145 (financial disclosures).
Subjective estimateThere are significant trade receivables with customers in GB with the risk of customer default remaining high, due to continued economic uncertainty and the fact that for domestic customers, gas and electricity bills can be a large part of income, resulting in significant judgement being applied in the Group’s assessment of the recoverability of these receivables.
Our procedures included: – Test of detail: Assessing and challenging the Directors’
assumptions behind the provision against experience of cash collection during the year and subsequent to the year end in relation to significant elements of the receivables balance. Ensuring the provision has been accurately and consistently calculated;
– Our sector experience: Assessing the Directors’ assumptions behind the provision against trade receivables against our own knowledge of bad debts experience by the group; and
– Assessing transparency: Assessing the adequacy of the group’s disclosures about the degree of estimation involved in arriving at the provision.
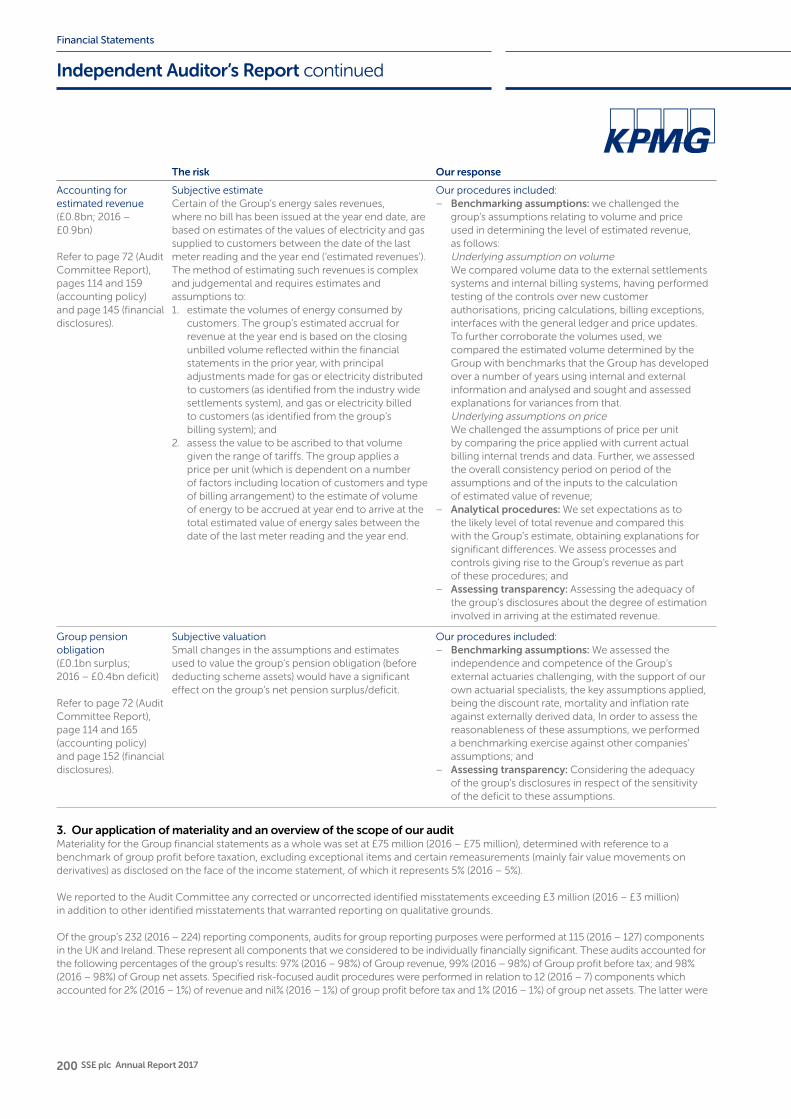
200 SSE plc Annual Report 2017
Financial Statements
The risk Our response
Accounting for estimated revenue(£0.8bn; 2016 – £0.9bn)
Refer to page 72 (Audit Committee Report), pages 114 and 159 (accounting policy) and page 145 (financial disclosures).
Subjective estimateCertain of the Group’s energy sales revenues, where no bill has been issued at the year end date, are based on estimates of the values of electricity and gas supplied to customers between the date of the last meter reading and the year end (‘estimated revenues’). The method of estimating such revenues is complex and judgemental and requires estimates and assumptions to: 1. estimate the volumes of energy consumed by
customers. The group’s estimated accrual for revenue at the year end is based on the closing unbilled volume reflected within the financial statements in the prior year, with principal adjustments made for gas or electricity distributed to customers (as identified from the industry wide settlements system), and gas or electricity billed to customers (as identified from the group’s billing system); and
2. assess the value to be ascribed to that volume given the range of tariffs. The group applies a price per unit (which is dependent on a number of factors including location of customers and type of billing arrangement) to the estimate of volume of energy to be accrued at year end to arrive at the total estimated value of energy sales between the date of the last meter reading and the year end.
Our procedures included: – Benchmarking assumptions: we challenged the
group’s assumptions relating to volume and price used in determining the level of estimated revenue, as follows:
Underlying assumption on volume We compared volume data to the external settlements
systems and internal billing systems, having performed testing of the controls over new customer authorisations, pricing calculations, billing exceptions, interfaces with the general ledger and price updates.
To further corroborate the volumes used, we compared the estimated volume determined by the Group with benchmarks that the Group has developed over a number of years using internal and external information and analysed and sought and assessed explanations for variances from that.
Underlying assumptions on price We challenged the assumptions of price per unit
by comparing the price applied with current actual billing internal trends and data. Further, we assessed the overall consistency period on period of the assumptions and of the inputs to the calculation of estimated value of revenue;
– Analytical procedures: We set expectations as to the likely level of total revenue and compared this with the Group’s estimate, obtaining explanations for significant differences. We assess processes and controls giving rise to the Group’s revenue as part of these procedures; and
– Assessing transparency: Assessing the adequacy of the group’s disclosures about the degree of estimation involved in arriving at the estimated revenue.
Group pension obligation(£0.1bn surplus; 2016 – £0.4bn deficit)
Refer to page 72 (Audit Committee Report), page 114 and 165 (accounting policy) and page 152 (financial disclosures).
Subjective valuationSmall changes in the assumptions and estimates used to value the group’s pension obligation (before deducting scheme assets) would have a significant effect on the group’s net pension surplus/deficit.
Our procedures included: – Benchmarking assumptions: We assessed the
independence and competence of the Group’s external actuaries challenging, with the support of our own actuarial specialists, the key assumptions applied, being the discount rate, mortality and inflation rate against externally derived data, In order to assess the reasonableness of these assumptions, we performed a benchmarking exercise against other companies’ assumptions; and
– Assessing transparency: Considering the adequacy of the group’s disclosures in respect of the sensitivity of the deficit to these assumptions.
3. Our application of materiality and an overview of the scope of our auditMateriality for the Group financial statements as a whole was set at £75 million (2016 – £75 million), determined with reference to a benchmark of group profit before taxation, excluding exceptional items and certain remeasurements (mainly fair value movements on derivatives) as disclosed on the face of the income statement, of which it represents 5% (2016 – 5%).
We reported to the Audit Committee any corrected or uncorrected identified misstatements exceeding £3 million (2016 – £3 million) in addition to other identified misstatements that warranted reporting on qualitative grounds.
Of the group’s 232 (2016 – 224) reporting components, audits for group reporting purposes were performed at 115 (2016 – 127) components in the UK and Ireland. These represent all components that we considered to be individually financially significant. These audits accounted for the following percentages of the group’s results: 97% (2016 – 98%) of Group revenue, 99% (2016 – 98%) of Group profit before tax; and 98% (2016 – 98%) of Group net assets. Specified risk-focused audit procedures were performed in relation to 12 (2016 – 7) components which accounted for 2% (2016 – 1%) of revenue and nil% (2016 – 1%) of group profit before tax and 1% (2016 – 1%) of group net assets. The latter were
Independent Auditor’s Report continued
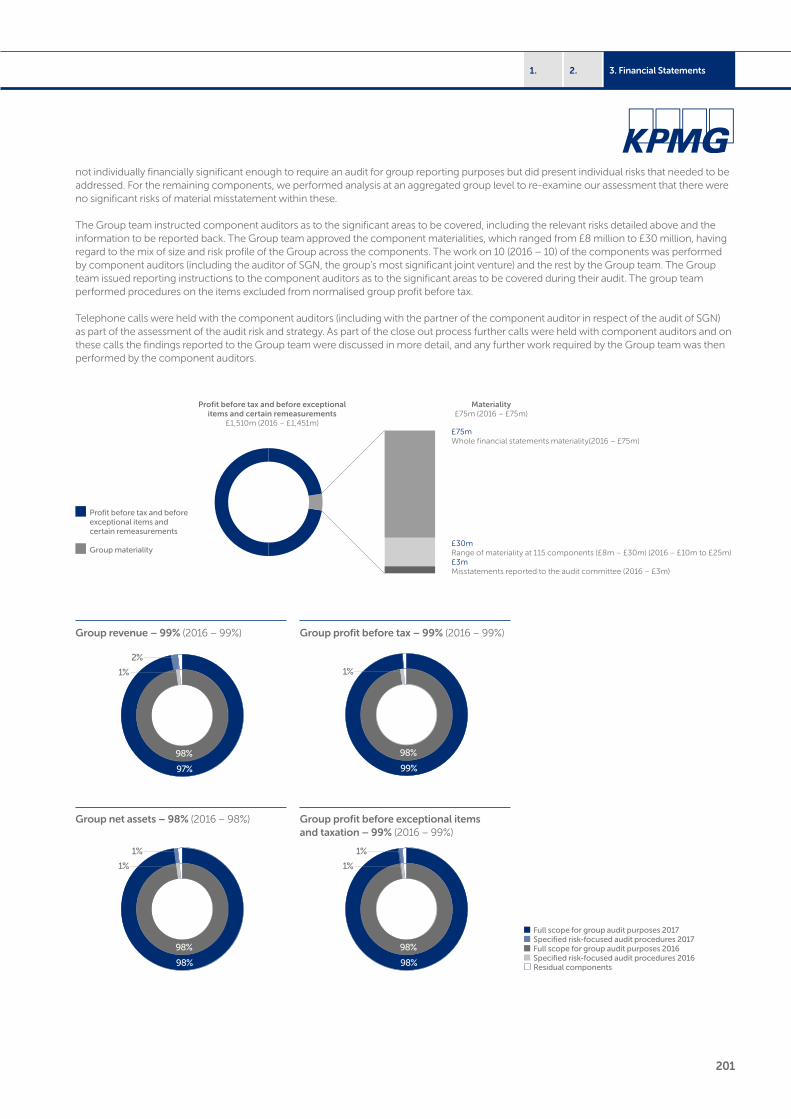
201
3. Financial Statements2.1.
98%
98%
1%
1%
98%
98%
1%
1%
97%
98%
2%
1%
99%
98%
1%
not individually financially significant enough to require an audit for group reporting purposes but did present individual risks that needed to be addressed. For the remaining components, we performed analysis at an aggregated group level to re-examine our assessment that there were no significant risks of material misstatement within these. The Group team instructed component auditors as to the significant areas to be covered, including the relevant risks detailed above and the information to be reported back. The Group team approved the component materialities, which ranged from £8 million to £30 million, having regard to the mix of size and risk profile of the Group across the components. The work on 10 (2016 – 10) of the components was performed by component auditors (including the auditor of SGN, the group’s most significant joint venture) and the rest by the Group team. The Group team issued reporting instructions to the component auditors as to the significant areas to be covered during their audit. The group team performed procedures on the items excluded from normalised group profit before tax. Telephone calls were held with the component auditors (including with the partner of the component auditor in respect of the audit of SGN) as part of the assessment of the audit risk and strategy. As part of the close out process further calls were held with component auditors and on these calls the findings reported to the Group team were discussed in more detail, and any further work required by the Group team was then performed by the component auditors.
£75mWhole financial statements materiality(2016 – £75m)
£30mRange of materiality at 115 components (£8m – £30m) (2016 – £10m to £25m)£3mMisstatements reported to the audit committee (2016 – £3m)
Profit before tax and before exceptional items and certain remeasurements
£1,510m (2016 – £1,451m)
Materiality£75m (2016 – £75m)
Profit before tax and before exceptional items and certain remeasurements
Group materiality
Group revenue – 99% (2016 – 99%) Group profit before tax – 99% (2016 – 99%)
Group net assets – 98% (2016 – 98%) Group profit before exceptional items and taxation – 99% (2016 – 99%)
Full scope for group audit purposes 2017 Specified risk-focused audit procedures 2017 Full scope for group audit purposes 2016 Specified risk-focused audit procedures 2016 Residual components
202 SSE plc Annual Report 2017
Financial Statements
4. Our opinion on other matters prescribed by the Companies Act 2006 is unmodifiedIn our opinion:
– the part of the Directors’ Remuneration Report to be audited has been properly prepared in accordance with the Companies Act 2006; and – the information given in the Strategic Report and the Directors’ Report for the financial year is consistent with the financial statements.
Based solely on the work required to be undertaken in the course of the audit of the financial statements and from reading the Strategic Report and the Directors’ Report:
– we have not identified material misstatements in those reports; and – in our opinion, those reports have been prepared in accordance with the Companies Act 2006.
5. We have nothing to report on the disclosures of principal risksBased on the knowledge we acquired during our audit, we have nothing material to add or draw attention to in relation to:
– the directors’ statement on longer-term viability on pages 24 to 27, concerning the principal risks, their management, and, based on that, the directors’ assessment and expectations of the group’s continuing in operation over the 3 years to 2020; or
– the disclosures in Note 1 of the financial statements concerning the use of the going concern basis of accounting.
6. We have nothing to report in respect of the matters on which we are required to report by exceptionUnder ISAs (UK and Ireland) we are required to report to you if, based on the knowledge we acquired during our audit, we have identified other information in the annual report that contains a material inconsistency with either that knowledge or the financial statements, a material misstatement of fact, or that is otherwise misleading.
In particular, we are required to report to you if: – we have identified material inconsistencies between the knowledge we acquired during our audit and the directors’ statement that
they consider that the annual report and financial statements taken as a whole is fair, balanced and understandable and provides the information necessary for shareholders to assess the group’s position and performance, business model and strategy; or
– the Report of the Audit Committee does not appropriately address matters communicated by us to the audit committee.
Under the Companies Act 2006 we are required to report to you if, in our opinion: – adequate accounting records have not been kept by the parent company, or returns adequate for our audit have not been received from
branches not visited by us; or – the parent company financial statements and the part of the Directors’ Remuneration Report to be audited are not in agreement with the
accounting records and returns; or – certain disclosures of directors’ remuneration specified by law are not made; or – we have not received all the information and explanations we require for our audit.
Under the Listing Rules we are required to review: – the Directors’ Statement, set out on pages 72 and 27 respectively, in relation to going concern and longer-term viability; and – the part of the Corporate Governance Statement on pages 54 to 97 relating to the company’s compliance with the eleven provisions of
the 2014 UK Corporate Governance Code specified for our review.
We have nothing to report in respect of the above responsibilities.
Scope and responsibilitiesAs explained more fully in the Directors’ Responsibilities Statement set out on page 100, the directors are responsible for the preparation of the financial statements and for being satisfied that they give a true and fair view. A description of the scope of an audit of financial statements is provided on the Financial Reporting Council’s website at www.frc.org.uk/auditscopeukprivate. This report is made solely to the Company’s members as a body and is subject to important explanations and disclaimers regarding our responsibilities, published on our website at www.kpmg.com/uk/auditscopeukco2014a, which are incorporated into this report as if set out in full and should be read to provide an understanding of the purpose of this report, the work we have undertaken and the basis of our opinions.
William Meredith (Senior Statutory Auditor)for and on behalf of KPMG LLP, Statutory Auditor Chartered Accountants319 St Vincent StreetGlasgow, G2 5AS
16 May 2017
Independent Auditor’s Report continued

203
3. Financial Statements2.1.Notes

204 SSE plc Annual Report 2017
Financial Statements
Notes
Shareholder information
Shareholder enquiriesThe Company’s register of members is maintained by our appointed Registrar, Capita Asset Services. Shareholders with queries relating to their shareholdings should contact Capita directly:
Capita Asset ServicesShareholder SolutionsThe Registry34 Beckenham RoadBeckenhamKentBR3 4TU
Telephone: 0345 143 4005Email: [email protected]
Financial calendar
Publication of Annual Report 16 June 2017
AGM (Perth) and Trading Statement 20 July 2017
Ex-dividend date for final dividend 27 July 2017
Record Date for final dividend 28 July 2017
Final date for Scrip elections 25 August 2017
Payment date 22 September 2017
Notification of Close Period by 30 September 2017
Results for six months to 30 September 08 November 2017
WebsiteSSE’s website, sse.com, contains a wide range of information including a dedicated investors section where you can find further information about shareholder services including:
– share price information; – dividend history and trading graphs – the Scrip Dividend Scheme; – telephone and internet share dealing; and – downloadable shareholder forms.
Digital newsSSE use a dedicated news and views website (available at www.sse.com/newsandviews) and Twitter (www.twitter.com/sse) to keep shareholders, investors, journalists, employees and other interested parties up-to-date with news from the Company.
DividendsThe Company typically pays dividends twice yearly. Interim dividends, are paid in March, and final dividends are paid in September once approved by shareholders at the AGM. SSE encourages its shareholders to have dividends paid directly into their bank/building society account, to ensure secure payment of funds on payment date whilst reducing the environmental impact through reduced print and paper use. Shareholders who elect to receive their dividend payment in this way will only receive an annual dividend confirmation at the end of each financial year. Any shareholder who requires a separate dividend confirmation for each dividend payment should contact Capita Asset Services.
Manage your shares online/ eCommunications ProgrammeTo manage your holding online, simply register through the Signal Portal, the online platform provided by Capita Registrars www.sse-shares.com/welcome which allows shareholders to:
– view their shareholding; – have dividends paid into their bank account; – update personal details; – sign up for electronic shareholder communication; – buy and sell shares online using Capita’s share dealing service; and – vote in advance of company general meetings.
If you have not used this service before, you will require your Investor Code (IVC) to register. You will find this on your share certificate or on recent items of communication.
SSE encourages its shareholders to elect for electronic communications. By joining our eCommunications Programme, shareholders can help us to reduce our impact on the environment and save paper by choosing to receive shareholder documents electronically. Shareholders are notified by email that documents such as the Annual Report or Notice of Annual General Meeting are available on our website.
Amalgamation of multiple share accountsMany shareholders receive several copies of the annual report and dividend documentation who could merge their shareholdings. If you receive more than one copy of these documents you could help SSE reduce its impact on the environment and save paper by merging your accounts into one. Please contact Capita Asset Services to amalgamate your accounts.
Keep us informedKeep us informed of changes to your email address by visiting www.sse.com/investors/ecommsprogramme and follow the instructions under ‘how to register or update your email address’.

For further information about SSE, please contact:
SSE plcCorporate AffairsInveralmond House200 Dunkeld RoadPerth PH1 3AQUKTel: +44 (0)1738 456000Email: [email protected] Registered in Scotland No. 117119
sse.comFollow the latest news from SSE on Twitter at: www.twitter.com/sse
@SSE
STOCK CODE 008229
SSE plc A
nn
ual R
epo
rt 20
17