Embed Size (px)
Citation preview

SSA Hearing on Compassionate Allowances
Janet N Scheel MD
November 9,2010

Cardiomyopathy
• Restrictive cardiomyopathy
• Hypertrophic cardiomyopathy
• Dilated cardiomyopathy*


Frank Starling Curve

Causes of DCM in Children
• Genetic
• Infectious
• Metabolic
• Arrhythmias
Causes of DCM in Children
• Inflammatory
• Nutritional
• Structural heart disease
• Chemotherapy
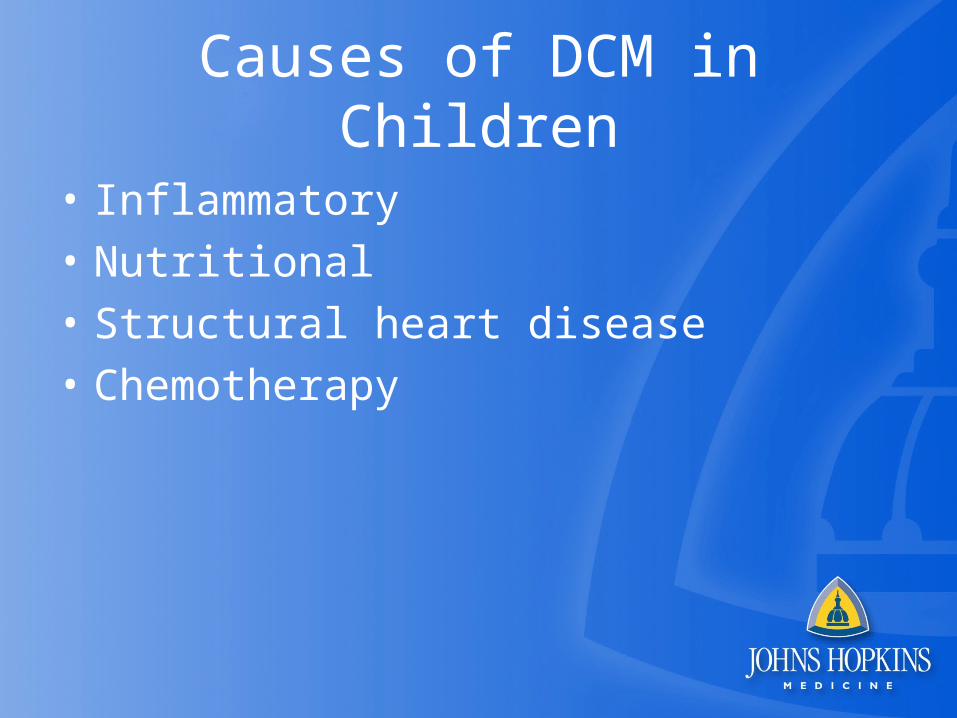
CHF symptoms in Adults
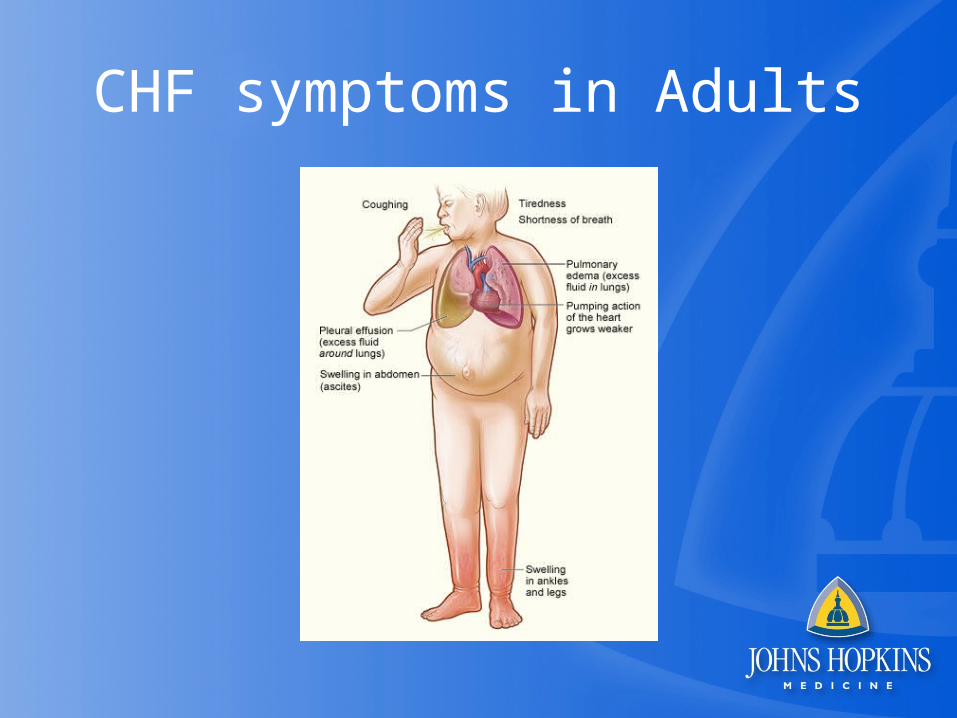
CHF Symptoms in ChildrenRoss Classification
• Class I- no symptoms
• Class II-Mild tachypnea or diaphoresis with feedings/exertion. No growth failure
• Class III-Marked tachypnea or diaphoresis with feedings/exertion;prolonged feeding time;growth failure
• Class IV-Symptomatic at rest
Treatment options
• Oral medical therapy
• IV inotropes
• Pacing
• ECMO/VAD
• Transplant

ECMO

ECMO

Long – term devices specific for children

Selection for Pediatric Heart Transplant
• End stage congenital heart disease not amenable to surgical or medical therapy– Ross Classification III-IV– Failure to thrive– Protein losing enteropathy– Intractable arrhythmias– Plastic bronchitis

Selection for Pediatric Heart Transplant
• Dilated Cardiomyopathy –symptomatic on maximal medical therapy
• Restrictive Cardiomyopathy
Exclusion Criteria
• Genetic syndrome with poor long term prognosis
• Neurologic abnormalities with poor long term prognosis
• Irreversible end-organ damage
• Socio-economic factors leading to poor long term compliance

Exclusion Criteria
• Genetic syndrome with poor long term prognosis
• Neurologic abnormalities with poor long term prognosis
• Irreversible end-organ damage
• Socio-economic factors leading to poor long term compliance

Exclusion Criteria
• Pulmonary Hypertension (>5-6 woods units)– Unresponsive to oxygen or pulmonary vasodilators– Transpulmonary gradient > 15mmHg
• Pulmonary vein stenosis
• Active infection
• Active malignancy

AGE DISTRIBUTION OF PEDIATRIC HEART RECIPIENTS
By Year of Transplant
0
50
100
150
200
250
300
350
400
450
500
1982
1983
1984
1985
1986
1987
1988
1989
1990
1991
1992
1993
1994
1995
1996
1997
1998
1999
2000
2001
2002
2003
2004
2005
2006
2007
11-17 Years
1-10 Years
<1 Year
Nu
mb
er
of
Tra
ns
pla
nts
ISHLT
NOTE: This figure includes only the heart transplants that are reported to the ISHLT Transplant Registry. As such, this should not be construed as evidence that the number of hearts transplanted worldwide has increased and/or decreased in recent years.
2009
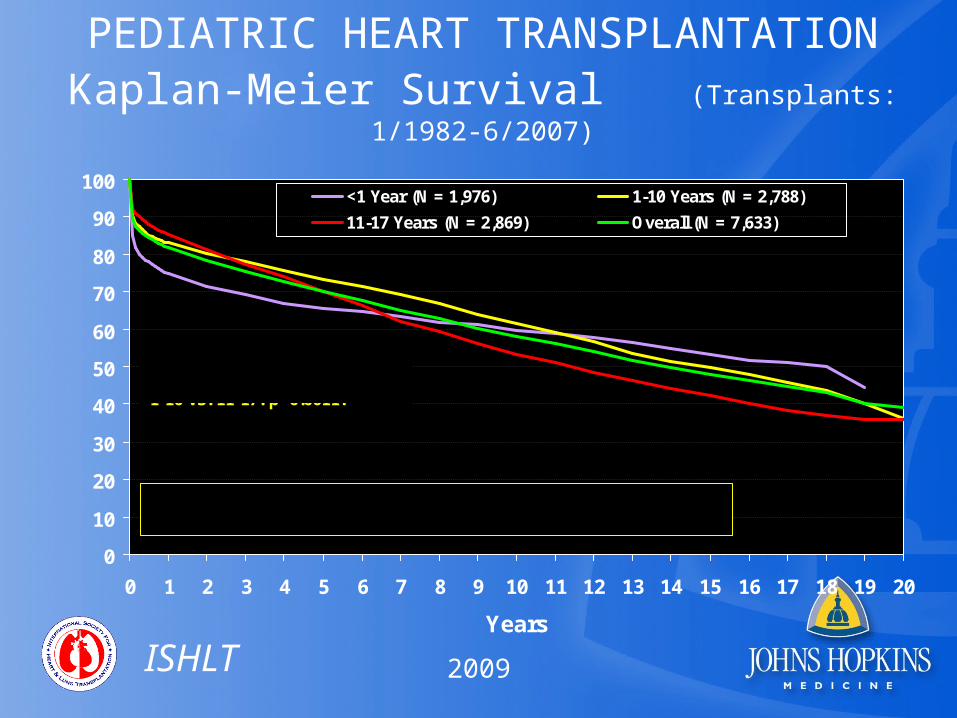
PEDIATRIC HEART TRANSPLANTATIONKaplan-Meier Survival (Transplants: 1/1982-6/2007)
0
10
20
30
40
50
60
70
80
90
100
0 1 2 3 4 5 6 7 8 9 10 11 12 13 14 15 16 17 18 19 20
Years
<1 Year (N = 1,976) 1-10 Years (N = 2,788)
11-17 Years (N = 2,869) Overall (N = 7,633)
0-<1 vs. 1-10: p = 0.0007; 0-<1 vs. 11-17: p=0.4922; 1-10 vs. 11-17: p=0.0011.
Half-life <1: 18.4 Years; 1-10: 14.7 Years; 11-17: 11.1 Years
Su
rviv
al (
%)
ISHLT
2009
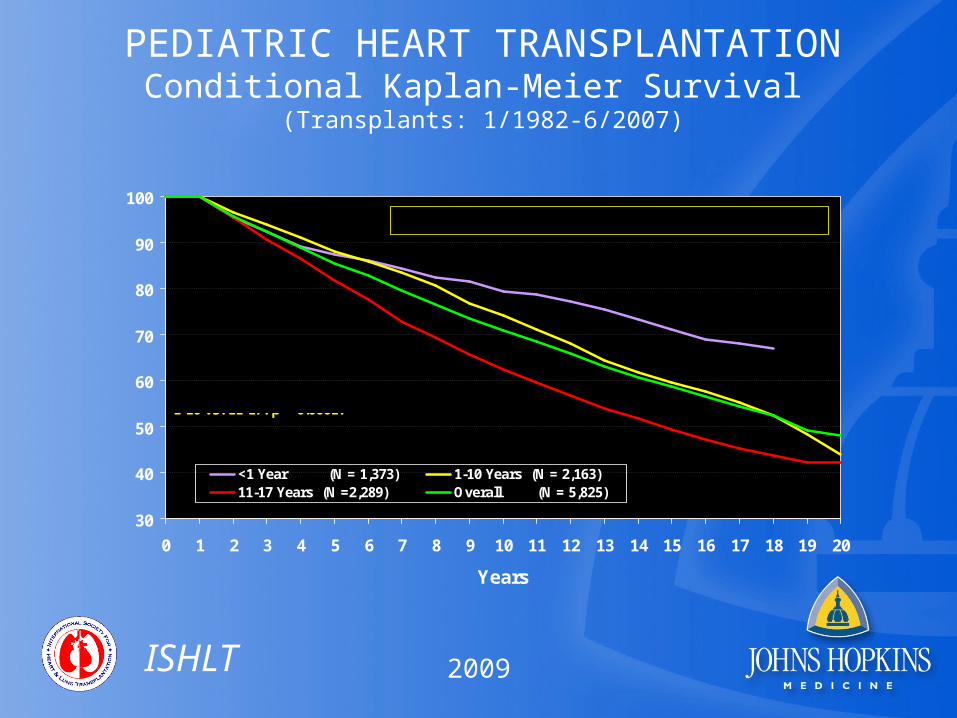
PEDIATRIC HEART TRANSPLANTATIONConditional Kaplan-Meier Survival
(Transplants: 1/1982-6/2007)
30
40
50
60
70
80
90
100
0 1 2 3 4 5 6 7 8 9 10 11 12 13 14 15 16 17 18 19 20
Years
<1 Year (N = 1,373) 1-10 Years (N = 2,163)11-17 Years (N =2,289) Overall (N = 5,825)
0-<1 vs. 1-10: p = 0.0044; 0-<1 vs. 11-17: p < 0.0001;1-10 vs. 11-17: p < 0.0001.
Half-life: <1: n.c.; 1-10: 18.5 Years; 11-17: 14.7 Years
Su
rviv
al (
%)
ISHLT
2009

PEDIATRIC HEART TRANSPLANTATIONConditional Kaplan-Meier Survival for Recent Era
(Transplants: 1/1999-6/2007)
50
60
70
80
90
100
0 1 2 3 4 5 6 7
Years
<1 Year (N = 606) 1-10 Years (N =1,033)
11-17 Years (N = 1,062) Overall (N = 2,701)
0-<1 vs. 1-10: p = 0.1610;0-<1 vs. 11-17: p = 0.0014; 1-10 vs. 11-17: p < 0.0001
Su
rviv
al (
%)
ISHLT
2009
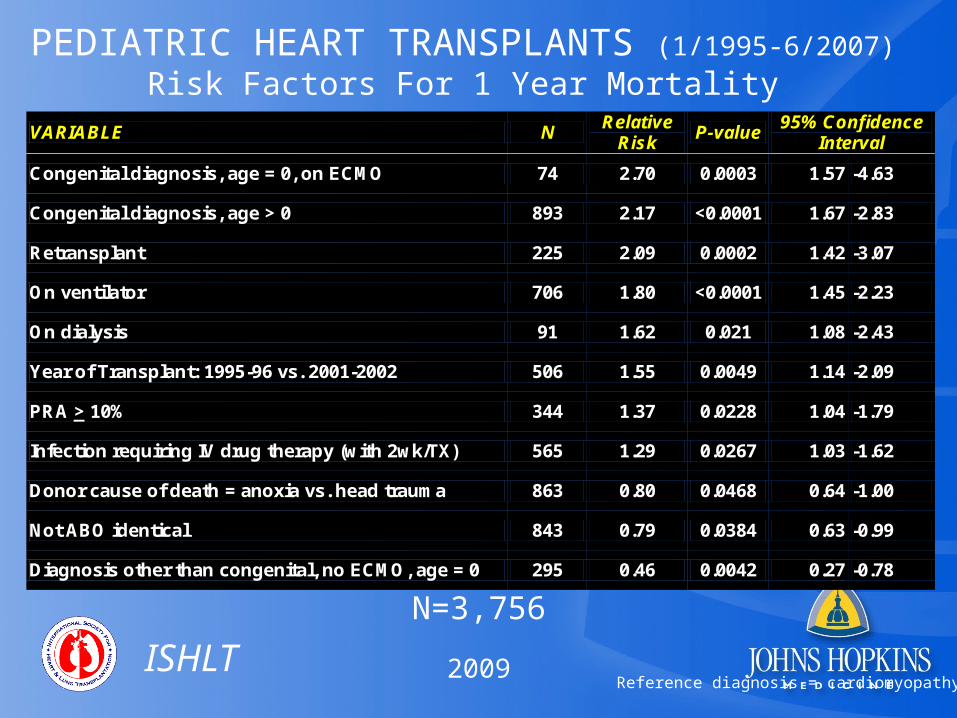
PEDIATRIC HEART TRANSPLANTS (1/1995-6/2007)
Risk Factors For 1 Year Mortality
N=3,756
VARIABLE N Relative
Risk P-value
95% Confidence Interval
Congenital diagnosis, age = 0, on ECMO 74 2.70 0.0003 1.57 -4.63
Congenital diagnosis, age > 0 893 2.17 <0.0001 1.67 -2.83
Retransplant 225 2.09 0.0002 1.42 -3.07
On ventilator 706 1.80 <0.0001 1.45 -2.23
On dialysis 91 1.62 0.021 1.08 -2.43
Year of Transplant: 1995-96 vs. 2001-2002 506 1.55 0.0049 1.14 -2.09
PRA > 10% 344 1.37 0.0228 1.04 -1.79
Infection requiring IV drug therapy (with 2wk/TX) 565 1.29 0.0267 1.03 -1.62
Donor cause of death = anoxia vs. head trauma 863 0.80 0.0468 0.64 -1.00
Not ABO identical 843 0.79 0.0384 0.63 -0.99
Diagnosis other than congenital, no ECMO, age = 0 295 0.46 0.0042 0.27 -0.78
ISHLT
Reference diagnosis = cardiomyopathy2009
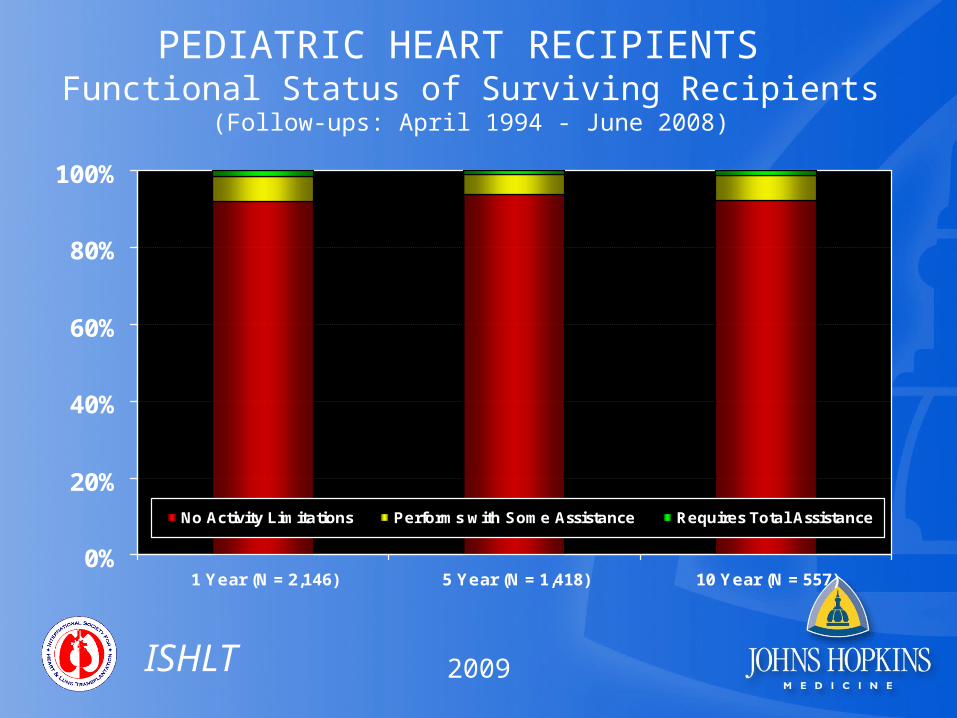
PEDIATRIC HEART RECIPIENTS Functional Status of Surviving Recipients
(Follow-ups: April 1994 - June 2008)
0%
20%
40%
60%
80%
100%
1 Year (N = 2,146) 5 Year (N = 1,418) 10 Year (N = 557)
No Activity Limitations Performs with Some Assistance Requires Total Assistance
ISHLT
2009

PEDIATRIC HEART RECIPIENTS Functional Status of Surviving Recipients
(Follow-ups: April 1994 - June 2008)For the Same Patients
0%
20%
40%
60%
80%
100%
1 Year (N = 758) 3 Year (N = 758) 5 Year (N = 758)
No Activity Limitations Performs with Some Assistance Requires Total Assistance
ISHLT
2009

PEDIATRIC HEART RECIPIENTS Rehospitalization Post-transplant of Surviving Recipients
(Follow-ups: April 1994 - June 2008)
0%
20%
40%
60%
80%
100%
1 Year (N = 3,431) 5 Years (N =2,143) 10 Years (N = 944)
No Hospitalization Hospitalized, Not Rejection/Not Infection
Hospitalized, Rejection Hospitalized, Infection Only
Hospitalized, Rejection + Infection
ISHLT
2009
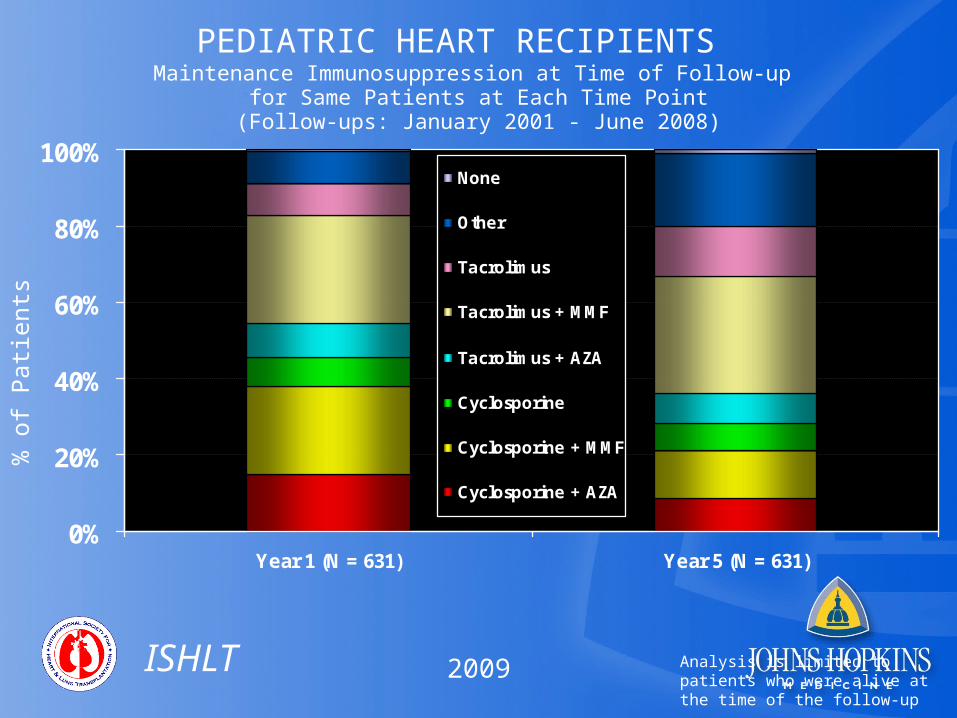
PEDIATRIC HEART RECIPIENTS Maintenance Immunosuppression at Time of Follow-up
for Same Patients at Each Time Point(Follow-ups: January 2001 - June 2008)
% o
f Pa
tien
ts
ISHLT
0%
20%
40%
60%
80%
100%
Year 1 (N = 631) Year 5 (N = 631)
None
Other
Tacrolimus
Tacrolimus + MMF
Tacrolimus + AZA
Cyclosporine
Cyclosporine + MMF
Cyclosporine + AZA
Analysis is limited to patients who were alive at the time of the follow-up2009

FREEDOM FROM CORONARY ARTERY VASCULOPATHY For Pediatric Heart Recipients (Follow-ups: April 1994 - June 2008)
50
60
70
80
90
100
0 1 2 3 4 5 6 7 8 9 10
Years
% F
ree
do
m f
rom
CA
V
ISHLT
2009

GRAFT SURVIVAL FOLLOWING REPORT OF CORONARY ARTERY VASCULOPATHY
For Pediatric Heart Recipients (Follow-ups: April 1994 - June 2008)Stratified by Age Group
0
10
20
30
40
50
60
70
80
90
100
0 0.5 1 1.5 2 2.5 3 3.5 4
Time since Report of CAV (Years)
<1 Year (N = 80)
1-10 Years (N = 135)
11-17 Years (N = 176)
p = 0.8363
Su
rviv
al s
ince
Rep
ort
of
CA
V (
%)
ISHLT
2009
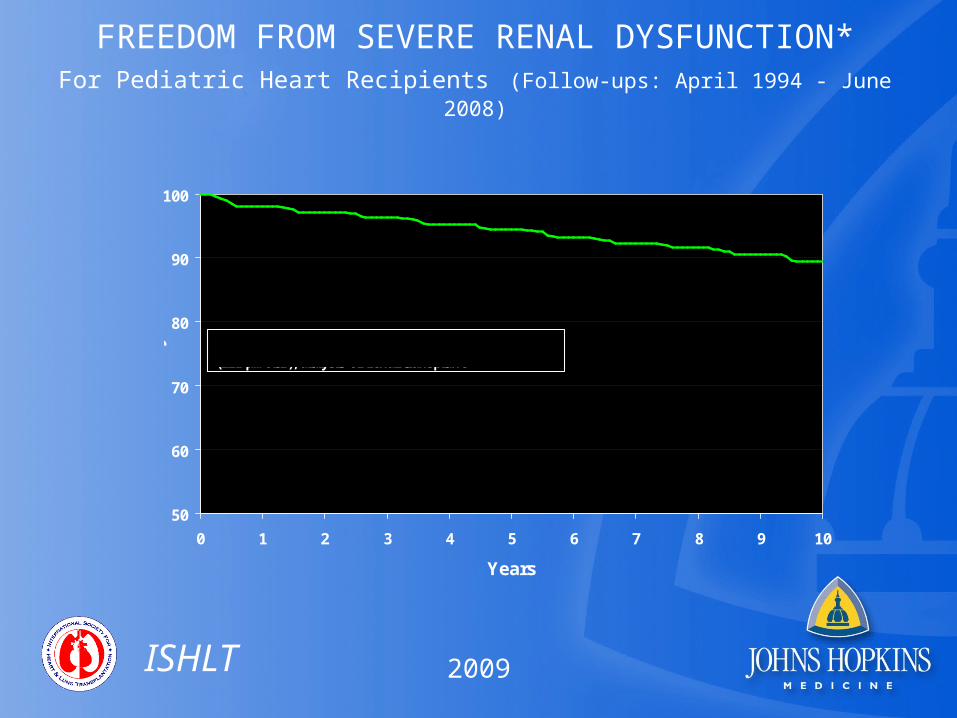
FREEDOM FROM SEVERE RENAL DYSFUNCTION*For Pediatric Heart Recipients (Follow-ups: April 1994 - June 2008)
50
60
70
80
90
100
0 1 2 3 4 5 6 7 8 9 10
Years
% F
ree
do
m f
rom
Se
ve
re
Re
na
l Dy
sfu
nc
tio
n
* Severe renal dysfunction = Creatinine > 2.5 mg/dl (221 μmol/L), dialysis or renal transplant
ISHLT
2009

MALIGNANCY POST-HEART TRANSPLANTATION FOR PEDIATRICSCumulative Prevalence in Survivors (Follow-ups: April 1994 - June 2008)
Malignancy/Type 1-Year Survivors
5-Year Survivors
10-Year Survivors
No Malignancy 3,361 (98.1%) 1,343 (95.2%) 332 (92.2%)
Malignancy (all types combined) 64 (1.9%) 68 (4.8%) 28 (7.8%)
Malignancy Type
Lymph 59 64 26
Other 4 5 2
Skin 1
Type Not Reported 1
ISHLT
NOTE: Multiple types may be reported; sum of types may be greater than total number with malignancy.
2009
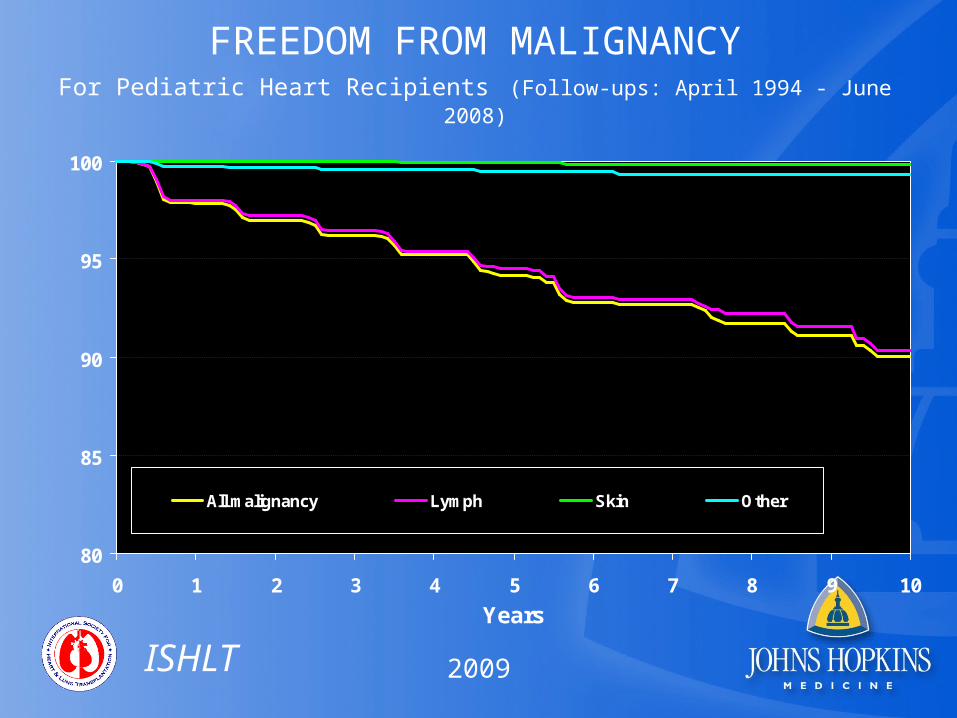
FREEDOM FROM MALIGNANCYFor Pediatric Heart Recipients (Follow-ups: April 1994 - June 2008)
80
85
90
95
100
0 1 2 3 4 5 6 7 8 9 10
Years
All malignancy Lymph Skin Other% F
ree
do
m f
rom
Ma
lign
an
cy
ISHLT
2009
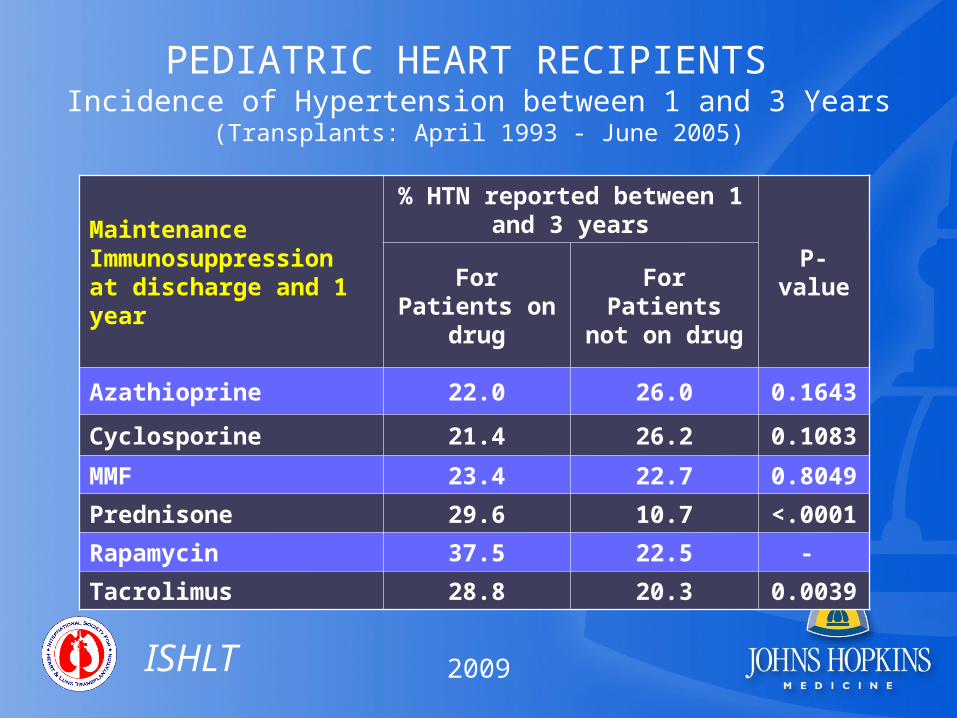
PEDIATRIC HEART RECIPIENTS Incidence of Hypertension between 1 and 3 Years
(Transplants: April 1993 - June 2005)
Maintenance Immunosuppression at discharge and 1 year
% HTN reported between 1 and 3 years
P-valueFor Patients
on drugFor Patients not on drug
Azathioprine 22.0 26.0 0.1643
Cyclosporine 21.4 26.2 0.1083
MMF 23.4 22.7 0.8049
Prednisone 29.6 10.7 <.0001
Rapamycin 37.5 22.5 -
Tacrolimus 28.8 20.3 0.0039
ISHLT
2009

PEDIATRIC HEART RECIPIENTS Incidence of Hypertension between 3 and 8 Years
(Transplants: April 1993 - June 2000)
Maintenance Immunosuppression at discharge and 1 year
% HTN reported between 3 and 8 years
P-valueFor Patients
on drugFor Patients not on drug
Azathioprine 37.5 48.9 0.1623
Cyclosporine 36.5 43.8 0.4302
MMF 41.4 37.6 0.6949
Prednisone 47.1 20.2 <.0001
Rapamycin . 37.6 -
Tacrolimus 42.3 34.8 0.4484
ISHLT
2009

PEDIATRIC HEART TRANSPLANT RECIPIENTS: Cause of Death (Deaths: January 1992 - June 2008)
CAUSE OF DEATH 0-30 Days (N = 461)
31 Days - 1 Year (N =
421)
>1 Year - 3 Years (N = 307)
>3 Years - 5 Years (N = 226)
>5 Years - 10 Years (N = 350)
>10 Years (N = 172)
CORONARY ARTERY VASCULOPATHY
5 (1.1%) 30 (7.1%) 62 (20.2%) 69 (30.5%) 98 (28.0%) 49 (28.5%)
ACUTE REJECTION 44 (9.5%) 100 (23.8%) 71 (23.1%) 31 (13.7%) 45 (12.9%) 10 (5.8%)
LYMPHOMA 10 (2.4%) 12 (3.9%) 6 (2.7%) 33 (9.4%) 11 (6.4%)
MALIGNANCY, OTHER 4 (1.0%) 2 (0.7%) 1 (0.4%) 5 (1.4%) 11 (6.4%)
CMV 1 (0.2%) 11 (2.6%) 1 (0.3%)
INFECTION, NON-CMV 54 (11.7%) 65 (15.4%) 20 (6.5%) 8 (3.5%) 17 (4.9%) 13 (7.6%)
PRIMARY FAILURE 102 (22.1%) 23 (5.5%) 10 (3.3%) 15 (6.6%) 18 (5.1%) 5 (2.9%)
GRAFT FAILURE 97 (21.0%) 45 (10.7%) 62 (20.2%) 53 (23.5%) 74 (21.1%) 44 (25.6%)
TECHNICAL 27 (5.9%) 3 (0.7%) 2 (0.7%) 2 (0.9%) 4 (1.1%) 1 (0.6%)
OTHER 25 (5.4%) 26 (6.2%) 29 (9.4%) 24 (10.6%) 30 (8.6%) 10 (5.8%)
MULTIPLE ORGAN FAILURE
46 (10.0%) 54 (12.8%) 11 (3.6%) 6 (2.7%) 10 (2.9%) 8 (4.7%)
RENAL FAILURE 1 (0.2%) 4 (1.0%) 1 (0.3%) 1 (0.4%) 1 (0.3%) 3 (1.7%)
PULMONARY 29 (6.3%) 30 (7.1%) 15 (4.9%) 8 (3.5%) 8 (2.3%) 5 (2.9%)
CEREBROVASCULAR 30 (6.5%) 16 (3.8%) 9 (2.9%) 2 (0.9%) 7 (2.0%) 2 (1.2%)
ISHLT
2009
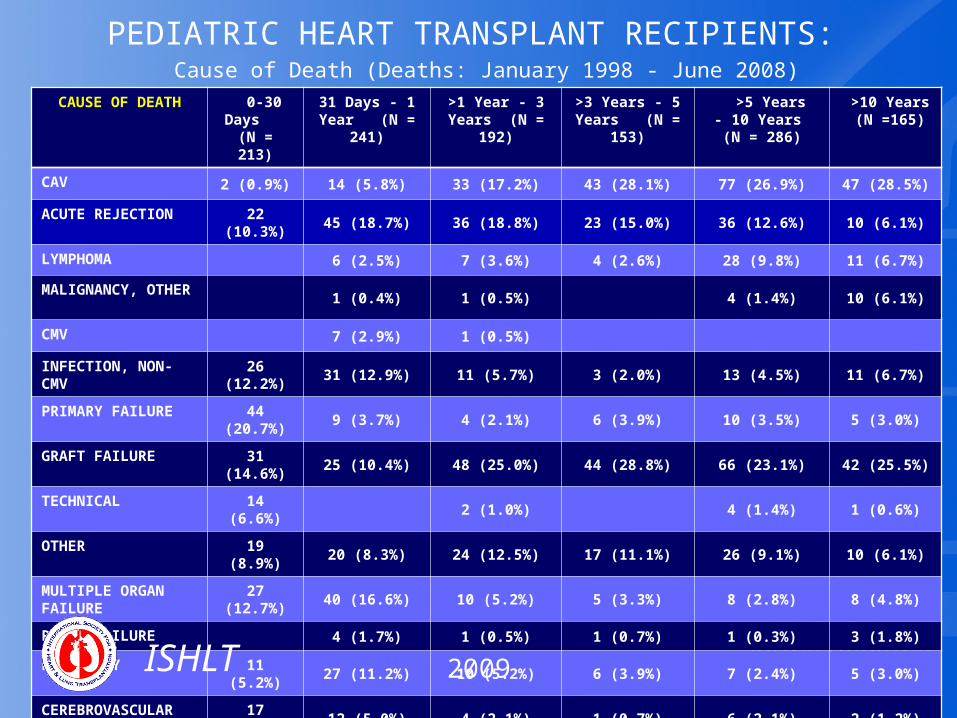
PEDIATRIC HEART TRANSPLANT RECIPIENTS: Cause of Death (Deaths: January 1998 - June 2008)
CAUSE OF DEATH 0-30 Days (N = 213)
31 Days - 1 Year (N = 241)
>1 Year - 3 Years (N = 192)
>3 Years - 5 Years (N = 153)
>5 Years - 10 Years (N = 286)
>10 Years (N =165)
CAV 2 (0.9%) 14 (5.8%) 33 (17.2%) 43 (28.1%) 77 (26.9%) 47 (28.5%)
ACUTE REJECTION 22 (10.3%) 45 (18.7%) 36 (18.8%) 23 (15.0%) 36 (12.6%) 10 (6.1%)
LYMPHOMA 6 (2.5%) 7 (3.6%) 4 (2.6%) 28 (9.8%) 11 (6.7%)
MALIGNANCY, OTHER
1 (0.4%) 1 (0.5%) 4 (1.4%) 10 (6.1%)
CMV 7 (2.9%) 1 (0.5%)
INFECTION, NON-CMV
26 (12.2%) 31 (12.9%) 11 (5.7%) 3 (2.0%) 13 (4.5%) 11 (6.7%)
PRIMARY FAILURE 44 (20.7%) 9 (3.7%) 4 (2.1%) 6 (3.9%) 10 (3.5%) 5 (3.0%)
GRAFT FAILURE 31 (14.6%) 25 (10.4%) 48 (25.0%) 44 (28.8%) 66 (23.1%) 42 (25.5%)
TECHNICAL 14 (6.6%) 2 (1.0%) 4 (1.4%) 1 (0.6%)
OTHER 19 (8.9%) 20 (8.3%) 24 (12.5%) 17 (11.1%) 26 (9.1%) 10 (6.1%)
MULTIPLE ORGAN FAILURE
27 (12.7%) 40 (16.6%) 10 (5.2%) 5 (3.3%) 8 (2.8%) 8 (4.8%)
RENAL FAILURE 4 (1.7%) 1 (0.5%) 1 (0.7%) 1 (0.3%) 3 (1.8%)
PULMONARY 11 (5.2%) 27 (11.2%) 10 (5.2%) 6 (3.9%) 7 (2.4%) 5 (3.0%)
CEREBROVASCULAR 17 (8.0%) 12 (5.0%) 4 (2.1%) 1 (0.7%) 6 (2.1%) 2 (1.2%)
ISHLT
2009
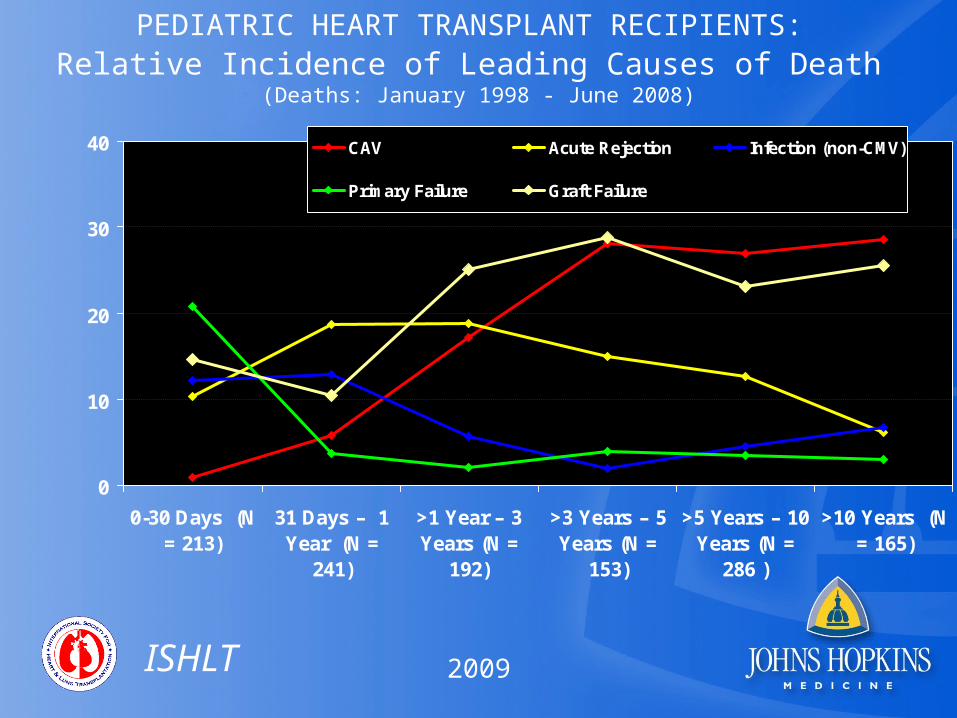
PEDIATRIC HEART TRANSPLANT RECIPIENTS: Relative Incidence of Leading Causes of Death
(Deaths: January 1998 - June 2008)
0
10
20
30
40
0-30 Days (N= 213)
31 Days – 1Year (N =
241)
>1 Year – 3Years (N =
192)
>3 Years – 5Years (N =
153)
>5 Years – 10Years (N =
286 )
>10 Years (N= 165)
CAV Acute Rejection Infection (non-CMV)
Primary Failure Graft Failure
Pe
rce
nta
ge
of
De
ath
s
ISHLT
2009