Embed Size (px)
Citation preview
SRT510 Business Case Studies
Evaluating Financial Performance: Ratios

Evaluating Financial Performance Return on Equity
3 levers of performance Quick and Current Ratios Problems
Timing, Risk, Value
Return on Equity
Measure of how efficiently a company uses owner’s capital
% return to owners on their investment “bang per buck” Net income / Shareholder’s Equity

Three Determinants of ROE
ROE =(net income/sales) * (sales/assets) * (assets/SE)
profit margin * asset turnover * financial leverage

Three Determinants of ROE
Profit margin: earnings squeezed out of each $ of sale
Asset turnover: sales generated from each $ of assets employed
Financial leverage: the amount of equity used to finance the assets
ROE and Performance
Unusually high ROE from company A attracts rivals anxious to emulate the good performance which drives A’s ROE back toward the average
Unusually low ROE from company B repels potential competitors, drives B (and others?) out of business so that survivor ROEs rise toward the average.

TABLE 2-1 ROEs and Levers of Performance for 10 Diverse Companies, 2004
Return on Profit Asset FinancialEquity Margin Turnover Leverage(ROE) (P) (A) (T)
(%) = (%) X (times) X (times)
Bank of America 14.2 = 21.6 X 0.06 X 11.17 ChevronTexaco 29.5 = 9.3 X 1.53 X 2.06 eBay 11.6 = 23.8 X 0.41 X 1.19 Florida Power and Light 11.8 = 8.4 X 0.37 X 3.76 Genentech 11.6 = 17.0 X 0.49 X 1.39 Harley-Davidson 27.6 = 16.7 X 0.97 X 1.70 Merck 33.6 = 24.8 X 0.55 X 2.46 Metflix 13.8 = 4.3 X 2.01 X 1.61 Morfolk Southern 11.6 = 12.6 X 0.30 X 3.10 Whole Foods Market 13.9 = 3.5 X 2.54 X 1.54
Totals do not add due to rounding.
Profit Margin (net income/sales)
Reflects company’s pricing strategy and ability to control costs.
Varies greatly from industry to industry Companies with high (low) profit margins tend
to have low (high) asset turnsWhy?
Companies with low profit margins and low asset turns are….bankrupt!
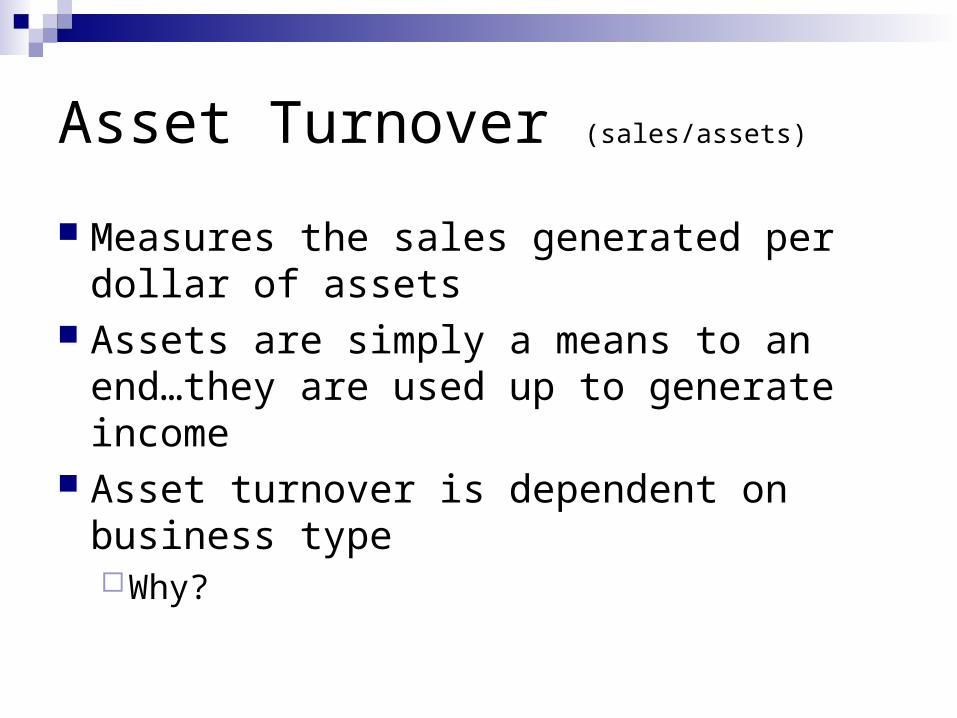
Asset Turnover (sales/assets)
Measures the sales generated per dollar of assets
Assets are simply a means to an end…they are used up to generate income
Asset turnover is dependent on business typeWhy?

Asset Turnover (sales/assets)
Reflects control over assets—often the margin between success and failureE.g. DELL (from 1.6 to 2.1 from 1991 to 2004)
Control over current assets is especially critical (e.g. A/R, inventory)Even modest changes can affect finances
Change in each asset tells a story
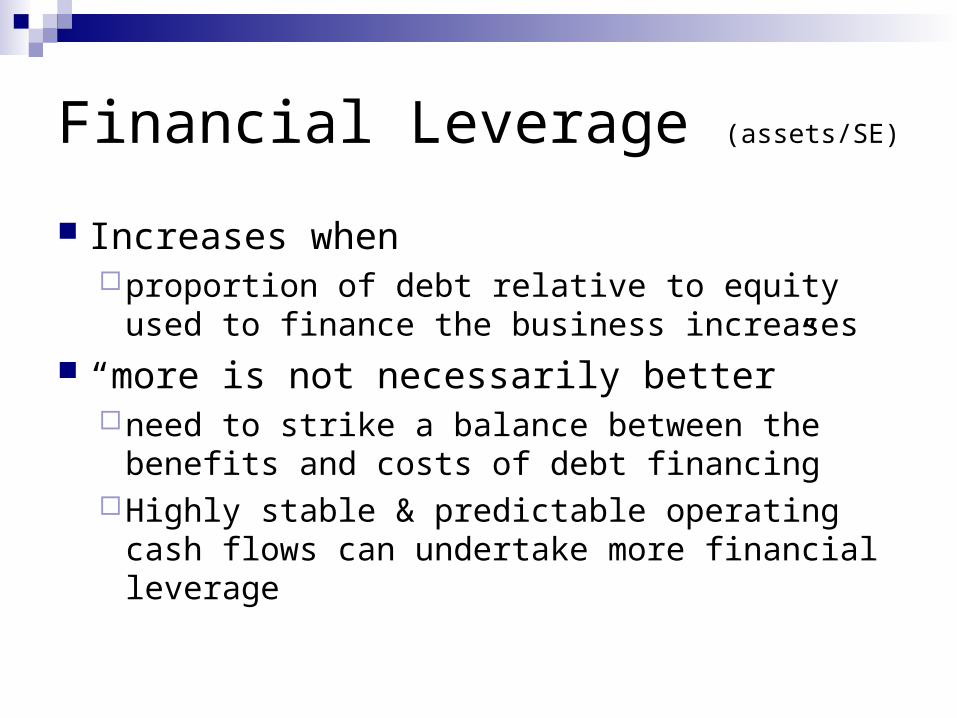
Financial Leverage (assets/SE)
Increases when proportion of debt relative to equity used to
finance the business increases “more is not necessarily better”
need to strike a balance between the benefits and costs of debt financing
Highly stable & predictable operating cash flows can undertake more financial leverage

Current Ratio
Current ratio = current assets/current liabilities
Compares the assets that will turn into cash within the year to the liabilities that must be paid within the year.
Low current ratio => don’t have enough liquidity in assets to pay off upcoming debts
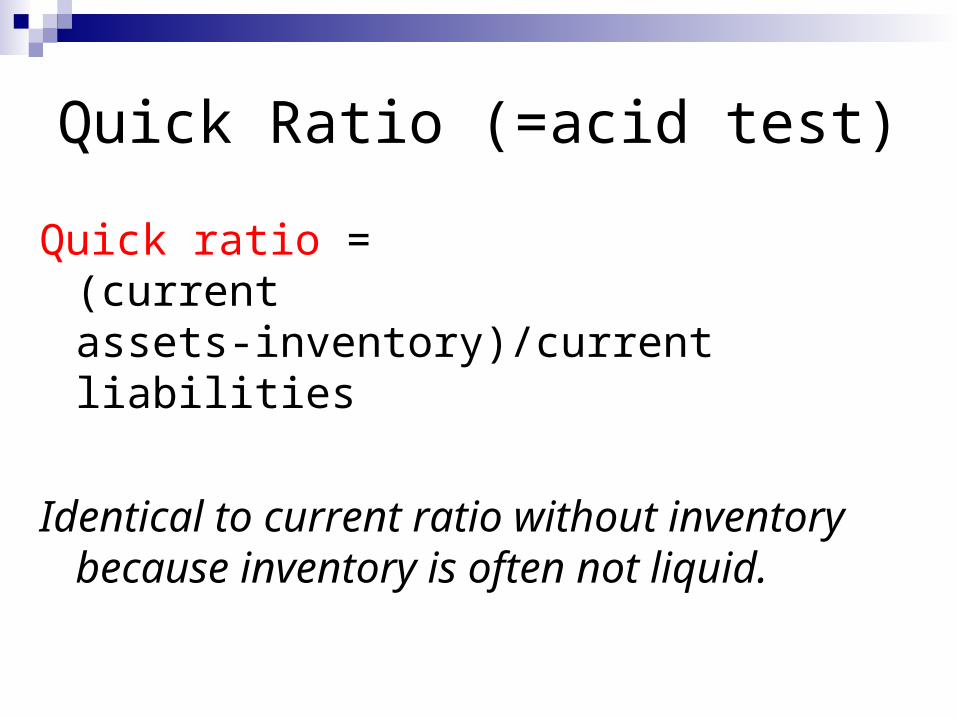
Quick Ratio (=acid test)
Quick ratio = (current assets-inventory)/current liabilities
Identical to current ratio without inventory because inventory is often not liquid.
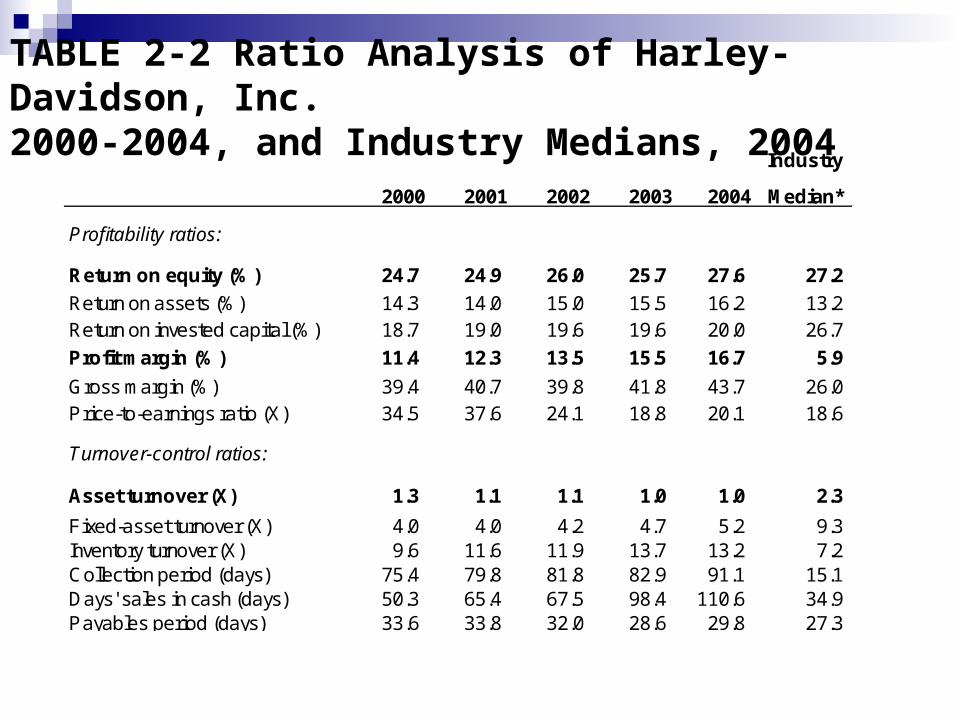
TABLE 2-2 Ratio Analysis of Harley-Davidson, Inc. 2000-2004, and Industry Medians, 2004
Industry
2000 2001 2002 2003 2004 Median*
Profitability ratios:
Return on equity (%) 24.7 24.9 26.0 25.7 27.6 27.2
Return on assets (%) 14.3 14.0 15.0 15.5 16.2 13.2 Return on invested capital (%) 18.7 19.0 19.6 19.6 20.0 26.7
Profit margin (%) 11.4 12.3 13.5 15.5 16.7 5.9
Gross margin (%) 39.4 40.7 39.8 41.8 43.7 26.0 Price-to-earnings ratio (X) 34.5 37.6 24.1 18.8 20.1 18.6
Turnover-control ratios:
Asset turnover (X) 1.3 1.1 1.1 1.0 1.0 2.3
Fixed-asset turnover (X) 4.0 4.0 4.2 4.7 5.2 9.3 Inventory turnover (X) 9.6 11.6 11.9 13.7 13.2 7.2 Collection period (days) 75.4 79.8 81.8 82.9 91.1 15.1 Days' sales in cash (days) 50.3 65.4 67.5 98.4 110.6 34.9 Payables period (days) 33.6 33.8 32.0 28.6 29.8 27.3

TABLE 2-2 (Continued)
Leverage and liquidity ratios:
Assets to equity (X) 1.7 1.8 1.7 1.7 1.7 2.0
Debt to assets (%) 42.3 43.7 42.2 39.9 41.3 48.8 Debt to equity (%) 73.3 77.6 72.9 66.4 70.4 95.4 Times interest earned (X) 18.0 27.8 50.3 55.2 61.8 85.1 Times burden covered (X) 3.2 1.9 1.5 2.3 1.8 85.1 Debt to assets (market value, %) 7.9 7.6 10.4 12.1 11.2 12.9 Debt to equity (market value, %) 8.6 8.3 11.6 13.7 12.7 14.8 Current ratio (X) 2.6 2.3 2.1 2.9 2.8 2.6 Acid test (X) 2.2 2.1 1.9 2.6 2.6 1.3
*Sample consists of five representative competitors in the "leisure travel" industry: Artic Cat, Brunswick,
Polaris Industries, Marine Products, and Winnebago Industries. (March 2004, data for Artic Cat.)

TABLE 2-4 Selected Ratios for Representative Industries, 2003 (upper-quartile, median and lower-quartile values)
Total Total Current Liabilities Collection Net Sales to Assets to Profit Return Return
Lines of Business and Ratio to Net Worth Period Inventory Net Sales Margin on Assets on EquityNumber of Firms Reporting (times) (%) (days) (times) (%) (%) (%) (%)
Agriculture, forestry, and fishing: Beef Cattle, Feedlot (16) 2.2 97.3 17.9 6.0 50.0 8.9 11.1 25.3
1.4 156.9 34.0 4.8 62.4 4.0 4.6 13.3 1.2 217.0 46.6 2.8 112.9 1.9 3.5 9.1
Lawn and graden services (304) 2.9 46.1 23.2 109.8 25.0 6.3 17.7 41.2 1.6 110.2 41.3 42.2 33.8 2.5 5.6 14.9 1.1 220.4 61.7 12.4 49.1 0.2 0.5 2.4
Manufacturing: Mens and boys shirts (19) 3.1 49.6 34.0 7.7 41.3 5.6 10.1 53.0
2.0 157.5 44.9 4.1 57.1 3.6 6.2 11.2 1.5 266.2 67.6 2.6 72.3 1.4 3.8 7.7
Motors and generators (49) 3.5 31.0 35.8 9.0 43.5 8.5 11.2 21.7 2.2 83.9 47.3 6.9 64.8 1.0 3.0 6.1 1.4 175.3 62.1 4.1 110.9 (2.4) (3.2) (2.4)
Semiconductors and related devices (208) 5.8 16.4 37.6 12.3 69.1 7.4 6.9 10.8 3.3 39.6 49.6 8.0 139.6 (5.1) (2.8) (2.0) 2.0 100.9 63.9 4.8 237.5 (42.5) (25.0) (36.6)
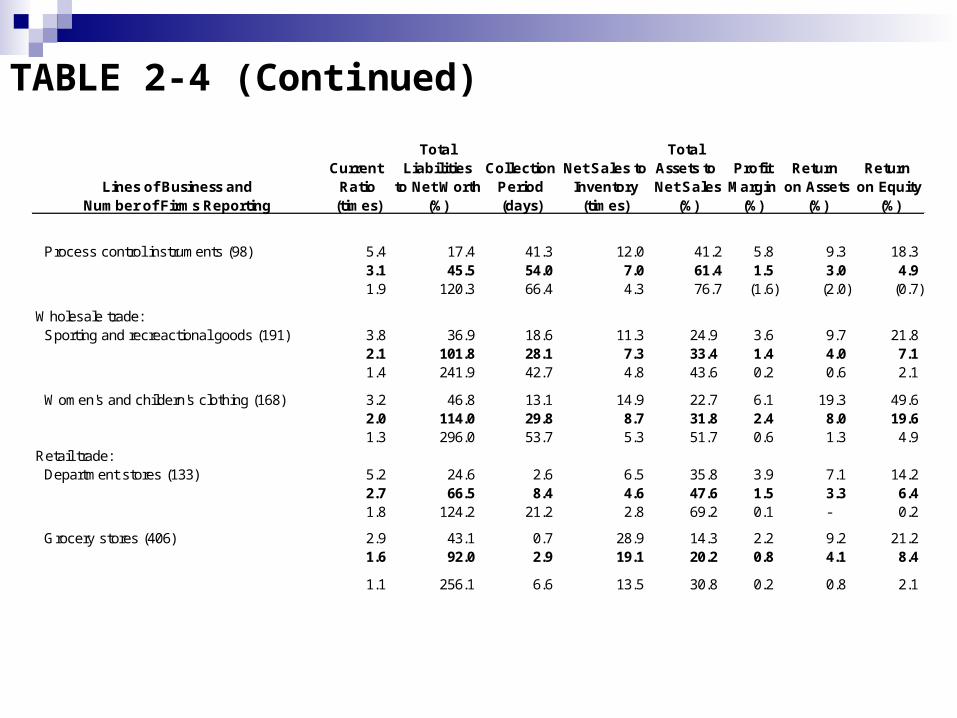
TABLE 2-4 (Continued)
Total Total Current Liabilities Collection Net Sales to Assets to Profit Return Return
Lines of Business and Ratio to Net Worth Period Inventory Net Sales Margin on Assets on EquityNumber of Firms Reporting (times) (%) (days) (times) (%) (%) (%) (%)
Process control instruments (98) 5.4 17.4 41.3 12.0 41.2 5.8 9.3 18.3 3.1 45.5 54.0 7.0 61.4 1.5 3.0 4.9 1.9 120.3 66.4 4.3 76.7 (1.6) (2.0) (0.7)
Wholesale trade: Sporting and recreactional goods (191) 3.8 36.9 18.6 11.3 24.9 3.6 9.7 21.8
2.1 101.8 28.1 7.3 33.4 1.4 4.0 7.1 1.4 241.9 42.7 4.8 43.6 0.2 0.6 2.1
Women's and childern's clothing (168) 3.2 46.8 13.1 14.9 22.7 6.1 19.3 49.6 2.0 114.0 29.8 8.7 31.8 2.4 8.0 19.6 1.3 296.0 53.7 5.3 51.7 0.6 1.3 4.9
Retail trade: Department stores (133) 5.2 24.6 2.6 6.5 35.8 3.9 7.1 14.2
2.7 66.5 8.4 4.6 47.6 1.5 3.3 6.4 1.8 124.2 21.2 2.8 69.2 0.1 - 0.2
Grocery stores (406) 2.9 43.1 0.7 28.9 14.3 2.2 9.2 21.2 1.6 92.0 2.9 19.1 20.2 0.8 4.1 8.4
1.1 256.1 6.6 13.5 30.8 0.2 0.8 2.1
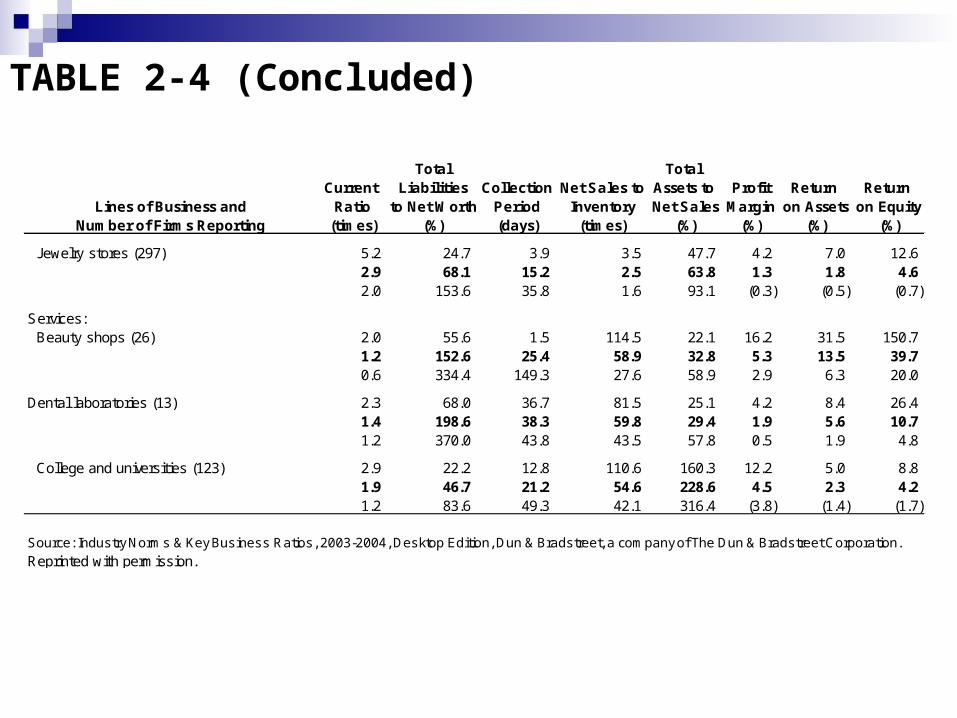
TABLE 2-4 (Concluded)
Total Total Current Liabilities Collection Net Sales to Assets to Profit Return Return
Lines of Business and Ratio to Net Worth Period Inventory Net Sales Margin on Assets on EquityNumber of Firms Reporting (times) (%) (days) (times) (%) (%) (%) (%)
Jewelry stores (297) 5.2 24.7 3.9 3.5 47.7 4.2 7.0 12.6 2.9 68.1 15.2 2.5 63.8 1.3 1.8 4.6 2.0 153.6 35.8 1.6 93.1 (0.3) (0.5) (0.7)
Services: Beauty shops (26) 2.0 55.6 1.5 114.5 22.1 16.2 31.5 150.7
1.2 152.6 25.4 58.9 32.8 5.3 13.5 39.7 0.6 334.4 149.3 27.6 58.9 2.9 6.3 20.0
Dental laboratories (13) 2.3 68.0 36.7 81.5 25.1 4.2 8.4 26.4 1.4 198.6 38.3 59.8 29.4 1.9 5.6 10.7 1.2 370.0 43.8 43.5 57.8 0.5 1.9 4.8
College and universities (123) 2.9 22.2 12.8 110.6 160.3 12.2 5.0 8.8 1.9 46.7 21.2 54.6 228.6 4.5 2.3 4.2 1.2 83.6 49.3 42.1 316.4 (3.8) (1.4) (1.7)
Source: Industry Norms & Key Business Ratios, 2003-2004, Desktop Edition, Dun & Bradstreet, a company of The Dun & Bradstreet Corporation.
Reprinted with permission.
Problems With ROE
TimingBackward looking1 yearDecrease does not necessarily indicate a
problem

Problems With ROE
Risk“eat well, sleep well”ROE looks only at return while ignoring risk;
therefore it is not always an accurate measure of performance

Problems With ROE
ValueROE uses book value, not market value
It may not be synonymous with a high return on investment to shareholders
Using Ratios
Trend analysis—calculate ratios over several years and see how they change.
User ROE and its three components; narrow your focus to more specific ratios as required.