Embed Size (px)
Citation preview

SRPAsia-Pacific
Awards Report 2015

SRP Asia-Pacific Awards Report 2015 1
1.1 Foreword
Structured Retail Products Limited (SRP), part of the Euromoney group of companies, is a research firm based in London, New York and Hong Kong, providing research and training services related to all aspects of structured products.
The company was founded in 2001 and our clients include hundreds of blue chip companies from around the world including all of the major global financial services groups, financial regulators, stock exchanges, index providers and professional services firms.
SRP also owns and maintains the specialist industry website StructuredRetailProducts.com. The site was launched in January 2003, and has become the leading online information resource for the global retail structured products industry. With over 4,100 registered users and more than 10 million product listings, the website is the primary information source for a wide range of businesses involved in the manufacture and distribution of structured investment products globally. The service is used by financial regulators, index providers, investment banks, stock exchanges, retail banks, insurance companies, asset and wealth managers, consultants, lawyers and other firms involved in the market.
Copyright Information
This report is copyright © 2015 Structured Retail Products Limited. All Rights Reserved. Reproduction and distribution of this report in any form without prior written permission is strictly prohibited.
Furthermore• It may not be sold for commercial gain, either in part or in its
entirety• It may not be photocopied or printed for multiple use, with
the exception of within the organization for which it was purchased.
• It may not be distributed electronically or otherwise in a manner other than that described above.
Indemnity
The information contained herein has been obtained from sources believed to be reliable. SRP disclaims all warranties as to the accuracy, completeness or adequacy of such information. Use of this report is at your sole risk and SRP accepts no responsibility for any problems or incidents arising from its use.
Acknowledgements
This report would not have been possible without the support of the structured products fraternity across the Asia-Pacific region. SRP would like to thank the participants in the SRP survey of May to June 2015, whose data underpins this report.
If you are interested in having a similar bespoke report produced for your organisation, please contact Kris Deslagmeulder +44 (0) 7779 8201 or email [email protected]
Contents
1.1 Introduction 11.2 Scope 21.3 Methodology 3
2.0 Management Summary2.1 Price Competitiveness 42.2 Understanding Client Needs 52.3 Innovation and Structuring Capability 62.4 After-sales Service 72.5 Overall Service Scores 8
3.0 Asia-Pacific Summary3.1 Asia-Pacific Overview -
Issuance & Volumes 2010-2014 103.2 Asset Qualitative Responses by Asset Class 12
4.0 Bank Analysis4.1 BNP Paribas 154.2 Credit Suisse 164.3 JP Morgan 174.4 Societe Generale 184.5 UBS 194.6 Best Distributor:
NH Investment & Securities 20
5.0 Service Provider Analysis 5.1 Best index provider: S&P Dow Jones Indices 215.2 Best law firm: Linklaters 225.3 Best technology provider: Bloomberg 235.4 Best derivatives exchange:
HK Exchange and Clearing 24
6.0 Award Results6.1 Best Manufacturers 256.2 Best Distributors 256.3 Service Providers 26
7.0 Market Shares 29
8.0 Appendix 32
Editor: Richard JoryResearch analysts: Su Chin Zhang, Danielle Chung, Yukiho YamadaMarketing: Margaux PalaciosSales: Kris Deslagmeulder
IntroductionM
anagement Sum
mary
Bank AnalysisAw
ards ResultsAppendix
Market Shares
Service Provider AnalysisAsia-Pacific Sum
mary

SRP Asia-Pacific Awards Report 20152
1.2 Scope
This report is concerned with the manufacture of structured products in all forms – including wrappers such as funds, notes, bonds, certificates, deposits, life assurance – and usually linked to equities, foreign exchange, commodities, interest rates and hybrid underlyings.
This report presents information on structured retail products markets across the Asia-Pacific region. Although the term ‘structured product’ is widely used in the financial community, the term often means different things to different people.
For the purposes of this report, a structured product is an investment product providing a predefined return linked to the price of one or more underlying assets. These are usually financial prices, rates or indices, but in rare cases can be sporting or other events. The product can usually be broken down into a number of separate financial instruments, one of which is usually a derivative product.
Where a derivative is not used, the product will use derivative- based investment strategy or computation to provide the return.
Although we exclude simple warrants, listed options and futures, and delta one products such as tracker funds, exchange-traded funds and notes, reference to these products may be made, where relevant.
The report is based on both quantitative and qualitative analysis. StructuredRetailProducts.com (SRP) surveyed 766 structured products distributors across the Asia Pacific region between May and June 2015, collecting data on structured product manufacturers from the point of view of their distributor clients. The results from the survey form the basis of this report. Details of both the quantitative and qualitative analyses are available in the Methodology section of the report.
The report provides the following information:
1. A scope, methodology and management summary of the report’s key findings
2. An analysis of the structured products market in Asia-Pacific based on survey responses
3. Separate analysis of top banks and service providers with
• How the bank ranked in terms of overall client service
• Whether client service was above the industry average in key service categories
4. The volume of business manufactured by the bank and breakdown by key countries
5. Table of the importance of the following key service categories for the bank’s respondents:
• Price competitiveness
• Understanding client needs
• Innovation and structuring capability
• After sales service
6. Score and rank of the bank, in league table format
• For overall client service with a geographic breakdown
• Across the key client service categories with an asset class breakdown
7. Analysis of top service providers
IntroductionM
anagement Sum
mary
Bank AnalysisAw
ards ResultsAppendix
Market Shares
Service Provider AnalysisAsia-Pacific Sum
mary

SRP Asia-Pacific Awards Report 2015 3
1.3 Methodology
Description of the SurveyBetween May and June 2015 StructuredRetailProducts.com (SRP) surveyed Asia-Pacific structured products distributors, receiving 766 responses. The survey was composed of three areas of investigation:
Part 1 QuantitativeWe asked respondents to the survey to specify up to three investment banks that they use for hedging purposes, for each asset class in which the respondent was active, and specify the volume of business for that asset class and the percentage split by bank.
Part 2 QualitativeThe respondents were then asked to rank the investment banks they dealt with for each asset class as 1, 2 or 3 (where 1 = below average, 2 = average and 3 = above average) according to four key service categories:
• Price competitiveness• Understanding client needs• Innovation and structuring capability• After sales service
Part 3 Data ValidationCaptive votes and those representing internal transaction flows were excluded from the results. This includes votes cast by distributors that are part of banking groups which use their parent group for 100% of their activity and internal structuring desks. Also votes were not included in the survey where:
• Providers vote for themselves• We cannot confirm the identity of the respondent• A respondent votes more than once and we cannot resolve the duplication
The survey results underpinned the 2015 Asia-Pacific Structured Products & Derivatives Awards, which were handed out on September 22, 2015 during the 2nd Asia-Pacific Structured Products & Derivatives conference in Hong Kong. For the purpose of this report, the scores for each key service category for the individual banks are calculated by averaging. Service scores are therefore suggestive of the level of service that a client might expect to receive when working with an investment banking counterparty.
Each bank analysis contains graphs of the bank’s score for each of the key service categories above as well a comparison to the industry average and a geographic breakdown. Where a bank receives a low score, it may need to improve or update its messaging, at least among some sectors of its target client base, rather than to improve its service.
In order to help banks decide their tactical direction, we have sought candid feedback from their clients and use this to suggest areas that each bank excels in and where it might improve.
IntroductionM
anagement Sum
mary
Bank AnalysisAw
ards ResultsAppendix
Market Shares
Service Provider AnalysisAsia-Pacific Sum
mary
SRP Asia-Pacific Awards Report 20154
2.0 Management Summary
The following key service categories influence the decision of distributors to work with a particular bank for their structured products:
1. Price competitiveness2. Understanding client needs3. Innovation and structuring capability4. After sales service
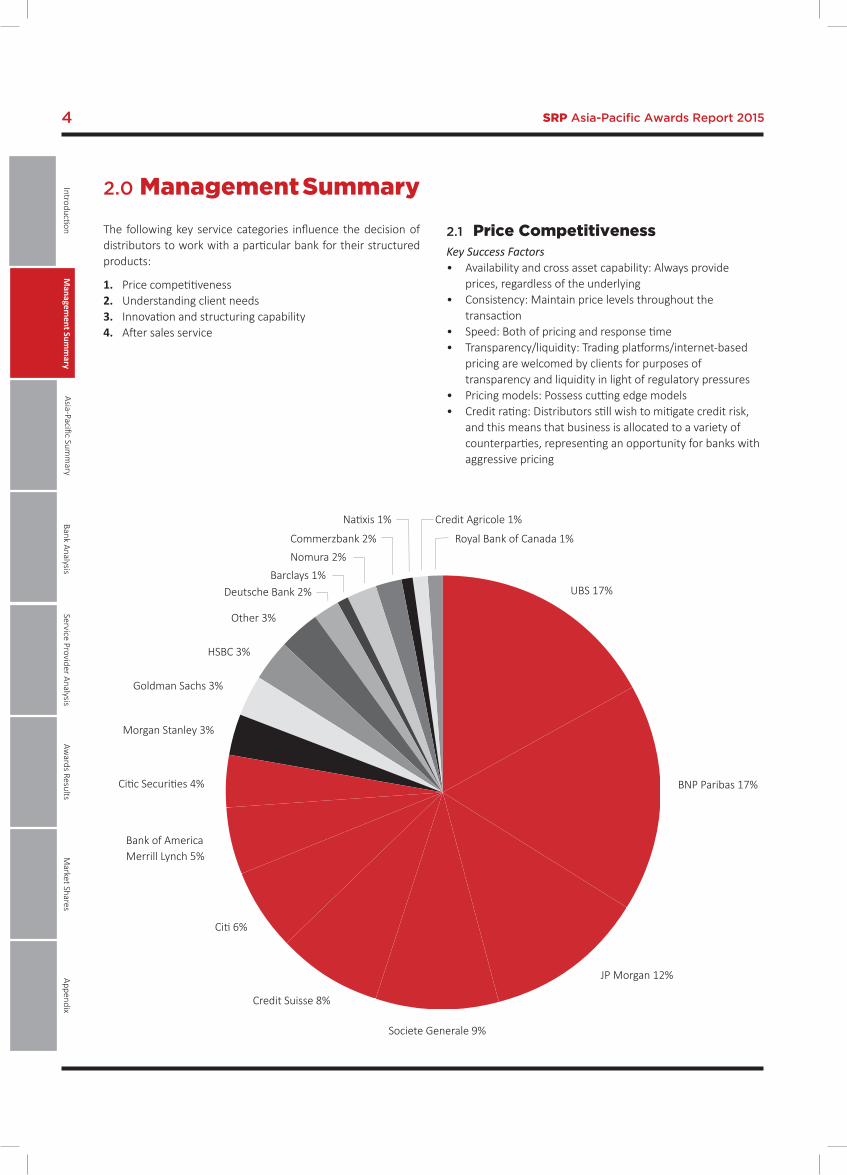
2.1 Price CompetitivenessKey Success Factors • Availability and cross asset capability: Always provide prices, regardless of the underlying• Consistency: Maintain price levels throughout the transaction• Speed: Both of pricing and response time• Transparency/liquidity: Trading platforms/internet-based pricing are welcomed by clients for purposes of transparency and liquidity in light of regulatory pressures• Pricing models: Possess cutting edge models• Credit rating: Distributors still wish to mitigate credit risk, and this means that business is allocated to a variety of counterparties, representing an opportunity for banks with aggressive pricing
Barclays 1% Nomura 2%
Commerzbank 2%
Natixis 1% Credit Agricole 1%
Royal Bank of Canada 1%
UBS 17%
BNP Paribas 17%
JP Morgan 12%
Societe Generale 9%
Credit Suisse 8%
Citi 6%
Bank of America Merrill Lynch 5%
Citic Securities 4%
Morgan Stanley 3%
Goldman Sachs 3%
HSBC 3%
Other 3%
Deutsche Bank 2%
IntroductionM
anagement Sum
mary
Bank AnalysisAw
ards ResultsAppendix
Market Shares
Service Provider AnalysisAsia-Pacific Sum
mary

SRP Asia-Pacific Awards Report 2015 5
2.2 Understanding Client NeedsKey Success Factors • Provide a seamless service that integrates with client operations• Do not put the client under pressure to close the deal• Understand the products offered• Possess local market/regulatory knowledge – preferably to have dedicated sales people in different markets• Deliver good macro ideas
• Have experienced sales people• Provide a quick response to client enquiries• Demonstrate a willingness to help clients grow their business – banks need to understand their clients’ business in order to pitch suitable products - a cooperative approach is welcomed by distributors which can lead to further sales opportunities• Spend time iterating suitable marketable ideas with the client
Barclays 2% Nomura 2%
Commerzbank 1%
Natixis 1% Credit Agricole 1%
Royal Bank of Canada 1%
UBS 17%
BNP Paribas 17%
JP Morgan 12%
Societe Generale 9%
Credit Suisse 8%
Citi 7%
Bank of America Merrill Lynch 5%
Citic Securities 4%
Morgan Stanley 3%
Goldman Sachs 2%
HSBC 3%
Other 3%
Deutsche Bank 2%
IntroductionM
anagement Sum
mary
Bank AnalysisAw
ards ResultsAppendix
Market Shares
Service Provider AnalysisAsia-Pacific Sum
mary

SRP Asia-Pacific Awards Report 20156
2.3 Innovation and Structuring CapabilityKey Success Factors • Demonstrate the ability to structure across asset classes, underlyings and also wrappers• Understand complex customer needs and turn these into innovative/ viable solutions• Have experience of alternative issuing vehicles and pricing models• Possess excellent knowledge of innovative products –
distributors value banks that can come up with interesting products and innovative payoffs as long as these are not too complicated to understand or explain to their customers• Offer leading research capabilities – more openness and clever trades and strategies that deliver value are highly rated by distributors• Provide flexibility to embed bespoke features into products
Barclays 2%
Nomura 2%
Commerzbank 1%
Natixis 1% Credit Agricole 1%
Royal Bank of Canada 1%
UBS 18%
BNP Paribas 16%
JP Morgan 12%
Societe Generale 9%
Credit Suisse 7%
Citi 7%
Bank of America Merrill Lynch 4%
Citic Securities 5%
Morgan Stanley 3%
Goldman Sachs 3%
HSBC 3%
Other 3%
Deutsche Bank 2%
Leonteq 1%
IntroductionM
anagement Sum
mary
Bank AnalysisAw
ards ResultsAppendix
Market Shares
Service Provider AnalysisAsia-Pacific Sum
mary

SRP Asia-Pacific Awards Report 2015 7
2.4 After-Sales ServiceKey Success Factors • Provide secondary market services – this source of liquidity encourages distributors to issue structured products and therefore supports the industry• Demonstrate the ability to unwind small tickets – while banks can typically support writing small deal sizes, liquidity for these deals is also required post trade• Help unwind commitments especially when pricing is not good
• Provide reliable and regularly updated secondary market prices• Issue valuation and risk management reports – this helps distributors decide what products and underlyings they may wish to use, and also allows them to explain product performance to their customers• Demonstrate efficiency in terms of product registration and passporting
Barclays 2% Nomura 2%
Commerzbank 1%
Natixis 1% Credit Agricole 1%
Royal Bank of Canada 1%
UBS 18%
BNP Paribas 17%
JP Morgan 12%
Societe Generale 9%
Credit Suisse 8%
Citi 7%
Bank of America Merrill Lynch 4%
Citic Securities 5%
Morgan Stanley 3%
Goldman Sachs 2%
HSBC 2%
Other 3%
Deutsche Bank 2%
IntroductionM
anagement Sum
mary
Bank AnalysisAw
ards ResultsAppendix
Market Shares
Service Provider AnalysisAsia-Pacific Sum
mary
8 SRP Asia-Pacific Awards Report 2015
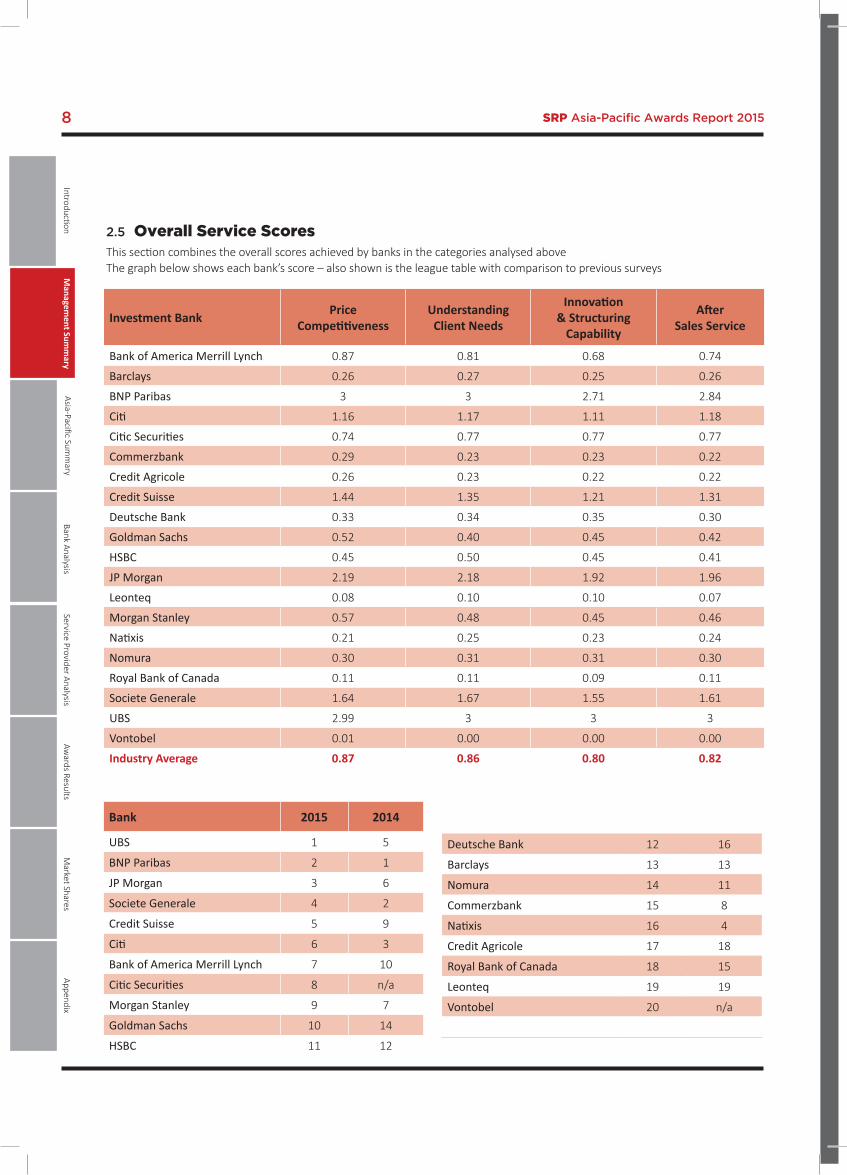
2.5 Overall Service ScoresThis section combines the overall scores achieved by banks in the categories analysed aboveThe graph below shows each bank’s score – also shown is the league table with comparison to previous surveys
Investment Bank Price Competitiveness
Understanding Client Needs
Innovation & Structuring
Capability
After Sales Service
Bank of America Merrill Lynch 0.87 0.81 0.68 0.74
Barclays 0.26 0.27 0.25 0.26
BNP Paribas 3 3 2.71 2.84
Citi 1.16 1.17 1.11 1.18
Citic Securities 0.74 0.77 0.77 0.77
Commerzbank 0.29 0.23 0.23 0.22
Credit Agricole 0.26 0.23 0.22 0.22
Credit Suisse 1.44 1.35 1.21 1.31
Deutsche Bank 0.33 0.34 0.35 0.30
Goldman Sachs 0.52 0.40 0.45 0.42
HSBC 0.45 0.50 0.45 0.41
JP Morgan 2.19 2.18 1.92 1.96
Leonteq 0.08 0.10 0.10 0.07
Morgan Stanley 0.57 0.48 0.45 0.46
Natixis 0.21 0.25 0.23 0.24
Nomura 0.30 0.31 0.31 0.30
Royal Bank of Canada 0.11 0.11 0.09 0.11
Societe Generale 1.64 1.67 1.55 1.61
UBS 2.99 3 3 3
Vontobel 0.01 0.00 0.00 0.00
Industry Average 0.87 0.86 0.80 0.82
Bank 2015 2014
UBS 1 5
BNP Paribas 2 1
JP Morgan 3 6
Societe Generale 4 2
Credit Suisse 5 9
Citi 6 3
Bank of America Merrill Lynch 7 10
Citic Securities 8 n/a
Morgan Stanley 9 7
Goldman Sachs 10 14
HSBC 11 12
Deutsche Bank 12 16
Barclays 13 13
Nomura 14 11
Commerzbank 15 8
Natixis 16 4
Credit Agricole 17 18
Royal Bank of Canada 18 15
Leonteq 19 19
Vontobel 20 n/a
IntroductionM
anagement Sum
mary
Bank AnalysisAw
ards ResultsAppendix
Market Shares
Service Provider AnalysisAsia-Pacific Sum
mary
3.0 Asia-Pacific Summary
9SRP Asia-Pacific Awards Report 2015
The SRP Asia-Pacific Awards Survey 2015 incorporates the results of a survey of 766 respondents who were asked for their views on product creators, preferred structures and underlyings and market views. The survey was conducted between May and June 2015.
The Asia-Pacific Overview includes graphic representations of SRP data on the trends in issuance numbers and sales volumes in this market over the past five years. This is followed by an article that is based on comments made in the survey by the respondents.
IntroductionM
anagement Sum
mary
Bank AnalysisAw
ards ResultsAppendix
Market Shares
Service Provider AnalysisAsia-Pacific Sum
mary

SRP Asia-Pacific Awards Report 201510
Including leverage, flow and private banking
Excluding leverage, flow and private banking
Excluding private banking
3.1 Asia-Pacific Overview - Issuance and volumes (2010-2014)
2010 2011 2012 2013 2014
2010 2011 2012 2013 2014
Total Volumes (US$m)
Total Volumes (US$m)
Total Issues
Total Issues
2010 2011 2012 2013 2014
Total Volumes (US$m) Total Issues
40,000
35,000
30,000
25,000
20,000
15,000
10,000
5,000
0
18,00016,00014,00012,00010,0008,0006,0004,0002,0000
35,000
30,000
25,000
20,000
15,000
10,000
5,000
0
400,000
350,000
300,000
250,000
200,000
150,000
100,000
50,000
0
100,00090,00080,00070,00060,00050,00040,00030,00020,00010,000
0
160000
140000
120000
100000
80000
60000
40000
20000
0
IntroductionM
anagement Sum
mary
Bank AnalysisAw
ards ResultsAppendix
Market Shares
Service Provider AnalysisAsia-Pacific Sum
mary

SRP Asia-Pacific Awards Report 2015 11
Predicting the tumble and falling for oilThe stock market correction was on the cards for those who regularly scrutinise the opportunities for equity-linked structured products, according to those completing the SRP Asia-Pacific Awards Survey 2015. Other top tips include hybrids and oil-linked products, but expect less from foreign exchange-linked products. Richard Jory reports.
It was almost like the respondents to SRP Asia-Pacific Awards Survey respondents knew that the markets were going to fall and volatility would be upon us, once again. When asked for their views on the trends and challenges that the equity-linked structured products market will face over the following 12 months, the worries outlined by the 766 respondents included, a “massive fall in the stock market”, leading to a need to “hedge the downside risk of the stock market”.
Further, more specific notes of caution were based around the “equity index is at a relatively high level. Clients should reduce long positions in the equity market”. And, “The high level of equity market, which makes it hard to find product with better downside protection”.
The product choices highlighted coincided with a belief in the arrival of volatility, and were based around lower barriers. “Due to the high level of indices, investors will prefer low barrier products,” said one respondent. “Products added with great stability will be the trend; there is, as well, a need for diversification of payoffs and of portfolios.”
Another respondent echoed the theme: “Lower barrier, smaller duration, lower possibility of knock-in products; more safe products will be the key trend.”
Other respondents mentioned that the autocallable structure will continue to be favoured, but also noted the need for a more diversified pool of underlyings, a trend that is being followed only slowly in Asia, as the Dax finds its way to Japan’s and South Korea’s investors increase their recent fondness for international underlyings.
“There is an expectation that the general Japanese stock market will continue to be boosted, hence the focus will be on products with early redemption structures,” said one of those questioned for the survey.
The news that South Korea’s regulators are applying ever more scrutiny to the structured product market was matched by the suggestion that there will be “increased demand for structured products, while having more and strengthened restriction in the market”.
Other comments reflected the same theme: “While equity-
linked structured products are becoming more popular due to the low interest rate environment, due to the concentration risk, the regulation is getting more strengthened and there is more supervision in the market.”
Predictions that the size of the equity-linked market would only increase were complemented by suggestions that this will be assisted by the development of “new indices, especially in-house strategy indices”.
What comes next could well revolve around the comment that, “As the stock market is quite vigorous, it will be difficult for the structured products business compared to last year”.
The enthusiasm that Asian investors have for foreign exchange was tainted by the belief that, “Stricter regulatory Issues and guidelines imposed on derivative business, as well as shrinking margin on trades”.
But the potential remains: “We see opportunities to propose alternative to deposits (like CNH-linked products and others) with short tenors (less than 18 months),” said one respondent. “With platform limitation (and so no possibility to propose targeted accrual redemption notes (Tarn)), funded products replicating popular OTC payoffs (Tarn) could be worth exploring.”
At the same time, one respondent noted that, “there is more demand for products that are less complicated. If the trend of a depreciating yen continues, there is no necessity to structure complicated products that might be beyond our capacity”.
Views on the prospects for the interest rate-linked structured products market is, obviously, dependent on when and if the US Federal Reserve raises rates. “If there is a stronger view on the rise in Fed rate, then there will be stronger demand in interest rate related products” was the straightforward view echoed by almost all respondents to the future of this asset class.
Other comments on interest rates mentioned the likely development of more multi-asset and hybrid products incorporating the asset class.
As for hybrids, there will continue to be demand. “There is an expectation that low interest rate in Japan will continue for the long term, and hence there will be higher demand for repackaged bonds backed by hybrid securities which will be redeemed or called in coming several years,” said one respondent.
Further support for hybrids included: “The high level of bond market and already low interest rate environment makes bond investment increasingly difficult. Thus, it’s harder to find good downside protection investment with attractive return.”
Wrapped in with comments on hybrids was a timely view on oil, with products linked to the commodity expected to increase in popularity.
Including leverage, flow and private banking
Excluding leverage, flow and private banking
IntroductionM
anagement Sum
mary
Bank AnalysisAw
ards ResultsAppendix
Market Shares
Service Provider AnalysisAsia-Pacific Sum
mary

SRP 12
0% 5% 10% 15% 20% 25% 30%
Volume
0% 10% 20% 30% 40% 50%
3.2 Qualitative Responses by Asset Class
1. Equity
2. Currency
Managem
ent Summ
aryBank Analysis
Awards Results
AppendixM
arket SharesService Provider Analysis
UBSSociete Generale
OtherNomura
NatixisMorgan Stanley
LeonteqJPMorgan
HSBCGoldman SachsDeutsche Bank
Credit SuisseCommerzbankCitic Securities
CitiBNP Paribas
BarclaysBank of America Merrill Lynch
Overall Score based on four Qualitative Criteria
UBSSociete Generale
RBCOther
NomuraMorgan Stanley
JPMorganHSBC
Goldman SachsDeutsche Bank
Credit SuisseCredit AgricoleCommerzbank
CitiBNP Paribas
Barclays
Volume Overall Score based on four Qualitative Criteria

SRP 13
4. Hybrids
3. Interest Rate
Volume Overall Score based on four Qualita ve Criteria
INTEREST RATE
0% 5% 10% 15% 20% 25% 30% 35% 40%
UBSSociete Generale
RBCOther
NomuraMorgan Stanley
JP MorganGoldman SachsDeutsche Bank
Credit SuisseCrédit Agricole
CiBNP Paribas
BarclaysBank of America Merrill Lynch
HSBC
Volume Overall Score based on four Qualita ve Criteria
Managem
ent Summ
aryBank Analysis
Awards Results
AppendixM
arket SharesService Provider Analysis
0% 10% 20% 30% 40% 50% 60%
UBSSociete Generale
OtherNatixis
Morgan StanleyJPMorgan
HSBCGoldman SachsDeutsche Bank
Credit SuisseCredit AgricoleCommerzbank
CitiBNP Paribas
BarclaysBank of America Merrill Lynch

SRP 14
3. Commodity
Volume Overall Score based on four Qualita ve Criteria
Managem
ent Summ
aryBank Analysis
Awards Results
AppendixM
arket SharesService Provider Analysis
0% 5% 10% 15% 20% 25% 30%
UBS
Societe Generale
Natixis
Morgan Stanley
JPMorgan
HSBC
Goldman Sachs
Deutsche Bank
Credit Suisse
BNP Paribas
Barclays
SRP Asia-Pacific Awards Report 2015 15
4.0 Bank Analysis
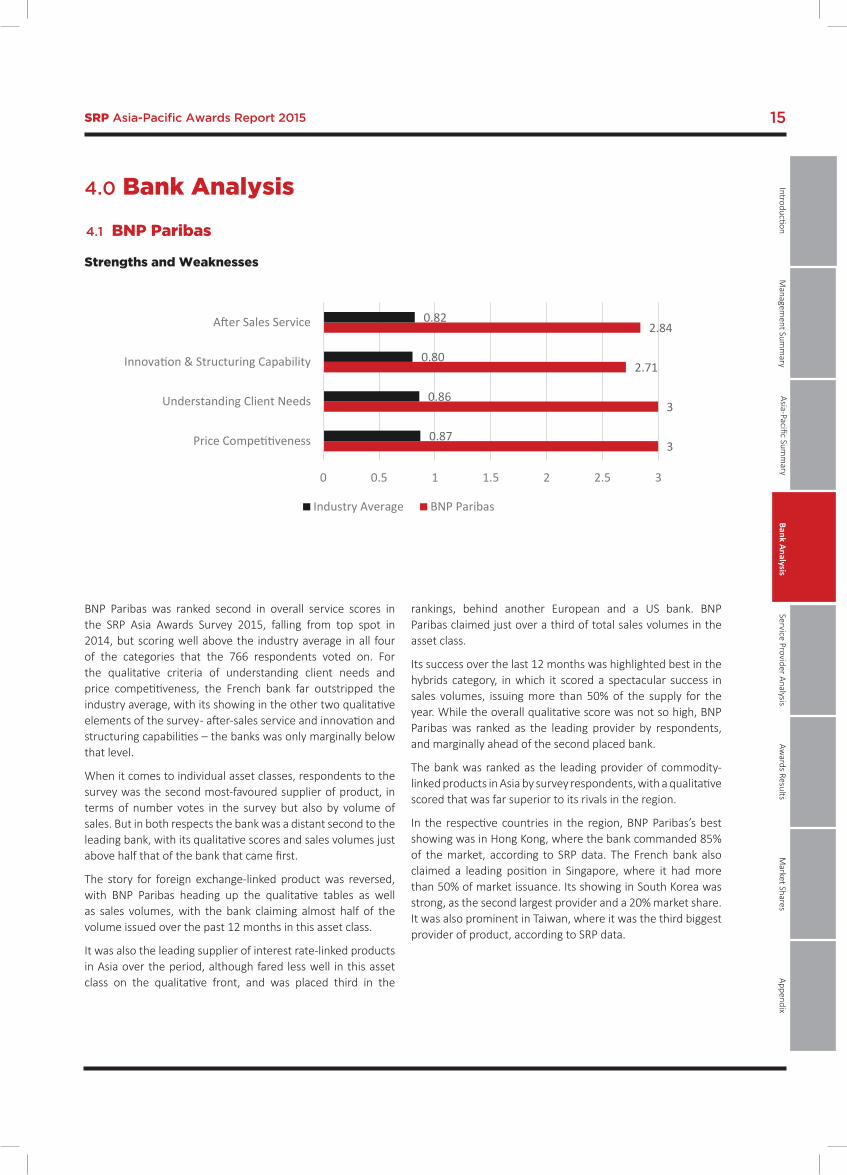
BNP Paribas was ranked second in overall service scores in the SRP Asia Awards Survey 2015, falling from top spot in 2014, but scoring well above the industry average in all four of the categories that the 766 respondents voted on. For the qualitative criteria of understanding client needs and price competitiveness, the French bank far outstripped the industry average, with its showing in the other two qualitative elements of the survey - after-sales service and innovation and structuring capabilities – the banks was only marginally below that level.
When it comes to individual asset classes, respondents to the survey was the second most-favoured supplier of product, in terms of number votes in the survey but also by volume of sales. But in both respects the bank was a distant second to the leading bank, with its qualitative scores and sales volumes just above half that of the bank that came first.
The story for foreign exchange-linked product was reversed, with BNP Paribas heading up the qualitative tables as well as sales volumes, with the bank claiming almost half of the volume issued over the past 12 months in this asset class.
It was also the leading supplier of interest rate-linked products in Asia over the period, although fared less well in this asset class on the qualitative front, and was placed third in the
rankings, behind another European and a US bank. BNP Paribas claimed just over a third of total sales volumes in the asset class.
Its success over the last 12 months was highlighted best in the hybrids category, in which it scored a spectacular success in sales volumes, issuing more than 50% of the supply for the year. While the overall qualitative score was not so high, BNP Paribas was ranked as the leading provider by respondents, and marginally ahead of the second placed bank.
The bank was ranked as the leading provider of commodity-linked products in Asia by survey respondents, with a qualitative scored that was far superior to its rivals in the region.
In the respective countries in the region, BNP Paribas’s best showing was in Hong Kong, where the bank commanded 85% of the market, according to SRP data. The French bank also claimed a leading position in Singapore, where it had more than 50% of market issuance. Its showing in South Korea was strong, as the second largest provider and a 20% market share. It was also prominent in Taiwan, where it was the third biggest provider of product, according to SRP data.
3
3
2.71
2.84
0.87
0.86
0.80
0.82
0 0.5 1 1.5 2 2.5 3
Price Competitiveness
Understanding Client Needs
Innovation & Structuring Capability
After Sales Service
BNP ParibasStrengths & Weaknesses
Industry Average BNP Paribas
Strengths and Weaknesses
4.1 BNP Paribas
IntroductionM
anagement Sum
mary
Bank AnalysisAw
ards ResultsAppendix
Market Shares
Service Provider AnalysisAsia-Pacific Sum
mary

SRP Asia-Pacific Awards Report 201516
Credit Suisse leapt from ninth in 2014 to fifth in the overall qualitative rankings from the SRP Asia Awards Survey for 2015. The Swiss bank scored far better than the industry average for all four of the qualitative criteria voted on by the 766 respondents to the survey. Its best showing was in price competitiveness, but it also excelled in understanding client needs. Its next best rating was in aftersales service, with its score for innovation and structuring capability only marginally behind.
For the qualitative categories, Credit Suisse was placed fifth among its peers by respondents to the survey for its price competitiveness, and also in voting for the best in innovation and structuring capabilities. The same rank was achieved in aftersales service.
In the equities asset class, Credit Suisse was highly rated overall and came in as the third most favoured, with its structured products sales volumes for the region putting it in the top 10. In the foreign exchange-linked market, the bank was ranked
sixth in the region on the basis of the survey. For interest rates, the bank appeared in the top 10, according to the views of those questioned for their views of the best performers over the last 12 months.
Top six was also the standing for the bank in the hybrids category, with Credit Suisse scoring one better in commodity-linked products – and coming fifth – in the voting of respondents to the survey. It was also ranked fifth in the category of understanding client needs.
For market share in the main markets in Asia-Pacific, Credit Suisse appeared in the top five, although was a long way below the massive share that Citic Securities claims in that market. The Swiss bank was ranked in the top five in Japan for market share, and achieved the same ranking in Singapore, according to SRP data. Its regular fifth spot was also the case for its market share in South Korea and Taiwan.
1.44
1.35
1.21
1.31
0.87
0.86
0.80
0.82
0 0.2 0.4 0.6 0.8 1 1.2 1.4 1.6
Price Competitiveness
Understanding Client Needs
Innovation & Structuring Capability
After Sales Service
Credit SuisseStrengths & Weaknesses
Industry Average Credit Suisse
Strengths and Weaknesses
4.2 Credit Suisse
IntroductionM
anagement Sum
mary
Bank AnalysisAw
ards ResultsAppendix
Market Shares
Service Provider AnalysisAsia-Pacific Sum
mary

SRP Asia-Pacific Awards Report 2015 17
JP Morgan jumped up to third spot in the overall qualitative criteria rankings as voted for by the 766 respondents to the SRP Asia Awards Survey 2015. The US investment bank was rated sixth in the same survey for 2014. The overall score was consistently played out for each of the four criteria, with the bank rated as the third most favoured in terms of price competitiveness, understanding client needs, innovation and structuring capability and aftersales service.
JP Morgan’s scores in the qualitative criteria put it far above the industry average in all four categories, with its best showing in understanding client needs, closely followed by its strong performance in price competitiveness. The US bank scored almost as well in aftersales service and nearly as well in innovation and structuring capabilities.
In the region’s most active structured products countries, JP Morgan was best placed in South Korea, according to SRP data. It claimed a 7% market share in the country, putting it fourth in the ranking based on product sales. There was also a strong showing in Taiwan, where the bank was ranked in the top four producers for the country. It held a similar position in the Singapore market, with a presence in the Hong Kong market also showing through.
In asset classes, the US bank was equal third for the region in equity-linked products, although a little lower ranked in terms of sales volume in the asset class, according to SRP data. JP Morgan fared equally well in foreign exchange-linked products, an asset class in which it was one of the clear leaders in the region. Its main showing in the respective asset classes was, unsurprisingly, in interest rates, where the bank was rated second by the survey respondents. It was third in the volume of sales of interest rate-linked products, according to SRP data.
The good showing in interest rates was repeated in hybrids, with the bank ranked third by survey respondents and appearing in the top six for sales volumes of these products, although the sales volumes put it a long way below the two European banks that were the top two providers.
Commodity-linked products were equally strong for JP Morgan, which was ranked second in this asset class by respondents to the survey.
2.19
2.18
1.92
1.96
0.87
0.86
0.80
0.82
0 0.5 1 1.5 2 2.5
Price Competitiveness
Understanding Client Needs
Innovation & Structuring Capability
After Sales Service
JPMorganStrengths & Weaknesses
Industry Average JPMorgan
Strengths and Weaknesses
4.3 JP Morgan
IntroductionM
anagement Sum
mary
Bank AnalysisAw
ards ResultsAppendix
Market Shares
Service Provider AnalysisAsia-Pacific Sum
mary
SRP Asia-Pacific Awards Report 201518
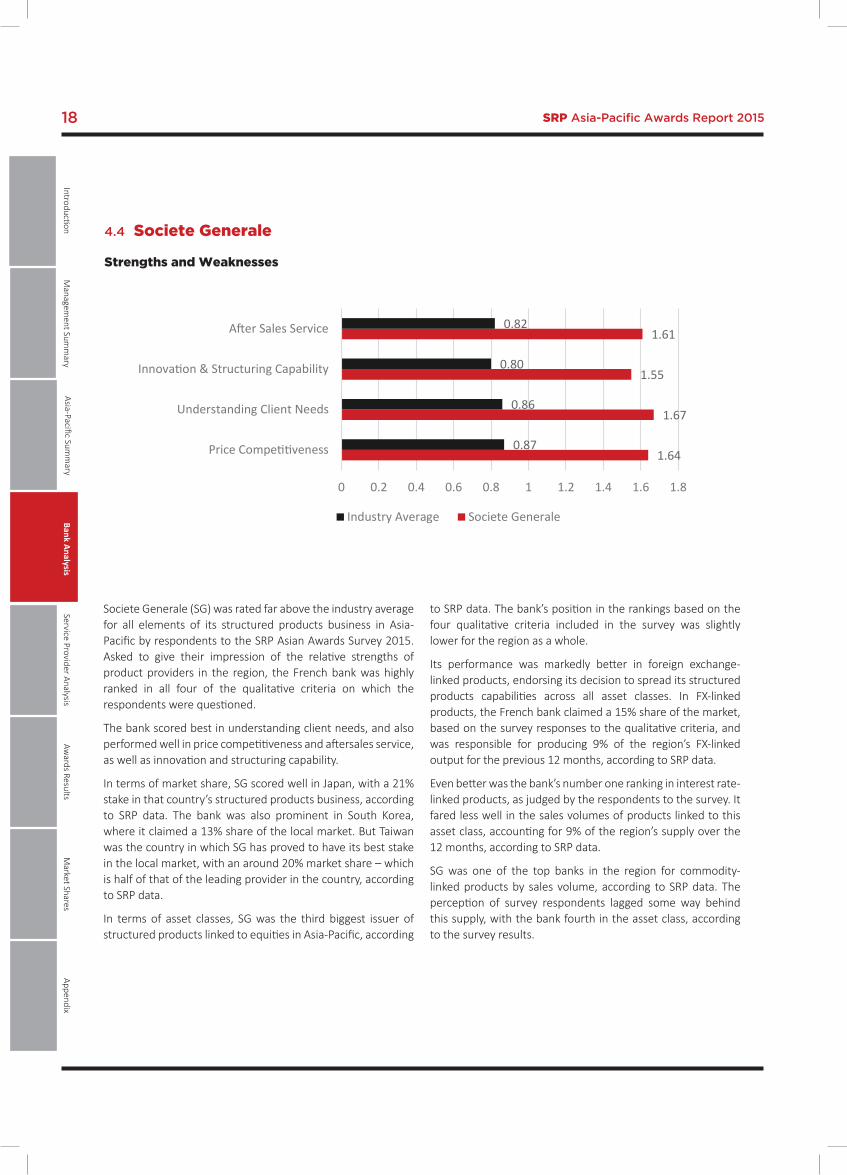
1.64
1.67
1.55
1.61
0.87
0.86
0.80
0.82
0 0.2 0.4 0.6 0.8 1 1.2 1.4 1.6 1.8
Price Competitiveness
Understanding Client Needs
Innovation & Structuring Capability
After Sales Service
Societe GeneraleStrengths & Weaknesses
Industry Average Societe Generale
Societe Generale (SG) was rated far above the industry average for all elements of its structured products business in Asia-Pacific by respondents to the SRP Asian Awards Survey 2015. Asked to give their impression of the relative strengths of product providers in the region, the French bank was highly ranked in all four of the qualitative criteria on which the respondents were questioned.
The bank scored best in understanding client needs, and also performed well in price competitiveness and aftersales service, as well as innovation and structuring capability.
In terms of market share, SG scored well in Japan, with a 21% stake in that country’s structured products business, according to SRP data. The bank was also prominent in South Korea, where it claimed a 13% share of the local market. But Taiwan was the country in which SG has proved to have its best stake in the local market, with an around 20% market share – which is half of that of the leading provider in the country, according to SRP data.
In terms of asset classes, SG was the third biggest issuer of structured products linked to equities in Asia-Pacific, according
to SRP data. The bank’s position in the rankings based on the four qualitative criteria included in the survey was slightly lower for the region as a whole.
Its performance was markedly better in foreign exchange-linked products, endorsing its decision to spread its structured products capabilities across all asset classes. In FX-linked products, the French bank claimed a 15% share of the market, based on the survey responses to the qualitative criteria, and was responsible for producing 9% of the region’s FX-linked output for the previous 12 months, according to SRP data.
Even better was the bank’s number one ranking in interest rate-linked products, as judged by the respondents to the survey. It fared less well in the sales volumes of products linked to this asset class, accounting for 9% of the region’s supply over the 12 months, according to SRP data.
SG was one of the top banks in the region for commodity-linked products by sales volume, according to SRP data. The perception of survey respondents lagged some way behind this supply, with the bank fourth in the asset class, according to the survey results.
Strengths and Weaknesses
4.4 Societe Generale
IntroductionM
anagement Sum
mary
Bank AnalysisAw
ards ResultsAppendix
Market Shares
Service Provider AnalysisAsia-Pacific Sum
mary

SRP Asia-Pacific Awards Report 2015 19
2.99
3
3
3
0.87
0.86
0.80
0.82
0 0.5 1 1.5 2 2.5 3
Price Competitiveness
Understanding Client Needs
Innovation & Structuring Capability
After Sales Service
UBS Strengths & Weaknesses
Industry Average UBS
Strengths and Weaknesses
It has been UBS’s year. The Swiss bank swept its way up the rankings to be the top provider of structured products in Asia-Pacific, according to the SRP’s Asia Awards Survey 2015. The Swiss bank was ranked fifth in last year’s.
In 2015, UBS was the second most popular bank in price competitiveness, and best for understanding client needs. It was top for innovation and structuring capabilities, and also for aftersales services.
In the final assessment of the Swiss bank’s strengths and weaknesses, it was ranked a very long way ahead of the industry average, according to the survey results.
As far as market shares in the most active structured products markets in Asia-Pacific, UBS has sustained a good-sized stake in almost all of these markets, according to SRP data. In China, the bank was ranked second as a product provider, with a 20% share, although this it joined all other producers in the large shadow of Citic Securities’s presence as a product producer in the country.
In Hong Kong, UBS claimed a 7% market share, which, although putting it a long way behind the leading issuer, put it second in
the rankings in terms of sales volumes, according to SRP data. The Swiss bank was ranked third in Singapore, with a 13% share of the market in terms of sales volumes.
Its most important rankings for market shares was in the burgeoning South Korea market, in which it was ranked first in terms of sales volumes, with 28% of the market, and also in Taiwan. The Swiss bank has claimed almost 50% of the Taiwan market by sales volume over the previous 12 months, making it the leading issuer in the local market, according to SRP data.
UBS’s appearances in the rankings for asset classes was equally spectacular, with the bank taking a 20% stake in the equity-linked structured products market across the region, according to the views of survey respondents. The Swiss bank’s market share in this asset class was almost twice that of the clutch of banks that followed. The survey ranking was matched by sales volumes recorded in the SRP database, which show that UBS had a 28% share of the market for this asset class in the region over the preceding 12 months.
4.5 UBS
IntroductionM
anagement Sum
mary
Bank AnalysisAw
ards ResultsAppendix
Market Shares
Service Provider AnalysisAsia-Pacific Sum
mary
SRP Asia-Pacific Awards Report 201520
NH Investment & Securities, part of NH Financial Group, which has merged with Woori Investment & Securities in early 2014 has again been recognised as the Best Distributor in Asia, succeeding Woori Investment & Securities naming as the Best Distributor Asia (ex-Japan) and the Best Distributor South Korea in 2014.
The firm was recognised for its outstanding annual sales and the performance of the products it sold to retail and private banking clients, which ultimately represents the company’s capability of offering diversified range of products reflecting market conditions in addition to the competitive yield it can bring to the clientele as well as large size client base it can reach, including retail investors, high net worth individuals as well as institutional investors.
Woori Investment & Securities, which has historically been one of the major securities firms within the structured products industry has started its over-the-counter (OTC) business in 2002 when the regulator opened up the OTC operation in South Korea. Since then, the firm extensively grew its reputation within structured products through constantly developing new payoffs reflecting market conditions and offering new kinds
of structured products. The firm brought in long-short index linked equity-linked bonds (ELBs), the first kind of propriety index-linked structured products for the first time in the industry, and it is also a pioneer for introducing three indices linked equity-linked securities (ELSs) and hybrid products.
While the majority of South Korean securities houses depend on back-to-back hedges when offering structured products, the company has constantly been investing in human capital and technology infrastructure to offer products through in-house hedging.
Since the merger between NH Investment & Securities and Woori Investment & Securities, it became the largest securities house in terms of total assets, currently at KRW42tr. With the advantage of the retail network NH Financial Group has, the company is able to distribute products through NH Bank and NongHyup Life Insurance as well as NH-CA Asset Management. Furthermore, as the regulator allowed the removal of barriers between banks, securities and insurance companies, NH Financial Group opened the first financial complex branch in South Korea in January 2015.
4.6 Best Distributor Asia NH Investment & Securities
IntroductionM
anagement Sum
mary
Bank AnalysisAw
ards ResultsAppendix
Market Shares
Service Provider AnalysisAsia-Pacific Sum
mary
SRP Asia-Pacific Awards Report 2015 21
S&P Dow Jones Indices (S&P DJI) is the leading index provider in Asia, according to respondents of the SRP Asia Awards Survey. Twenty Seven percent of the respondents valued S&P DJI as the best index provider in Asia on the basis of innovation, competitiveness, and understanding clients’ needs. S&P DJI provides a full range of indices across all asset classes, providing investors with innovative solutions to attain income and performance in the current low interest rate environment.
S&P DJI has been the pioneer in smart beta strategy, introducing the first non-market cap weighted index, S&P 500 Equal Weight Index (EWI) in 2003, which has also been applied to international equities, as well as in other asset class, such as fixed-income indices and commodity indices. In the same year, it has also launched The Dow Jones US Select Dividend Index, which pioneered the dividend indexing that measure the performance of yield-based investment strategies that are designed to address varying needs for high yield or stable payouts. Exchange-traded products (ETPs) tracking S&P DJI’s smart beta indices topped $113.8bn in assets as of February 2015.
In regards to Asia, the S&P Global Intrinsic Value Japan Index stand out as one of the most successful smart beta indices, driven by the lead of Government Pension Investment Fund
(GPIF) in Japan using tailored benchmarks for stocks driving the fund managers to adopt smart-beta active management. The index lists low-volatility shares weighted by intrinsic value, which is calculated by assessing the value of assets and their earnings growth.
According to SRP database, there are over 4,300 structured products linked to S&P Dow Jones Indices in 2015 in Asia-Pacific with the S&P 500 dominating total issuance and South Korea being the most active country for providers. S&P DJI also announced an agreement with Korea Exchange (KRX) in November 2014 to manage the commercial licensing of all existing KRX indices, including the Kospi 200, the leading gauge of equity market performance in South Korea, to potential clients worldwide.
S&P DJI also contributes to the education of the investors by publishing smart beta strategy research and educational papers and videos through the online platform www.spdji.com/theme/smart-beta. Their Indexology Blog also provides complementary and customised assess to on-going market analysis and index investment concepts on smart beta strategy www.indexologyblog.com, in addition to seminars and webinars hosted to educate the market.
5.1 Best Index Provider S&P Dow Jones Indices
IntroductionM
anagement Sum
mary
Bank AnalysisAw
ards ResultsAppendix
Market Shares
Service Provider AnalysisAsia-Pacific Sum
mary
5.0 Service Provider Analysis

SRP Asia-Pacific Awards Report 201522
Linklaters has been recognised as the top law firm for its market leadership in the development of new and sophisticated products in the structured products industry in Asia.
The firm is recognised for its depth of knowledge in structured products and derivatives, its responsiveness to the regulatory development and its capability to explain complex concepts.
Linklaters works with major financial institutions on the most important deals and legal issues surrounding structured products and derivatives and it is well known for its active role in advising market players on structured products and derivatives covering all asset classes, including options, futures, commodities derivatives and interest rate swaps to securitisations as well as synthetic collateralised debt obligations and structured investment vehicles. The firm also handles various structured products traded over the counter. The firm is also closely in contact with the regulatory authorities around the world to allow the firm to advise on
regulatory issues arising from the structuring and marketing of derivatives products.
Respondents have stressed Linklaters’ ability to explain and deal with complicated concepts, which is reflected in the firm’s record with the most complex and high value derivatives disputes as well as its litigation team working closely with the firm’s market-leading derivatives and structured products practices.
Linklaters was founded in 1838 in London when John Linklater entered into partnership with Julius Dods. After going through a number of partnerships and merges globally, the firm has a global network of 29 offices covering the core and emerging countries across Western Europe, Emerge Europe, Americas, Asia Pacific, Middle East and Africa.
5.2 Best Law Firm Linklaters
IntroductionM
anagement Sum
mary
Bank AnalysisAw
ards ResultsAppendix
Market Shares
Service Provider AnalysisAsia-Pacific Sum
mary
SRP Asia-Pacific Awards Report 2015 23
5.3 Best Technology Provider Bloomberg
Bloomberg has been recognised as the leading technology provider in innovation, pricing, e-commerce and client interface. Fifty eight percent of respondents of the SRP Asia Awards Survey valued Bloomberg as the best technology provider for it’s technology innovation, infrastructure, trade execution and interface.
The Bloomberg Professional service is used by more than 320,000 subscribers, supporting all aspects of pre- and post-trade workflow for derivatives, including idea generation, structuring, pricing, risk management, regulation, reporting and operations.
The internationalisation of the structured products market is seeing investors place significant value in transparency and having the right information and tools to spur investment decisions.
Underlying this trend is a broad investor need for greater efficiency and progressive solutions that can drive market development. Bloomberg’s technology is playing a critical role in the shift towards electronic trading. The power of data and analytics has been transformative for the currency market, increasing liquidity and price transparency that in turn bolsters investor confidence and enhances market participation.
In 2014, Bloomberg launched its Derivatives Library, DLIB<GO>, a platform to structure, price and risk manage derivatives, structured product and dynamic strategies. In addition, it released a simplified scripting language for product creation which is universal across all asset classes, ensuring coverage for derivatives and structured products and allowing for the creation of the formula-based strategies. For electronic
trading, Bloomberg is engaging with the sell-side to leverage its DLIB Model API to allow the creation of a multi-asset electronic trading platform, integrating sell-side quant models to produce trading prices. All functionalities, such as life-cycle information with full audit trail, document generation, back-testing, pricing, various probabilities, cashflow analytics, greeks, risk, calibration of quant models, scenario analysis, stress testing,
Excel and API are automatically supported, allowing customers to distribute them on the Bloomberg network. The company has also produced AIM, or Asset and Investment Manager, a portfolio management, trading and operations platform, which is one of a number of offerings that is designed specifically for the buy-side, supporting a range of firms’ front-, middle- and back-office needs.
Used by 700 buy-side companies globally, AIM provides institutional investors with decision support and portfolio management tools such as pre-trade analytics, post-trade matching and end-of-day compliance, settlement, reconciliation, performance measurement, data aggregation, and reporting capabilities. Its cross-asset functionality, covering equities, fixed income, foreign exchange, listed equity options, futures, and over-the-counter derivatives, gives it a broad appeal to the global investment management community, while its ability to route to 2,300 venues, including dark pools, makes it the integrated front-office platform of choice on the buy side. Confirmations are provided through Bloomberg’s voice confirmation service, and through Swift and Omgeo.
IntroductionM
anagement Sum
mary
Bank AnalysisAw
ards ResultsAppendix
Market Shares
Service Provider AnalysisAsia-Pacific Sum
mary
SRP Asia-Pacific Awards Report 201524
5.4 Best Derivatives Exchange Hong Kong Exchange and Clearing
Hong Kong Exchange and Clearing (HKEx) is the leading derivatives exchange in Asia-Pacific, according to respondents of the SRP Asia Pacific Awards Survey. Respondents consider HKEx to be the best derivatives exchange overall, with votes for the exchange far outpacing votes for any other: 38% of respondents judged HKEx to have the best infrastructure, while 18% agreed that HKEx excelled in market turnover rate and 29% agreed that they excelled in being responsive to market needs. Also thirty-three percent of the votes suggested that HKEx has the best compliance for regulation, according to the survey.
HKEx operates a securities market and a derivatives market in Hong Kong and the clearing houses for those markets, making Hong Kong one of the top markets in the world in terms of exchange-traded-funds (ETFs), warrants, callable bull/bear contracts, futures and options. Due to its outstanding performance, the company won the Best Exchange last year and successfully defended this in 2015.
As for last year, survey respondents provided various comments on what more exchanges can do for them, ranging from increasing liquidity in secondary markets, fostering more market players, to developing new products, lowering licensing fees and shortening the listing process. There were also calls for easing regulation and a specific request to promote a more favorable environment for ETF trading. In the past year, HKEx has co-operated with the Shanghai Stock Exchange in China to launch the Shanghai – Hong Kong
Stock Connect to provide mutual trading access between the two stock markets, as well as increase cross-border access to investment and generate more opportunities for the trading of derivative-linked instruments.
Besides shares, HKEx is also focusing on ETFs and other derivatives. The average daily turnover (ADT) of HKEx’s ETF market in July was HK$13.8 billion, which was up 2% from June and 3.5 times the ADT of the same period last year. Currently, there are 131 ETFs listed with 33% invested in mainland A-shares, 56% in Hong Kong and other Asia-Pacific equities, nine featured fixed income and FX and six featured commodities.
Earlier this year the trading of local warrants and bull bear certificates on Hong Kong’s stock market has increased by 139%, with some warrants driving more activity than the underlying shares. Up until the end of May, year-on-year daily trading volumes around warrants surged to HK$19.8 (US$2.55bn), while the daily trading volumes of bull bear certificates jumped by 35%, to HK$6.7bn, making Hong Kong the biggest markets of listed derivatives worldwide.
The market capitalisation of warrants and bull bear certificates reached HK$20bn in the first half of the year, up 110% compared with the end of 2014.
IntroductionM
anagement Sum
mary
Bank AnalysisAw
ards ResultsAppendix
Market Shares
Service Provider AnalysisAsia-Pacific Sum
mary
SRP Asia Pacfic Awards Report 2015 25
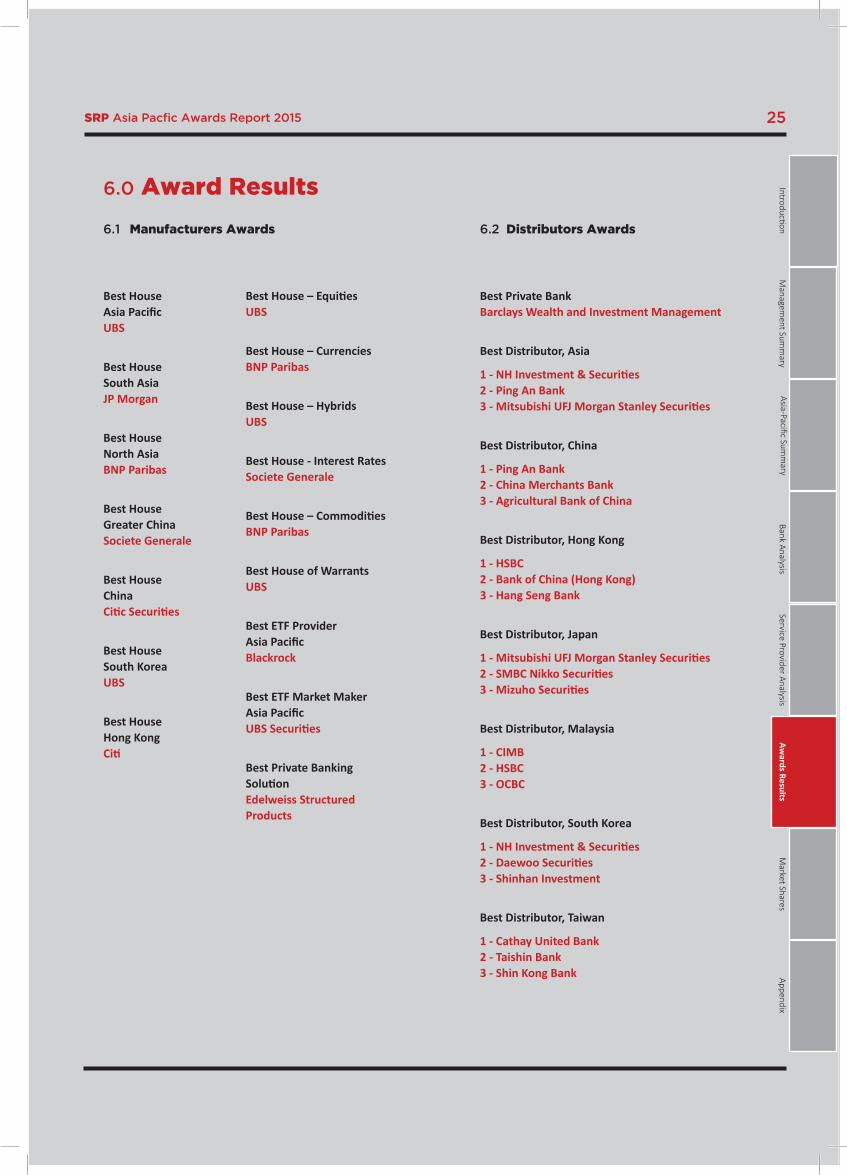
Best Private Bank Barclays Wealth and Investment Management
Best Distributor, Asia
1 - NH Investment & Securities 2 - Ping An Bank 3 - Mitsubishi UFJ Morgan Stanley Securities
Best Distributor, China
1 - Ping An Bank 2 - China Merchants Bank 3 - Agricultural Bank of China
Best Distributor, Hong Kong
1 - HSBC 2 - Bank of China (Hong Kong) 3 - Hang Seng Bank
Best Distributor, Japan
1 - Mitsubishi UFJ Morgan Stanley Securities 2 - SMBC Nikko Securities 3 - Mizuho Securities
Best Distributor, Malaysia
1 - CIMB 2 - HSBC 3 - OCBC
Best Distributor, South Korea
1 - NH Investment & Securities 2 - Daewoo Securities 3 - Shinhan Investment
Best Distributor, Taiwan
1 - Cathay United Bank 2 - Taishin Bank 3 - Shin Kong Bank
6.0 Award Results
Best House Asia Pacific UBS
Best House South Asia JP Morgan
Best House North Asia BNP Paribas
Best House Greater China Societe Generale
Best House China Citic Securities
Best House South Korea UBS
Best House Hong Kong Citi
Best House – Equities UBS
Best House – Currencies BNP Paribas
Best House – Hybrids UBS
Best House - Interest Rates Societe Generale
Best House – Commodities BNP Paribas
Best House of Warrants UBS
Best ETF Provider Asia Pacific Blackrock
Best ETF Market Maker Asia Pacific UBS Securities
Best Private Banking Solution Edelweiss Structured Products
6.1 Manufacturers Awards 6.2 Distributors Awards
IntroductionM
anagement Sum
mary
Bank AnalysisAw
ards ResultsAppendix
Market Shares
Service Provider AnalysisAsia-Pacific Sum
mary
SRP Asia Pacfic Awards Report 201526
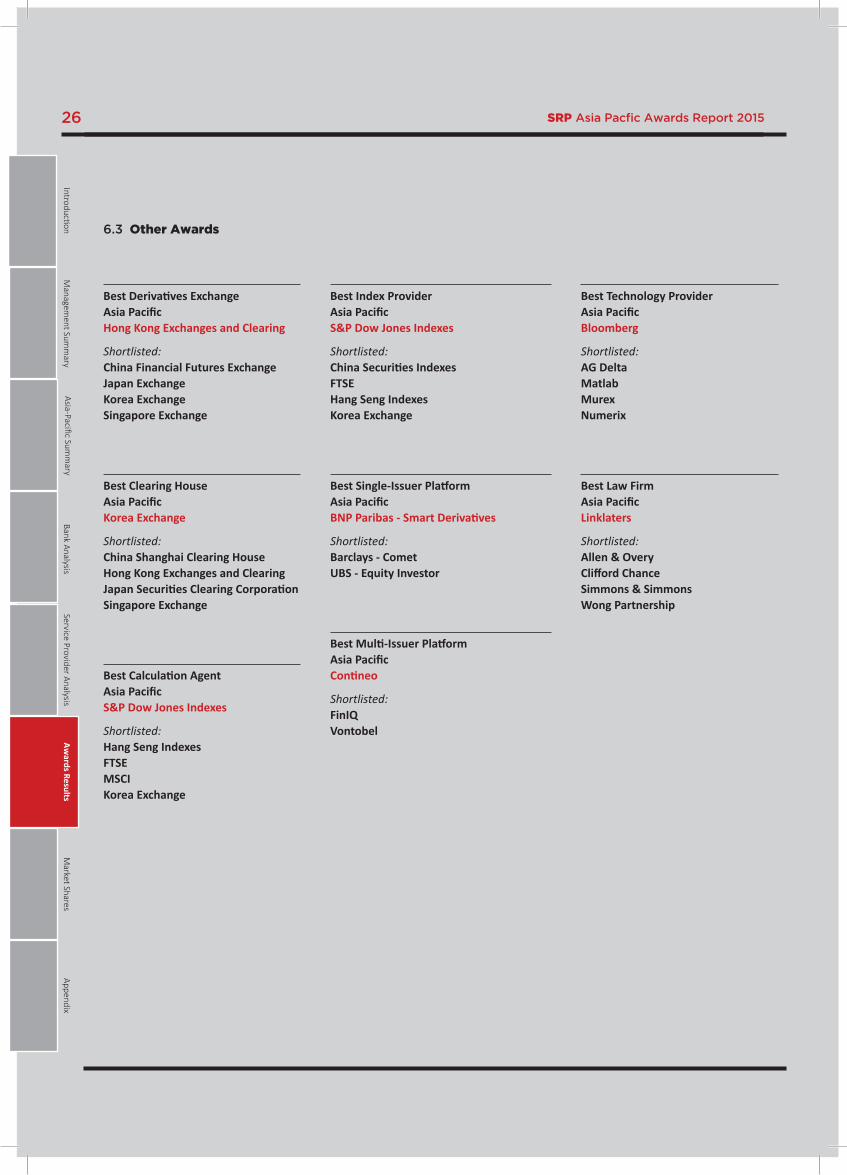
6.3 Other Awards
Best Derivatives Exchange Asia Pacific Hong Kong Exchanges and Clearing
Shortlisted: China Financial Futures Exchange Japan Exchange Korea Exchange Singapore Exchange
Best Clearing House Asia Pacific Korea Exchange
Shortlisted: China Shanghai Clearing House Hong Kong Exchanges and Clearing Japan Securities Clearing Corporation Singapore Exchange
Best Calculation Agent Asia Pacific S&P Dow Jones Indexes
Shortlisted: Hang Seng Indexes FTSE MSCI Korea Exchange
Best Index Provider Asia Pacific S&P Dow Jones Indexes
Shortlisted: China Securities Indexes FTSE Hang Seng Indexes Korea Exchange
Best Single-Issuer Platform Asia Pacific BNP Paribas - Smart Derivatives
Shortlisted: Barclays - Comet UBS - Equity Investor
Best Multi-Issuer Platform Asia Pacific Contineo
Shortlisted: FinIQ Vontobel
Best Technology Provider Asia Pacific Bloomberg
Shortlisted: AG Delta Matlab Murex Numerix
Best Law Firm Asia Pacific Linklaters
Shortlisted: Allen & Overy Clifford Chance Simmons & Simmons Wong Partnership
IntroductionM
anagement Sum
mary
Bank AnalysisAw
ards ResultsAppendix
Market Shares
Service Provider AnalysisAsia-Pacific Sum
mary

SRP Asia Pacfic Awards Report 2015 27
Best Hedge Fund Blackrock
Shortlisted: Bluecrest Capital JP Morgan Asset Management Man Group Winton Capital
Best Strategy Index Credit Suisse
Shortlisted: BNP Paribas S&P Dow Jones Indexes
Best Structured Fund Credit Suisse
Best Insurance Solution Credit Suisse
IntroductionM
anagement Sum
mary
Bank AnalysisAw
ards ResultsAppendix
Market Shares
Service Provider AnalysisAsia-Pacific Sum
mary

London 13th European Structured Products & Derivatives Conference
Join the game-changers at Europe’s biggest Structured Products & Derivatives industry event
For more information, please visit structuredretailproducts.com/europe
To discuss a tailored sponsorship solution, please callKris Deslagmeulder +44 (0)20 7779 8201 or email [email protected]
London | 11 & 12 February 2016

29SRP Asia-Pacific Awards Report 2015
UBS 20%
Citi 4%
Citic Securities 75%
HSBC 1%
ChinaMarket Share by manufacturer
Credit Agricole 1%
UBS 7%
BNP Paribas 85%
JP Morgan 1%Citic Securities 5%
Morgan Stanley 1%
Hong KongMarket Share by manufacturer
IntroductionM
anagement Sum
mary
Bank AnalysisAw
ards ResultsAppendix
Market Shares
Service Provider AnalysisAsia-Pacific Sum
mary
London 13th European Structured Products & Derivatives Conference
Join the game-changers at Europe’s biggest Structured Products & Derivatives industry event
For more information, please visit structuredretailproducts.com/europe
To discuss a tailored sponsorship solution, please callKris Deslagmeulder +44 (0)20 7779 8201 or email [email protected]
London | 11 & 12 February 2016
7.0 Market shares
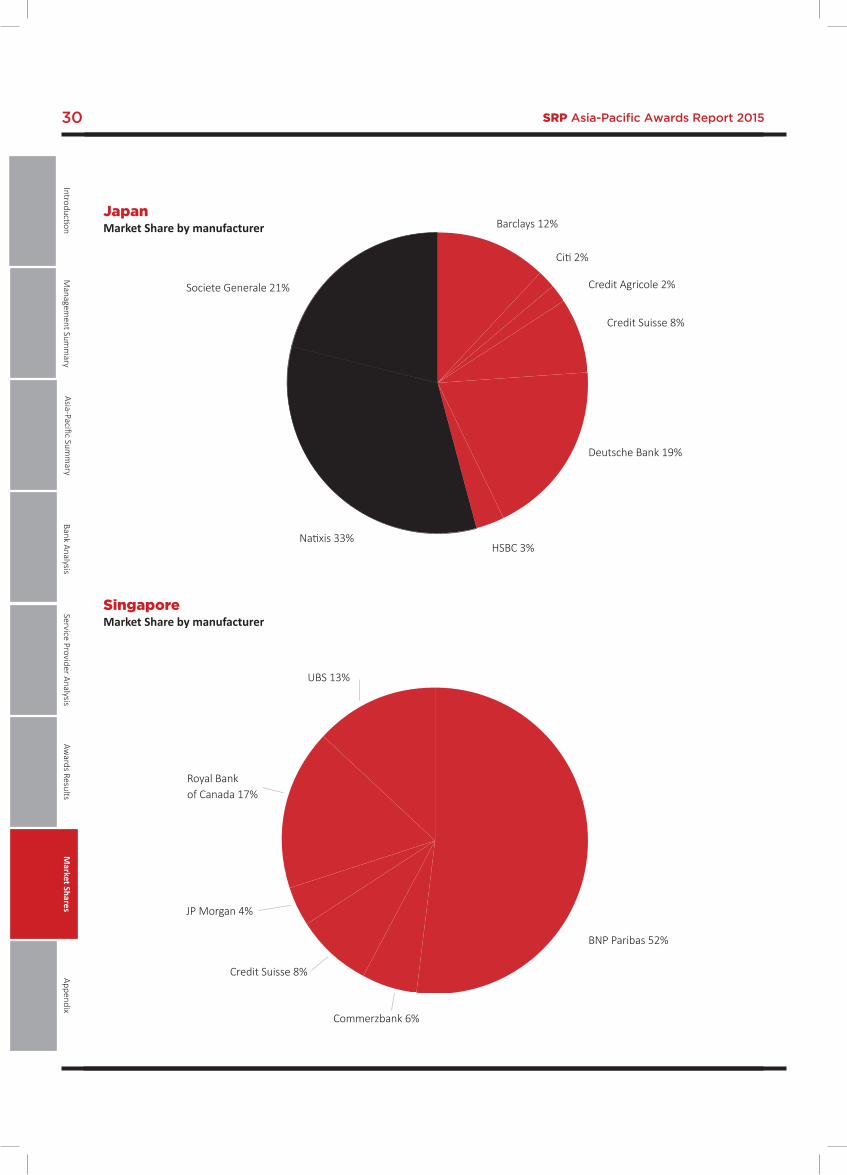
SRP Asia-Pacific Awards Report 201530
Barclays 12%
Credit Agricole 2%Societe Generale 21%
Credit Suisse 8%
Citi 2%
HSBC 3%Natixis 33%
Deutsche Bank 19%
JapanMarket Share by manufacturer
Royal Bank of Canada 17%
UBS 13%
BNP Paribas 52%
Commerzbank 6%
JP Morgan 4%
Credit Suisse 8%
SingaporeMarket Share by manufacturer
IntroductionM
anagement Sum
mary
Bank AnalysisAw
ards ResultsAppendix
Market Shares
Service Provider AnalysisAsia-Pacific Sum
mary
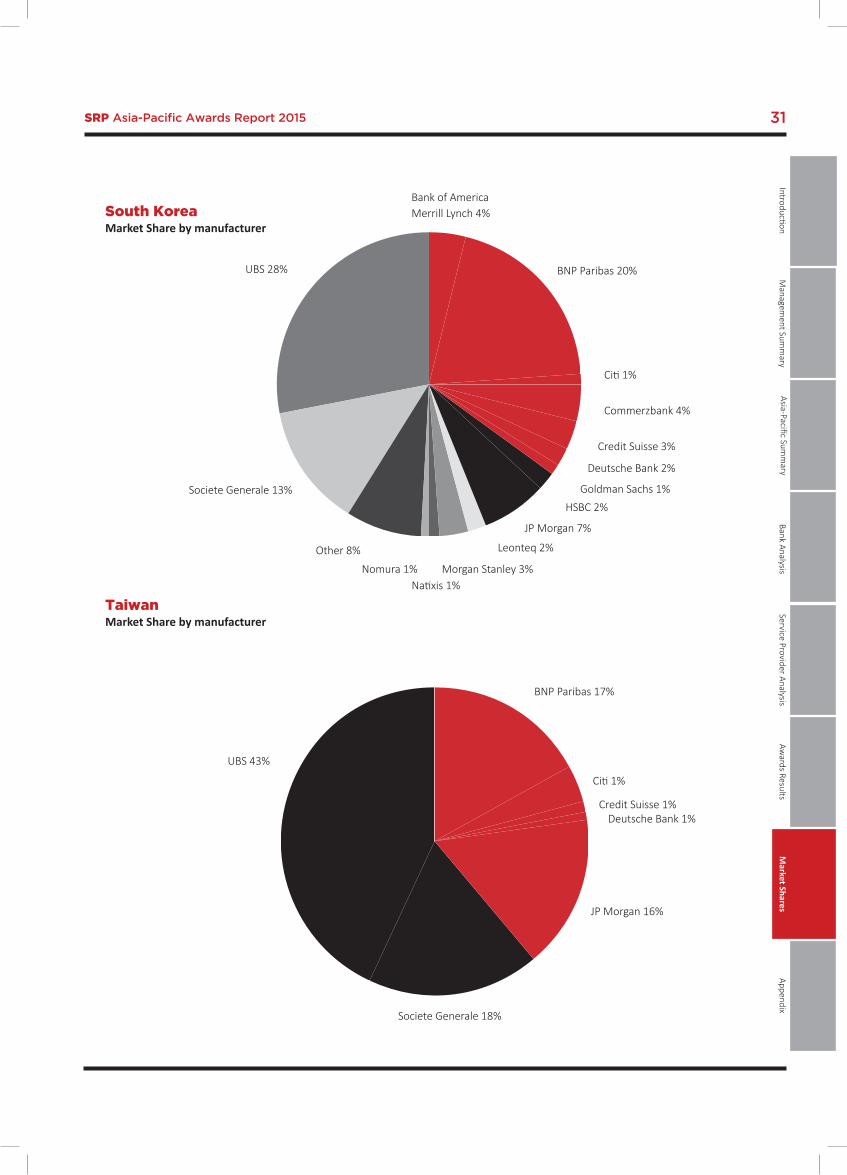
SRP Asia-Pacific Awards Report 2015 31
TaiwanMarket Share by manufacturer
UBS 43%
BNP Paribas 17%
JP Morgan 16%
Societe Generale 18%
Credit Suisse 1%
Citi 1%
Deutsche Bank 1%
South KoreaMarket Share by manufacturer
Commerzbank 4%
Natixis 1%Nomura 1%
UBS 28% BNP Paribas 20%
JP Morgan 7%
Societe Generale 13%
Credit Suisse 3%
Citi 1%
Bank of America Merrill Lynch 4%
Morgan Stanley 3%
Goldman Sachs 1%HSBC 2%
Other 8%
Deutsche Bank 2%
Leonteq 2%
IntroductionM
anagement Sum
mary
Bank AnalysisAw
ards ResultsAppendix
Market Shares
Service Provider AnalysisAsia-Pacific Sum
mary
SRP Asia-Pacific Awards Report 201532
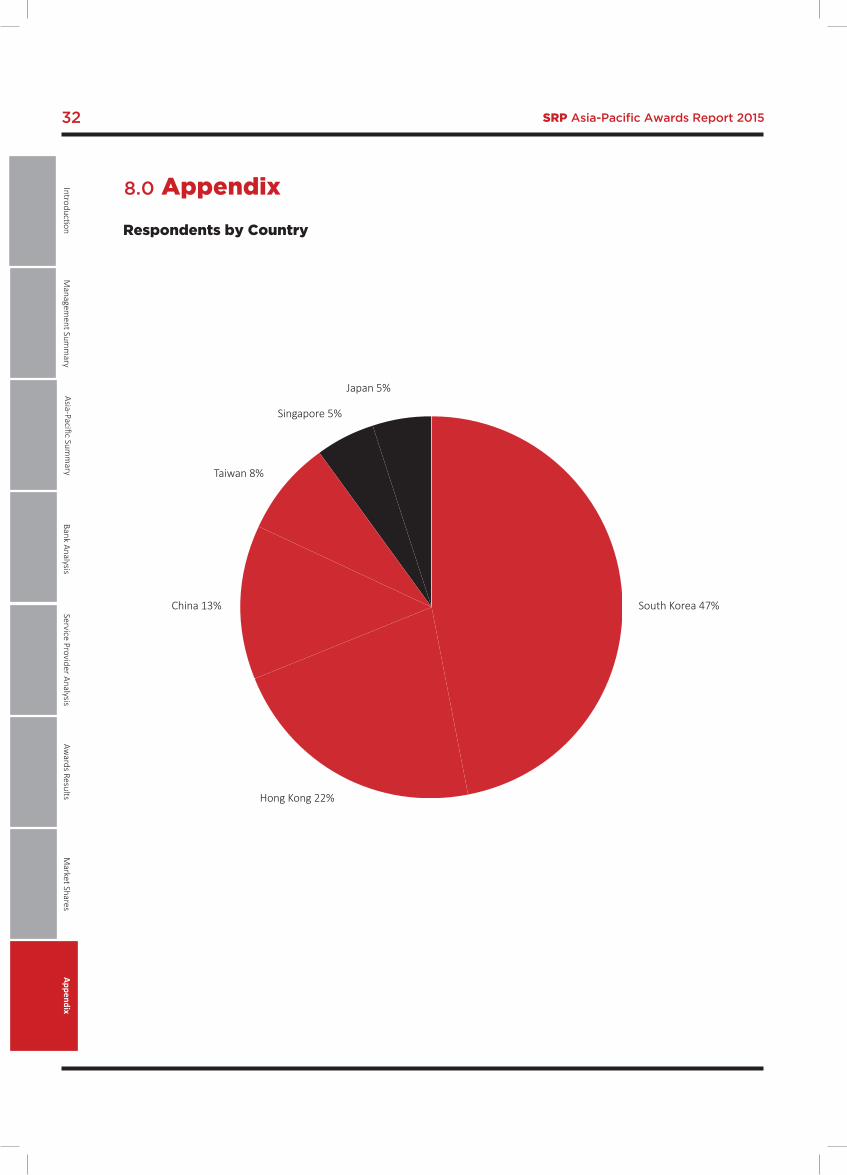
Respondents by Country
8.0 AppendixIntroductionM
anagement Sum
mary
Bank AnalysisAw
ards ResultsAppendix
Market Shares
Service Provider AnalysisAsia-Pacific Sum
mary
South Korea 47%
Hong Kong 22%
China 13%
Taiwan 8%
Singapore 5%
Japan 5%
DISCOVER ALPHA SP : SOCIÉTÉ GÉNÉRALE’S TRADING PLATFORM FOR CROSS ASSET STRUCTURED PRODUCTS
FOR MORE INFORMATION: WWW.ALPHAINFO.SOCGEN.COM/SP | [email protected]
CREATE, QUOTE AND EXECUTE YOUR STRUCTURED PRODUCTS IN REAL TIME:
www.alphainfo.socgen.com/sp
For marketing and information purposes by Société Générale Paris. The information mentioned herein is not intended to be construed as a solicitation or an offer to buy or sell any securities or related financial instruments. The content of this document is for information purposes only. SG accept no responsibility whatsoever for the accuracy and completeness. Your access to the Alpha SP Services is subject to various conditions and restrictions (geographical location, client type). SG retains full discretion to grant you access to the Services. Please contact SG to find out whether the Services may be available to you. Copyright: the Société Générale Group 2015. All rights reserved.