Embed Size (px)
Citation preview
Comprehensive Annual Financial Report
For the Fiscal Years Ended June 30, 2013 and 2012
Multi-City Subregional Operating Group
S R O G (an Arizona Joint Venture)

MULTI-CITY SUBREGIONAL OPERATING GROUP (SROG)
(An Arizona Joint Venture)
Comprehensive Annual Financial Report For the Fiscal Years Ended June 30, 2013 and 2012
Prepared By: City of Phoenix
Finance Department Financial Accounting and Reporting Division
Jeff DeWitt, Chief Financial Officer
I
Multi-City Subregional Operating Group (SROG)
Comprehensive Annual Financial Report
For the Fiscal Years Ended June 30, 2013 and 2012
Table of Contents
Page No.
Introductory Section
Letter of Transmittal II
Certificate of Achievement for Excellence in Financial Reporting VII
Committee Members VIII
Organizational Chart IX
Financial Section
Independent Auditor's Report 1
Management's Discussion and Analysis 3
Basic Financial Statements
Statements of Net Position 9
Statements of Revenues, Expenses and Changes in Net Position 10
Statements of Cash Flows 11
Notes to the Financial Statements 13
Supplementary Information
Net Operating and Maintenance Expenditures 27
Members' CIP Account Activity 30
Operating Deposits Activity 31
Equipment Replacement Deposits Activity 32
Statistical Section
Statements of Net Position - Last Ten Fiscal Years 34
Statements of Revenues, Expenses and Changes in Net Position - Last Ten
Fiscal Years 34
Members' Charges - Last Ten Fiscal Years 35
Area Map 36
SROG Cities' Population Growth - Last Ten Fiscal Years 37
Demographic and Economic Statistics - Last Ten Years 38
Major Employers Metropolitan Phoenix - Current Year and Nine Years Ago 39
SROG Cities' Area Growth - Last Ten Fiscal Years 40
Measured Sewage Flows and Strengths and Rates - Last Ten Fiscal Years 41
Measured Sewage Flows by City - Last Ten Fiscal Years 41
Measured Sewage Strengths - Last Ten Fiscal Years 42
Full-Time Equivalent Employees - Last Ten Fiscal Years 43
Operating and Capital Indicators - Last Ten Fiscal Years 43
II
TO THE MEMBERS OF THE MULTI-CITY SUBREGIONAL OPERATING GROUP
November 22, 2013
In accordance with the requirements of the Multi-City Subregional Operating Group (SROG), I
am pleased to submit the SROG Comprehensive Annual Financial Report for the fiscal year
ended June 30, 2013 and 2012. Responsibility for the accuracy of the data, and the completeness
and fairness of the presentation, including all disclosures, rests with the management of SROG.
To the best of our knowledge and belief, this report is accurate in all material respects and is
reported in a manner designed to present fairly the financial position, results of operations and
cash flows of SROG. All disclosures necessary to enable the reader to gain an understanding of
SROG’s financial position and results of operation have been included.
Heinfeld, Meech & Co. has issued an unmodified (“clean”) opinion on the SROG financial
statements for the year ended June 30, 2013. The independent auditor’s report is located at the
front of the financial section of this report. Management’s discussion and analysis (MD&A)
immediately follows the independent auditor’s report and provides a narrative introduction,
overview, and analysis of the basic financial statements. The MD&A complements this letter of
transmittal and should be read in conjunction with it.
PROFILE OF THE OPERATING GROUP
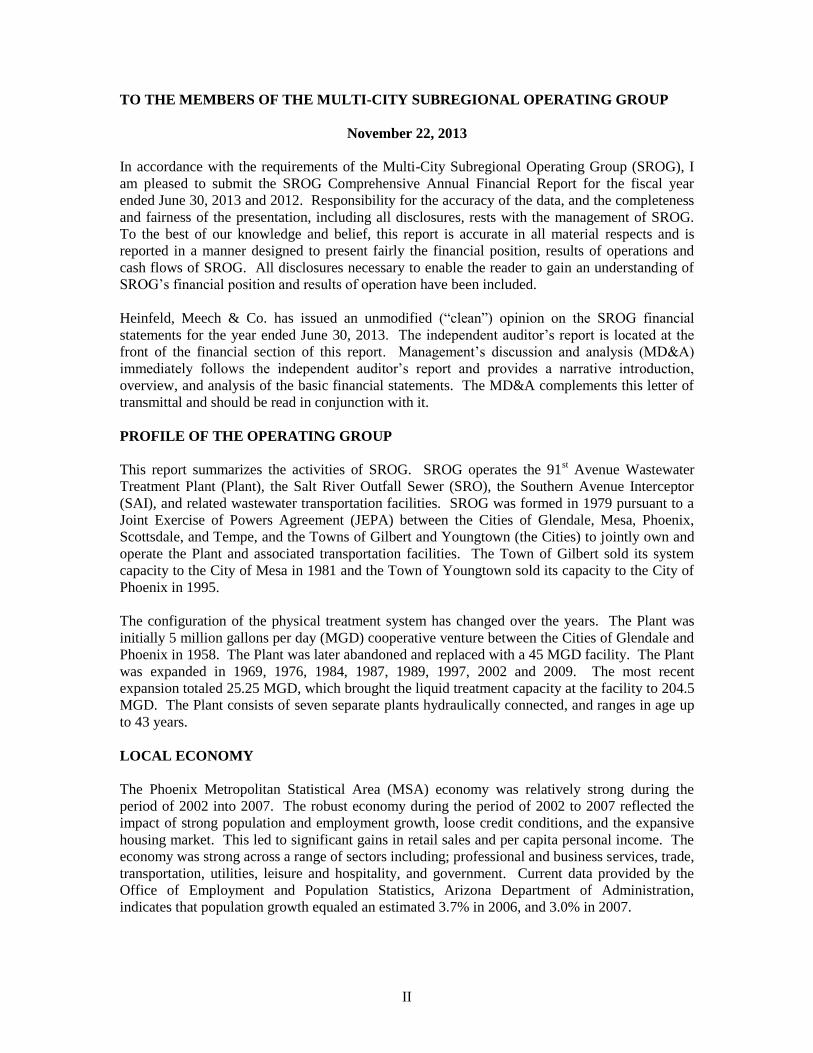
This report summarizes the activities of SROG. SROG operates the 91st Avenue Wastewater
Treatment Plant (Plant), the Salt River Outfall Sewer (SRO), the Southern Avenue Interceptor
(SAI), and related wastewater transportation facilities. SROG was formed in 1979 pursuant to a
Joint Exercise of Powers Agreement (JEPA) between the Cities of Glendale, Mesa, Phoenix,
Scottsdale, and Tempe, and the Towns of Gilbert and Youngtown (the Cities) to jointly own and
operate the Plant and associated transportation facilities. The Town of Gilbert sold its system
capacity to the City of Mesa in 1981 and the Town of Youngtown sold its capacity to the City of
Phoenix in 1995.
The configuration of the physical treatment system has changed over the years. The Plant was
initially 5 million gallons per day (MGD) cooperative venture between the Cities of Glendale and
Phoenix in 1958. The Plant was later abandoned and replaced with a 45 MGD facility. The Plant
was expanded in 1969, 1976, 1984, 1987, 1989, 1997, 2002 and 2009. The most recent
expansion totaled 25.25 MGD, which brought the liquid treatment capacity at the facility to 204.5
MGD. The Plant consists of seven separate plants hydraulically connected, and ranges in age up
to 43 years.
LOCAL ECONOMY
The Phoenix Metropolitan Statistical Area (MSA) economy was relatively strong during the
period of 2002 into 2007. The robust economy during the period of 2002 to 2007 reflected the
impact of strong population and employment growth, loose credit conditions, and the expansive
housing market. This led to significant gains in retail sales and per capita personal income. The
economy was strong across a range of sectors including; professional and business services, trade,
transportation, utilities, leisure and hospitality, and government. Current data provided by the
Office of Employment and Population Statistics, Arizona Department of Administration,
indicates that population growth equaled an estimated 3.7% in 2006, and 3.0% in 2007.

III
LOCAL ECONOMY (CONTINUED)
Then, starting in 2007 and to a significant extent into 2010, the poor housing market combined
with the financial crisis led to significant weakness in the economy. Due to the rapid correction
in the housing market and related business sectors, and the crisis in the financial markets in 2008,
the MSA economy went into a deep recession. Data provided by the Office of Employment and
Population Statistics, Arizona Department of Administration indicates that total employment
decreased in all sectors of the economy. Reflecting the weak economy, the population in the
MSA showed only marginally amounts of growth during the period of 2009 to 2010.
Employment growth started to build in 2011, with some increasing momentum evident starting
during the second half of calendar year 2011. Data provided by the University of Arizona’s Eller
College of Management indicate that employment growth equaled 2.4% and population growth
equaled 1.1% in 2012. The level of economic activity during the balance of 2013 and 2014, both
nationally and in the MSA, will be affected by the following issues; the level of stability in the
financial markets, the recovery of the housing market, the strength of the labor market, the
reemergence of the consumer, and the impact of public policy on the economy. Forecasts
provided by the University of Arizona’s Eller College of Management indicate relatively low
levels of population growth in Maricopa County; 1.3% in 2013 and then 1.5% in 2014.
Employment is expected to increase 2.5% in 2013 and then another 3.4% in 2014. Stronger
employment growth is expected in 2015 and 2016 with gains equal to 3.9% and then 4.1%
expected for 2015 and 2016 respectively. The housing market is slowly recovering as the number
of foreclosures is declining and home prices have been increasing since the second half of 2011.
LONG TERM FINANCIAL PLANNING
Flow and Loading projections, future regulatory compliance, and replacement and rehabilitation
requirements are used in the development of a five year Construction Improvement Program
(CIP). Flow and Loading projections are from SROG engineering master planning reports as
well as annually monitoring and updated Flow and Loading projections based on historical data
and anticipated growth patterns. The amount of wastewater sent to the SROG facilities by each
SROG member varies depending on flow generated in each community. The five year CIP
currently consists of 26 projects with an estimated cost of over $210 million.
MAJOR INITIATIVES
SROG has a number of significant projects underway or recently completed as described below.
These projects will allow SROG to continue to meet demand requirements and to meet Federal,
State and County Regulations.
SMIS Website Hosting and Upgrades
This project provides a budget vehicle to hire a consultant and purchase required
hardware/software to share the recurring costs associated with hosting the SROG Management
Information System (SMIS), previously referred to as the SROG Website, with the SROG Cities.
The project includes expenses related to: updating and replacing outdated software, replacing
aging equipment, modifying programming to accommodate these updates and replacements, and
developing the program for new auditing and reporting modules to increase the transparency of
data used for billing the SROG Cities.
IV
MAJOR INITIATIVES (CONTINUED)
91st Ave WWTP Pipe/Equipment Coating
The goal of the 91st Ave WWTP Pipe/Equipment Coating project is to accurately meet regulatory
requirements (Aquifer Protection Permit) and planned preventive coating of various wastewater
plant equipment that is required in order to improve system reliability and to minimize equipment
and system failures. It would also reduce any crisis failure situations. This project is planned to
be implemented and added to the program at the plant over next 5 years.
Instrumentation and Control Inspection
The Electrical, Instrumentation and Control Systems Testing and Inspection Services program is
to attain or maintain adequate electrical and control systems. The Water Services Department
developed electrical, instrumentation and control standards for all facilities. This program is to
ensure proper emphasis in the electrical, instrumentation and controls systems for design and
construction projects during upgrades or expansions. The selected consultant enforces these
standards on behalf of the City of Phoenix Water Services Department for all projects.
SRO Sanitary Sewer & SAI Condition Assessments
Both the Salt River Outfall (SRO) and the Southern Avenue Interceptor (SAI) Conditions
Assessment projects are similar in scope. These projects utilize consultants to employ CCTV
(closed circuit television) to view the interior of these major interceptors and provide manned
entry into the manholes of each system in order to determine the condition of the facilities and
their structural integrity. For the SAI, the consultant will also employ an electromagnetic
scanning robot to evaluate the condition of a 3,000 foot dual barrel siphon under the Salt River.
RELEVANT FINANCIAL POLICIES
Budgeting Systems and Controls
SROG also maintains budgetary controls, which are designed to ensure compliance with
appropriate provisions of the annual budget adopted by the SROG members. The SROG budget
process provides for input from administrators, management, the SROG committees, and the
member cities in developing revenue and expenditure projections and determining the SROG
programs and services for the coming year.
After tentative adoption of the budget, the SROG Committee may make changes, in accordance
with the applicable JEPA and Arizona State budget law. Transfers between appropriations for
areas not exempted by State budget law are permissible as long as the overall budget is not
increased. After final adoption, transfers between budget appropriations for areas not exempt may
not be made. State law requires SROG to re-budget (re-appropriate) funds for the completion of
contracts that were originally budgeted for and encumbered in a previous fiscal year. This law
necessitates an additional appropriation approval to re-budget funds for contracts not completed
by June 30.
V
RELEVANT FINANCIAL POLICIES (CONTINUED)
Accounting and Administrative Controls
Internal controls are procedures that are designed to protect assets from loss, theft or misuse;
check the accuracy and reliability of accounting data; promote operational efficiency; and
encourage compliance with managerial policies. The management of SROG is responsible for
establishing a system of internal controls designed to provide reasonable assurance that these
objectives are met. Federal and State financial assistance programs require recipients to comply
with many laws and regulations. Administrative controls are procedures designed to ensure
compliance with these requirements. SROG has established a system of administrative controls
to ensure compliance with the requirements of the programs under which it receives financial
assistance. As with other internal controls, this system is subject to periodic review and
evaluation by management. The cost of a control should not exceed the benefits derived from the
control. Therefore, the objective is to provide reasonable, rather than absolute assurance, that the
financial statements are free from any material misstatements. As part of the annual audit
process, internal controls are considered in order to determine the nature, timing, and extent of
auditing procedures.
AWARDS AND ACKNOWLEDGEMENTS
The Government Finance Officers Association of the United States and Canada (“GFOA”)
awarded a Certificate of Achievement for Excellence in Financial Reporting to SROG for its
comprehensive annual financial report for the fiscal year ended June 30, 2012. The Certificate of
Achievement is a prestigious national award recognizing conformance with the highest standards
for preparation of state and local government financial reports.
In order to be awarded a Certificate of Achievement, SROG published an easily readable and
efficiently organized comprehensive annual financial report. This report satisfied both generally
accepted accounting principles and the applicable legal requirements.
A Certificate of Achievement is valid for a period of one year only. SROG has received a
Certificate of Achievement for the last seventeen consecutive years (fiscal years ended 1995
through 2012). We believe that our current comprehensive annual financial report continues to
meet the Certificate of Achievement Program’s requirements, and we are submitting it to the
GFOA to determine its eligibility for another certificate.
The National Association of Clean Water Agencies presented the Plant with a Gold Peak
Performance Award during 2012. Gold awards are issued to member agency facilities that have
zero exceedances in discharge limitations as stated in the National Pollutant Discharge
Elimination System permit. During 2012, SROG had no exceedances. This award provides
recognition to individual agencies for outstanding compliance with the National Pollutant
Discharge Elimination System permit discharge limitations.
VI
AWARDS AND ACKNOWLEDGEMENTS (CONTINUED)
The Tres Rios Phase III Flow Regulating Wetlands received the 2012/13 Crescordia award from
the Valley Forward Association in the Site Development and Landscape: Public Sector category.
This award recognizes outstanding contributions to the physical environment of Valley
communities. The award program is the benchmark for promoting livability, conserving natural
resources and sustaining the valley’s desert environment for future generations.
I want to thank all of the SROG members, Arizona Municipal Water Users Association
(AMWUA) staff, City of Phoenix departments for their cooperation and assistance throughout the
past year and the Financial Accounting and Reporting Division for their efforts in the preparation
of this comprehensive annual financial report. I also appreciate the guidance and support
extended by the SROG Committee.
Respectfully submitted,
Jeff DeWitt
Chief Financial Officer
VII
VIII
Multi-City Subregional Operating Group (SROG)
Comprehensive Annual Financial Report
For the Fiscal Year Ended June 30, 2013 and 2012
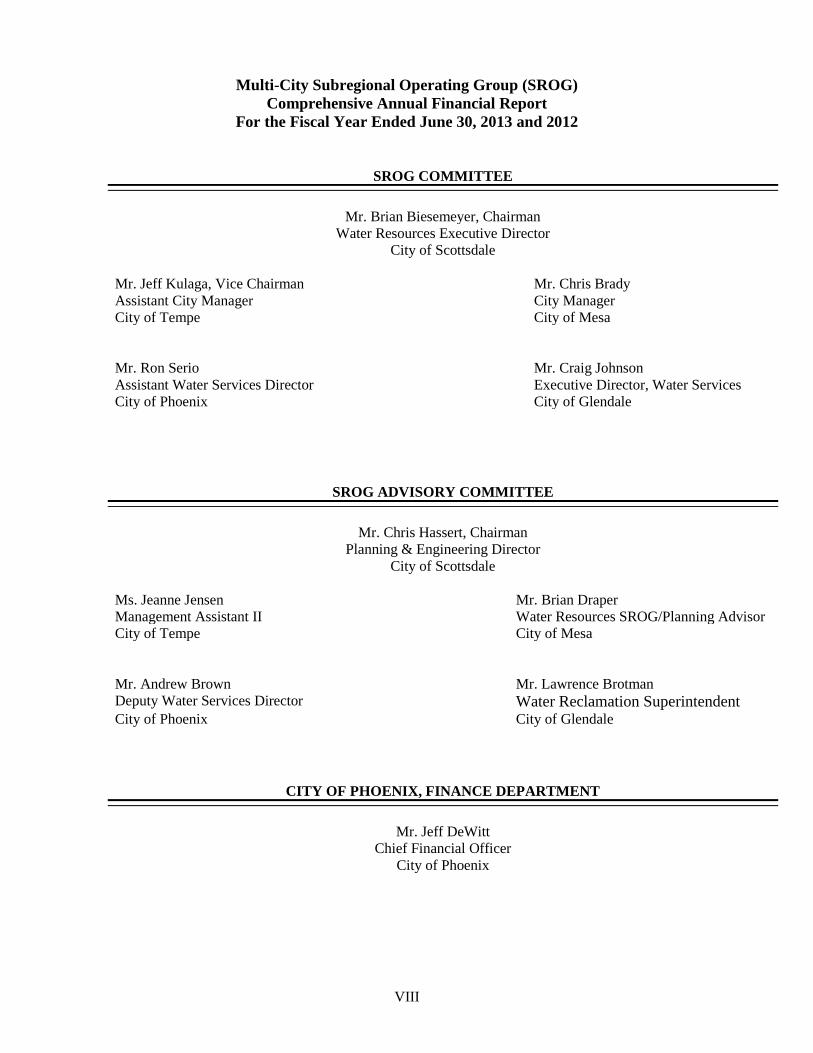
SROG COMMITTEE
Mr. Brian Biesemeyer, Chairman
Water Resources Executive Director
City of Scottsdale
Mr. Jeff Kulaga, Vice Chairman Mr. Chris Brady
Assistant City Manager City Manager
City of Tempe City of Mesa
Mr. Ron Serio Mr. Craig Johnson
Assistant Water Services Director Executive Director, Water Services
City of Phoenix City of Glendale
SROG ADVISORY COMMITTEE
Mr. Chris Hassert, Chairman
Planning & Engineering Director
City of Scottsdale
Ms. Jeanne Jensen Mr. Brian Draper
Management Assistant II Water Resources SROG/Planning Advisor
City of Tempe City of Mesa
Mr. Andrew Brown Mr. Lawrence Brotman
Deputy Water Services Director Water Reclamation Superintendent City of Phoenix City of Glendale
CITY OF PHOENIX, FINANCE DEPARTMENT
Mr. Jeff DeWitt
Chief Financial Officer
City of Phoenix
IX
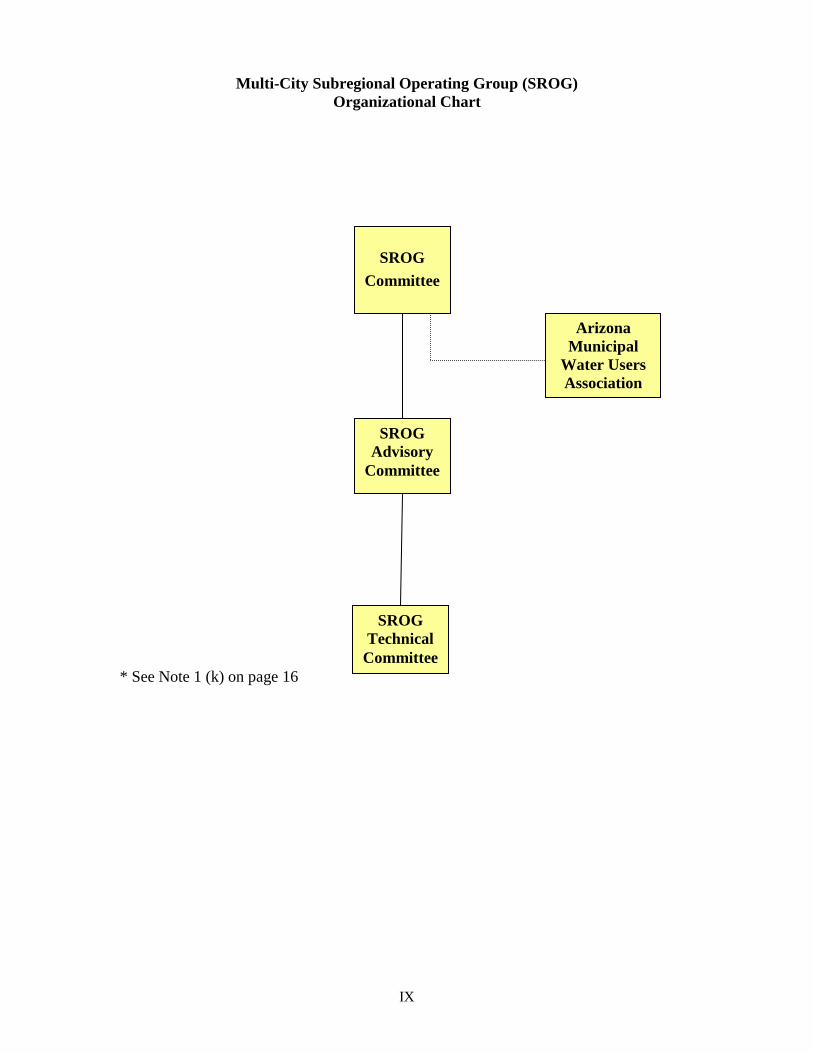
Multi-City Subregional Operating Group (SROG)
Organizational Chart
* See Note 1 (k) on page 16
SROG
Committee
SROG
Advisory
Committee
Arizona
Municipal
Water Users
Association
SROG
Technical
Committee

(This page intentionally left blank)
FINANCIAL SECTION
The Financial Section includes the independent auditors’ report, Management’s Discussion and Analysis, the basic financial statements, and supplementary information.
INDEPENDENT AUDITOR’S REPORT The Multi-City Subregional Operating Group Committee and Management Arizona Municipal Water Users Association Report on the Financial Statements We have audited the accompanying financial statements of Multi-City Subregional Operating Group (SROG), as of and for the year ended June 30, 2013, and the related notes to the financial statements, which collectively comprise SROG’s basic financial statements as listed in the table of contents. Management’s Responsibility for the Financial Statements Management is responsible for the preparation and fair presentation of these financial statements in accordance with accounting principles generally accepted in the United States of America; this includes the design, implementation, and maintenance of internal control relevant to the preparation and fair presentation of financial statements that are free from material misstatement, whether due to fraud or error.
Auditor’s Responsibility Our responsibility is to express an opinion on these financial statements based on our audit. We conducted our audit in accordance with auditing standards generally accepted in the United States of America and the standards applicable to financial audits contained in Government Auditing Standards, issued by the Comptroller General of the United States. Those standards require that we plan and perform the audit to obtain reasonable assurance about whether the financial statements are free from material misstatement. An audit involves performing procedures to obtain audit evidence about the amounts and disclosures in the financial statements. The procedures selected depend on the auditor’s judgment, including the assessment of the risks of material misstatement of the financial statements, whether due to fraud or error. In making those risk assessments, the auditor considers internal control relevant to SROG’s preparation and fair presentation of the financial statements in order to design audit procedures that are appropriate in the circumstances, but not for the purpose of expressing an opinion on the effectiveness of SROG’s internal control. Accordingly, we express no such opinion. An audit also includes evaluating the appropriateness of accounting policies used and the reasonableness of significant accounting estimates made by management, as well as evaluating the overall presentation of the financial statements. We believe that the audit evidence we have obtained is sufficient and appropriate to provide a basis for our audit opinion. Opinion In our opinion, the financial statements referred to above present fairly, in all material respects, the financial position of the Multi-City Subregional Operating Group, as of June 30, 2013, and the changes in financial position and cash flows thereof for the year then ended in conformity with accounting principles generally accepted in the United States of America. Report on Comparative Information The prior year comparative information has been derived from SROG’s 2012 financial statements which were audited by other accountants who expressed an unmodified opinion on those financial statements. Neither we nor the other accountants have performed any audit procedures on this information since the date of their report.
TUCSON • PHOENIX • FLAGSTAFF www.heinfeldmeech.com
3033 N. Central Ave., Suite 300Phoenix, Arizona 85012
Tel (602) 277-9449Fax (602) 277-9297
Page 2
Change in Accounting Principle As described in Note 1, SROG implemented the provisions of the Governmental Accounting Standards Board (GASB) Statement No. 63, Financial Reporting of Deferred Outflows of Resources, Deferred Inflows of Resources, and Net Position and GASB Statement No. 65, Items Previously Reported as Assets and Liabilities, for the year ended June 30, 2013, which represent changes in accounting principle. Our opinion is not modified with respect to these matters. Other Matters Required Supplementary Information Accounting principles generally accepted in the United States of America require that the management’s discussion and analysis on pages 3 through 8 be presented to supplement the basic financial statements. Such information, although not a part of the basic financial statements, is required by the Governmental Accounting Standards Board, who considers it to be an essential part of financial reporting for placing the basic financial statements in an appropriate operational, economic, or historical context. We have applied certain limited procedures to the required supplementary information in accordance with auditing standards generally accepted in the United States of America, which consisted of inquiries of management about the methods of preparing the information and comparing the information for consistency with management’s responses to our inquiries, the basic financial statements, and other knowledge we obtained during our audit of the basic financial statements. We do not express an opinion or provide any assurance on the information because the limited procedures do not provide us with sufficient evidence to express an opinion or provide any assurance. Other Information Our audit was conducted for the purpose of forming an opinion on the basic financial statements. The introductory section, supplementary information and statistical section are presented for purposes of additional analysis and are not a required part of the basic financial statements. The supplementary information is the responsibility of management and was derived from and relates directly to the underlying accounting and other records used to prepare the basic financial statements. Such information has been subjected to the auditing procedures applied in the audit of the basic financial statements and certain additional procedures, including comparing and reconciling such information directly to the underlying accounting and other records used to prepare the basic financial statements or to the basic financial statements themselves, and other additional procedures in accordance with auditing standards generally accepted in the United States of America. In our opinion, the information is fairly stated in all material respects in relation to the basic financial statements as a whole. The introductory and statistical sections have not been subjected to the auditing procedures applied in the audit of the basic financial statements and, accordingly, we do not express an opinion or provide any assurance on them. Other Reporting Required by Government Auditing Standards In accordance with Government Auditing Standards, we have also issued our report dated November 22, 2013, on our consideration of the Multi-City Subregional Operating Group’s internal control over financial reporting and on our tests of its compliance with certain provisions of laws, regulations, contracts, and grant agreements and other matters. The purpose of that report is to describe the scope of our testing of internal control over financial reporting and compliance and the results of that testing, and not to provide an opinion on the internal control over financial reporting or on compliance. That report is an integral part of an audit performed in accordance with Government Auditing Standards in considering the Multi-City Subregional Operating Group’s internal control over financial reporting and compliance. HEINFELD, MEECH & CO., P.C. CPAs and Business Consultants November 22, 2013

FINANCIAL SECTION – MANAGEMENT’S DISCUSSION AND ANALYSIS
3
MANAGEMENT’S DISCUSSION AND ANALYSIS
The following Management Discussion and Analysis (MD&A) of the Multi-City Subregional Operating Group’s (SROG) activities and financial performance provides an introduction to SROG’s financial statements as of and for fiscal years ended June 30, 2013 and 2012. The information contained in this MD&A should be considered in conjunction with the information contained in the Letter of Transmittal included in the Introductory Section of this report. All amounts, unless otherwise indicated, are expressed in thousands of dollars. FINANCIAL AND OPERATIONAL HIGHLIGHTS (in thousands) • Total net position for the SROG joint venture was $831,387 at June 30, 2013 and $877,882 at June 30,
2012. Net position for fiscal year 2013 decreased by $46,495 as compared to fiscal year 2012. In fiscal year 2012, net position decreased by $26,539. The decreases in net position for fiscal years 2013 and 2012 are primarily due to decreased construction activity at the Plant and an increase in accumulated depreciation.
• Operating revenue was $50,653 for fiscal year 2013 and $51,133 for fiscal year 2012. Operating
revenues decreased by $480 in the current year and decreased by $4,432 in 2012. The decrease in 2013 is due to a decrease in Members’ contributions for construction projects as compared to 2012. Revenue contributions from SROG members for the construction of capital assets were $5,715 or 11.3% of total operating revenues in 2013 and $5,990 or 11.7 % of total operating revenues in 2012.
• Total operating expenses decreased by $5,610 to $96,922 during fiscal year 2013, and increased by
$18,654 to $102,532 during fiscal year 2012. In 2013, this decrease was related to an $8,708 decrease in operation & maintenance expense, a $2,578 increase in depreciation expense primarily due to capitalized CIP projects, and an increase of $520 in administration expense. In 2012, this increase was related to a $5,578 increase in depreciation expense, a $12,975 increase in operation and maintenance expense primarily due to expensed CIP projects, and an increase of $101 in administration expense.
OVERVIEW OF THE FINANCIAL STATEMENTS This discussion and analysis is intended to serve as an introduction to SROG’s basic financial statements. SROG’s basic financial statements include statements of net position; statements of revenues, expenses and changes in net position; statements of cash flows; and the notes to the financial statements. SROG’s financial statements are prepared on an accrual basis in accordance with generally accepted accounting principles. Enterprise Operations SROG is structured as a joint venture, which was formed pursuant to the Joint Exercise of Powers Agreement (JEPA) to govern the construction, operation, and maintenance of the jointly utilized sewage treatment and transportation facilities. The City of Phoenix is the lead agency for SROG and is responsible for the planning, budgeting, construction, operation, and maintenance of the 91st Avenue Wastewater Treatment Plant (Plant). The other participants pay for purchased capacity in plant and related transportation facilities based on approved engineering billings. See the notes to the financial statements for a summary of SROG’s significant accounting policies.
4
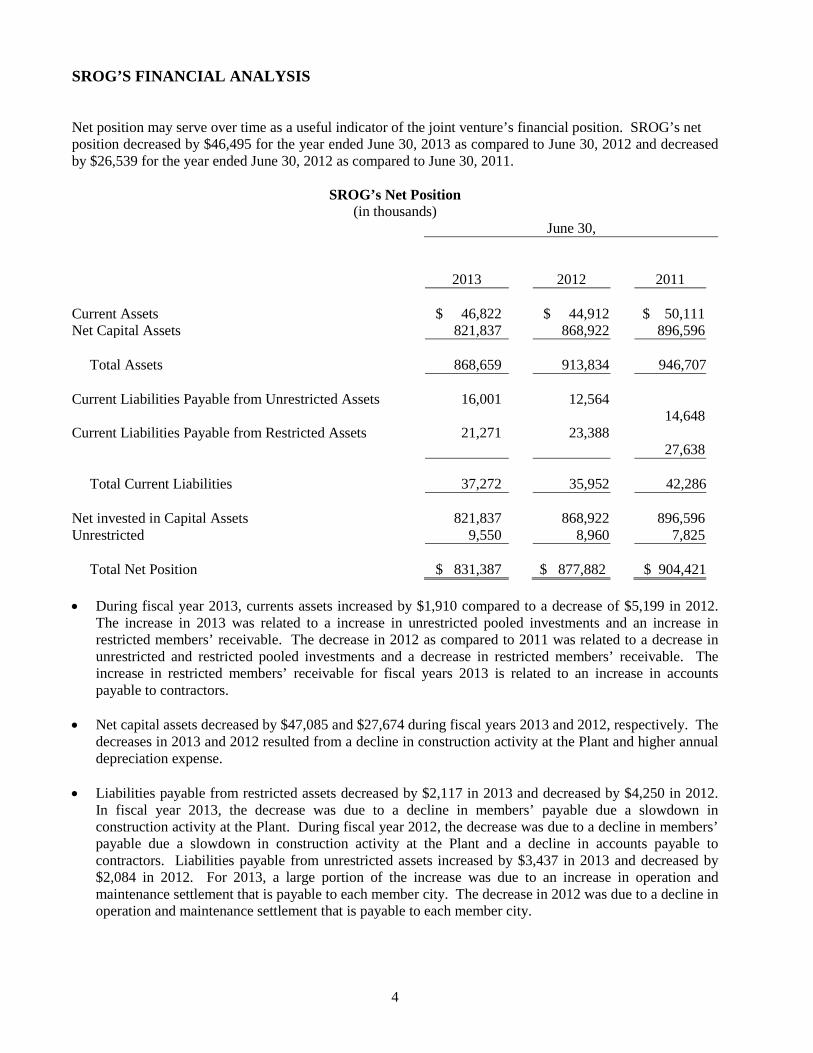
SROG’S FINANCIAL ANALYSIS Net position may serve over time as a useful indicator of the joint venture’s financial position. SROG’s net position decreased by $46,495 for the year ended June 30, 2013 as compared to June 30, 2012 and decreased by $26,539 for the year ended June 30, 2012 as compared to June 30, 2011.
SROG’s Net Position (in thousands)
June 30,
2013
2012
2011
Current Assets $ 46,822 $ 44,912 $ 50,111 Net Capital Assets 821,837 868,922 896,596
Total Assets 868,659 913,834 946,707
Current Liabilities Payable from Unrestricted Assets 16,001 12,564
14,648 Current Liabilities Payable from Restricted Assets 21,271 23,388
27,638 Total Current Liabilities 37,272 35,952 42,286
Net invested in Capital Assets 821,837 868,922 896,596 Unrestricted 9,550 8,960 7,825
Total Net Position $ 831,387 $ 877,882 $ 904,421
• During fiscal year 2013, currents assets increased by $1,910 compared to a decrease of $5,199 in 2012.
The increase in 2013 was related to a increase in unrestricted pooled investments and an increase in restricted members’ receivable. The decrease in 2012 as compared to 2011 was related to a decrease in unrestricted and restricted pooled investments and a decrease in restricted members’ receivable. The increase in restricted members’ receivable for fiscal years 2013 is related to an increase in accounts payable to contractors.
• Net capital assets decreased by $47,085 and $27,674 during fiscal years 2013 and 2012, respectively. The
decreases in 2013 and 2012 resulted from a decline in construction activity at the Plant and higher annual depreciation expense.
• Liabilities payable from restricted assets decreased by $2,117 in 2013 and decreased by $4,250 in 2012.
In fiscal year 2013, the decrease was due to a decline in members’ payable due a slowdown in construction activity at the Plant. During fiscal year 2012, the decrease was due to a decline in members’ payable due a slowdown in construction activity at the Plant and a decline in accounts payable to contractors. Liabilities payable from unrestricted assets increased by $3,437 in 2013 and decreased by $2,084 in 2012. For 2013, a large portion of the increase was due to an increase in operation and maintenance settlement that is payable to each member city. The decrease in 2012 was due to a decline in operation and maintenance settlement that is payable to each member city.
5
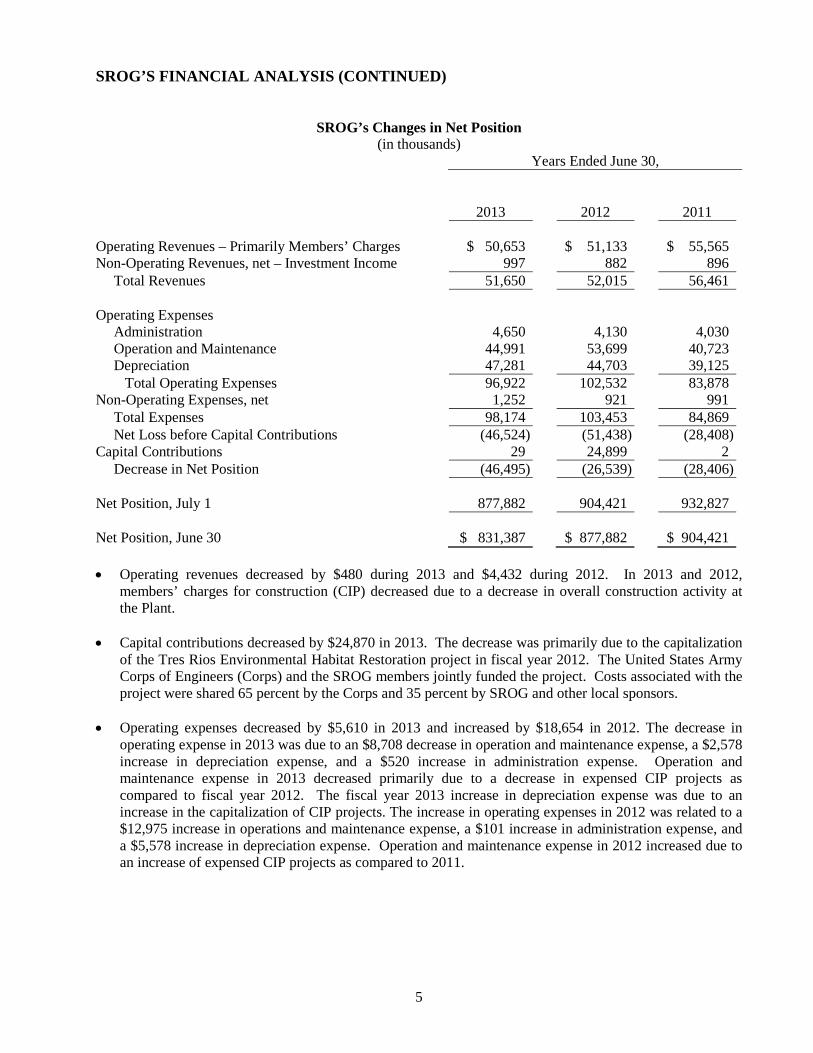
SROG’S FINANCIAL ANALYSIS (CONTINUED)
SROG’s Changes in Net Position (in thousands)
Years Ended June 30,
2013
2012
2011
Operating Revenues – Primarily Members’ Charges $ 50,653 $ 51,133 $ 55,565 Non-Operating Revenues, net – Investment Income 997 882 896
Total Revenues 51,650 52,015 56,461 Operating Expenses
Administration 4,650 4,130 4,030 Operation and Maintenance 44,991 53,699 40,723 Depreciation 47,281 44,703 39,125 Total Operating Expenses 96,922 102,532 83,878
Non-Operating Expenses, net 1,252 921 991 Total Expenses 98,174 103,453 84,869 Net Loss before Capital Contributions (46,524) (51,438) (28,408)
Capital Contributions 29 24,899 2 Decrease in Net Position (46,495) (26,539) (28,406)
Net Position, July 1 877,882 904,421 932,827
Net Position, June 30 $ 831,387 $ 877,882 $ 904,421 • Operating revenues decreased by $480 during 2013 and $4,432 during 2012. In 2013 and 2012,
members’ charges for construction (CIP) decreased due to a decrease in overall construction activity at the Plant.
• Capital contributions decreased by $24,870 in 2013. The decrease was primarily due to the capitalization of the Tres Rios Environmental Habitat Restoration project in fiscal year 2012. The United States Army Corps of Engineers (Corps) and the SROG members jointly funded the project. Costs associated with the project were shared 65 percent by the Corps and 35 percent by SROG and other local sponsors.
• Operating expenses decreased by $5,610 in 2013 and increased by $18,654 in 2012. The decrease in
operating expense in 2013 was due to an $8,708 decrease in operation and maintenance expense, a $2,578 increase in depreciation expense, and a $520 increase in administration expense. Operation and maintenance expense in 2013 decreased primarily due to a decrease in expensed CIP projects as compared to fiscal year 2012. The fiscal year 2013 increase in depreciation expense was due to an increase in the capitalization of CIP projects. The increase in operating expenses in 2012 was related to a $12,975 increase in operations and maintenance expense, a $101 increase in administration expense, and a $5,578 increase in depreciation expense. Operation and maintenance expense in 2012 increased due to an increase of expensed CIP projects as compared to 2011.
6
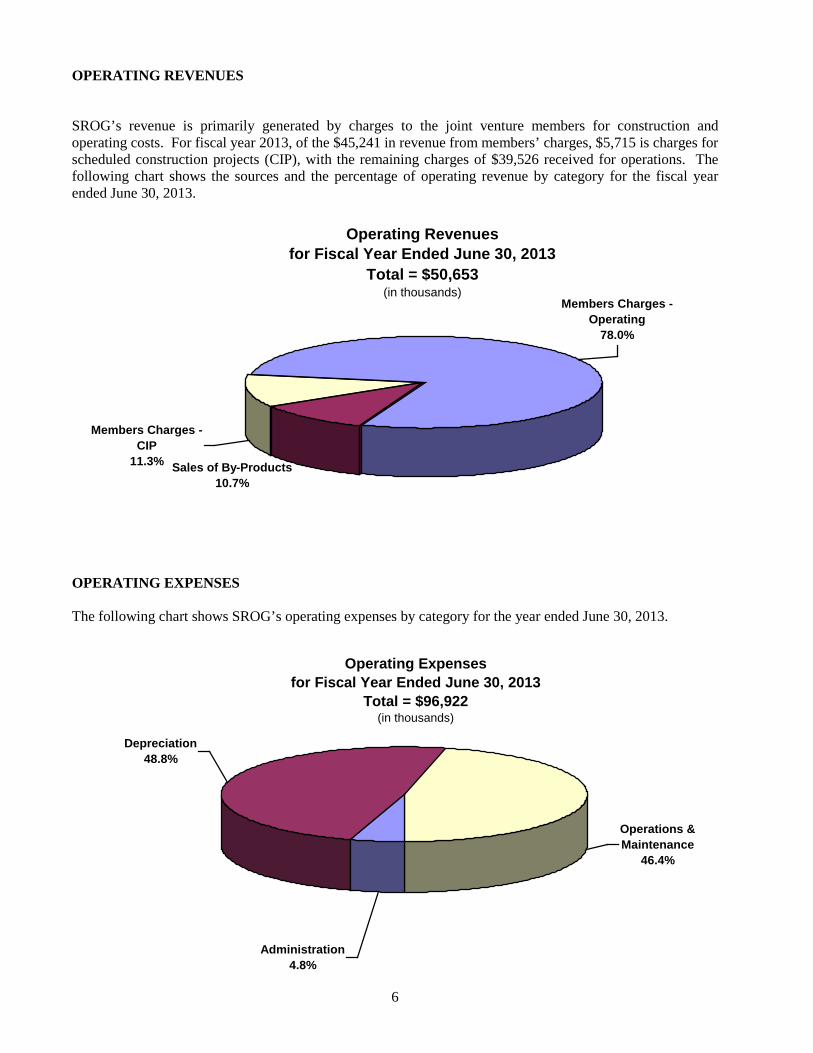
OPERATING REVENUES SROG’s revenue is primarily generated by charges to the joint venture members for construction and operating costs. For fiscal year 2013, of the $45,241 in revenue from members’ charges, $5,715 is charges for scheduled construction projects (CIP), with the remaining charges of $39,526 received for operations. The following chart shows the sources and the percentage of operating revenue by category for the fiscal year ended June 30, 2013.
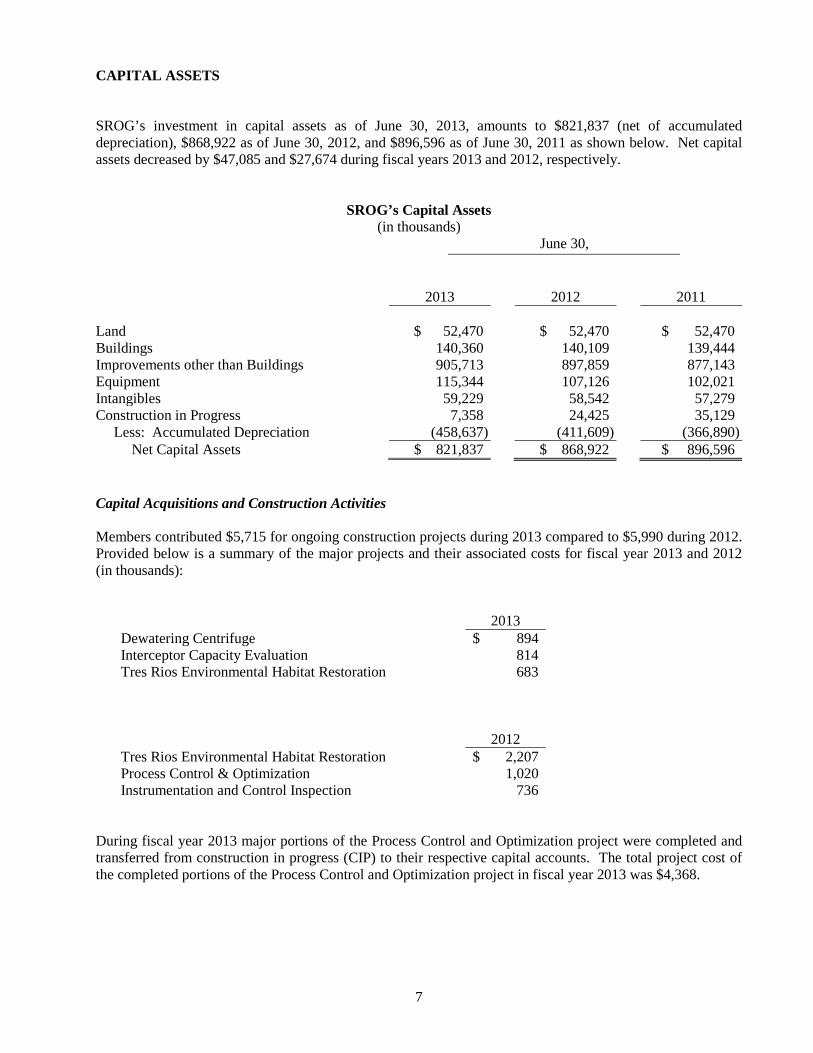
OPERATING EXPENSES The following chart shows SROG’s operating expenses by category for the year ended June 30, 2013.
Operating Revenuesfor Fiscal Year Ended June 30, 2013
Total = $50,653(in thousands)
Sales of By-Products10.7%
Members Charges - Operating
78.0%
Members Charges - CIP
11.3%
Operating Expensesfor Fiscal Year Ended June 30, 2013
Total = $96,922(in thousands)
Depreciation48.8%
Administration4.8%
Operations & Maintenance
46.4%
7
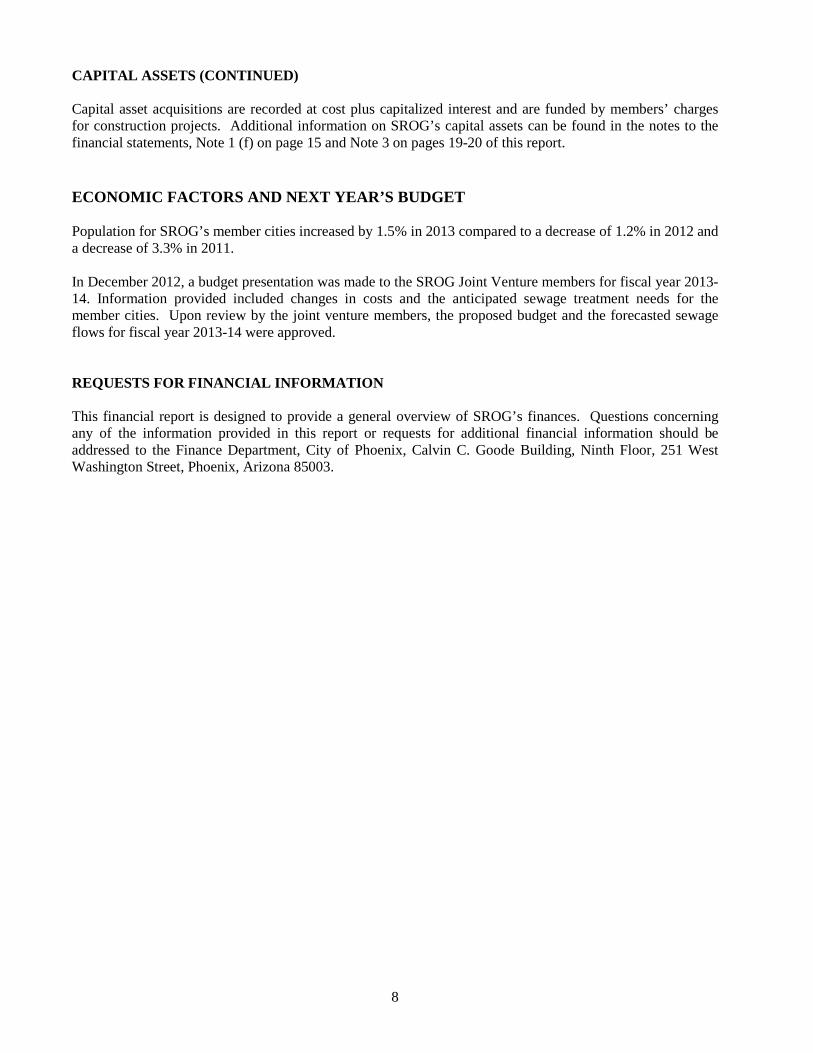
CAPITAL ASSETS SROG’s investment in capital assets as of June 30, 2013, amounts to $821,837 (net of accumulated depreciation), $868,922 as of June 30, 2012, and $896,596 as of June 30, 2011 as shown below. Net capital assets decreased by $47,085 and $27,674 during fiscal years 2013 and 2012, respectively.
SROG’s Capital Assets (in thousands)
June 30,
2013
2012
2011
Land $ 52,470 $ 52,470 $ 52,470 Buildings 140,360 140,109 139,444 Improvements other than Buildings 905,713 897,859 877,143 Equipment 115,344 107,126 102,021 Intangibles 59,229 58,542 57,279 Construction in Progress 7,358 24,425 35,129
Less: Accumulated Depreciation (458,637) (411,609) (366,890) Net Capital Assets $ 821,837 $ 868,922 $ 896,596
Capital Acquisitions and Construction Activities Members contributed $5,715 for ongoing construction projects during 2013 compared to $5,990 during 2012. Provided below is a summary of the major projects and their associated costs for fiscal year 2013 and 2012 (in thousands):
2013 Dewatering Centrifuge Interceptor Capacity Evaluation Tres Rios Environmental Habitat Restoration
$ 894 814 683
2012 Tres Rios Environmental Habitat Restoration $ 2,207 Process Control & Optimization 1,020 Instrumentation and Control Inspection 736
During fiscal year 2013 major portions of the Process Control and Optimization project were completed and transferred from construction in progress (CIP) to their respective capital accounts. The total project cost of the completed portions of the Process Control and Optimization project in fiscal year 2013 was $4,368.
8
CAPITAL ASSETS (CONTINUED) Capital asset acquisitions are recorded at cost plus capitalized interest and are funded by members’ charges for construction projects. Additional information on SROG’s capital assets can be found in the notes to the financial statements, Note 1 (f) on page 15 and Note 3 on pages 19-20 of this report. ECONOMIC FACTORS AND NEXT YEAR’S BUDGET Population for SROG’s member cities increased by 1.5% in 2013 compared to a decrease of 1.2% in 2012 and a decrease of 3.3% in 2011. In December 2012, a budget presentation was made to the SROG Joint Venture members for fiscal year 2013-14. Information provided included changes in costs and the anticipated sewage treatment needs for the member cities. Upon review by the joint venture members, the proposed budget and the forecasted sewage flows for fiscal year 2013-14 were approved. REQUESTS FOR FINANCIAL INFORMATION This financial report is designed to provide a general overview of SROG’s finances. Questions concerning any of the information provided in this report or requests for additional financial information should be addressed to the Finance Department, City of Phoenix, Calvin C. Goode Building, Ninth Floor, 251 West Washington Street, Phoenix, Arizona 85003.

FINANCIAL SECTION – BASIC FINANCIAL STATEMENTS
The accompanying notes are an integral part of these financial statements.
9
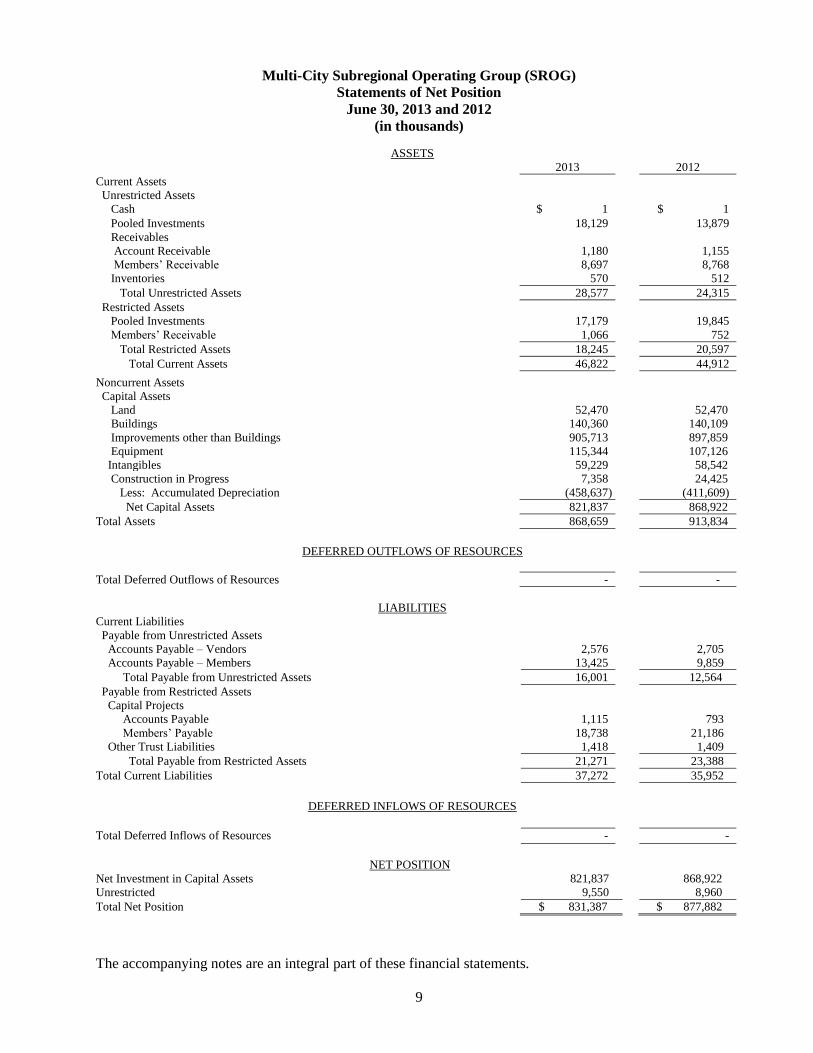
Multi-City Subregional Operating Group (SROG)
Statements of Net Position
June 30, 2013 and 2012
(in thousands)
ASSETS
2013 2012
Current Assets
Unrestricted Assets
Cash $ 1 $ 1
Pooled Investments 18,129 9 13,879
Receivables
Account Receivable
Members’ Receivable
1,180
8,697
1,155
8,768
Inventories 570 512
Total Unrestricted Assets 28,577 24,315
Restricted Assets
Pooled Investments
17,179
19,845
Members’ Receivable 1,066 752
Total Restricted Assets 18,245 20,597
Total Current Assets 46,822 44,912
Noncurrent Assets
Capital Assets
Land 52,470 52,470
Buildings 140,360 140,109
Improvements other than Buildings 905,713 897,859
Equipment 115,344 107,126
Intangibles 59,229 58,542
Construction in Progress 7,358 24,425
Less: Accumulated Depreciation (458,637) (411,609)
Net Capital Assets 821,837 868,922
Total Assets 868,659 913,834
DEFERRED OUTFLOWS OF RESOURCES
Total Deferred Outflows of Resources - -
LIABILITIES
Current Liabilities
Payable from Unrestricted Assets
Accounts Payable – Vendors 2,576 2,705
Accounts Payable – Members 13,425 9,859
Total Payable from Unrestricted Assets 16,001 12,564
Payable from Restricted Assets
Capital Projects
Accounts Payable 1,115 793
Members’ Payable 18,738 21,186
Other Trust Liabilities 1,418 1,409
Total Payable from Restricted Assets 21,271 23,388
Total Current Liabilities 37,272 35,952
DEFERRED INFLOWS OF RESOURCES
Total Deferred Inflows of Resources - -
NET POSITION
Net Investment in Capital Assets 821,837 868,922
Unrestricted 9,550 8,960
Total Net Position $ 831,387 $ 877,882
The accompanying notes are an integral part of these financial statements.
10
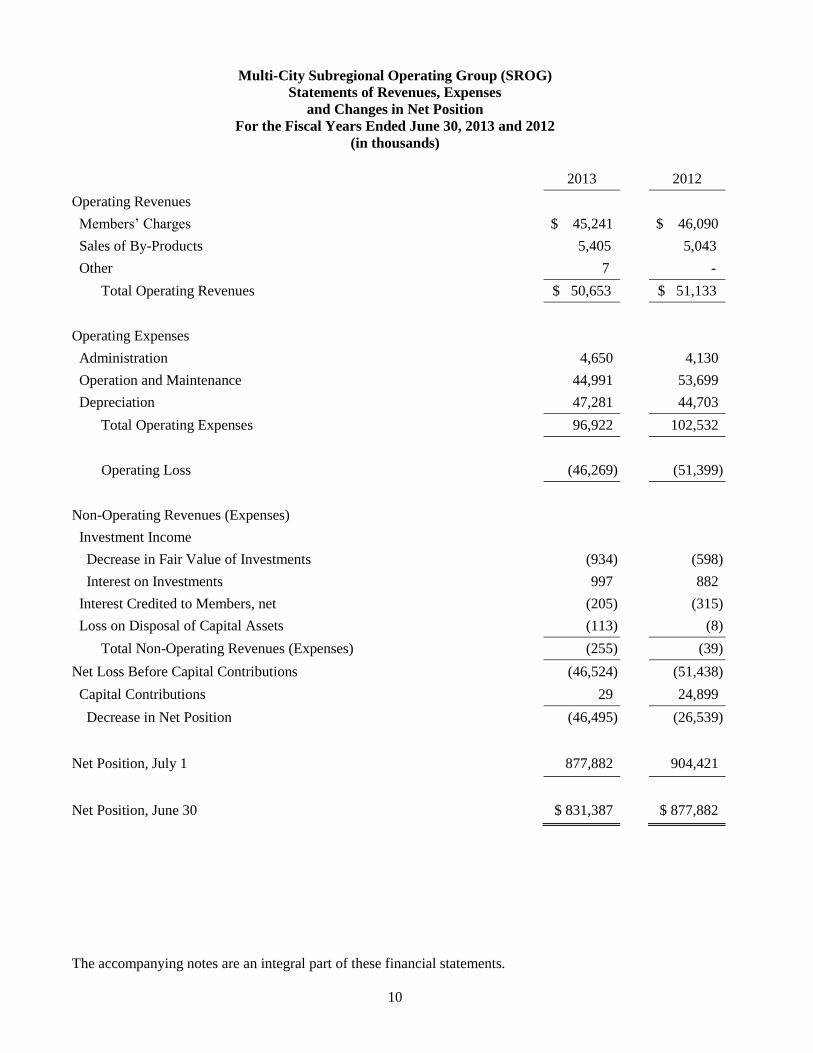
Multi-City Subregional Operating Group (SROG)
Statements of Revenues, Expenses
and Changes in Net Position
For the Fiscal Years Ended June 30, 2013 and 2012
(in thousands)
2013 2012
Operating Revenues
Members’ Charges $ 45,241 $ 46,090
Sales of By-Products 5,405 5,043
Other 7 -
Total Operating Revenues $ 50,653 $ 51,133
Operating Expenses
Administration 4,650 4,130
Operation and Maintenance 44,991 53,699
Depreciation 47,281 44,703
Total Operating Expenses 96,922 102,532
Operating Loss (46,269) (51,399)
Non-Operating Revenues (Expenses)
Investment Income
Decrease in Fair Value of Investments (934) (598)
Interest on Investments 997 882
Interest Credited to Members, net (205) (315)
Loss on Disposal of Capital Assets (113) (8)
Total Non-Operating Revenues (Expenses) (255) (39)
Net Loss Before Capital Contributions (46,524) (51,438)
Capital Contributions 29 24,899
Decrease in Net Position (46,495) (26,539)
Net Position, July 1 877,882 904,421
Net Position, June 30 $ 831,387 $ 877,882
The accompanying notes are an integral part of these financial statements.
11
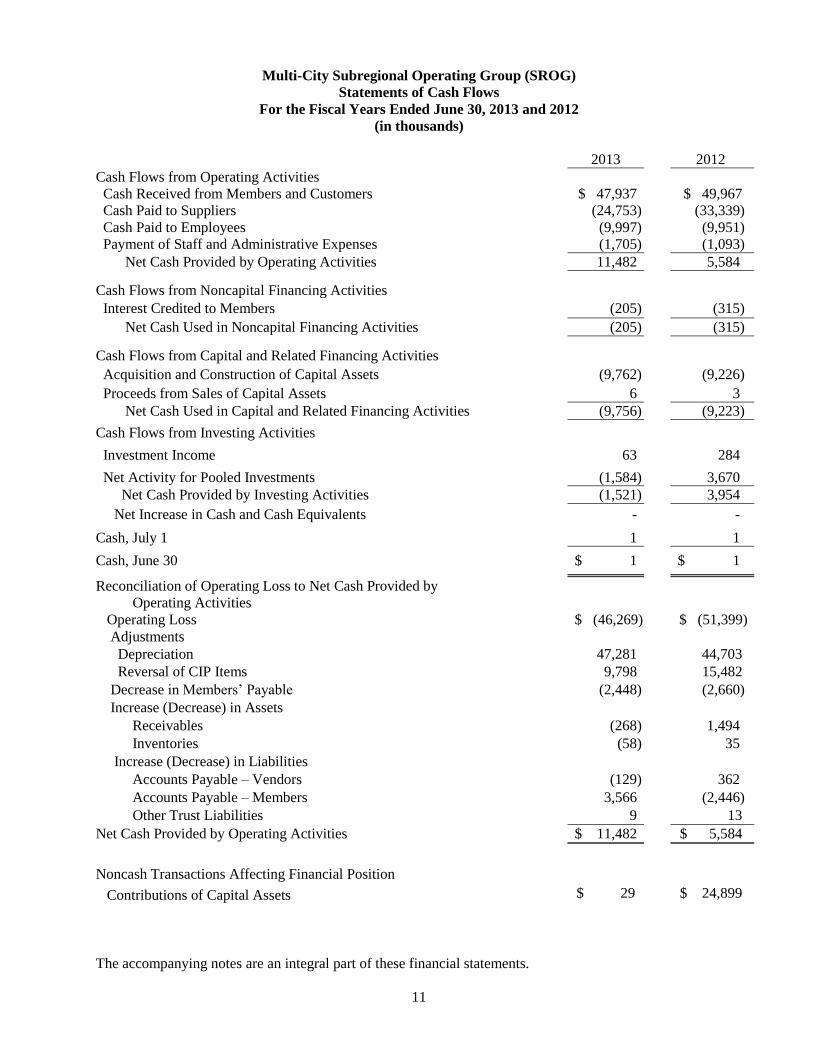
Multi-City Subregional Operating Group (SROG)
Statements of Cash Flows
For the Fiscal Years Ended June 30, 2013 and 2012
(in thousands)
2013 2012
Cash Flows from Operating Activities
Cash Received from Members and Customers $ 47,937 $ 49,967
Cash Paid to Suppliers (24,753) (33,339)
Cash Paid to Employees (9,997) (9,951)
Payment of Staff and Administrative Expenses (1,705) (1,093)
Net Cash Provided by Operating Activities 11,482 5,584
Cash Flows from Noncapital Financing Activities
Interest Credited to Members (205) (315)
Net Cash Used in Noncapital Financing Activities (205) (315)
Cash Flows from Capital and Related Financing Activities
Acquisition and Construction of Capital Assets (9,762) (9,226)
Proceeds from Sales of Capital Assets 6
3
Net Cash Used in Capital and Related Financing Activities (9,756) (9,223)
Cash Flows from Investing Activities
Investment Income 63 284
Net Activity for Pooled Investments (1,584)
3,670
Net Cash Provided by Investing Activities (1,521) 3,954
Net Increase in Cash and Cash Equivalents - -
Cash, July 1 1 1
Cash, June 30 $ 1 $ 1
Reconciliation of Operating Loss to Net Cash Provided by
Operating Activities
Operating Loss $ (46,269) $ (51,399)
Adjustments
Depreciation 47,281 44,703
Reversal of CIP Items 9,798 15,482
Decrease in Members’ Payable (2,448) (2,660)
Increase (Decrease) in Assets
Receivables (268) 1,494
Inventories (58) 35
Increase (Decrease) in Liabilities
Accounts Payable – Vendors (129) 362
Accounts Payable – Members 3,566 (2,446)
Other Trust Liabilities 9 13
Net Cash Provided by Operating Activities $ 11,482 $ 5,584
Noncash Transactions Affecting Financial Position
Contributions of Capital Assets $ 29 $ 24,899

(This page intentionally left blank)
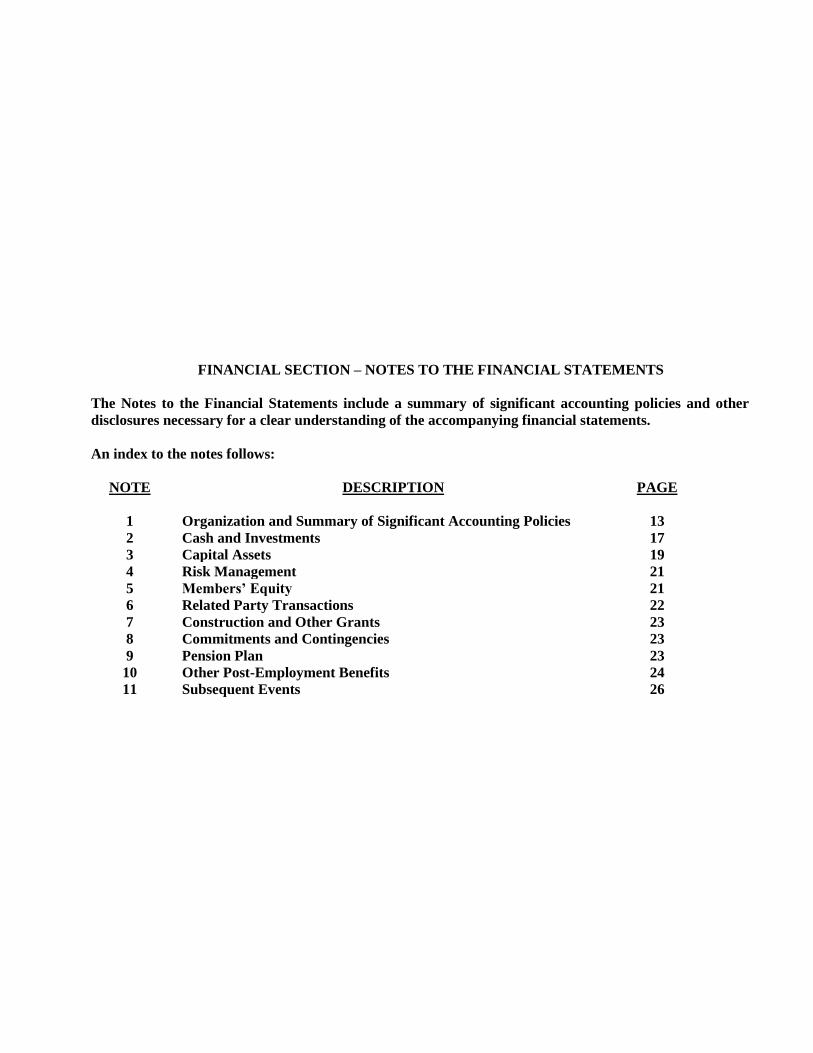
FINANCIAL SECTION – NOTES TO THE FINANCIAL STATEMENTS
The Notes to the Financial Statements include a summary of significant accounting policies and other
disclosures necessary for a clear understanding of the accompanying financial statements.
An index to the notes follows:
NOTE DESCRIPTION PAGE
1 Organization and Summary of Significant Accounting Policies 13
2 Cash and Investments 17
3 Capital Assets 19
4 Risk Management 21
5 Members’ Equity 21
6 Related Party Transactions 22
7 Construction and Other Grants 23
8 Commitments and Contingencies 23
9 Pension Plan 23
10
11
Other Post-Employment Benefits
Subsequent Events
24
26
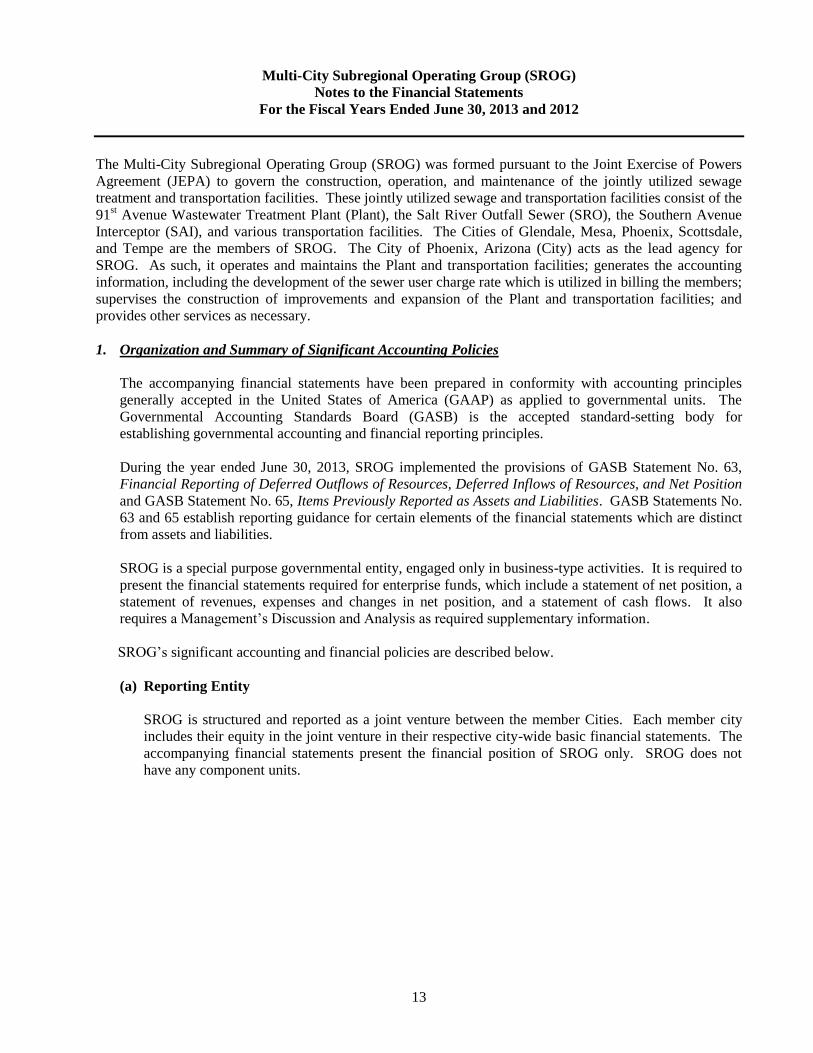
Multi-City Subregional Operating Group (SROG)
Notes to the Financial Statements
For the Fiscal Years Ended June 30, 2013 and 2012
13
The Multi-City Subregional Operating Group (SROG) was formed pursuant to the Joint Exercise of Powers
Agreement (JEPA) to govern the construction, operation, and maintenance of the jointly utilized sewage
treatment and transportation facilities. These jointly utilized sewage and transportation facilities consist of the
91st Avenue Wastewater Treatment Plant (Plant), the Salt River Outfall Sewer (SRO), the Southern Avenue
Interceptor (SAI), and various transportation facilities. The Cities of Glendale, Mesa, Phoenix, Scottsdale,
and Tempe are the members of SROG. The City of Phoenix, Arizona (City) acts as the lead agency for
SROG. As such, it operates and maintains the Plant and transportation facilities; generates the accounting
information, including the development of the sewer user charge rate which is utilized in billing the members;
supervises the construction of improvements and expansion of the Plant and transportation facilities; and
provides other services as necessary.
1. Organization and Summary of Significant Accounting Policies
The accompanying financial statements have been prepared in conformity with accounting principles
generally accepted in the United States of America (GAAP) as applied to governmental units. The
Governmental Accounting Standards Board (GASB) is the accepted standard-setting body for
establishing governmental accounting and financial reporting principles.
During the year ended June 30, 2013, SROG implemented the provisions of GASB Statement No. 63,
Financial Reporting of Deferred Outflows of Resources, Deferred Inflows of Resources, and Net Position
and GASB Statement No. 65, Items Previously Reported as Assets and Liabilities. GASB Statements No.
63 and 65 establish reporting guidance for certain elements of the financial statements which are distinct
from assets and liabilities.
SROG is a special purpose governmental entity, engaged only in business-type activities. It is required to
present the financial statements required for enterprise funds, which include a statement of net position, a
statement of revenues, expenses and changes in net position, and a statement of cash flows. It also
requires a Management’s Discussion and Analysis as required supplementary information.
SROG’s significant accounting and financial policies are described below.
(a) Reporting Entity
SROG is structured and reported as a joint venture between the member Cities. Each member city
includes their equity in the joint venture in their respective city-wide basic financial statements. The
accompanying financial statements present the financial position of SROG only. SROG does not
have any component units.
Multi-City Subregional Operating Group (SROG)
Notes to the Financial Statements
For the Fiscal Years Ended June 30, 2013 and 2012
14
1. Organization and Summary of Significant Accounting Policies (Continued)
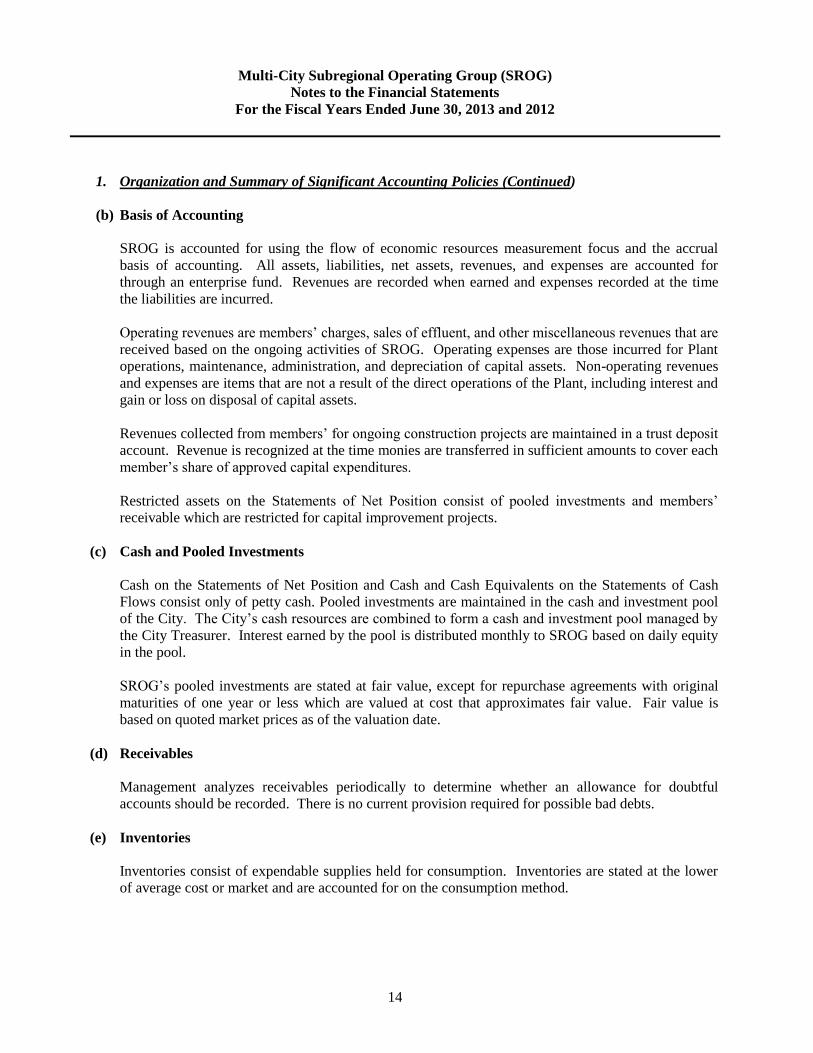
(b) Basis of Accounting
SROG is accounted for using the flow of economic resources measurement focus and the accrual
basis of accounting. All assets, liabilities, net assets, revenues, and expenses are accounted for
through an enterprise fund. Revenues are recorded when earned and expenses recorded at the time
the liabilities are incurred.
Operating revenues are members’ charges, sales of effluent, and other miscellaneous revenues that are
received based on the ongoing activities of SROG. Operating expenses are those incurred for Plant
operations, maintenance, administration, and depreciation of capital assets. Non-operating revenues
and expenses are items that are not a result of the direct operations of the Plant, including interest and
gain or loss on disposal of capital assets.
Revenues collected from members’ for ongoing construction projects are maintained in a trust deposit
account. Revenue is recognized at the time monies are transferred in sufficient amounts to cover each
member’s share of approved capital expenditures.
Restricted assets on the Statements of Net Position consist of pooled investments and members’
receivable which are restricted for capital improvement projects.
(c) Cash and Pooled Investments
Cash on the Statements of Net Position and Cash and Cash Equivalents on the Statements of Cash
Flows consist only of petty cash. Pooled investments are maintained in the cash and investment pool
of the City. The City’s cash resources are combined to form a cash and investment pool managed by
the City Treasurer. Interest earned by the pool is distributed monthly to SROG based on daily equity
in the pool.
SROG’s pooled investments are stated at fair value, except for repurchase agreements with original
maturities of one year or less which are valued at cost that approximates fair value. Fair value is
based on quoted market prices as of the valuation date.
(d) Receivables
Management analyzes receivables periodically to determine whether an allowance for doubtful
accounts should be recorded. There is no current provision required for possible bad debts.
(e) Inventories
Inventories consist of expendable supplies held for consumption. Inventories are stated at the lower
of average cost or market and are accounted for on the consumption method.

Multi-City Subregional Operating Group (SROG)
Notes to the Financial Statements
For the Fiscal Years Ended June 30, 2013 and 2012
15
1. Organization and Summary of Significant Accounting Policies (Continued)
(f) Capital Assets
Capital assets are recorded at historical cost plus capitalized interest on assets constructed.
Depreciation is computed using the straight-line method over the estimated useful lives of the related
assets as follows:
Land Not depreciated
Construction in Progress Not depreciated
Buildings 10 – 40 years
Improvements other than Buildings 10 – 50 years
Equipment 5 – 30 years
Intangibles 5 – 40 years
A gain or loss on disposal of capital assets is recognized when assets are retired from service or are
otherwise sold or removed. The minimum capitalization policy is $5,000 or more with an estimated
useful life exceeding two years.
(g) Other Trust Liabilities
Neighborhood Committee Trust
SROG maintains a Neighborhood Committee Trust asset and offsetting liability account for the
Neighborhood Committee. The monies are expended in accordance with the authorization of the
Neighborhood Committee for evaluation and improvement projects related to the Plant. The trust
balance at June 30, 2013 and 2012 was $1,417,661 and $1,408,987, respectively, and is included in
other trust liabilities.
(h) Operating Revenues
Operating revenues include members’ charges, sales of by-products and other revenues. Members’
charges are contributions received from the members for costs of operation and maintenance,
administration, and the construction of capital assets. All operating revenues are recognized when
earned. Members’ charges for construction projects and operating costs are earned ratably throughout
the year.
(i) Operating Expenses
Operating expenses include operation and maintenance expenses, depreciation, and administrative
expenses. Administration expenses include direct administrative costs to manage the Plant and
indirect costs allocated to SROG by the City.
Operating, maintenance, and administration costs are allocated to the members based upon their
respective sewage strengths and flows measured in million gallons per day (MGD) at the metering
stations prior to entering the Plant for processing, or as estimated by the Plant personnel in the event
of a meter breakdown. City of Phoenix flows and strengths are not metered as they are calculated by
deducting the other members’ metered flows and strengths from the total flows and strengths.
Multi-City Subregional Operating Group (SROG)
Notes to the Financial Statements
For the Fiscal Years Ended June 30, 2013 and 2012
16
1. Organization and Summary of Significant Accounting Policies (Continued)
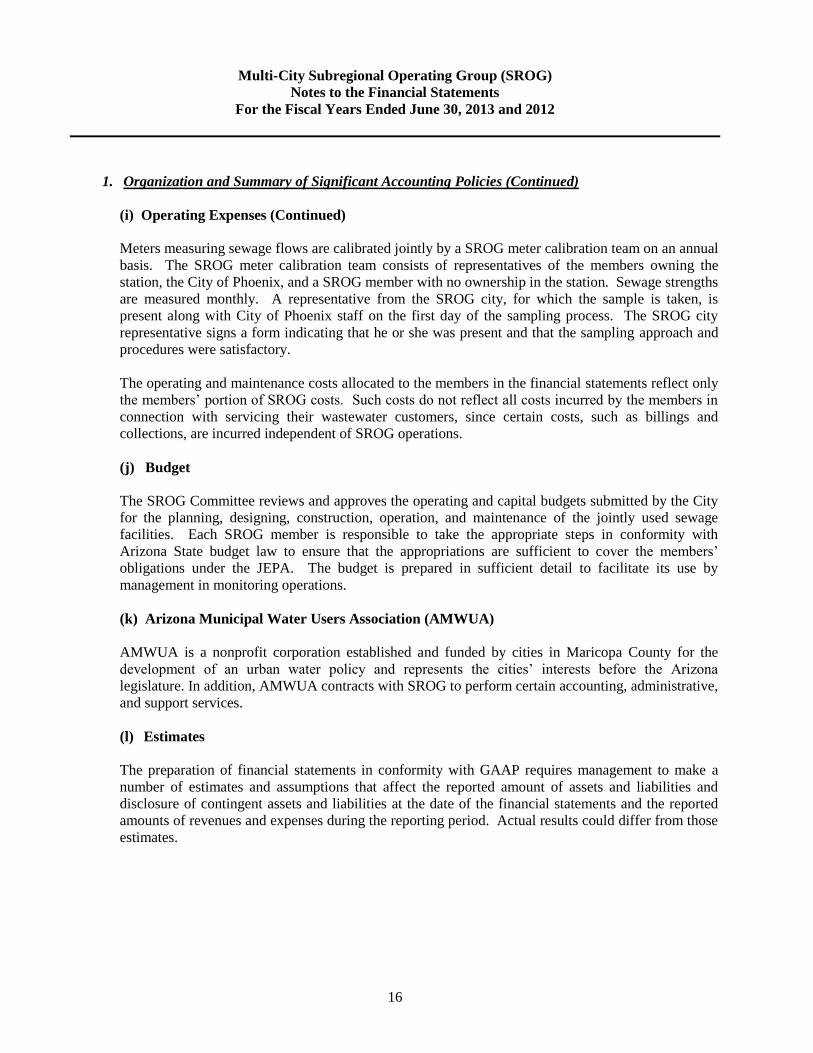
(i) Operating Expenses (Continued)
Meters measuring sewage flows are calibrated jointly by a SROG meter calibration team on an annual
basis. The SROG meter calibration team consists of representatives of the members owning the
station, the City of Phoenix, and a SROG member with no ownership in the station. Sewage strengths
are measured monthly. A representative from the SROG city, for which the sample is taken, is
present along with City of Phoenix staff on the first day of the sampling process. The SROG city
representative signs a form indicating that he or she was present and that the sampling approach and
procedures were satisfactory.
The operating and maintenance costs allocated to the members in the financial statements reflect only
the members’ portion of SROG costs. Such costs do not reflect all costs incurred by the members in
connection with servicing their wastewater customers, since certain costs, such as billings and
collections, are incurred independent of SROG operations.
(j) Budget
The SROG Committee reviews and approves the operating and capital budgets submitted by the City
for the planning, designing, construction, operation, and maintenance of the jointly used sewage
facilities. Each SROG member is responsible to take the appropriate steps in conformity with
Arizona State budget law to ensure that the appropriations are sufficient to cover the members’
obligations under the JEPA. The budget is prepared in sufficient detail to facilitate its use by
management in monitoring operations.
(k) Arizona Municipal Water Users Association (AMWUA)
AMWUA is a nonprofit corporation established and funded by cities in Maricopa County for the
development of an urban water policy and represents the cities’ interests before the Arizona
legislature. In addition, AMWUA contracts with SROG to perform certain accounting, administrative,
and support services.
(l) Estimates
The preparation of financial statements in conformity with GAAP requires management to make a
number of estimates and assumptions that affect the reported amount of assets and liabilities and
disclosure of contingent assets and liabilities at the date of the financial statements and the reported
amounts of revenues and expenses during the reporting period. Actual results could differ from those
estimates.
Multi-City Subregional Operating Group (SROG)
Notes to the Financial Statements
For the Fiscal Years Ended June 30, 2013 and 2012
17
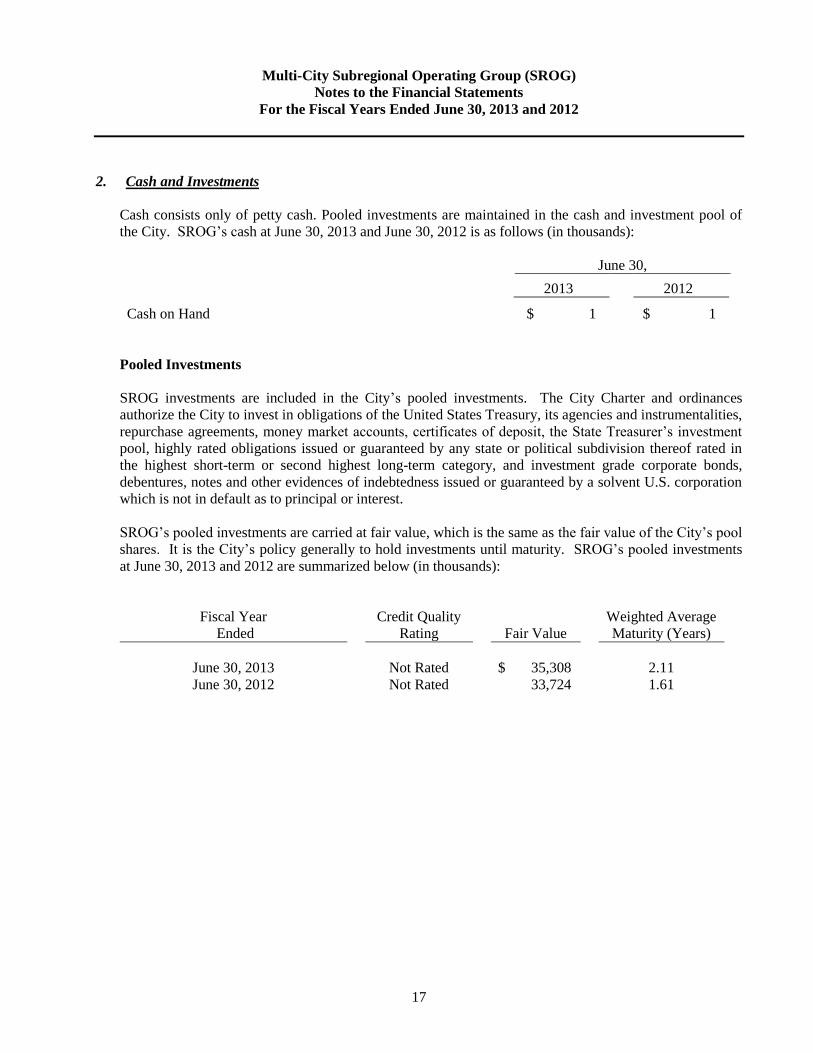
2. Cash and Investments
Cash consists only of petty cash. Pooled investments are maintained in the cash and investment pool of
the City. SROG’s cash at June 30, 2013 and June 30, 2012 is as follows (in thousands):
June 30,
2013 2012
Cash on Hand $ 1 $ 1
Pooled Investments
SROG investments are included in the City’s pooled investments. The City Charter and ordinances
authorize the City to invest in obligations of the United States Treasury, its agencies and instrumentalities,
repurchase agreements, money market accounts, certificates of deposit, the State Treasurer’s investment
pool, highly rated obligations issued or guaranteed by any state or political subdivision thereof rated in
the highest short-term or second highest long-term category, and investment grade corporate bonds,
debentures, notes and other evidences of indebtedness issued or guaranteed by a solvent U.S. corporation
which is not in default as to principal or interest.
SROG’s pooled investments are carried at fair value, which is the same as the fair value of the City’s pool
shares. It is the City’s policy generally to hold investments until maturity. SROG’s pooled investments
at June 30, 2013 and 2012 are summarized below (in thousands):
Fiscal Year
Ended
Credit Quality
Rating
Fair Value
Weighted Average
Maturity (Years)
June 30, 2013 Not Rated $ 35,308 2.11
June 30, 2012 Not Rated 33,724 1.61
Multi-City Subregional Operating Group (SROG)
Notes to the Financial Statements
For the Fiscal Years Ended June 30, 2013 and 2012
18
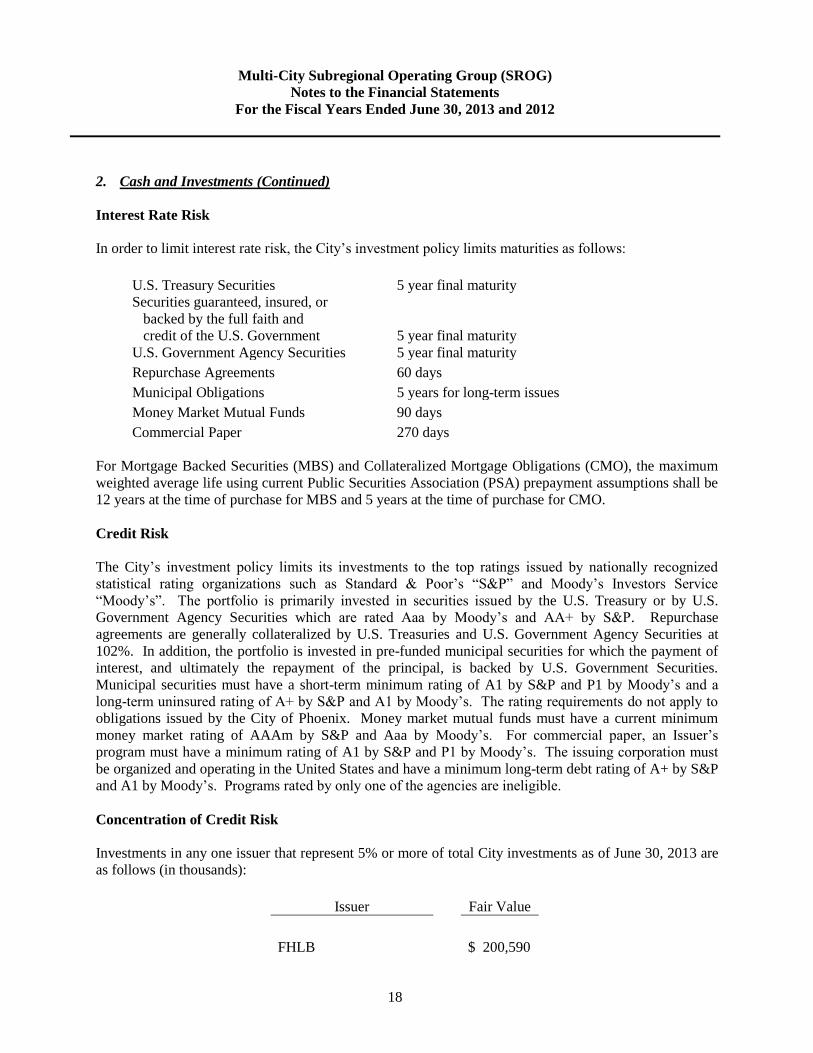
2. Cash and Investments (Continued)
Interest Rate Risk
In order to limit interest rate risk, the City’s investment policy limits maturities as follows:
U.S. Treasury Securities 5 year final maturity
Securities guaranteed, insured, or
backed by the full faith and
credit of the U.S. Government
U.S. Government Agency Securities
5 year final maturity
5 year final maturity
Repurchase Agreements 60 days
Municipal Obligations 5 years for long-term issues
Money Market Mutual Funds 90 days
Commercial Paper 270 days
For Mortgage Backed Securities (MBS) and Collateralized Mortgage Obligations (CMO), the maximum
weighted average life using current Public Securities Association (PSA) prepayment assumptions shall be
12 years at the time of purchase for MBS and 5 years at the time of purchase for CMO.
Credit Risk
The City’s investment policy limits its investments to the top ratings issued by nationally recognized
statistical rating organizations such as Standard & Poor’s “S&P” and Moody’s Investors Service
“Moody’s”. The portfolio is primarily invested in securities issued by the U.S. Treasury or by U.S.
Government Agency Securities which are rated Aaa by Moody’s and AA+ by S&P. Repurchase
agreements are generally collateralized by U.S. Treasuries and U.S. Government Agency Securities at
102%. In addition, the portfolio is invested in pre-funded municipal securities for which the payment of
interest, and ultimately the repayment of the principal, is backed by U.S. Government Securities.
Municipal securities must have a short-term minimum rating of A1 by S&P and P1 by Moody’s and a
long-term uninsured rating of A+ by S&P and A1 by Moody’s. The rating requirements do not apply to
obligations issued by the City of Phoenix. Money market mutual funds must have a current minimum
money market rating of AAAm by S&P and Aaa by Moody’s. For commercial paper, an Issuer’s
program must have a minimum rating of A1 by S&P and P1 by Moody’s. The issuing corporation must
be organized and operating in the United States and have a minimum long-term debt rating of A+ by S&P
and A1 by Moody’s. Programs rated by only one of the agencies are ineligible.
Concentration of Credit Risk
Investments in any one issuer that represent 5% or more of total City investments as of June 30, 2013 are
as follows (in thousands):
Issuer Fair Value
FHLB $ 200,590
Multi-City Subregional Operating Group (SROG)
Notes to the Financial Statements
For the Fiscal Years Ended June 30, 2013 and 2012
19
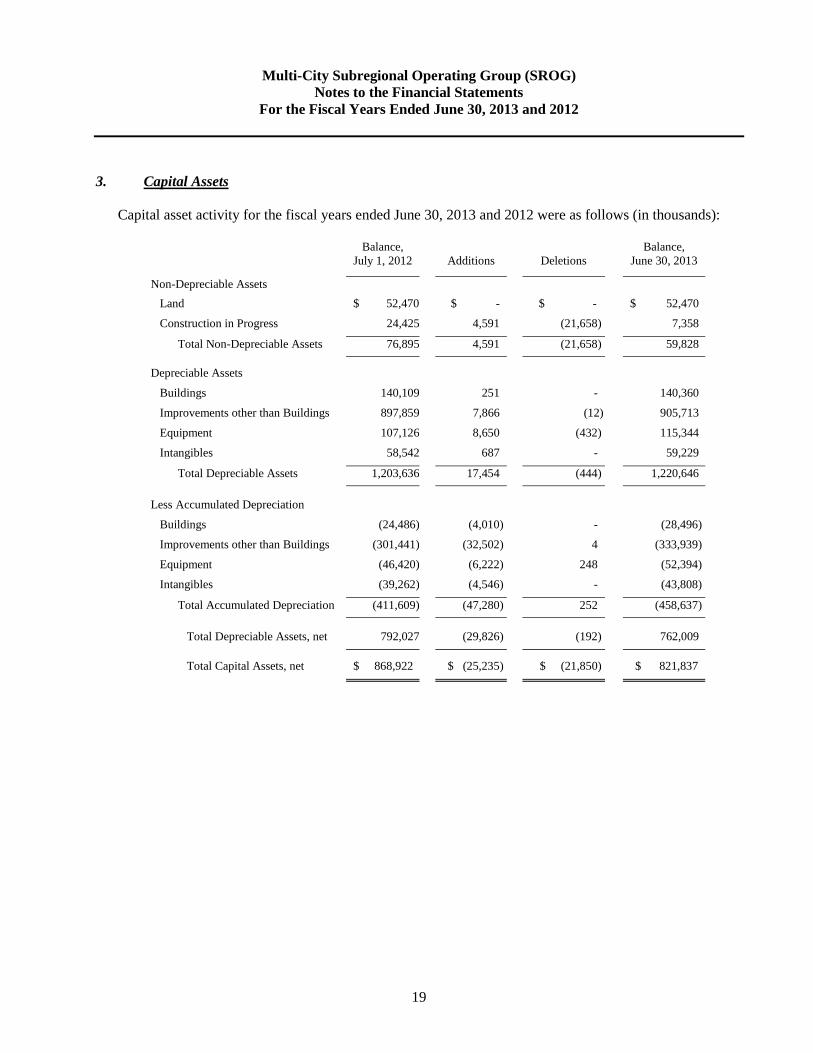
3. Capital Assets
Capital asset activity for the fiscal years ended June 30, 2013 and 2012 were as follows (in thousands):
Balance,
July 1, 2012
Additions
Deletions
Balance,
June 30, 2013
Non-Depreciable Assets
Land $ 52,470 $ - $ - $ 52,470
Construction in Progress 24,425 4,591 (21,658) 7,358
Total Non-Depreciable Assets 76,895 4,591 (21,658) 59,828
Depreciable Assets
Buildings 140,109 251 - 140,360
Improvements other than Buildings 897,859 7,866 (12) 905,713
Equipment 107,126 8,650 (432) 115,344
Intangibles 58,542 687
- 59,229
Total Depreciable Assets 1,203,636 17,454 (444) 1,220,646
Less Accumulated Depreciation
Buildings (24,486) (4,010) - (28,496)
Improvements other than Buildings (301,441) (32,502) 4 (333,939)
Equipment (46,420) (6,222) 248 (52,394)
Intangibles (39,262) (4,546) - (43,808)
Total Accumulated Depreciation (411,609) (47,280) 252 (458,637)
Total Depreciable Assets, net 792,027 (29,826) (192) 762,009
Total Capital Assets, net $ 868,922 $ (25,235) $ (21,850) $ 821,837
Multi-City Subregional Operating Group (SROG)
Notes to the Financial Statements
For the Fiscal Years Ended June 30, 2013 and 2012
20
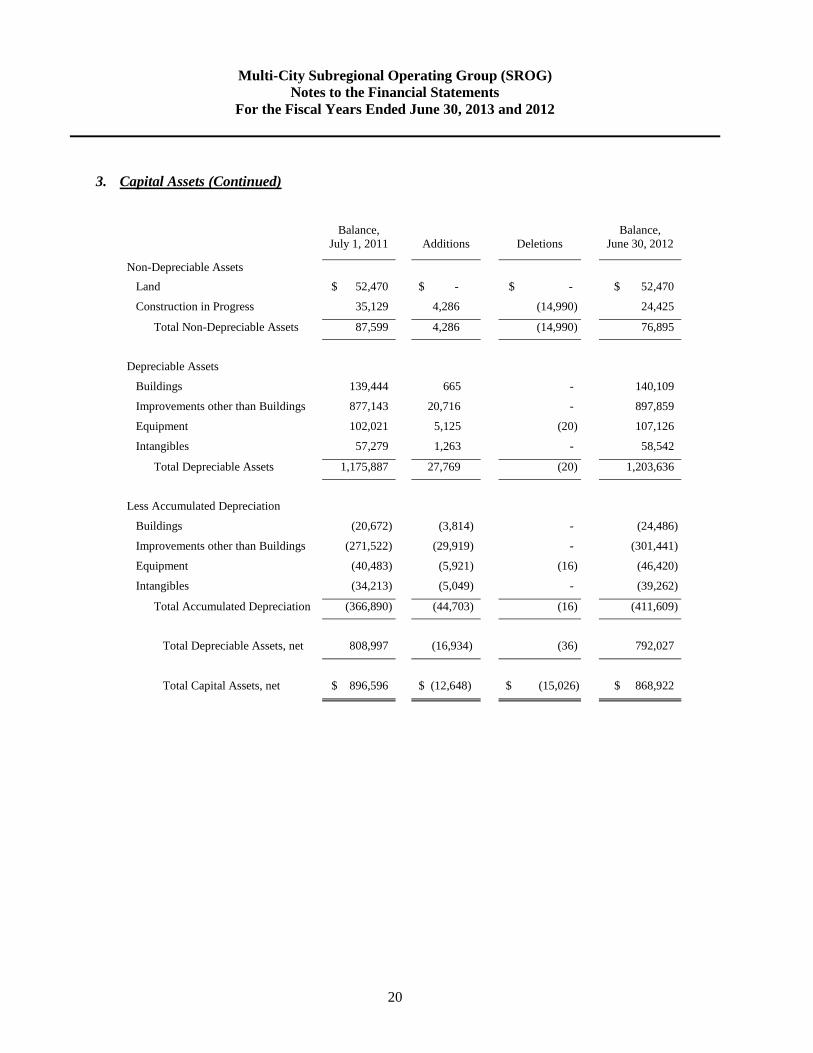
3. Capital Assets (Continued)
Balance,
July 1, 2011
Additions
Deletions
Balance,
June 30, 2012
Non-Depreciable Assets
Land $ 52,470 $ - $ - $ 52,470
Construction in Progress 35,129 4,286 (14,990) 24,425
Total Non-Depreciable Assets 87,599 4,286 (14,990) 76,895
Depreciable Assets
Buildings 139,444 665 - 140,109
Improvements other than Buildings 877,143 20,716 - 897,859
Equipment 102,021 5,125 (20) 107,126
Intangibles 57,279 1,263 - 58,542
Total Depreciable Assets 1,175,887 27,769 (20) 1,203,636
Less Accumulated Depreciation
Buildings (20,672) (3,814) - (24,486)
Improvements other than Buildings (271,522) (29,919) - (301,441)
Equipment (40,483) (5,921) (16) (46,420)
Intangibles (34,213) (5,049) - (39,262)
Total Accumulated Depreciation (366,890) (44,703) (16) (411,609)
Total Depreciable Assets, net 808,997 (16,934) (36) 792,027
Total Capital Assets, net $ 896,596 $ (12,648) $ (15,026) $ 868,922
Multi-City Subregional Operating Group (SROG)
Notes to the Financial Statements
For the Fiscal Years Ended June 30, 2013 and 2012
21
4. Risk Management
The Plant’s insurance program is administered by the City of Phoenix Risk Management Division of the
Finance Department. SROG is charged quarterly for its share of self-insurance coverage. For fiscal
years 2013 and 2012, SROG was charged $192,282 and $142,203, respectively, for self-insurance
premiums. The members proportionately share the costs of the insurance program according to the
provisions of the intergovernmental agreement. The City of Phoenix maintains a $7.5 million self-
insured retention for third-party liability claims. Losses which exceed the retention levels are covered by
commercial insurance purchased through the City. Workers’ compensation, unemployment and long-
term disability are self-insured. Employee healthcare benefits are self-insured through the City of
Phoenix Health Care Benefits Trust. Self-insured claims are reported as liabilities in the City of
Phoenix’s basic financial statements when it is probable that a loss has occurred and the amount of that
loss can be reasonably estimated. This determination is based on an independent actuarial analysis of
reported claims and estimated claims incurred but not reported. For the year ended June 30, 2013, there
were no reductions in insurance coverage from the prior year and settled claims have not exceeded
insurance coverage for the past five years. In the opinion of management, no provision for claims is
required in the accompanying financial statements.
Long-term disability benefits were self-insured through the City of Phoenix Long-term Disability Trust
Fiduciary Fund. As a partially funded other post-employment benefit, no liability is reflected. Claims
that are expected to be paid with expendable available financial resources are accounted for in the City’s
General Fund. All other claims are accounted for in the City’s government-wide statement of net
position.
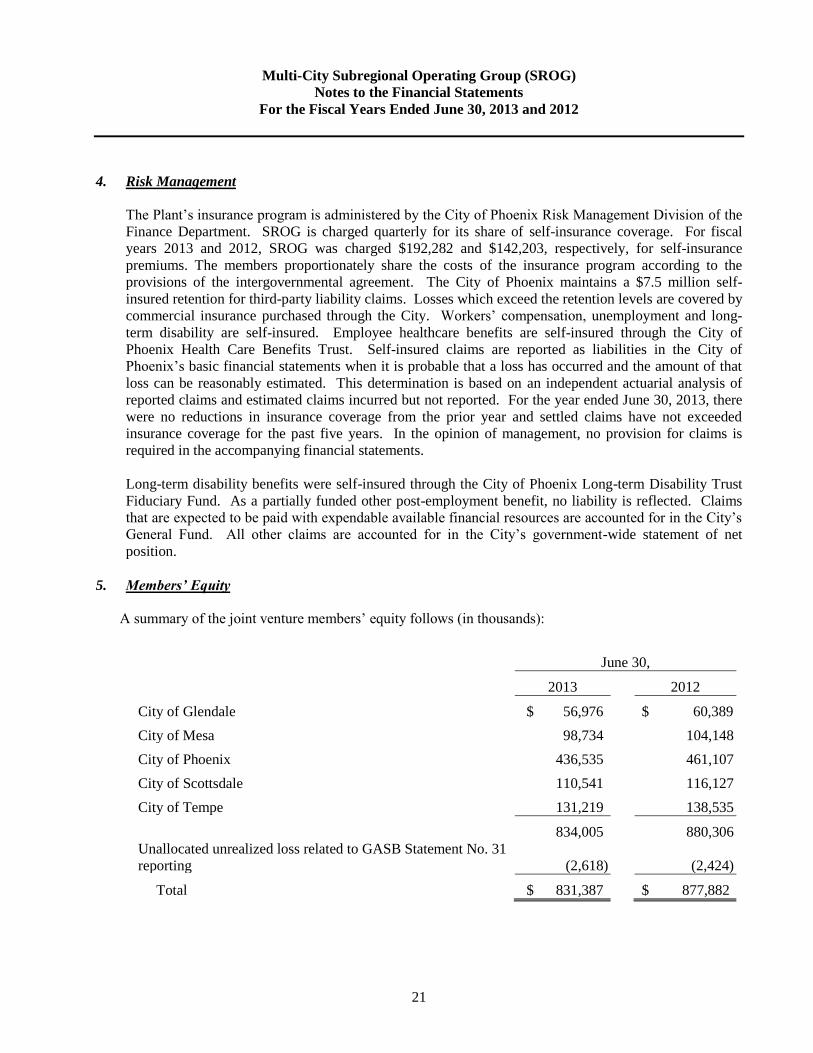
5. Members’ Equity
A summary of the joint venture members’ equity follows (in thousands):
June 30,
2013 2012
City of Glendale $ 56,976 $ 60,389
City of Mesa 98,734 104,148
City of Phoenix 436,535 461,107
City of Scottsdale 110,541 116,127
City of Tempe 131,219 138,535
834,005 880,306
Unallocated unrealized loss related to GASB Statement No. 31
reporting (2,618) (2,424)
Total $ 831,387 $ 877,882
Multi-City Subregional Operating Group (SROG)
Notes to the Financial Statements
For the Fiscal Years Ended June 30, 2013 and 2012
22
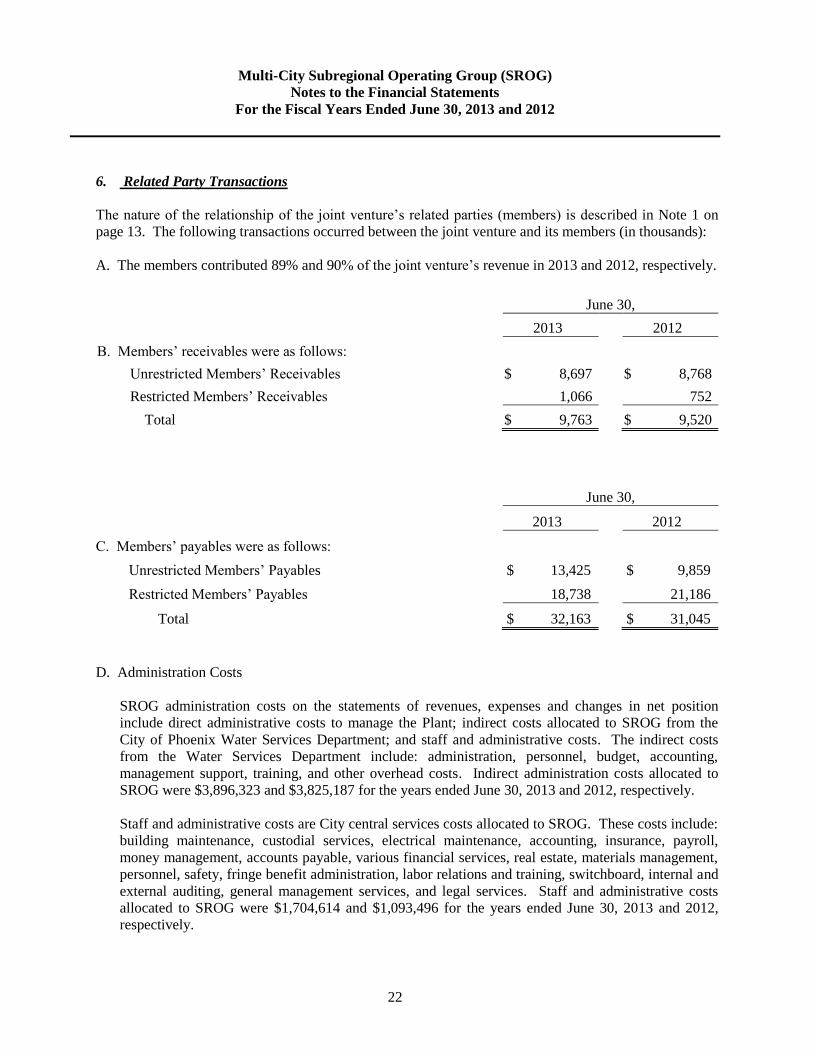
6. Related Party Transactions
The nature of the relationship of the joint venture’s related parties (members) is described in Note 1 on
page 13. The following transactions occurred between the joint venture and its members (in thousands):
A. The members contributed 89% and 90% of the joint venture’s revenue in 2013 and 2012, respectively.
June 30,
2013 2012
B. Members’ receivables were as follows:
Unrestricted Members’ Receivables $ 8,697 $ 8,768
Restricted Members’ Receivables 1,066 752
Total $ 9,763 $ 9,520
June 30,
2013 2012
C. Members’ payables were as follows:
Unrestricted Members’ Payables $ 13,425 $ 9,859
Restricted Members’ Payables 18,738 21,186
Total $ 32,163 $ 31,045
D. Administration Costs
SROG administration costs on the statements of revenues, expenses and changes in net position
include direct administrative costs to manage the Plant; indirect costs allocated to SROG from the
City of Phoenix Water Services Department; and staff and administrative costs. The indirect costs
from the Water Services Department include: administration, personnel, budget, accounting,
management support, training, and other overhead costs. Indirect administration costs allocated to
SROG were $3,896,323 and $3,825,187 for the years ended June 30, 2013 and 2012, respectively.
Staff and administrative costs are City central services costs allocated to SROG. These costs include:
building maintenance, custodial services, electrical maintenance, accounting, insurance, payroll,
money management, accounts payable, various financial services, real estate, materials management,
personnel, safety, fringe benefit administration, labor relations and training, switchboard, internal and
external auditing, general management services, and legal services. Staff and administrative costs
allocated to SROG were $1,704,614 and $1,093,496 for the years ended June 30, 2013 and 2012,
respectively.
Multi-City Subregional Operating Group (SROG)
Notes to the Financial Statements
For the Fiscal Years Ended June 30, 2013 and 2012
23
7. Construction and Other Grants
Grant receipts are disbursed to the SROG members based on their purchased capacity at the Plant. The
members recognize grant proceeds as income during the period in which reimbursable costs are
expensed and recorded. The amounts are not reflected in SROG's financial statements. SROG did not
receive any grant receipts for the fiscal years ended June 30, 2013 and 2012.
8. Commitments and Contingencies
In the normal course of expanding the jointly used wastewater treatment plant and transportation
facilities, SROG enters into contractual agreements to purchase material, equipment, and services. At
June 30, 2013, SROG had outstanding purchase commitments for capital improvements aggregating
approximately $1.3 million.
9. Pension Plan
(a) Plan Description
SROG’s full-time employees are employed by the City are covered by the City of Phoenix
Employees’ Retirement Plan (COPERS). In addition to normal retirement benefits, COPERS also
provides for disability and survivor benefits, as well as deferred pensions for former employees.
Pension benefits vest after five years for general City employees.
COPERS is a single-employer defined benefit pension plan for all full-time classified civil service
general City employees. Members are eligible for retirement benefits upon meeting one of the
following age and service requirements:
1. Age 60 years, with ten or more years of credited service.
2. Age 62 years, with five or more years of credited service.
3. Any age, which added to years of credited service equals 80.
COPERS is authorized by and administered in accordance with Chapter XXIV of the Charter of the
City. Authority to make amendments to the plan rests with City voters. It is administered by a nine-
member Retirement Board. COPERS has been included as part of the City’s reporting entity as a
pension trust fund. Copies of the separately issued COPERS financial report, which includes
financial statements and required supplemental information, may be obtained from COPERS, 200
West Washington, 10th Floor, Phoenix, Arizona 85003.
Multi-City Subregional Operating Group (SROG)
Notes to the Financial Statements
For the Fiscal Years Ended June 30, 2013 and 2012
24
9. Pension Plan (Continued)
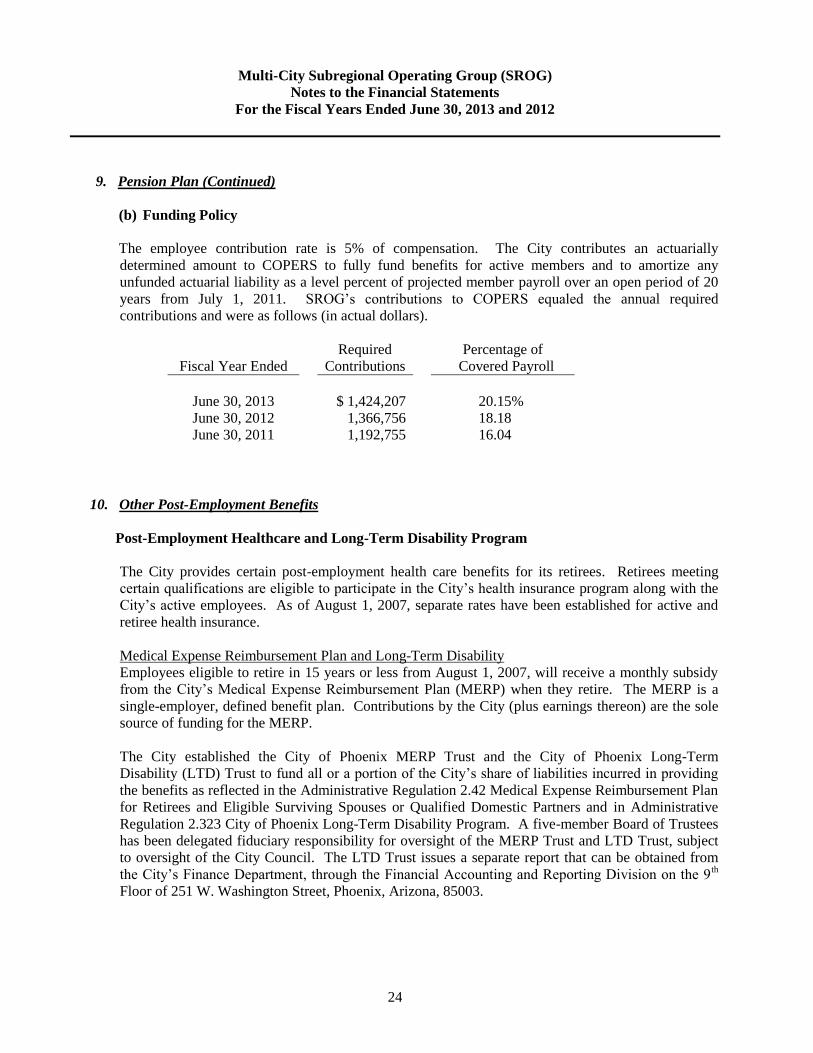
(b) Funding Policy
The employee contribution rate is 5% of compensation. The City contributes an actuarially
determined amount to COPERS to fully fund benefits for active members and to amortize any
unfunded actuarial liability as a level percent of projected member payroll over an open period of 20
years from July 1, 2011. SROG’s contributions to COPERS equaled the annual required
contributions and were as follows (in actual dollars).
Fiscal Year Ended
Required
Contributions
Percentage of
Covered Payroll
June 30, 2013
June 30, 2012
$ 1,424,207
1,366,756
20.15%
18.18
June 30, 2011 1,192,755 16.04
10. Other Post-Employment Benefits
Post-Employment Healthcare and Long-Term Disability Program
The City provides certain post-employment health care benefits for its retirees. Retirees meeting
certain qualifications are eligible to participate in the City’s health insurance program along with the
City’s active employees. As of August 1, 2007, separate rates have been established for active and
retiree health insurance.
Medical Expense Reimbursement Plan and Long-Term Disability
Employees eligible to retire in 15 years or less from August 1, 2007, will receive a monthly subsidy
from the City’s Medical Expense Reimbursement Plan (MERP) when they retire. The MERP is a
single-employer, defined benefit plan. Contributions by the City (plus earnings thereon) are the sole
source of funding for the MERP.
The City established the City of Phoenix MERP Trust and the City of Phoenix Long-Term
Disability (LTD) Trust to fund all or a portion of the City’s share of liabilities incurred in providing
the benefits as reflected in the Administrative Regulation 2.42 Medical Expense Reimbursement Plan
for Retirees and Eligible Surviving Spouses or Qualified Domestic Partners and in Administrative
Regulation 2.323 City of Phoenix Long-Term Disability Program. A five-member Board of Trustees
has been delegated fiduciary responsibility for oversight of the MERP Trust and LTD Trust, subject
to oversight of the City Council. The LTD Trust issues a separate report that can be obtained from
the City’s Finance Department, through the Financial Accounting and Reporting Division on the 9th
Floor of 251 W. Washington Street, Phoenix, Arizona, 85003.

Multi-City Subregional Operating Group (SROG)
Notes to the Financial Statements
For the Fiscal Years Ended June 30, 2013 and 2012
25
10. Other Post-Employment Benefits (Continued)
Post-Employment Healthcare and Long-Term Disability Program (Continued)
The City’s annual other post-employment benefit (OPEB) expense is calculated based on the annual
required contribution (ARC), an amount actuarially determined in accordance with the parameters of
GASB Statement No. 45. The ARC represents a level of funding that, if paid on an ongoing basis, is
projected to cover normal cost each year and amortize any unfunded actuarial liabilities over a period not
to exceed 30 years.
Post-Employment Health Plan
Employees eligible to retire in more than 15 years from August 1, 2007 who have payroll deductions for
City medical insurance coverage are entitled to a $150 monthly contribution to a Post Employment Health
Plan (PEHP) account in lieu of MERP subsidies. PEHP is a 100% employer-paid defined contribution.
Funds accumulated in the account can be used upon termination of employment for qualified medical
expenses. The current administrator of the plan is Nationwide Retirement Solutions.
Actuarial Valuations
In the July 1, 2013, actuarial valuation, the projected unit credit method was used. The actuarial
assumptions included a 7.0 percent investment rate of return (net of administrative expenses), which is the
expected long-term investment returns on plan assets. The actuarial value of assets was equal to market
value. The amortization will not exceed 30 years.
Actuarial valuations of an ongoing plan involve estimates of the value of reported amounts and
assumptions about the probability of occurrence of events far into the future. Examples include
assumptions about future employment, mortality, and the healthcare. Amounts determined regarding the
funded status of the plan and the annual required contributions of the City are subject to continual
revision as actual results are compared with past expectations and new estimates are made about the
future.
Projections of benefits for financial reporting purposes are based on the substantive plan (the plan as
understood by the City and plan members) and include the types of benefits provided at the time of each
valuation. The actuarial methods and assumptions used include techniques that are designed to reduce the
effects of short-term volatility in actuarial accrued liabilities and the actuarial value of assets, consistent
with the long-term perspective of the calculations.
SROG has no assets or liabilities reflected on its statements of net position related to GASB No. 45 as of
June 30, 2013 and 2012.
Multi-City Subregional Operating Group (SROG)
Notes to the Financial Statements
For the Fiscal Years Ended June 30, 2013 and 2012
26
11. Subsequent Events
Pension Reform
On March 12, 2013, Phoenix voters passed Proposition 201- Reform of the City of Phoenix
Employees’ Retirement Plan. The reform has transformed COPERS into a two tier retirement plan.
Changes affect new general city employees hired on or after July 1, 2013 (Tier 2). The Tier 2
contribution rate is based on a 50/50 split with the City of Phoenix’s actuarially determined rate.
Employees are eligible for retirement based on one of the determining factors:
1. Age 60 years, with ten or more years of credited service.
2. Age 62 years, with five or more years of credited service.
3. Any age, which added to years of credited service equals eighty-seven (Rule of 87)

FINANCIAL SECTION - SUPPLEMENTARY INFORMATION
27
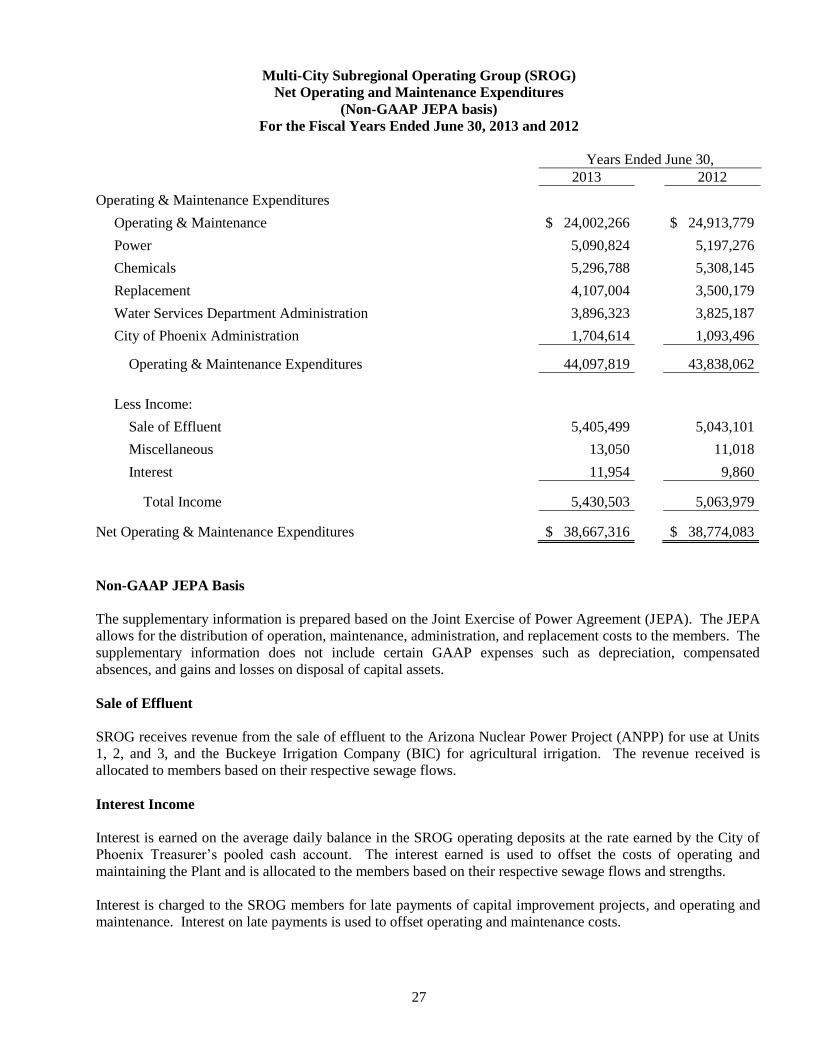
Multi-City Subregional Operating Group (SROG)
Net Operating and Maintenance Expenditures
(Non-GAAP JEPA basis)
For the Fiscal Years Ended June 30, 2013 and 2012
Years Ended June 30,
2013 2012
Operating & Maintenance Expenditures
Operating & Maintenance $ 24,002,266 $ 24,913,779
Power 5,090,824 5,197,276
Chemicals 5,296,788 5,308,145
Replacement 4,107,004 3,500,179
Water Services Department Administration 3,896,323 3,825,187
City of Phoenix Administration 1,704,614 1,093,496
Operating & Maintenance Expenditures 44,097,819 43,838,062
Less Income:
Sale of Effluent 5,405,499 5,043,101
Miscellaneous 13,050 11,018
Interest 11,954 9,860
Total Income 5,430,503 5,063,979
Net Operating & Maintenance Expenditures $ 38,667,316 $ 38,774,083
Non-GAAP JEPA Basis
The supplementary information is prepared based on the Joint Exercise of Power Agreement (JEPA). The JEPA
allows for the distribution of operation, maintenance, administration, and replacement costs to the members. The
supplementary information does not include certain GAAP expenses such as depreciation, compensated
absences, and gains and losses on disposal of capital assets.
Sale of Effluent
SROG receives revenue from the sale of effluent to the Arizona Nuclear Power Project (ANPP) for use at Units
1, 2, and 3, and the Buckeye Irrigation Company (BIC) for agricultural irrigation. The revenue received is
allocated to members based on their respective sewage flows.
Interest Income
Interest is earned on the average daily balance in the SROG operating deposits at the rate earned by the City of
Phoenix Treasurer’s pooled cash account. The interest earned is used to offset the costs of operating and
maintaining the Plant and is allocated to the members based on their respective sewage flows and strengths.
Interest is charged to the SROG members for late payments of capital improvement projects, and operating and
maintenance. Interest on late payments is used to offset operating and maintenance costs.
28
Multi-City Subregional Operating Group (SROG)
Net Operating and Maintenance Expenditures (Continued)
(Non-GAAP JEPA basis)
For the Fiscal Years Ended June 30, 2013 and 2012
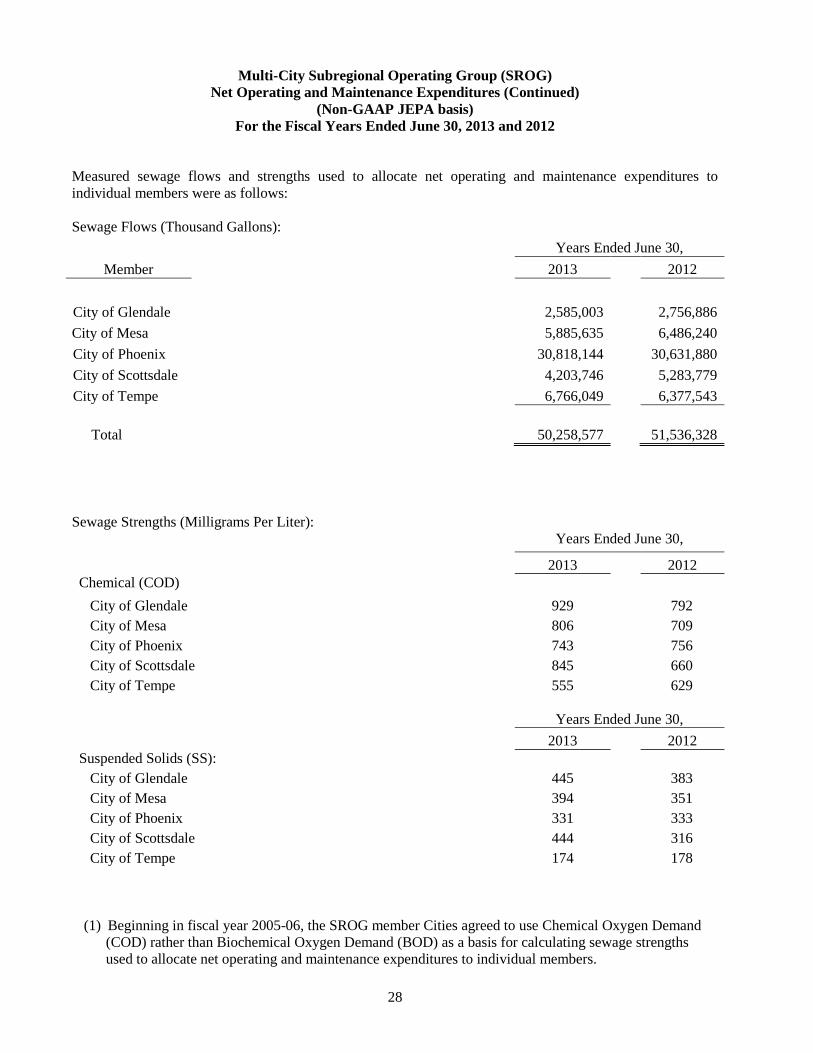
Measured sewage flows and strengths used to allocate net operating and maintenance expenditures to
individual members were as follows:
Sewage Flows (Thousand Gallons):
Years Ended June 30,
Member 2013 2012
City of Glendale 2,585,003 2,756,886
City of Mesa 5,885,635 6,486,240
City of Phoenix 30,818,144 30,631,880
City of Scottsdale 4,203,746 5,283,779
City of Tempe 6,766,049 6,377,543
Total 50,258,577 51,536,328
Sewage Strengths (Milligrams Per Liter):
Years Ended June 30,
2013 2012
Chemical (COD)
City of Glendale 929 792
City of Mesa 806 709
City of Phoenix 743 756
City of Scottsdale 845 660
City of Tempe 555 629
Years Ended June 30,
2013 2012
Suspended Solids (SS):
City of Glendale 445 383
City of Mesa 394 351
City of Phoenix 331 333
City of Scottsdale 444 316
City of Tempe 174 178
(1) Beginning in fiscal year 2005-06, the SROG member Cities agreed to use Chemical Oxygen Demand
(COD) rather than Biochemical Oxygen Demand (BOD) as a basis for calculating sewage strengths
used to allocate net operating and maintenance expenditures to individual members.
29
Multi-City Subregional Operating Group (SROG)
Net Operating and Maintenance Expenditures (Continued)
(Non-GAAP JEPA basis)
For the Fiscal Years Ended June 30, 2013 and 2012
2013
Charge (Credit) Replacement
Per User Charges Over Net Operating
Amount Charge (Under) Actual Expenditures
Member Billed Settlement (1) Expenditures (2) (see page 29)
City of Glendale $ 2,499,801 $ 62,368 $ (53,352) $ 2,508,817
City of Mesa 6,562,261 (1,277,439) (112,034) 5,172,788
City of Phoenix 26,862,401 (3,075,834) (546,904) 23,239,663
City of Scottsdale 4,591,307 (687,688) (83,909) 3,819,710
City of Tempe 4,714,331 (691,196) (96,797) 3,926,338
Total $ 45,230,101 $ (5,669,789) $ (892,996) $ 38,667,316
2012
Charge (Credit) Replacement
Per User Charges Over Net Operating
Amount Charge (Under) Actual Expenditures
Member Billed Settlement (1) Expenditures (2) (see page 29)
City of Glendale $ 2,922,875 $ (490,430) $ (86,575) $ 2,345,870
City of Mesa 6,348,537 (998,859) (192,077) 5,157,601
City of Phoenix 27,187,934 (2,799,636) (914,095) 23,474,203
City of Scottsdale 5,813,584 (1,880,831) (148,937) 3,783,816
City of Tempe 4,610,456 (439,726) (158,137) 4,012,593
Total $ 46,883,386 $ (6,609,482) $ (1,499,821) $ 38,774,083 $ 1,130,117
$
21,091 $ 2,512,852
3,775,951 1,626,204 47,730 5,449,885
$ 22,105,788
$
2,116,776
$
220,458
$
24,443,022
(1)
(2)
These amounts represent the settlement of operating and maintenance expenditures.
SROG members were billed $5,000,000 and $5,000,000 for replacement charges during the years
ended June 30, 2013 and 2012, but incurred $4,107,004 and $3,500,179, respectively, in actual
replacement expenditures.
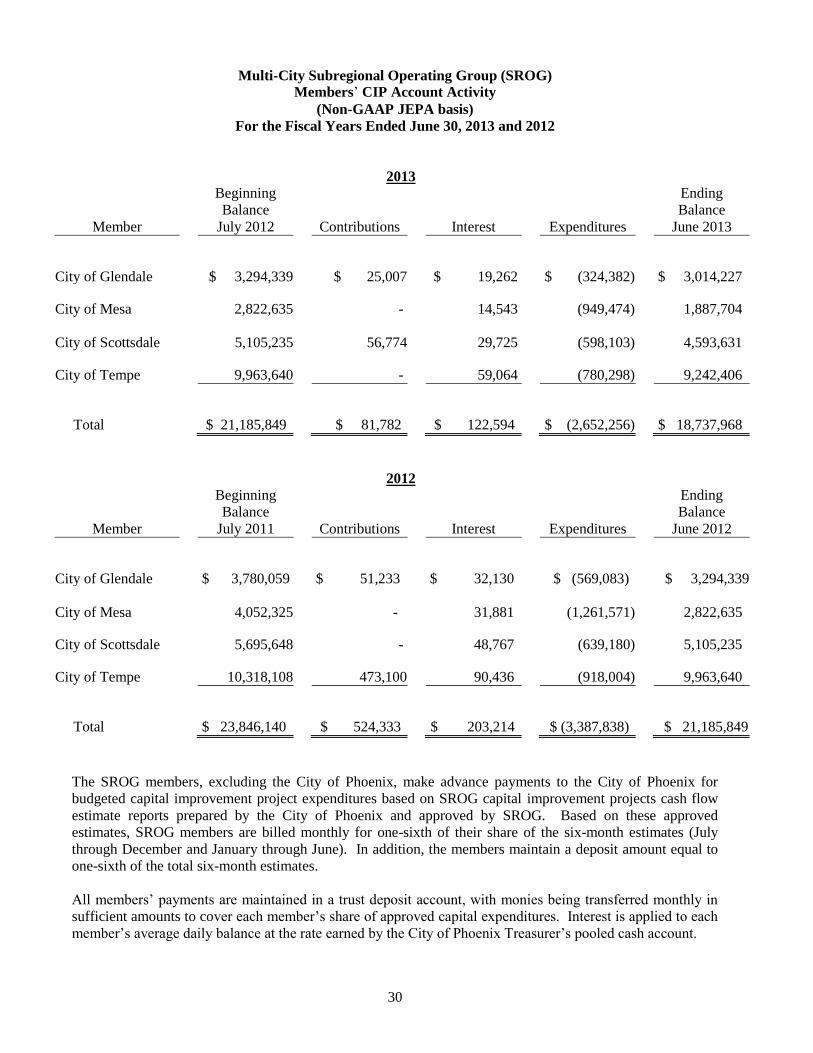
30
Multi-City Subregional Operating Group (SROG)
Members’ CIP Account Activity
(Non-GAAP JEPA basis)
For the Fiscal Years Ended June 30, 2013 and 2012
2013 Beginning Ending
Balance Balance
Member July 2012 Contributions Interest Expenditures June 2013
City of Glendale $ 3,294,339 $ 25,007 $ 19,262 $ (324,382) $ 3,014,227
City of Mesa 2,822,635 - 14,543 (949,474) 1,887,704
City of Scottsdale 5,105,235
56,774 29,725 (598,103) 4,593,631
City of Tempe 9,963,640 - 59,064 (780,298) 9,242,406
Total $ 21,185,849 $ 81,782 $ 122,594 $ (2,652,256) $ 18,737,968
2012 Beginning Ending
Balance Balance
Member July 2011 Contributions Interest Expenditures June 2012
City of Glendale $ 3,780,059 $ 51,233 $ 32,130 $ (569,083) $ 3,294,339
City of Mesa 4,052,325 - 31,881 (1,261,571)
2,822,635
City of Scottsdale 5,695,648 - 48,767 (639,180) 5,105,235
City of Tempe 10,318,108 473,100 90,436 (918,004) 9,963,640
Total $ 23,846,140 $ 524,333 $ 203,214 $ (3,387,838) $ 21,185,849
The SROG members, excluding the City of Phoenix, make advance payments to the City of Phoenix for
budgeted capital improvement project expenditures based on SROG capital improvement projects cash flow
estimate reports prepared by the City of Phoenix and approved by SROG. Based on these approved
estimates, SROG members are billed monthly for one-sixth of their share of the six-month estimates (July
through December and January through June). In addition, the members maintain a deposit amount equal to
one-sixth of the total six-month estimates.
All members’ payments are maintained in a trust deposit account, with monies being transferred monthly in
sufficient amounts to cover each member’s share of approved capital expenditures. Interest is applied to each
member’s average daily balance at the rate earned by the City of Phoenix Treasurer’s pooled cash account.
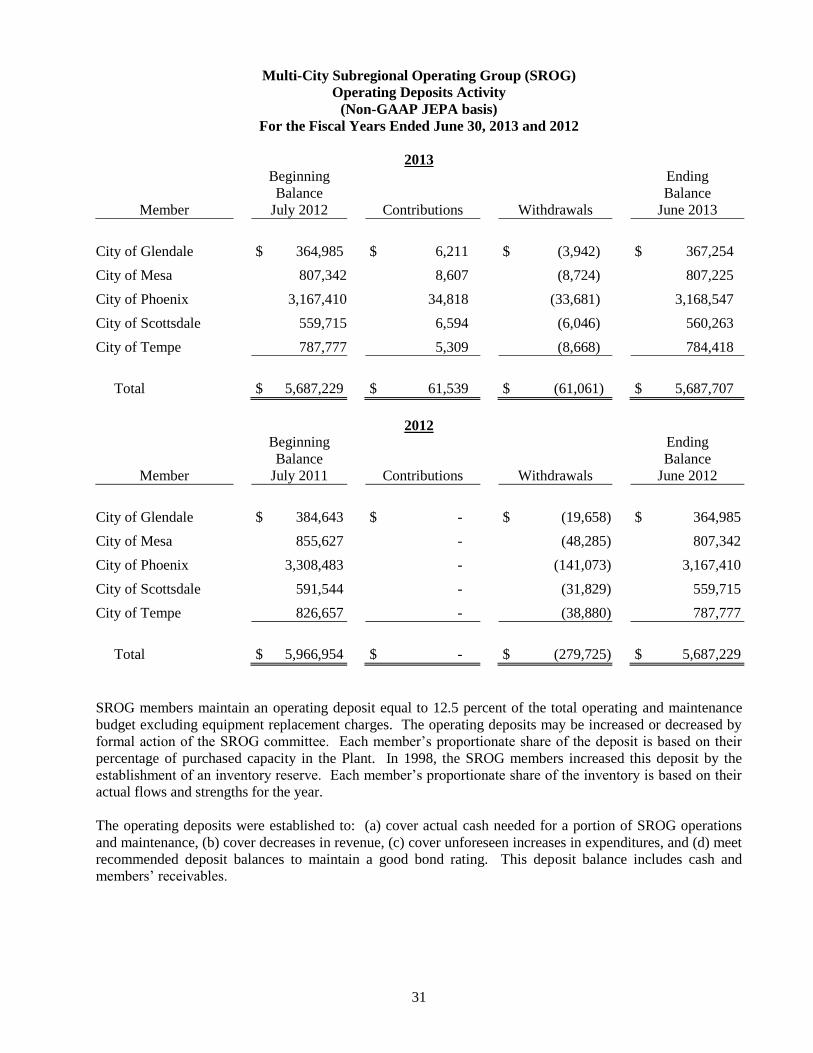
31
Multi-City Subregional Operating Group (SROG)
Operating Deposits Activity
(Non-GAAP JEPA basis)
For the Fiscal Years Ended June 30, 2013 and 2012
2013
Beginning Ending
Balance Balance
Member July 2012 Contributions Withdrawals June 2013
City of Glendale $ 364,985 $ 6,211 $ (3,942) $ 367,254
City of Mesa 807,342 8,607 (8,724) 807,225
City of Phoenix 3,167,410 34,818 (33,681) 3,168,547
City of Scottsdale 559,715 6,594 (6,046) 560,263
City of Tempe 787,777 5,309 (8,668) 784,418
Total $ 5,687,229 $ 61,539 $ (61,061) $ 5,687,707
2012
Beginning Ending
Balance Balance
Member July 2011 Contributions Withdrawals June 2012
City of Glendale $ 384,643 $ - $ (19,658) $ 364,985
City of Mesa 855,627 - (48,285) 807,342
City of Phoenix 3,308,483 - (141,073) 3,167,410
City of Scottsdale 591,544 - (31,829) 559,715
City of Tempe 826,657 - (38,880) 787,777
Total $ 5,966,954 $ - $ (279,725) $ 5,687,229
SROG members maintain an operating deposit equal to 12.5 percent of the total operating and maintenance
budget excluding equipment replacement charges. The operating deposits may be increased or decreased by
formal action of the SROG committee. Each member’s proportionate share of the deposit is based on their
percentage of purchased capacity in the Plant. In 1998, the SROG members increased this deposit by the
establishment of an inventory reserve. Each member’s proportionate share of the inventory is based on their
actual flows and strengths for the year.
The operating deposits were established to: (a) cover actual cash needed for a portion of SROG operations
and maintenance, (b) cover decreases in revenue, (c) cover unforeseen increases in expenditures, and (d) meet
recommended deposit balances to maintain a good bond rating. This deposit balance includes cash and
members’ receivables.
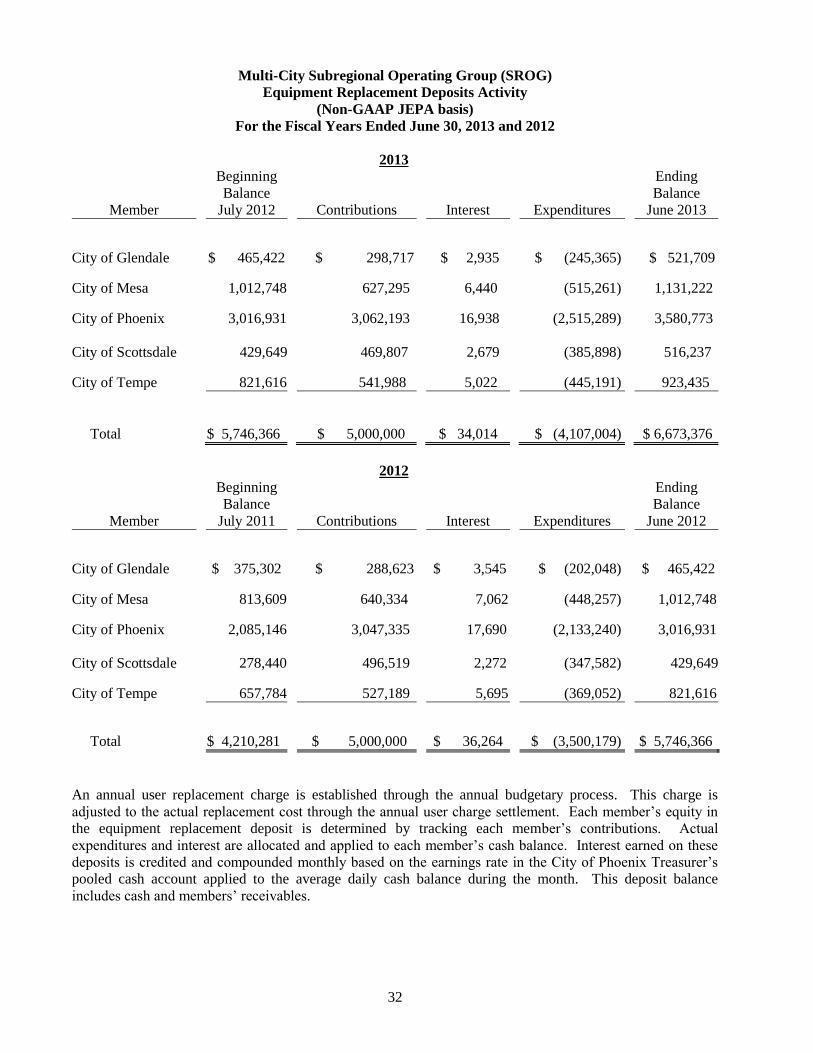
32
Multi-City Subregional Operating Group (SROG)
Equipment Replacement Deposits Activity
(Non-GAAP JEPA basis)
For the Fiscal Years Ended June 30, 2013 and 2012
2013 Beginning Ending
Balance Balance
Member July 2012 Contributions Interest Expenditures June 2013
City of Glendale $ 465,422 $ 298,717 $ 2,935 $ (245,365) $ 521,709
City of Mesa 1,012,748 627,295 6,440 (515,261) 1,131,222
City of Phoenix 3,016,931 3,062,193 16,938 (2,515,289) 3,580,773
City of Scottsdale
429,649 469,807 2,679 (385,898) 516,237
City of Tempe 821,616 541,988 5,022 (445,191) 923,435
Total $ 5,746,366 $ 5,000,000 $ 34,014 $ (4,107,004) $ 6,673,376
2012 Beginning Ending
Balance Balance
Member July 2011 Contributions Interest Expenditures June 2012
City of Glendale $ 375,302 $ 288,623 $ 3,545 $ (202,048) $ 465,422
City of Mesa 813,609 640,334 7,062 (448,257) 1,012,748
City of Phoenix 2,085,146 3,047,335 17,690 (2,133,240) 3,016,931
City of Scottsdale 278,440 496,519 2,272 (347,582)
429,649
City of Tempe 657,784 527,189 5,695 (369,052) 821,616
Total $ 4,210,281 $ 5,000,000 $ 36,264 $ (3,500,179) $ 5,746,366
An annual user replacement charge is established through the annual budgetary process. This charge is
adjusted to the actual replacement cost through the annual user charge settlement. Each member’s equity in
the equipment replacement deposit is determined by tracking each member’s contributions. Actual
expenditures and interest are allocated and applied to each member’s cash balance. Interest earned on these
deposits is credited and compounded monthly based on the earnings rate in the City of Phoenix Treasurer’s
pooled cash account applied to the average daily cash balance during the month. This deposit balance
includes cash and members’ receivables.

STATISTICAL SECTION
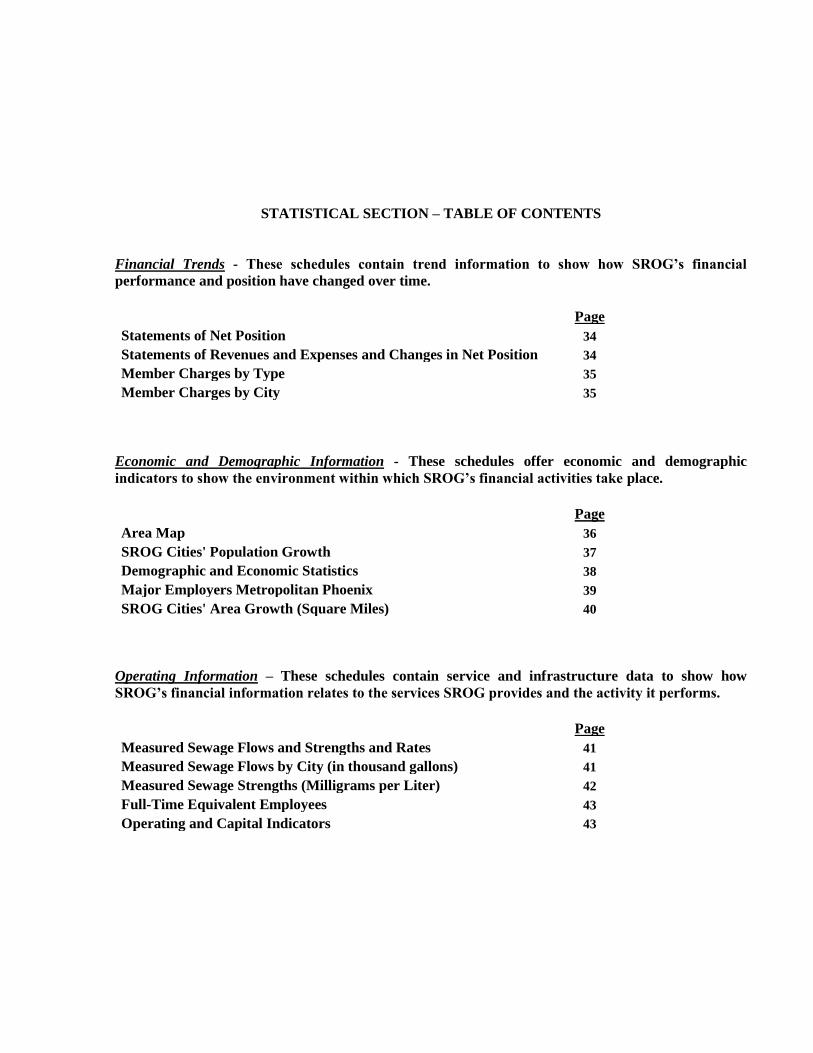
STATISTICAL SECTION – TABLE OF CONTENTS
Financial Trends - These schedules contain trend information to show how SROG’s financial
performance and position have changed over time.
Page
Statements of Net Position 34
Statements of Revenues and Expenses and Changes in Net Position 34
Member Charges by Type 35
Member Charges by City 35
Economic and Demographic Information - These schedules offer economic and demographic
indicators to show the environment within which SROG’s financial activities take place.
Page
Area Map 36
SROG Cities' Population Growth 37
Demographic and Economic Statistics 38
Major Employers Metropolitan Phoenix 39
SROG Cities' Area Growth (Square Miles) 40
Operating Information – These schedules contain service and infrastructure data to show how
SROG’s financial information relates to the services SROG provides and the activity it performs.
Page
Measured Sewage Flows and Strengths and Rates 41
Measured Sewage Flows by City (in thousand gallons) 41
Measured Sewage Strengths (Milligrams per Liter) 42
Full-Time Equivalent Employees 43
Operating and Capital Indicators 43
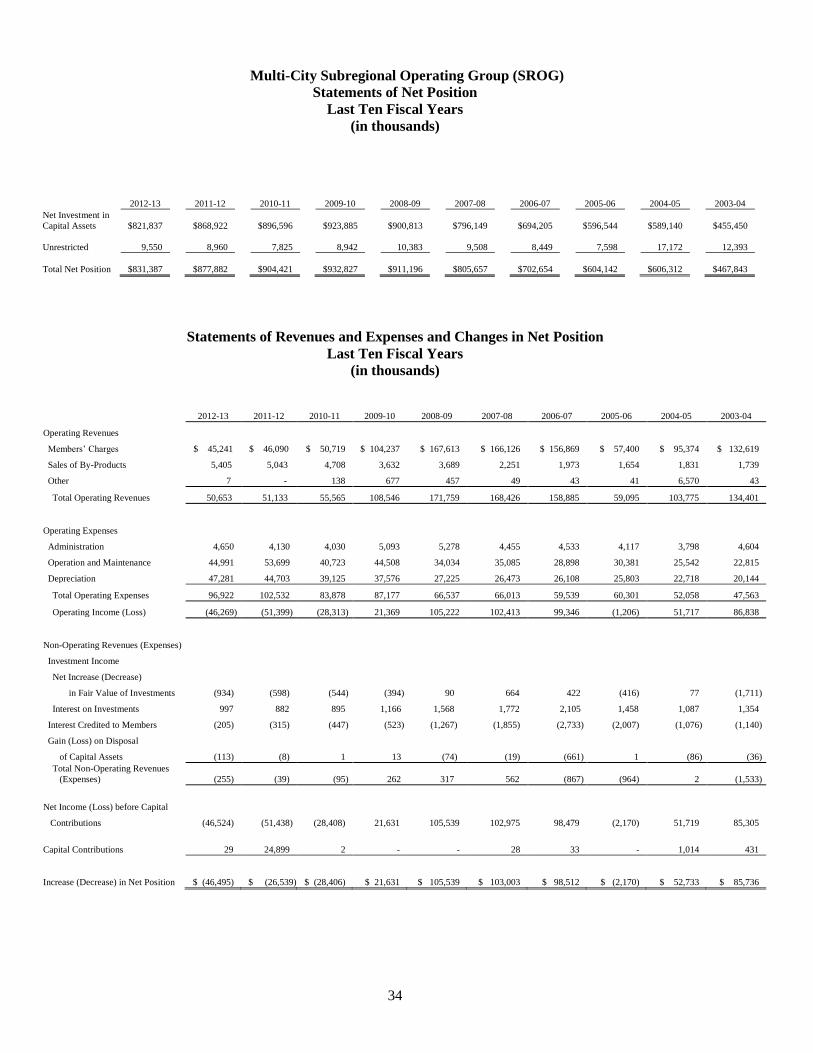
34
Multi-City Subregional Operating Group (SROG)
Statements of Net Position
Last Ten Fiscal Years
(in thousands)
Statements of Revenues and Expenses and Changes in Net Position
Last Ten Fiscal Years
(in thousands)
2012-13 2011-12 2010-11 2009-10 2008-09 2007-08 2006-07 2005-06 2004-05 2003-04
Operating Revenues
Members’ Charges $ 45,241 $ 46,090 $ 50,719 $ 104,237 $ 167,613 $ 166,126 $ 156,869 $ 57,400 $ 95,374 $ 132,619
Sales of By-Products 5,405 5,043 4,708 3,632 3,689 2,251 1,973 1,654 1,831 1,739
Other 7 - 138 677 457 49 43 41 6,570 43
Total Operating Revenues 50,653 51,133 55,565 108,546 171,759 168,426 158,885 59,095 103,775 134,401
Operating Expenses
Administration 4,650 4,130 4,030 5,093 5,278 4,455 4,533 4,117 3,798 4,604
Operation and Maintenance 44,991 53,699 40,723 44,508 34,034 35,085 28,898 30,381 25,542 22,815
Depreciation 47,281 44,703 39,125 37,576 27,225 26,473 26,108 25,803 22,718 20,144
Total Operating Expenses 96,922 102,532 83,878 87,177 66,537 66,013 59,539 60,301 52,058 47,563
Operating Income (Loss) (46,269) (51,399) (28,313) 21,369 105,222 102,413 99,346 (1,206) 51,717 86,838
Non-Operating Revenues (Expenses)
Investment Income
Net Increase (Decrease)
in Fair Value of Investments (934) (598) (544) (394) 90 664 422 (416) 77 (1,711)
Interest on Investments 997 882 895 1,166 1,568 1,772 2,105 1,458 1,087 1,354
Interest Credited to Members (205) (315) (447) (523) (1,267) (1,855) (2,733) (2,007) (1,076) (1,140)
Gain (Loss) on Disposal
of Capital Assets (113) (8) 1 13 (74) (19) (661) 1 (86) (36)
Total Non-Operating Revenues
(Expenses) (255) (39) (95) 262 317 562 (867) (964) 2 (1,533)
Net Income (Loss) before Capital
Contributions (46,524) (51,438) (28,408) 21,631 105,539 102,975 98,479 (2,170) 51,719 85,305
Capital Contributions 29 24,899 2 - - 28 33 - 1,014 431
Increase (Decrease) in Net Position $ (46,495) $ (26,539) $ (28,406) $ 21,631 $ 105,539 $ 103,003 $ 98,512 $ (2,170) $ 52,733 $ 85,736
2012-13 2011-12 2010-11 2009-10 2008-09 2007-08 2006-07 2005-06 2004-05 2003-04
Net Investment in
Capital Assets
$821,837 $868,922 $896,596 $923,885 $900,813
$796,149 $694,205 $596,544 $589,140
$455,450
Unrestricted
9,550 8,960 7,825 8,942 10,383 9,508 8,449 7,598 17,172 12,393
Total Net Position
$831,387 $877,882 $904,421 $932,827 $911,196 $805,657 $702,654 $604,142
$606,312
$467,843
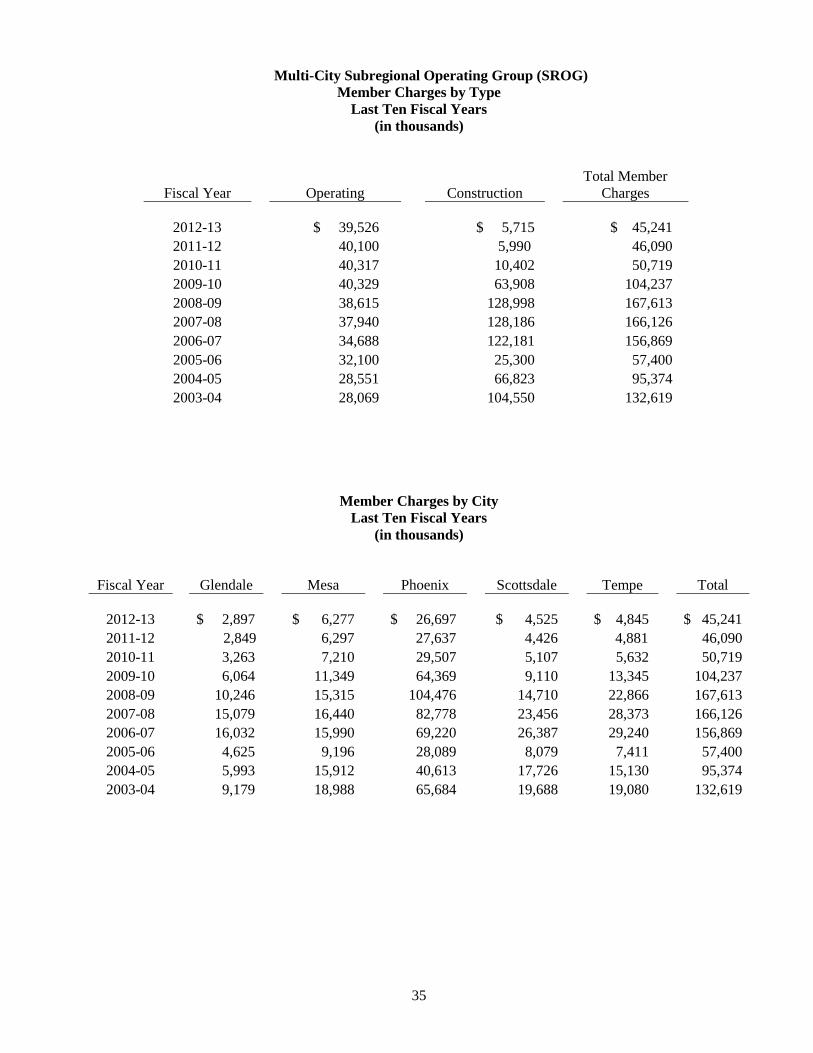
35
Multi-City Subregional Operating Group (SROG)
Member Charges by Type
Last Ten Fiscal Years
(in thousands)
Fiscal Year
Operating
Construction
Total Member
Charges
2012-13 $ 39,526 $ 5,715 $ 45,241
2011-12 40,100 5,990 46,090
2010-11 40,317 10,402 50,719
2009-10 40,329 63,908 104,237
2008-09 38,615 128,998 167,613
2007-08 37,940 128,186 166,126
2006-07 34,688 122,181 156,869
2005-06 32,100 25,300 57,400
2004-05 28,551 66,823 95,374
2003-04 28,069 104,550 132,619
Member Charges by City
Last Ten Fiscal Years
(in thousands)
Fiscal Year Glendale Mesa Phoenix Scottsdale Tempe Total
2012-13 $ 2,897 $ 6,277 $ 26,697 $ 4,525 $ 4,845 $ 45,241
2011-12 2,849 6,297 27,637 4,426 4,881 46,090
2010-11 3,263 7,210 29,507 5,107 5,632 50,719
2009-10 6,064 11,349 64,369 9,110 13,345 104,237
2008-09 10,246 15,315 104,476 14,710 22,866 167,613
2007-08 15,079 16,440 82,778 23,456 28,373 166,126
2006-07 16,032 15,990 69,220 26,387 29,240 156,869
2005-06 4,625 9,196 28,089 8,079 7,411 57,400
2004-05 5,993 15,912 40,613 17,726 15,130 95,374
2003-04 9,179 18,988 65,684 19,688 19,080 132,619
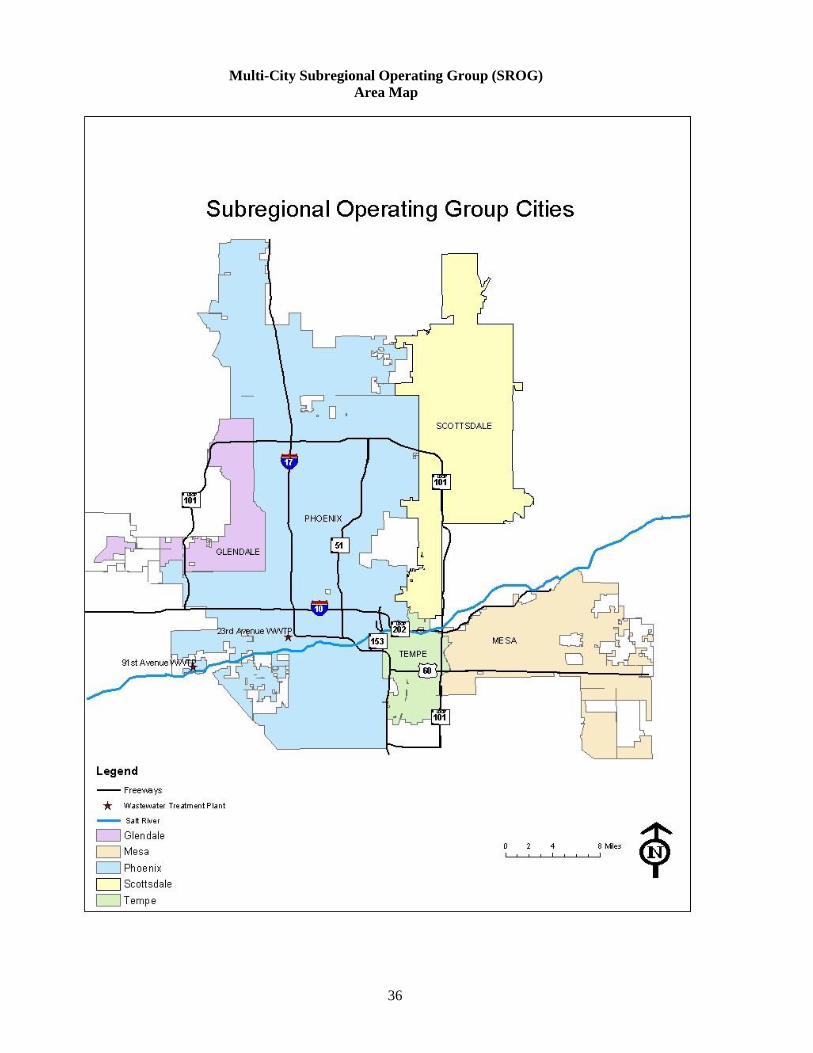
36
Multi-City Subregional Operating Group (SROG)
Area Map
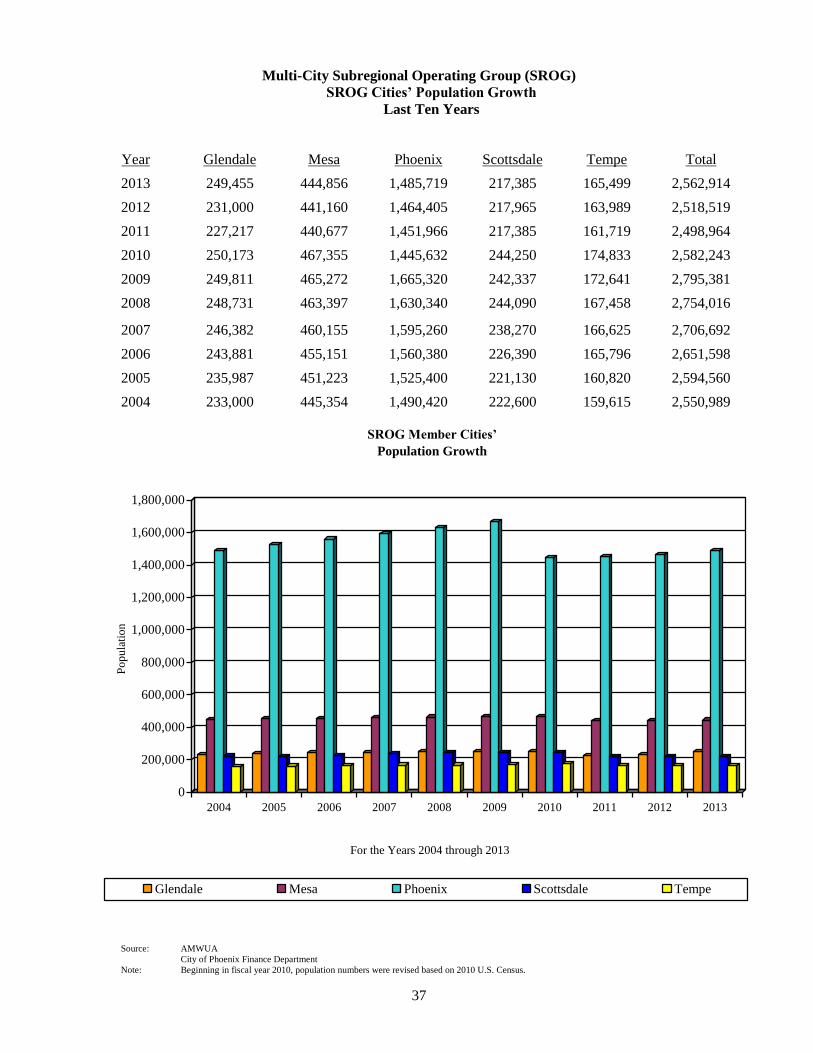
37
Multi-City Subregional Operating Group (SROG)
SROG Cities’ Population Growth
Last Ten Years
Year Glendale Mesa Phoenix Scottsdale Tempe Total
2013 249,455 444,856 1,485,719 217,385 165,499 2,562,914
2012 231,000 441,160 1,464,405 217,965 163,989 2,518,519
2011 227,217 440,677 1,451,966 217,385 161,719 2,498,964
2010 250,173 467,355 1,445,632 244,250 174,833 2,582,243
2009 249,811 465,272 1,665,320 242,337 172,641 2,795,381
2008 248,731 463,397 1,630,340 244,090 167,458 2,754,016
2007 246,382 460,155 1,595,260 238,270 166,625 2,706,692
2006 243,881 455,151 1,560,380 226,390 165,796 2,651,598
2005 235,987 451,223 1,525,400 221,130 160,820 2,594,560
2004 233,000 445,354 1,490,420 222,600 159,615 2,550,989
0
200,000
400,000
600,000
800,000
1,000,000
1,200,000
1,400,000
1,600,000
1,800,000
Po
pu
lati
on
2004 2005 2006 2007 2008 2009 2010 2011 2012 2013
SROG Member Cities’
Population Growth
Glendale Mesa Phoenix Scottsdale Tempe
Source: AMWUA
City of Phoenix Finance Department
Note: Beginning in fiscal year 2010, population numbers were revised based on 2010 U.S. Census.
For the Years 2004 through 2013
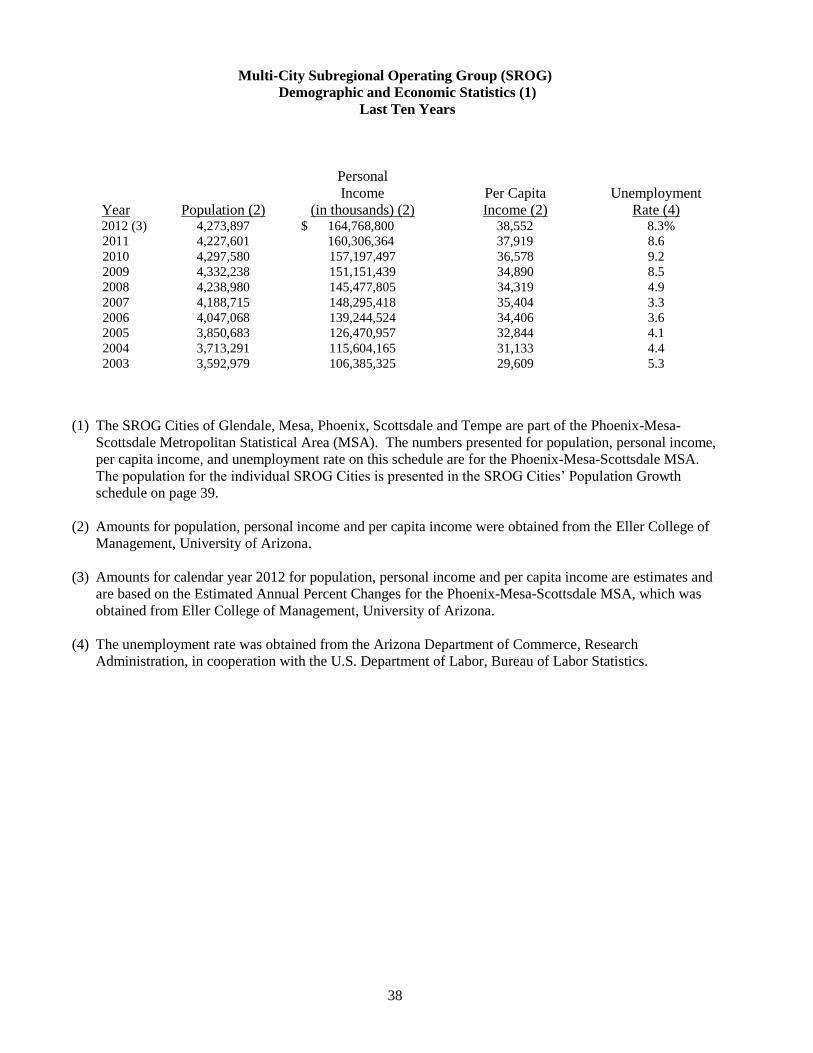
38
Multi-City Subregional Operating Group (SROG)
Demographic and Economic Statistics (1)
Last Ten Years
Year
Population (2)
Personal
Income
(in thousands) (2)
Per Capita
Income (2)
Unemployment
Rate (4) 2012 (3) 4,273,897 $ 164,768,800 38,552 8.3%
2011 4,227,601 160,306,364 37,919 8.6
2010 4,297,580 157,197,497 36,578 9.2
2009 4,332,238 151,151,439 34,890 8.5
2008 4,238,980 145,477,805 34,319 4.9
2007 4,188,715 148,295,418 35,404 3.3
2006 4,047,068 139,244,524 34,406 3.6
2005 3,850,683 126,470,957 32,844 4.1
2004 3,713,291 115,604,165 31,133 4.4
2003 3,592,979 106,385,325 29,609 5.3
(1) The SROG Cities of Glendale, Mesa, Phoenix, Scottsdale and Tempe are part of the Phoenix-Mesa-
Scottsdale Metropolitan Statistical Area (MSA). The numbers presented for population, personal income,
per capita income, and unemployment rate on this schedule are for the Phoenix-Mesa-Scottsdale MSA.
The population for the individual SROG Cities is presented in the SROG Cities’ Population Growth
schedule on page 39.
(2) Amounts for population, personal income and per capita income were obtained from the Eller College of
Management, University of Arizona.
(3) Amounts for calendar year 2012 for population, personal income and per capita income are estimates and
are based on the Estimated Annual Percent Changes for the Phoenix-Mesa-Scottsdale MSA, which was
obtained from Eller College of Management, University of Arizona.
(4) The unemployment rate was obtained from the Arizona Department of Commerce, Research
Administration, in cooperation with the U.S. Department of Labor, Bureau of Labor Statistics.
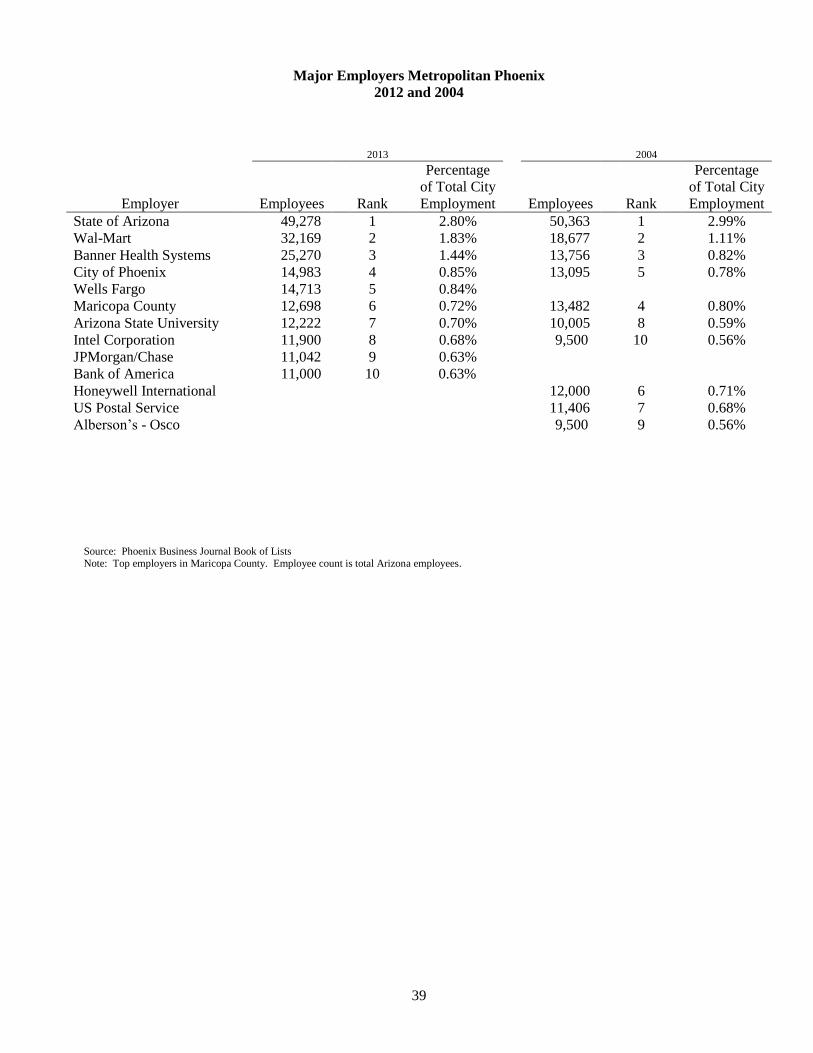
39
Major Employers Metropolitan Phoenix
2012 and 2004
Source: Phoenix Business Journal Book of Lists Note: Top employers in Maricopa County. Employee count is total Arizona employees.
2013 2004
Employer Employees Rank
Percentage
of Total City
Employment Employees Rank
Percentage
of Total City
Employment
State of Arizona 49,278 1 2.80% 50,363 1 2.99%
Wal-Mart 32,169 2 1.83% 18,677 2 1.11%
Banner Health Systems 25,270 3 1.44% 13,756 3 0.82%
City of Phoenix 14,983 4 0.85% 13,095 5 0.78%
Wells Fargo 14,713 5 0.84%
Maricopa County 12,698 6 0.72% 13,482 4 0.80%
Arizona State University 12,222 7 0.70% 10,005 8 0.59%
Intel Corporation 11,900 8 0.68% 9,500 10 0.56%
JPMorgan/Chase 11,042 9 0.63%
Bank of America 11,000 10 0.63%
Honeywell International 12,000 6 0.71%
US Postal Service 11,406 7 0.68%
Alberson’s - Osco 9,500 9 0.56%
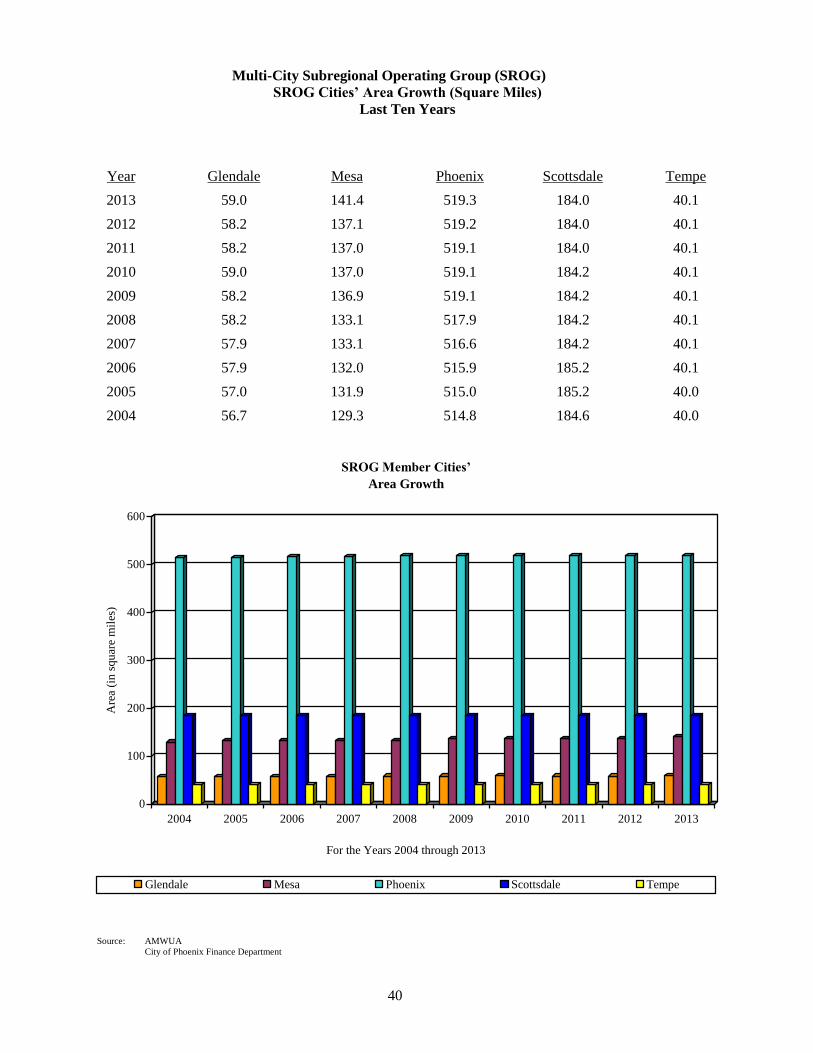
40
Multi-City Subregional Operating Group (SROG)
SROG Cities’ Area Growth (Square Miles)
Last Ten Years
Year Glendale Mesa Phoenix Scottsdale Tempe
2013 59.0 141.4 519.3 184.0 40.1
2012 58.2 137.1 519.2 184.0 40.1
2011 58.2 137.0 519.1 184.0 40.1
2010 59.0 137.0 519.1 184.2 40.1
2009 58.2 136.9 519.1 184.2 40.1
2008 58.2 133.1 517.9 184.2 40.1
2007 57.9 133.1 516.6 184.2 40.1
2006 57.9 132.0 515.9 185.2 40.1
2005 57.0 131.9 515.0 185.2 40.0
2004 56.7 129.3 514.8 184.6 40.0
0
100
200
300
400
500
600
Are
a (i
n s
qu
are
mil
es)
2004 2005 2006 2007 2008 2009 2010 2011 2012 2013
SROG Member Cities’
Area Growth
Glendale Mesa Phoenix Scottsdale Tempe
Source: AMWUA
City of Phoenix Finance Department
For the Years 2004 through 2013
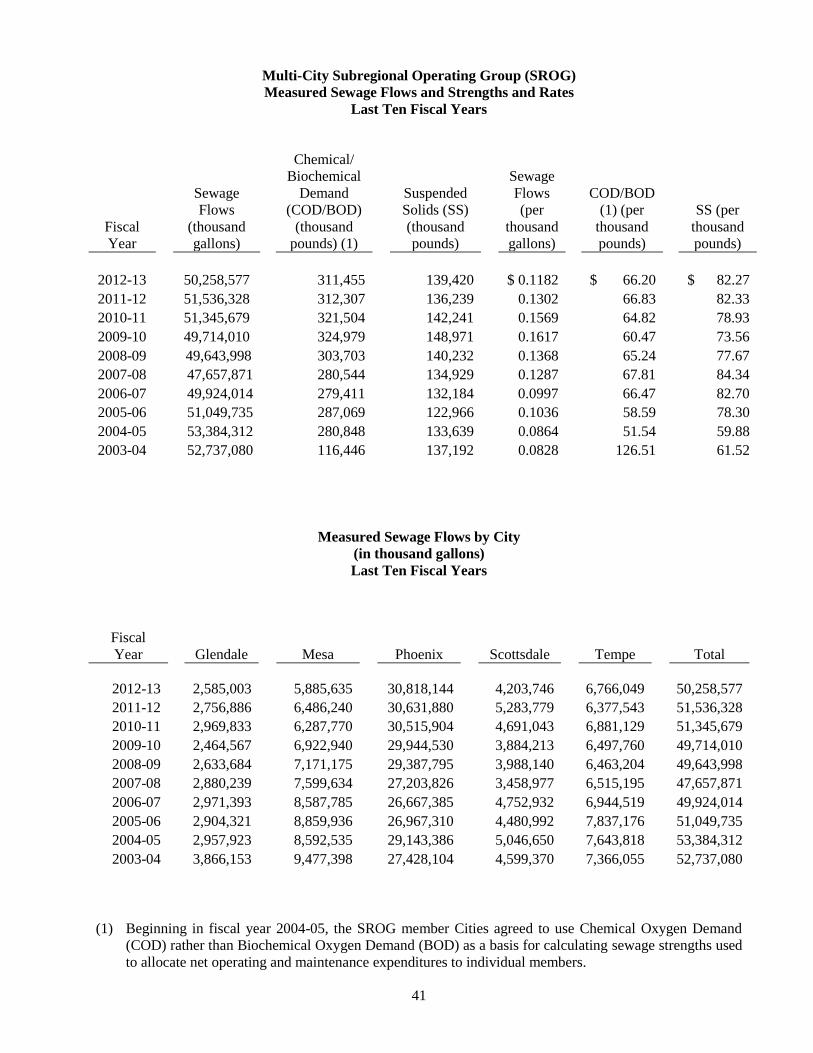
41
Multi-City Subregional Operating Group (SROG) Measured Sewage Flows and Strengths and Rates
Last Ten Fiscal Years
Fiscal
Year
Sewage
Flows
(thousand
gallons)
Chemical/
Biochemical
Demand
(COD/BOD)
(thousand
pounds) (1)
Suspended
Solids (SS)
(thousand
pounds)
Sewage
Flows
(per
thousand
gallons)
COD/BOD
(1) (per
thousand
pounds)
SS (per
thousand
pounds)
2012-13 50,258,577 311,455 139,420 $ 0.1182 $ 66.20 $ 82.27
2011-12 51,536,328 312,307 136,239 0.1302 66.83 82.33
2010-11 51,345,679 321,504 142,241 0.1569 64.82 78.93
2009-10 49,714,010 324,979 148,971 0.1617 60.47 73.56
2008-09 49,643,998 303,703 140,232 0.1368 65.24 77.67
2007-08 47,657,871 280,544 134,929 0.1287 67.81 84.34
2006-07 49,924,014 279,411 132,184 0.0997 66.47 82.70
2005-06 51,049,735 287,069 122,966 0.1036 58.59 78.30
2004-05 53,384,312 280,848 133,639 0.0864 51.54 59.88
2003-04 52,737,080 116,446 137,192 0.0828 126.51 61.52
Measured Sewage Flows by City
(in thousand gallons)
Last Ten Fiscal Years
Fiscal
Year
Glendale
Mesa
Phoenix
Scottsdale
Tempe
Total
2012-13 2,585,003 5,885,635 30,818,144 4,203,746 6,766,049 50,258,577
2011-12 2,756,886 6,486,240 30,631,880 5,283,779 6,377,543 51,536,328
2010-11 2,969,833 6,287,770 30,515,904 4,691,043 6,881,129 51,345,679
2009-10 2,464,567 6,922,940 29,944,530 3,884,213 6,497,760 49,714,010
2008-09 2,633,684 7,171,175 29,387,795 3,988,140 6,463,204 49,643,998
2007-08 2,880,239 7,599,634 27,203,826 3,458,977 6,515,195 47,657,871
2006-07 2,971,393 8,587,785 26,667,385 4,752,932 6,944,519 49,924,014
2005-06 2,904,321 8,859,936 26,967,310 4,480,992 7,837,176 51,049,735
2004-05 2,957,923 8,592,535 29,143,386 5,046,650 7,643,818 53,384,312
2003-04 3,866,153 9,477,398 27,428,104 4,599,370 7,366,055 52,737,080
(1) Beginning in fiscal year 2004-05, the SROG member Cities agreed to use Chemical Oxygen Demand
(COD) rather than Biochemical Oxygen Demand (BOD) as a basis for calculating sewage strengths used
to allocate net operating and maintenance expenditures to individual members.
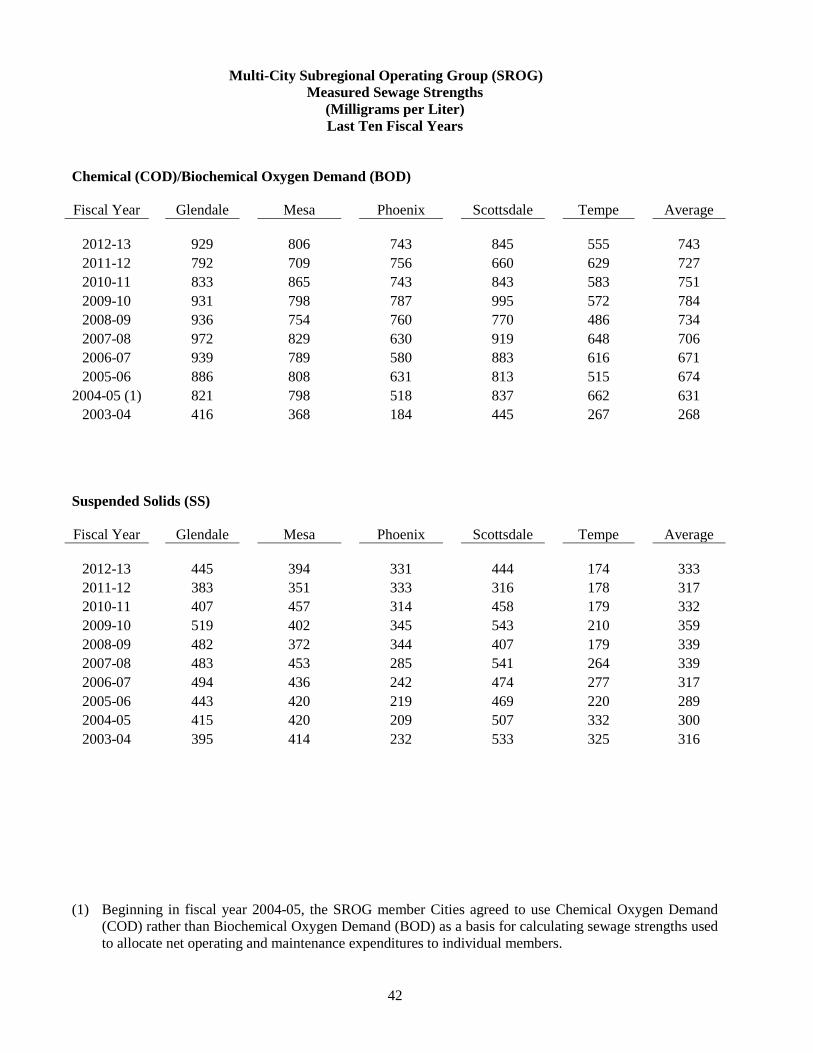
42
Multi-City Subregional Operating Group (SROG) Measured Sewage Strengths
(Milligrams per Liter)
Last Ten Fiscal Years
Chemical (COD)/Biochemical Oxygen Demand (BOD)
Fiscal Year Glendale Mesa Phoenix Scottsdale Tempe Average
2012-13 929 806 743 845 555 743
2011-12 792 709 756 660 629 727
2010-11 833 865 743 843 583 751
2009-10 931 798 787 995 572 784
2008-09 936 754 760 770 486 734
2007-08 972 829 630 919 648 706
2006-07 939 789 580 883 616 671
2005-06 886 808 631 813 515 674
2004-05 (1) 821 798 518 837 662 631
2003-04 416 368 184 445 267 268
Suspended Solids (SS)
Fiscal Year Glendale Mesa Phoenix Scottsdale Tempe Average
2012-13 445 394 331 444 174 333
2011-12 383 351 333 316 178 317
2010-11 407 457 314 458 179 332
2009-10 519 402 345 543 210 359
2008-09 482 372 344 407 179 339
2007-08 483 453 285 541 264 339
2006-07 494 436 242 474 277 317
2005-06 443 420 219 469 220 289
2004-05 415 420 209 507 332 300
2003-04 395 414 232 533 325 316
(1) Beginning in fiscal year 2004-05, the SROG member Cities agreed to use Chemical Oxygen Demand
(COD) rather than Biochemical Oxygen Demand (BOD) as a basis for calculating sewage strengths used
to allocate net operating and maintenance expenditures to individual members.
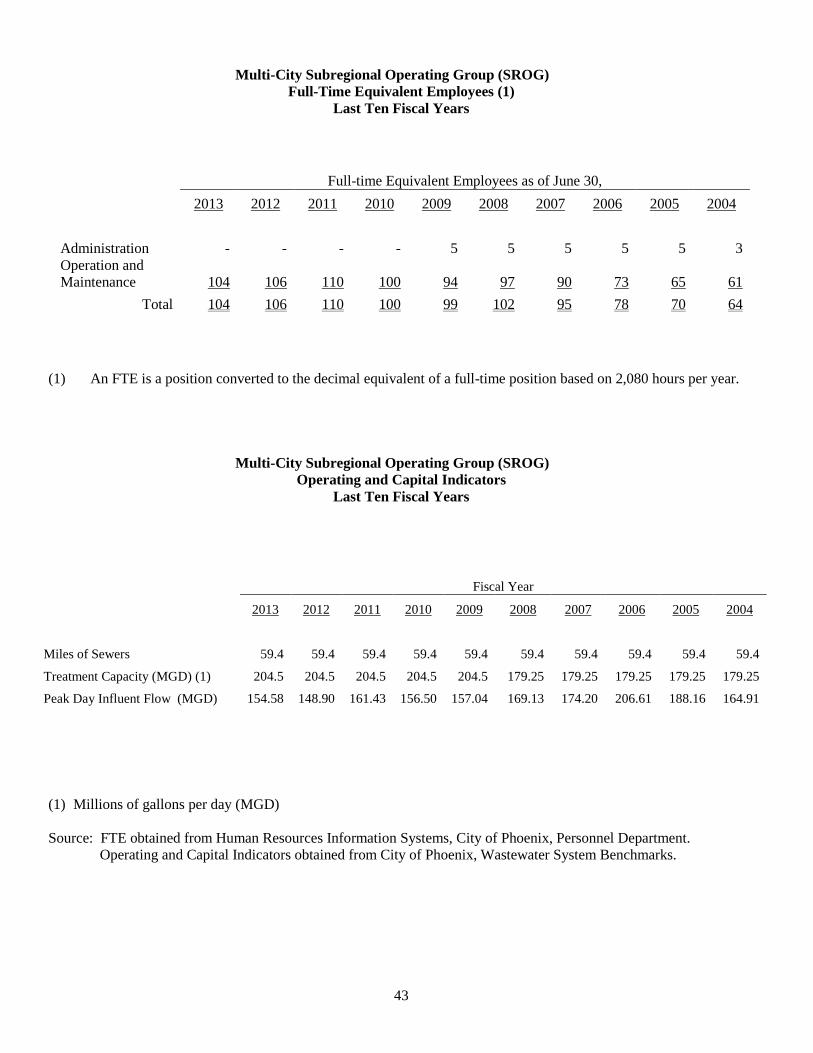
43
Multi-City Subregional Operating Group (SROG) Full-Time Equivalent Employees (1)
Last Ten Fiscal Years
Full-time Equivalent Employees as of June 30,
2013 2012 2011 2010 2009 2008 2007 2006 2005 2004
Administration - - - - 5 5 5 5 5 3
Operation and
Maintenance 104 106 110 100 94 97 90 73 65 61
Total 104 106 110 100 99 102 95 78 70 64
(1) An FTE is a position converted to the decimal equivalent of a full-time position based on 2,080 hours per year.
Multi-City Subregional Operating Group (SROG) Operating and Capital Indicators
Last Ten Fiscal Years
Fiscal Year
2013 2012 2011 2010 2009 2008 2007 2006 2005 2004
Miles of Sewers 59.4 59.4 59.4 59.4 59.4 59.4 59.4 59.4 59.4 59.4
Treatment Capacity (MGD) (1) 204.5 204.5 204.5 204.5 204.5 179.25 179.25 179.25 179.25 179.25
Peak Day Influent Flow (MGD) 154.58 148.90 161.43 156.50 157.04 169.13 174.20 206.61 188.16 164.91
(1) Millions of gallons per day (MGD)
Source: FTE obtained from Human Resources Information Systems, City of Phoenix, Personnel Department.
Operating and Capital Indicators obtained from City of Phoenix, Wastewater System Benchmarks.