Embed Size (px)
Citation preview
1
©A. Alizadeh Shipping Risk Management Slide 1
Shipping Risk Management
Bunker Risk Management
©A. Alizadeh Shipping Risk Management Slide 2
Topics covered
• What is bunker (fuel oil)?
• World bunker market
• Bunker Risk management in liner shipping • Bunker adjustment factor• Long term bunker contracts
• Bunker Risk in Tramp Shipping
• Bunker derivatives
• Petroleum and Product futures
• Forward contracts
• Swaps
• Options
Shipping Risk Management

2
©A. Alizadeh Shipping Risk Management Slide 3
• Bunker fuel is essentially a "Residual" fuel that was originally defined
as whatever liquid was left behind in the petroleum distillation unit after
the removal of more valuable products like kerosene, diesel and naphtha
• There are two basic grades of bunker fuel, IFO 180 and the more widely
used, IFO 380.
• The distinction between the two grades is the distillate content, Grade
180 has 7-15% distillate content, while Grade 380 has 2-5% distillate
content. The higher the distillate content, the more energy the fuel has.
• 60% of world volume in bunkers is IFO380, 30% IFO180 and other
grades, with the remaining 10% in Marine Diesel Oil,
World Bunker Markets
©A. Alizadeh Shipping Risk Management Slide 4
• The IFO380 used in modern ships reflects the technological
advances in the design and efficiency of the engines.
• In general, ships use bunker fuel for propulsion and diesel oil
for manoeuvring in ports and electricity generators.
• Although, recent technological advances enabled ships to use
lower grade bunker fuel more efficiently, high grade bunker is
still used by more sophisticated ships, especially cruise ships
and fast ferries.
World Bunker Markets

3
©A. Alizadeh Shipping Risk Management Slide 5
• Marine bunkers are almost bought and sold in almost every
port in the world
• However, there are a few major bunkering regions in the world
in which the bulk of physical bunkering activities takes place
• These markets are Singapore, Rotterdam and Houston• Singapore has long flourished as a transshipment centre due to its
strategic geographical location.
• Rotterdam (ARA) has been the transshipment centre in Europe
• Houston has been the main bunkering port in the US Gulf
• Other markets include: Hamburg, Fujaira, Yokohama, New
York, Hong Kong, Pusan, etc.
World Bunker Markets
©A. Alizadeh Shipping Risk Management Slide 6
Between 1996 to 2000, roughly 140 million mt of bunker fuels was
consumed per year globally. This has gone up to an estimated
amount of about 200 million mt per year.
• The Singapore bunker market is by far the largest marine fuels market in
the world, with turnover in marine fuel oil 28.5 million mt in 2010
• In Europe, bunker trade volume in Rotterdam reached 13.4 million mt in
2010. However, the combined Amsterdam–Rotterdam–Antwerp (ARA)
region trade is much higher
• Bunkering on the US Gulf coast is dominated by Houston, recording an
estimated annual sales volume of about 5 million mt in year 2010.
World Bunker Markets

4
©A. Alizadeh Shipping Risk Management Slide 7
Historical Bunker prices in major shipping ports
Risk Management in Shipping Operation
Source: Clarkson’s SIN
0
100
200
300
400
500
600
700
800
900
US
$/M
T
Rotterdam Houston Singapore Fujairah Japan
©A. Alizadeh Shipping Risk Management Slide 8
• Bunker fuel is one of the major operating expenses of any shipownerand shipping company, depending on the duration of the voyage accounting for almost 10% to 95% of voyage costs
• The volatility of bunker markets leaves shipowners and operators in a very difficult position as their operating profit may be wiped off very quickly due to sudden changes in bunker prices
• Bunker risk management is important since • It provides greater control over operational costs and secures profit
margins
• Company's creditworthiness can be improved through stabilisation of cash flow and profitability.
Bunker Risk Management

5
©A. Alizadeh Shipping Risk Management Slide 9
Bunker Risk Management
Weekly changes in 380cst bunker prices in Rotterdam, Housmt and Singapore
Average price change and volatility of weekly bunker prices in different
bunkering locations (1990 to 2007)
Rotterdam Houston Singapore Fujairah Japan
Average Price $/mt 158.67 161.98 172.38 169.49 200.34
Min Price $/mt 50.50 48.50 52.00 51.00 59.00Max Price $/mt 707.00 747.00 745.50 736.00 792.50Ave Price Change 0.0509 0.0649 0.0446 0.0456 0.0464Volatility SD 0.4036 0.4329 0.4063 0.3808 0.3142
-0.4
-0.3
-0.2
-0.1
0
0.1
0.2
0.3
0.4
Ja
n-9
0
Ja
n-9
1
Ja
n-9
2
Ja
n-9
3
Ja
n-9
4
Ja
n-9
5
Ja
n-9
6
Ja
n-9
7
Ja
n-9
8
Ja
n-9
9
Ja
n-0
0
Ja
n-0
1
Ja
n-0
2
Ja
n-0
3
Ja
n-0
4
Ja
n-0
5
Ja
n-0
6
Ja
n-0
7
Ja
n-0
8
US
$/m
t
Rotterdam Houston Singapore
©A. Alizadeh Shipping Risk Management Slide 10
• To see how bunker price fluctuations affect shipowners’ P/L, consider the
following example
• A panamax owner fixes a contract of affreightment (CoA) for 150,000 mt
of cargo today, which requires 3 shipments, one every 2 months, at a rate of
25$/mt.
• The freight contract generates $1,250,000 (25$/mt x 50,000 mt) every two
months.
• If the current bunker price is 300$/mt, and the ship consumes 2500 mt of
bunker per voyage, the expected profit for the shipowner from each voyage,
assuming that port charges are $150,000, will be $350,000.
• Now consider the case where bunker prices increase by 20% to 360$/mt in
two months time. This results in an overall reduction in profits of $450,000
for the entire contract, $150,000 for each voyage.
Bunker Risk Management
6
©A. Alizadeh Shipping Risk Management Slide 11
©A. Alizadeh Shipping Risk Management Slide 12
In order to efficiently and effectively use derivatives to manage
bunker price risk in shipping operations it is essential to know how
these derivatives instruments work
These instruments include
• Petroleum and Petroleum product futures contracts,
• Forward bunker agreements,
• Options on bunker prices
• Bunker swap contracts
There are also other tailor made derivative contracts which are
designed especially to eliminate or control the bunker price risk.
Use of each derivative instrument depends on the need of the shipowner/operator and bunker supplier in terms of costs & benefits
Bunker Risk Management

7
©A. Alizadeh Shipping Risk Management Slide 13
Fuel oil Futures Contracts
• Fuel oil futures were traded in the Singapore Mercantile
Exchange (SIMEX) during the period 1988 to 1992, however,
due to the decline in trading volume and illiquidity of the
contracts, SIMEX withdrew the contract.
• The International Petroleum Exchange attempted to launch a
bunker futures contract in January 1999. This proved
unsuccessful and the contract was withdrawn after six months.
• The reason for the failure of these contracts is that shipowners
and suppliers are exposed to price fluctuations in different
geographical locations while bunker futures were only
available for one location (Rotterdam)
Bunker Risk Management
©A. Alizadeh Shipping Risk Management Slide 14
CONTRACT SIZE QUOTE TICK
NYMEX
1. WTI Crude at Cushing 1000 bbl US$/bbl $ 0.01/bbl=$10/contract
2. HEATING OIL #2 42000 US gl US$/gl $ 0.01/gl=$4.2/contract
3. UNLEADED GAS 42000 US gl US$/gl $0.01/gl=$4.2/contract
IPE
1. Brent Crude oil 1000bbl US$/bbl 0.01/bbl=$10/contract
2. GASOIL 100 mt US$/mt $ 0.25/mt=$25/contract
SIMEX
1.Crude Oil Brent 1000 bbl US$/bbl $0.01/bbl=$100/contract
• Apart from Futures contracts, Options on WTI crude, Heating Oil,
Unleaded Gas and crack spreads are also traded at NYMEX
• In the IPE, options on Brent crude and Gasoil are also available
Bunker Risk Management

8
©A. Alizadeh Shipping Risk Management Slide 15
Rotterdam
IFO380
Singapore
IFO380
Houston
IFO380
NYMEXHO NYMEXCO NYMEXGO IPECO IPEGO
Rotterdam IFO380 1.0000
Singapore IFO380 0.4993 1.0000
Houston IFO380 0.3956 0.4679 1.0000
NYMEXCO 0.4228 0.3527 0.2646 1.0000
NYMEXHO 0.3832 0.3001 0.2272 0.6366 1.0000
NYMEXGO 0.4081 0.3255 0.2242 0.6088 0.6546 1.0000
IPECO 0.4671 0.3249 0.2264 0.6590 0.8007 0.6859 1.0000
IPEGO 0.4991 0.4131 0.2975 0.8231 0.7016 0.6304 0.7194 1.0000
• Since fuel oil is a low derivative of crude oil and one would expect crude
or petroleum prices to move closely together (positive correlation), then
it might be possible to use exchange traded petroleum and petroleum
product derivatives to hedge bunker price risk
• Let us see how strong is the correlation between bunker prices in
different bunker markets and oil futures.
Bunker Risk Management
©A. Alizadeh Shipping Risk Management Slide 16
• Due to the poor effectiveness of cross commodity hedging in the
bunker markets, use of OTC instruments such as forwards, swaps and
options has become increasingly popular.
• In recent years, especially following the wake of development of a
variety of OTC derivative products for fuel oil, such instruments have
become quite popular in bunker price risk management too.
• OTC products are tailor-made and designed to suit the individual
needs of agents involved in the bunker market.
• Nowadays many financial institutions and commodity trading houses
such as Barclays Capital, Morgan Stanley, Calyon etc., offer OTC
bunker derivative products such as forward contracts, swaps and
options.
Bunker Risk Management
9
©A. Alizadeh Shipping Risk Management Slide 17
Forward Bunker Contracts
• Recently, OTC instruments such as forwards, swaps and options have become increasingly popular in the bunker market.
• A forward bunker contract is defined as an agreement between a
seller and a buyer to exchange a specified quantity of fuel oil of
certain quality, at an agreed price, at certain delivery location
and time in the future.
• Forward contracts are usually paper contracts in the sense that
settlement is made on the difference between the contracted
price and the price for bunker at the delivery point, although
physical deliveries are also possible.
©A. Alizadeh Shipping Risk Management Slide 18
Forward Bunker Contracts
• Forward Bunker Contracts are effective tools for bunker price
risk management but they there is credit risk involved
• Many financial institutions and commodity trading houses such
as Barclays Capital, Morgan Stanley, Calyon etc., offer OTC
bunker derivative products such as forward contracts, swaps
and options.
• Imarex launched their Bunker Forward contracts in Dec 2005• Rotterdam 3.5% S Barges FOB
• NWE 1.0% S Cargo FOB
• Singapore HSFO 380 C/St FOB
• Singapore HSFO 180 C/St FOB
• Fujairah IFO380 c/St Bunker FOB

10
©A. Alizadeh Shipping Risk Management Slide 19
Example:• On 8 Jan 2009 a shipowner fixes a voyage charter contract for end of
February 2009.
• The shipowner expects to purchase 5000 tonnes of bunker fuel @ Houston
for this voyage. The current bunker price at Houston is 420$/tonne
• The owner expects the price to increase by February and if the price goes
above 420$/tonne, the shipowner will lose $5000 for every 1$ increase in
prices. If prices go to 450$/tonne, the profit from the voyage will be zero
• Through a broker, he finds that forward bunker prices for 5000 tonnes at
Houston for August is 425$/tonne
• Therefore, he decides to hedge the bunker for the voyage by entering into
(buying) a forward bunker contract for Feb at 425$/tonne
• In this way the owner locks into a bunker price of 425$/tonne.
Forward Bunker Contracts
©A. Alizadeh Shipping Risk Management Slide 20
1-month forward bunker hedge for the period 8 Jan to 28 Feb 2009
Physical Market Forward Market
8 July 2009 Spot bunker price: 420$/tonne Feb 09 Forward bunker price: 425 $/tonne
Total current bunker cost :
$2,100,000 (=5,000*420$/t)
Expected total bunker cost :
$2,125,000 (=5,000 * 425$/t)
Shipowner buys 5000 tonnes of forward bunker expiry 28 Feb 2009 for 425$/t
28 Feb 2009 Spot bunker price: 455$/tonne Feb 2009 forward bunker Settlement: 455 $/tonne
Total bunker cost :
$2,275,000(=5000*455$/t)
Settles the difference between forward bunker price and
Feb market price
$150,000=(455 - 425)*5,000
Loss in the Physical Market Profit from FBA transaction
2,125,000 –2,275,000 = - $150,000 (455- 425)*5,000 = $150,000
Net Result from Hedging = $0
Forward Bunker Contracts

11
©A. Alizadeh Shipping Risk Management Slide 21
Average and standard deviations (volatility) of spot and forward bunker prices in four major bunkering ports
around the world: April 1997 to May 2002
US Gulf
Houston
New York
Harbour
Asia
Singapore
ARA
Rotterdam
Spot
102.40
(29.22)
114.91
(32.93)
110.35
(35.26)
98.60
(27.99)
1 month Forward
102.27
(28.28)
114.73
(31.79)
115.20
(34.78)
100.83
(28.02)
2 month Forward
102.40
(27.25)
115.02
(30.62)
113.93
(32.88)
100.61
(26.68)
3 month Forward
NA
NA
115.35
(29.69)
113.02
(31.48)
100.79
(25.70) All f igures are in $/t
Figures in brackets are standard deviations
We can compare the mean and volatilities of spot and forward bunker prices in different bunkering ports to asses the risk involved in bunker prices
• It can be seen that on average prices are higher in New York, Singapore, compared to
US Gulf and Rotterdam
• Also volatilities decrease as contract maturity increases. This is in line with the
behaviour of forward prices for commodities
• Volatilities are higher in Singapore and New York compared to US Gulf and
Rotterdam
Forward Bunker Contracts
©A. Alizadeh Shipping Risk Management Slide 22
A forward curve (forward bunker curve) is the plot of available forward prices across time. For example plot of 1m, 2m and 3m prices as a percentage of spot prices.
It is also interesting to look at the behaviour (shape) of forward bunker curves and compare them across different bunkering ports
• Forward bunker curves reflects the market’s believe of future bunker prices
• It can be seen that forward bunker curves behave differently at different point
in time and across regions. For example, in September 1997, forward bunker
curve in Rotterdam has show increasing bunker prices over the next few
months
• Whereas, in September 1997, forward bunker prices in Asia signals a drop in
bunker prices over the next three months.
• The slope of the curve also contains information on the volatility of the market
Forward Bunker Contracts

12
©A. Alizadeh Shipping Risk Management Slide 23
Rotterdam Bunker Forward Curves at Different Points in Time
96
98
100
102
104
106
108
110
Rotterdam 1m FWD Rotterdam 2m FWD Rotterdam 3m FWD
% o
f Spo
t pric
e
Sep-97 Sep-98 Sep-99 Sep-00 Sep-01
Forward Bunker Curves
©A. Alizadeh Shipping Risk Management Slide 24
Asian Bunker Forward Curves at Different Points in Time
98
99
100
101
102
103
104
105
106
Asia 1m FWD Asia 2m FWD Asia 3m FWD
% o
f Spo
t pric
e
Sep-97 Sep-98 Sep-99 Sep-00 Sep-01
Forward Bunker Curves

13
©A. Alizadeh Shipping Risk Management Slide 25
Bunker Swaps
©A. Alizadeh Shipping Risk Management Slide 26
• Swaps are perhaps the most popular instruments for bunker price
risk management and many banks and commodity trading houses
now offer bunker swap contracts as a part of their derivative
products.
• Swaps are OTC arrangements, which involve no transfer of
physical commodity, and are settled in cash at the maturity date(s).
• Swap contracts are normally done through a third party known as
swap facilitator or broker. • The role of the swap facilitator is to help the two counterparties identify
each other and help them to settle swap contract transaction. Therefore,
swap facilitators, act as intermediaries.
Bunker Swap Contracts

14
©A. Alizadeh Shipping Risk Management Slide 27
Bunker Swaps: The Benefits
• Bunker swaps can protect the buyer (shipowner) from the
impact of adverse movements in bunker prices on the profits.
• From a bunker supplier point of view entering into a bunker
swap contract can stabilise the selling price of his bunker
stock and consequently his revenue.
• Swaps are a customised product that can be tailored to the
needs of the principal, be he the shipowner or bunker
supplier.
©A. Alizadeh Shipping Risk Management Slide 28
• Swap providers are normally market makers who take differentpositions at any point in time
• This means that they exposed to risk each time they enter a swaparrangement.
• However, for every position, they try to take an offsetting positionwith another counterparty.
• Their gain is the difference in prices of the two offsetting contracts(i.e. the premium) which cover the costs of taking risk and subsequenthedging
• The premium also reflects the credit risk of the customer
• Market makers provide liquidity
Bunker Swaps: Role of the Market Maker

15
©A. Alizadeh Shipping Risk Management Slide 29
• In this example AAA Shipping swaps a fixed for floating bunker payment
with XXX refinery through the swap facilitator.
• AAA swaps a flat price of 325 $/mt for a floating price
• XXX swaps a floating price for a flat price of 315 $/mt
Shipowner
AAA Shipping
Swap
Counter-party
XXX refinery
Flat Price 325$/mt
Floating Price
Swap
Facilitator
YYY Capital
Flat Price 315$/mt
Floating Price
• A net profit of 10$/mt for the facilitator
• Security of cost and revenue for shipowner and bunker seller
• The swap facilitator may add premium to flat or floating prices to
compensate for the credit risk involved for each contract
Bunker Swaps: The Mechanics
©A. Alizadeh Shipping Risk Management Slide 30
Bunker Swap Contracts; Pricing
In a Plain Vanilla swap contract: • when the spot bunker price is greater than the swap rate (e.g. 325$/t), then the
shipowner is compensated by the swap seller for the increased bunker price over the swap rate,
• whereas when the spot bunker prices is less than the swap rate (e.g. 325$/t), the shipowner has to compensate the seller with the difference between the market price and the swap rate.
100.00
200.00
300.00
400.00
500.00
Janu
ary
Feb
ruar
y
Mar
ch
Apr
il
May
June
July
Aug
ust
Sep
tem
ber
Oct
ober
Nov
embe
r
Dec
embe
r
Us
$/m
t
Floating Price $/mt Sw ap Price $/mt

16
©A. Alizadeh Shipping Risk Management Slide 31
Pricing a swap contract
Price of a swap contract can be determined using prices of forward
contract for the same amount of the underlying variable for the
same expiry time as the swap contract.
For example, the swap contract mentioned in the previous example
is equivalent to a 12-month forward contract staring from January
for every month thereafter. The price of each forward contract
therefore set to 325$/mt.
Pricing Bunker Swap Contracts
©A. Alizadeh Shipping Risk Management Slide 32
]),()[,(1
)(1
m
k
kk KstFstPm
tSP
• Plain Vanilla Bunker Swaps can be priced directly from forward
bunker curves since the appropriate portfolio of forward contracts
is a hedge for the swap contract
• This is because the price of each reset date is the same as the price
for a forward for that date
• Therefore, if F(t,sk) is the floating price, K is fixed price and
P(t,sk) is discount factor from period sk to today, we can write the
value of a swap as
Pricing Bunker Swap Contracts

17
©A. Alizadeh Shipping Risk Management Slide 33
As an example consider that in December 2006, forward bunker prices for
January, February and March 2007 are, $230, $250 and 262$/mt, (e.g.
1000 mt) respectively, while 1, 2 and 3 month interest rates are all 5%,
4.75% and 4.25% per annum, respectively.
Using the above formula, a fair value for the fixed price of the swap contract for the following 3 months has to be 247.30$/mt to set the value of the swap to zero in December 2006.
The reason is that if there is any differences between the prices, agents will arbitrage any riskless profits
30 Dec 2006 Jan 2007 Feb 2007 Mar 2007
Forward Price 230 250 262
Fixed Price ? ? ?
Interest rates 5% 4.75% 4.5%
Pricing Bunker Swap Contracts
©A. Alizadeh Shipping Risk Management Slide 34
However, the swap provider may ask for a higher fixed price to
initiate the swap contract. This is a protective measure against the risk
that he is exposed to by taking a position
This might be spot market risk as well as credit risk
Using Excel spreadsheet and solver or goal-seek function, it is not
difficult to do this simple calculation
Pricing Bunker Swap Contracts
22-Dec-06 Jan-07 Feb-07 Mar-07
Forward Price 230 250 262
Fixed Price 247.30 247.30 247.30
Interest rates 5% 4.75% 4.50%
swap duration 3
swap value 9.18E-14

18
©A. Alizadeh Shipping Risk Management Slide 35
A Differential Swap is a simple swap contract in which
counterparties exchange the difference between two floating
prices (the differential) for a fixed price differential.
For example, the difference between bunker prices in Singapore
and Rotterdam is exchanged for a fixed price (fixed price diff)
Pricing Bunker Swap Contracts
22-Dec-06 Jan-07 Feb-07 Mar-07
Singapore 230 250 262
Rotterdam 215 238 248
Fix Diff ? ? ?
Actual Diff 15 12 14
Interest rates 5% 4.75% 4.50%
©A. Alizadeh Shipping Risk Management Slide 36
The question is how to price this differential!
We use the same principle as we did for Plain Vanilla swap; that is,
we set the DPV of differences between forwards equal to the
average DPV of fixed differential as follows
where F1(t,sk) and F2(t,sk) are forward prices, K is the fixed
differential and P(t,sk) is discount factor as usual.
It is not difficult to calculate this in excel to get the fixed
differential
m
k
kkk KstFstFstPm
tSP1
21 )],(),([),(1
)(diff_
Pricing Bunker Swap Contracts

19
©A. Alizadeh Shipping Risk Management Slide 37
Therefore, the fixed differential is
Pricing Bunker Swap Contracts
12/312/212/1 )12/045.01(
)248262(
)12/0475.01(
)238250(
)12/05.01(
)215230(
3
1)(diff_
KKKtSP
22-Dec-06 Jan-07 Feb-07 Mar-07
Singapore 230 250 262
Rotterdam 215 238 248
Fix Diff ? ? ?
Actual Diff 15 12 14
Interest rates 5% 4.75% 4.50%
Swap Duration 3
Swap Value 0
©A. Alizadeh Shipping Risk Management Slide 38
So far we discussed the properties of simple swap contracts
But, swap contracts can also be more complex and difficult in structure
designed and offered by financial institutions and commodity trading
houses in order to fulfil the hedging performance and risk management
requirements of the shipowners.
Among these are; • Variable volume swap or swing,
• Participation swap,
• Double up swap,
• Extendable swap, etc.
Each contract has certain specifications, structure and payoff, which
makes it more relevant in to counterparties involved.
• More detail on payoffs and pricing of these types of swap contracts can
be found in Clewlow and Strickland [2000] and Hull [2000].
Different Types of Swap Contracts
20
©A. Alizadeh Shipping Risk Management Slide 39
Bunker Options
©A. Alizadeh Shipping Risk Management Slide 40
Option Contracts on Bunker Prices
Options give the holder the flexibility (right but not the obligation) of
buying or selling the asset at certain pre-specified price during or at certain
period.
The most popular option contracts in the commodity markets, especially
the bunker market are the Asian option contracts.
• An Asian option is similar to an European option in that it can be onlyexercised at the maturity, but it differs from an European option in that eitherexercise price or the spot price at the expiry is calculated as the average ofspot prices over certain period.
• This property of the Asian option is important as sharp fluctuations andexcess volatility in the commodity markets, especially oil markets, increaseboth premium and payoffs of other (Eu or Am) options.
• Therefore, by smoothing the strike prices in Asian options, they become
cheaper instruments for risk management in commodity markets.

21
©A. Alizadeh Shipping Risk Management Slide 41
Bunker Options
When the average spot price over certain period prior to maturity is used
as spot price, then the option is called average price option, whereas
when the average market price over some period prior to maturity is used
as strike price, the option is called average strike option.
It is not difficult to extend these results to Asian call and put options.
• The payoff of a an average price Asian call is
• The payoff of an average price Asian put is
)0,1
max(1
KSm
m
k
k
)0,1
max(1
m
k
kSm
K
©A. Alizadeh Shipping Risk Management Slide 42
Caps and Floors on Bunker Prices
• A caplet is defined as a hedging position, which is the result of a
long call option on an underlying asset.
– Usually the hedger has a short physical position on the same asset.
• A caplet gives its holder the opportunity to limit any possible
future losses due to the increase in the price of the asset.
• Purchase of the call option compensates the owner in the case of
a price rise and provides an upper bound on the price that the
owner has to pay for bunker at expiry.
• A cap is a portfolio of two or more caplets with the same
exercise price but different maturity dates.
22
©A. Alizadeh Shipping Risk Management Slide 43
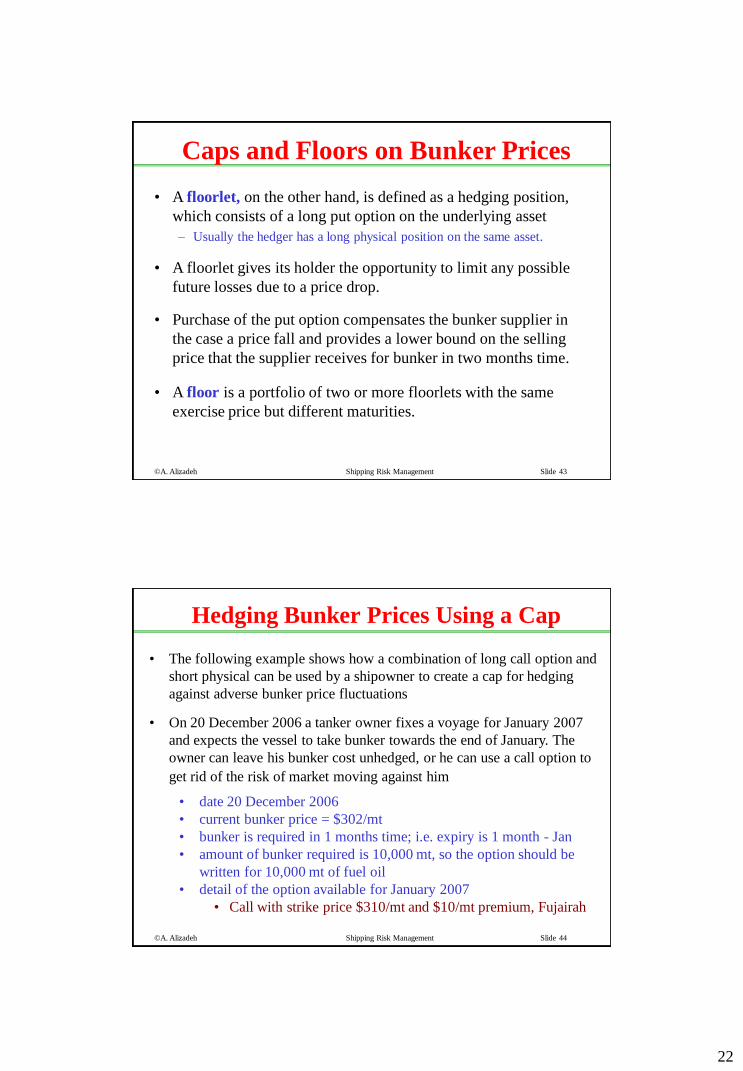
• A floorlet, on the other hand, is defined as a hedging position,
which consists of a long put option on the underlying asset
– Usually the hedger has a long physical position on the same asset.
• A floorlet gives its holder the opportunity to limit any possible
future losses due to a price drop.
• Purchase of the put option compensates the bunker supplier in
the case a price fall and provides a lower bound on the selling
price that the supplier receives for bunker in two months time.
• A floor is a portfolio of two or more floorlets with the same
exercise price but different maturities.
Caps and Floors on Bunker Prices
©A. Alizadeh Shipping Risk Management Slide 44
Hedging Bunker Prices Using a Cap
• The following example shows how a combination of long call option and
short physical can be used by a shipowner to create a cap for hedging
against adverse bunker price fluctuations
• On 20 December 2006 a tanker owner fixes a voyage for January 2007
and expects the vessel to take bunker towards the end of January. The
owner can leave his bunker cost unhedged, or he can use a call option to
get rid of the risk of market moving against him
• date 20 December 2006
• current bunker price = $302/mt
• bunker is required in 1 months time; i.e. expiry is 1 month - Jan
• amount of bunker required is 10,000 mt, so the option should be
written for 10,000 mt of fuel oil
• detail of the option available for January 2007
• Call with strike price $310/mt and $10/mt premium, Fujairah

23
©A. Alizadeh Shipping Risk Management Slide 45
Hedging Bunker Prices Using a Cap
Caplet hedge for January 2007
Physical Market Options Market
20 December 2006
Bunker price in Fujairah : $302/mt Option Details: January 2007 Call with a strike
Bunker cost: $3,020,000 (=10,000*302) Price of $310/mt, Premium= $10/mt
Shipowner buys January 2007 call at a total cost of $100,000 (=10*10,000)
31 January 2007 – First Scenario
Falling Bunker Market
Bunker price in Fujairah: $280/mt Strike Price ($310) > Settlement Price ($280)
Actual Bunker Cost : $2,800,000 Therefore Option is not exercised
Notional Gain in the Physical Market Payoff from the Option Transaction
3,020,000 – 2,800,000 = - $220,000 $ -100,000
Total Bunker Cost (including option premium) = 2,800,000 + 100,000 = $2,900,000
31 January 2007 – Alternative Scenario
Rising Bunker Market
Bunker price in Fujairah: $350/tonne Strike Price ($310) > Settlement Price ($350)
Actual Bunker Cost : $3,500,000 Therefore Option is exercised
Notional Loss in the Physical Market Payoff from the Options Transaction
3,020,000 – 3,500,000 = - $480,000 (350 – 310) *10,000 –100,000 = $300,000
Total Bunker Cost (including option premium) = $ 3,500,000 - 300,000 = 3,200,000
©A. Alizadeh Shipping Risk Management Slide 46
Profit and loss of the hedged position for the tanker owner10000 mt to buy in January 2007
Hedging Bunker Prices Using a Cap
-600
-400
-200
0
200
400
600
250 270 290 310 330 350 370
Prevailing Bunker Price at the Maturity ($/tonne)
Pro
ffit
& lo
ss fro
m the h
edged P
ort
folio
000$
Long call
Physical M arket Position
Overall Position

24
©A. Alizadeh Shipping Risk Management Slide 47
• The Cap ensures that shipowner pays maximum $113/mt for fuel whatever happens to bunker prices at maturity.
• This means that the risk of losing profits in case of rising bunker prices is protected, while the owner can benefit from falling bunker prices.
Hedging Bunker Prices Using a Cap
250
260
270
280
290
300
310
320
330
340
350
360
370
250 270 290 310 330 350 370
Prevailing Bunker Price at the Maturity ($/tonne)
Price P
aid
by the s
hip
ow
ner
($/tonne)
©A. Alizadeh Shipping Risk Management Slide 48
Hedging Bunker Prices Using a Floor
• The following example shows how a bunker supplier can use
combination of long put option and long physical to create a floor for
hedging against adverse bunker price fluctuations
• On 20 March 2007, a bunker supplier expects delivery and sale of
10,000 mt of fuel oil in June. However, he is not sure about the market
condition in June, therefore, he decides to buy put option to protect his
revenue (profit) in June 2007.
• date 20 March 2007
• current bunker price = $305/mt
• bunker will be sold in 3 months time; i.e. expiry is June 2007
• Total bunker is 10,000 mt,
• detail of the option available for June 2007
• Asian average price put option with strike price $300/mt and
$12/mt premium
25
©A. Alizadeh Shipping Risk Management Slide 49
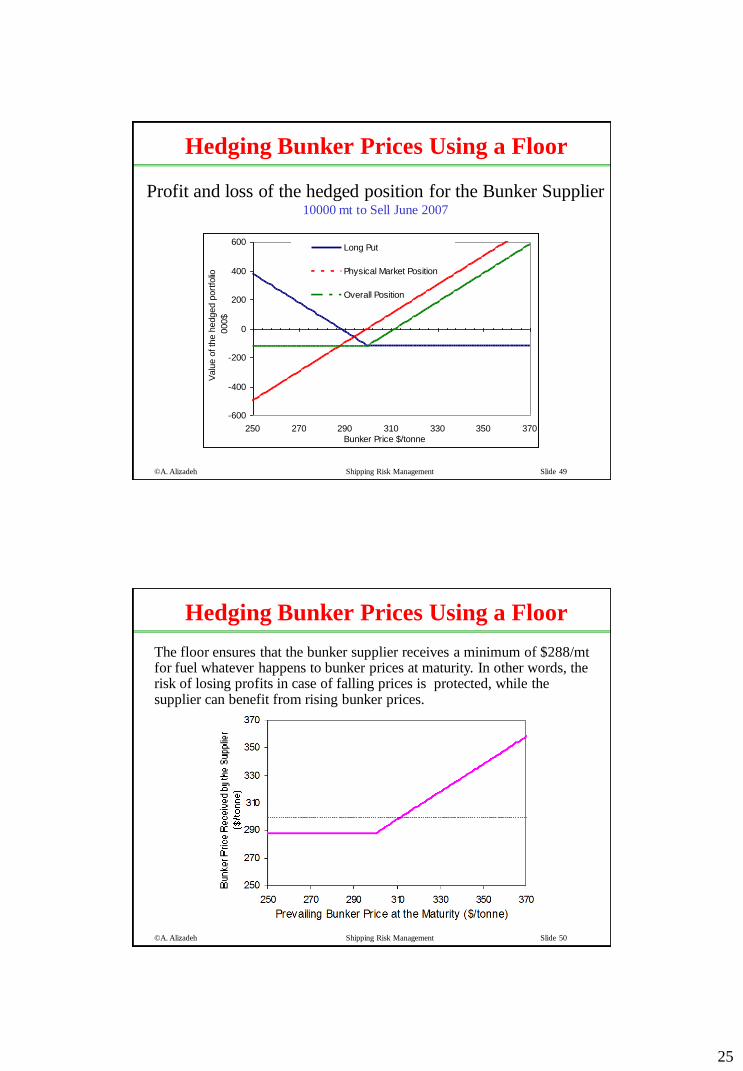
Hedging Bunker Prices Using a Floor
-600
-400
-200
0
200
400
600
250 270 290 310 330 350 370
Bunker Price $/tonne
Valu
e o
f th
e h
edged p
ort
folio
000$
Long Put
Physical Market Position
Overall Position
Profit and loss of the hedged position for the Bunker Supplier10000 mt to Sell June 2007
©A. Alizadeh Shipping Risk Management Slide 50
Hedging Bunker Prices Using a Floor
The floor ensures that the bunker supplier receives a minimum of $288/mt for fuel whatever happens to bunker prices at maturity. In other words, the risk of losing profits in case of falling prices is protected, while the supplier can benefit from rising bunker prices.

26
©A. Alizadeh Shipping Risk Management Slide 51
• Sometimes shipowners (or bunker suppliers) may decide to hedge if
the costs involved is low or even zero.
• It is possible to construct a hedged position through a portfolio of
options (put and call) to have minimum or zero cost
• This type of options are known as zero cost, collar or cylinder options
• The idea is to hedge the bunker fluctuations through selling the upside
risk position and buying downside risk protection
• Therefore, a zero cost collar for a shipowner who has a short physical
position can be constructed by selling a put and using the proceeds to
buy a call option for the same maturity. However, strike prices may
vary and define the protection limits.
Zero Cost Collar for Ship-operator
©A. Alizadeh Shipping Risk Management Slide 52
• As an example consider a shipowner who needs to purchase 10,000
mt of bunker in 3 months time (T=3month) and the current bunker
price is $300/mt.
• The market seems to be very unstable and there are news about
severe volatility in the oil (bunker) market.
• The following options are currently available to him
– Put option, 3m to maturity, strike $290/mt, 10,000 mt volume, $8/mt
– Call option, 3m to maturity, strike $310/mt, 10,000 mt volume, $8/mt
• In order to secure a reasonable bunkering cost and avoid any
uncertainty, as well as paying a large some for such protection, he
decides to use “zero cost collar”
• This is done as follows:
Zero Cost Collar for Ship-operator

27
©A. Alizadeh Shipping Risk Management Slide 53
Zero Cost Collar for Ship-operator
The over all position of the shipowner, a zero cost collarShort physical + short put + long call
-600
-400
-200
0
200
400
600
250 260 270 280 290 300 310 320 330 340 350 360
Prevailing Bunker Price at the Maturity ($/tonne)
Payoff o
f th
e z
ero
-cost C
olla
r
(000$)
Long call (X=310$/t, pr=8$/t, T=3M )
Short put (X=290$/t, pr=8$/t, T=3M )
Physical M arket
Shipowner's Overall Payoff
©A. Alizadeh Shipping Risk Management Slide 54
Zero Cost Collar for Ship-operator
Expected bunker cost for a shipowner using a zero cost collar
260
270
280
290
300
310
320
330
340
350
250 260 270 280 290 300 310 320 330 340 350 360
Prevailing Bunker Price at the Maturity ($/tonne)
Bunker
Price P
aid
by the S
hip
ow
ner
($/tonne)

28
©A. Alizadeh Shipping Risk Management Slide 55
Bunker Risk Management Summary
• The methods and instruments available to shipowners and
bunker supplier to hedge their costs and revenue are by no
means limited
• Here we learned how to asses the risk involved in ship
operation and bunkering activities
• We also learned how to use derivative instruments to hedge
bunker price fluctuations both from the point of view of
shipowner and bunker supplier
• We also learned how to price some of these derivatives
©A. Alizadeh Shipping Risk Management Slide 56
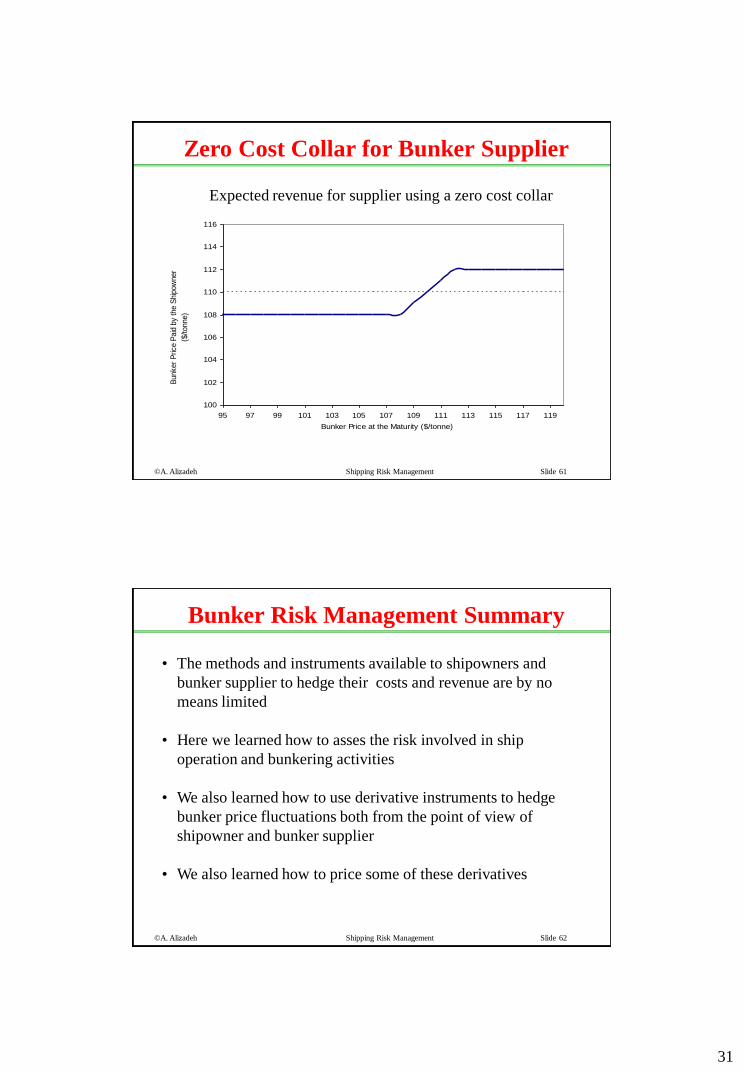
• A zero cost collar for a bunker supplier who has a long physical
position can be constructed by selling a call and using the proceeds
to buy a put option for the same maturity.
• This will give the opportunity to the bunker supplier to secure the
selling price (revenue) of his/her bunker within a range at no cost
• For example consider the supplier has a long physical bunker
position in 3 months and the following options are currently traded
in the market– Put option, 3m to maturity, strike $112/t, 10,000t volume, $2/t premium
– Call option, 3m to maturity, strike $110/t, 10,000t volume, $3/t premium
• A hedged portfolio at zero cost can be constructed by selling call
option and buying put simultaneously in the following form
Zero Cost Collar for Bunker Supplier

29
©A. Alizadeh Shipping Risk Management Slide 57
Zero Cost Collar for Bunker Supplier
The short position of the supplier in the physical market
Assuming an expected price of $110/t
-8
-6
-4
-2
0
2
4
6
8
10
12
102 104 106 108 110 112 114 116 118 120
Bunker Price at the Maturity ($/tonne)
Payoff o
f th
e z
ero
-cost C
olla
r
($/tonne)
Physical Market Position
©A. Alizadeh Shipping Risk Management Slide 58
Zero Cost Collar for Bunker Supplier
The short position of the supplier in the physical market plus a short call ($3/t)
-8
-6
-4
-2
0
2
4
6
8
10
12
102 104 106 108 110 112 114 116 118 120
Bunker Price at the Maturity ($/tonne)
Payoff o
f th
e z
ero
-cost C
olla
r
($/tonne)
Short call (X=110$/t, pr=3$/t, T=3M)
Physical Market Position

30
©A. Alizadeh Shipping Risk Management Slide 59
Zero Cost Collar for Bunker Supplier
The short position of the supplier in the physical market plus a short call ($3/t) and long put ($3/t)
-8
-6
-4
-2
0
2
4
6
8
10
12
102 104 106 108 110 112 114 116 118 120
Bunker Price at the Maturity ($/tonne)
Payoff o
f th
e z
ero
-cost C
olla
r
($/tonne)
Short call (X=110$/t, pr=3$/t, T=3M)
Long put (X=112$/t, pr=3$/t, T=3M)
Physical Market Position
©A. Alizadeh Shipping Risk Management Slide 60
Zero Cost Collar for Bunker Supplier
The short position of the supplier using a zero cost collarLong physical + short cal + long put
-8
-6
-4
-2
0
2
4
6
8
10
12
102 104 106 108 110 112 114 116 118 120
Bunker Price at the Maturity ($/tonne)
Pa
yoff
of t
he
ze
ro-c
ost
Co
llar
($/to
nn
e)
Short call (X=110$/t, pr=3$/t, T=3M)
Long put (X=112$/t, pr=3$/t, T=3M)
Physical Market Position
Supplier's overall position
31
©A. Alizadeh Shipping Risk Management Slide 61
Zero Cost Collar for Bunker Supplier
Expected revenue for supplier using a zero cost collar
100
102
104
106
108
110
112
114
116
95 97 99 101 103 105 107 109 111 113 115 117 119
Bunker Price at the Maturity ($/tonne)
Bunker
Price P
aid
by the S
hip
ow
ner
($/tonne)
©A. Alizadeh Shipping Risk Management Slide 62
Bunker Risk Management Summary
• The methods and instruments available to shipowners and
bunker supplier to hedge their costs and revenue are by no
means limited
• Here we learned how to asses the risk involved in ship
operation and bunkering activities
• We also learned how to use derivative instruments to hedge
bunker price fluctuations both from the point of view of
shipowner and bunker supplier
• We also learned how to price some of these derivatives

32
©A. Alizadeh Shipping Risk Management Slide 63
End of Slides


