Embed Size (px)
Citation preview

Tangible Interfaces for Volume Navigation
Sriram Subramanian
The work described in this thesis has been carried out under the auspices ofthe J. F. Schouten School for User-System Interaction Research.
c© 2004 Sriram Subramanian - Eindhoven - The Netherlands.
CIP-DATA LIBRARY TECHNISCHE UNIVERSITEIT EINDHOVEN
Subramanian, Sriram
Tangible Interfaces for Volume Navigation / by Sriram Subramanian. -Eindhoven: Technische Universiteit Eindhoven, 2004. -Proefschrift. -ISBNNURKeywords: Human-computer interaction / Augmented Reality / Mixed Reality/ 3D input devices/ Tangible User Interface/ User Evaluation/ Design Guidelines
Printing: Printing Services, University of Saskatchewan.
ii
Tangible Interfaces for Volume Navigation
PROEFSCHRIFT
ter verkrijging van de graad van doctor aan deTechnische Universiteit Eindhoven, op gezag van de
Rector Magnificus, prof.dr. R.A. van Santen, voor eencommissie aangewezen door het College voor
Promoties in het openbaar te verdedigenop dinsdag 6 april 2004 om 16.00 uur
door
Sriram Subramanian
geboren te Madras, India
iii
Dit proefschrift is goedgekeurd door de promotoren:
prof.dr. G.W.M. Rauterbergenprof.dr.ir. J.B.O.S. Martens
iv
Acknowledgements
I would like to thank all members of the Industrial Design department and the formerIPO for contributing directly or indirectly to the success of this research. In particular, Iwould like to express my gratitude to Matthias Rauterberg and Jean-Bernard Martens forsupporting and supervising this project. Matthias’s desire to question the unquestionableand Jean-Bernard’s desire to define the undefinable opened my eyes to a whole new worldof research in Human-Computer Interaction.
Special thanks are due to Dzmitry Aliakseyeu and Bernard Champoux for creating an am-icable atmosphere for research. Dima and I worked closely in developing the later versionsof the visual interaction platform. In doing so, we shared many interesting discussions fromVodka to smart environments. Bernard was elemental is incorporating design concepts intothis work. Bernard’s phenomenal drive to succeed has been instrumental in shaping thefinal parts of the dissertation.
Thanks to Wieger Wesselink and Marina Vroubel for their contributions to developing theearlier versions of the visual Interaction Platform.
Acknowledgements are due to Wijnand IJsselsteijn for helping me kick start this research,Willy Wong for opening my eyes to Canadian research opportunities and encouraging meto reach higher grounds and Stephan Wensveen and Kees Overbeeke for their interestingdiscussions on Tangible Computing Frameworks during the final stages of this project. Ilook forward to continued research collaborations with all of you.
Thanks is also due to Ken Hinckley for taking time at CHI 2002 to explain the differentpossible research directions my thesis can take.
Finally, special thanks to my family and friends for their constant support, encouragementand entertainment.
Sriram Subramanian
v

vi
Contents
1 Introduction 1
1.1 Overview of Emerging Subfields of HCI . . . . . . . . . . . . . . . . . . . . 1
1.1.1 Augmented Reality and Computer-Augmented Environments . . . . 3
1.1.2 Ubiquitous Computing . . . . . . . . . . . . . . . . . . . . . . . . . 3
1.1.3 Cooperative Buildings . . . . . . . . . . . . . . . . . . . . . . . . . 3
1.1.4 Tangible Computing . . . . . . . . . . . . . . . . . . . . . . . . . . 3
1.2 The MCRit Model for Tangible Computing . . . . . . . . . . . . . . . . . 4
1.3 Systems . . . . . . . . . . . . . . . . . . . . . . . . . . . . . . . . . . . . . 5
1.3.1 Digital Desk . . . . . . . . . . . . . . . . . . . . . . . . . . . . . . . 5
1.3.2 AlgoBlocks . . . . . . . . . . . . . . . . . . . . . . . . . . . . . . . 5
1.3.3 Passive Interface Prop . . . . . . . . . . . . . . . . . . . . . . . . . 5
1.3.4 Bricks . . . . . . . . . . . . . . . . . . . . . . . . . . . . . . . . . . 6
1.3.5 metaDESK . . . . . . . . . . . . . . . . . . . . . . . . . . . . . . . 7
1.3.6 BuildIT . . . . . . . . . . . . . . . . . . . . . . . . . . . . . . . . . 7
1.3.7 Urp . . . . . . . . . . . . . . . . . . . . . . . . . . . . . . . . . . . 7
1.3.8 Blocks . . . . . . . . . . . . . . . . . . . . . . . . . . . . . . . . . . 8
1.3.9 Active Cubes . . . . . . . . . . . . . . . . . . . . . . . . . . . . . . 8
1.3.10 DataTiles . . . . . . . . . . . . . . . . . . . . . . . . . . . . . . . . 8
1.3.11 Tangible Query Interface . . . . . . . . . . . . . . . . . . . . . . . . 8
1.4 Frameworks . . . . . . . . . . . . . . . . . . . . . . . . . . . . . . . . . . . 10
1.4.1 Ullmer’s Framework . . . . . . . . . . . . . . . . . . . . . . . . . . 10
1.4.2 Degrees of Freedom for Various Classifications . . . . . . . . . . . . 11
1.5 Toolkits . . . . . . . . . . . . . . . . . . . . . . . . . . . . . . . . . . . . . 11
1.5.1 Context Toolkit . . . . . . . . . . . . . . . . . . . . . . . . . . . . . 13
vii
1.5.2 Phidgets . . . . . . . . . . . . . . . . . . . . . . . . . . . . . . . . . 13
1.5.3 iStuff . . . . . . . . . . . . . . . . . . . . . . . . . . . . . . . . . . . 13
1.6 Design Guidelines . . . . . . . . . . . . . . . . . . . . . . . . . . . . . . . . 14
1.6.1 Effectiveness and Efficiency . . . . . . . . . . . . . . . . . . . . . . 14
1.6.2 Transparency . . . . . . . . . . . . . . . . . . . . . . . . . . . . . . 15
1.6.3 Social Intelligence . . . . . . . . . . . . . . . . . . . . . . . . . . . . 16
1.6.4 Coordination . . . . . . . . . . . . . . . . . . . . . . . . . . . . . . 16
1.6.5 Fun, Flow and Engagement . . . . . . . . . . . . . . . . . . . . . . 17
1.7 Focus and Contribution of the Thesis . . . . . . . . . . . . . . . . . . . . . 17
2 Tangible 3D Interaction System 19
2.1 Introduction . . . . . . . . . . . . . . . . . . . . . . . . . . . . . . . . . . . 19
2.2 Working with Volume Data sets . . . . . . . . . . . . . . . . . . . . . . . . 19
2.3 Tangible 3D Interaction Systems . . . . . . . . . . . . . . . . . . . . . . . . 20
2.3.1 Passive Interface Props . . . . . . . . . . . . . . . . . . . . . . . . . 20
2.3.2 Cubic Mouse . . . . . . . . . . . . . . . . . . . . . . . . . . . . . . 21
2.3.3 Personal Space Station . . . . . . . . . . . . . . . . . . . . . . . . . 22
2.3.4 Visual Interaction Platform . . . . . . . . . . . . . . . . . . . . . . 22
2.4 Compliance with the Challenges for Interaction . . . . . . . . . . . . . . . 23
2.4.1 Address . . . . . . . . . . . . . . . . . . . . . . . . . . . . . . . . . 26
2.4.2 Attention . . . . . . . . . . . . . . . . . . . . . . . . . . . . . . . . 27
2.4.3 Action . . . . . . . . . . . . . . . . . . . . . . . . . . . . . . . . . . 27
2.4.4 Alignment . . . . . . . . . . . . . . . . . . . . . . . . . . . . . . . . 28
2.4.5 Accident . . . . . . . . . . . . . . . . . . . . . . . . . . . . . . . . . 29
2.5 Conclusions . . . . . . . . . . . . . . . . . . . . . . . . . . . . . . . . . . . 29
3 Design and Evaluation of a Cutting Plane Prop 31
3.1 Introduction . . . . . . . . . . . . . . . . . . . . . . . . . . . . . . . . . . . 31
3.2 Factors Influencing Hand-Held Input Devices . . . . . . . . . . . . . . . . . 31
3.2.1 Influence of Form Factor on Performance . . . . . . . . . . . . . . . 31
3.2.2 Influence of Muscle Groups on Performance . . . . . . . . . . . . . 33
3.3 Grips for Hand-Held Props . . . . . . . . . . . . . . . . . . . . . . . . . . . 34
3.3.1 Precision Grip . . . . . . . . . . . . . . . . . . . . . . . . . . . . . . 34
viii
3.3.2 Power Grip . . . . . . . . . . . . . . . . . . . . . . . . . . . . . . . 34
3.4 Relevant Research Questions . . . . . . . . . . . . . . . . . . . . . . . . . . 35
3.5 The Experimental Task . . . . . . . . . . . . . . . . . . . . . . . . . . . . . 36
3.5.1 RISP Design . . . . . . . . . . . . . . . . . . . . . . . . . . . . . . . 36
3.6 Experimental Design . . . . . . . . . . . . . . . . . . . . . . . . . . . . . . 38
3.7 Results . . . . . . . . . . . . . . . . . . . . . . . . . . . . . . . . . . . . . . 40
3.8 Discussion and Conclusions . . . . . . . . . . . . . . . . . . . . . . . . . . 44
4 Constrained vs. Unconstrained Interfaces 45
4.1 Introduction . . . . . . . . . . . . . . . . . . . . . . . . . . . . . . . . . . . 45
4.2 Handling Multiple Degrees of Freedom . . . . . . . . . . . . . . . . . . . . 45
4.3 Relevant Research Questions . . . . . . . . . . . . . . . . . . . . . . . . . . 47
4.4 Experimental Platform . . . . . . . . . . . . . . . . . . . . . . . . . . . . . 47
4.4.1 Constraint . . . . . . . . . . . . . . . . . . . . . . . . . . . . . . . . 48
4.4.2 RISP . . . . . . . . . . . . . . . . . . . . . . . . . . . . . . . . . . . 48
4.4.3 Digital Pen and Tablet . . . . . . . . . . . . . . . . . . . . . . . . . 48
4.5 Experimental Task . . . . . . . . . . . . . . . . . . . . . . . . . . . . . . . 48
4.6 Interaction Techniques . . . . . . . . . . . . . . . . . . . . . . . . . . . . . 48
4.6.1 Free Movement . . . . . . . . . . . . . . . . . . . . . . . . . . . . . 50
4.6.2 Free Movement followed by Rotation . . . . . . . . . . . . . . . . . 50
4.6.3 Positioning followed by Rotation . . . . . . . . . . . . . . . . . . . 51
4.6.4 Menu-based Navigation . . . . . . . . . . . . . . . . . . . . . . . . . 51
4.7 Experimental Design . . . . . . . . . . . . . . . . . . . . . . . . . . . . . . 52
4.8 Results . . . . . . . . . . . . . . . . . . . . . . . . . . . . . . . . . . . . . 53
4.9 Discussion and Conclusions . . . . . . . . . . . . . . . . . . . . . . . . . . 54
4.9.1 Perceptual Structures . . . . . . . . . . . . . . . . . . . . . . . . . . 57
5 Redesign of the VIP 59
5.1 Introduction . . . . . . . . . . . . . . . . . . . . . . . . . . . . . . . . . . . 59
5.2 Tangible Volume Navigation System . . . . . . . . . . . . . . . . . . . . . 60
5.2.1 Design Description . . . . . . . . . . . . . . . . . . . . . . . . . . . 61
5.2.2 Compliance with the Challenges for Interaction . . . . . . . . . . . 64
5.2.3 Performing user studies on real-world applications . . . . . . . . . . 65
ix
5.3 Future of Tangible Computing . . . . . . . . . . . . . . . . . . . . . . . . . 65
5.3.1 Understanding TUIs . . . . . . . . . . . . . . . . . . . . . . . . . . 66
5.3.2 TUIs to support other forms of Interaction . . . . . . . . . . . . . . 66
5.4 Beyond Effectiveness and Efficiency . . . . . . . . . . . . . . . . . . . . . . 67
6 Coordination 69
6.1 Introduction . . . . . . . . . . . . . . . . . . . . . . . . . . . . . . . . . . . 69
6.1.1 Examples of Coordination . . . . . . . . . . . . . . . . . . . . . . . 70
6.2 Existing Measures . . . . . . . . . . . . . . . . . . . . . . . . . . . . . . . . 71
6.2.1 Dimensions of Performance . . . . . . . . . . . . . . . . . . . . . . 71
6.2.2 Neuromotor Channel Capacity Measure . . . . . . . . . . . . . . . . 72
6.2.3 Inefficiency Measure . . . . . . . . . . . . . . . . . . . . . . . . . . 73
6.2.4 The m−metric . . . . . . . . . . . . . . . . . . . . . . . . . . . . . 74
6.3 Guidelines for a Coordination Measure . . . . . . . . . . . . . . . . . . . . 75
6.4 Proposed Coordination Measure for 2D Positioning . . . . . . . . . . . . . 77
6.4.1 Averaging Schemes . . . . . . . . . . . . . . . . . . . . . . . . . . . 79
6.5 Subjective Evaluation . . . . . . . . . . . . . . . . . . . . . . . . . . . . . . 79
6.5.1 The Task . . . . . . . . . . . . . . . . . . . . . . . . . . . . . . . . 81
6.5.2 Results of Subjective Rankings . . . . . . . . . . . . . . . . . . . . 81
6.6 Comparing Objective Measures with Subjective Rankings . . . . . . . . . . 81
6.7 Discussion and Conclusions . . . . . . . . . . . . . . . . . . . . . . . . . . 88
6.8 Future Directions . . . . . . . . . . . . . . . . . . . . . . . . . . . . . . . . 89
6.8.1 Applying Coordination to TUI . . . . . . . . . . . . . . . . . . . . . 90
A The Visual Interaction Platform 91
A.1 Hardware Setup . . . . . . . . . . . . . . . . . . . . . . . . . . . . . . . . . 91
A.2 Software . . . . . . . . . . . . . . . . . . . . . . . . . . . . . . . . . . . . . 92
A.3 Physical Props used in the VIP-3D . . . . . . . . . . . . . . . . . . . . . . 92
A.3.1 Brick ELements . . . . . . . . . . . . . . . . . . . . . . . . . . . . . 92
A.3.2 Tablet and Digital Pen . . . . . . . . . . . . . . . . . . . . . . . . . 94
A.3.3 Rigid Intersection Selection Prop . . . . . . . . . . . . . . . . . . . 94
A.4 Interacting through the VIP-3D . . . . . . . . . . . . . . . . . . . . . . . . 95
A.4.1 Demo Version . . . . . . . . . . . . . . . . . . . . . . . . . . . . . . 95
x
A.4.2 Experiment Version . . . . . . . . . . . . . . . . . . . . . . . . . . . 96
A.5 The Early Design Cycle . . . . . . . . . . . . . . . . . . . . . . . . . . . . 101
A.5.1 LCD RISP . . . . . . . . . . . . . . . . . . . . . . . . . . . . . . . . 101
A.5.2 Open Frame RISP . . . . . . . . . . . . . . . . . . . . . . . . . . . 101
A.5.3 Current Version . . . . . . . . . . . . . . . . . . . . . . . . . . . . . 102
B Calibration Procedure 104
C Extending Coordination 105
Bibliography 107
Summary 115
Samenvatting (Summary in Dutch) 119
Essential Biography 123
xi
Terminology
Input Input to computers consists of sensed information about the physical environ-ment (Hinckley, Jacob, & Ware, 2003).
Interaction Techniques An interaction technique is the fusion of input and output,consisting of all hardware and software elements, that provides a way for the user toaccomplish a task (Hinckley et al., 2003).
Input device(prop) or Token A physical device or prop that is used by the user to giveinput to the computer system.
3D Input device An input device that can be operated in 3D space to provide input tothe computer.
3D Interaction technique An interaction technique that provides a way for the user toaccomplish a task in 3D space. A 3D interaction technique may or may not employa 3D input device.
Tangible Computing A computing system that utilizes a tangible user interface.
Tangible User Interface A user interface that includes a physical representation andcontrol for a digital information (Dourish, 2001).
DOF Degrees of Freedom.
Continuous DOF Degrees of Freedom that can take continuous values.
Discrete DOF Degrees of Freedom that can only take discrete values.
xii
Chapter 1
Introduction
Computers are becoming ubiquitous in our everyday lives (Weiser, 1991). The computerof today is a primary artifact, explicitly perceived and used as a computer (for example,the desktop PC). However, in the future, computers will proliferate into our everyday livesand mostly be secondary artifacts embedded in primary artifacts that have their own es-tablished appearance, purpose and use in everyday experiences. The rise of embeddedcomputing as a research discipline reflects the expectation that computation can be use-fully harnessed for more than just the traditional desktop (Dourish, 2001). AugmentedReality, a broad research area within Human-Computer Interaction (HCI) and ComputerGraphics, has strived for the fusion of physical world artifacts with computationally me-diated augmentation since the 1960s when the first see-through head-mounted display wasinvented.
1.1 Overview of Emerging Subfields of HCI
The last decade has witnessed a renewed interest in making computations ubiquitous.The related research efforts have resulted in the emergence of new subfields within HCIthat address aspects of how people interact with such computers or more appropriatelycomputationally enhanced artifacts.
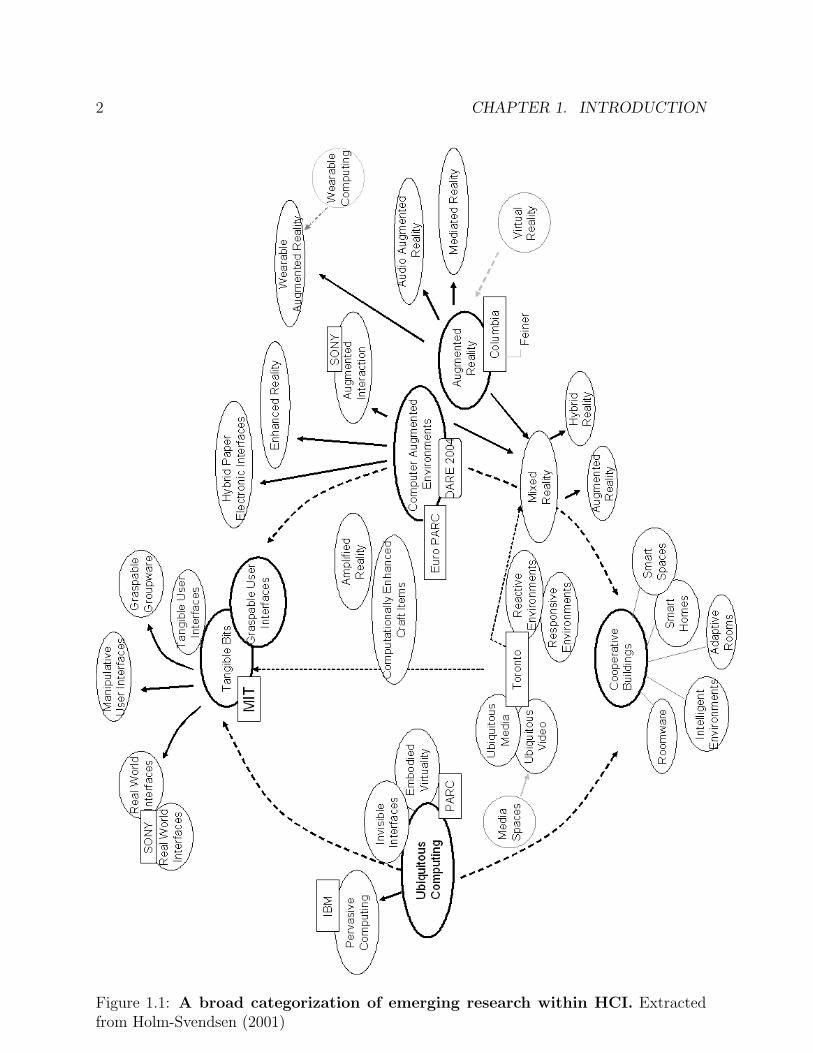
These subfields can be classified into four broad categories (Holm-Svendsen, 2001; Streitz& Russell, 1998): Computer-Augmented Environments (and Augmented Reality), Ubiq-uitous Computing, Cooperative Buildings and Tangible Computing. Figure 1.1 providesan overview of a number of systems, people, organizations and early trends within thesebroad areas (Holm-Svendsen, 2001). This dissertation has been mostly developed withinthe context of Tangible Computing. The following subsections briefly characterize thevarious subfields.
1
2 CHAPTER 1. INTRODUCTION
Figure 1.1: A broad categorization of emerging research within HCI. Extractedfrom Holm-Svendsen (2001)
1.1. OVERVIEW OF EMERGING SUBFIELDS OF HCI 3
1.1.1 Augmented Reality and Computer-Augmented Environ-ments
The main idea of Augmented Reality is the fusion of physical world artifacts with computationally-mediated augmentation. It is generally believed that AR is the younger (or newer) siblingof Virtual Reality (Feiner et al., 1999). Most of the augmented reality systems seekto augment physical-world spaces through projections-either with over-head projectors orsee-through head-mounted displays. An example of seminal impact is Wellner’s DigitalDesk (Wellner, 1991) which supported augmented interaction with paper documents on aphysical desktop, identifying and augmenting these with overhead cameras and projectors.
1.1.2 Ubiquitous Computing
Mark Weiser (Weiser, 1991) introduced the area of ubiquitous computing through hisvision of computational resources moving beyond the desktop of people and into theirenvironment to provide information and services when and where desired. In recent years“pervasive computing” has also been used to describe a similar concept. In some senseWeiser’s vision is coming to pass with the recent proliferation of PDAs, digital tablets,mobile phones, laptops etc. Still, one of the main challenges of ubiquitous computingis developing augmented environments that are “context” sensitive (Abowd & Mynatt,2000). Integrating context into the computational system leads to research that can becategorized as cooperative buildings.
1.1.3 Cooperative Buildings
Cooperative buildings lead to the integration of computational interfaces with walls, doors,furniture etc. Such systems (or computationally enhanced buildings) can generally bedescribed as being context-sensitive. These systems have also come to be referred toas Ambient Intelligent systems (Aarts & Marzano, 2003), everyday computing (Abowd,Mynatt, & Rodden, 2002) or smart environments. Such systems can also be listed underUbiquitous Computing or Augmented Reality systems. The aware home project at GeorgiaTech Institute (Abowd et al., 2000) is an example of a cooperative building that creates ahome environment that is aware of its occupants’ whereabouts and activities, and attemptsto enhance the residents’ quality of life.
1.1.4 Tangible Computing
Tangible computing generally refers to computing systems that use physical artifacts asrepresentations and controls for digital information (Dourish, 2001). While the areas ofubiquitous computing, augmented reality and cooperative buildings share a concern forinteractions that are physically contextualized, tangible computing is centrally concerned
4 CHAPTER 1. INTRODUCTION
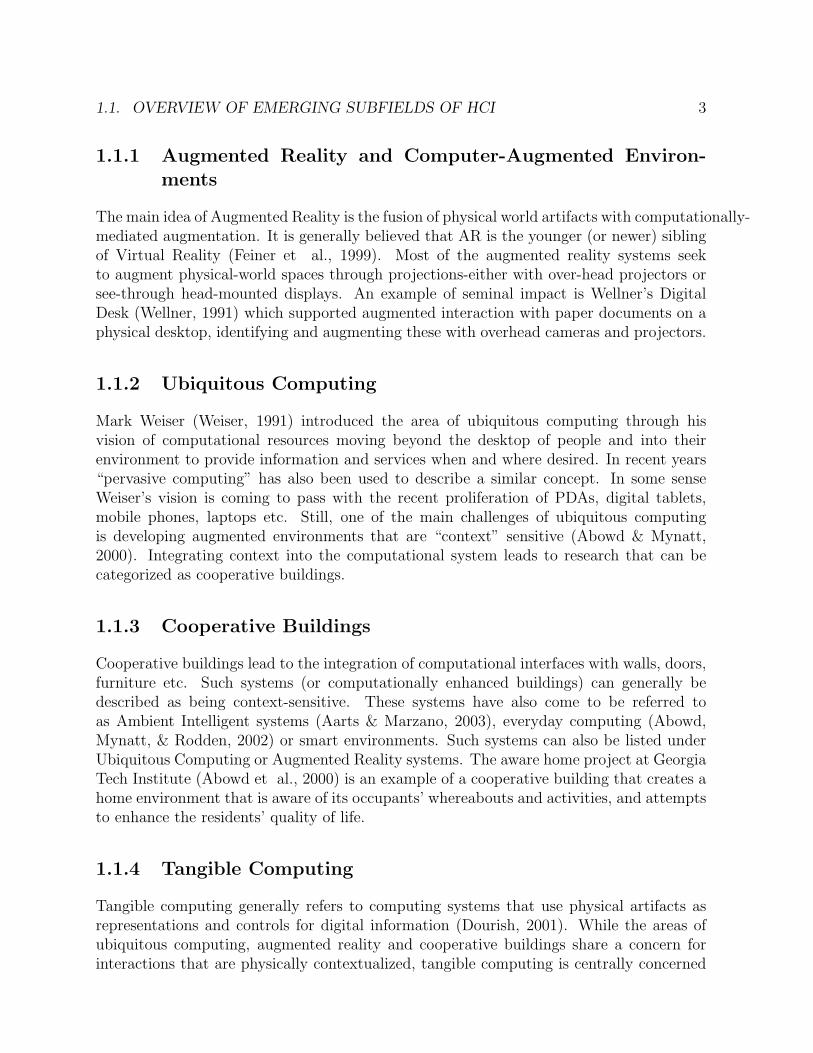
Figure 1.2: The Interaction model of a Tangible User Interface. Extracted fromUllmer (2002).
with interactions that are physically embodied (Ullmer, 2002). Many of the tangible com-puting systems integrate the benefits of physical interfaces with computationally mediatedaugmentation. These systems offer the benefits of stronger integration of visual and phys-ical representations of digital information.
1.2 The MCRit Model for Tangible Computing
The first point that needs clarification is the difference between a tangible interface anda physical interface. Ullmer and Ishii (2000) presented the MCRit (Model-Controller-Representations intangible and tangible) model for tangible interfaces in order to clarifythis point. According to this model (see Figure 1.2), the essential feature of tangibleuser interfaces (TUIs) is the integration of physical representation and control of digitalinformation. This is also referred to as embodied physical interaction (Dourish, 2001).This is in contrast to the Graphical User Interface models, where there is physical controlbut no physical representation of digital information. For example, when using a mouse tocontrol a desktop window, the mouse (a physical device) provides control of the desktopwindow, but the physical dimensions (location, orientation, size etc) of the mouse does notprovide any information about the position and orientation of the desktop window, henceno physical representation of the digital information is provided.
The model also highlights that tangible interfaces rely upon a balance between tangibleand intangible representations. While embodied physical elements play a central, definingrole in the representation and control of TUIs, intangible representations like graphics andaudio are also used to present some of the digital information being processed.
Research in tangible computing can be broadly classified into four categories - systems (or
1.3. SYSTEMS 5
prototypes), design guidelines, frameworks, and toolkits. A popular approach to researchin HCI is to follow a four-step cycle consisting of design, implement, evaluate and re-designsteps. In this case, frameworks and guidelines can assist in the design of a system thatcan be implemented with the aid of toolkits and also helps to position a new system withrespect to existing systems. Such systems can then be evaluated to generate better designguidelines leading to a refined framework and an improved design.
1.3 Systems
Systems are point designs (or examples), illustrating the feasibility in prototyping tangiblesystems. They help to explore the space of tangible systems. Most research in tangiblecomputing has a system as its central piece. This accounts for a large number of tangiblesystems. Recently a systematic review of the existing systems has been presented (Ullmer,2002). Here, I merely present a representative sample (in chronological order) of some ofthe most influential and most often-cited systems.
1.3.1 Digital Desk
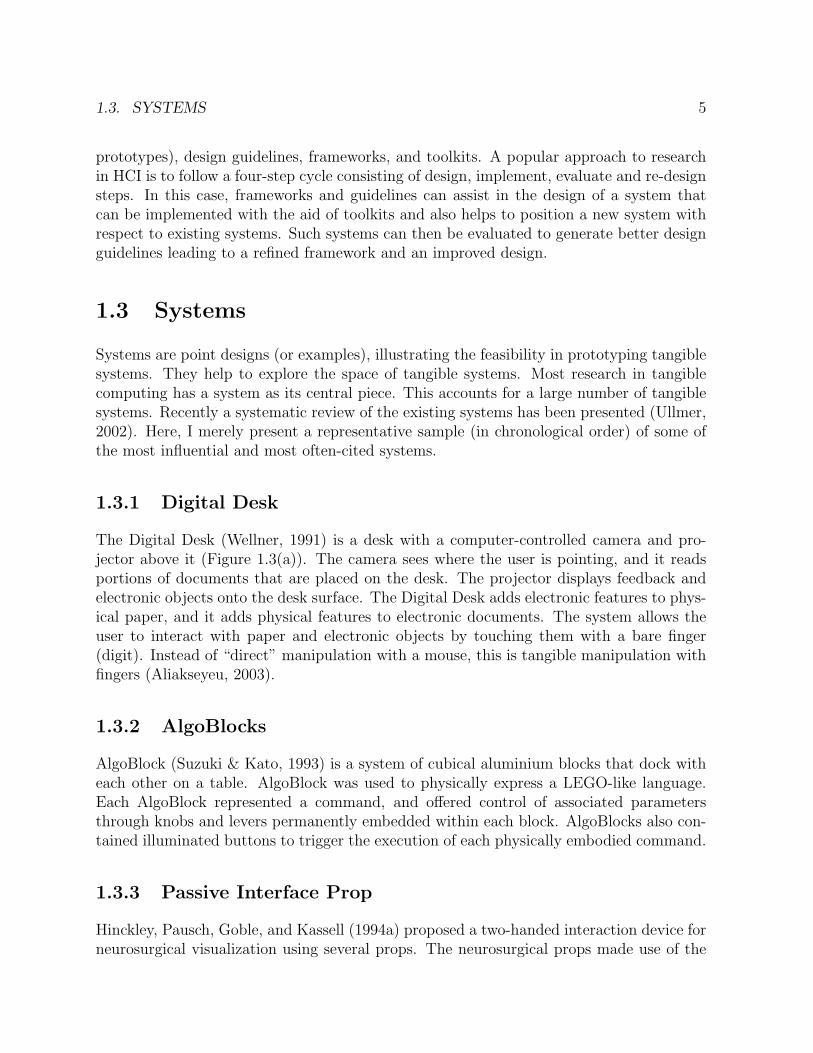
The Digital Desk (Wellner, 1991) is a desk with a computer-controlled camera and pro-jector above it (Figure 1.3(a)). The camera sees where the user is pointing, and it readsportions of documents that are placed on the desk. The projector displays feedback andelectronic objects onto the desk surface. The Digital Desk adds electronic features to phys-ical paper, and it adds physical features to electronic documents. The system allows theuser to interact with paper and electronic objects by touching them with a bare finger(digit). Instead of “direct” manipulation with a mouse, this is tangible manipulation withfingers (Aliakseyeu, 2003).
1.3.2 AlgoBlocks
AlgoBlock (Suzuki & Kato, 1993) is a system of cubical aluminium blocks that dock witheach other on a table. AlgoBlock was used to physically express a LEGO-like language.Each AlgoBlock represented a command, and offered control of associated parametersthrough knobs and levers permanently embedded within each block. AlgoBlocks also con-tained illuminated buttons to trigger the execution of each physically embodied command.
1.3.3 Passive Interface Prop
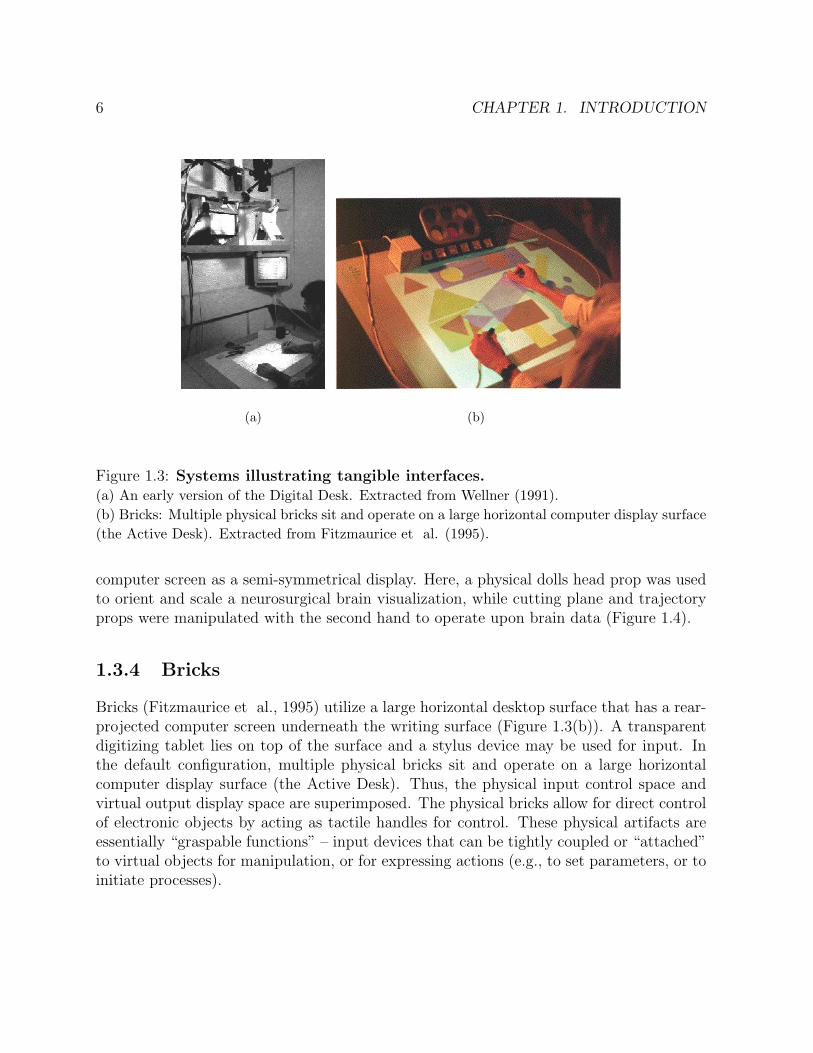
Hinckley, Pausch, Goble, and Kassell (1994a) proposed a two-handed interaction device forneurosurgical visualization using several props. The neurosurgical props made use of the
6 CHAPTER 1. INTRODUCTION
(a) (b)
Figure 1.3: Systems illustrating tangible interfaces.(a) An early version of the Digital Desk. Extracted from Wellner (1991).(b) Bricks: Multiple physical bricks sit and operate on a large horizontal computer display surface(the Active Desk). Extracted from Fitzmaurice et al. (1995).
computer screen as a semi-symmetrical display. Here, a physical dolls head prop was usedto orient and scale a neurosurgical brain visualization, while cutting plane and trajectoryprops were manipulated with the second hand to operate upon brain data (Figure 1.4).
1.3.4 Bricks
Bricks (Fitzmaurice et al., 1995) utilize a large horizontal desktop surface that has a rear-projected computer screen underneath the writing surface (Figure 1.3(b)). A transparentdigitizing tablet lies on top of the surface and a stylus device may be used for input. Inthe default configuration, multiple physical bricks sit and operate on a large horizontalcomputer display surface (the Active Desk). Thus, the physical input control space andvirtual output display space are superimposed. The physical bricks allow for direct controlof electronic objects by acting as tactile handles for control. These physical artifacts areessentially “graspable functions” – input devices that can be tightly coupled or “attached”to virtual objects for manipulation, or for expressing actions (e.g., to set parameters, or toinitiate processes).
1.3. SYSTEMS 7
(a) (b)
Figure 1.4: Passive Interface Props. Extracted from Hinckley et al. (1994a).(a) The head prop and the cutting plane prop.(b) The trajectory selection prop.
1.3.5 metaDESK
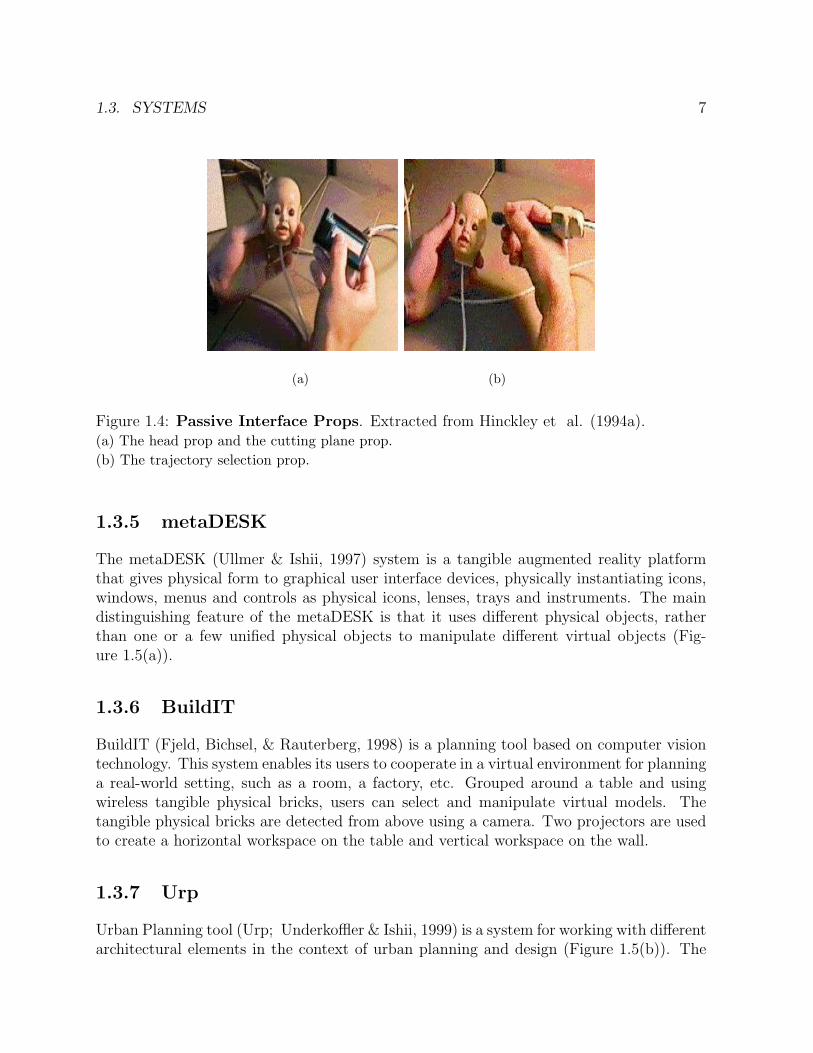
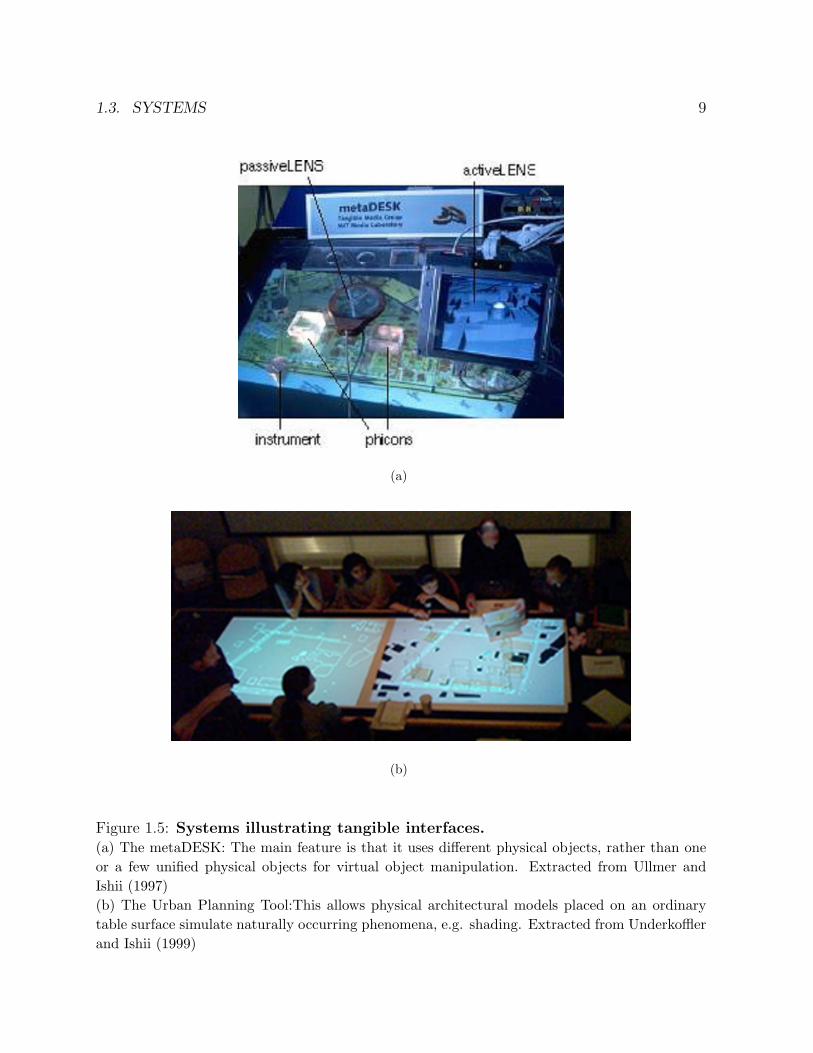
The metaDESK (Ullmer & Ishii, 1997) system is a tangible augmented reality platformthat gives physical form to graphical user interface devices, physically instantiating icons,windows, menus and controls as physical icons, lenses, trays and instruments. The maindistinguishing feature of the metaDESK is that it uses different physical objects, ratherthan one or a few unified physical objects to manipulate different virtual objects (Fig-ure 1.5(a)).
1.3.6 BuildIT
BuildIT (Fjeld, Bichsel, & Rauterberg, 1998) is a planning tool based on computer visiontechnology. This system enables its users to cooperate in a virtual environment for planninga real-world setting, such as a room, a factory, etc. Grouped around a table and usingwireless tangible physical bricks, users can select and manipulate virtual models. Thetangible physical bricks are detected from above using a camera. Two projectors are usedto create a horizontal workspace on the table and vertical workspace on the wall.
1.3.7 Urp
Urban Planning tool (Urp; Underkoffler & Ishii, 1999) is a system for working with differentarchitectural elements in the context of urban planning and design (Figure 1.5(b)). The
8 CHAPTER 1. INTRODUCTION
I/O Bulb on which the application is based, allows physical architectural models placed onan ordinary table surface to simulate numerous real-life urban planning conditions: castshadows accurate for any given time of the day, throw reflections off glass facade surfaces,affect a real-time and visually coincident simulation of pedestrian-level wind flow amongothers.
1.3.8 Blocks
This system (Anderson et al., 2000) uses a series of blocks to physically describe differentgeometric structures. These constructions were heuristically interpreted by the associatedsoftware to create graphical interpretations that could then be explored in various ways.
1.3.9 Active Cubes
The Active Cubes (Kitamura, Itoh, Masaki, & Kishino., 2000) offer an abstract supportfor programming. Each cube is uniquely identified and can be bound to digital behaviors,with the cubes’ aggregate 3D configuration sensed in realtime. Active Cubes are embeddedwith a variety of sensors and actuators, allowing for the construction of modular, responsivestructures.
1.3.10 DataTiles
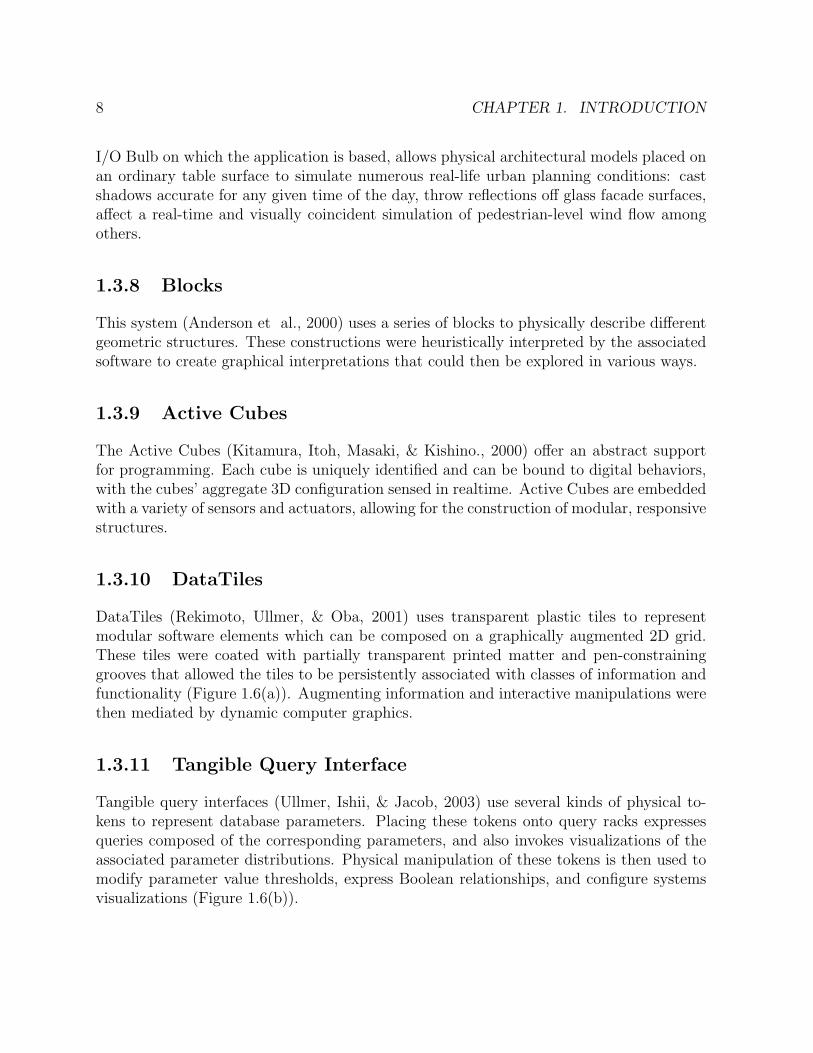
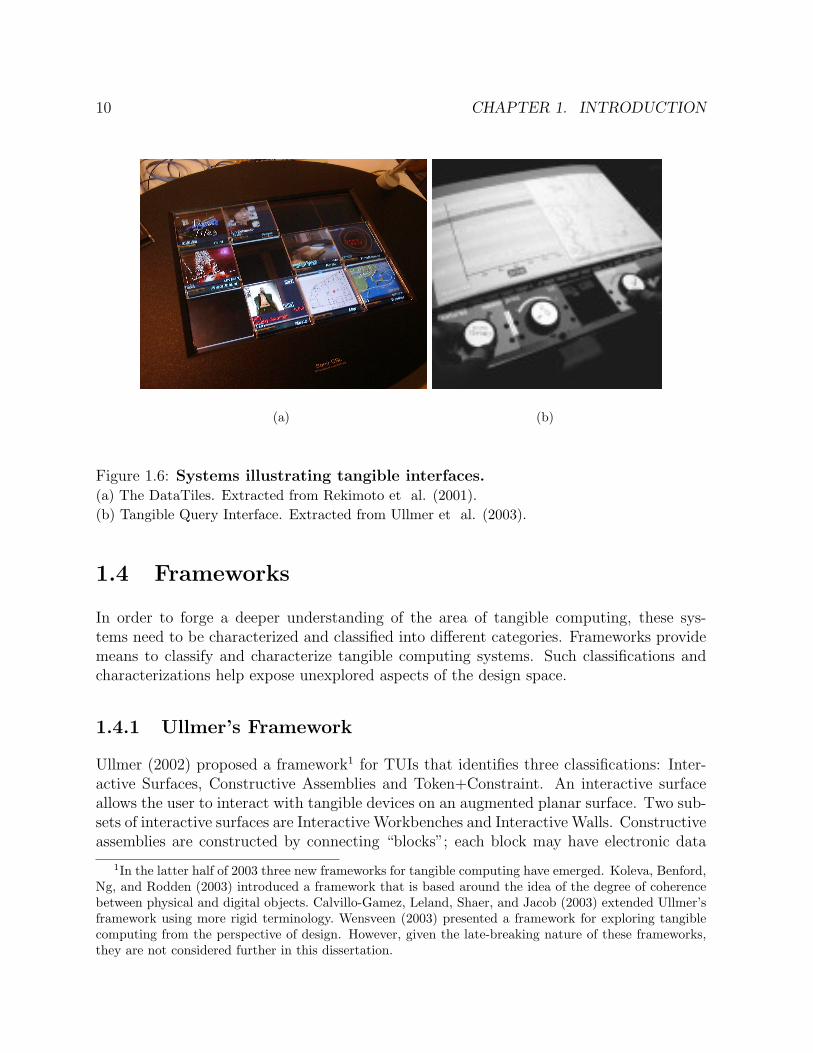
DataTiles (Rekimoto, Ullmer, & Oba, 2001) uses transparent plastic tiles to representmodular software elements which can be composed on a graphically augmented 2D grid.These tiles were coated with partially transparent printed matter and pen-constraininggrooves that allowed the tiles to be persistently associated with classes of information andfunctionality (Figure 1.6(a)). Augmenting information and interactive manipulations werethen mediated by dynamic computer graphics.
1.3.11 Tangible Query Interface
Tangible query interfaces (Ullmer, Ishii, & Jacob, 2003) use several kinds of physical to-kens to represent database parameters. Placing these tokens onto query racks expressesqueries composed of the corresponding parameters, and also invokes visualizations of theassociated parameter distributions. Physical manipulation of these tokens is then used tomodify parameter value thresholds, express Boolean relationships, and configure systemsvisualizations (Figure 1.6(b)).
1.3. SYSTEMS 9
(a)
(b)
Figure 1.5: Systems illustrating tangible interfaces.(a) The metaDESK: The main feature is that it uses different physical objects, rather than oneor a few unified physical objects for virtual object manipulation. Extracted from Ullmer andIshii (1997)(b) The Urban Planning Tool:This allows physical architectural models placed on an ordinarytable surface simulate naturally occurring phenomena, e.g. shading. Extracted from Underkofflerand Ishii (1999)
10 CHAPTER 1. INTRODUCTION
(a) (b)
Figure 1.6: Systems illustrating tangible interfaces.(a) The DataTiles. Extracted from Rekimoto et al. (2001).(b) Tangible Query Interface. Extracted from Ullmer et al. (2003).
1.4 Frameworks
In order to forge a deeper understanding of the area of tangible computing, these sys-tems need to be characterized and classified into different categories. Frameworks providemeans to classify and characterize tangible computing systems. Such classifications andcharacterizations help expose unexplored aspects of the design space.
1.4.1 Ullmer’s Framework
Ullmer (2002) proposed a framework1 for TUIs that identifies three classifications: Inter-active Surfaces, Constructive Assemblies and Token+Constraint. An interactive surfaceallows the user to interact with tangible devices on an augmented planar surface. Two sub-sets of interactive surfaces are Interactive Workbenches and Interactive Walls. Constructiveassemblies are constructed by connecting “blocks”; each block may have electronic data
1In the latter half of 2003 three new frameworks for tangible computing have emerged. Koleva, Benford,Ng, and Rodden (2003) introduced a framework that is based around the idea of the degree of coherencebetween physical and digital objects. Calvillo-Gamez, Leland, Shaer, and Jacob (2003) extended Ullmer’sframework using more rigid terminology. Wensveen (2003) presented a framework for exploring tangiblecomputing from the perspective of design. However, given the late-breaking nature of these frameworks,they are not considered further in this dissertation.
1.5. TOOLKITS 11
associated with it. In the Token+Constraint classification each physical object (or token)is constrained by other object(s) (or constraints). The Token+Constraint approach centerson the relationship between two kinds of physical elements: tokens and constraints. A to-ken is a physical object that allows the user to perform tangible interaction. A constraint isa physical object that physically restrains the movement of the token. The token can onlybe manipulated within the physical bounds of the constraint. A token cannot function asa tangible interface without a constraint being associated with it.
1.4.2 Degrees of Freedom for Various Classifications
Tangible objects on an interactive surface typically have two translational DOF, and eitherone or zero rotational DOF. Each object can also be regarded as having a single discreteDOF defined by their presence on or absence from the surface 2.
Constructive assemblies tend to involve purely discrete combinations of numerous modularelements. The continuous manipulation of physical elements are generally not allowed insuch systems.
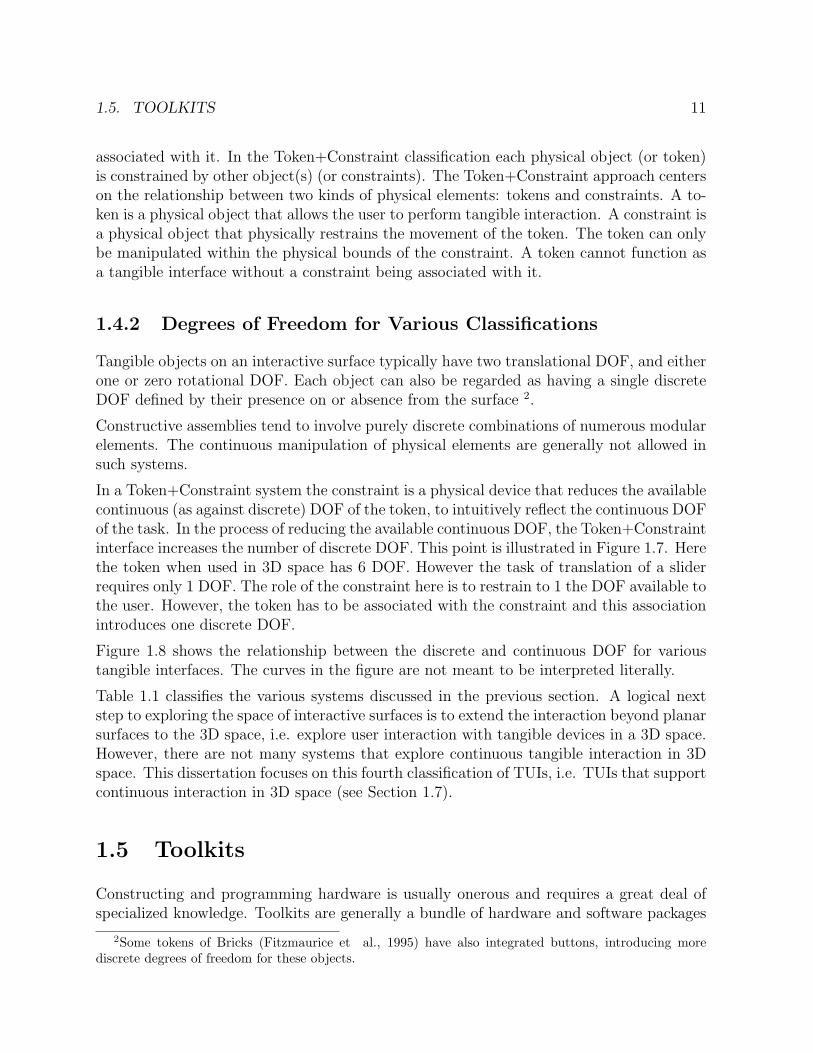
In a Token+Constraint system the constraint is a physical device that reduces the availablecontinuous (as against discrete) DOF of the token, to intuitively reflect the continuous DOFof the task. In the process of reducing the available continuous DOF, the Token+Constraintinterface increases the number of discrete DOF. This point is illustrated in Figure 1.7. Herethe token when used in 3D space has 6 DOF. However the task of translation of a sliderrequires only 1 DOF. The role of the constraint here is to restrain to 1 the DOF available tothe user. However, the token has to be associated with the constraint and this associationintroduces one discrete DOF.
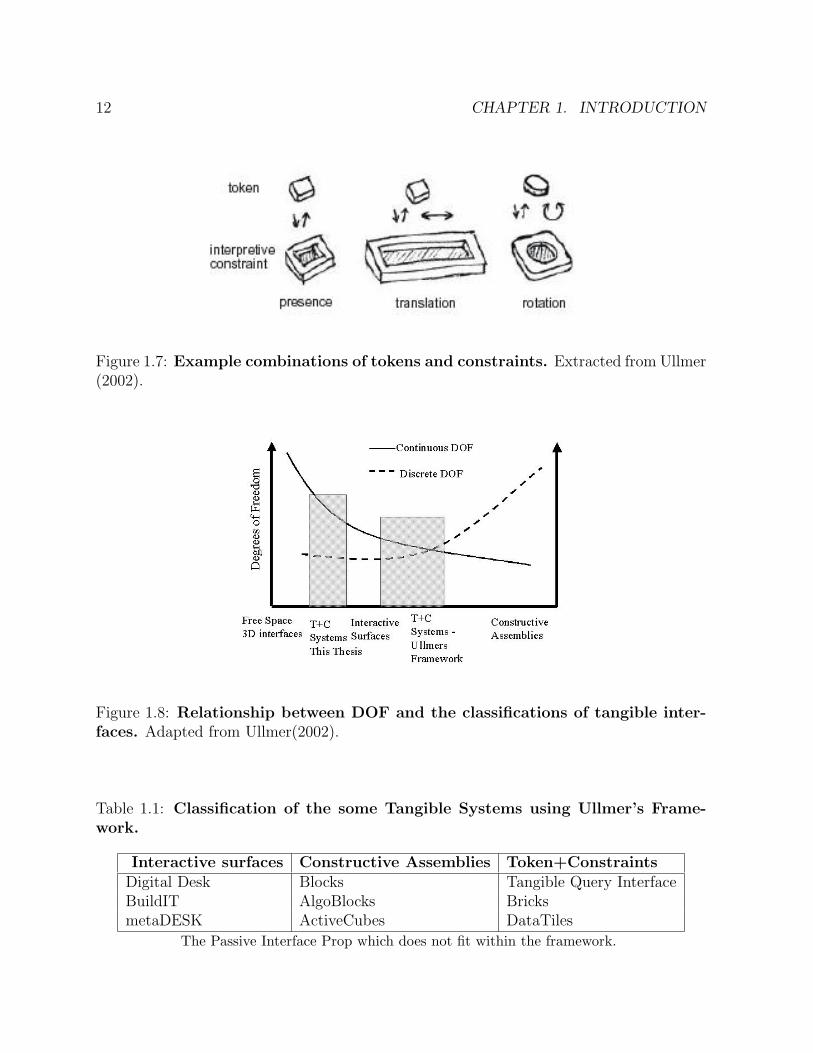
Figure 1.8 shows the relationship between the discrete and continuous DOF for varioustangible interfaces. The curves in the figure are not meant to be interpreted literally.
Table 1.1 classifies the various systems discussed in the previous section. A logical nextstep to exploring the space of interactive surfaces is to extend the interaction beyond planarsurfaces to the 3D space, i.e. explore user interaction with tangible devices in a 3D space.However, there are not many systems that explore continuous tangible interaction in 3Dspace. This dissertation focuses on this fourth classification of TUIs, i.e. TUIs that supportcontinuous interaction in 3D space (see Section 1.7).
1.5 Toolkits
Constructing and programming hardware is usually onerous and requires a great deal ofspecialized knowledge. Toolkits are generally a bundle of hardware and software packages
2Some tokens of Bricks (Fitzmaurice et al., 1995) have also integrated buttons, introducing morediscrete degrees of freedom for these objects.
12 CHAPTER 1. INTRODUCTION
Figure 1.7: Example combinations of tokens and constraints. Extracted from Ullmer(2002).
Figure 1.8: Relationship between DOF and the classifications of tangible inter-faces. Adapted from Ullmer(2002).
Table 1.1: Classification of the some Tangible Systems using Ullmer’s Frame-work.
Interactive surfaces Constructive Assemblies Token+ConstraintsDigital Desk Blocks Tangible Query InterfaceBuildIT AlgoBlocks BricksmetaDESK ActiveCubes DataTiles
The Passive Interface Prop which does not fit within the framework.
1.5. TOOLKITS 13
that facilitate developing such systems. Low-level details about the functioning of theoperating system, etc. can be hidden from the developer.
1.5.1 Context Toolkit
The Context Toolkit (Dey, 2000) leverages the notion of a widget to create context widgets.Context widgets gather contextual information from several sources, then abstract andmake this information available to the programmer. One source of contextual informationmay come from actual physical devices called generators. A context widget may alsocontain several generators, and it may combine and abstract the information collectedfrom these generators. However, the context toolkit does not facilitate building thesegenerators. The context toolkit separates context acquisition from context consumption.This enables multiple applications to utilize the same context.
1.5.2 Phidgets
Phidgets (physical widgets; Greenberg & Fitchett, 2001) represent a general toolkit ofphysical user interface components. The physical components includes wired primitiveinput and output device components (sensors, motors, switches, etc.), a circuit board withmicro-controller, and a communications layer. These physical components can be combinedto build more complex physical interfaces. They also provide a software interface thatallows developers to integrate the components into their applications.
1.5.3 iStuff
The iStuff (Ballagas, Ringel, Stone, & Borchers, 2003) toolkit combines lightweight wire-less input and output devices, such as buttons, sliders, buzzers, microphones, etc., withtheir respective software in order to create iStuff components. Each component can be dy-namically mapped to different applications running in the environment through a softwareintermediary. The iStuff toolkit and accompanying software interface are designed to beparticularly suitable for a ubiquitous computing environment.
These toolkits are aimed at enabling computer scientists to program physical devices. How-ever, they require fairly low-level programming and are difficult to use for non-computerscience developers (in particular designers). I am not aware of any toolkit that enablesrapid prototyping of TUIs. Phidgets and iStuff provide a good starting point for developingtoolkits for TUIs. Owing to reasons mentioned above, this dissertation neither uses any ofthese toolkits nor directly contributes to research in toolkit design.
14 CHAPTER 1. INTRODUCTION
1.6 Design Guidelines
Toolkits facilitate rapid prototyping of different systems which can be compared based onan evaluation criterion to generate design guidelines. These guidelines help future devel-opers of systems make informed decisions regarding the various design choices. One ofthe most important aspects of the design guideline is the evaluation criterion or perfor-mance measure used. The most popular performance measures are the usability measures(effectiveness, efficiency, and user satisfaction). However recently, other measures likefun (Blythe, Monk, Overbeeke, & Wright, 2003) and engagement (Eggen, Feijs, & Peters,2003) have also been explored.
1.6.1 Effectiveness and Efficiency
Effectiveness and efficiency are objective measures of usability that can be assessed usingperformance time and trial accuracy. Most guidelines generated through objective measuresuse either performance time or trial accuracy as their objective measure. The followingdesign factors can be identified when trying to develop tangible user interfaces that areeffective and efficient:
Role of Grip
Neurophysiological studies have shown that various parts of the human body are dispro-portionately reflected in the brain relative to their physical size and mass, as illustratedby the homunculus model (Sage, 1977, 2nd ed.). Of particular interest is the fact thatrepresentations of the fingers and the hands in both the somatosensory cortex and themotor cortex are much richer than those of the wrists, elbows and shoulders. Thereforeone may expect performance enhancement if fine muscle groups (i.e. fingers) are allowedto take part in handling an input device. On the other hand, the relationship betweenthe size of cortical area and dexterity has not been definitively established in the field ofneuroscience (Zhai, Milgram, & Buxton, 1996). Card, Mackinlay, and Robertson (1991)reviewed Fitts’ law studies with various parts of the body (fingers, wrist, arm, neck) andpointed out the limitations of the mouse. They suggested that “a promising direction fordeveloping a device to beat the mouse is by using the bandwidth of the finger”. Exper-imental work to evaluate this prediction was conducted by Zhai (1995), who concludedthat involvement of the small muscle groups (and joints in the user’s fingers) in the controlof an input device resulted in faster trial completion times than input devices that did notinvolve such muscle groups.
Bimanual Interaction
In the last two decades several experiments on spatial input devices have been performed.One of the focal points of these investigations has been the understanding of bimanual
1.6. DESIGN GUIDELINES 15
interaction. A bimanual interaction model widely accepted within the HCI community isthe Kinematic Chain (KC) model proposed by Guiard (1987). This model distinguishesthe following mechanisms for right-handed users:
• Left-hand precedence: The left hand precedes the right hand. For example, the lefthand first positions the paper, and then the right hand begins to write.
• Right-to-left reference: Motion of the right hand typically finds its spatial referencein the results of motion of the left hand.
• Asymmetric scales of motion: The right and left hands are involved in asymmetrictemporal-spatial scales of motion. The right hand specializes in rapid, small-scalemovements; the left in slower, larger-scale movements.
There have been experiments to show that bimanual interaction, when guided by the KCmodel, can be faster and more accurate than unimanual interaction, both in the caseof 2D-input devices (Buxton & Myers, 1986; Leganchuk, Zhai, & Buxton, 1998; Kabbash,Buxton, & Sellen, 1994) and 3D-input devices (Gribnau & Hennessey, 1998). This suggeststhat TUIs guided by the KC model can lead to faster and more accurate interactions thanthose devoid of KC model guidance.
1.6.2 Transparency
An important evaluation criterion considered in the design of TUIs is that the interactionswith the digital information (using the physical device) should look and feel to the userlike he/she is directly navigating and/or manipulating the digital information (at a certainlevel of abstraction), without the need to pay much attention to the interaction itself(Subramanian & IJsselsteijn, 2000). Thus, at a phenomenological level, the interactionshould be as transparent as possible (Winograd & Flores, 1986). This design philosophyhas been professed by many researchers in varying degrees and forms. For example, DonaldNorman in his book ‘The Invisible Computer’, on information appliances calls for invisibleinterfaces (Norman, 1998). Dourish (2001) has written a book on this topic where hepresents his ideas on embodiment of interaction . In particular, he points out that anessential feature of tangible input devices is that they can provide a scenario where theirform directly leads to functionality. Weiser’s (1991) visions of ubiquitous computing, atthe core, share a similar agenda of transparency.
The following design factors can be identified when trying to develop TUI that enhancetransparency:
Wireless Interface: Transparency of the interface can be enhanced through the useof untethered or wireless input props (Subramanian & IJsselsteijn, 2000). Mostdevelopers of input props have used electromagnetic sensing technologies. These
16 CHAPTER 1. INTRODUCTION
sensing technologies, though reliable, accurate and fast have a major disadvantage;a wire is needed to connect the sensors to the processing unit (Gribnau, 1999, page117). As a result they do not move and revolve freely. Thus many researchers haveexpressed a preference for wireless props over wired props (Gribnau, 1999; Hinckleyet al., 1994a).
Action-Perception Coupling: Transparency can be further enhanced if the user’s ac-tion space is integrated with their perception space into one unified space. In currentdesktop environments, the workspace where the user’s input actions such as keyboardand mouse inputs are performed is separated from the display space. For example,mouse actions and the cursor movements occur at separate positions: perceptionand action space are separated. This displacement of the display and input surfacefor pointing and positioning tasks produces eye-hand coordination problems. This isclaimed to influence transparency negatively (Rauterberg, 1995; Rauterberg, Bichsel,Meier, & Fjeld, 1997). Thus a tight coupling between the user’s actions and theirperception is expected to enhance transparency.
1.6.3 Social Intelligence
Bellotti et al. (2002) pose five questions that any sensing system should address forimproved usability. These questions can be seen as the UbiCom and Tangible computingequivalent of Norman’s famous gulfs of execution and evaluation for GUIs. The five basicquestions that designers and researchers of any sensing system should address are:
Address How do I address one (or more) of many possible devices?
Attention How do I know the system is ready and attending to my actions?
Action How do I effect a meaningful action, control its extent and possibly specify atarget or targets for my actions?
Alignment How do I know the system is doing (has done) the right thing?
Accident How do I avoid and correct mistakes and misunderstandings?
1.6.4 Coordination
Coordination, as defined by the Oxford English dictionary (2001), is a measure of smooth,accurate, controlled, continuous and well-orchestrated movements. How to measure coor-dination is still a much-debated topic (Accot & Zhai, 1999; Subramanian, Aliakseyeu, &Martens, 2003b; MacKenzie, Kauppinen, & Silfverberg, 2001). It is widely believed that anadvantage of TUIs is the greater sense of coordination it provides the user over the actionsthey perform (interpretations in various forms are available in Dourish, 2001; Ullmer, 2002
1.7. FOCUS AND CONTRIBUTION OF THE THESIS 17
and Fjeld, 2001). However, there are no guidelines for developing TUIs to enhance coor-dination, partly due to a lack of an appropriate measure for coordination. In Chapter 6, Ipresent a measurement scheme for coordination and compare it with subjective scores.
1.6.5 Fun, Flow and Engagement
Blythe et al. (2003) explores various concepts and aspects of fun. Djajadiningrat, Over-beeke, and Wensveen (2000) provides 10 heuristics, such as think experience, think enjoy-ment of the experience etc. to be considered from a designers perspective for designingaugmented and virtual reality systems in order to enhance the fun and beauty of inter-action. Eggen et al. (2003) explores the role/influence of physical interaction in chil-drens’ flow when playing computer games. The authors are attempting to study meansfor controlling the flow, so that children are better aware of the time they spend playingcomputer games. These are new and promising directions in which tangible computingcan contribute. However, much research remains in order to develop guidelines for use bydesigners.
1.7 Focus and Contribution of the Thesis
This dissertation is focused on designing and evaluating tangible user interfaces for continu-ous interaction in 3D space to support navigation through volumetric data, and specifically,the task of creating planar intersections through volumetric data.
Chapter 2 reviews four popular systems (the Passive Interface Props (PassProps), CubicMouse (CMouse), Personal Space Station (PSS) and Visual Interaction Platform (VIP))that support navigation through volumetric data using continuous tangible interactions in3D space. The main contribution of this chapter is the comparison of the four systemsin terms of the five dimensions of social intelligence highlighted in Section 1.6.3. Thiscomparison shows that while the four systems differ mostly in the technology employed,they seem to be very similar in their expectations of how this technology could, would andshould be used within the context of real applications. All systems have similar limitationswith respect to permitted user actions and alignment of system responses to such actions.They also have a similar (lack of) expectation or behavior with respect to how the usershould address devices within such systems and how the system informs the user of itsattention. Further more, the systems do not have any specific mechanism to prevent usermisunderstandings or accidents.
Three of the four systems presented, PassProps, PSS and VIP, utilize a hand-held prop tophysically represent and control an intersection window (i.e. to make planar intersectionsof volumetric data). A factor that can influence control when using such hand-held props isthe way the prop is held in the user’s hand. In order to design better versions of such propsone needs to further investigate the role of different hand-held grips and handedness on
18 CHAPTER 1. INTRODUCTION
control. The main contribution of Chapter 3 is an experimental comparison of various grips(power and precision) of a hand-held tangible 3D intersection window (referred to as RISP- Rigid Intersection Selection Prop), when used in the user’s dominant and non-dominanthand.
Chapter 3 only explored the use of an unconstrained 6 Degrees of Freedom (DOF) tangible3D intersection window. In other words, the user had simultaneous control of all 6 DOF.Of the systems described in Chapter 2, the PassProps, PSS and VIP allow simultaneouscontrol over the location and orientation of their intersection window, whereas the CMouseseparates the control of the location and orientation of the intersection planes.
Chapter 4 explores, through an experimental evaluation, how to allocate control over thedifferent DOF and questions if it is better to provide unconstrained simultaneous control ofall DOF (as in the VIP) or constrain the available DOF to provide users with consecutivecontrol of lower DOF (as in the CMouse)? One consequence of constraining the user’savailable continuous DOF is the creation of subtasks that require lower continuous DOF.These subtasks may be effectively accomplished by using a 2D-input device rather than a3D-input device. In such a case, one would expect hybrid interfaces that allow handling a3D-input device in one hand and a 2D-input device in the other hand to extend the user’sperformance advantage.
Chapter 5 presents the Tangible Volume Navigation system as a redesign of the VIP. Theredesign attempts to resolve the problems with social intelligence highlighted in Chapter 2.The interaction techniques also incorporate the results of the experimental evaluationsperformed in Chapters 3 and 4. The Tangible Volume Navigation system utilizes moretangible representations and provides stronger links between the tangible and intangiblerepresentations.It also allows the user to leave the interactions at any point to return at alater stage to resume the interactions.
A commonly attributed advantage of tangible input devices is the sense of control (alsoreferred to as coordination) they provide to the users. However, there is no establishedmeans to measure control. Based on an analysis of some of the existing measures I proposein Chapter 6 a new measure for coordination that compares the actual path traced bythe user with an optimal path. Some features of this measure are that the optimal pathdepends on the current position (along the path) and the target position (intended endpoint along the path) and that the measure is independent of the coordinate system andsampling rate.
Chapter 2
Tangible 3D Interaction System
2.1 Introduction
This chapter1 focuses on a class of computing systems that support continuous tangibleinteraction in 3D space known as “tangible 3D interaction systems”. Such systems can forinstance be applied in 3D scene manipulation and navigation through volumetric data. thatrequire 3D scene manipulation (environments like Maya and 3D StudioMax) and navigationthrough volumetric data (like in visualization of brain data). This chapter focuses onsystems that support navigation through volume data sets, and in specific the task ofcreating planar intersections through volumetric data. Subsequently, a comparison of someexisting systems based on the five dimensions of social intelligence (see Section 1.6.3) revealsinteresting challenges for improving these designs.
2.2 Working with Volume Data sets
Contrary to usual images that contain a value for each position (pixel) in a planar region,volumetric data have a value for each position (voxel) in a region of a 3D space. As aconsequence, the complete data set cannot be rendered as a single image and as a resultnew ways of exploring such data sets are required. Volumetric data sets, for instance, occurin the following applications.
• Medical diagnostics and surgical planning (Hinckley, Pausch, Proffitt, & Kassell,1998) often require anatomical images of the human body. Examples of volumetric(or scientific) data in this context are Computer Tomography (CT) data that arederived by a computer algorithm from multiple 2D images taken at many differentorientations. CT exists for many different modalities: X-ray, Magnetic Resonance,Positron Emission, etc.
1Submitted to Journal of Personal and Ubiquitous Computing, Springer.
19
20 CHAPTER 2. TANGIBLE 3D INTERACTION SYSTEM
• In geology, seismic recordings over a complete area may be collected to obtain in-formation on the subsurface structure. These data must be subsequently analyzedto better understand the shape and position of different geological layers, or to planinteresting trajectories for test drills (in oil or gas exploration or mining). Often, thecomputer can assist by making segmentations of the data. However, the results ofsuch segmentation are seldom completely trustworthy, and they have to be checked bya human operator, and corrected whenever necessary (Johnson & Bacigalupo-Rose,1993; Lin, Loftin, & Nelson, 2000).
Volumetric data set are used to obtain a better understanding of an underlying physicalprocess or structure (such as the human anatomy), as well as to plan future actions.Techniques need to be employed that allow the interior patterns to be examined. Onerecurring technique that is commonly employed is the analysis of planar cross-sections ofthe volume data. For example, neurosurgeons have planned surgical paths through theanatomy based on 2D slices acquired through 3D volumetric data sets.
2.3 Tangible 3D Interaction Systems
In this section, we review four popular systems, viz. Passive Interface Props, CubicMouse, Personal space station and the Visual Interaction Platform, that support navi-gation through volumetric data using continuous tangible interactions in 3D space. Acomparison of these systems based on the way they resolve the issues on social intelligence(raised in Section 1.6.3) is presented in Section 2.4
2.3.1 Passive Interface Props
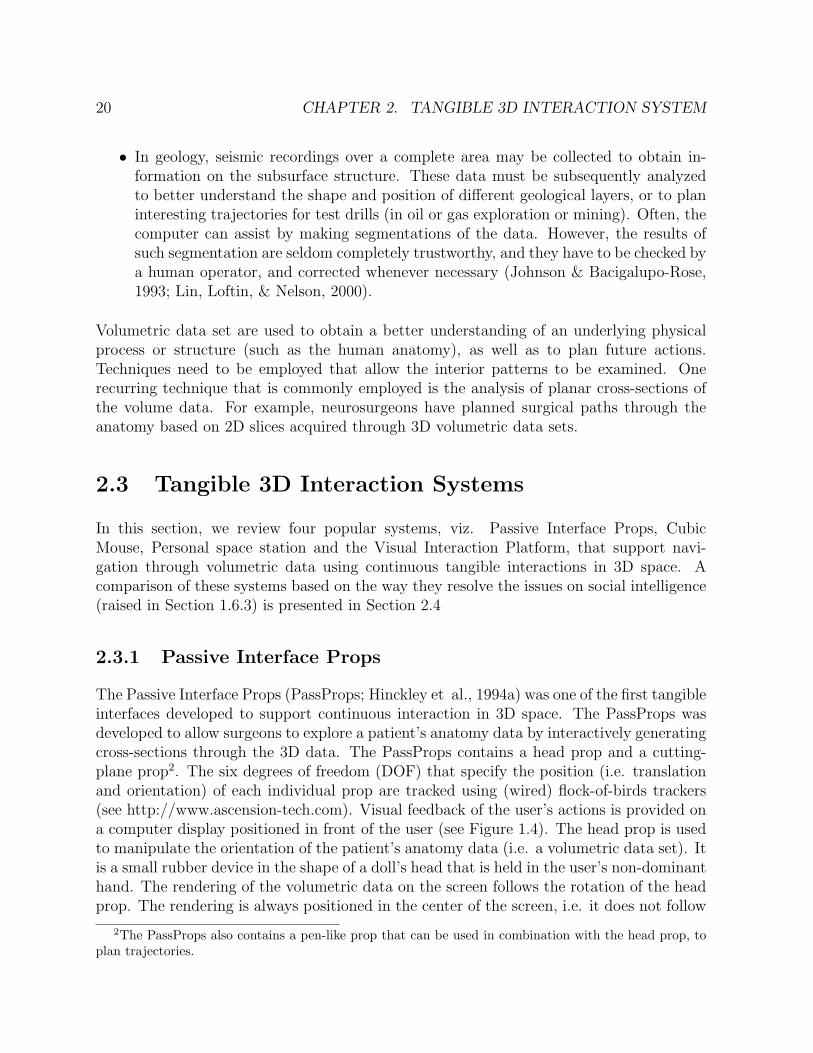
The Passive Interface Props (PassProps; Hinckley et al., 1994a) was one of the first tangibleinterfaces developed to support continuous interaction in 3D space. The PassProps wasdeveloped to allow surgeons to explore a patient’s anatomy data by interactively generatingcross-sections through the 3D data. The PassProps contains a head prop and a cutting-plane prop2. The six degrees of freedom (DOF) that specify the position (i.e. translationand orientation) of each individual prop are tracked using (wired) flock-of-birds trackers(see http://www.ascension-tech.com). Visual feedback of the user’s actions is provided ona computer display positioned in front of the user (see Figure 1.4). The head prop is usedto manipulate the orientation of the patient’s anatomy data (i.e. a volumetric data set). Itis a small rubber device in the shape of a doll’s head that is held in the user’s non-dominanthand. The rendering of the volumetric data on the screen follows the rotation of the headprop. The rendering is always positioned in the center of the screen, i.e. it does not follow
2The PassProps also contains a pen-like prop that can be used in combination with the head prop, toplan trajectories.
2.3. TANGIBLE 3D INTERACTION SYSTEMS 21
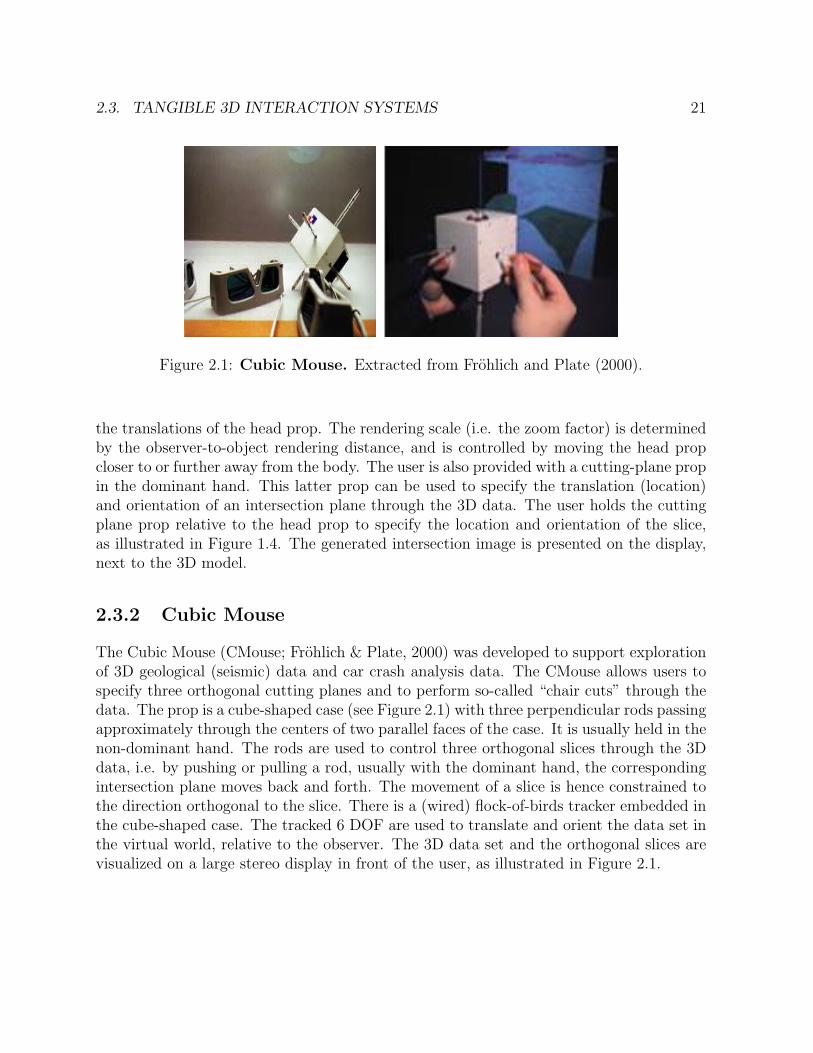
Figure 2.1: Cubic Mouse. Extracted from Frohlich and Plate (2000).
the translations of the head prop. The rendering scale (i.e. the zoom factor) is determinedby the observer-to-object rendering distance, and is controlled by moving the head propcloser to or further away from the body. The user is also provided with a cutting-plane propin the dominant hand. This latter prop can be used to specify the translation (location)and orientation of an intersection plane through the 3D data. The user holds the cuttingplane prop relative to the head prop to specify the location and orientation of the slice,as illustrated in Figure 1.4. The generated intersection image is presented on the display,next to the 3D model.
2.3.2 Cubic Mouse
The Cubic Mouse (CMouse; Frohlich & Plate, 2000) was developed to support explorationof 3D geological (seismic) data and car crash analysis data. The CMouse allows users tospecify three orthogonal cutting planes and to perform so-called “chair cuts” through thedata. The prop is a cube-shaped case (see Figure 2.1) with three perpendicular rods passingapproximately through the centers of two parallel faces of the case. It is usually held in thenon-dominant hand. The rods are used to control three orthogonal slices through the 3Ddata, i.e. by pushing or pulling a rod, usually with the dominant hand, the correspondingintersection plane moves back and forth. The movement of a slice is hence constrained tothe direction orthogonal to the slice. There is a (wired) flock-of-birds tracker embedded inthe cube-shaped case. The tracked 6 DOF are used to translate and orient the data set inthe virtual world, relative to the observer. The 3D data set and the orthogonal slices arevisualized on a large stereo display in front of the user, as illustrated in Figure 2.1.
22 CHAPTER 2. TANGIBLE 3D INTERACTION SYSTEM
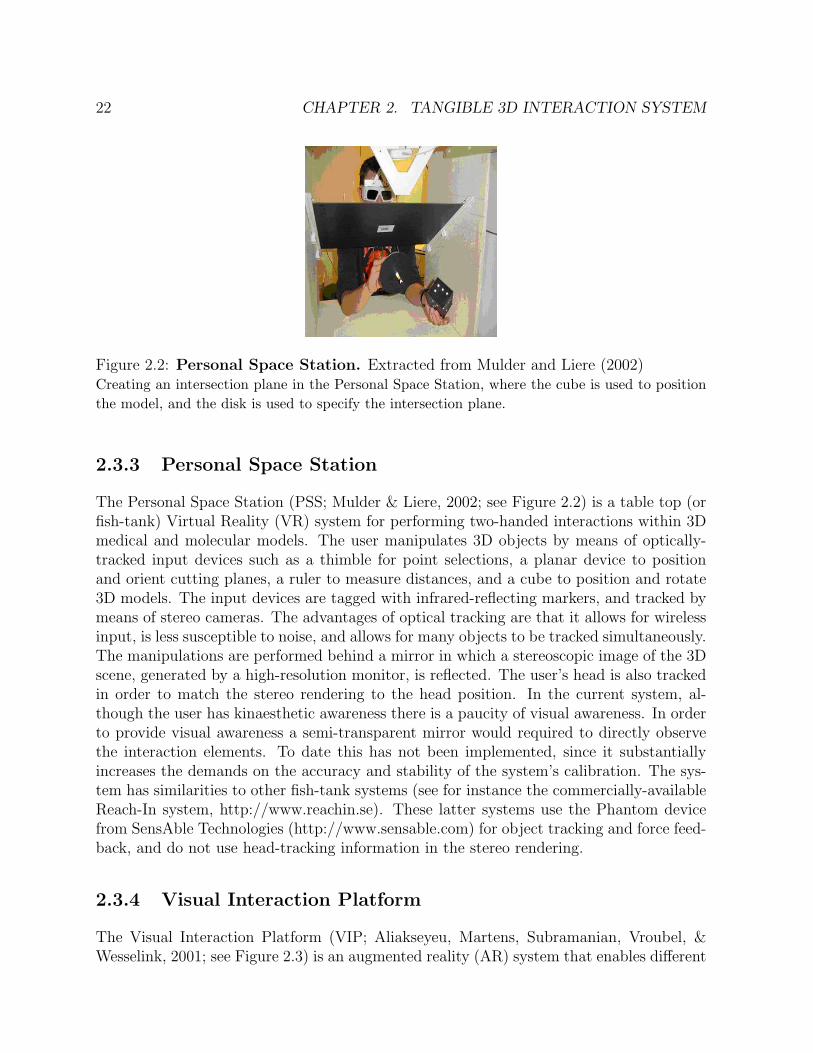
Figure 2.2: Personal Space Station. Extracted from Mulder and Liere (2002)Creating an intersection plane in the Personal Space Station, where the cube is used to positionthe model, and the disk is used to specify the intersection plane.
2.3.3 Personal Space Station
The Personal Space Station (PSS; Mulder & Liere, 2002; see Figure 2.2) is a table top (orfish-tank) Virtual Reality (VR) system for performing two-handed interactions within 3Dmedical and molecular models. The user manipulates 3D objects by means of optically-tracked input devices such as a thimble for point selections, a planar device to positionand orient cutting planes, a ruler to measure distances, and a cube to position and rotate3D models. The input devices are tagged with infrared-reflecting markers, and tracked bymeans of stereo cameras. The advantages of optical tracking are that it allows for wirelessinput, is less susceptible to noise, and allows for many objects to be tracked simultaneously.The manipulations are performed behind a mirror in which a stereoscopic image of the 3Dscene, generated by a high-resolution monitor, is reflected. The user’s head is also trackedin order to match the stereo rendering to the head position. In the current system, al-though the user has kinaesthetic awareness there is a paucity of visual awareness. In orderto provide visual awareness a semi-transparent mirror would required to directly observethe interaction elements. To date this has not been implemented, since it substantiallyincreases the demands on the accuracy and stability of the system’s calibration. The sys-tem has similarities to other fish-tank systems (see for instance the commercially-availableReach-In system, http://www.reachin.se). These latter systems use the Phantom devicefrom SensAble Technologies (http://www.sensable.com) for object tracking and force feed-back, and do not use head-tracking information in the stereo rendering.
2.3.4 Visual Interaction Platform
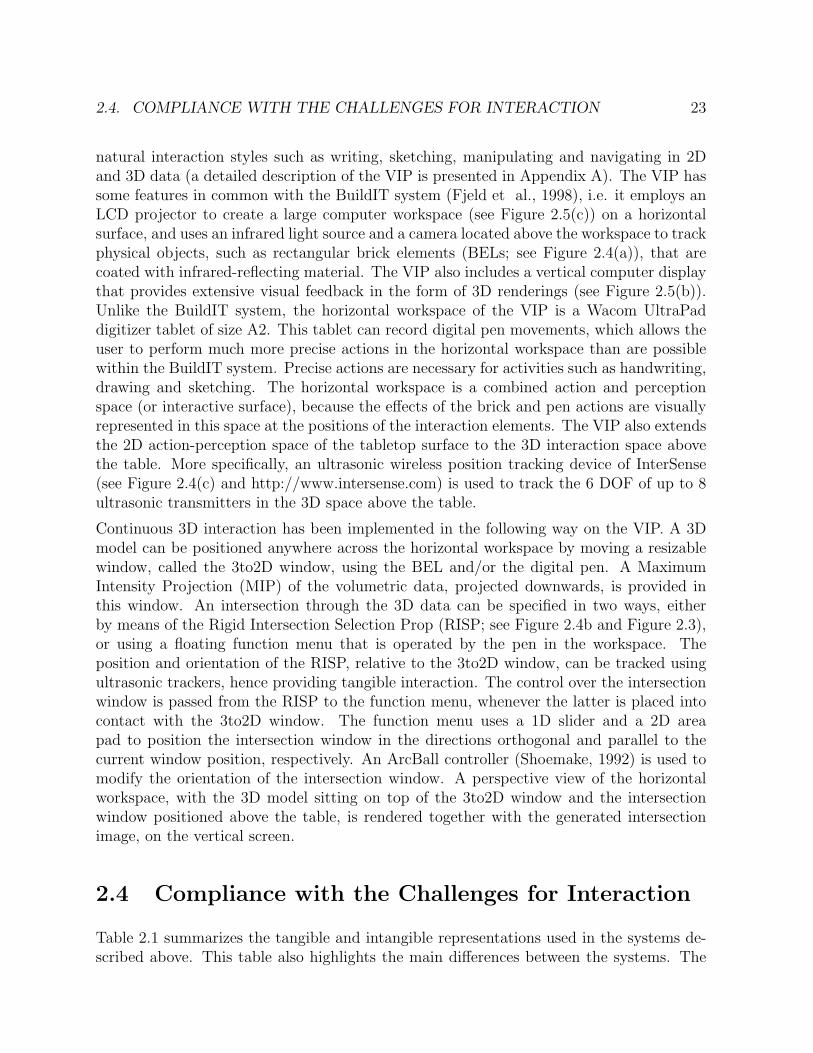
The Visual Interaction Platform (VIP; Aliakseyeu, Martens, Subramanian, Vroubel, &Wesselink, 2001; see Figure 2.3) is an augmented reality (AR) system that enables different
2.4. COMPLIANCE WITH THE CHALLENGES FOR INTERACTION 23
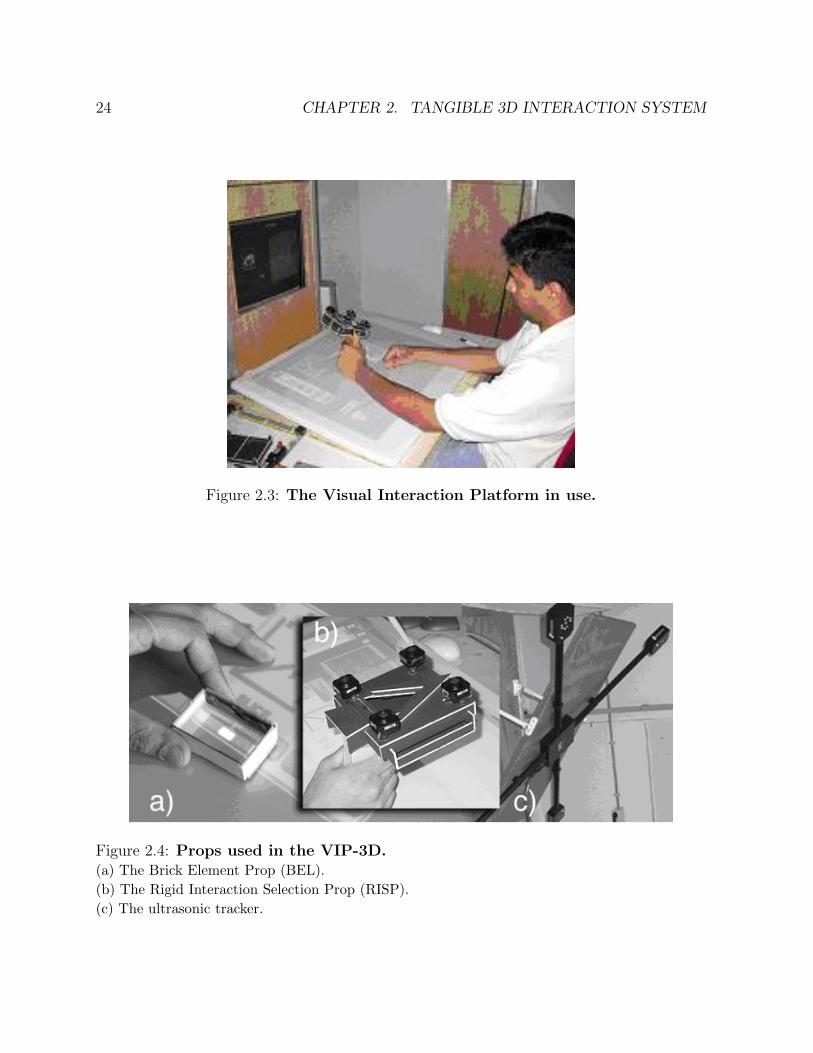
natural interaction styles such as writing, sketching, manipulating and navigating in 2Dand 3D data (a detailed description of the VIP is presented in Appendix A). The VIP hassome features in common with the BuildIT system (Fjeld et al., 1998), i.e. it employs anLCD projector to create a large computer workspace (see Figure 2.5(c)) on a horizontalsurface, and uses an infrared light source and a camera located above the workspace to trackphysical objects, such as rectangular brick elements (BELs; see Figure 2.4(a)), that arecoated with infrared-reflecting material. The VIP also includes a vertical computer displaythat provides extensive visual feedback in the form of 3D renderings (see Figure 2.5(b)).Unlike the BuildIT system, the horizontal workspace of the VIP is a Wacom UltraPaddigitizer tablet of size A2. This tablet can record digital pen movements, which allows theuser to perform much more precise actions in the horizontal workspace than are possiblewithin the BuildIT system. Precise actions are necessary for activities such as handwriting,drawing and sketching. The horizontal workspace is a combined action and perceptionspace (or interactive surface), because the effects of the brick and pen actions are visuallyrepresented in this space at the positions of the interaction elements. The VIP also extendsthe 2D action-perception space of the tabletop surface to the 3D interaction space abovethe table. More specifically, an ultrasonic wireless position tracking device of InterSense(see Figure 2.4(c) and http://www.intersense.com) is used to track the 6 DOF of up to 8ultrasonic transmitters in the 3D space above the table.
Continuous 3D interaction has been implemented in the following way on the VIP. A 3Dmodel can be positioned anywhere across the horizontal workspace by moving a resizablewindow, called the 3to2D window, using the BEL and/or the digital pen. A MaximumIntensity Projection (MIP) of the volumetric data, projected downwards, is provided inthis window. An intersection through the 3D data can be specified in two ways, eitherby means of the Rigid Intersection Selection Prop (RISP; see Figure 2.4b and Figure 2.3),or using a floating function menu that is operated by the pen in the workspace. Theposition and orientation of the RISP, relative to the 3to2D window, can be tracked usingultrasonic trackers, hence providing tangible interaction. The control over the intersectionwindow is passed from the RISP to the function menu, whenever the latter is placed intocontact with the 3to2D window. The function menu uses a 1D slider and a 2D areapad to position the intersection window in the directions orthogonal and parallel to thecurrent window position, respectively. An ArcBall controller (Shoemake, 1992) is used tomodify the orientation of the intersection window. A perspective view of the horizontalworkspace, with the 3D model sitting on top of the 3to2D window and the intersectionwindow positioned above the table, is rendered together with the generated intersectionimage, on the vertical screen.
2.4 Compliance with the Challenges for Interaction
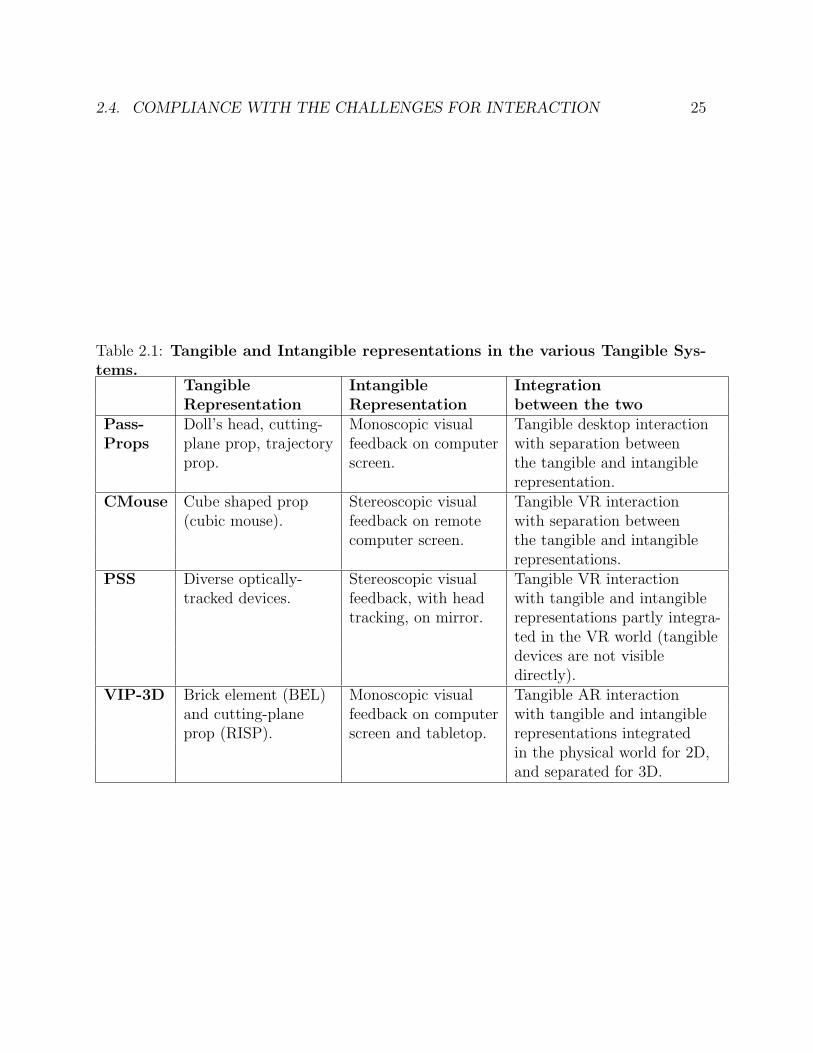
Table 2.1 summarizes the tangible and intangible representations used in the systems de-scribed above. This table also highlights the main differences between the systems. The
24 CHAPTER 2. TANGIBLE 3D INTERACTION SYSTEM
Figure 2.3: The Visual Interaction Platform in use.
Figure 2.4: Props used in the VIP-3D.(a) The Brick Element Prop (BEL).(b) The Rigid Interaction Selection Prop (RISP).(c) The ultrasonic tracker.
2.4. COMPLIANCE WITH THE CHALLENGES FOR INTERACTION 25
Table 2.1: Tangible and Intangible representations in the various Tangible Sys-tems.
Tangible Intangible IntegrationRepresentation Representation between the two
Pass- Doll’s head, cutting- Monoscopic visual Tangible desktop interactionProps plane prop, trajectory feedback on computer with separation between
prop. screen. the tangible and intangiblerepresentation.
CMouse Cube shaped prop Stereoscopic visual Tangible VR interaction(cubic mouse). feedback on remote with separation between
computer screen. the tangible and intangiblerepresentations.
PSS Diverse optically- Stereoscopic visual Tangible VR interactiontracked devices. feedback, with head with tangible and intangible
tracking, on mirror. representations partly integra-ted in the VR world (tangibledevices are not visibledirectly).
VIP-3D Brick element (BEL) Monoscopic visual Tangible AR interactionand cutting-plane feedback on computer with tangible and intangibleprop (RISP). screen and tabletop. representations integrated
in the physical world for 2D,and separated for 3D.
26 CHAPTER 2. TANGIBLE 3D INTERACTION SYSTEM
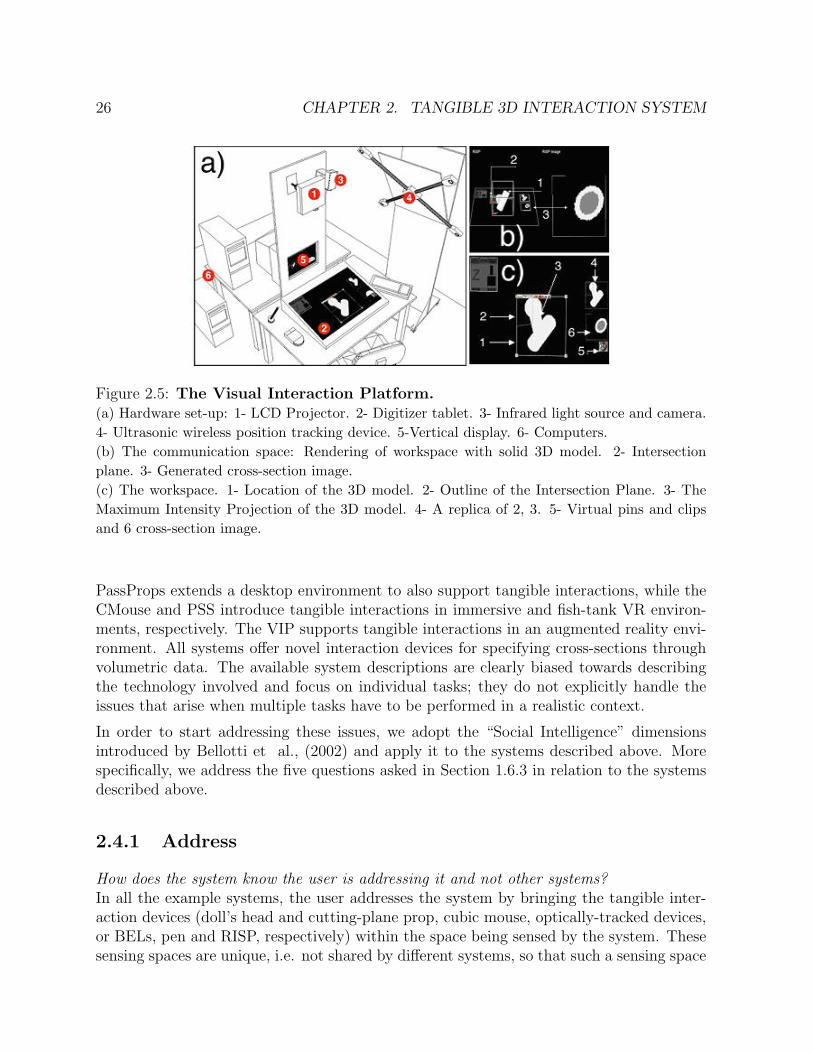
Figure 2.5: The Visual Interaction Platform.(a) Hardware set-up: 1- LCD Projector. 2- Digitizer tablet. 3- Infrared light source and camera.4- Ultrasonic wireless position tracking device. 5-Vertical display. 6- Computers.(b) The communication space: Rendering of workspace with solid 3D model. 2- Intersectionplane. 3- Generated cross-section image.(c) The workspace. 1- Location of the 3D model. 2- Outline of the Intersection Plane. 3- TheMaximum Intensity Projection of the 3D model. 4- A replica of 2, 3. 5- Virtual pins and clipsand 6 cross-section image.
PassProps extends a desktop environment to also support tangible interactions, while theCMouse and PSS introduce tangible interactions in immersive and fish-tank VR environ-ments, respectively. The VIP supports tangible interactions in an augmented reality envi-ronment. All systems offer novel interaction devices for specifying cross-sections throughvolumetric data. The available system descriptions are clearly biased towards describingthe technology involved and focus on individual tasks; they do not explicitly handle theissues that arise when multiple tasks have to be performed in a realistic context.
In order to start addressing these issues, we adopt the “Social Intelligence” dimensionsintroduced by Bellotti et al., (2002) and apply it to the systems described above. Morespecifically, we address the five questions asked in Section 1.6.3 in relation to the systemsdescribed above.
2.4.1 Address
How does the system know the user is addressing it and not other systems?In all the example systems, the user addresses the system by bringing the tangible inter-action devices (doll’s head and cutting-plane prop, cubic mouse, optically-tracked devices,or BELs, pen and RISP, respectively) within the space being sensed by the system. Thesesensing spaces are unique, i.e. not shared by different systems, so that such a sensing space
2.4. COMPLIANCE WITH THE CHALLENGES FOR INTERACTION 27
constitutes the physical “address” of the corresponding system. In the case of the VIP,the active sensing area for 2D interactions is explicitly delineated by means of visual cues.For interactions with the digitizer pen and the optically tracked BELs, the active area ismarked by four corners on the digitizer tablet, while for the RISP interaction, it is the areaoccupied by the 3to2D window. On the other hand, the height of the RISP’s sensing spaceabove the table is not indicated. In the other three systems, the space being tracked bythe system is, as far as we can judge, not explicitly delimited. One obvious consequenceis that, in cases where this tracked space is larger than that imagined by the user, thesystem may react to an interaction device, without this being the intention of the user.Conversely, if the sensing space is smaller than that imagined, the intention of addressingthe system may be missed. The fact that the sensing spaces are, at best, only indicatedby visual markers that do not constitute physical obstructions or boundaries, also impliesthat system addressing can easily happen unintentionally or alternatively can fail.
2.4.2 Attention
How does the user know the system is attending to his/her request?The available system descriptions do not provide sufficient detailed information to resolvethe issue of whether or not there is explicit feedback to the user’s initial address. In thecase of the VIP, attention-confirmation signals are provided for the 2D interaction. Inthe case of the digitizer tablet, a light turns on and off when the pen is inside or outsidethe sensing range of the tablet. Regarding BEL tracking, a pattern is projected on topof each detected BEL. No such explicit visual feedback is provided upon detection of the3D interaction device, i.e. the RISP. As far as we can judge, no such confirmation signals,either on the display, through sound or on the interaction elements themselves, are providedin the PassProps, CMouse and PSS systems. The known systems hence rely completely onthe “action” and “alignment” (see below) for user feedback in the case of 3D interaction.Since these latter feedbacks are typically generated from within an application program,it can happen that the “driver” software that detects and tracks the interaction devicesis functioning properly while the application program is failing. In the currently availablesystems, there seems to be no way of diagnosing such situations.
2.4.3 Action
How can the user establish what action he/she wishes the system to perform and how canhe/she specify and control the target and extent of the action?In the prototype systems discussed above, the interaction devices are coupled one-to-oneto the objects in the scene, i.e. one interaction device typically manipulates the volumetricdata set, while another interaction device controls the intersection plane. The problem ofcoupling different data sets or interaction elements to a limited number of physical devicesis hence circumvented. One possible way of implementing this aspect in the VIP system
28 CHAPTER 2. TANGIBLE 3D INTERACTION SYSTEM
could be to allow for multiple 3to2D windows on the workspace that are linked to differentvolumetric data sets. A clutch and/or function button could be used in most existingsystems to couple a single input device to multiple objects and/or functions.
The actions that have to be performed when creating intersection images are geometricin nature (i.e. positioning an intersection plane relative to a volume), and hence can bemapped in a straightforward way to the interaction devices. Most system descriptionshowever do not mention explicitly how the action can be terminated. In the case ofthe VIP, there are currently two ways of freezing an intersection image. The first is byusing the non-occupied hand to move the function menu so that it intersects with the3to2D window, and the second is by issuing a voice command. An alternative option,not currently implemented, is to use a foot pedal; this is the mechanism used in the PSS.Because the perceptual processing and motor (or speech) actions required from the user,and the processing of the user actions by the system, all introduce latency, it often happensthat the intersection image actually saved differs (slightly) from the intended image. Theavailable systems do not offer any assistance for keeping the interaction elements steadyduring such latency period.
All existing systems also suffer the “cup of tea” syndrome. If the user leaves the systemto take a break or attend some other unrelated activity, then the location and orientationof the 3D model (in the case of the PassProps, CMouse and PSS) and/or the intersectionwindow (in the case of the PassProps, PSS and VIP) are lost and the user will have tostart over. More specifically, unlike the virtual representation, the physical representationcannot be saved and reloaded, in order for the session to be resumed at a later point intime.
2.4.4 Alignment
How does the user know the system understands and is correctly executing the user’s in-tended action?The system detects the presence, identity, position, orientation and configuration of thevarious tangible objects, and renders the corresponding interaction elements in the virtualscene. Note that the correspondence in form factor and position between the real andvirtual interaction elements can play a role in the perceived alignment, as was alreadyshown by Hinckley in the case of the PassProps system. He noted that the eyes in thedoll’s head were not necessarily aligned with the eyes in a volumetric scan of a head, whichcomplicated the task of creating an intersection image at eye height (because of the con-flicting physical and virtual representations offered to the user). Hinckley circumventedthis problem by replacing the doll’s head with a spherical head prop, so that the user hasto rely on the virtual representation. This is also the case for systems using purely virtualrepresentations, such as the PSS.
A key feature of tangible interfaces is that the user can pay attention to either the tan-gible or the virtual representation (or both, either simultaneously or consecutively) while
2.5. CONCLUSIONS 29
performing a task. This implies that designers of tangible interfaces should be especiallyaware of discrepancies between the physical and virtual representations. Judging fromthe existing designs, some discrepancies will probably always remain. For instance, in allsystems except the PSS, the rendering of the virtual scene is physically displaced from theactual position of the interaction devices. In the case of the PassProps and PSS systems,the two props are intended to intersect, but due to obvious physical limitations, they in-stead need to be used alongside each other. In the case of the CMouse, the positions ofthe intersection planes cannot be observed directly from the physical representation butmust be deduced indirectly by how much the rods stick out on either side. In the case ofthe VIP, the 3D data set is (virtually) above the 3to2D window at a height that cannotbe physically perceived. Moreover, it is difficult to judge exactly where the intersectionplane is in the physical representation (it is actually the plane spanned by the tops ofthe ultrasonic transducers of the RISP, i.e. it is a plane that is not physically present).Another source of discrepancies between the physical and virtual representations is thefact that the calibration between both worlds is never perfect. With the current state oftracking and technologies, these registration errors are often easily perceivable. All thesefactors contribute to the fact that we expect user of the existing systems to rely mostly onthe virtual rendering, rather than on the physical representation, for task alignment. Thisis obviously not in agreement with the major goal of tangible interaction.
2.4.5 Accident
How do the user and the system resolve misunderstandings?A problem that is seldom discussed, but nevertheless very real in all tracking systems thatwe have observed up to now, is that the system sometimes loses track of one or more of theinteraction devices. In the current systems, there is no explicit visual, acoustic or tactileevent signaling such an occurrence. The user will continue to manipulate the interactiondevices and will only realize that there is a misunderstanding when s/he does not see theappropriate changes of the interaction devices taking place in the virtual scene. Hence theuser only realizes that something is wrong when the alignment is lost.
In the existing systems, it seems that the task of detecting and resolving errors is completelyleft up to the user, which can obviously result in confusion. For instance, we have frequentlyobserved, in the course of experiments with or demonstrations of our VIP system, that theinstructor has to inform the user that there is a misunderstanding due to tracking loss andhas to explain the reason. Once they realize this, most users figure out themselves how toresolve the problem.
2.5 Conclusions
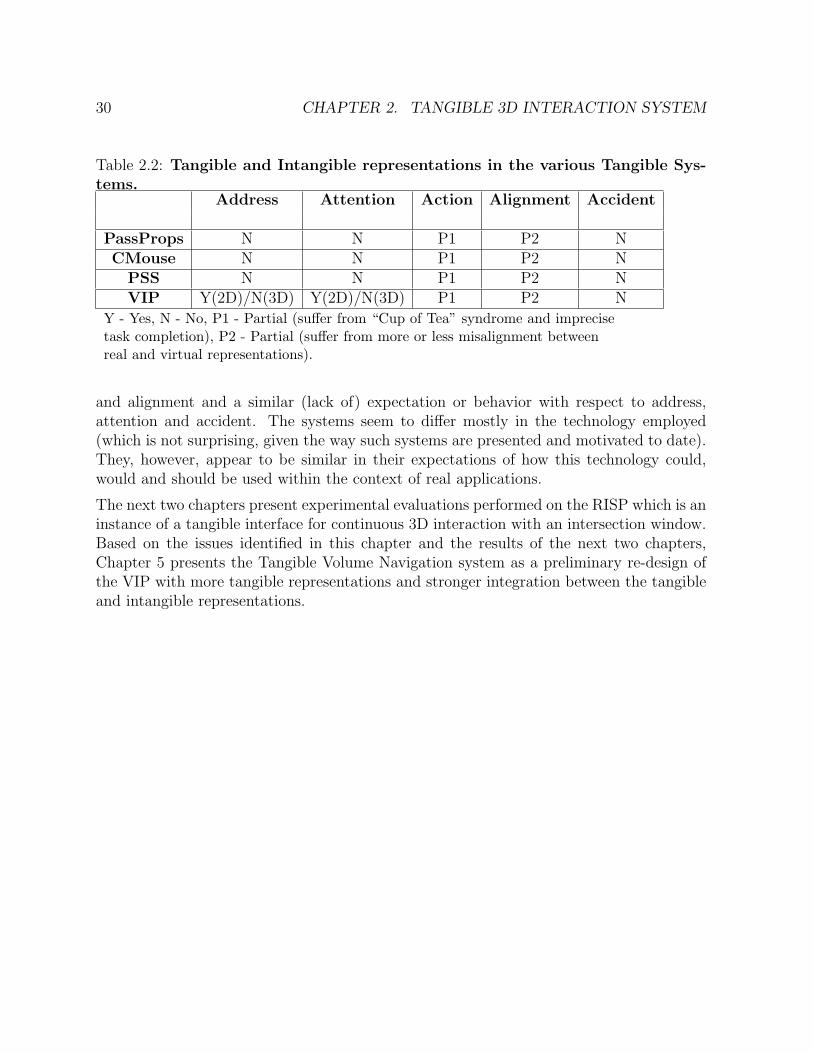
Table 2.2 summarizes how the described systems resolve the issues for social intelligenceraised by Bellotti et al., (2002). All systems have similar limitations with respect to action
30 CHAPTER 2. TANGIBLE 3D INTERACTION SYSTEM
Table 2.2: Tangible and Intangible representations in the various Tangible Sys-tems.
Address Attention Action Alignment Accident
PassProps N N P1 P2 NCMouse N N P1 P2 N
PSS N N P1 P2 NVIP Y(2D)/N(3D) Y(2D)/N(3D) P1 P2 N
Y - Yes, N - No, P1 - Partial (suffer from “Cup of Tea” syndrome and imprecisetask completion), P2 - Partial (suffer from more or less misalignment betweenreal and virtual representations).
and alignment and a similar (lack of) expectation or behavior with respect to address,attention and accident. The systems seem to differ mostly in the technology employed(which is not surprising, given the way such systems are presented and motivated to date).They, however, appear to be similar in their expectations of how this technology could,would and should be used within the context of real applications.
The next two chapters present experimental evaluations performed on the RISP which is aninstance of a tangible interface for continuous 3D interaction with an intersection window.Based on the issues identified in this chapter and the results of the next two chapters,Chapter 5 presents the Tangible Volume Navigation system as a preliminary re-design ofthe VIP with more tangible representations and stronger integration between the tangibleand intangible representations.
Chapter 3
Design and Evaluation of a CuttingPlane Prop
3.1 Introduction
Chapter 2 introduced the different prototype systems that permit tangible interaction in3D space and compared the different systems based on their social intelligence. Threeof the four systems presented, the Passive Interface Props, Personal Space Station andVisual Interaction Platform, utilize a hand-held prop to physically represent and controlan intersection window (i.e. to make planar intersections of volume data). A factor thatcan influence control when using such hand-held props is the way in which the prop is heldin the user’s hand. In order to design better versions of such props one needs to furtherinvestigate the role of different hand-held grips on control.
To this end, this chapter focuses on the effect of different hand grips on the design. Inparticular, it investigates human performance differences in controlling 6 DOF 3D tangibleinput devices which use different hand grips. Sections 3.2 reviews relevant literature ofexperimental investigations on the influence of form factor and muscle groups in perfor-mance of hand-held input devices. Sections 3.3 and 3.4 address the various types of gripsused and raise relevant research questions, respectively. Finally, Sections 3.5 through 3.8present and discuss the experiment and its results.
3.2 Factors Influencing Hand-Held Input Devices
3.2.1 Influence of Form Factor on Performance
In a study on the usability analysis of 3D rotation tasks Hinckley et al., (1997) found thatthere was no significant difference in the performance of two 3D-input devices that differed
31
32 CHAPTER 3. DESIGN AND EVALUATION OF A CUTTING PLANE PROP
(a) (b)
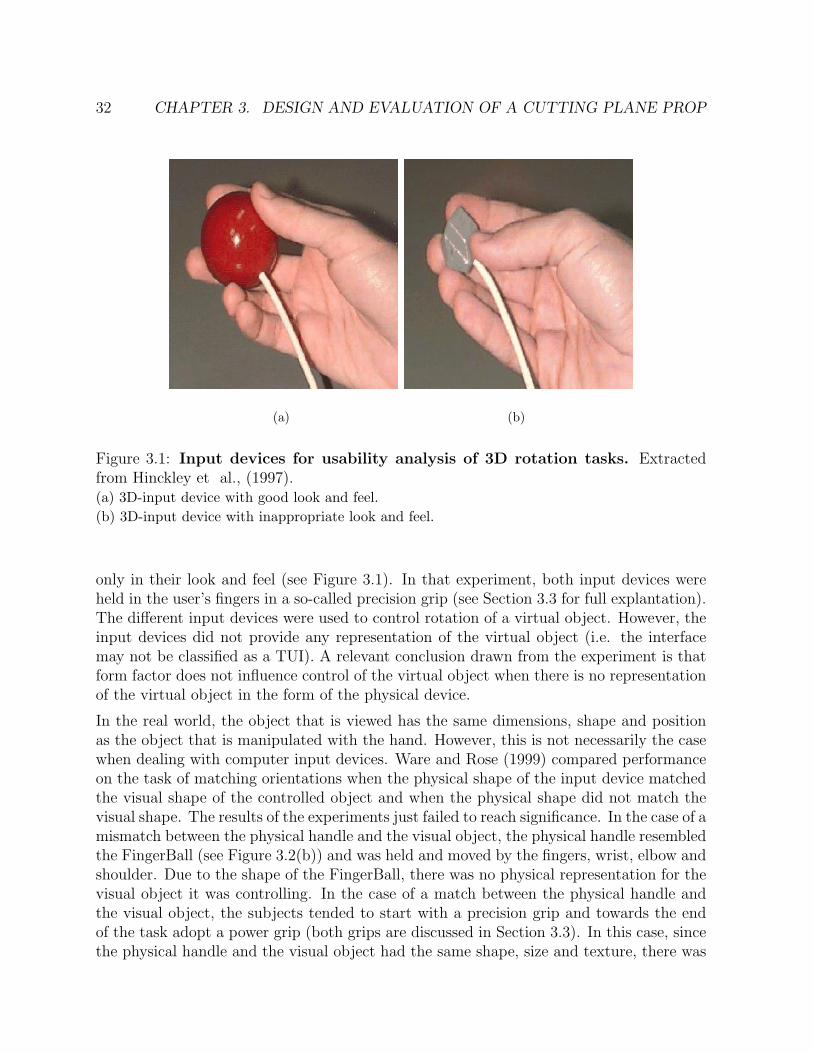
Figure 3.1: Input devices for usability analysis of 3D rotation tasks. Extractedfrom Hinckley et al., (1997).(a) 3D-input device with good look and feel.(b) 3D-input device with inappropriate look and feel.
only in their look and feel (see Figure 3.1). In that experiment, both input devices wereheld in the user’s fingers in a so-called precision grip (see Section 3.3 for full explantation).The different input devices were used to control rotation of a virtual object. However, theinput devices did not provide any representation of the virtual object (i.e. the interfacemay not be classified as a TUI). A relevant conclusion drawn from the experiment is thatform factor does not influence control of the virtual object when there is no representationof the virtual object in the form of the physical device.
In the real world, the object that is viewed has the same dimensions, shape and positionas the object that is manipulated with the hand. However, this is not necessarily the casewhen dealing with computer input devices. Ware and Rose (1999) compared performanceon the task of matching orientations when the physical shape of the input device matchedthe visual shape of the controlled object and when the physical shape did not match thevisual shape. The results of the experiments just failed to reach significance. In the case of amismatch between the physical handle and the visual object, the physical handle resembledthe FingerBall (see Figure 3.2(b)) and was held and moved by the fingers, wrist, elbow andshoulder. Due to the shape of the FingerBall, there was no physical representation for thevisual object it was controlling. In the case of a match between the physical handle andthe visual object, the subjects tended to start with a precision grip and towards the endof the task adopt a power grip (both grips are discussed in Section 3.3). In this case, sincethe physical handle and the visual object had the same shape, size and texture, there was
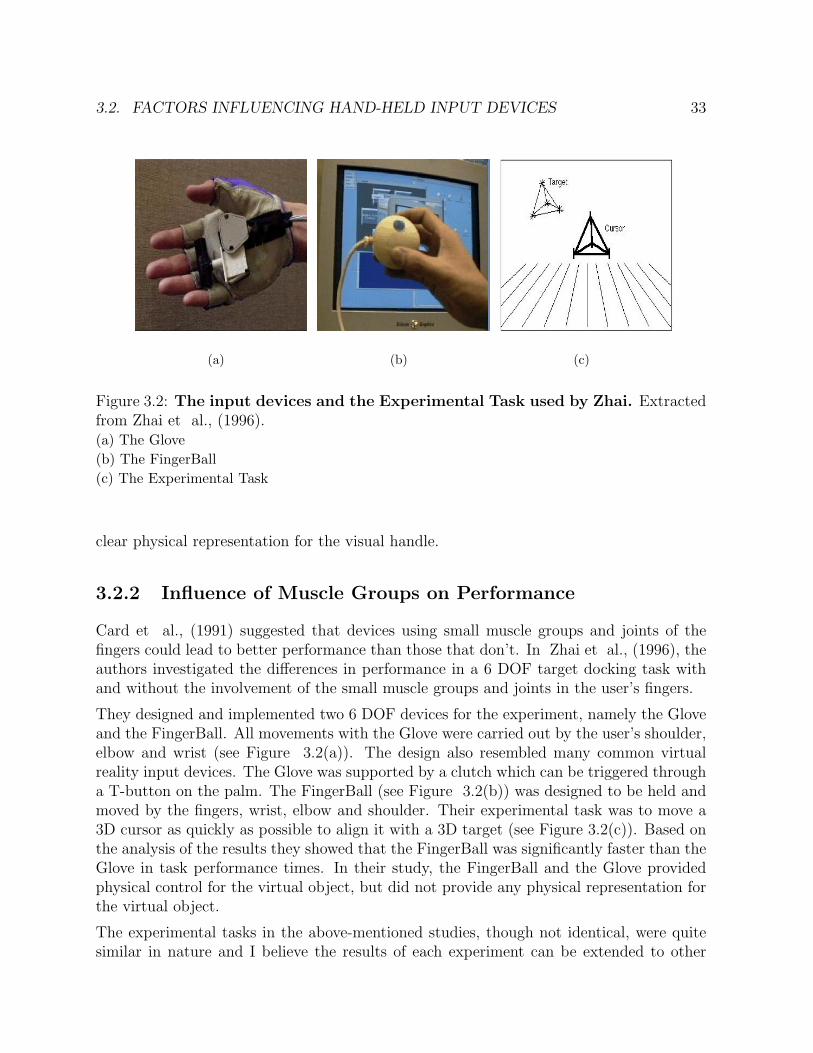
3.2. FACTORS INFLUENCING HAND-HELD INPUT DEVICES 33
(a) (b) (c)
Figure 3.2: The input devices and the Experimental Task used by Zhai. Extractedfrom Zhai et al., (1996).(a) The Glove(b) The FingerBall(c) The Experimental Task
clear physical representation for the visual handle.
3.2.2 Influence of Muscle Groups on Performance
Card et al., (1991) suggested that devices using small muscle groups and joints of thefingers could lead to better performance than those that don’t. In Zhai et al., (1996), theauthors investigated the differences in performance in a 6 DOF target docking task withand without the involvement of the small muscle groups and joints in the user’s fingers.
They designed and implemented two 6 DOF devices for the experiment, namely the Gloveand the FingerBall. All movements with the Glove were carried out by the user’s shoulder,elbow and wrist (see Figure 3.2(a)). The design also resembled many common virtualreality input devices. The Glove was supported by a clutch which can be triggered througha T-button on the palm. The FingerBall (see Figure 3.2(b)) was designed to be held andmoved by the fingers, wrist, elbow and shoulder. Their experimental task was to move a3D cursor as quickly as possible to align it with a 3D target (see Figure 3.2(c)). Based onthe analysis of the results they showed that the FingerBall was significantly faster than theGlove in task performance times. In their study, the FingerBall and the Glove providedphysical control for the virtual object, but did not provide any physical representation forthe virtual object.
The experimental tasks in the above-mentioned studies, though not identical, were quitesimilar in nature and I believe the results of each experiment can be extended to other
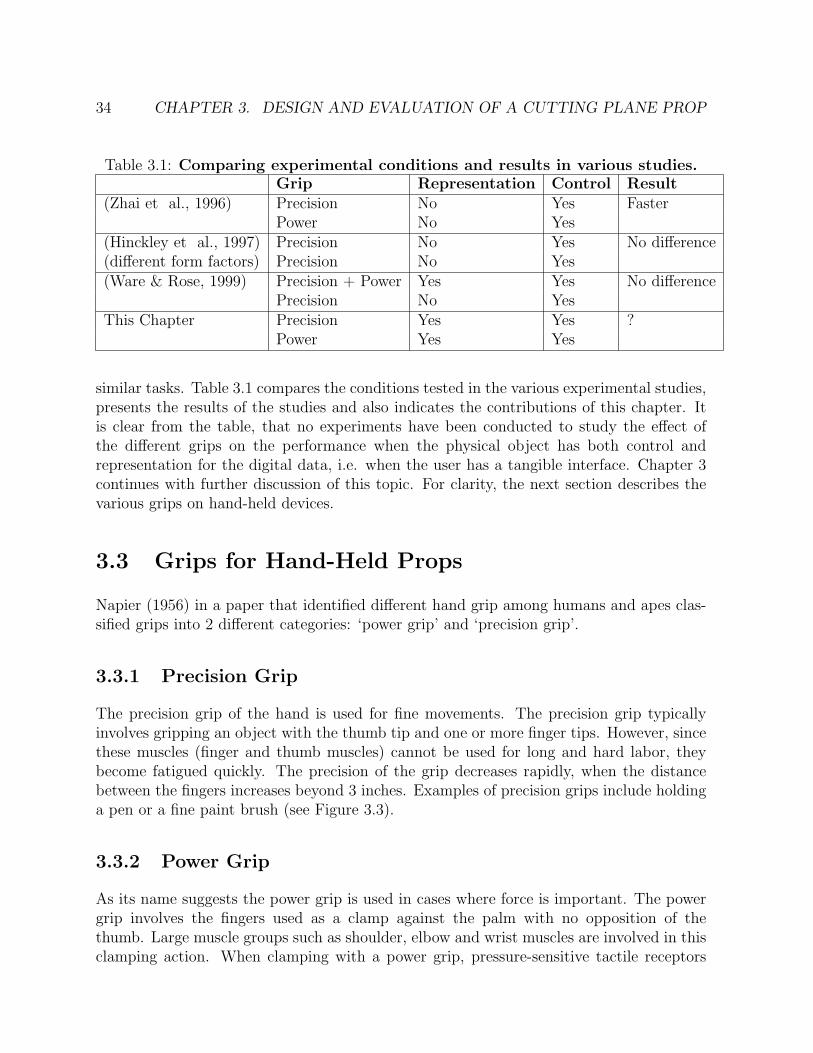
34 CHAPTER 3. DESIGN AND EVALUATION OF A CUTTING PLANE PROP
Table 3.1: Comparing experimental conditions and results in various studies.Grip Representation Control Result
(Zhai et al., 1996) Precision No Yes FasterPower No Yes
(Hinckley et al., 1997) Precision No Yes No difference(different form factors) Precision No Yes(Ware & Rose, 1999) Precision + Power Yes Yes No difference
Precision No YesThis Chapter Precision Yes Yes ?
Power Yes Yes
similar tasks. Table 3.1 compares the conditions tested in the various experimental studies,presents the results of the studies and also indicates the contributions of this chapter. Itis clear from the table, that no experiments have been conducted to study the effect ofthe different grips on the performance when the physical object has both control andrepresentation for the digital data, i.e. when the user has a tangible interface. Chapter 3continues with further discussion of this topic. For clarity, the next section describes thevarious grips on hand-held devices.
3.3 Grips for Hand-Held Props
Napier (1956) in a paper that identified different hand grip among humans and apes clas-sified grips into 2 different categories: ‘power grip’ and ‘precision grip’.
3.3.1 Precision Grip
The precision grip of the hand is used for fine movements. The precision grip typicallyinvolves gripping an object with the thumb tip and one or more finger tips. However, sincethese muscles (finger and thumb muscles) cannot be used for long and hard labor, theybecome fatigued quickly. The precision of the grip decreases rapidly, when the distancebetween the fingers increases beyond 3 inches. Examples of precision grips include holdinga pen or a fine paint brush (see Figure 3.3).
3.3.2 Power Grip
As its name suggests the power grip is used in cases where force is important. The powergrip involves the fingers used as a clamp against the palm with no opposition of thethumb. Large muscle groups such as shoulder, elbow and wrist muscles are involved in thisclamping action. When clamping with a power grip, pressure-sensitive tactile receptors
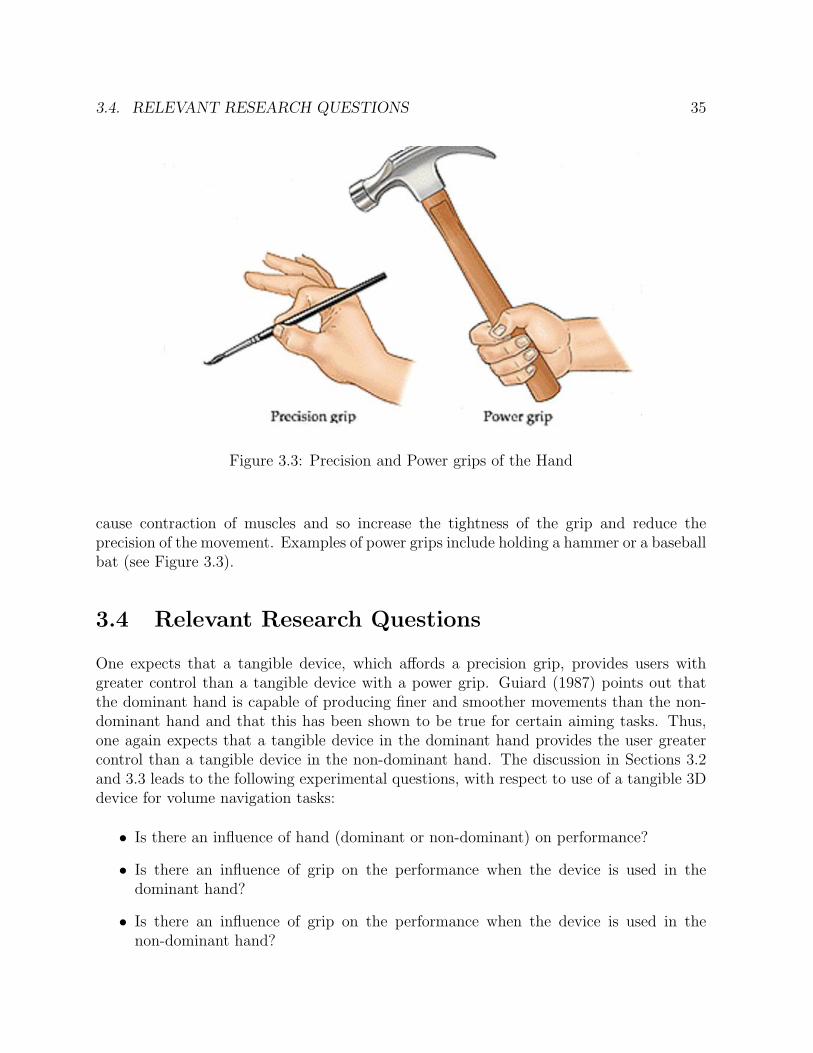
3.4. RELEVANT RESEARCH QUESTIONS 35
Figure 3.3: Precision and Power grips of the Hand
cause contraction of muscles and so increase the tightness of the grip and reduce theprecision of the movement. Examples of power grips include holding a hammer or a baseballbat (see Figure 3.3).
3.4 Relevant Research Questions
One expects that a tangible device, which affords a precision grip, provides users withgreater control than a tangible device with a power grip. Guiard (1987) points out thatthe dominant hand is capable of producing finer and smoother movements than the non-dominant hand and that this has been shown to be true for certain aiming tasks. Thus,one again expects that a tangible device in the dominant hand provides the user greatercontrol than a tangible device in the non-dominant hand. The discussion in Sections 3.2and 3.3 leads to the following experimental questions, with respect to use of a tangible 3Ddevice for volume navigation tasks:
• Is there an influence of hand (dominant or non-dominant) on performance?
• Is there an influence of grip on the performance when the device is used in thedominant hand?
• Is there an influence of grip on the performance when the device is used in thenon-dominant hand?
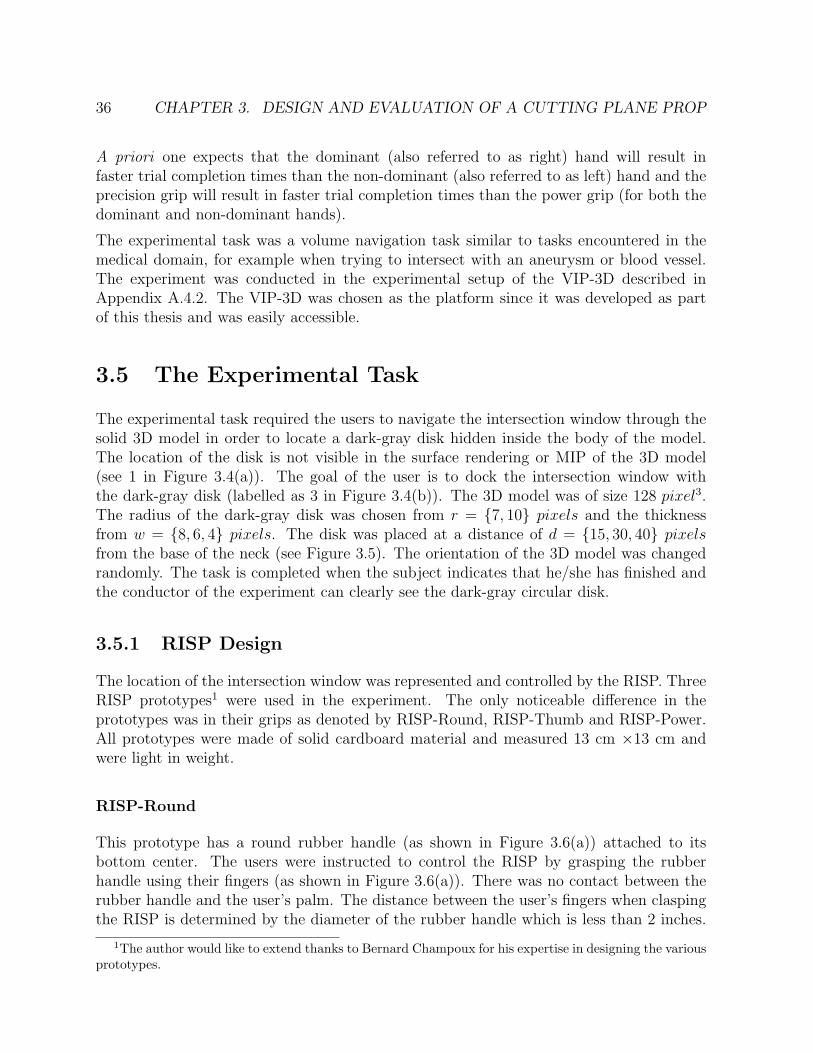
36 CHAPTER 3. DESIGN AND EVALUATION OF A CUTTING PLANE PROP
A priori one expects that the dominant (also referred to as right) hand will result infaster trial completion times than the non-dominant (also referred to as left) hand and theprecision grip will result in faster trial completion times than the power grip (for both thedominant and non-dominant hands).
The experimental task was a volume navigation task similar to tasks encountered in themedical domain, for example when trying to intersect with an aneurysm or blood vessel.The experiment was conducted in the experimental setup of the VIP-3D described inAppendix A.4.2. The VIP-3D was chosen as the platform since it was developed as partof this thesis and was easily accessible.
3.5 The Experimental Task
The experimental task required the users to navigate the intersection window through thesolid 3D model in order to locate a dark-gray disk hidden inside the body of the model.The location of the disk is not visible in the surface rendering or MIP of the 3D model(see 1 in Figure 3.4(a)). The goal of the user is to dock the intersection window withthe dark-gray disk (labelled as 3 in Figure 3.4(b)). The 3D model was of size 128 pixel3.The radius of the dark-gray disk was chosen from r = {7, 10} pixels and the thicknessfrom w = {8, 6, 4} pixels. The disk was placed at a distance of d = {15, 30, 40} pixelsfrom the base of the neck (see Figure 3.5). The orientation of the 3D model was changedrandomly. The task is completed when the subject indicates that he/she has finished andthe conductor of the experiment can clearly see the dark-gray circular disk.
3.5.1 RISP Design
The location of the intersection window was represented and controlled by the RISP. ThreeRISP prototypes1 were used in the experiment. The only noticeable difference in theprototypes was in their grips as denoted by RISP-Round, RISP-Thumb and RISP-Power.All prototypes were made of solid cardboard material and measured 13 cm ×13 cm andwere light in weight.
RISP-Round
This prototype has a round rubber handle (as shown in Figure 3.6(a)) attached to itsbottom center. The users were instructed to control the RISP by grasping the rubberhandle using their fingers (as shown in Figure 3.6(a)). There was no contact between therubber handle and the user’s palm. The distance between the user’s fingers when claspingthe RISP is determined by the diameter of the rubber handle which is less than 2 inches.
1The author would like to extend thanks to Bernard Champoux for his expertise in designing the variousprototypes.

3.5. THE EXPERIMENTAL TASK 37
(a)
(b)
Figure 3.4: Visual feedback on the VIP.(a) The Communication Space: 1 - Rendering of workspace with solid 3D model, 2 - Inter-section window, 3 - Generated cross-section image.(b) The Workspace: 1 - Location of the 3D model, 2 - Outline of the Intersection window, 3- The Maximum Intensity Projection of the 3D model, 4 - A replica of 2 and 3, 5 - Pins, 6 -Cross-section Image.
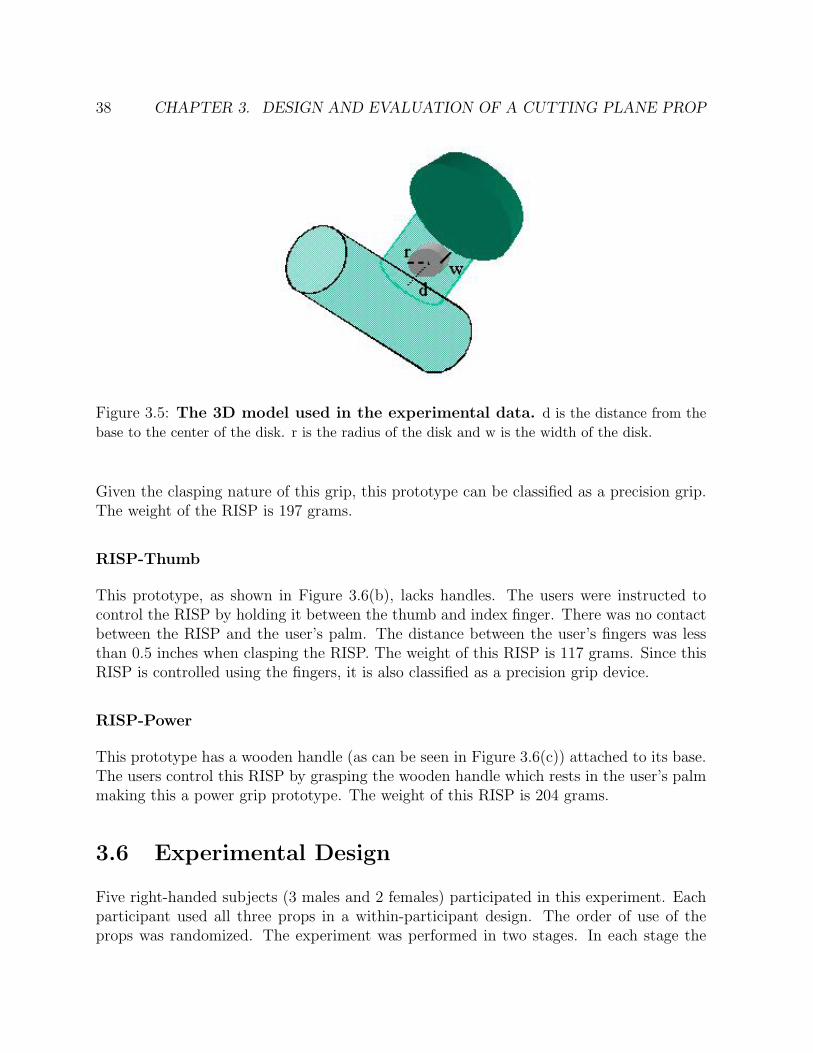
38 CHAPTER 3. DESIGN AND EVALUATION OF A CUTTING PLANE PROP
Figure 3.5: The 3D model used in the experimental data. d is the distance from thebase to the center of the disk. r is the radius of the disk and w is the width of the disk.
Given the clasping nature of this grip, this prototype can be classified as a precision grip.The weight of the RISP is 197 grams.
RISP-Thumb
This prototype, as shown in Figure 3.6(b), lacks handles. The users were instructed tocontrol the RISP by holding it between the thumb and index finger. There was no contactbetween the RISP and the user’s palm. The distance between the user’s fingers was lessthan 0.5 inches when clasping the RISP. The weight of this RISP is 117 grams. Since thisRISP is controlled using the fingers, it is also classified as a precision grip device.
RISP-Power
This prototype has a wooden handle (as can be seen in Figure 3.6(c)) attached to its base.The users control this RISP by grasping the wooden handle which rests in the user’s palmmaking this a power grip prototype. The weight of this RISP is 204 grams.
3.6 Experimental Design
Five right-handed subjects (3 males and 2 females) participated in this experiment. Eachparticipant used all three props in a within-participant design. The order of use of theprops was randomized. The experiment was performed in two stages. In each stage the
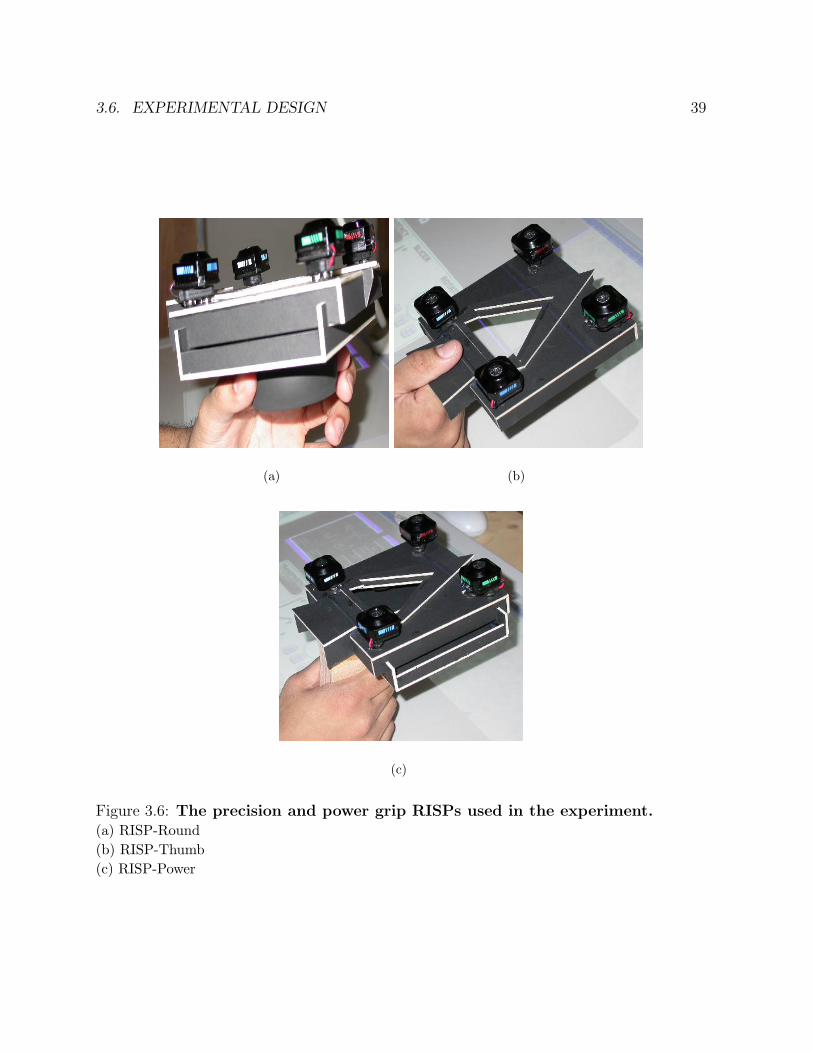
3.6. EXPERIMENTAL DESIGN 39
(a) (b)
(c)
Figure 3.6: The precision and power grip RISPs used in the experiment.(a) RISP-Round(b) RISP-Thumb(c) RISP-Power
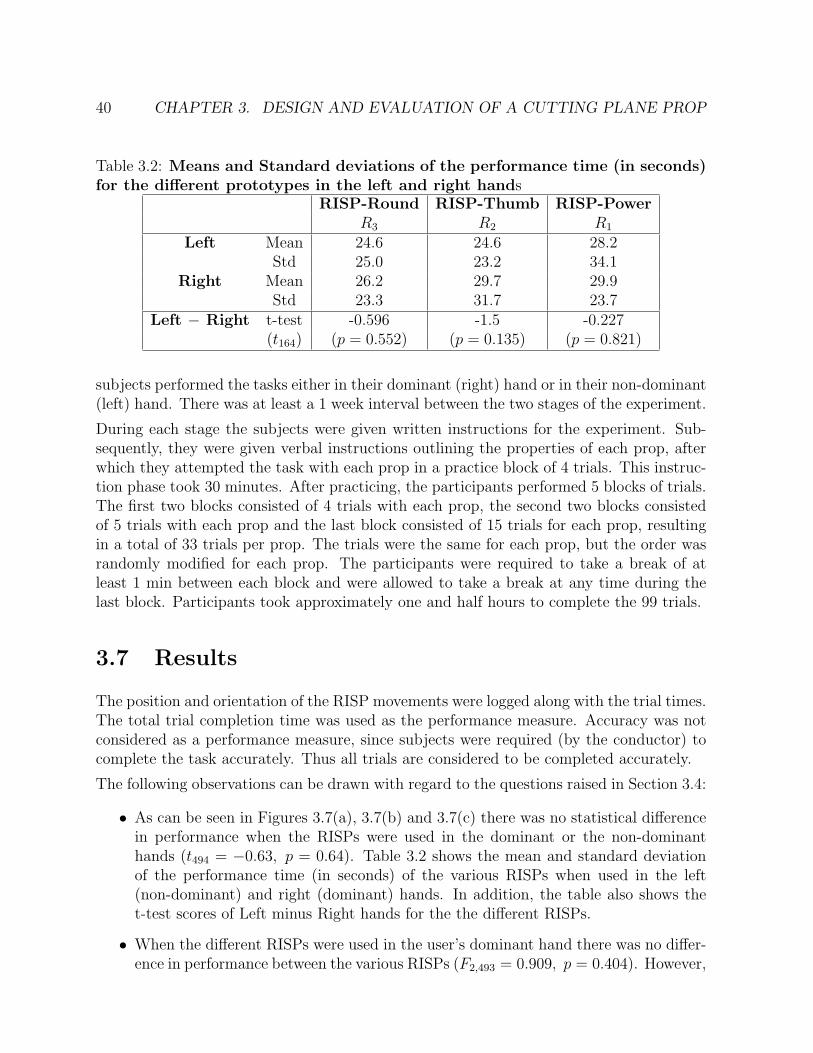
40 CHAPTER 3. DESIGN AND EVALUATION OF A CUTTING PLANE PROP
Table 3.2: Means and Standard deviations of the performance time (in seconds)for the different prototypes in the left and right hands
RISP-Round RISP-Thumb RISP-PowerR3 R2 R1
Left Mean 24.6 24.6 28.2Std 25.0 23.2 34.1
Right Mean 26.2 29.7 29.9Std 23.3 31.7 23.7
Left − Right t-test -0.596 -1.5 -0.227(t164) (p = 0.552) (p = 0.135) (p = 0.821)
subjects performed the tasks either in their dominant (right) hand or in their non-dominant(left) hand. There was at least a 1 week interval between the two stages of the experiment.
During each stage the subjects were given written instructions for the experiment. Sub-sequently, they were given verbal instructions outlining the properties of each prop, afterwhich they attempted the task with each prop in a practice block of 4 trials. This instruc-tion phase took 30 minutes. After practicing, the participants performed 5 blocks of trials.The first two blocks consisted of 4 trials with each prop, the second two blocks consistedof 5 trials with each prop and the last block consisted of 15 trials for each prop, resultingin a total of 33 trials per prop. The trials were the same for each prop, but the order wasrandomly modified for each prop. The participants were required to take a break of atleast 1 min between each block and were allowed to take a break at any time during thelast block. Participants took approximately one and half hours to complete the 99 trials.
3.7 Results
The position and orientation of the RISP movements were logged along with the trial times.The total trial completion time was used as the performance measure. Accuracy was notconsidered as a performance measure, since subjects were required (by the conductor) tocomplete the task accurately. Thus all trials are considered to be completed accurately.
The following observations can be drawn with regard to the questions raised in Section 3.4:
• As can be seen in Figures 3.7(a), 3.7(b) and 3.7(c) there was no statistical differencein performance when the RISPs were used in the dominant or the non-dominanthands (t494 = −0.63, p = 0.64). Table 3.2 shows the mean and standard deviationof the performance time (in seconds) of the various RISPs when used in the left(non-dominant) and right (dominant) hands. In addition, the table also shows thet-test scores of Left minus Right hands for the the different RISPs.
• When the different RISPs were used in the user’s dominant hand there was no differ-ence in performance between the various RISPs (F2,493 = 0.909, p = 0.404). However,
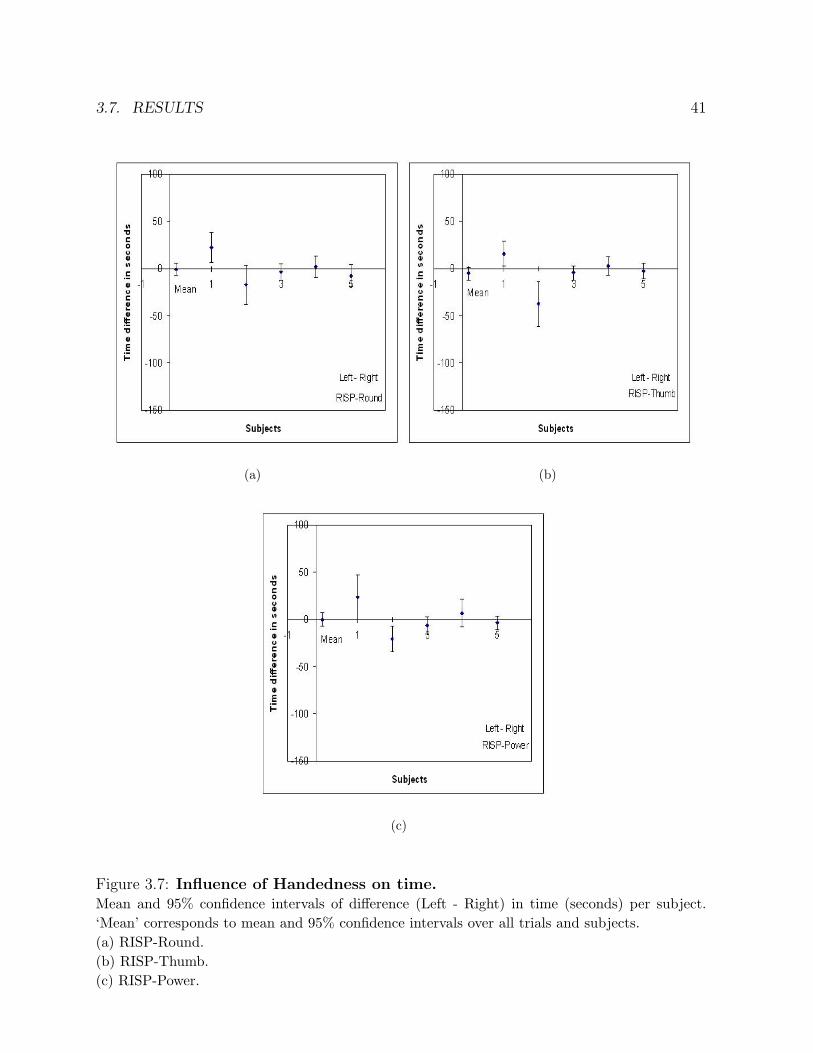
3.7. RESULTS 41
(a) (b)
(c)
Figure 3.7: Influence of Handedness on time.Mean and 95% confidence intervals of difference (Left - Right) in time (seconds) per subject.‘Mean’ corresponds to mean and 95% confidence intervals over all trials and subjects.(a) RISP-Round.(b) RISP-Thumb.(c) RISP-Power.
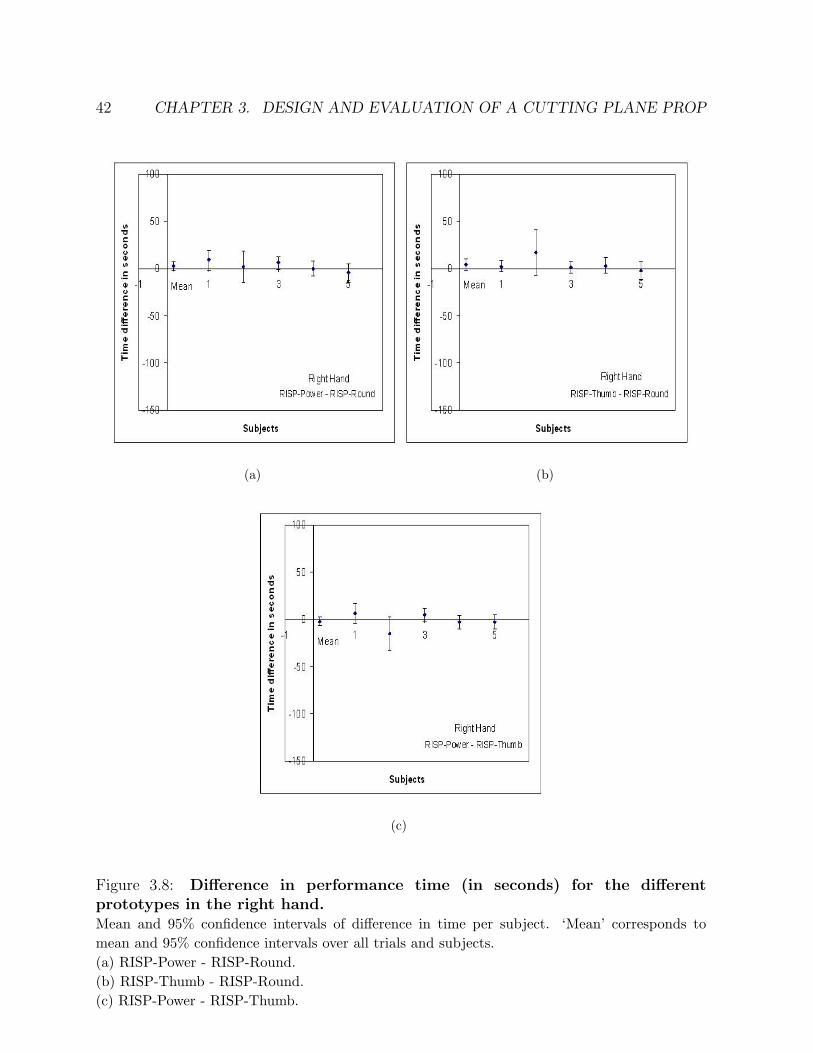
42 CHAPTER 3. DESIGN AND EVALUATION OF A CUTTING PLANE PROP
(a) (b)
(c)
Figure 3.8: Difference in performance time (in seconds) for the differentprototypes in the right hand.Mean and 95% confidence intervals of difference in time per subject. ‘Mean’ corresponds tomean and 95% confidence intervals over all trials and subjects.(a) RISP-Power - RISP-Round.(b) RISP-Thumb - RISP-Round.(c) RISP-Power - RISP-Thumb.
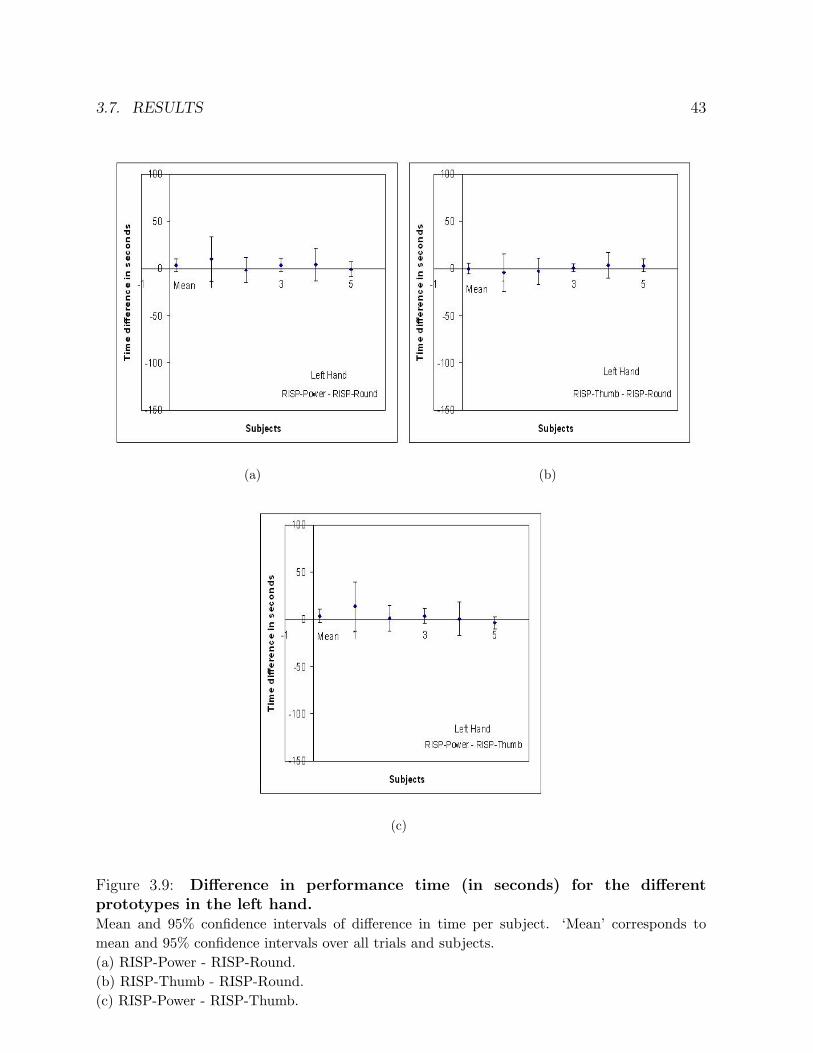
3.7. RESULTS 43
(a) (b)
(c)
Figure 3.9: Difference in performance time (in seconds) for the differentprototypes in the left hand.Mean and 95% confidence intervals of difference in time per subject. ‘Mean’ corresponds tomean and 95% confidence intervals over all trials and subjects.(a) RISP-Power - RISP-Round.(b) RISP-Thumb - RISP-Round.(c) RISP-Power - RISP-Thumb.
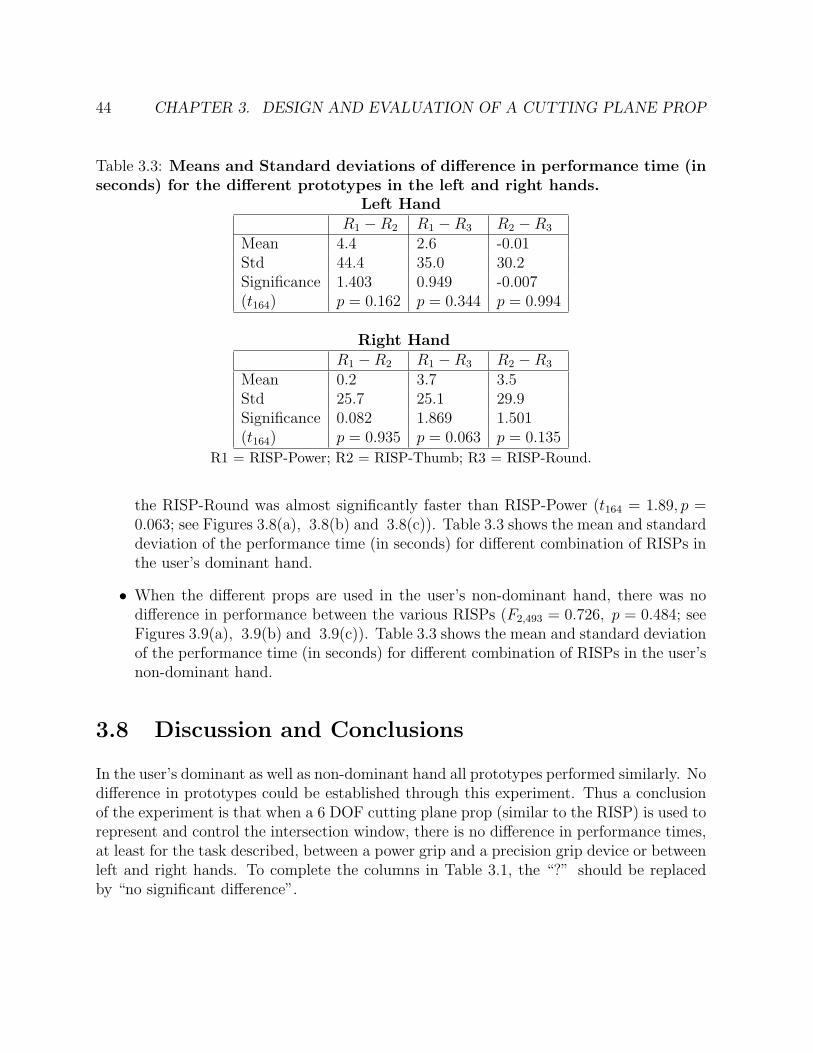
44 CHAPTER 3. DESIGN AND EVALUATION OF A CUTTING PLANE PROP
Table 3.3: Means and Standard deviations of difference in performance time (inseconds) for the different prototypes in the left and right hands.
Left HandR1 −R2 R1 −R3 R2 −R3
Mean 4.4 2.6 -0.01Std 44.4 35.0 30.2Significance 1.403 0.949 -0.007(t164) p = 0.162 p = 0.344 p = 0.994
Right HandR1 −R2 R1 −R3 R2 −R3
Mean 0.2 3.7 3.5Std 25.7 25.1 29.9Significance 0.082 1.869 1.501(t164) p = 0.935 p = 0.063 p = 0.135
R1 = RISP-Power; R2 = RISP-Thumb; R3 = RISP-Round.
the RISP-Round was almost significantly faster than RISP-Power (t164 = 1.89, p =0.063; see Figures 3.8(a), 3.8(b) and 3.8(c)). Table 3.3 shows the mean and standarddeviation of the performance time (in seconds) for different combination of RISPs inthe user’s dominant hand.
• When the different props are used in the user’s non-dominant hand, there was nodifference in performance between the various RISPs (F2,493 = 0.726, p = 0.484; seeFigures 3.9(a), 3.9(b) and 3.9(c)). Table 3.3 shows the mean and standard deviationof the performance time (in seconds) for different combination of RISPs in the user’snon-dominant hand.
3.8 Discussion and Conclusions
In the user’s dominant as well as non-dominant hand all prototypes performed similarly. Nodifference in prototypes could be established through this experiment. Thus a conclusionof the experiment is that when a 6 DOF cutting plane prop (similar to the RISP) is used torepresent and control the intersection window, there is no difference in performance times,at least for the task described, between a power grip and a precision grip device or betweenleft and right hands. To complete the columns in Table 3.1, the “?” should be replacedby “no significant difference”.
Chapter 4
Design and Evaluation ofConstrained 3D Tangible Interface
4.1 Introduction
Chapter 3 explored the use of an unconstrained 6 Degrees of Freedom (DOF) tangible3D intersection window. In other words, the user had simultaneous control of all 6 DOF.This chapter1 explores, through experimental evaluation, how to allocate control over thedifferent DOF. Is it better to provide unconstrained simultaneous control of all DOF (like inthe VIP) or constrain the available DOF to provide users with consecutive control of lowerDOF (like in the CMouse)? One consequence of constraining the user’s available continuousDOF is the creation of subtasks that require lower continuous DOF. These subtasks may beeffectively accomplished by using a 2D-input device rather than a 3D-input device. In sucha case, one would expect hybrid interfaces that allow handling a 3D-input device in onehand and a 2D-input device in the other hand to extend the user’s performance advantage.One of the outcomes of the experiment was that the users performed significantly fasterwith the consecutive controls than with the simultaneous control. The results suggest that,in cases where a choice has to be made, one should support consecutive control of location(3 DOF) and orientation (3 DOF) rather than simultaneous control of all 6 DOF.
The next section reviews relevant literature in handling multiple degrees of freedom andintroduces the idea of hybrid interfaces.
4.2 Handling Multiple Degrees of Freedom
It is common knowledge that it makes good sense to exploit task-specific needs to reduceDOF (Hinckley, Pausch, Goble, & Kassell, 1994b). For example, if the user’s task consists
1Appeared in Subramanian, Aliakseyeu, & Martens, (2003; “Empirical Evaluation of Hybrid 2D and3D Interfaces”, INTERACT 2003)
45
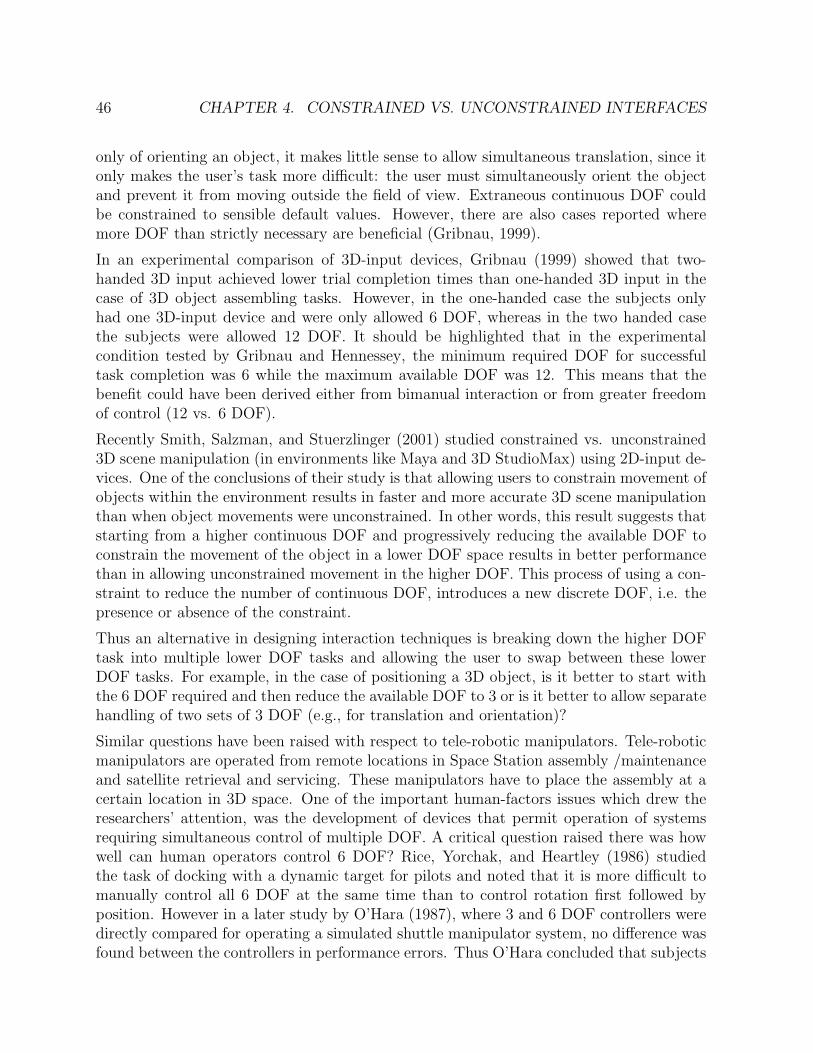
46 CHAPTER 4. CONSTRAINED VS. UNCONSTRAINED INTERFACES
only of orienting an object, it makes little sense to allow simultaneous translation, since itonly makes the user’s task more difficult: the user must simultaneously orient the objectand prevent it from moving outside the field of view. Extraneous continuous DOF couldbe constrained to sensible default values. However, there are also cases reported wheremore DOF than strictly necessary are beneficial (Gribnau, 1999).
In an experimental comparison of 3D-input devices, Gribnau (1999) showed that two-handed 3D input achieved lower trial completion times than one-handed 3D input in thecase of 3D object assembling tasks. However, in the one-handed case the subjects onlyhad one 3D-input device and were only allowed 6 DOF, whereas in the two handed casethe subjects were allowed 12 DOF. It should be highlighted that in the experimentalcondition tested by Gribnau and Hennessey, the minimum required DOF for successfultask completion was 6 while the maximum available DOF was 12. This means that thebenefit could have been derived either from bimanual interaction or from greater freedomof control (12 vs. 6 DOF).
Recently Smith, Salzman, and Stuerzlinger (2001) studied constrained vs. unconstrained3D scene manipulation (in environments like Maya and 3D StudioMax) using 2D-input de-vices. One of the conclusions of their study is that allowing users to constrain movement ofobjects within the environment results in faster and more accurate 3D scene manipulationthan when object movements were unconstrained. In other words, this result suggests thatstarting from a higher continuous DOF and progressively reducing the available DOF toconstrain the movement of the object in a lower DOF space results in better performancethan in allowing unconstrained movement in the higher DOF. This process of using a con-straint to reduce the number of continuous DOF, introduces a new discrete DOF, i.e. thepresence or absence of the constraint.
Thus an alternative in designing interaction techniques is breaking down the higher DOFtask into multiple lower DOF tasks and allowing the user to swap between these lowerDOF tasks. For example, in the case of positioning a 3D object, is it better to start withthe 6 DOF required and then reduce the available DOF to 3 or is it better to allow separatehandling of two sets of 3 DOF (e.g., for translation and orientation)?
Similar questions have been raised with respect to tele-robotic manipulators. Tele-roboticmanipulators are operated from remote locations in Space Station assembly /maintenanceand satellite retrieval and servicing. These manipulators have to place the assembly at acertain location in 3D space. One of the important human-factors issues which drew theresearchers’ attention, was the development of devices that permit operation of systemsrequiring simultaneous control of multiple DOF. A critical question raised there was howwell can human operators control 6 DOF? Rice, Yorchak, and Heartley (1986) studiedthe task of docking with a dynamic target for pilots and noted that it is more difficult tomanually control all 6 DOF at the same time than to control rotation first followed byposition. However in a later study by O’Hara (1987), where 3 and 6 DOF controllers weredirectly compared for operating a simulated shuttle manipulator system, no difference wasfound between the controllers in performance errors. Thus O’Hara concluded that subjects
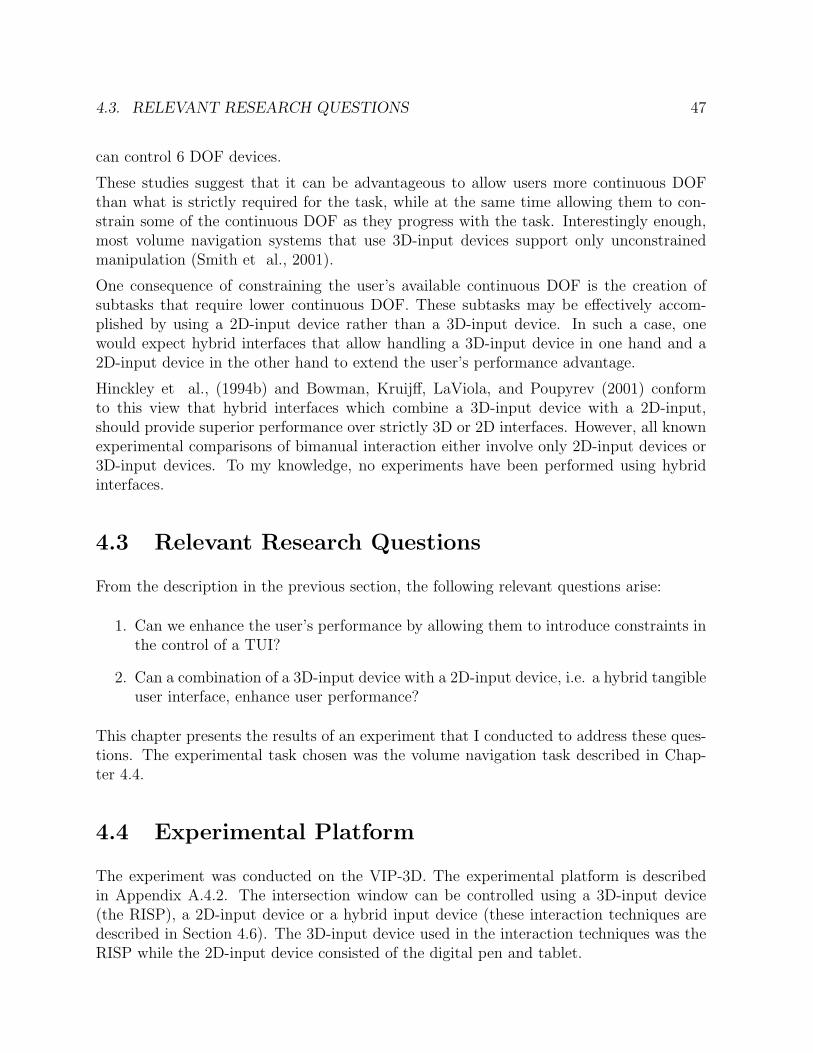
4.3. RELEVANT RESEARCH QUESTIONS 47
can control 6 DOF devices.
These studies suggest that it can be advantageous to allow users more continuous DOFthan what is strictly required for the task, while at the same time allowing them to con-strain some of the continuous DOF as they progress with the task. Interestingly enough,most volume navigation systems that use 3D-input devices support only unconstrainedmanipulation (Smith et al., 2001).
One consequence of constraining the user’s available continuous DOF is the creation ofsubtasks that require lower continuous DOF. These subtasks may be effectively accom-plished by using a 2D-input device rather than a 3D-input device. In such a case, onewould expect hybrid interfaces that allow handling a 3D-input device in one hand and a2D-input device in the other hand to extend the user’s performance advantage.
Hinckley et al., (1994b) and Bowman, Kruijff, LaViola, and Poupyrev (2001) conformto this view that hybrid interfaces which combine a 3D-input device with a 2D-input,should provide superior performance over strictly 3D or 2D interfaces. However, all knownexperimental comparisons of bimanual interaction either involve only 2D-input devices or3D-input devices. To my knowledge, no experiments have been performed using hybridinterfaces.
4.3 Relevant Research Questions
From the description in the previous section, the following relevant questions arise:
1. Can we enhance the user’s performance by allowing them to introduce constraints inthe control of a TUI?
2. Can a combination of a 3D-input device with a 2D-input device, i.e. a hybrid tangibleuser interface, enhance user performance?
This chapter presents the results of an experiment that I conducted to address these ques-tions. The experimental task chosen was the volume navigation task described in Chap-ter 4.4.
4.4 Experimental Platform
The experiment was conducted on the VIP-3D. The experimental platform is describedin Appendix A.4.2. The intersection window can be controlled using a 3D-input device(the RISP), a 2D-input device or a hybrid input device (these interaction techniques aredescribed in Section 4.6). The 3D-input device used in the interaction techniques was theRISP while the 2D-input device consisted of the digital pen and tablet.
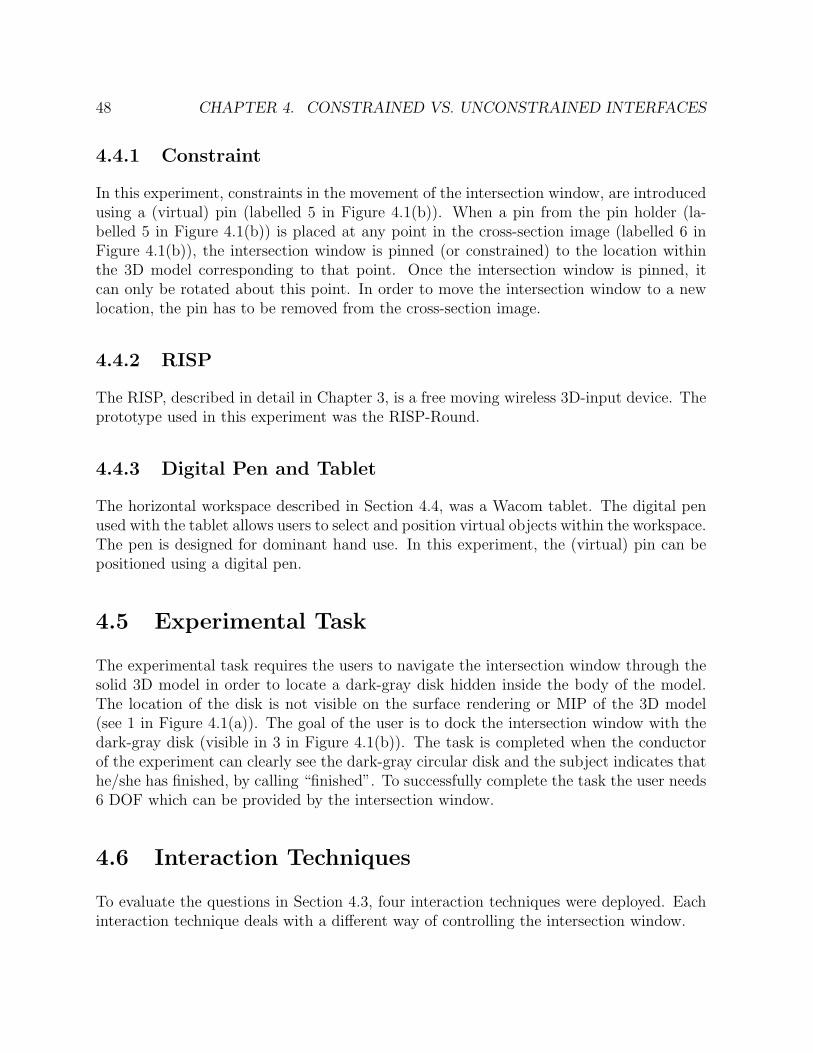
48 CHAPTER 4. CONSTRAINED VS. UNCONSTRAINED INTERFACES
4.4.1 Constraint
In this experiment, constraints in the movement of the intersection window, are introducedusing a (virtual) pin (labelled 5 in Figure 4.1(b)). When a pin from the pin holder (la-belled 5 in Figure 4.1(b)) is placed at any point in the cross-section image (labelled 6 inFigure 4.1(b)), the intersection window is pinned (or constrained) to the location withinthe 3D model corresponding to that point. Once the intersection window is pinned, itcan only be rotated about this point. In order to move the intersection window to a newlocation, the pin has to be removed from the cross-section image.
4.4.2 RISP
The RISP, described in detail in Chapter 3, is a free moving wireless 3D-input device. Theprototype used in this experiment was the RISP-Round.
4.4.3 Digital Pen and Tablet
The horizontal workspace described in Section 4.4, was a Wacom tablet. The digital penused with the tablet allows users to select and position virtual objects within the workspace.The pen is designed for dominant hand use. In this experiment, the (virtual) pin can bepositioned using a digital pen.
4.5 Experimental Task
The experimental task requires the users to navigate the intersection window through thesolid 3D model in order to locate a dark-gray disk hidden inside the body of the model.The location of the disk is not visible on the surface rendering or MIP of the 3D model(see 1 in Figure 4.1(a)). The goal of the user is to dock the intersection window with thedark-gray disk (visible in 3 in Figure 4.1(b)). The task is completed when the conductorof the experiment can clearly see the dark-gray circular disk and the subject indicates thathe/she has finished, by calling “finished”. To successfully complete the task the user needs6 DOF which can be provided by the intersection window.
4.6 Interaction Techniques
To evaluate the questions in Section 4.3, four interaction techniques were deployed. Eachinteraction technique deals with a different way of controlling the intersection window.
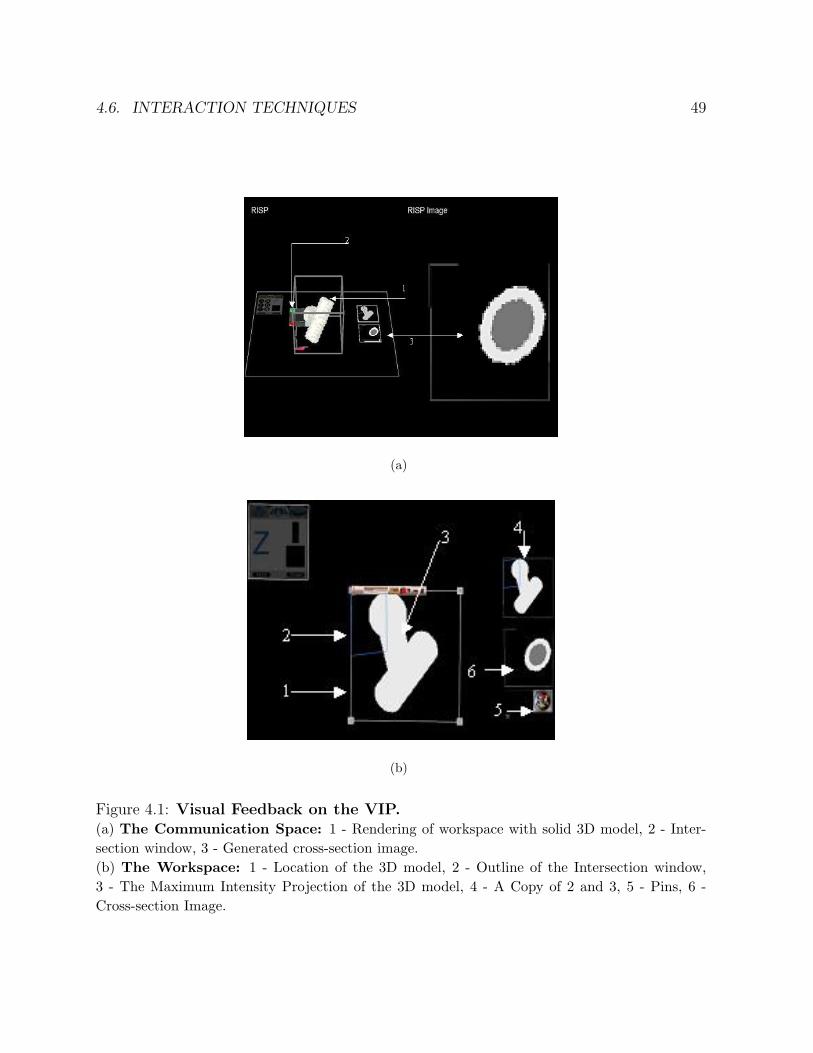
4.6. INTERACTION TECHNIQUES 49
(a)
(b)
Figure 4.1: Visual Feedback on the VIP.(a) The Communication Space: 1 - Rendering of workspace with solid 3D model, 2 - Inter-section window, 3 - Generated cross-section image.(b) The Workspace: 1 - Location of the 3D model, 2 - Outline of the Intersection window,3 - The Maximum Intensity Projection of the 3D model, 4 - A Copy of 2 and 3, 5 - Pins, 6 -Cross-section Image.
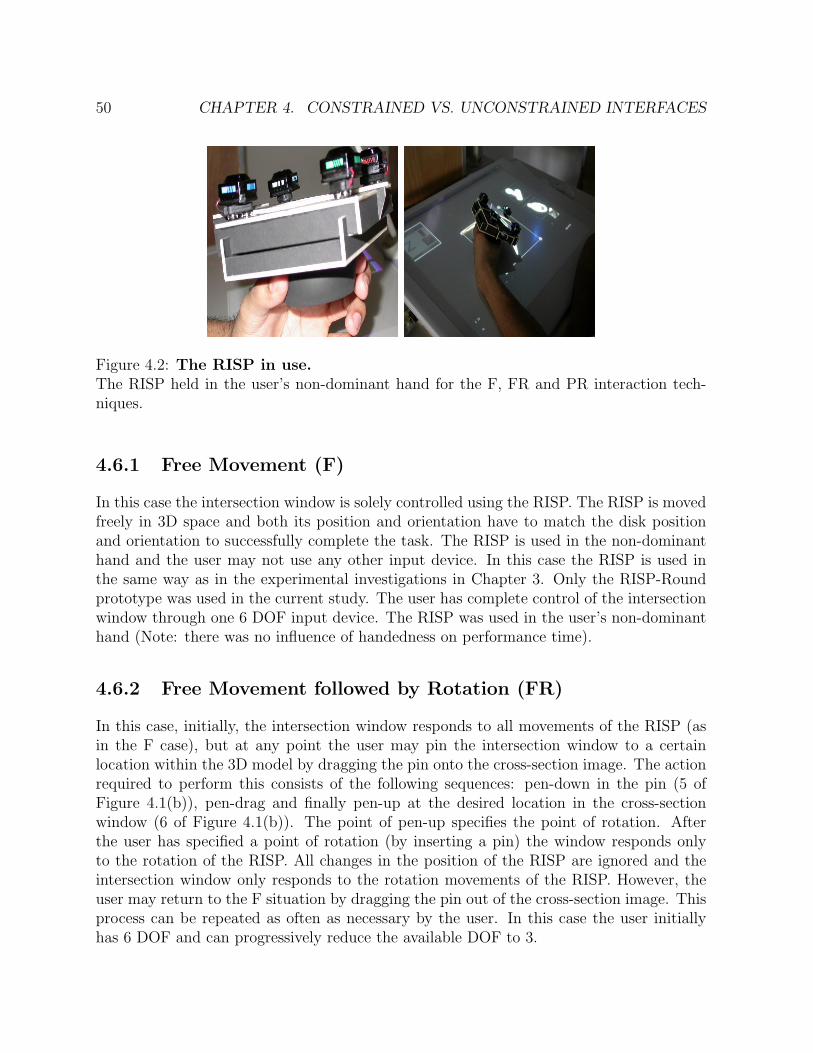
50 CHAPTER 4. CONSTRAINED VS. UNCONSTRAINED INTERFACES
Figure 4.2: The RISP in use.The RISP held in the user’s non-dominant hand for the F, FR and PR interaction tech-niques.
4.6.1 Free Movement (F)
In this case the intersection window is solely controlled using the RISP. The RISP is movedfreely in 3D space and both its position and orientation have to match the disk positionand orientation to successfully complete the task. The RISP is used in the non-dominanthand and the user may not use any other input device. In this case the RISP is used inthe same way as in the experimental investigations in Chapter 3. Only the RISP-Roundprototype was used in the current study. The user has complete control of the intersectionwindow through one 6 DOF input device. The RISP was used in the user’s non-dominanthand (Note: there was no influence of handedness on performance time).
4.6.2 Free Movement followed by Rotation (FR)
In this case, initially, the intersection window responds to all movements of the RISP (asin the F case), but at any point the user may pin the intersection window to a certainlocation within the 3D model by dragging the pin onto the cross-section image. The actionrequired to perform this consists of the following sequences: pen-down in the pin (5 ofFigure 4.1(b)), pen-drag and finally pen-up at the desired location in the cross-sectionwindow (6 of Figure 4.1(b)). The point of pen-up specifies the point of rotation. Afterthe user has specified a point of rotation (by inserting a pin) the window responds onlyto the rotation of the RISP. All changes in the position of the RISP are ignored and theintersection window only responds to the rotation movements of the RISP. However, theuser may return to the F situation by dragging the pin out of the cross-section image. Thisprocess can be repeated as often as necessary by the user. In this case the user initiallyhas 6 DOF and can progressively reduce the available DOF to 3.
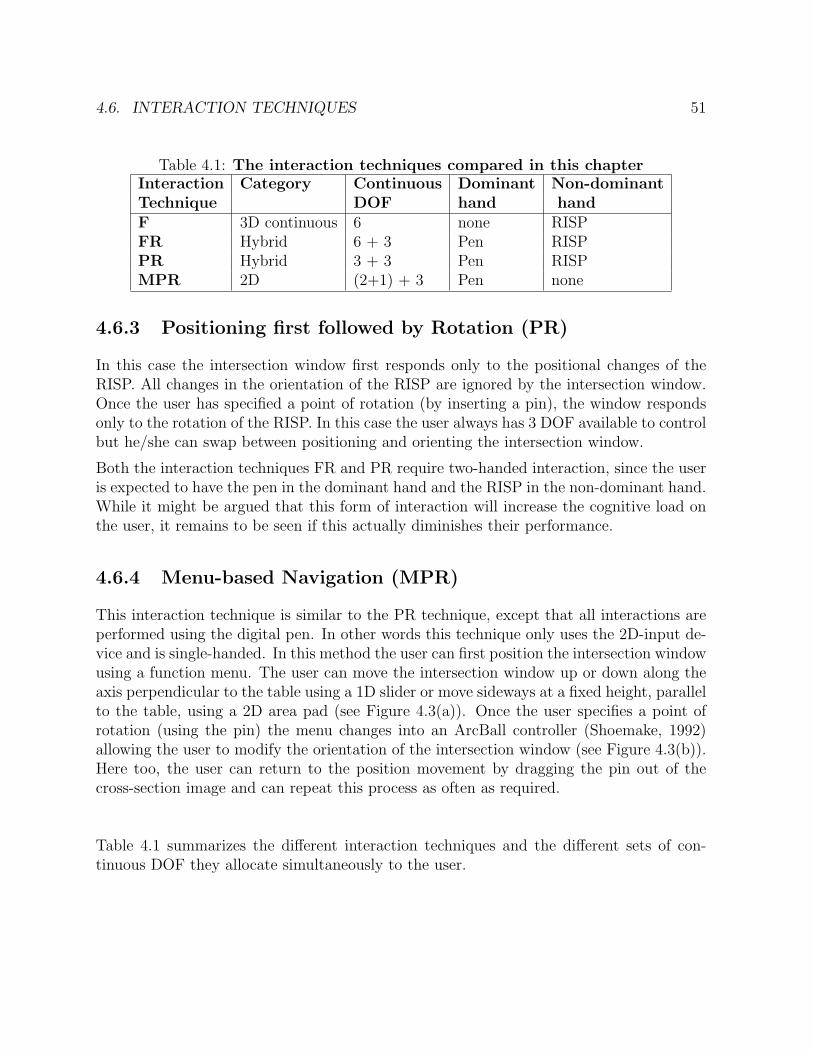
4.6. INTERACTION TECHNIQUES 51
Table 4.1: The interaction techniques compared in this chapterInteraction Category Continuous Dominant Non-dominantTechnique DOF hand handF 3D continuous 6 none RISPFR Hybrid 6 + 3 Pen RISPPR Hybrid 3 + 3 Pen RISPMPR 2D (2+1) + 3 Pen none
4.6.3 Positioning first followed by Rotation (PR)
In this case the intersection window first responds only to the positional changes of theRISP. All changes in the orientation of the RISP are ignored by the intersection window.Once the user has specified a point of rotation (by inserting a pin), the window respondsonly to the rotation of the RISP. In this case the user always has 3 DOF available to controlbut he/she can swap between positioning and orienting the intersection window.
Both the interaction techniques FR and PR require two-handed interaction, since the useris expected to have the pen in the dominant hand and the RISP in the non-dominant hand.While it might be argued that this form of interaction will increase the cognitive load onthe user, it remains to be seen if this actually diminishes their performance.
4.6.4 Menu-based Navigation (MPR)
This interaction technique is similar to the PR technique, except that all interactions areperformed using the digital pen. In other words this technique only uses the 2D-input de-vice and is single-handed. In this method the user can first position the intersection windowusing a function menu. The user can move the intersection window up or down along theaxis perpendicular to the table using a 1D slider or move sideways at a fixed height, parallelto the table, using a 2D area pad (see Figure 4.3(a)). Once the user specifies a point ofrotation (using the pin) the menu changes into an ArcBall controller (Shoemake, 1992)allowing the user to modify the orientation of the intersection window (see Figure 4.3(b)).Here too, the user can return to the position movement by dragging the pin out of thecross-section image and can repeat this process as often as required.
Table 4.1 summarizes the different interaction techniques and the different sets of con-tinuous DOF they allocate simultaneously to the user.
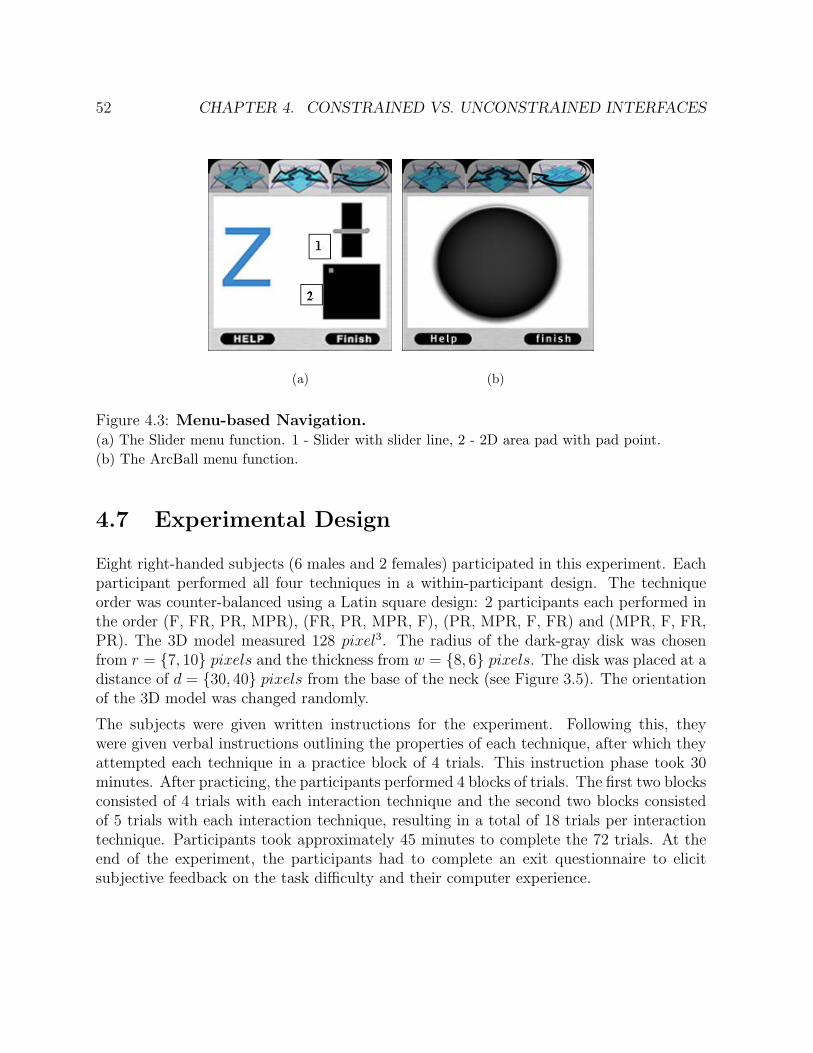
52 CHAPTER 4. CONSTRAINED VS. UNCONSTRAINED INTERFACES
(a) (b)
Figure 4.3: Menu-based Navigation.(a) The Slider menu function. 1 - Slider with slider line, 2 - 2D area pad with pad point.(b) The ArcBall menu function.
4.7 Experimental Design
Eight right-handed subjects (6 males and 2 females) participated in this experiment. Eachparticipant performed all four techniques in a within-participant design. The techniqueorder was counter-balanced using a Latin square design: 2 participants each performed inthe order (F, FR, PR, MPR), (FR, PR, MPR, F), (PR, MPR, F, FR) and (MPR, F, FR,PR). The 3D model measured 128 pixel3. The radius of the dark-gray disk was chosenfrom r = {7, 10} pixels and the thickness from w = {8, 6} pixels. The disk was placed at adistance of d = {30, 40} pixels from the base of the neck (see Figure 3.5). The orientationof the 3D model was changed randomly.
The subjects were given written instructions for the experiment. Following this, theywere given verbal instructions outlining the properties of each technique, after which theyattempted each technique in a practice block of 4 trials. This instruction phase took 30minutes. After practicing, the participants performed 4 blocks of trials. The first two blocksconsisted of 4 trials with each interaction technique and the second two blocks consistedof 5 trials with each interaction technique, resulting in a total of 18 trials per interactiontechnique. Participants took approximately 45 minutes to complete the 72 trials. At theend of the experiment, the participants had to complete an exit questionnaire to elicitsubjective feedback on the task difficulty and their computer experience.
4.8. RESULTS 53
Table 4.2: Mean and standard deviation of performance time for the differentinteraction techniques.
F FR PR MPRMean 20.09 16.37 12.65 16.17Std 8.58 7.85 6.52 7.42
4.8 Results
The total trial time was used as the primary measure of performance. Figure 4.4 showsthe cumulative probability distribution of time for the different interaction techniques. Ta-ble 6.1 shows the means and standard deviations of the completion times for the differentinteraction techniques. Figures 4.5(a) - 4.6(b) show the mean with 95% confidence inter-vals of difference in time for various pairs of interaction techniques both per subject and pertrial. There was an overall significant difference in the means (F3,572 = 14.14, p < 0.001).The unconstrained free movement (F) was the slowest of the different interaction tech-niques, whereas starting with positioning followed by rotating (PR) was the fastest.
With respect to the questions raised in Section 4.3, the following inferences can be drawnfrom this experiment for the volume navigation task:
• Can we enhance the user’s performance (as defined by trial times) by allowing themto introduce constraints in the control of a TUI?
FR vs F The unconstrained 3D-input device used in the free movement interactiontechnique (F) performs poorly when compared to starting with higher DOFand then moving down to lower DOF using a hybrid interaction technique (FR)(t143 = 16.605, p < 0.001; see Figure 4.5(a)).
F vs PR The unconstrained 3D-input device used in the free movement interactiontechnique (F) performs poorly when compared to swapping between lower DOFtasks using a hybrid interaction technique (PR) (t143 = 17.462, p < 0.001; seeFigure 4.5(b)).
F vs MPR The unconstrained 3D-input device used in the free movement inter-action technique (F) performs poorly when compared to the constrained 2Dinteraction technique (MPR) (t143 = 16.793, p < 0.001; see Figure 4.5(c)).
These results confirm that trial times can be improved by allowing users to dynami-cally constrain the available continuous DOF of a TUI.
• Can a hybrid TUI, enhance user performance (as defined by trial times)?
FR vs MPR Starting with higher DOF and then moving down to lower DOFusing a hybrid interaction technique (FR) results in similar performance asswapping between lower DOF tasks using 2D interaction techniques (MPR)(t143 = 1.099, p = 0.274; see Figure 4.6(a)).
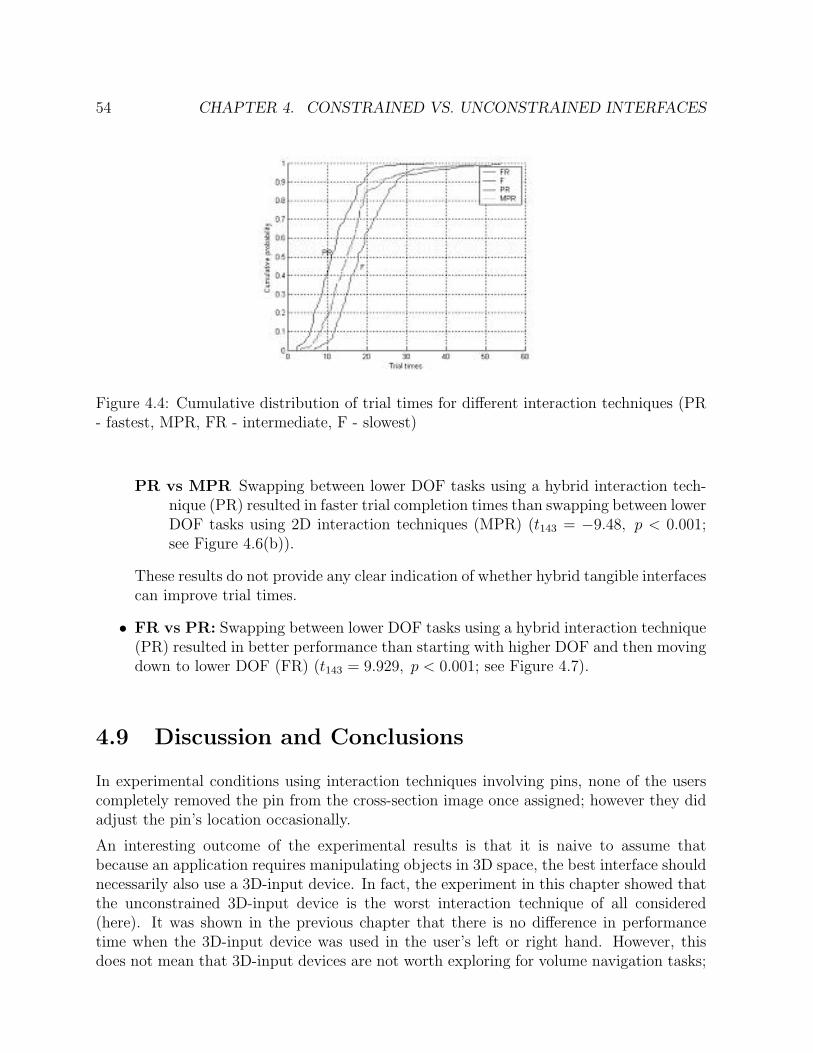
54 CHAPTER 4. CONSTRAINED VS. UNCONSTRAINED INTERFACES
Figure 4.4: Cumulative distribution of trial times for different interaction techniques (PR- fastest, MPR, FR - intermediate, F - slowest)
PR vs MPR Swapping between lower DOF tasks using a hybrid interaction tech-nique (PR) resulted in faster trial completion times than swapping between lowerDOF tasks using 2D interaction techniques (MPR) (t143 = −9.48, p < 0.001;see Figure 4.6(b)).
These results do not provide any clear indication of whether hybrid tangible interfacescan improve trial times.
• FR vs PR: Swapping between lower DOF tasks using a hybrid interaction technique(PR) resulted in better performance than starting with higher DOF and then movingdown to lower DOF (FR) (t143 = 9.929, p < 0.001; see Figure 4.7).
4.9 Discussion and Conclusions
In experimental conditions using interaction techniques involving pins, none of the userscompletely removed the pin from the cross-section image once assigned; however they didadjust the pin’s location occasionally.
An interesting outcome of the experimental results is that it is naive to assume thatbecause an application requires manipulating objects in 3D space, the best interface shouldnecessarily also use a 3D-input device. In fact, the experiment in this chapter showed thatthe unconstrained 3D-input device is the worst interaction technique of all considered(here). It was shown in the previous chapter that there is no difference in performancetime when the 3D-input device was used in the user’s left or right hand. However, thisdoes not mean that 3D-input devices are not worth exploring for volume navigation tasks;
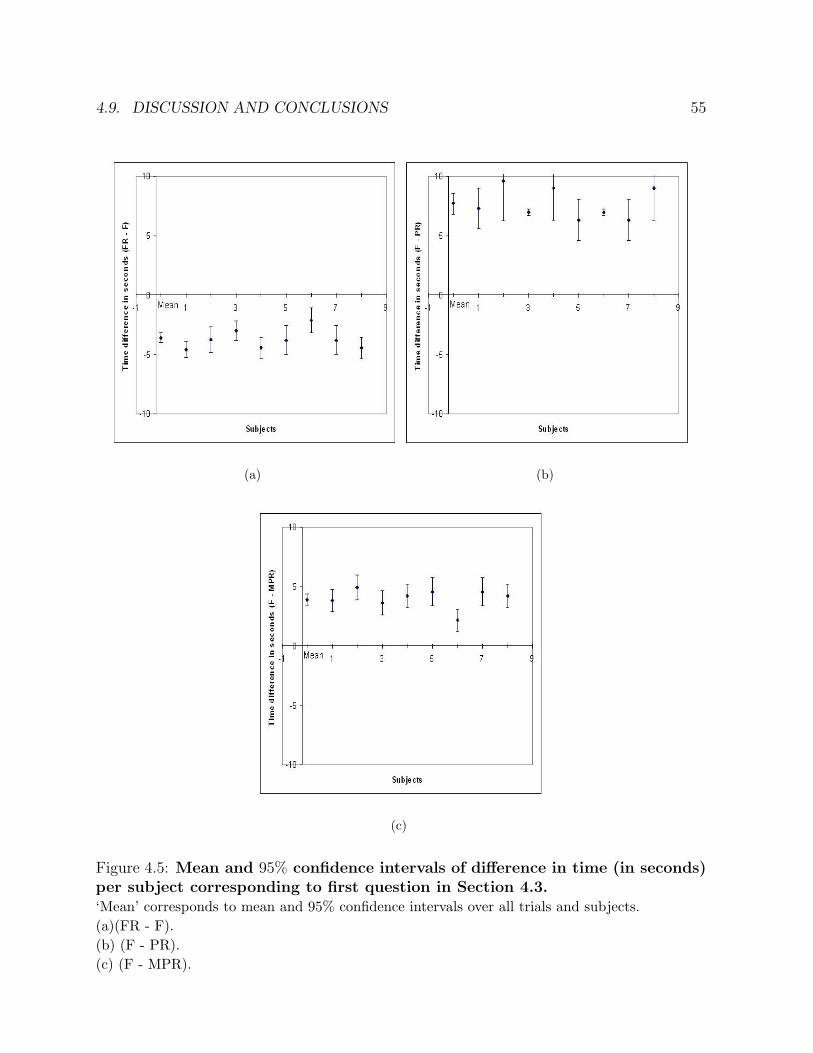
4.9. DISCUSSION AND CONCLUSIONS 55
(a) (b)
(c)
Figure 4.5: Mean and 95% confidence intervals of difference in time (in seconds)per subject corresponding to first question in Section 4.3.‘Mean’ corresponds to mean and 95% confidence intervals over all trials and subjects.(a)(FR - F).(b) (F - PR).(c) (F - MPR).
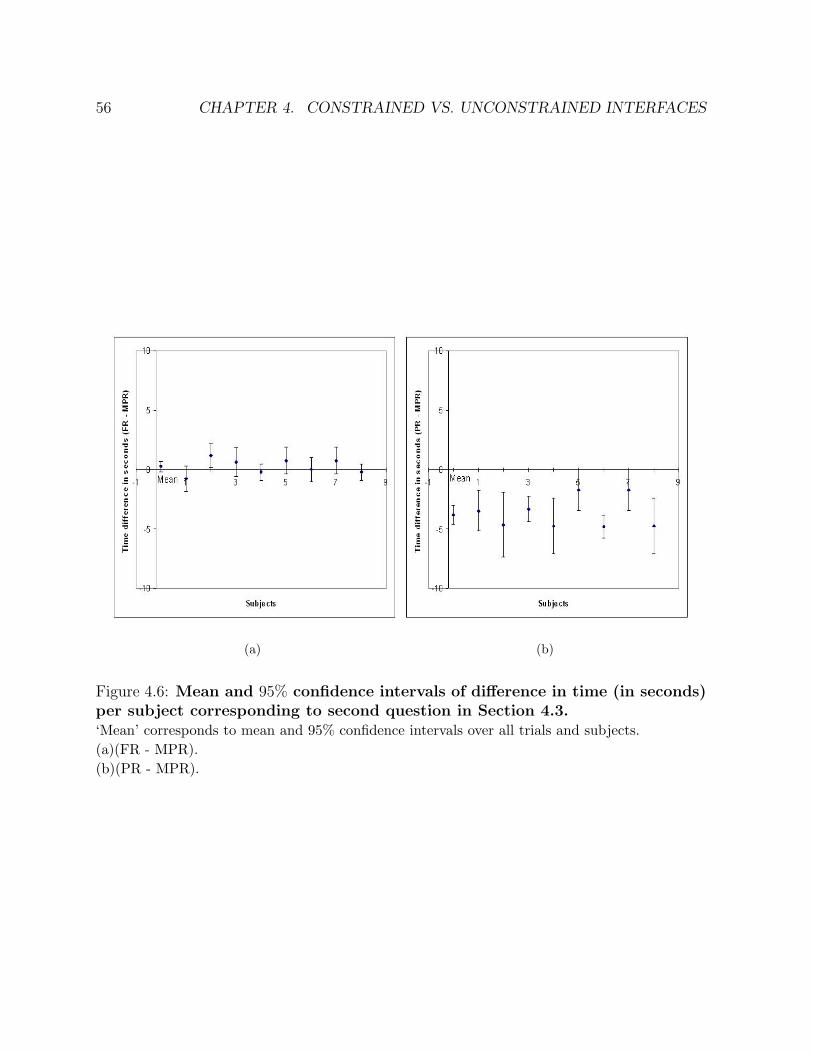
56 CHAPTER 4. CONSTRAINED VS. UNCONSTRAINED INTERFACES
(a) (b)
Figure 4.6: Mean and 95% confidence intervals of difference in time (in seconds)per subject corresponding to second question in Section 4.3.‘Mean’ corresponds to mean and 95% confidence intervals over all trials and subjects.(a)(FR - MPR).(b)(PR - MPR).
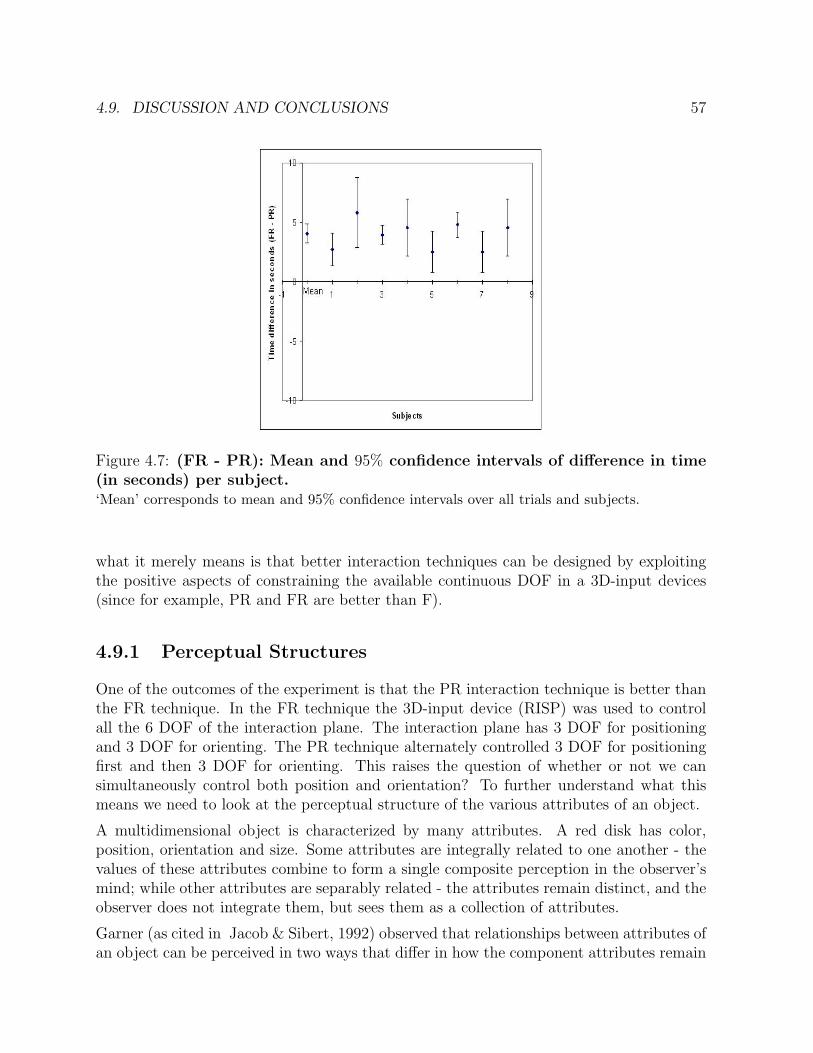
4.9. DISCUSSION AND CONCLUSIONS 57
Figure 4.7: (FR - PR): Mean and 95% confidence intervals of difference in time(in seconds) per subject.‘Mean’ corresponds to mean and 95% confidence intervals over all trials and subjects.
what it merely means is that better interaction techniques can be designed by exploitingthe positive aspects of constraining the available continuous DOF in a 3D-input devices(since for example, PR and FR are better than F).
4.9.1 Perceptual Structures
One of the outcomes of the experiment is that the PR interaction technique is better thanthe FR technique. In the FR technique the 3D-input device (RISP) was used to controlall the 6 DOF of the interaction plane. The interaction plane has 3 DOF for positioningand 3 DOF for orienting. The PR technique alternately controlled 3 DOF for positioningfirst and then 3 DOF for orienting. This raises the question of whether or not we cansimultaneously control both position and orientation? To further understand what thismeans we need to look at the perceptual structure of the various attributes of an object.
A multidimensional object is characterized by many attributes. A red disk has color,position, orientation and size. Some attributes are integrally related to one another - thevalues of these attributes combine to form a single composite perception in the observer’smind; while other attributes are separably related - the attributes remain distinct, and theobserver does not integrate them, but sees them as a collection of attributes.
Garner (as cited in Jacob & Sibert, 1992) observed that relationships between attributes ofan object can be perceived in two ways that differ in how the component attributes remain
58 CHAPTER 4. CONSTRAINED VS. UNCONSTRAINED INTERFACES
identifiable. For example, different colors (with different brightness, hue and saturation)are perceived integrally, while shape and color are perceived separably. This leads to twoclasses of perceptual space, one whose coordinate axes are perceived integrally and one,separably, although there is really a continuum rather than a sharp dichotomy (Jacob &Sibert, 1992). There is a clear relationship between attributes and DOF. Each attributehas a set of DOF. Thus the attribute of color has 3 DOF (brightness, hue and saturation),position 3 DOF etc. This means that it might not be enough for the designer to knowthat a logical task requires the control of 4 DOF (for example), but should also know ifthe intended user perceives these DOF as related or independent. Related attributes canbe assigned to a single input device, whereas assigning independent attributes to the sameinput device can be confusing and misleading to the user (Hinckley et al., 1994b).
The question here is whether position and orientation (in 3D space) are perceived asintegrated attributes or are perceived as independent attributes. Many researchers haveargued both for and against them being integrated attributes. For example, O’Hara (1987)contradicts Rice et al., (1986), by saying that users can indeed control these two attributesthrough one input device suggesting that perhaps these are integral attributes. But recentlyMasliah and Milgram (2000), demonstrated in his experiment that subjects consistentlyfirst position and then orient, thereby contradicting O’Hara, (1987) and suggesting thatposition and orientation are independent attributes. Of course, the experimental tasks andthe input devices used were different in each of these studies.
Our experimental results are in agreement with others (Masliah & Milgram, 2000; Riceet al., 1986) and suggest that subjects indeed do not perceive position and orientationas an integrated attribute in 3D space. This is evident from the fact that the F and FRtechniques performed poorly when compared to the PR technique.
Chapter 5
Redesign of the VIP
5.1 Introduction
The goal of redesigning1 the existing VIP system is to create a new system in which weapply some of the lessons learnt from the analysis in Section 2.4 and combine them withthe results from user evaluations performed in Chapters 3 and 4 on aspects of tangiblecontinuous interaction systems.
The design issues identified can be summarized as follows:
Address The physical space that is being tracked by our system is only weakly delineated,i.e. only for the 2D interactions and only with (weak) visual cues. Furthermore, thephysical space that can be addressed for 3D interaction is not explicitly visible to theuser. Hence, it may be worthwhile to explore designs that offer much stronger cuesin this respect.
Attention Only limited (or even no) feedback is provided to the user to confirm that theinteraction devices presented within the interaction space of the system are indeeddetected (and tracked). In cases, where more feedback is provided, it needs to bedecided if such feedback will be offered continuously or only when the interaction de-vices enter or leave the interaction space (and/or when tracking is lost or regained).Other issues are whether or not this feedback should be provided for all availableinteraction devices, or only for a subset of them, and whether or not the feedbackshould allow identifying the device concerned. The most appropriate modality (vi-sual, auditory, tactile) and the location (on the system display or on the device) forproviding the feedback also needs to be decided.
Action It seems especially interesting to attack the “cup of tea” syndrome, the inaccuratetask completion aspects and the flexible coupling of interaction elements to virtual
1Submitted to Journal of Personal and Ubiquitous Computing, Springer.
59
60 CHAPTER 5. REDESIGN OF THE VIP
objects. Moreover, it should be at least possible to break down higher DOF tasksinto multiple lower DOF tasks. One of the outcomes of Chapter 4 was that the usersperformed significantly faster with the consecutive controls than with the simulta-neous control. The results of our experiment suggest that, in cases where a choicehas to be made, one should support consecutive control of location (3 DOF) andorientation (3 DOF) rather than simultaneous control of both.
Alignment The major question here is on how to strengthen and maintain the close linkbetween physical and virtual representations. Improved tracking and calibration,as well as more suitable form factors for the interaction devices, play an importantrole in this respect. There exists an obvious conflicting demand between “generic”interaction devices that can perform multiple functions, and “specific” interactiondevices whose physical shape and size closely match the virtual objects that theycontrol.
Accident The system should, as much as possible, assist the user in avoiding, detectingand resolving misunderstandings. Some misunderstandings can be avoided by incor-porating physical constraints. Such constraints can for instance make it more difficult(or even impossible) to move interaction devices outside the range of where they canbe (reliably) detected. Some of the additional feedback mechanisms mentioned abovecan also assist in diagnosing the cause of a misunderstanding, and hence can help tounderstand how the misunderstanding might be resolved.
The above lessons are mainly formulated as questions (design decisions to be taken), and itis not obvious in all cases if and to which extent the implied guidelines should be adopted.This is partly a consequence of the fact that some of the above guidelines may be conflicting.For instance, delineating the tracking space with tangible borders may complicate or slowdown the actions being performed in this space. Moreover, providing too much feedbackmay distract from the task to be performed. Therefore, in the design that we will presentbelow, many of the new elements that we will introduce are optional at this stage, i.e. theycan easily be introduced or removed by the user. In this way, we will obtain more insightsinto the benefits and side effects of the added elements.
5.2 Tangible Volume Navigation System
The Tangible Volume Navigation System is presented as a preliminary redesign of theVIP with more tangible representation and stronger integration between the tangible andintangible representations. The redesign is presented in the form of sketches with manydetailed design decisions still open. It is intended as an illustration of how some of theidentified design issues could be accommodated. After describing the design process todate, the manner in which the redesigned system resolves the issues on social intelligenceis presented in Section5.2.2.
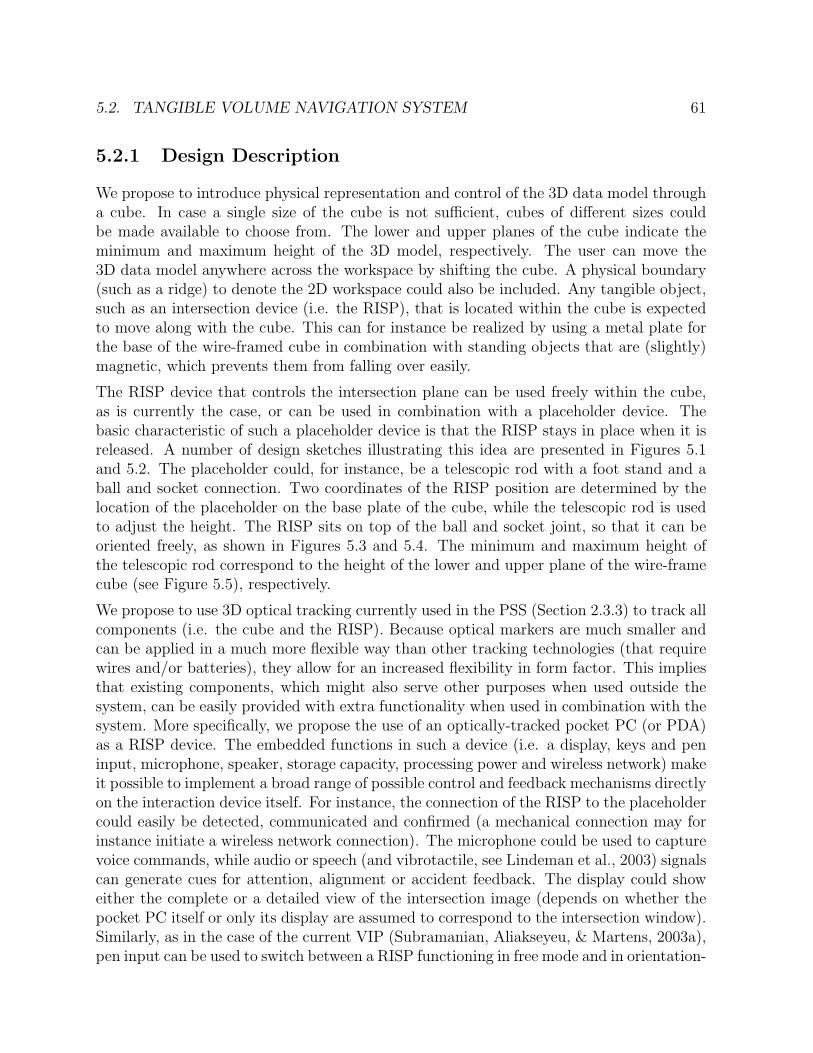
5.2. TANGIBLE VOLUME NAVIGATION SYSTEM 61
5.2.1 Design Description
We propose to introduce physical representation and control of the 3D data model througha cube. In case a single size of the cube is not sufficient, cubes of different sizes couldbe made available to choose from. The lower and upper planes of the cube indicate theminimum and maximum height of the 3D model, respectively. The user can move the3D data model anywhere across the workspace by shifting the cube. A physical boundary(such as a ridge) to denote the 2D workspace could also be included. Any tangible object,such as an intersection device (i.e. the RISP), that is located within the cube is expectedto move along with the cube. This can for instance be realized by using a metal plate forthe base of the wire-framed cube in combination with standing objects that are (slightly)magnetic, which prevents them from falling over easily.
The RISP device that controls the intersection plane can be used freely within the cube,as is currently the case, or can be used in combination with a placeholder device. Thebasic characteristic of such a placeholder device is that the RISP stays in place when it isreleased. A number of design sketches illustrating this idea are presented in Figures 5.1and 5.2. The placeholder could, for instance, be a telescopic rod with a foot stand and aball and socket connection. Two coordinates of the RISP position are determined by thelocation of the placeholder on the base plate of the cube, while the telescopic rod is usedto adjust the height. The RISP sits on top of the ball and socket joint, so that it can beoriented freely, as shown in Figures 5.3 and 5.4. The minimum and maximum height ofthe telescopic rod correspond to the height of the lower and upper plane of the wire-framecube (see Figure 5.5), respectively.
We propose to use 3D optical tracking currently used in the PSS (Section 2.3.3) to track allcomponents (i.e. the cube and the RISP). Because optical markers are much smaller andcan be applied in a much more flexible way than other tracking technologies (that requirewires and/or batteries), they allow for an increased flexibility in form factor. This impliesthat existing components, which might also serve other purposes when used outside thesystem, can be easily provided with extra functionality when used in combination with thesystem. More specifically, we propose the use of an optically-tracked pocket PC (or PDA)as a RISP device. The embedded functions in such a device (i.e. a display, keys and peninput, microphone, speaker, storage capacity, processing power and wireless network) makeit possible to implement a broad range of possible control and feedback mechanisms directlyon the interaction device itself. For instance, the connection of the RISP to the placeholdercould easily be detected, communicated and confirmed (a mechanical connection may forinstance initiate a wireless network connection). The microphone could be used to capturevoice commands, while audio or speech (and vibrotactile, see Lindeman et al., 2003) signalscan generate cues for attention, alignment or accident feedback. The display could showeither the complete or a detailed view of the intersection image (depends on whether thepocket PC itself or only its display are assumed to correspond to the intersection window).Similarly, as in the case of the current VIP (Subramanian, Aliakseyeu, & Martens, 2003a),pen input can be used to switch between a RISP functioning in free mode and in orientation-
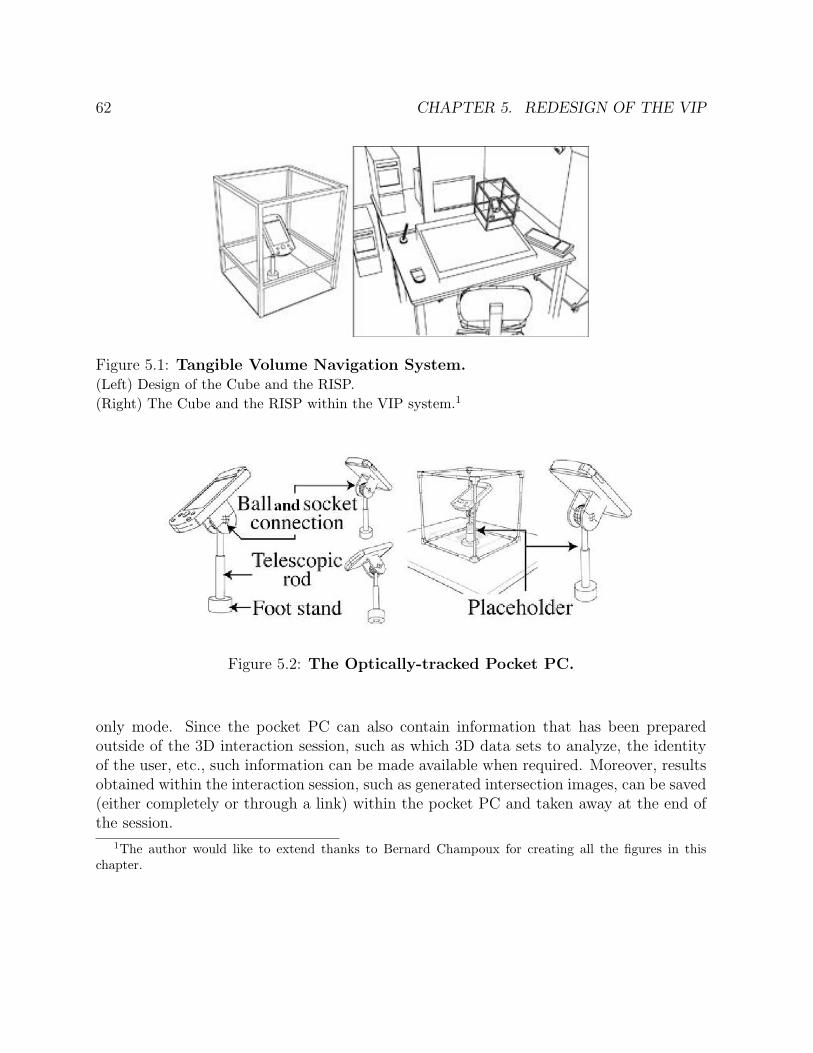
62 CHAPTER 5. REDESIGN OF THE VIP
Figure 5.1: Tangible Volume Navigation System.(Left) Design of the Cube and the RISP.(Right) The Cube and the RISP within the VIP system.1
Figure 5.2: The Optically-tracked Pocket PC.
only mode. Since the pocket PC can also contain information that has been preparedoutside of the 3D interaction session, such as which 3D data sets to analyze, the identityof the user, etc., such information can be made available when required. Moreover, resultsobtained within the interaction session, such as generated intersection images, can be saved(either completely or through a link) within the pocket PC and taken away at the end ofthe session.
1The author would like to extend thanks to Bernard Champoux for creating all the figures in thischapter.
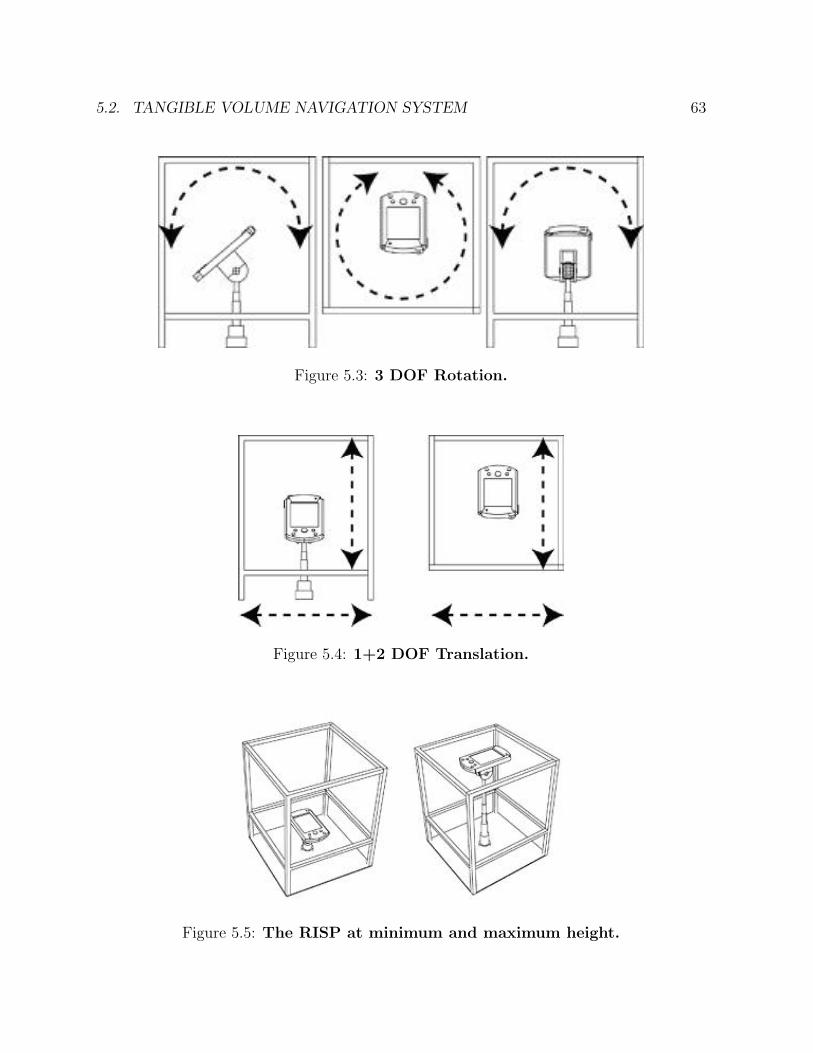
5.2. TANGIBLE VOLUME NAVIGATION SYSTEM 63
Figure 5.3: 3 DOF Rotation.
Figure 5.4: 1+2 DOF Translation.
Figure 5.5: The RISP at minimum and maximum height.
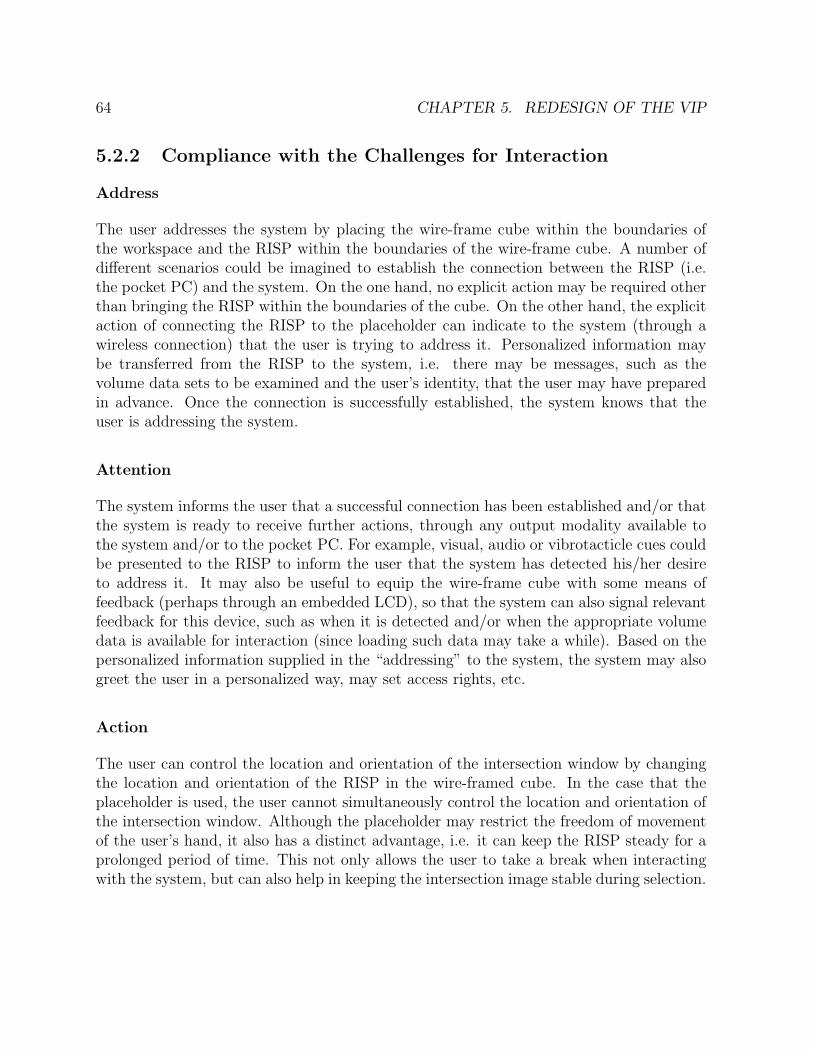
64 CHAPTER 5. REDESIGN OF THE VIP
5.2.2 Compliance with the Challenges for Interaction
Address
The user addresses the system by placing the wire-frame cube within the boundaries ofthe workspace and the RISP within the boundaries of the wire-frame cube. A number ofdifferent scenarios could be imagined to establish the connection between the RISP (i.e.the pocket PC) and the system. On the one hand, no explicit action may be required otherthan bringing the RISP within the boundaries of the cube. On the other hand, the explicitaction of connecting the RISP to the placeholder can indicate to the system (through awireless connection) that the user is trying to address it. Personalized information maybe transferred from the RISP to the system, i.e. there may be messages, such as thevolume data sets to be examined and the user’s identity, that the user may have preparedin advance. Once the connection is successfully established, the system knows that theuser is addressing the system.
Attention
The system informs the user that a successful connection has been established and/or thatthe system is ready to receive further actions, through any output modality available tothe system and/or to the pocket PC. For example, visual, audio or vibrotacticle cues couldbe presented to the RISP to inform the user that the system has detected his/her desireto address it. It may also be useful to equip the wire-frame cube with some means offeedback (perhaps through an embedded LCD), so that the system can also signal relevantfeedback for this device, such as when it is detected and/or when the appropriate volumedata is available for interaction (since loading such data may take a while). Based on thepersonalized information supplied in the “addressing” to the system, the system may alsogreet the user in a personalized way, may set access rights, etc.
Action
The user can control the location and orientation of the intersection window by changingthe location and orientation of the RISP in the wire-framed cube. In the case that theplaceholder is used, the user cannot simultaneously control the location and orientation ofthe intersection window. Although the placeholder may restrict the freedom of movementof the user’s hand, it also has a distinct advantage, i.e. it can keep the RISP steady for aprolonged period of time. This not only allows the user to take a break when interactingwith the system, but can also help in keeping the intersection image stable during selection.
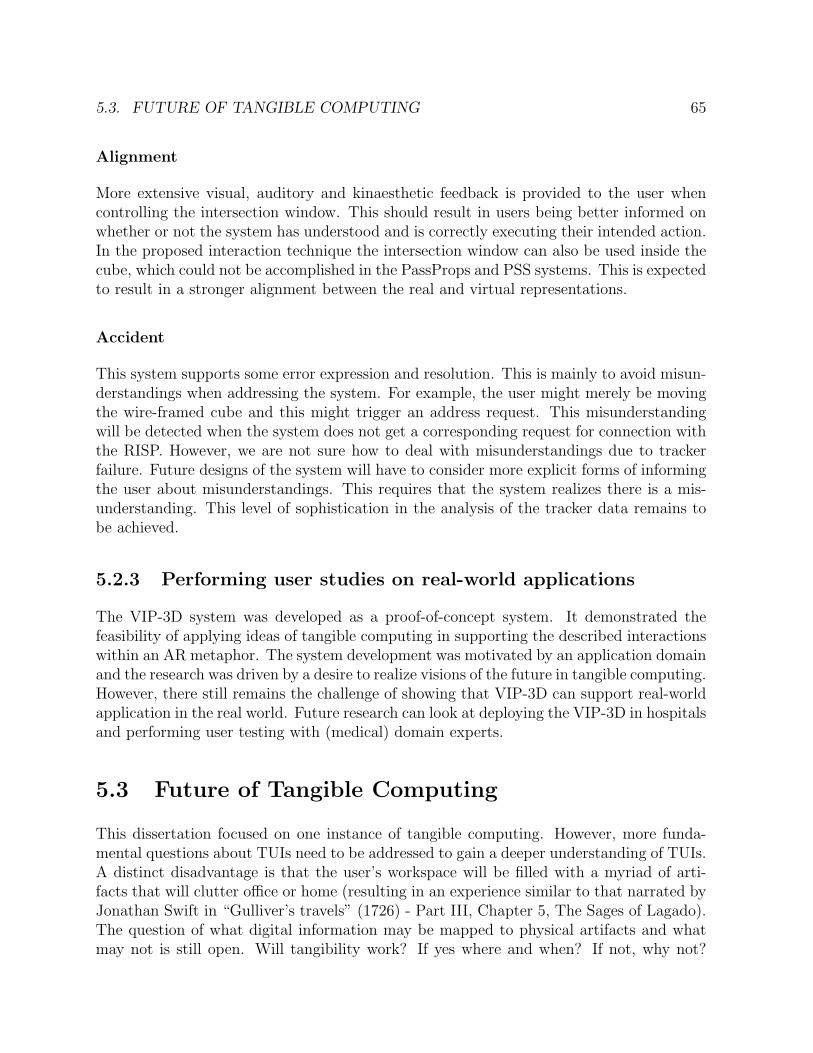
5.3. FUTURE OF TANGIBLE COMPUTING 65
Alignment
More extensive visual, auditory and kinaesthetic feedback is provided to the user whencontrolling the intersection window. This should result in users being better informed onwhether or not the system has understood and is correctly executing their intended action.In the proposed interaction technique the intersection window can also be used inside thecube, which could not be accomplished in the PassProps and PSS systems. This is expectedto result in a stronger alignment between the real and virtual representations.
Accident
This system supports some error expression and resolution. This is mainly to avoid misun-derstandings when addressing the system. For example, the user might merely be movingthe wire-framed cube and this might trigger an address request. This misunderstandingwill be detected when the system does not get a corresponding request for connection withthe RISP. However, we are not sure how to deal with misunderstandings due to trackerfailure. Future designs of the system will have to consider more explicit forms of informingthe user about misunderstandings. This requires that the system realizes there is a mis-understanding. This level of sophistication in the analysis of the tracker data remains tobe achieved.
5.2.3 Performing user studies on real-world applications
The VIP-3D system was developed as a proof-of-concept system. It demonstrated thefeasibility of applying ideas of tangible computing in supporting the described interactionswithin an AR metaphor. The system development was motivated by an application domainand the research was driven by a desire to realize visions of the future in tangible computing.However, there still remains the challenge of showing that VIP-3D can support real-worldapplication in the real world. Future research can look at deploying the VIP-3D in hospitalsand performing user testing with (medical) domain experts.
5.3 Future of Tangible Computing
This dissertation focused on one instance of tangible computing. However, more funda-mental questions about TUIs need to be addressed to gain a deeper understanding of TUIs.A distinct disadvantage is that the user’s workspace will be filled with a myriad of arti-facts that will clutter office or home (resulting in an experience similar to that narrated byJonathan Swift in “Gulliver’s travels” (1726) - Part III, Chapter 5, The Sages of Lagado).The question of what digital information may be mapped to physical artifacts and whatmay not is still open. Will tangibility work? If yes where and when? If not, why not?
66 CHAPTER 5. REDESIGN OF THE VIP
There are also questions like, “what will tangibility improve?” In other words, how dowe evaluate the achievements of tangible computing (do we merely stick to usability ordo we look at coordination, fun, engagement etc.)? Finally, can we generate guidelinesfor developing new tangible objects? What happens when the interaction breaks down?At a more philosophical level, can tangibility reach the level of transparency professed byHeidegger (present-at-hand as against ready-to-hand)?
5.3.1 Understanding TUIs
In order to understand what ticks in a TUI it is important to understand the role ofphysical representations in influencing physical control of digital data. There are variousattributes of the physical object (shape, size, location, color etc) that can be used torepresent and control digital information. The physical attributes that can be effectivelyharnessed to establish representation and control for digital information still need to beestablished. This can be done through creation of simple TUIs that utilize one or anotherform of attribute. The next step would be to compare the various attributes. How dothe various representations (through the different attributes) influence the control of thedigital information? For example, how does a shape-varying tangible interface comparewith a slider (tangible) interface for setting the time? While the slider might be faster theshape-varying interface might be more fun. The results are likely to depend on the digitalinformation controlled and represented. TUIs also rely on a balance between physicaland non-physical representations. In addition, there is a need to investigate the desiredlevel of balance between these two representations. This balance will decide how genericor application-specific the interface is going to become. On the one hand no physicalrepresentation can lead to a generic device like the mouse, while on the other hand, strongphysical representations can lead to application-specific interfaces like the illuminatingclay (Piper, Ratti, & Ishii, 2002). In short the following three specific projects can beidentified.
• Exploring forms of physical representation.
• Comparing the various forms of physical representation.
• Exploring the amount of physical representation,
5.3.2 TUIs to support other forms of Interaction
It is important to recognize that TUIs will not be the only form of interaction with digitalinformation. There are likely to be many activities that can be done better through otherinteraction techniques e.g., using a keyboard for text entry. When supporting multiplestyles of interaction (TUIs, GUIs etc.) with digital information, it is important to makethe transitions between the various interactions harmonious. For example, the user having
5.4. BEYOND EFFECTIVENESS AND EFFICIENCY 67
finished manipulating figures in a word document using a tangible interface might want toresume text entry using the keyboard. How does the user inform the system that he/shehas finished working with the tangible interface and wants to put it aside (without affectingthe figure that was being controlled) to bring the keyboard closer for comfortable typing?When the user then returns to the tangible interface, how does he/she know if the interfacecan still be used to control the same figure? How does she/he start the control and specifywhich figure to control?
These problems become more pronounced when dealing with combinations of tangible andeveryday computing environments as exemplified by intelligent homes. It can becomeextremely hard for the user to say whether an artifact lying on the table is intelligent ordumb. If it is intelligent what does it represent and control? Is there any non-physicalrepresentation? Where can the user see, hear or feel the results of the action? Whathappens when the user returns the artifact to the table - does it remember, record andlearn from all the interactions? When would this become an invasion of user privacy andhow can the user be informed of these? In short, research should aim to develop guidelinesthat address the following questions (Bellotti et al., 2002):
• How does the user know if a device is intelligent or not?
• How does the user address one (or more) of many possible TUIs?
• How does the user know the system is ready and attending to his/her actions?
• How does the user effect a meaningful action, control its extent and possibly specifya target or targets for his/her actions?
• How does the user know the system is doing (has done) the right thing?
• How does the user avoid mistakes/misunderstandings?
• How does the system record and store user settings without invading their privacy?
5.4 Beyond Effectiveness and Efficiency
In the experiments of Chapter 3 and 4, trial completion time was used as the performancemeasure. Reflecting on the experiments of Chapter 3 and 4, one can argue that the addedbenefit of physical interactions is that it provides the users with a direct control of thedigital information (interpretations in various forms are available in Dourish, 2001; Fjeld,2001 and Ullmer, 2002). The more control one has on a physical device, the better onecan manipulate the digital information. To effectively validate this claim, one needs to beable to measure controllability of the device. While there have been attempts to develop ameasure for controllability there is still no consensus on how to measure control. A popularproposal for measuring control is through a measure of coordination (see for example, Zhai

68 CHAPTER 5. REDESIGN OF THE VIP
et al., 1996; Zhai & Senders, 1997a; Masliah, 2001). The next chapter expands on the topicof measuring coordination. Rather than merely generating design relevant knowledge bycomparing various TUIs using a coordination measure, it attempts to develop and validatea measure for coordination.
Chapter 6
Coordination: Measuring Allocationof Control
6.1 Introduction
Recent years have seen the proliferation of a wide variety of input devices into the user’sworkspace. These devices range from 2D-input devices like the mouse, to 3D-input deviceslike the bat (Ware & Jessome, 1988). Given this growing diversity, it becomes increasinglydifficult to distinguish between these input devices based solely on traditional performancemeasures such as task completion time and accuracy (error).
Two-dimensional pointing devices like the mouse, trackball and joystick have differentstrengths and weaknesses. Consider, for example, the use of the trackball to effect pointermotion. To move the pointer a long distance, users may start off with “throwing” theball with a quick flick of the index finger, and finish off by narrowing in on the target by“walking” the index finger across the top of the ball. This behavior, which may not bepossible with other pointing devices like the mouse, may affect the trajectory traced by thepointer and as a consequence the user’s experience and usage of the device. Such effects donot surface if analysis is limited to movement time or error rates (MacKenzie et al., 2001).Time and error rates focus on the initial and the target points traced by the devices. Aricher measure, which highlights the sort of difference mentioned above, would be one thatanalyzes the entire trajectory traced by the device1.
What are we looking for in the trajectory?
We are looking for a measure that quantifies the user’s ability to manipulatean input device to produce smooth, accurate, controlled, continuous and well-orchestrated movements (Zhai & Milgram, 1998; Masliah, 2001; MacKenzieet al., 2001).
1Appeared in Subramanian, Aliakseyeu, & Martens, (2003; “Measuring Coordination for 2D-PositioningTasks”, INTERACT 2003)
69
70 CHAPTER 6. COORDINATION
Coordinated movement is a popular term used for smooth, accurate, controlled, continuousand well-orchestrated movements (as defined by The Concise Oxford Dictionary). In otherwords, a more informative measure would be one that quantifies the user’s ability to pro-duce coordinated movements. Such a measure is called (for obvious reasons) a coordinationmeasure.
Though this concept has, only recently, been embraced in the HCI community, the idea ofmeasuring coordination(the act of producing coordinated movements) is in itself not new.Coordination is used with this same intuitive meaning in disciplines as diverse as medicaldiagnosis, rehabilitation, and athletics (Fischer & Kondraske, 1997).
6.1.1 Examples of Coordination
Many diverse disciplines use the term coordination to quantify motion characteristics. Inthis section I provide a sample of these different disciplines.
Surgical success is largely dependent on the precise and delicate execution of a surgi-cal procedure (Kaufman, Wiegand, & Tunick, 1987, page 1). Correct manipulation inthe operating theater is essential to avoid tissue damage and to reduce patient recoverytime (Holding, 1992 2nd ed.). This is achieved partly through the use of an appropriateprop (or instrument) (i.e. using a knife of appropriate thickness to cut the tissue) andpartly through the controlled and orchestrated use of the prop in producing coordinatedmovements. Surgical trainees are evaluated by expert surgeons through the visual inspec-tion of the trainees’ actions. However, with the development of virtual reality techniquesfor training surgeons, there has been a renewed interest in providing objective measures toevaluate the progress of the trainee (Moody, Baber, Arvanitis, & Elliott, 2003).
Deficits in motor skills, labelled as developmental coordination disorder (DCD) (previouslyalso referred to as neurological soft signs, clumsiness etc.), is defined by the AmericanPsychiatric Association, as “a marked impairment in the development of motor coordina-tion . . . (which) significantly interferes with academic achievement or activities of dailyliving. . .” (Dewey, Kaplan, Crawford, & Wilson, 2002). Evaluations of such deficits con-sists of having patients move their arms in certain prescribed motions while the physicianassesses performance. With the proliferation of computers in the medical world, using com-puterized tracking tasks as a quantitative and objective means of assessing such deficitsmight provide extended benefits to the physicians (Masliah & Milgram, 2000).
Researchers in kinesiology are interested in the coordination between the hand and theeye movements in goal-directed movement of the head and arm to manipulate every dayobjects. They usually refer to this coordination as eye-hand coordination (Binsted, Chua,Helsen, & Elliot, 2001; Neggers & Bekkering, 2002).
Precise coordination is crucial in various sports, such as diving where failure of the athleteto execute precise coordinated acrobatics movements will ultimately lead to poor perfor-mance. Similar situations occur in gymnastics and acrobatics (Sports, 2003). Coaches try
6.2. EXISTING MEASURES 71
to incorporate a sense of coordination into the athlete, through their subjective judgementof the athlete’s coordination skill.
In the late 1940’s and early 1950’s research in human factors centered on the ability of anti-aircraft gunners to control multiple degrees of freedom devices in a coordinated manner(Masliah, 2001; Zhai & Senders, 1997a; Zhai & Senders, 1997b). However, research inthis area waned until recently, when the advent of new multiple degrees of freedom inputdevices has renewed the interest in measuring coordination.
Despite this widespread interest in coordination, a broadly accepted definition of the termis still elusive (Kondraske & Vasta, 2000). While different measures for coordination havebeen introduced (Zhai & Milgram, 1998; Masliah & Milgram, 2000; Fischer & Kondraske,1997; Kondraske & Vasta, 2000), they are mostly formulated in an ad hoc way, and are notbased on any computational theory. Thus a measurement procedure for coordination thatagrees with our intuitive understanding, and that is based on firm theoretical concepts,would be most useful in this context.
I start this chapter by reviewing and analyzing the existing measures of coordinationand developing a set of guidelines for a computational theory in Section 6.3. Section 6.4describes a proposed new measure for coordination, while the remaining sections describethe experiments and the results of comparison between the subjective preference and thedifferent instrumental measures.
6.2 Existing Measures
From the introduction it seems fairly clear that coordination is an all encompassing termmeant to convey information about a trajectory. Since a clear definition of coordinationis still elusive, it is also not yet clear how to capture this property of the trajectory. Aselection of some of the dominant measures, with commentary, is presented here.
6.2.1 Dimensions of Performance
Fischer and Kondraske (1997) have proposed a human motion quality measure that can bederived from the 3D trajectory followed during the movement of a point-wise source towardsa target. Their measure is a multiplicative combination of 4 dimensions of performance(DOP), i.e. speed, smoothness, volume appropriateness and accuracy. All numerical mea-sures of DOPs are calculated from time-stamped three-dimensional coordinates (X,Y,Z)sampled at time intervals ∆t.
speed =distance
time
=
√(X2 −X1)2 + (Y2 − Y1)2 + (Z2 − Z1)2
∆t(6.1)
72 CHAPTER 6. COORDINATION
smoothness =1
|jerkx| × |jerky| × |jerkz|(6.2)
where
jerkx =((X2 −X1)− (X1 −X0))− ((X3 −X2)− (X2 −X1))
∆t3
approximates a third-order derivative, i.e. a change in acceleration. The instantaneousspeed and smoothness are calculated throughout the task and averaged at the end.
The third variable is defined as
V olume appropriateness = RAx ×RAy ×RAz (6.3)
where
RAx =1
|appropriate rangex −measured range usedx|and the appropriaterange is set a priori (in an unclear manner).
Accuracy of a motion can be defined when there are intermediate target locations (Xtarg j,Ytarg j, Ztarg j) involved in the motion. The error associated with a given target is computed(over an entire motion task) as
errortarg j = minover i(√
(xi − xtarg j)2 + (yi − ytarg j)2 + (zi − ztarg j)2) (6.4)
From this, the accuracy for the motion task can be computed as
Accuracy = averageover j(1
errorj
)
The volume appropriateness and the accuracy are calculated once over the entire task.
The authors compared these measures with scores provided by clinical experts for differenteveryday tasks like wiping a flat horizontal surface and reciprocal point-to-point motion.All possible multiplicative combinations of the DOPs were calculated and compared tothe average expert rating for each task. They found that the smoothness measure wasleast correlated with the expert results and the product of speed and accuracy correlatedsignificantly (75%) with the expert judgement for all tasks. This led them to conclude thata simultaneous measure of time and accuracy will effectively quantify the human motionquality. It is also worth pointing out that the smoothness and volume-appropriatenessmeasures, which were the worst predictors, are dependent on the coordinate system used.
6.2.2 Neuromotor Channel Capacity Measure
Following the study in Sec 6.2.1, Kondraske and Vasta (2000) proposed another motionquality measure called the Neuromotor Channel Capacity measure (NMCC) that is basedon Fitts’ law. Fitts’ law expresses movement time (MT) in terms of the ratio A/W of target
6.2. EXISTING MEASURES 73
distance A over target size W in a 1D selection task. The formula used by Kondraske andVasta is
MT = a + b log2
2A
W
The ‘index of performance’ IP=1/b (in bits/sec) is used as the NMCC. The NMCC capturestime and accuracy simultaneously. The aim of their study was to test the hypothesis that“NMCC is coordination”. They developed a questionnaire to survey physical therapists’perception about “coordination” and expectations regarding its (coordination’s) behavioracross populations as well as desired characteristics of a coordination measure.
From the questionnaire they could establish a set of hypotheses. For example, the ques-tionnaire indicated that healthy young adults are expected to exhibit better coordinationthan older adults. This led to the creation of the hypothesis that young (aged ≤ 50 yrs)healthy adults have more NMCC than older (> 50 yrs) healthy adults. To determine, ifthe overall notion that “NMCC is coordination”is supported, they required that at least80% of the hypotheses be accepted. Based on this analysis they concluded that the NMCCconcept provided a powerful and compelling basis for standardized, objective measurementof what is more commonly called coordination.
The NMCC is being used in biomedical research as a means of quantifying upper extremityperformance in Parkinson’s patients. One of the limitations of the experiments is that theexperimental hypotheses set were mostly age- and gender- based. No hypothesis was basedon the path executed by the subjects even though NMCC and coordination are meant tobe motion quality measures. Besides, the NMCC is only applicable to positioning tasks.
6.2.3 Inefficiency Measure
Zhai and Milgram (1998) have proposed the inefficiency measure to express the coordi-nation while using 3D-input devices with 6 DOF. In case of translation, their measure isdefined as the ratio of the difference in length of the actual path and shortest path to thelength of the shortest path.
l =Length of Actual path− Length of Shortest path
Length of Shortest path
This definition can also be extended to rotation coordination. If the initial mismatchbetween a cursor and a target (both are 3D objects in 3D space) can be removed bya rotation over an angle φA around an axis with orientation vector nA, and the actualamount of rotation is φB around an axis with orientation vector nB, then the rotationcoordination coefficient can be defined as:
r =Amount of actual rotation− Initial rotation mismatch
Initial rotation mismatch
=φB − φA
φA
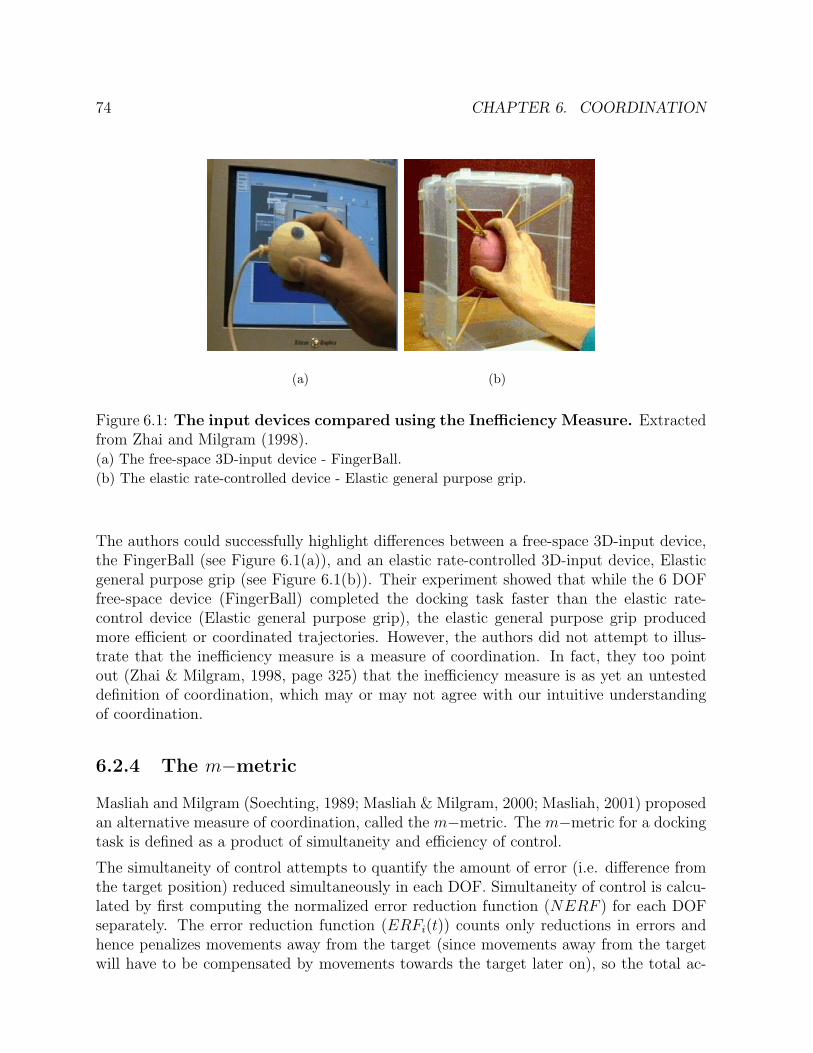
74 CHAPTER 6. COORDINATION
(a) (b)
Figure 6.1: The input devices compared using the Inefficiency Measure. Extractedfrom Zhai and Milgram (1998).(a) The free-space 3D-input device - FingerBall.(b) The elastic rate-controlled device - Elastic general purpose grip.
The authors could successfully highlight differences between a free-space 3D-input device,the FingerBall (see Figure 6.1(a)), and an elastic rate-controlled 3D-input device, Elasticgeneral purpose grip (see Figure 6.1(b)). Their experiment showed that while the 6 DOFfree-space device (FingerBall) completed the docking task faster than the elastic rate-control device (Elastic general purpose grip), the elastic general purpose grip producedmore efficient or coordinated trajectories. However, the authors did not attempt to illus-trate that the inefficiency measure is a measure of coordination. In fact, they too pointout (Zhai & Milgram, 1998, page 325) that the inefficiency measure is as yet an untesteddefinition of coordination, which may or may not agree with our intuitive understandingof coordination.
6.2.4 The m−metric
Masliah and Milgram (Soechting, 1989; Masliah & Milgram, 2000; Masliah, 2001) proposedan alternative measure of coordination, called the m−metric. The m−metric for a dockingtask is defined as a product of simultaneity and efficiency of control.
The simultaneity of control attempts to quantify the amount of error (i.e. difference fromthe target position) reduced simultaneously in each DOF. Simultaneity of control is calcu-lated by first computing the normalized error reduction function (NERF ) for each DOFseparately. The error reduction function (ERFi(t)) counts only reductions in errors andhence penalizes movements away from the target (since movements away from the targetwill have to be compensated by movements towards the target later on), so the total ac-
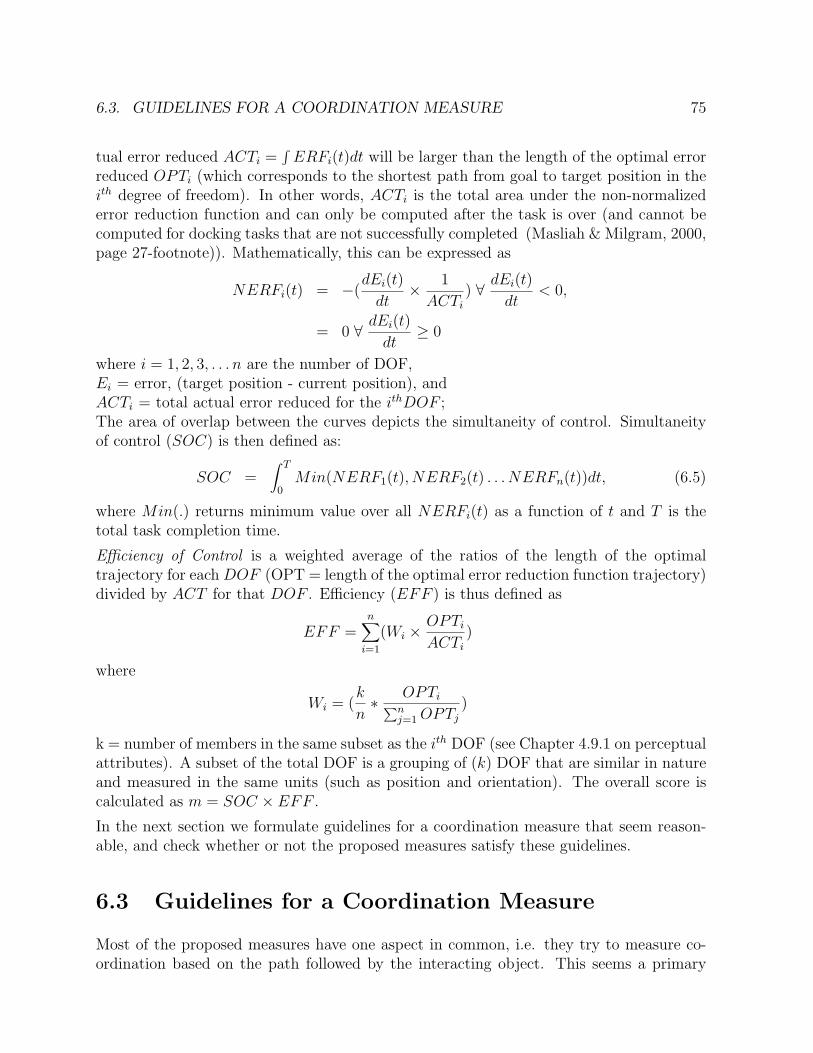
6.3. GUIDELINES FOR A COORDINATION MEASURE 75
tual error reduced ACTi =∫
ERFi(t)dt will be larger than the length of the optimal errorreduced OPTi (which corresponds to the shortest path from goal to target position in theith degree of freedom). In other words, ACTi is the total area under the non-normalizederror reduction function and can only be computed after the task is over (and cannot becomputed for docking tasks that are not successfully completed (Masliah & Milgram, 2000,page 27-footnote)). Mathematically, this can be expressed as
NERFi(t) = −(dEi(t)
dt× 1
ACTi
) ∀ dEi(t)
dt< 0,
= 0 ∀ dEi(t)
dt≥ 0
where i = 1, 2, 3, . . . n are the number of DOF,Ei = error, (target position - current position), andACTi = total actual error reduced for the ithDOF ;The area of overlap between the curves depicts the simultaneity of control. Simultaneityof control (SOC) is then defined as:
SOC =∫ T
0Min(NERF1(t), NERF2(t) . . . NERFn(t))dt, (6.5)
where Min(.) returns minimum value over all NERFi(t) as a function of t and T is thetotal task completion time.
Efficiency of Control is a weighted average of the ratios of the length of the optimaltrajectory for each DOF (OPT = length of the optimal error reduction function trajectory)divided by ACT for that DOF . Efficiency (EFF ) is thus defined as
EFF =n∑
i=1
(Wi ×OPTi
ACTi
)
where
Wi = (k
n∗ OPTi∑n
j=1 OPTj
)
k = number of members in the same subset as the ith DOF (see Chapter 4.9.1 on perceptualattributes). A subset of the total DOF is a grouping of (k) DOF that are similar in natureand measured in the same units (such as position and orientation). The overall score iscalculated as m = SOC × EFF .
In the next section we formulate guidelines for a coordination measure that seem reason-able, and check whether or not the proposed measures satisfy these guidelines.
6.3 Guidelines for a Coordination Measure
Most of the proposed measures have one aspect in common, i.e. they try to measure co-ordination based on the path followed by the interacting object. This seems a primary
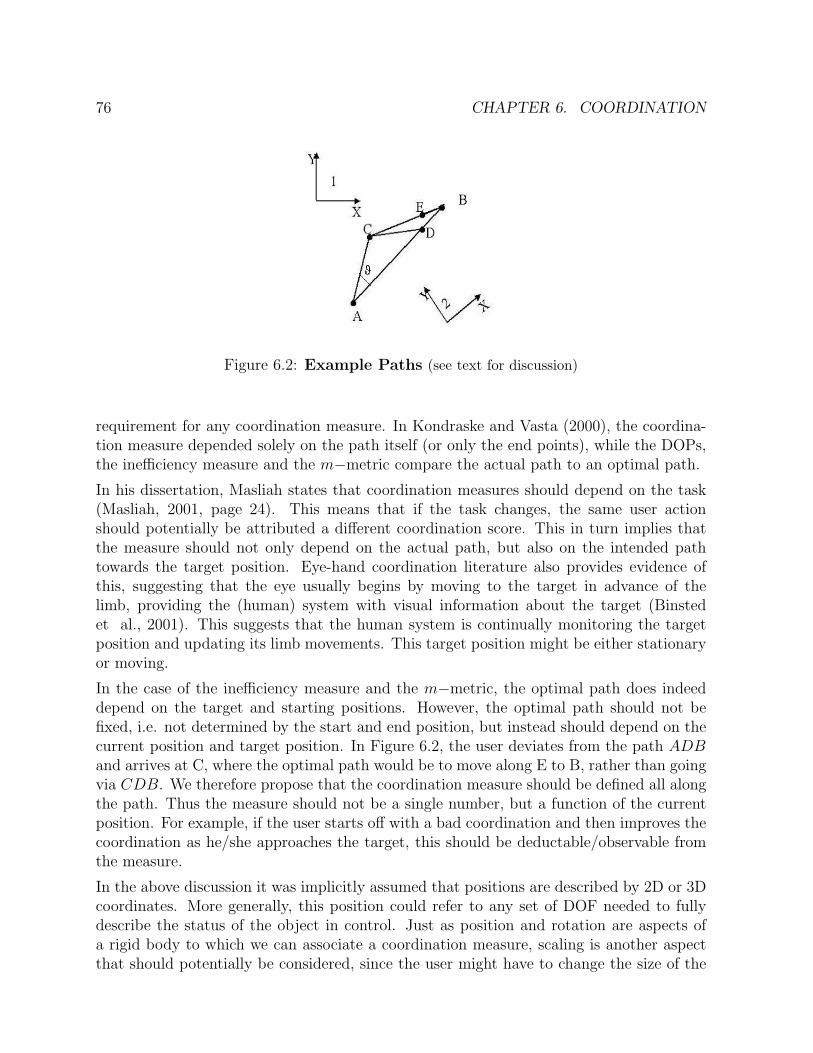
76 CHAPTER 6. COORDINATION
Figure 6.2: Example Paths (see text for discussion)
requirement for any coordination measure. In Kondraske and Vasta (2000), the coordina-tion measure depended solely on the path itself (or only the end points), while the DOPs,the inefficiency measure and the m−metric compare the actual path to an optimal path.
In his dissertation, Masliah states that coordination measures should depend on the task(Masliah, 2001, page 24). This means that if the task changes, the same user actionshould potentially be attributed a different coordination score. This in turn implies thatthe measure should not only depend on the actual path, but also on the intended pathtowards the target position. Eye-hand coordination literature also provides evidence ofthis, suggesting that the eye usually begins by moving to the target in advance of thelimb, providing the (human) system with visual information about the target (Binstedet al., 2001). This suggests that the human system is continually monitoring the targetposition and updating its limb movements. This target position might be either stationaryor moving.
In the case of the inefficiency measure and the m−metric, the optimal path does indeeddepend on the target and starting positions. However, the optimal path should not befixed, i.e. not determined by the start and end position, but instead should depend on thecurrent position and target position. In Figure 6.2, the user deviates from the path ADBand arrives at C, where the optimal path would be to move along E to B, rather than goingvia CDB. We therefore propose that the coordination measure should be defined all alongthe path. Thus the measure should not be a single number, but a function of the currentposition. For example, if the user starts off with a bad coordination and then improves thecoordination as he/she approaches the target, this should be deductable/observable fromthe measure.
In the above discussion it was implicitly assumed that positions are described by 2D or 3Dcoordinates. More generally, this position could refer to any set of DOF needed to fullydescribe the status of the object in control. Just as position and rotation are aspects ofa rigid body to which we can associate a coordination measure, scaling is another aspectthat should potentially be considered, since the user might have to change the size of the
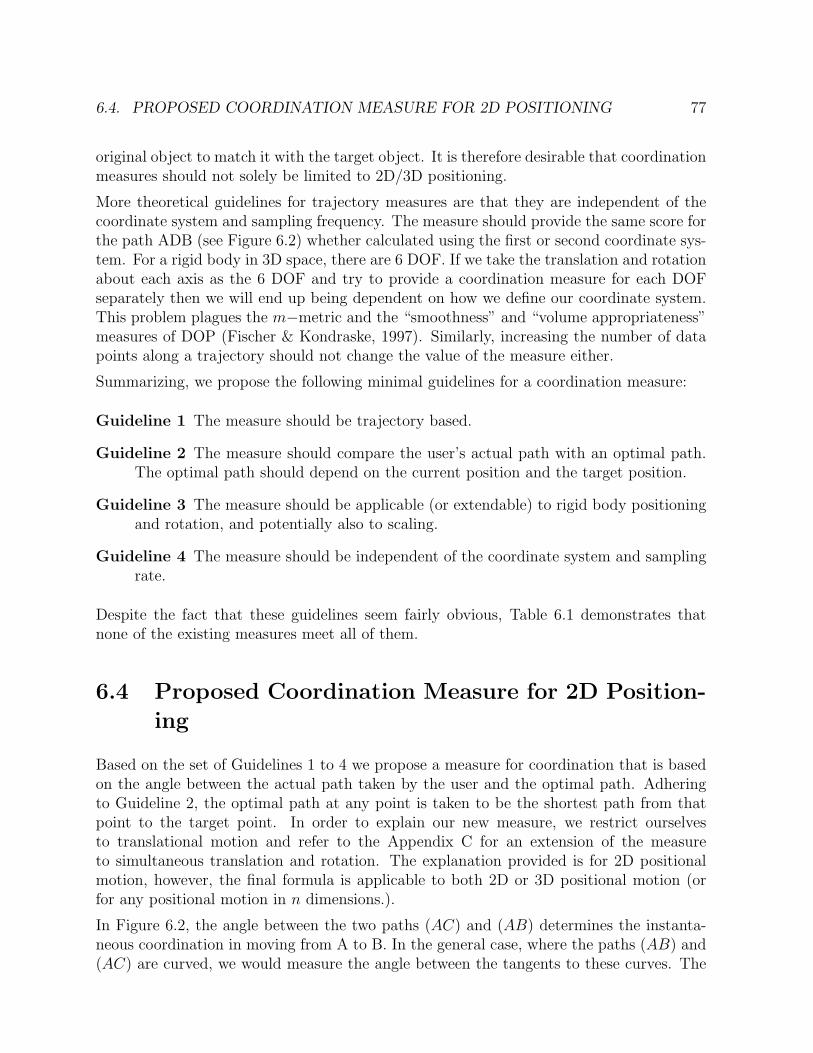
6.4. PROPOSED COORDINATION MEASURE FOR 2D POSITIONING 77
original object to match it with the target object. It is therefore desirable that coordinationmeasures should not solely be limited to 2D/3D positioning.
More theoretical guidelines for trajectory measures are that they are independent of thecoordinate system and sampling frequency. The measure should provide the same score forthe path ADB (see Figure 6.2) whether calculated using the first or second coordinate sys-tem. For a rigid body in 3D space, there are 6 DOF. If we take the translation and rotationabout each axis as the 6 DOF and try to provide a coordination measure for each DOFseparately then we will end up being dependent on how we define our coordinate system.This problem plagues the m−metric and the “smoothness” and “volume appropriateness”measures of DOP (Fischer & Kondraske, 1997). Similarly, increasing the number of datapoints along a trajectory should not change the value of the measure either.
Summarizing, we propose the following minimal guidelines for a coordination measure:
Guideline 1 The measure should be trajectory based.
Guideline 2 The measure should compare the user’s actual path with an optimal path.The optimal path should depend on the current position and the target position.
Guideline 3 The measure should be applicable (or extendable) to rigid body positioningand rotation, and potentially also to scaling.
Guideline 4 The measure should be independent of the coordinate system and samplingrate.
Despite the fact that these guidelines seem fairly obvious, Table 6.1 demonstrates thatnone of the existing measures meet all of them.
6.4 Proposed Coordination Measure for 2D Position-
ing
Based on the set of Guidelines 1 to 4 we propose a measure for coordination that is basedon the angle between the actual path taken by the user and the optimal path. Adheringto Guideline 2, the optimal path at any point is taken to be the shortest path from thatpoint to the target point. In order to explain our new measure, we restrict ourselvesto translational motion and refer to the Appendix C for an extension of the measureto simultaneous translation and rotation. The explanation provided is for 2D positionalmotion, however, the final formula is applicable to both 2D or 3D positional motion (orfor any positional motion in n dimensions.).
In Figure 6.2, the angle between the two paths (AC) and (AB) determines the instanta-neous coordination in moving from A to B. In the general case, where the paths (AB) and(AC) are curved, we would measure the angle between the tangents to these curves. The
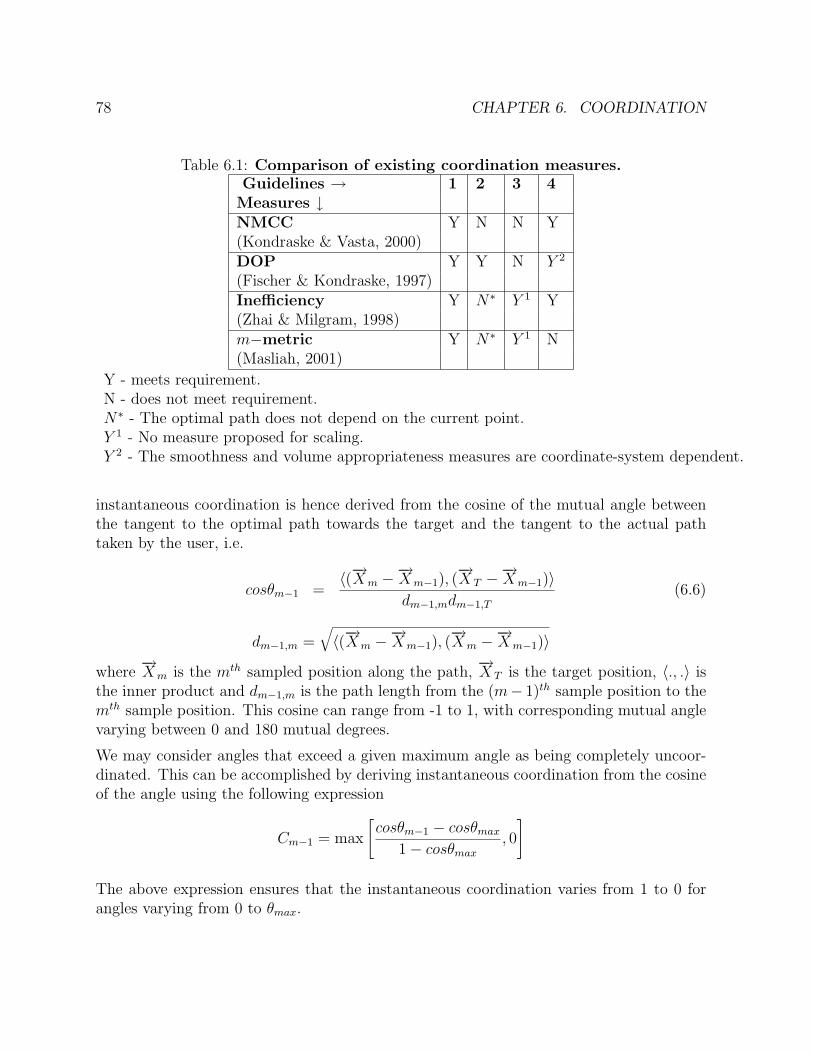
78 CHAPTER 6. COORDINATION
Table 6.1: Comparison of existing coordination measures.Guidelines → 1 2 3 4Measures ↓NMCC Y N N Y(Kondraske & Vasta, 2000)DOP Y Y N Y 2
(Fischer & Kondraske, 1997)Inefficiency Y N∗ Y 1 Y(Zhai & Milgram, 1998)m−metric Y N∗ Y 1 N(Masliah, 2001)
Y - meets requirement.N - does not meet requirement.N∗ - The optimal path does not depend on the current point.Y 1 - No measure proposed for scaling.Y 2 - The smoothness and volume appropriateness measures are coordinate-system dependent.
instantaneous coordination is hence derived from the cosine of the mutual angle betweenthe tangent to the optimal path towards the target and the tangent to the actual pathtaken by the user, i.e.
cosθm−1 =〈(−→Xm −−→
Xm−1), (−→X T −
−→Xm−1)〉
dm−1,mdm−1,T
(6.6)
dm−1,m =√〈(−→Xm −−→
Xm−1), (−→Xm −−→
Xm−1)〉
where−→Xm is the mth sampled position along the path,
−→X T is the target position, 〈., .〉 is
the inner product and dm−1,m is the path length from the (m− 1)th sample position to themth sample position. This cosine can range from -1 to 1, with corresponding mutual anglevarying between 0 and 180 mutual degrees.
We may consider angles that exceed a given maximum angle as being completely uncoor-dinated. This can be accomplished by deriving instantaneous coordination from the cosineof the angle using the following expression
Cm−1 = max
[cosθm−1 − cosθmax
1− cosθmax
, 0
]
The above expression ensures that the instantaneous coordination varies from 1 to 0 forangles varying from 0 to θmax.
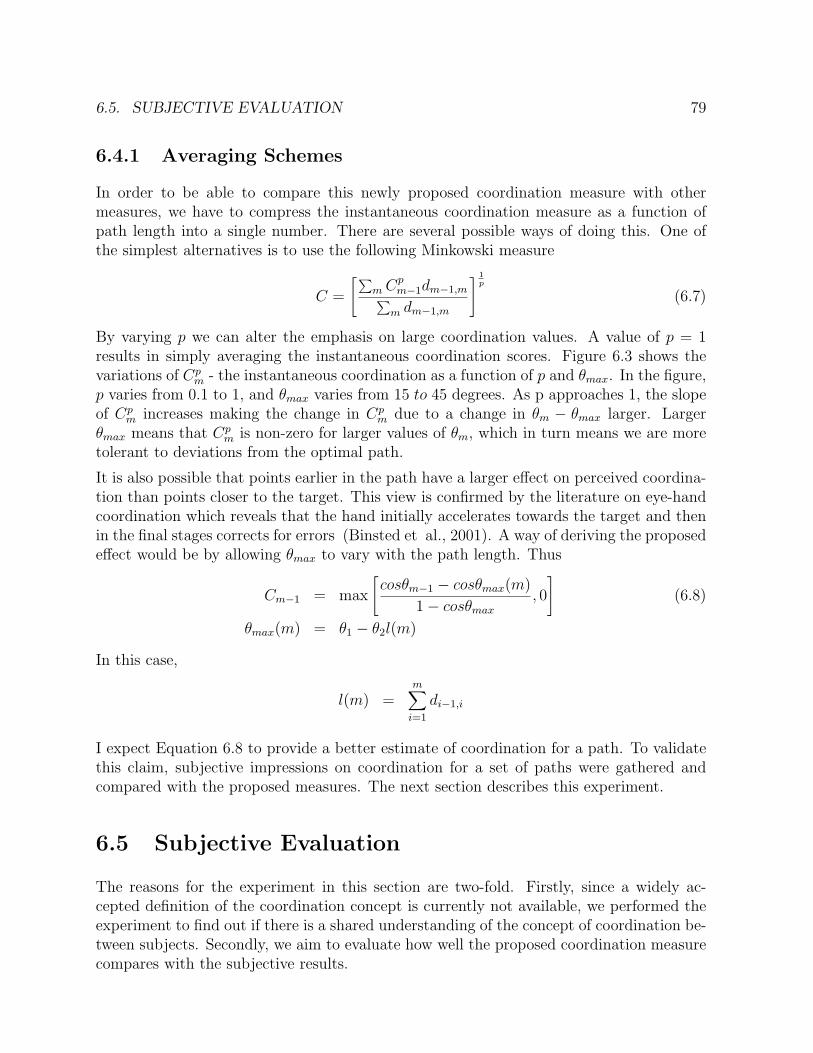
6.5. SUBJECTIVE EVALUATION 79
6.4.1 Averaging Schemes
In order to be able to compare this newly proposed coordination measure with othermeasures, we have to compress the instantaneous coordination measure as a function ofpath length into a single number. There are several possible ways of doing this. One ofthe simplest alternatives is to use the following Minkowski measure
C =
[∑m Cp
m−1dm−1,m∑m dm−1,m
] 1p
(6.7)
By varying p we can alter the emphasis on large coordination values. A value of p = 1results in simply averaging the instantaneous coordination scores. Figure 6.3 shows thevariations of Cp
m - the instantaneous coordination as a function of p and θmax. In the figure,p varies from 0.1 to 1, and θmax varies from 15 to 45 degrees. As p approaches 1, the slopeof Cp
m increases making the change in Cpm due to a change in θm − θmax larger. Larger
θmax means that Cpm is non-zero for larger values of θm, which in turn means we are more
tolerant to deviations from the optimal path.
It is also possible that points earlier in the path have a larger effect on perceived coordina-tion than points closer to the target. This view is confirmed by the literature on eye-handcoordination which reveals that the hand initially accelerates towards the target and thenin the final stages corrects for errors (Binsted et al., 2001). A way of deriving the proposedeffect would be by allowing θmax to vary with the path length. Thus
Cm−1 = max
[cosθm−1 − cosθmax(m)
1− cosθmax
, 0
](6.8)
θmax(m) = θ1 − θ2l(m)
In this case,
l(m) =m∑
i=1
di−1,i
I expect Equation 6.8 to provide a better estimate of coordination for a path. To validatethis claim, subjective impressions on coordination for a set of paths were gathered andcompared with the proposed measures. The next section describes this experiment.
6.5 Subjective Evaluation
The reasons for the experiment in this section are two-fold. Firstly, since a widely ac-cepted definition of the coordination concept is currently not available, we performed theexperiment to find out if there is a shared understanding of the concept of coordination be-tween subjects. Secondly, we aim to evaluate how well the proposed coordination measurecompares with the subjective results.
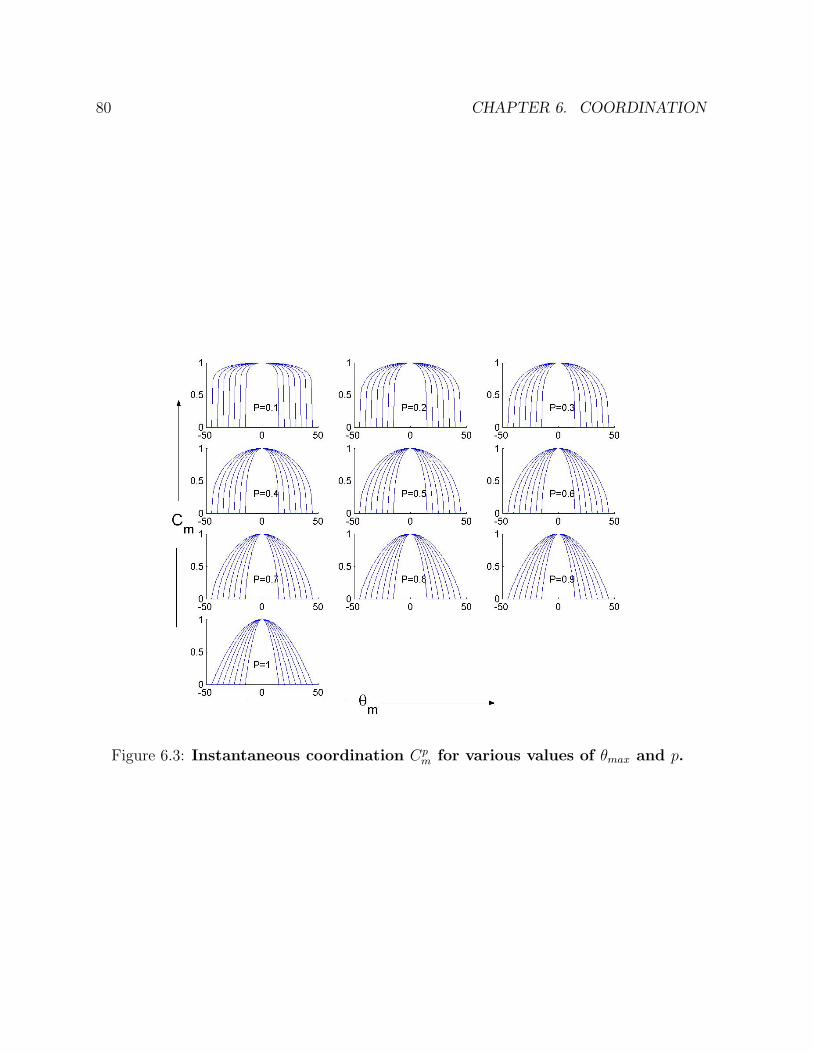
80 CHAPTER 6. COORDINATION
Figure 6.3: Instantaneous coordination Cpm for various values of θmax and p.
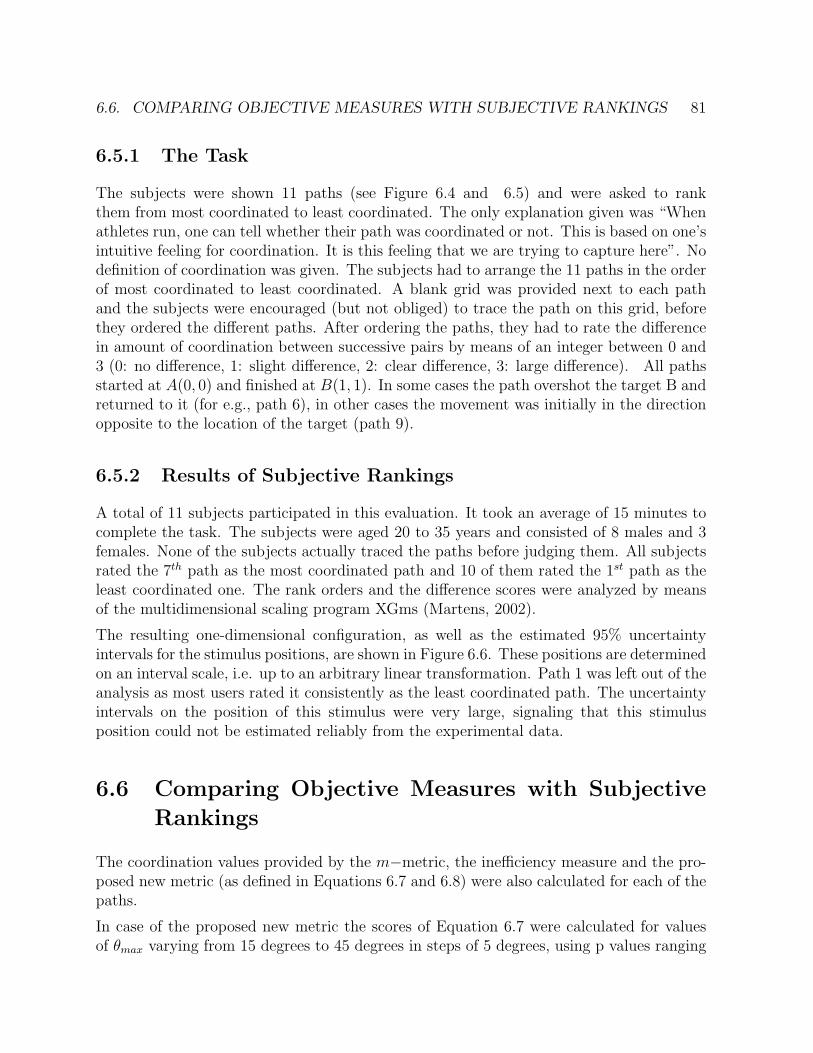
6.6. COMPARING OBJECTIVE MEASURES WITH SUBJECTIVE RANKINGS 81
6.5.1 The Task
The subjects were shown 11 paths (see Figure 6.4 and 6.5) and were asked to rankthem from most coordinated to least coordinated. The only explanation given was “Whenathletes run, one can tell whether their path was coordinated or not. This is based on one’sintuitive feeling for coordination. It is this feeling that we are trying to capture here”. Nodefinition of coordination was given. The subjects had to arrange the 11 paths in the orderof most coordinated to least coordinated. A blank grid was provided next to each pathand the subjects were encouraged (but not obliged) to trace the path on this grid, beforethey ordered the different paths. After ordering the paths, they had to rate the differencein amount of coordination between successive pairs by means of an integer between 0 and3 (0: no difference, 1: slight difference, 2: clear difference, 3: large difference). All pathsstarted at A(0, 0) and finished at B(1, 1). In some cases the path overshot the target B andreturned to it (for e.g., path 6), in other cases the movement was initially in the directionopposite to the location of the target (path 9).
6.5.2 Results of Subjective Rankings
A total of 11 subjects participated in this evaluation. It took an average of 15 minutes tocomplete the task. The subjects were aged 20 to 35 years and consisted of 8 males and 3females. None of the subjects actually traced the paths before judging them. All subjectsrated the 7th path as the most coordinated path and 10 of them rated the 1st path as theleast coordinated one. The rank orders and the difference scores were analyzed by meansof the multidimensional scaling program XGms (Martens, 2002).
The resulting one-dimensional configuration, as well as the estimated 95% uncertaintyintervals for the stimulus positions, are shown in Figure 6.6. These positions are determinedon an interval scale, i.e. up to an arbitrary linear transformation. Path 1 was left out of theanalysis as most users rated it consistently as the least coordinated path. The uncertaintyintervals on the position of this stimulus were very large, signaling that this stimulusposition could not be estimated reliably from the experimental data.
6.6 Comparing Objective Measures with Subjective
Rankings
The coordination values provided by the m−metric, the inefficiency measure and the pro-posed new metric (as defined in Equations 6.7 and 6.8) were also calculated for each of thepaths.
In case of the proposed new metric the scores of Equation 6.7 were calculated for valuesof θmax varying from 15 degrees to 45 degrees in steps of 5 degrees, using p values ranging
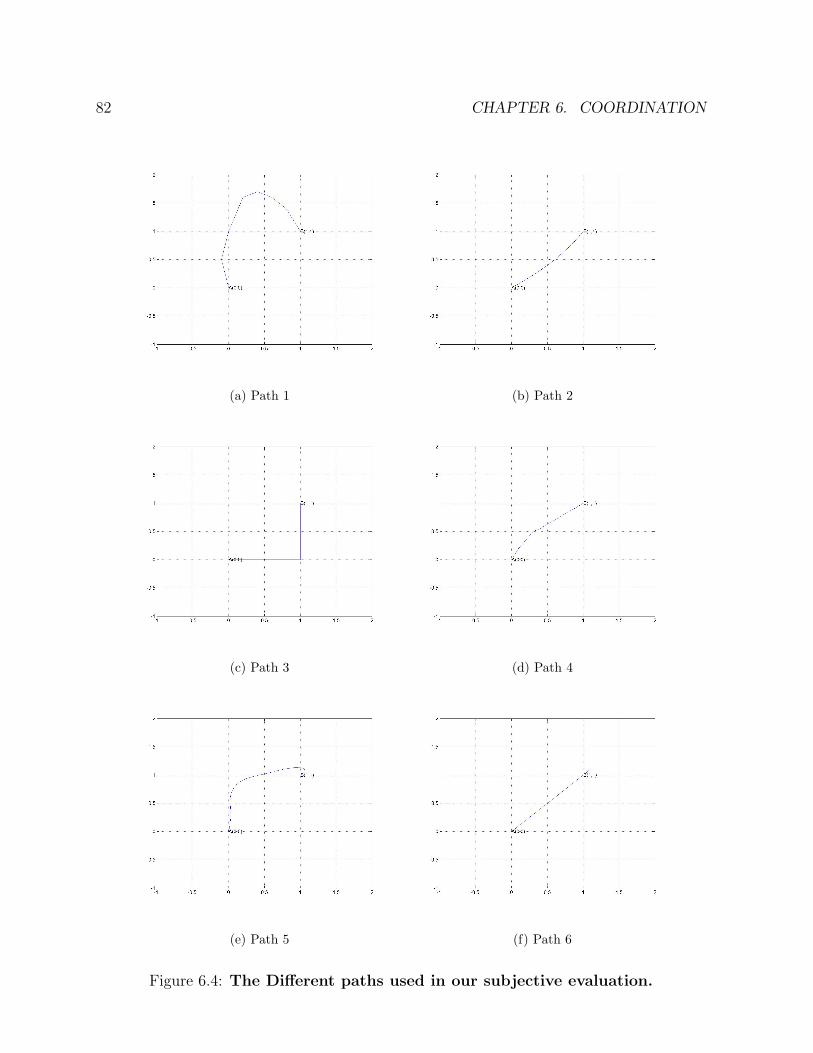
82 CHAPTER 6. COORDINATION
(a) Path 1 (b) Path 2
(c) Path 3 (d) Path 4
(e) Path 5 (f) Path 6
Figure 6.4: The Different paths used in our subjective evaluation.
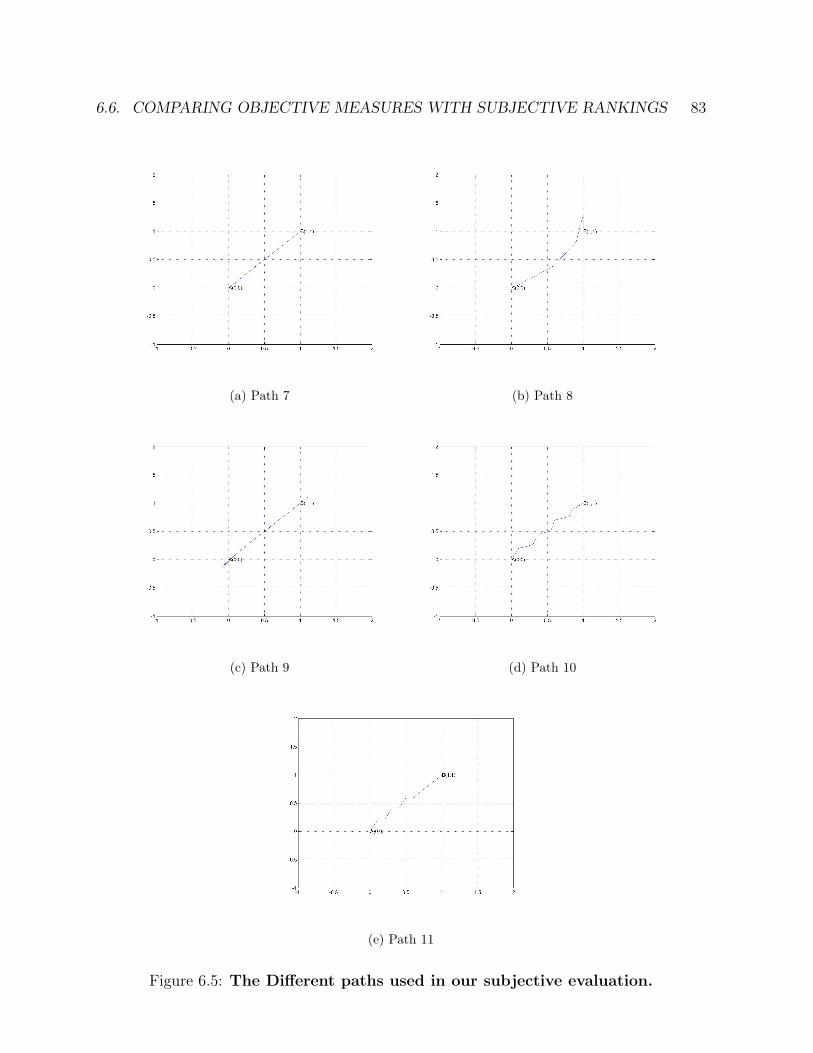
6.6. COMPARING OBJECTIVE MEASURES WITH SUBJECTIVE RANKINGS 83
(a) Path 7 (b) Path 8
(c) Path 9 (d) Path 10
(e) Path 11
Figure 6.5: The Different paths used in our subjective evaluation.
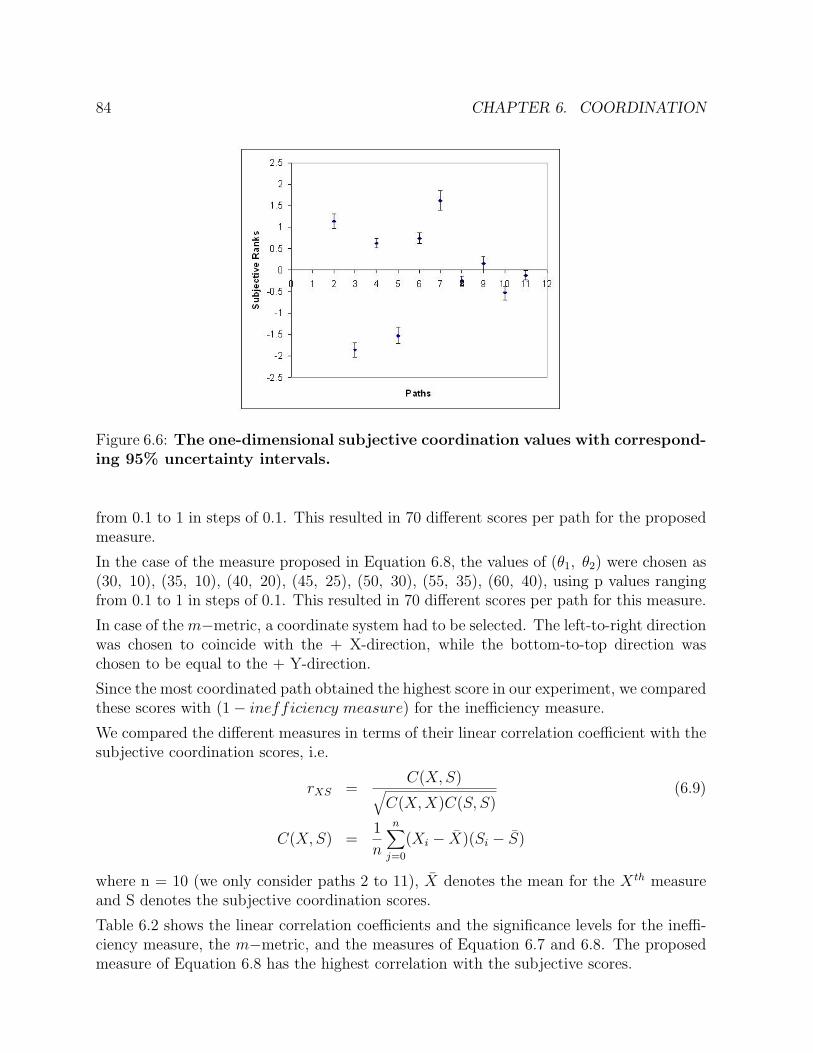
84 CHAPTER 6. COORDINATION
Figure 6.6: The one-dimensional subjective coordination values with correspond-ing 95% uncertainty intervals.
from 0.1 to 1 in steps of 0.1. This resulted in 70 different scores per path for the proposedmeasure.
In the case of the measure proposed in Equation 6.8, the values of (θ1, θ2) were chosen as(30, 10), (35, 10), (40, 20), (45, 25), (50, 30), (55, 35), (60, 40), using p values rangingfrom 0.1 to 1 in steps of 0.1. This resulted in 70 different scores per path for this measure.
In case of the m−metric, a coordinate system had to be selected. The left-to-right directionwas chosen to coincide with the + X-direction, while the bottom-to-top direction waschosen to be equal to the + Y-direction.
Since the most coordinated path obtained the highest score in our experiment, we comparedthese scores with (1− inefficiency measure) for the inefficiency measure.
We compared the different measures in terms of their linear correlation coefficient with thesubjective coordination scores, i.e.
rXS =C(X, S)√
C(X, X)C(S, S)(6.9)
C(X,S) =1
n
n∑j=0
(Xi − X)(Si − S)
where n = 10 (we only consider paths 2 to 11), X denotes the mean for the X th measureand S denotes the subjective coordination scores.
Table 6.2 shows the linear correlation coefficients and the significance levels for the ineffi-ciency measure, the m−metric, and the measures of Equation 6.7 and 6.8. The proposedmeasure of Equation 6.8 has the highest correlation with the subjective scores.
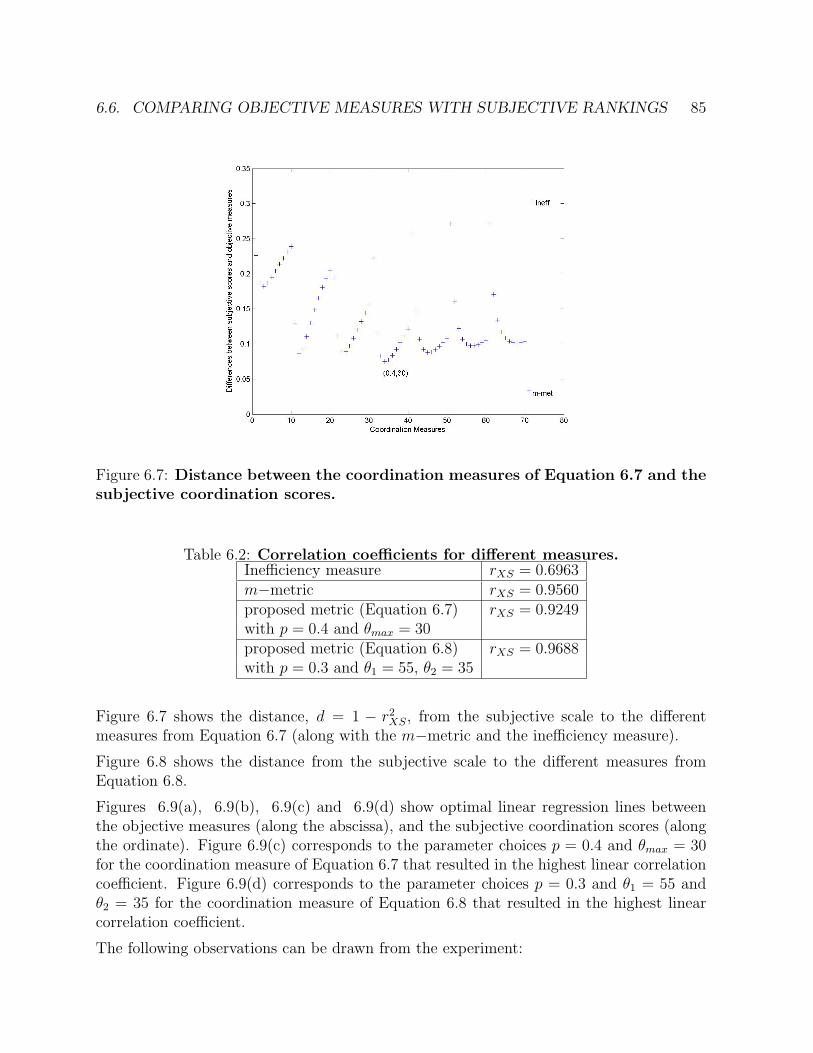
6.6. COMPARING OBJECTIVE MEASURES WITH SUBJECTIVE RANKINGS 85
Figure 6.7: Distance between the coordination measures of Equation 6.7 and thesubjective coordination scores.
Table 6.2: Correlation coefficients for different measures.Inefficiency measure rXS = 0.6963m−metric rXS = 0.9560proposed metric (Equation 6.7) rXS = 0.9249with p = 0.4 and θmax = 30proposed metric (Equation 6.8) rXS = 0.9688with p = 0.3 and θ1 = 55, θ2 = 35
Figure 6.7 shows the distance, d = 1 − r2XS, from the subjective scale to the different
measures from Equation 6.7 (along with the m−metric and the inefficiency measure).
Figure 6.8 shows the distance from the subjective scale to the different measures fromEquation 6.8.
Figures 6.9(a), 6.9(b), 6.9(c) and 6.9(d) show optimal linear regression lines betweenthe objective measures (along the abscissa), and the subjective coordination scores (alongthe ordinate). Figure 6.9(c) corresponds to the parameter choices p = 0.4 and θmax = 30for the coordination measure of Equation 6.7 that resulted in the highest linear correlationcoefficient. Figure 6.9(d) corresponds to the parameter choices p = 0.3 and θ1 = 55 andθ2 = 35 for the coordination measure of Equation 6.8 that resulted in the highest linearcorrelation coefficient.
The following observations can be drawn from the experiment:
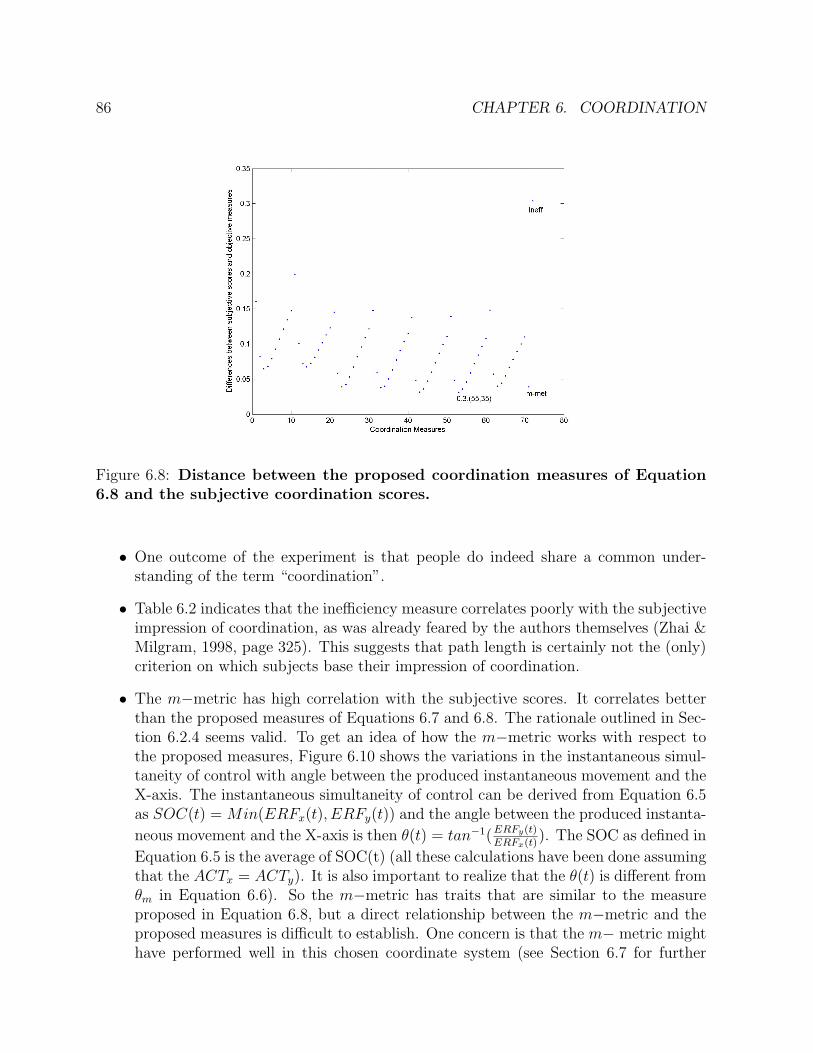
86 CHAPTER 6. COORDINATION
Figure 6.8: Distance between the proposed coordination measures of Equation6.8 and the subjective coordination scores.
• One outcome of the experiment is that people do indeed share a common under-standing of the term “coordination”.
• Table 6.2 indicates that the inefficiency measure correlates poorly with the subjectiveimpression of coordination, as was already feared by the authors themselves (Zhai &Milgram, 1998, page 325). This suggests that path length is certainly not the (only)criterion on which subjects base their impression of coordination.
• The m−metric has high correlation with the subjective scores. It correlates betterthan the proposed measures of Equations 6.7 and 6.8. The rationale outlined in Sec-tion 6.2.4 seems valid. To get an idea of how the m−metric works with respect tothe proposed measures, Figure 6.10 shows the variations in the instantaneous simul-taneity of control with angle between the produced instantaneous movement and theX-axis. The instantaneous simultaneity of control can be derived from Equation 6.5as SOC(t) = Min(ERFx(t), ERFy(t)) and the angle between the produced instanta-
neous movement and the X-axis is then θ(t) = tan−1(ERFy(t)ERFx(t)
). The SOC as defined in
Equation 6.5 is the average of SOC(t) (all these calculations have been done assumingthat the ACTx = ACTy). It is also important to realize that the θ(t) is different fromθm in Equation 6.6). So the m−metric has traits that are similar to the measureproposed in Equation 6.8, but a direct relationship between the m−metric and theproposed measures is difficult to establish. One concern is that the m− metric mighthave performed well in this chosen coordinate system (see Section 6.7 for further
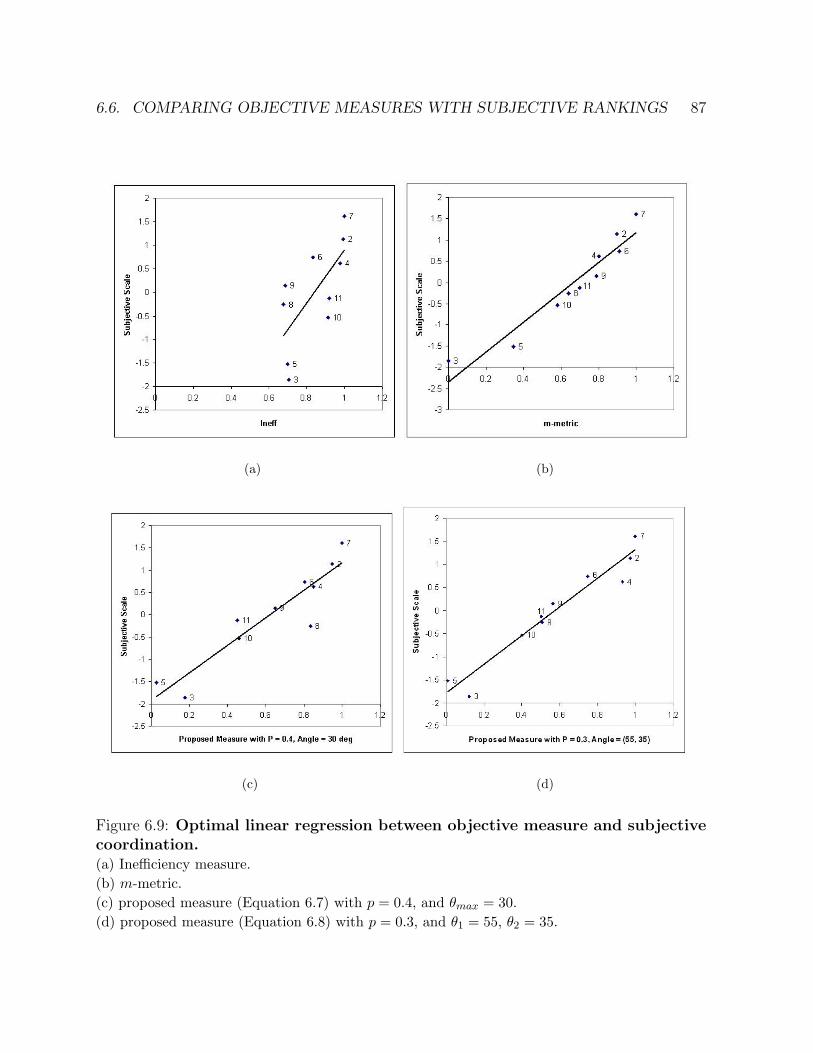
6.6. COMPARING OBJECTIVE MEASURES WITH SUBJECTIVE RANKINGS 87
(a) (b)
(c) (d)
Figure 6.9: Optimal linear regression between objective measure and subjectivecoordination.(a) Inefficiency measure.(b) m-metric.(c) proposed measure (Equation 6.7) with p = 0.4, and θmax = 30.(d) proposed measure (Equation 6.8) with p = 0.3, and θ1 = 55, θ2 = 35.
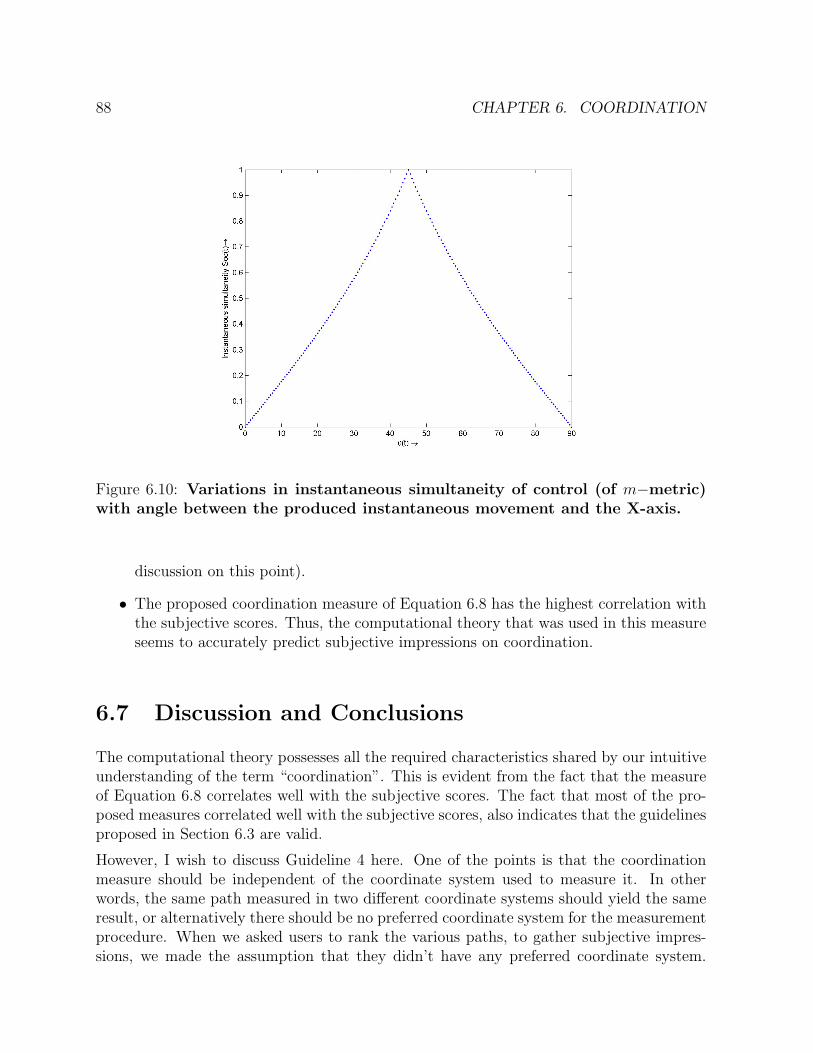
88 CHAPTER 6. COORDINATION
Figure 6.10: Variations in instantaneous simultaneity of control (of m−metric)with angle between the produced instantaneous movement and the X-axis.
discussion on this point).
• The proposed coordination measure of Equation 6.8 has the highest correlation withthe subjective scores. Thus, the computational theory that was used in this measureseems to accurately predict subjective impressions on coordination.
6.7 Discussion and Conclusions
The computational theory possesses all the required characteristics shared by our intuitiveunderstanding of the term “coordination”. This is evident from the fact that the measureof Equation 6.8 correlates well with the subjective scores. The fact that most of the pro-posed measures correlated well with the subjective scores, also indicates that the guidelinesproposed in Section 6.3 are valid.
However, I wish to discuss Guideline 4 here. One of the points is that the coordinationmeasure should be independent of the coordinate system used to measure it. In otherwords, the same path measured in two different coordinate systems should yield the sameresult, or alternatively there should be no preferred coordinate system for the measurementprocedure. When we asked users to rank the various paths, to gather subjective impres-sions, we made the assumption that they didn’t have any preferred coordinate system.
6.8. FUTURE DIRECTIONS 89
However, in retrospect I am not sure if this is the case. There is plenty of evidence tosuggest otherwise.
The information required to make a movement from an object to a target is provided to thehuman system (the central nervous system) in an extrinsic coordinate system through ourvisual inspection of the object and target. Successful movement to the target ultimatelyrequires the activation of pertinent muscles in an appropriate pattern, through the success-ful transformation from the extrinsic coordinate system to the intrinsic muscle activations.These transformations are pre-computed in our central nervous system to increase reactionspeed and efficiency of our movements. This in turn means that users have a preferredextrinsic coordinate system. Psychophysical experiments on what the natural coordinatesystem might be, has revealed that the forearm acts as one of the coordinate axes (Masliah,1999). This result is also reflected in the influential (within HCI community) theory oftwo-handed interaction proposed by Guiard (Guiard, 1987), that the right hand moveswith reference to the left hand. These results could suggest that users ranked the variouspaths using a preferred coordinate system and that the formulation of the m−metric usinga preferred coordinate system might not be entirely inappropriate.
A further drawback of this study is that subjects did not trace the various paths beforeranking them. Their rankings might have been different if they had traced the variouspaths. In clinical practice, physicians watch patients trace the path and their ranks arebased on the observation of the movement. However, I am confident that this measure laysthe foundations for deeper studies on coordination, perhaps with greater involvement fromkinesiologists.
The experiment preformed here only used artificially-generated paths. A possible alterna-tive would be to make subjects draw a trajectory from an object to the target and askthem to rate their perception of coordination after completing the task. The trajectorycould be replayed for the subjects to see how they change their perception of coordination.This would give us subjective scores for “real” paths traced by the users.
6.8 Future Directions
More experiments need to be performed to understand coordination. Three immediateissues that need to be studied are:
• The role of the coordinate system in subjective impressions of coordination for po-sitioning tasks. We could give subjects the same 2D path in various translated androtated coordinate systems (in other words, the path is translated or rotated). Ifthere are clear differences in subjective rankings of the paths, then we can concludethat subjects work with a preferred coordinate system.
• Is there a strong correlation between time and coordination of two different inputdevices? Such questions have been raised (but not fully resolved) by the inefficiency
90 CHAPTER 6. COORDINATION
measure (Zhai & Milgram, 1998) and the m−metric (Masliah, 2001). In the experi-ments performed above, we showed the subjects various trajectories and asked themto rank them. In other words, the time component of the path traced was removed.However, in clinical practices when judging coordination skills of patients, the clini-cian asks the patient to trace the paths in their presence. It can be argued, that thepath traced is as important as the act of tracing (the timing information), in judgingcoordination. A possible way to extend our experiments is by recording the subjectstracing the path and replaying it so they can judge the coordination for the pathwith the timing information.
6.8.1 Applying Coordination to TUI
When a coordination measure is developed it can be applied to characterize different inputdevices based on how well the users are able to control them. We could address questionssimilar to the ones addressed in Chapter 3 such as:
• Is there an influence of hand (dominant or non-dominant) on coordination?
• Is there an influence of grip on coordination when a TUI is used in the dominant/non-dominant hand?
We could also explore the effect of constraints and available DOF on coordination. For ex-ample, the questions in Chapter 4 can be re-addressed with coordination as a performancemeasure.
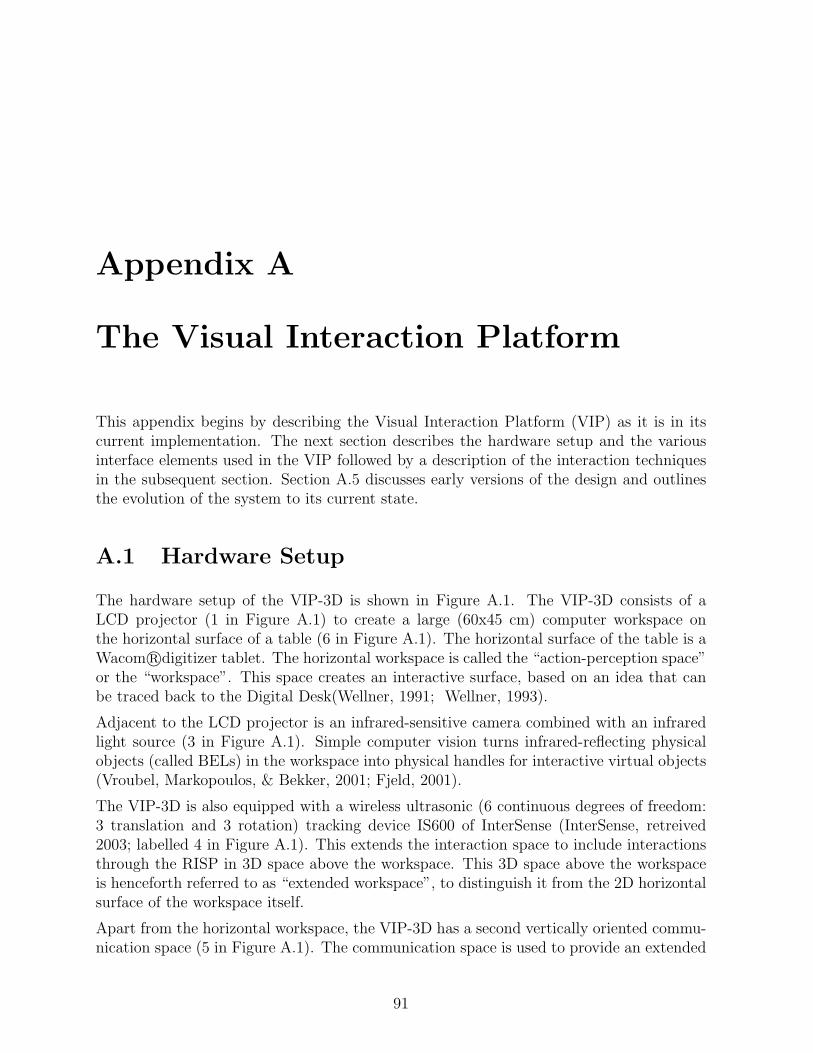
Appendix A
The Visual Interaction Platform
This appendix begins by describing the Visual Interaction Platform (VIP) as it is in itscurrent implementation. The next section describes the hardware setup and the variousinterface elements used in the VIP followed by a description of the interaction techniquesin the subsequent section. Section A.5 discusses early versions of the design and outlinesthe evolution of the system to its current state.
A.1 Hardware Setup
The hardware setup of the VIP-3D is shown in Figure A.1. The VIP-3D consists of aLCD projector (1 in Figure A.1) to create a large (60x45 cm) computer workspace onthe horizontal surface of a table (6 in Figure A.1). The horizontal surface of the table is aWacom r©digitizer tablet. The horizontal workspace is called the “action-perception space”or the “workspace”. This space creates an interactive surface, based on an idea that canbe traced back to the Digital Desk(Wellner, 1991; Wellner, 1993).
Adjacent to the LCD projector is an infrared-sensitive camera combined with an infraredlight source (3 in Figure A.1). Simple computer vision turns infrared-reflecting physicalobjects (called BELs) in the workspace into physical handles for interactive virtual objects(Vroubel, Markopoulos, & Bekker, 2001; Fjeld, 2001).
The VIP-3D is also equipped with a wireless ultrasonic (6 continuous degrees of freedom:3 translation and 3 rotation) tracking device IS600 of InterSense (InterSense, retreived2003; labelled 4 in Figure A.1). This extends the interaction space to include interactionsthrough the RISP in 3D space above the workspace. This 3D space above the workspaceis henceforth referred to as “extended workspace”, to distinguish it from the 2D horizontalsurface of the workspace itself.
Apart from the horizontal workspace, the VIP-3D has a second vertically oriented commu-nication space (5 in Figure A.1). The communication space is used to provide an extended
91
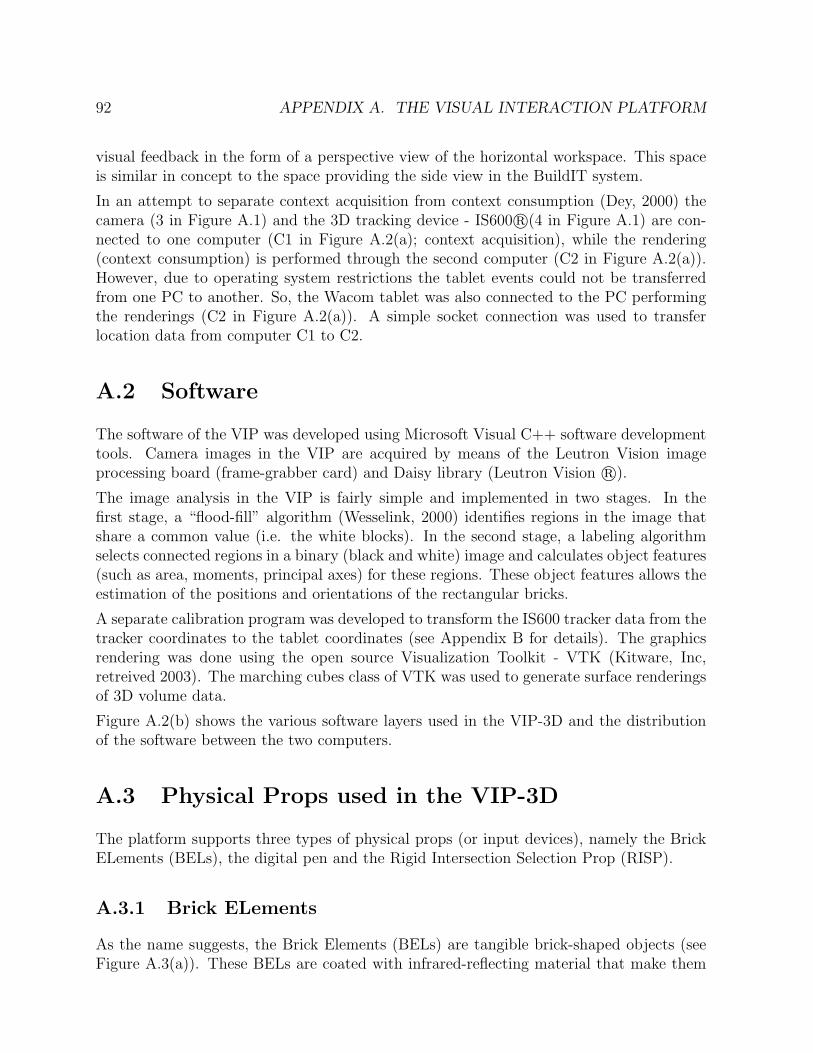
92 APPENDIX A. THE VISUAL INTERACTION PLATFORM
visual feedback in the form of a perspective view of the horizontal workspace. This spaceis similar in concept to the space providing the side view in the BuildIT system.
In an attempt to separate context acquisition from context consumption (Dey, 2000) thecamera (3 in Figure A.1) and the 3D tracking device - IS600 r©(4 in Figure A.1) are con-nected to one computer (C1 in Figure A.2(a); context acquisition), while the rendering(context consumption) is performed through the second computer (C2 in Figure A.2(a)).However, due to operating system restrictions the tablet events could not be transferredfrom one PC to another. So, the Wacom tablet was also connected to the PC performingthe renderings (C2 in Figure A.2(a)). A simple socket connection was used to transferlocation data from computer C1 to C2.
A.2 Software
The software of the VIP was developed using Microsoft Visual C++ software developmenttools. Camera images in the VIP are acquired by means of the Leutron Vision imageprocessing board (frame-grabber card) and Daisy library (Leutron Vision r©).
The image analysis in the VIP is fairly simple and implemented in two stages. In thefirst stage, a “flood-fill” algorithm (Wesselink, 2000) identifies regions in the image thatshare a common value (i.e. the white blocks). In the second stage, a labeling algorithmselects connected regions in a binary (black and white) image and calculates object features(such as area, moments, principal axes) for these regions. These object features allows theestimation of the positions and orientations of the rectangular bricks.
A separate calibration program was developed to transform the IS600 tracker data from thetracker coordinates to the tablet coordinates (see Appendix B for details). The graphicsrendering was done using the open source Visualization Toolkit - VTK (Kitware, Inc,retreived 2003). The marching cubes class of VTK was used to generate surface renderingsof 3D volume data.
Figure A.2(b) shows the various software layers used in the VIP-3D and the distributionof the software between the two computers.
A.3 Physical Props used in the VIP-3D
The platform supports three types of physical props (or input devices), namely the BrickELements (BELs), the digital pen and the Rigid Intersection Selection Prop (RISP).
A.3.1 Brick ELements
As the name suggests, the Brick Elements (BELs) are tangible brick-shaped objects (seeFigure A.3(a)). These BELs are coated with infrared-reflecting material that make them
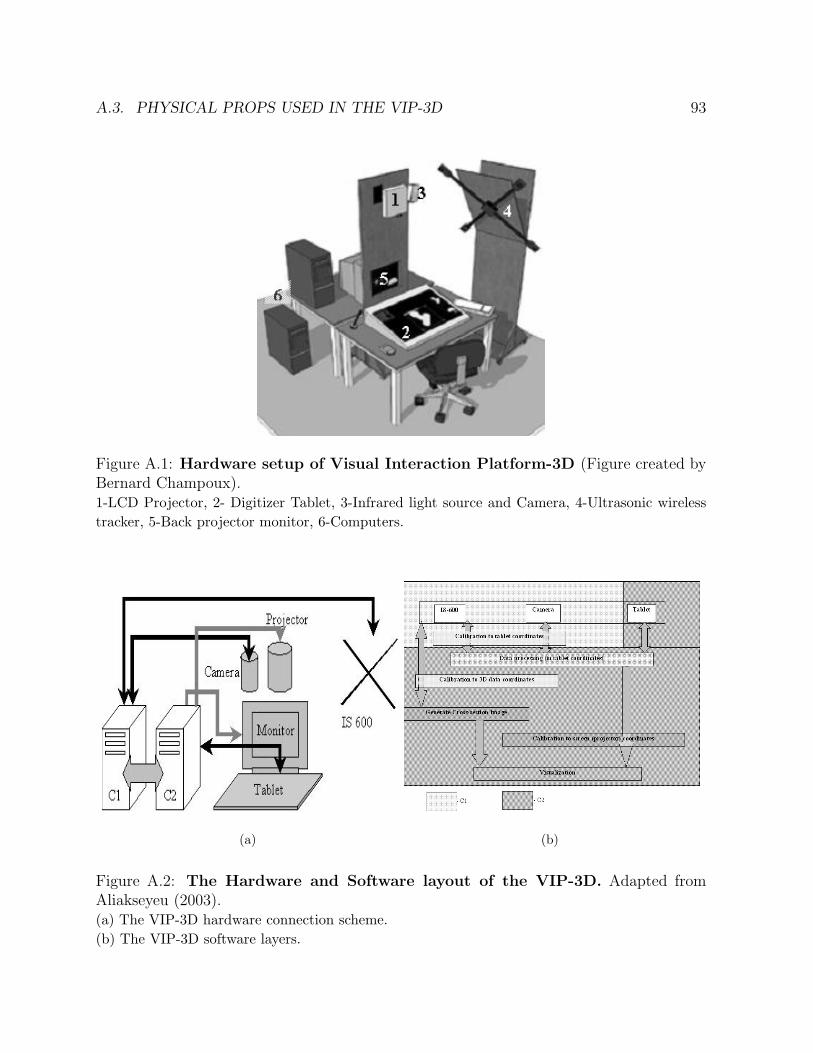
A.3. PHYSICAL PROPS USED IN THE VIP-3D 93
Figure A.1: Hardware setup of Visual Interaction Platform-3D (Figure created byBernard Champoux).1-LCD Projector, 2- Digitizer Tablet, 3-Infrared light source and Camera, 4-Ultrasonic wirelesstracker, 5-Back projector monitor, 6-Computers.
(a) (b)
Figure A.2: The Hardware and Software layout of the VIP-3D. Adapted fromAliakseyeu (2003).(a) The VIP-3D hardware connection scheme.(b) The VIP-3D software layers.
94 APPENDIX A. THE VISUAL INTERACTION PLATFORM
(a) (b) (c)
Figure A.3: Physical Props used in the VIP-3D.(a) Brick Element.(b) The Digital Pen.(c) The Rigid Intersection Selection Prop.
into physical handles for interactive virtual objects (Vroubel et al., 2001). The user canselect the virtual object intended for manipulation by placing a BEL on top of it. Theobject can be moved to the required position by dragging the BEL there. The user interactswith the system by modifying the location(s) and orientation(s) of these brick(s). Typicallythe BEL is used for either selecting a virtual object or for positioning (and orienting) thevirtual object within the workspace. The BEL can be used in the user’s dominant ornon-dominant hand (see Wesselink, 2000 for implementation details).
A.3.2 Tablet and Digital Pen
As mentioned earlier, the horizontal workspace is a Wacom UltraPad (2 in Figure A.1).The UltraPad has an active area of 63.5× 46.2cm2and a resolution of 2540 lines per inch.It consists of a tablet and digital pen (see Figure A.3(b)). The digital pen can be used likea conventional mouse or as a writing tool. The digital pen is primarily meant to supportsketching and writing tasks within the VIP, however selecting and positioning of virtualobjects can also be performed using the digital pen. The pen is recommended for use inthe user’s dominant hand (see Aliakseyeu, 2003 for implementation details).
A.3.3 Rigid Intersection Selection Prop
The RISP (see Figure A.3(c)) is a tangible 3D-input prop that is used to control a virtualintersection window. The RISP has 4 acoustic trackers attached to it, which allows it to betracked in 3D using the IS600 tracking device (InterSense, retreived 2003). The intersectionwindow can be moved through 3D data to view slices. The RISP can be used either inthe user’s dominant or the non-dominant hand (see Chapter 3 for a detailed discussion onusing the RISP in either hand using a precision or power grip).
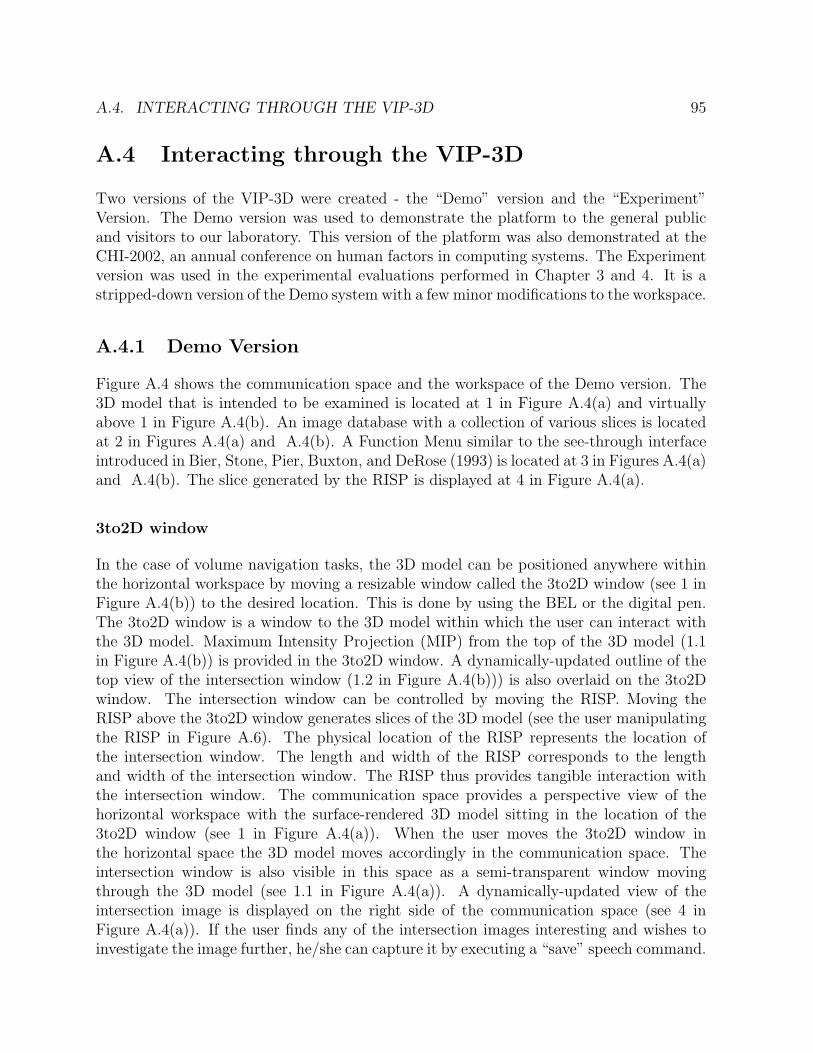
A.4. INTERACTING THROUGH THE VIP-3D 95
A.4 Interacting through the VIP-3D
Two versions of the VIP-3D were created - the “Demo” version and the “Experiment”Version. The Demo version was used to demonstrate the platform to the general publicand visitors to our laboratory. This version of the platform was also demonstrated at theCHI-2002, an annual conference on human factors in computing systems. The Experimentversion was used in the experimental evaluations performed in Chapter 3 and 4. It is astripped-down version of the Demo system with a few minor modifications to the workspace.
A.4.1 Demo Version
Figure A.4 shows the communication space and the workspace of the Demo version. The3D model that is intended to be examined is located at 1 in Figure A.4(a) and virtuallyabove 1 in Figure A.4(b). An image database with a collection of various slices is locatedat 2 in Figures A.4(a) and A.4(b). A Function Menu similar to the see-through interfaceintroduced in Bier, Stone, Pier, Buxton, and DeRose (1993) is located at 3 in Figures A.4(a)and A.4(b). The slice generated by the RISP is displayed at 4 in Figure A.4(a).
3to2D window
In the case of volume navigation tasks, the 3D model can be positioned anywhere withinthe horizontal workspace by moving a resizable window called the 3to2D window (see 1 inFigure A.4(b)) to the desired location. This is done by using the BEL or the digital pen.The 3to2D window is a window to the 3D model within which the user can interact withthe 3D model. Maximum Intensity Projection (MIP) from the top of the 3D model (1.1in Figure A.4(b)) is provided in the 3to2D window. A dynamically-updated outline of thetop view of the intersection window (1.2 in Figure A.4(b))) is also overlaid on the 3to2Dwindow. The intersection window can be controlled by moving the RISP. Moving theRISP above the 3to2D window generates slices of the 3D model (see the user manipulatingthe RISP in Figure A.6). The physical location of the RISP represents the location ofthe intersection window. The length and width of the RISP corresponds to the lengthand width of the intersection window. The RISP thus provides tangible interaction withthe intersection window. The communication space provides a perspective view of thehorizontal workspace with the surface-rendered 3D model sitting in the location of the3to2D window (see 1 in Figure A.4(a)). When the user moves the 3to2D window inthe horizontal space the 3D model moves accordingly in the communication space. Theintersection window is also visible in this space as a semi-transparent window movingthrough the 3D model (see 1.1 in Figure A.4(a)). A dynamically-updated view of theintersection image is displayed on the right side of the communication space (see 4 inFigure A.4(a)). If the user finds any of the intersection images interesting and wishes toinvestigate the image further, he/she can capture it by executing a “save” speech command.
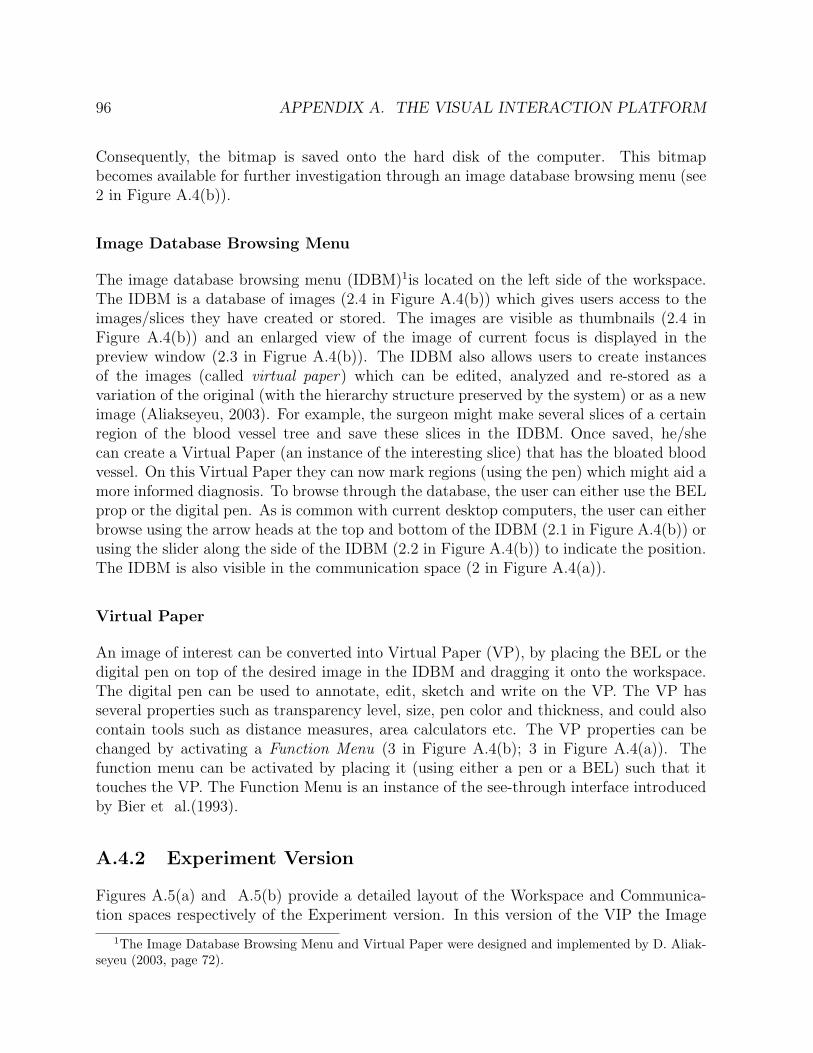
96 APPENDIX A. THE VISUAL INTERACTION PLATFORM
Consequently, the bitmap is saved onto the hard disk of the computer. This bitmapbecomes available for further investigation through an image database browsing menu (see2 in Figure A.4(b)).
Image Database Browsing Menu
The image database browsing menu (IDBM)1is located on the left side of the workspace.The IDBM is a database of images (2.4 in Figure A.4(b)) which gives users access to theimages/slices they have created or stored. The images are visible as thumbnails (2.4 inFigure A.4(b)) and an enlarged view of the image of current focus is displayed in thepreview window (2.3 in Figrue A.4(b)). The IDBM also allows users to create instancesof the images (called virtual paper) which can be edited, analyzed and re-stored as avariation of the original (with the hierarchy structure preserved by the system) or as a newimage (Aliakseyeu, 2003). For example, the surgeon might make several slices of a certainregion of the blood vessel tree and save these slices in the IDBM. Once saved, he/shecan create a Virtual Paper (an instance of the interesting slice) that has the bloated bloodvessel. On this Virtual Paper they can now mark regions (using the pen) which might aid amore informed diagnosis. To browse through the database, the user can either use the BELprop or the digital pen. As is common with current desktop computers, the user can eitherbrowse using the arrow heads at the top and bottom of the IDBM (2.1 in Figure A.4(b)) orusing the slider along the side of the IDBM (2.2 in Figure A.4(b)) to indicate the position.The IDBM is also visible in the communication space (2 in Figure A.4(a)).
Virtual Paper
An image of interest can be converted into Virtual Paper (VP), by placing the BEL or thedigital pen on top of the desired image in the IDBM and dragging it onto the workspace.The digital pen can be used to annotate, edit, sketch and write on the VP. The VP hasseveral properties such as transparency level, size, pen color and thickness, and could alsocontain tools such as distance measures, area calculators etc. The VP properties can bechanged by activating a Function Menu (3 in Figure A.4(b); 3 in Figure A.4(a)). Thefunction menu can be activated by placing it (using either a pen or a BEL) such that ittouches the VP. The Function Menu is an instance of the see-through interface introducedby Bier et al.(1993).
A.4.2 Experiment Version
Figures A.5(a) and A.5(b) provide a detailed layout of the Workspace and Communica-tion spaces respectively of the Experiment version. In this version of the VIP the Image
1The Image Database Browsing Menu and Virtual Paper were designed and implemented by D. Aliak-seyeu (2003, page 72).
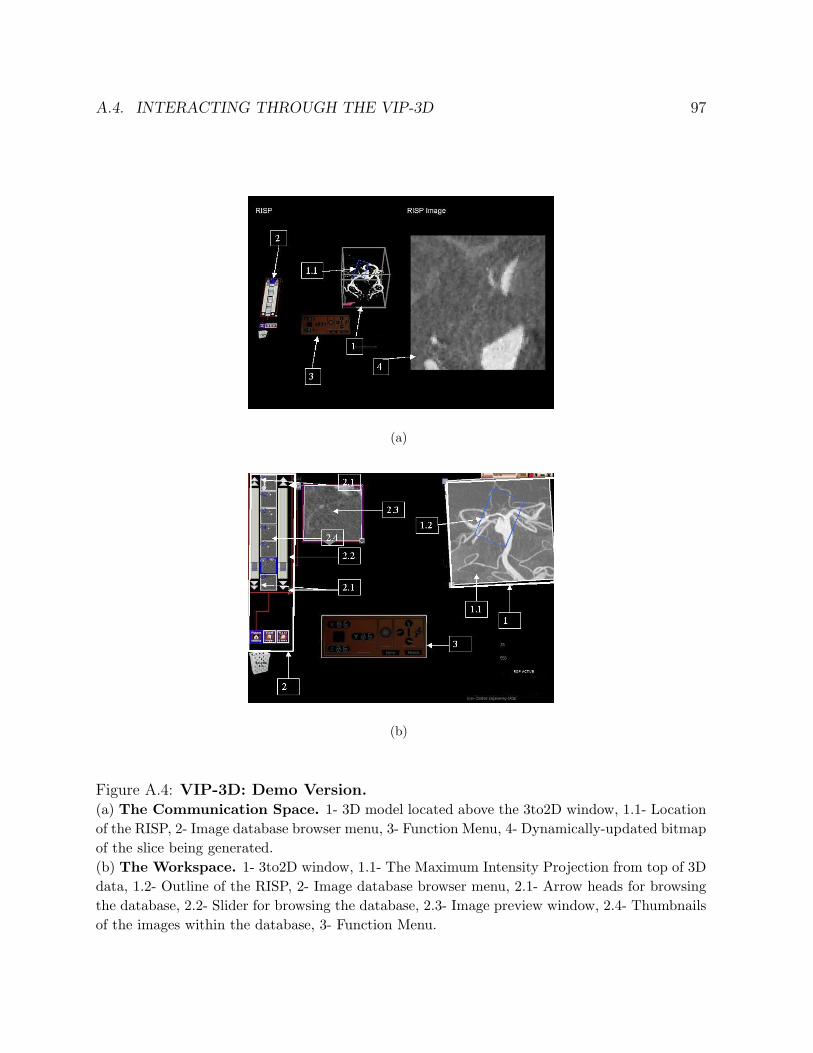
A.4. INTERACTING THROUGH THE VIP-3D 97
(a)
(b)
Figure A.4: VIP-3D: Demo Version.(a) The Communication Space. 1- 3D model located above the 3to2D window, 1.1- Locationof the RISP, 2- Image database browser menu, 3- Function Menu, 4- Dynamically-updated bitmapof the slice being generated.(b) The Workspace. 1- 3to2D window, 1.1- The Maximum Intensity Projection from top of 3Ddata, 1.2- Outline of the RISP, 2- Image database browser menu, 2.1- Arrow heads for browsingthe database, 2.2- Slider for browsing the database, 2.3- Image preview window, 2.4- Thumbnailsof the images within the database, 3- Function Menu.
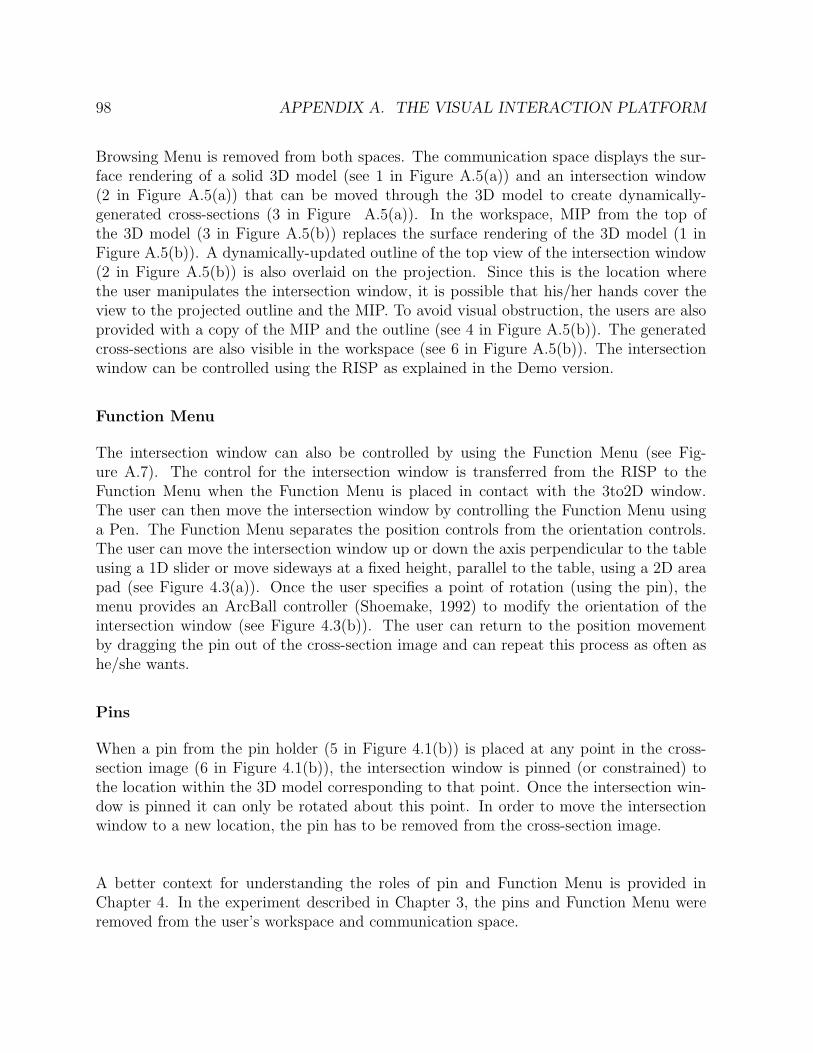
98 APPENDIX A. THE VISUAL INTERACTION PLATFORM
Browsing Menu is removed from both spaces. The communication space displays the sur-face rendering of a solid 3D model (see 1 in Figure A.5(a)) and an intersection window(2 in Figure A.5(a)) that can be moved through the 3D model to create dynamically-generated cross-sections (3 in Figure A.5(a)). In the workspace, MIP from the top ofthe 3D model (3 in Figure A.5(b)) replaces the surface rendering of the 3D model (1 inFigure A.5(b)). A dynamically-updated outline of the top view of the intersection window(2 in Figure A.5(b)) is also overlaid on the projection. Since this is the location wherethe user manipulates the intersection window, it is possible that his/her hands cover theview to the projected outline and the MIP. To avoid visual obstruction, the users are alsoprovided with a copy of the MIP and the outline (see 4 in Figure A.5(b)). The generatedcross-sections are also visible in the workspace (see 6 in Figure A.5(b)). The intersectionwindow can be controlled using the RISP as explained in the Demo version.
Function Menu
The intersection window can also be controlled by using the Function Menu (see Fig-ure A.7). The control for the intersection window is transferred from the RISP to theFunction Menu when the Function Menu is placed in contact with the 3to2D window.The user can then move the intersection window by controlling the Function Menu usinga Pen. The Function Menu separates the position controls from the orientation controls.The user can move the intersection window up or down the axis perpendicular to the tableusing a 1D slider or move sideways at a fixed height, parallel to the table, using a 2D areapad (see Figure 4.3(a)). Once the user specifies a point of rotation (using the pin), themenu provides an ArcBall controller (Shoemake, 1992) to modify the orientation of theintersection window (see Figure 4.3(b)). The user can return to the position movementby dragging the pin out of the cross-section image and can repeat this process as often ashe/she wants.
Pins
When a pin from the pin holder (5 in Figure 4.1(b)) is placed at any point in the cross-section image (6 in Figure 4.1(b)), the intersection window is pinned (or constrained) tothe location within the 3D model corresponding to that point. Once the intersection win-dow is pinned it can only be rotated about this point. In order to move the intersectionwindow to a new location, the pin has to be removed from the cross-section image.
A better context for understanding the roles of pin and Function Menu is provided inChapter 4. In the experiment described in Chapter 3, the pins and Function Menu wereremoved from the user’s workspace and communication space.

A.4. INTERACTING THROUGH THE VIP-3D 99
(a)
(b)
Figure A.5: VIP-3D: Experimental Version.(a) The Communication Space. 1 - rendering of workspace with solid 3D model, 2 - intersec-tion window, 3 - generated cross-section image.(b) The Workspace. 1 - Location of the 3D model, 2 - Outline of the Intersection window,3 - The Maximum Intensity Projection of the 3D model, 4 - A Copy of 2 and 3, 5 - Pins, 6 -Cross-section Image.
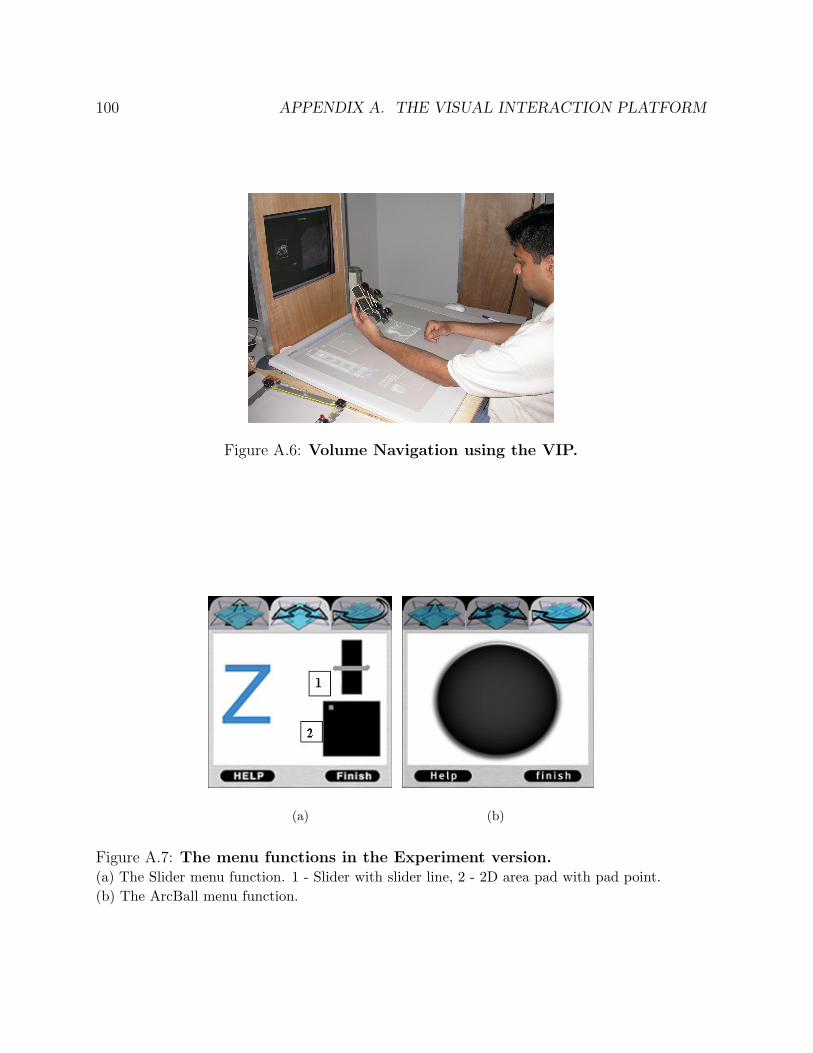
100 APPENDIX A. THE VISUAL INTERACTION PLATFORM
Figure A.6: Volume Navigation using the VIP.
(a) (b)
Figure A.7: The menu functions in the Experiment version.(a) The Slider menu function. 1 - Slider with slider line, 2 - 2D area pad with pad point.(b) The ArcBall menu function.
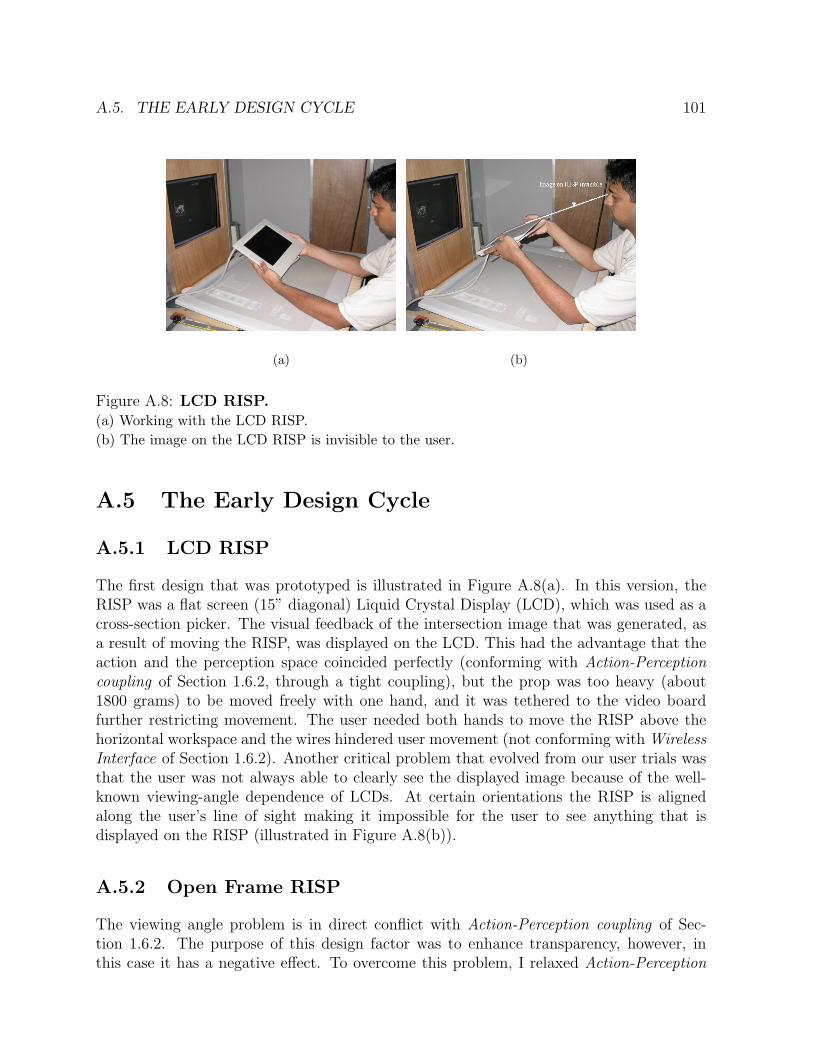
A.5. THE EARLY DESIGN CYCLE 101
(a) (b)
Figure A.8: LCD RISP.(a) Working with the LCD RISP.(b) The image on the LCD RISP is invisible to the user.
A.5 The Early Design Cycle
A.5.1 LCD RISP
The first design that was prototyped is illustrated in Figure A.8(a). In this version, theRISP was a flat screen (15” diagonal) Liquid Crystal Display (LCD), which was used as across-section picker. The visual feedback of the intersection image that was generated, asa result of moving the RISP, was displayed on the LCD. This had the advantage that theaction and the perception space coincided perfectly (conforming with Action-Perceptioncoupling of Section 1.6.2, through a tight coupling), but the prop was too heavy (about1800 grams) to be moved freely with one hand, and it was tethered to the video boardfurther restricting movement. The user needed both hands to move the RISP above thehorizontal workspace and the wires hindered user movement (not conforming with WirelessInterface of Section 1.6.2). Another critical problem that evolved from our user trials wasthat the user was not always able to clearly see the displayed image because of the well-known viewing-angle dependence of LCDs. At certain orientations the RISP is alignedalong the user’s line of sight making it impossible for the user to see anything that isdisplayed on the RISP (illustrated in Figure A.8(b)).
A.5.2 Open Frame RISP
The viewing angle problem is in direct conflict with Action-Perception coupling of Sec-tion 1.6.2. The purpose of this design factor was to enhance transparency, however, inthis case it has a negative effect. To overcome this problem, I relaxed Action-Perception
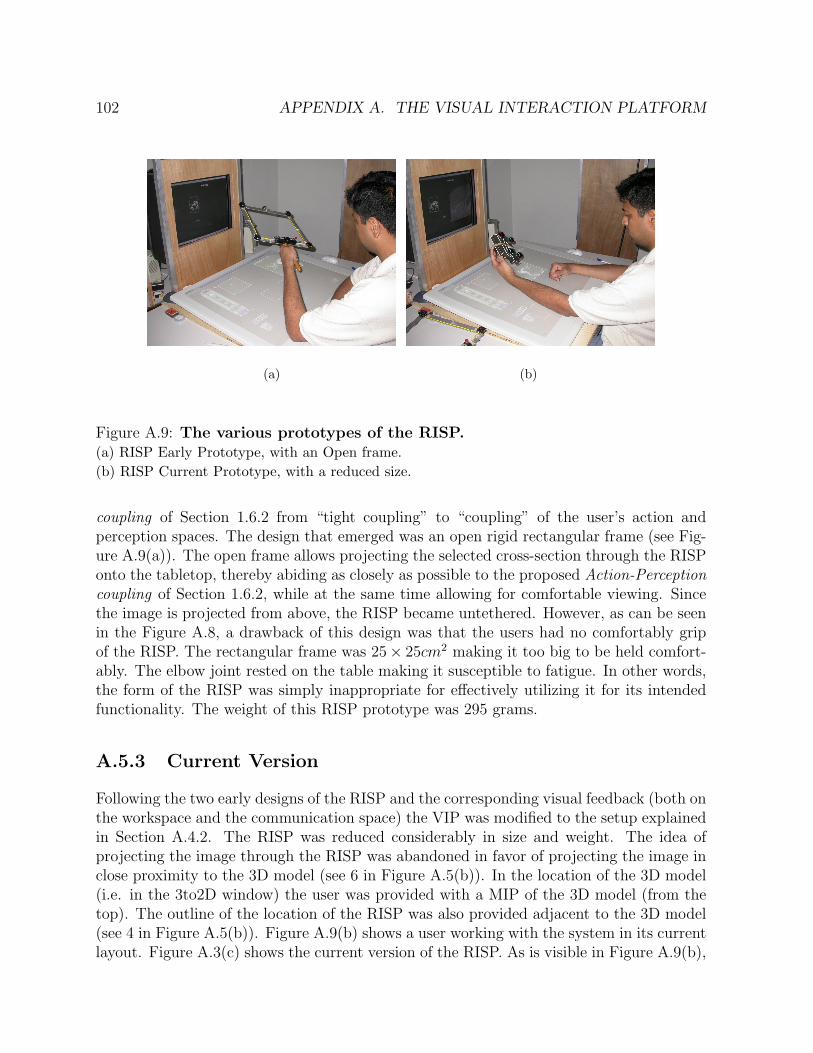
102 APPENDIX A. THE VISUAL INTERACTION PLATFORM
(a) (b)
Figure A.9: The various prototypes of the RISP.(a) RISP Early Prototype, with an Open frame.(b) RISP Current Prototype, with a reduced size.
coupling of Section 1.6.2 from “tight coupling” to “coupling” of the user’s action andperception spaces. The design that emerged was an open rigid rectangular frame (see Fig-ure A.9(a)). The open frame allows projecting the selected cross-section through the RISPonto the tabletop, thereby abiding as closely as possible to the proposed Action-Perceptioncoupling of Section 1.6.2, while at the same time allowing for comfortable viewing. Sincethe image is projected from above, the RISP became untethered. However, as can be seenin the Figure A.8, a drawback of this design was that the users had no comfortably gripof the RISP. The rectangular frame was 25× 25cm2 making it too big to be held comfort-ably. The elbow joint rested on the table making it susceptible to fatigue. In other words,the form of the RISP was simply inappropriate for effectively utilizing it for its intendedfunctionality. The weight of this RISP prototype was 295 grams.
A.5.3 Current Version
Following the two early designs of the RISP and the corresponding visual feedback (both onthe workspace and the communication space) the VIP was modified to the setup explainedin Section A.4.2. The RISP was reduced considerably in size and weight. The idea ofprojecting the image through the RISP was abandoned in favor of projecting the image inclose proximity to the 3D model (see 6 in Figure A.5(b)). In the location of the 3D model(i.e. in the 3to2D window) the user was provided with a MIP of the 3D model (from thetop). The outline of the location of the RISP was also provided adjacent to the 3D model(see 4 in Figure A.5(b)). Figure A.9(b) shows a user working with the system in its currentlayout. Figure A.3(c) shows the current version of the RISP. As is visible in Figure A.9(b),

A.5. THE EARLY DESIGN CYCLE 103
when using this version of the RISP, the user’s forearm rests on the workspace making itless fatiguing.
Appendix B
Calibration Procedure
This section describes the procedure adopted to convert the RISP coordinate data fromIS600 coordinate system to the tablet coordinate system. It already assumes calibrationbetween the projector and tablet (see Aliakseyeu, 2003 for implementation details). Thesystem obtains tie points for calibrating by consecutively projecting five crosshairs (notall points are on a plane) at which the user has to place an IS600 tracker pod. With thisinformation, one can calculate the mappings using the following procedure. Mathemati-cally, this procedure can be formulated as trying to find a scale factor s, an orthonormaltransformation matrix U and a translation matrix C (see Martens, 2003, Page 285) suchthat
T = I.(sU) + C (B.1)
where the 5× 3 matrix T is the RISP coordinate data in tablet coordinates and the 5× 3matrix I is the same data in IS600 coordinates. The scale factor s and the transformationmatric U are determined by minimizing the sum of the squared distances between thestimulus positions (T and I).
s =trace(T tIU)
trace(U tI tIU)(B.2)
U = PQt (B.3)
where I tT = PSQt is the singular value decomposition of the 3 × 3 matrix I tT , and S isa diagonal matrix of singular values.
X t is the transpose of X.
T = T + CT such that column averages of T are 0. C = CI .sU − CT
104
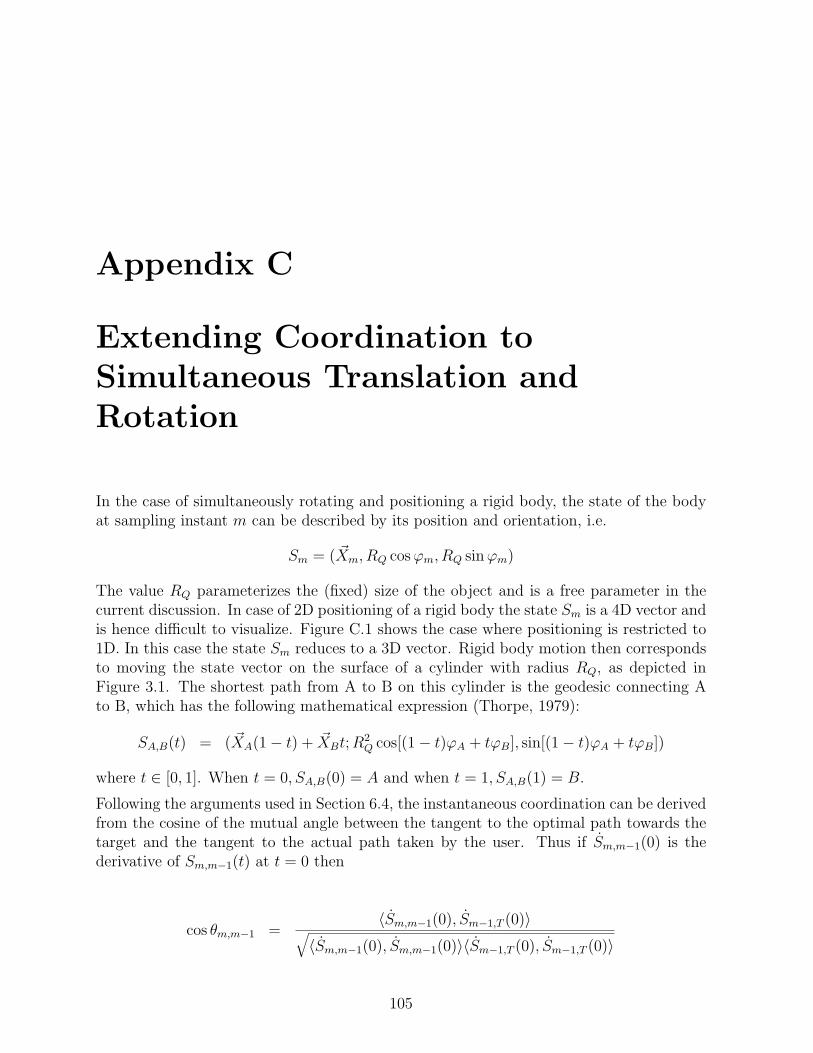
Appendix C
Extending Coordination toSimultaneous Translation andRotation
In the case of simultaneously rotating and positioning a rigid body, the state of the bodyat sampling instant m can be described by its position and orientation, i.e.
Sm = ( ~Xm, RQ cos ϕm, RQ sin ϕm)
The value RQ parameterizes the (fixed) size of the object and is a free parameter in thecurrent discussion. In case of 2D positioning of a rigid body the state Sm is a 4D vector andis hence difficult to visualize. Figure C.1 shows the case where positioning is restricted to1D. In this case the state Sm reduces to a 3D vector. Rigid body motion then correspondsto moving the state vector on the surface of a cylinder with radius RQ, as depicted inFigure 3.1. The shortest path from A to B on this cylinder is the geodesic connecting Ato B, which has the following mathematical expression (Thorpe, 1979):
SA,B(t) = ( ~XA(1− t) + ~XBt; R2Q cos[(1− t)ϕA + tϕB], sin[(1− t)ϕA + tϕB])
where t ∈ [0, 1]. When t = 0, SA,B(0) = A and when t = 1, SA,B(1) = B.
Following the arguments used in Section 6.4, the instantaneous coordination can be derivedfrom the cosine of the mutual angle between the tangent to the optimal path towards thetarget and the tangent to the actual path taken by the user. Thus if Sm,m−1(0) is thederivative of Sm,m−1(t) at t = 0 then
cos θm,m−1 =〈Sm,m−1(0), Sm−1,T (0)〉√
〈Sm,m−1(0), Sm,m−1(0)〉〈Sm−1,T (0), Sm−1,T (0)〉
105
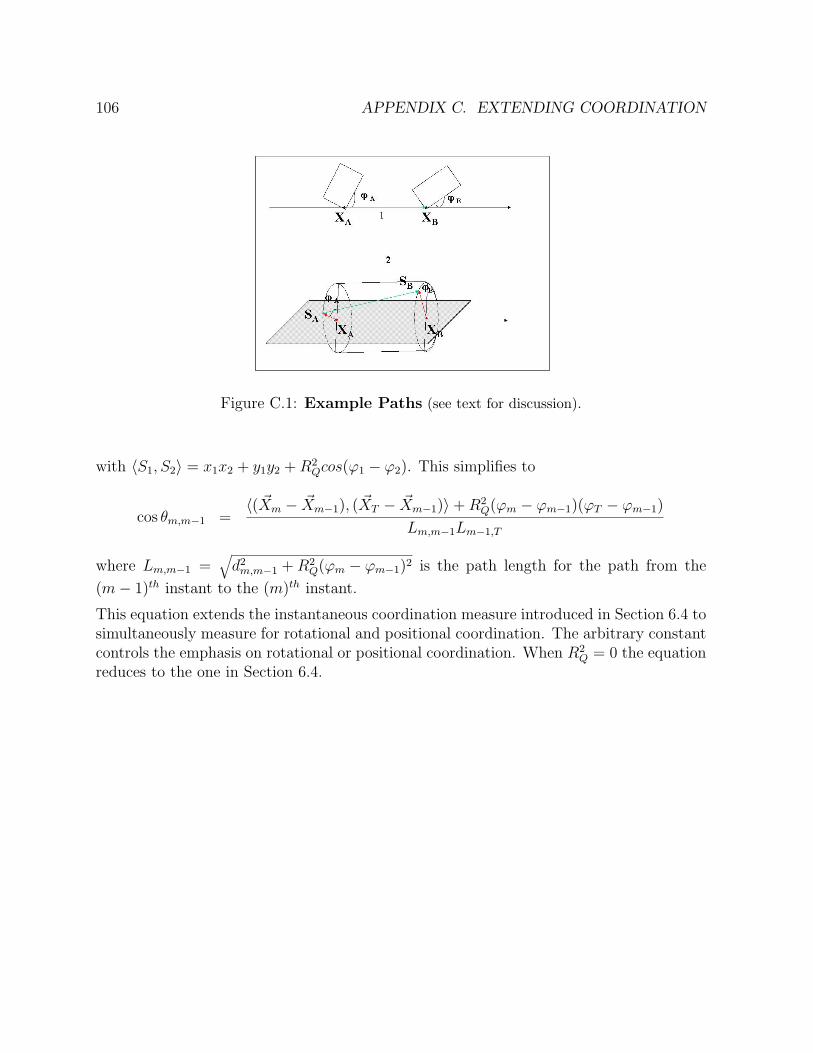
106 APPENDIX C. EXTENDING COORDINATION
Figure C.1: Example Paths (see text for discussion).
with 〈S1, S2〉 = x1x2 + y1y2 + R2Qcos(ϕ1 − ϕ2). This simplifies to
cos θm,m−1 =〈( ~Xm − ~Xm−1), ( ~XT − ~Xm−1)〉+ R2
Q(ϕm − ϕm−1)(ϕT − ϕm−1)
Lm,m−1Lm−1,T
where Lm,m−1 =√
d2m,m−1 + R2
Q(ϕm − ϕm−1)2 is the path length for the path from the
(m− 1)th instant to the (m)th instant.
This equation extends the instantaneous coordination measure introduced in Section 6.4 tosimultaneously measure for rotational and positional coordination. The arbitrary constantcontrols the emphasis on rotational or positional coordination. When R2
Q = 0 the equationreduces to the one in Section 6.4.
Bibliography
Aarts, E., & Marzano, S. (Eds.). (2003). The new everyday: Views on ambient intelligence.Philips.
Abowd, G. D., Atkeson, C. G., Bobick, A. F., Essa, I. A., MacIntyre, B., Mynatt, E. D.,& Starner, T. E. (2000). Living laboratories: the future computing environmentsgroup at the Georgia Institute of Technology. In Extended abstracts of the CHI’00conference on Human factors in computing systems (pp. 215–216). ACM Press.
Abowd, G. D., & Mynatt, E. D. (2000). Charting past, present and future research inubiquitous computing. ACM Transactions of Computer-Human Interaction, 7 (1),29–58.
Abowd, G. D., Mynatt, E. D., & Rodden, T. (2002). The human experience. PervasiveComputing, 1 (1), 48–57.
Accot, J., & Zhai, S. (1999). Performance evaluation of input devices in trajectory-basedtasks: an application of the steering law. In Proceeding of the CHI’98 conference onHuman factors in computing systems (pp. 466–472). ACM Press.
Aliakseyeu, D. (2003). A computer support tool for the early stages of architectural design.Technische Universiteit Eindhoven. (PhD Dissertation)
Aliakseyeu, D., Martens, J.-B., Subramanian, S., Vroubel, M., & Wesselink, W. (2001).Visual Interaction Platform. In Human-Computer Interaction INTERACT2001 (pp.232–239). IFIP/ IOS Press.
Anderson, D., Frankel, J. L., Marks, J., Agarwala, A., Beardsley, P., Hodgins, J., Leigh,D., Ryall, K., Sullivan, E., & Yedidia, J. S. (2000). Tangible interaction + graphicalinterpretation: a new approach to 3D modeling. In Proceedings of the 27th annualconference on Computer graphics and interactive techniques (pp. 393–402). ACMPress.
Ballagas, R., Ringel, M., Stone, M., & Borchers, J. (2003). istuff: a physical user inter-face toolkit for ubiquitous computing environments. In Proceedings of the CHI’03conference on Human factors in computing systems (pp. 537–544). ACM Press.
107
108 BIBLIOGRAPHY
Bellotti, V., Back, M., Edwards, W. K., Grinter, R. E., Henderson, A., & Lopes, C. (2002).Making sense of sensing systems: five questions for designers and researchers. InProceedings of the CHI’02 conference on Human factors in computing systems (pp.415–422). ACM Press.
Bier, E. A., Stone, M. C., Pier, K., Buxton, W., & DeRose, T. D. (1993). Toolglass andMagic Lenses: The See-Through Interface. In Conference on computer graphics andinteractive techniques (pp. 73–80). ACM Press.
Binsted, G., Chua, R., Helsen, W., & Elliot, D. (2001). Eye-Hand coordination in goal-directed aiming. Human Movement Science, 20, 563–585.
Blythe, M. A., Monk, A. F., Overbeeke, K., & Wright, P. C. (Eds.). (2003). Funology:From usability to enjoyment. Kluwer Academic Publishers.
Bowman, D., Kruijff, E., LaViola, J., & Poupyrev, I. (2001). An introduction to 3D userinterface design. Presence: Teleoperators and Virtual Environments, 10 (1), 96–108.
Buxton, W., & Myers, B. (1986). A study in two-handed input. In Proceedings of theCHI’86 conference on Human factors in computing systems (pp. 321–326). ACMPress.
Calvillo-Gamez, E., Leland, N., Shaer, O., & Jacob, R. (2003). The TAC Paradigm:Unified Conceptual Framework to Represent Tangible User. In CLIHC 2003 LatinAmerican Conference on Human-Computer Interaction. ACM Press. (in press)
Card, S. K., Mackinlay, J. D., & Robertson, G. G. (1991). A morphological analysis of thedesign space of input devices. ACM Transactions on Information Systems (TOIS),9 (2), 99–122.
Dewey, D., Kaplan, B. J., Crawford, S. G., & Wilson, B. N. (2002). Developmentalcoordination disorder: Associated problems in attention, learning, and psychosocialadjustment. Human Movement Science, 21 (5–6), 905–918.
Dey, A. K. (2000). Providing architectural support for building context-aware applica-tions. Unpublished doctoral dissertation, College of Computing, Georgia Institute ofTechnology.
Djajadiningrat, J. P., Overbeeke, C. J., & Wensveen, S. A. G. (2000). Augmenting fun andbeauty: a pamphlet. In Proceedings of DARE 2000 on designing augmented realityenvironments (pp. 131–134). ACM Press.
Dourish, P. (2001). Where the action is: The foundation of embodied interaction. Cam-bridge, Massachusetts: MIT Press.
Eggen, B., Feijs, L., & Peters, P. (2003). Linking physical and virtual interaction spaces. InProceedings of the international conference on entertainment computing. (in press)
BIBLIOGRAPHY 109
Feiner, S., Fuchs, H., Kanade, T., Klinker, G., Milgram, P., & Tamura, H. (1999). Mixedreality: where real and virtual worlds meet. In ACM SIGGRAPH ‘99 conferenceabstracts and applications (pp. 156–158). ACM Press.
Fischer, A., & Kondraske, G. (1997). A new approach to human motion quality measure-ment. In Proceedings of the annual IEEE conference on Engineering in Medicine andBiology (pp. 1701 – 1704). IEEE.
Fitzmaurice, G. W., Ishii, H., & Buxton, W. A. S. (1995). Bricks: laying the foundationsfor graspable user interfaces. In Proceedings of the CHI’95 conference on Humanfactors in computing systems (pp. 442–449). ACM Press.
Fjeld, M. (2001). Designing for tangible interaction. Unpublished doctoral dissertation,Eidgenossische Technische Hoghschule (ETH), Zurich.
Fjeld, M., Bichsel, M., & Rauterberg, M. (1998). BUILD-IT: an intuitive design tool basedon direct object manipulation. Gesture and Sign Language in Human-Computer In-teraction. Lecture Notes in Artificial Intelligence, 1371, 297–308.
Frohlich, B., & Plate, J. (2000). The cubic mouse: a new device for three-dimensionalinput. In Proceedings of the CHI’00 conference on Human factors in computingsystems (pp. 526–531). ACM Press.
Greenberg, S., & Fitchett, C. (2001). Phidgets: easy development of physical interfacesthrough physical widgets. In Proceedings of the ACM symposium on user interfacesoftware and technology (pp. 209–218). ACM Press.
Gribnau, M. W. (1999). Two-handed interaction in computer supported 3D conceptualmodelling. PhD dissertation, Technische Universiteit Delft.
Gribnau, M. W., & Hennessey, J. M. (1998). Comparing single- and two-handed 3D inputfor a 3D object assembly task. In Extended abstracts of CHI’98 conference on Humanfactors in computing systems (pp. 233–234). ACM Press.
Guiard, Y. (1987). Asymmetric division of labor in human skilled bimanual action: Thekinematic chain as a model. Journal of Motor Behavior, 4 (19), 486–517.
Hinckley, K., Jacob, R., & Ware, C. (2003). Input/output Devices and Interaction Tech-niques. In A. Tucker (Ed.), The computer science and engineering handbook (Seconded., p. (in press)). CRC Press.
Hinckley, K., Pausch, R., Goble, J. C., & Kassell, N. F. (1994a). Passive real-world interfaceprops for neurosurgical visualization. In Proceedings of the CHI’94 conference onHuman factors in computing systems (pp. 452–458). ACM Press.
110 BIBLIOGRAPHY
Hinckley, K., Pausch, R., Goble, J. C., & Kassell, N. F. (1994b). A survey of design issuesin spatial input. In Proceedings of the Symposium on User Interface Software andTechnology (pp. 213–222). ACM Press.
Hinckley, K., Pausch, R., Proffitt, D., & Kassell, N. F. (1998). Two-handed virtualmanipulation. ACM Transactions on Computer-Human Interaction (TOCHI), 5 (3),260–302.
Hinckley, K., Tullio, J., Pausch, R., Proffitt, D., & Kassell, N. (1997). Usability analysis of3D rotation techniques. In Proceedings of the 10th annual ACM Symposium on UserInterface Software and Technology (pp. 1–10). ACM Press.
Holding, D. H. (1992 2nd ed.). Human skills. John Wiley and Sons.
Holm-Svendsen, E. (2001). On the theory of augmented reality. Unpublished master’sthesis, Department of Computer Science, University of Aarhus, Denmark. (in Danish)
InterSense. (retreived 2003). IS-600 Mark 2 Plus. http://www.isense.com/support/.
Jacob, R. J. K., & Sibert, L. E. (1992). The perceptual structure of multidimensionalinput device selection. In Proceedings of the CHI’92 conference on Human factors incomputing systems (pp. 211–218). ACM Press.
Johnson, & Bacigalupo-Rose. (1993). Three-dimensional data imaging in mine geologyapplications. In International mining geology conference (pp. 35–46). Kalgoorlie -Boulder: Australasian Institute of Mining and Metallurgy.
Kabbash, P., Buxton, W., & Sellen, A. (1994). Two-handed input in a compound task.In Extended abstracts of CHI’94 conference on Human factors in computing systems(p. 230). ACM Press.
Kaufman, H., Wiegand, R., & Tunick, R. H. (1987). Teaching surgeons to operate:Principles of psychomotor skills training. Acta Neurochirurgica, 87 (1-2), 1–7.
Kitamura, Y., Itoh, Y., Masaki, T., & Kishino., F. (2000). Activecube: A bi-directionaluser interface using cubes. In Proceedings of International Conference on Knowledge-Based Intelligent Engineering Systems and Allied Technologies (pp. 99–102). IEEE.
Kitware, Inc. (retreived 2003, August). The visualization toolkit. http://www.vtk.org.
Koleva, B., Benford, S., Ng, K. H., & Rodden, T. (2003). A framework for tangible userinterfaces. In Proceedings of the 5th International Symposium, Mobile HCI Conference(p. workshop). Springer.
Kondraske, G., & Vasta, P. J. (2000). Neuromotor channel capacity, coordination andmotion quality. In Proceedings of the annual IEEE conference on Engineering inMedicine and Biology (pp. 2259 – 2262). IEEE.
BIBLIOGRAPHY 111
Leganchuk, A., Zhai, S., & Buxton, W. (1998). Manual and cognitive benefits of two-handed input: an experimental study. ACM Transactions on Computer-Human In-teraction (TOCHI), 5 (4), 326–359.
Lin, C.-R., Loftin, & Nelson. (2000). Interaction with geoscience data in an immersiveenvironment. In IEEE virtual reality (pp. 55–62). IEEE.
MacKenzie, I. S., Kauppinen, T., & Silfverberg, M. (2001). Accuracy measures for evalu-ating computer pointing devices. In Proceedings of the CHI’01 conference on Humanfactors in computing systems (pp. 9–16). ACM Press.
Martens, J.-B. (2002). Multidimensional modeling of image quality. Proceedings of theIEEE, 90 (1), 133–153.
Martens, J.-B. (2003). Image technology design: A perceptual approach. Kluwer AcademicPublisher.
Masliah, M. R. (1999). Quantifying human coordination in HCI. In Extended abstracts ofthe CHI’99 conference on Human factors in computer systems (pp. 300–301). ACMPress.
Masliah, M. R. (2001). Measuring the allocation of control in 6 degrees of freedom human-computer interaction tasks. Unpublished doctoral dissertation, University of Toronto,Graduate School of Mechanical and Industrial Engineering.
Masliah, M. R., & Milgram, P. (2000). Measuring the allocation of control in a 6 degree-of-freedom docking experiment. In Proceedings of the CHI’00 conference on Humanfactors in computing systems (pp. 25–32). ACM Press.
Moody, L., Baber, C., Arvanitis, T. N., & Elliott, M. (2003). Objective metrics for the eval-uation of simple surgical skills in real and virtual domains. Presence: Teleoperatorsand virtual environments, 12 (2), 207–221.
Mulder, J. D., & Liere, R. van. (2002). The Personal Space Station: Bringing Interactionwithin Reach. In Fourth Virtual Reality International Conference (p. 73-81).
Napier, J. R. (1956). The prehensile movements of the human hand. Journal of Bone andJoint Surgery, 38B(4), 902–913.
Neggers, S., & Bekkering, H. (2002). Coordinated control of eye and hand movements indynamic reaching. Human Movement Science, 21, 349–376.
Norman, D. (1998). The invisible computer. Cambridge, Massachusetts: MIT Press.
O’Hara, J. (1987). Telerobotic control of a dextrous manipulator using master and six-DOF hand controllers for space assembly and servicing tasks. In Proceedings of theHuman Factors Society (Vol. 31, pp. 791–795). Human Factors Society.
112 BIBLIOGRAPHY
Piper, B., Ratti, C., & Ishii, H. (2002). Illuminating clay: a 3-D tangible interface forlandscape analysis. In Proceedings of the CHI’02 conference on Human factors incomputing systems (pp. 355–362). ACM Press.
Rauterberg, Bichsel, Meier, & Fjeld. (1997). A gesture based interaction technique for aplanning tool for construction and design. In International Workshop on Robot andHuman Communication ROMAN’97 (pp. 212–217). IEEE.
Rauterberg, M. (1995). Ein Konzept zur Quantifizierung software-ergonomischer Richtlin-ien. Zurich: IfAP-ETH Press.
Rekimoto, J., Ullmer, B., & Oba, H. (2001). Datatiles: a modular platform for mixedphysical and graphical interactions. In Proceedings of the CHI’01 conference onHuman factors in computing systems (pp. 269–276). ACM Press.
Rice, J., Yorchak, J., & Heartley, C. (1986). Planning for unanticipated satellite servicingteleoperations. In Proceedings of the Human Factors Society (pp. 870–874). HumanFactors Society.
Sage, G. H. (1977, 2nd ed.). Introduction to motor behavior, a neuropsychological approach.Addison-Wesley.
Shoemake, K. (1992). ARCBALL: a user interface for specifying three-dimensional ori-entation using a mouse. In Proceedings of the conference on Graphics interface (pp.151–156). Morgan Kaufmann.
Smith, G., Salzman, T., & Stuerzlinger, W. (2001). 3D scene manipulation with 2Ddevices and constraints. In Proceedings of the conference on Graphics Interface (pp.135–142). Morgan Kaufman.
Soechting, J. F. (1989). Elements of Coordinated Arm movements in Three-DimensionalSpace. In S. A. Wallace (Ed.), Perspectives on the Coordination of Movement (pp.47–83). Elsevier Science.
Sport is life. (2003). http://www.sportislife.com/newpage13.htm.
Streitz, N. A., & Russell, D. M. (1998). Basics of integrated information and physicalspaces: the state of the art. In Extended abstracts of the CHI’98 conference onhuman factors in computing systems (pp. 273–274). ACM Press.
Subramanian, S., Aliakseyeu, D., & Martens, J.-B. (2003a). Emperical evaluation ofhybrid 2D and 3D interfaces. In Human-Computer Interaction INTERACT 2003 (p.916-919). IFIP/IOS Press.
Subramanian, S., Aliakseyeu, D., & Martens, J.-B. (2003b). Measuring cooridnation for 2Dpositioning tasks. In Human-Computer Interaction INTERACT 2003 (pp. 295–302).IFIP/IOS Press.
BIBLIOGRAPHY 113
Subramanian, S., & IJsselsteijn, W. (2000). Survey and classification of spatial objectmanipulation techniques. In Proceedings of the OzCHI (pp. 330–337). ACM Press.
Suzuki, H., & Kato, H. (1993). Algoblock: A tangible programming language, a tool forcollaborative learning. In Proceedings of the Fourth European Logo Conference (p.297-303).
Thorpe, J. A. (1979). Elementary topics in differential geometry. Springer-Verlag.
Ullmer, B. (2002). Tangible interfaces for manipulating aggregates of digital information.Unpublished doctoral dissertation, Massachusetts Institute of Technology.
Ullmer, B., & Ishii, H. (1997). The metaDESK: models and prototypes for tangibleuser interfaces. In Proceedings of the 10th annual ACM symposium on user interfacesoftware and technology (pp. 223–232). ACM Press.
Ullmer, B., & Ishii, H. (2000). Emerging Frameworks for Tangible User Interfaces. IBMSystems Journal, 393 (3), 915–931.
Ullmer, B., Ishii, H., & Jacob, R. J. (2003). Tangible query interfaces: Physically con-strained tokens for manipulating database queries. In Human-Computer InteractionINTERACT 2003 (pp. 279–286). IFIP/ IOS Press.
Underkoffler, J., & Ishii, H. (1999). Urp: a luminous-tangible workbench for urban planningand design. In Proceedings of the CHI’99 conference on Human factors in computingsystems (pp. 386–393). ACM Press.
Vroubel, M., Markopoulos, P., & Bekker, M. (2001). Fridge: exploring intuitive inter-action styles for home information appliances. In Extended abstracts of the CHI’01conference on Human factors in computer systems (pp. 207–208). ACM Press.
Ware, C., & Jessome, D. (1988). Using the Bat: A Six Dimensional Mouse for ObjectPlacement. IEEE Computer Graphics and Applications, 8 (6), 65–70.
Ware, C., & Rose, J. (1999). Rotating virtual objects with real handles. ACM Transactionson Computer-Human Interaction (TOCHI), 6 (2), 162–180.
Weiser, M. (1991). The computer for the 21st century. Scientific American, 265 (3),94–104.
Wellner, P. (1991). The digitaldesk calculator: Tangible manipulation on a desk top display.In Proceeding of the ACM symposium on User Interface Software and Technology (pp.107–115.). ACM Press.
Wellner, P. (1993). Interacting with paper on the digitaldesk. Communications of theACM, 36 (7), 87–96.
114 BIBLIOGRAPHY
Wensveen, S. (2003). Designing for emotionally rich interaction. TU - Delft. (unpublisheddoctoral dissertation.)
Wesselink, W. (2000). VIP++ software (Tech. Rep.). IPO/ Technical University ofEindhoven, Eindhoven, The Netherlands.
Winograd, & Flores. (1986). Understanding computers and cognition. Addison-Wesley.
Zhai, S. (1995). Human performance in six degrees of freedom input control. Unpublisheddoctoral dissertation, Graduate Department of Industrial Engineering, University ofToronto.
Zhai, S., & Milgram, P. (1998). Quantifying coordination in multiple dof movement and itsapplication to evaluating 6 dof input devices. In Proceedings of the CHI’98 conferenceon Human factors in computing systems (pp. 320–327). ACM Press.
Zhai, S., Milgram, P., & Buxton, W. (1996). The influence of muscle groups on performanceof multiple degree-of-freedom input. In Proceedings of the CHI’96 conference onHuman factors in computing systems (pp. 308–315). ACM Press.
Zhai, S., & Senders, J. W. (1997a). Investigating coordination in multidegree of freedomcontrol 1: Time-On-Target analysis of 6DOF Tracking. In Proceedings of the annualmeeting on human factors and ergonomics society (pp. 1249–1254). HFES Press.
Zhai, S., & Senders, J. W. (1997b). Investigating coordination in multidegree of freedomcontrol II: Correlation analysis in 6DOF tracking. In Proceedings of the annualmeeting on human factors and ergonomics society (pp. 1254–1258). HFES Press.
Summary
Tangible user interfaces (TUIs) refer to computing systems that use physical artifactsas both representations and controls for digital information. TUIs forge a much strongerrelationship between the physical and digital information, and in the process aim to removethe distinction between user’s input (control) and output (representation) spaces.
To-date most TUI research has focused on developing systems that support tangible in-teraction in 2D space. Such systems allow either continuous interaction in 2D space (likemoving an object freely on a table) or a combination of continuous and discrete interactionin 2D space. My dissertation focuses on developing guidelines for designing tangible inter-faces for continuous interaction in 3D space. Continuous interaction in 3D-space is oftenencountered in applications that require 3D scene manipulation (environments like Mayaand 3D StudioMax) and navigation through volumetric data (like in visualization of braindata). In this dissertation, I focus on systems that support navigation through volumetricdata, and in specific the task of creation of planar intersections through volumetric data.
In Chapter 2, I review four popular systems (the Passive Interface Props (PassProps), Cubicmouse (CMouse), Personal Space Station (PSS) and Visual Interaction Platform (VIP))that support navigation through volumetric data using continuous tangible interactionsin 3D space. The VIP was extended, as part of this dissertation, to support continuoustangible interaction within the context of an augmented-reality metaphor. The PassPropscontextualize the tangible interaction using a desktop metaphor, while the CMouse andPSS use a virtual-reality metaphor.
These four systems are subsequently compared in terms of the five dimensions of socialintelligence proposed by Bellotti et al., (2002). While the four systems differ mostly inthe technology employed, they seem to be very similar in their expectations of how thistechnology could, would and should be used within the context of real applications. Allsystems have similar limitations with respect to permitted user actions and alignmentof system responses to such actions. They also have a similar (lack of) expectation orbehavior with respect to how the user should address devices within such systems and howthe system informs the user of its attention. Furthermore, these systems do not have anyspecific mechanism to prevent user misunderstandings or accidents.
Three of the four systems presented, PassProps, PSS and VIP, utilize a hand-held prop tophysically represent and control an intersection window (i.e. to make planar intersections
115
116 BIBLIOGRAPHY
of volumetric data). A factor that can influence control when using such hand-held propsis the way the prop is held in the user’s hand. In order to design better versions of suchprops one needs to further investigate the role of different hand-held grips and handednesson control. The main contribution of Chapter 3 is an experimental comparison of variousgrips (power and precision) of a hand-held tangible 3D intersection window, when usedin the user’s dominant and non-dominant hand. No performance (as defined by time)difference could be established between the various grips or between the user’s dominantand non-dominant hands.
Chapter 3 explores the use of an unconstrained 6 Degrees of Freedom (DOF) tangible 3Dintersection window. In other words, the user had simultaneous control of all 6 DOF.Of the systems described in Chapter 2, the PassProps, PSS and VIP allow simultaneouscontrol over the location and orientation of their intersection window, whereas the CMouseseparates the control of the location and orientation of the intersection planes.
Chapter 4 explores, through experimental evaluation, how to allocate control over thedifferent DOF and questions if it is better to provide unconstrained simultaneous control ofall DOF (as in the VIP) or constrain the available DOF to provide users with consecutivecontrol of lower DOF (as in the CMouse). One consequence of constraining the user’savailable continuous DOF is the creation of subtasks that require lower continuous DOF.These subtasks may be effectively accomplished by using a 2D-input device rather than a3D input device. In such a case, one would expect hybrid interfaces that allow handlinga 3D-input device in one hand and a 2D-input device in the other hand to extend theuser’s performance advantage. One of the outcomes of the experiment was that the usersperformed significantly faster with the consecutive controls than with the simultaneouscontrol. The results suggest that, in cases where a choice has to be made, one shouldsupport consecutive control of location (3 DOF) and orientation (3 DOF) rather thansimultaneous control of all 6 DOF.
Chapter 5 presents the Tangible Volume Navigation system as a redesign of the VIP. Theredesign attempts to resolve the problems with social intelligence highlighted in Chapter 2.The interaction techniques also incorporate the results of the experimental evaluationsperformed in Chapters 3 and 4. The Tangible Volume Navigation system utilizes moretangible representations and provides stronger links between the tangible and intangiblerepresentations. In particular, the intersection window allows consecutive control of loca-tion (3 DOF) and orientation (3 DOF) rather than simultaneous control of all 6 DOF. Italso allows the user to leave the interactions at any point and return at a later stage toresume the interactions.
A commonly attributed advantage of tangible input devices is the sense of control (alsoreferred to as coordination) they provide to the users. However, there is no establishedmeans to measure control. Based on an analysis of some of the existing measures I propose(in Chapter 6) a new measure for coordination that compares the actual path traced bythe user with an optimal path. Some features of this measure are that the optimal pathdepends on the current position (along the path) and the target position (intended end

BIBLIOGRAPHY 117
point along the path), and that this measure is independent of the coordinate system andsampling rate. Following a subjective experiment, I could conclude that the proposedmeasure closely follows subjective impressions about coordination. This is the first effortwithin the HCI community to validate coordination as a performance measure.

118 BIBLIOGRAPHY
Samenvatting (Summary in Dutch)
De term tastbare gebruikersinterfaces (TGIs) verwijst naar computer systemen die fysiekevoorwerpen gebruiken om digitale informatie zowel te representeren als te bewerken. TGIsdwingen een veel sterkere relatie tussen de fysieke en digitale informatie af, en hebben alsdoel de afstand tussen de gebruikers in- en uitvoerruimtes weg te nemen.
Tot op heden is het onderzoek naar TGI vooral gericht geweest op de ontwikkeling van sys-temen die tastbare interactie in een 2 dimensionale (2D) ruimte ondersteunen. Dergelijkesystemen ondersteunen continue interactie in een 2D ruimte (zoals een voorwerp zonderbeperkingen over een tafel bewegen) of een combinatie van een continue en een discreteinteractie in een 2D ruimte. Mijn proefschrift richt zich op de ontwikkeling van ontwer-prichtlijnen voor tastbare gebruikersinterfaces van continue interactie in een 3 dimensionale(3D) ruimte.
Continu interactie in een 3D ruimte wordt vaak waargenomen in applicaties waar de ma-nipulatie van 3D voorstelling nodig is (omgevingen zoals Maya en 3D StudioMax) of waargebruikers navigeren door volumetrische data (zoals de visualisatie van hersenscans). Inhet proefschrift richt ik me op systemen die gebruikers ondersteunen bij het navigeren doorvolumetrische data en met name op het maken van dwarsdoorsneden van volumetrischedata.
In hoofdstuk 2, bespreek ik vier gangbare systemen (Passive Interface Props (PassProps),Cubic mouse (Cmouse), Personal Space Station (PSS) en Visual Interaction Platform(VIP)) die gebruikers ondersteunen bij navigatie door volumetrische data met continuetastbare interacties in een 3D ruimte. VIP werd als deel van dit promotie onderzoek uitge-breid zodat het continue tastbare interactie ondersteunt in de context van een ’augmentedreality’ metafoor. PassProps contextualizeert de tastbare interactie door een werkbladmetafoor te gebruiken, terwijl Cmouse en PSS een ’virtual reality’ metafoor gebruiken.Deze vier systemen zijn achtereenvolgens vergeleken op basis van de vijf dimensies vansociale intelligentie zoals voorgestelt door Bellotti et al (2000). Hoewel de vier systemenhoofdzakelijk verschillen in de gebruikte technologie, stemmen ze grotendeels overeen inhun verwachting over hoe de technologie kan en zal worden gebruikt in een daadwerkeli-jke toepassing. Alle systemen hebben vergelijkbare begrenzingen met betrekking tot demogelijke gebruikersacties en de afstemming van de systeemreactie op deze acties. Desystemen hebben ook een vergelijkbaar gebrek aan verwachtingen en aanwijzingen. Zegeven de gebruiker geen aanwijzingen hoe ze bediend moeten worden en wat ze op dat
119
120 BIBLIOGRAPHY
moment van de gebruiker verwachten. Bovendien bezitten deze systemen geen preventiefmechanisme tegen gebruikersmisverstanden en ongelukken.
Drie van de vier eerder genoemde systemen, PassProps, PSS en VIP, gebruiken handbe-dienbare instrumenten voor het fysiek weergeven en bedienen van een intersectie venster(bijvoorbeeld om een dwarsdoorsnede van volumetrische data te maken). Een factor dieinvloed heeft op de bediening van dergelijke handbedienbare instrumenten, is hoe hetinstrument in de hand ligt. Om betere versies van dergelijke instrumenten te kunnen on-twerpen is meer onderzoek nodig naar links- of rechtshandige bediening. De belangrijkstebijdrage van hoofdstuk 3 is een experimentele vergelijking van de verschillende handgrepen(kracht en precisie) van een handbedienbaar en tastbaar 3D intersectie venster, bij gebruikin de dominante danwel niet-dominante hand. Geen prestatieverschil (gemeten in tijd) kongevonden worden tussen de verschillende handgrepen of tussen de dominante danwel nietdominante hand.
Hoofdstuk 3 bestudeert het gebruik van een ongelimiteerde tastbare 3D intersectie venstermet 6 vrijheidsgraden (VG). Met andere woorden, de gebruiker had gelijktijdig controleover alle 6 de vrijheidsgraden. Van de systemen beschreven in hoofdstuk 2 staan PassProps,PSS en VIP toe dat de gebruiker de locatie en de orientatie van hun intersectie venstergelijktijdig kan manipuleren, terwijl Cmouse de controle van de locatie en de orientatie vanhet intersectie vlak scheidt.
Hoofdstuk 4 bestudeert, aan de hand van een experimentele studie, hoe de controle van deverschillende vrijheidsgraden toegewezen moeten worden. Het stelt de vraag of het beteris om ongelimiteerde simultane manipulatie van alle vrijheidsgraden te hebben, danwelde beschikbare vrijheidsgraden te beperken door het systeem te voorzien van sequentielebediening van minder vrijheidsgraden (zoals bij Cmouse). Een gevolg van het beperkenvan de beschikbare vrijheidsgraden is de creatie van subtaken die minder continue vrijhei-dsgraden gebruiken. Deze subtaken zouden effectief uitgevoerd kunnen worden door hetgebruiken van een 2D invoer apparaat in plaats van een 3D invoer apparaat. In dergelijkegevallen zou men een hybride gebruikersinterface kunnen voorstellen die toestaat dat degebruiker een 3D apparaat in de ene hand heeft en een 2D apparaat in de andere handom zo de taakuitvoering te verbeteren. Een van de uitkomsten van het experiment wasdat de gebruikers significant sneller zijn met de sequentile bediening dan met de simultanebediening. De resultaten suggereren dat wanneer een keuze gemaakt moet worden, devoorkeur uit gaat naar sequentile manipulatie van de locatie (3VG) en de orientatie (3VG)in plaats van simultane controle van alle 6 de vrijheidsgraden.
Hoofdstuk 5 presenteert het ’Tangible Volume Navigation’ systeem als een herontwerp vanVIP. Het herontwerp streeft naar een oplossing voor de problemen met de sociale intelli-gentie benadrukt in hoofdstuk 2. De resultaten van de experimentele studie beschreven inhoofdstuk 3 en 4 worden meegenomen in de interactietechnieken. Het ’Tangible VolumeNavigation’ systeem benut meer tastbare representaties en crert een sterker verband tussende tastbare en de niet-tastbare representaties. Het intersectievenster maakt het mogelijkde locatie (3VG) en de orientatie (3VG) opeenvolgens te manipuleren in plaats van het
BIBLIOGRAPHY 121
simultane manipulateren van alle 6 de vrijheidsgraden. Ook staat het de gebruiker toe deinteractie op ieder moment te onderbreken en op een later tijdstip weer op te pakken.
Een algemeen erkend voordeel van tastbare invoerinstrumenten is het gevoel van controle(ook wel cordinatie genoemd) dat zij de gebruiker geven. Echter, er is geen gevestigdemethode voor het meten van controle. Aan de hand van een analyse van enkele van debestaande maten, introduceer ik (in hoofdstuk 6) een nieuwe maat voor cordinatie die hetwerkelijke pad van de gebruiker vergelijkt met het optimale pad. Een kenmerk van dezemaat is dat het optimale pad afhankelijk is van de huidige en de beoogde positie. Tevens isdeze maat onafhankelijk van het cordinatiesysteem en de samplingsnelheid. Op basis vaneen subjectief experiment kan ik concluderen dat de voorgestelde maat nauw overeenkomtmet de subjectieve impressie van cordinatie. Dit is de eerste validatiepoging binnen deMens-Computer Interactie gemeenschap van een dergelijke prestatiemaat.

122 BIBLIOGRAPHY

Essential Biography
1992 - 1995 Bachelor of Science - PhysicsLoyola College, Madras, India.
1995 - 1999 Master of Engineering - Electrical Communication EngineeringIndian Institute of Science, Bangalore, India.
1999 - 2004 PhD - User-System InteractionTechnische Universiteit Eindhoven, Eindhoven, The Netherlands.
2003 - Assistant Professor - Computer ScienceUniversity of Saskatchewan, Saskatoon, Canada.
123