Embed Size (px)
Citation preview

Smart City Proposal
Annex 3
Srinagar

Sheet No Description
1 City Profile
2 Baseline Information
3 Citizen Engagement
4 Vision for Smart City
5 Strategic Plan
6 ABD Specifications
7 ABD Major Projects
8 ABD Mobility
9A ABD Interventions
9B ABD Interventions
10 ABD mapping Essential Features
11 ABD Interventions: Lake Revival
12 ABD Interventions: Incubation Centre
13 ABD Interventions: Hospitality Complex
14 ABD Interventions: Tourism and Interpretation Centre
15 Pan City Solutions
16 Pan City Solutions
17 SPV
18A Project Cost
18B Project Cost
18C Project Cost
19A Project Implimentation
19B Project Implimentation
20A Revenur Projection
20B Expenditure Projection
20C SPV-P&L Statement
20D O&M EstimatesTable of Content

1.City Profile
SRINAGAR CITY
Municipal
Area
Planning
Area
REGIONAL SETTING OF SRINAGAR
Total Population (SMC+OG) 1,180,570 (2011)Local Planning Area (Master Plan Area): 757 sq. km.
Srinagar Municipal Corporation Area: 246 sq. km.
619,072 561,498
52% 48%
HH Size
6.45 48 PPH
Population Density
Annual Growth
2.76%
Total HHs
182,829
71% 32.4%
Literacy Rate WPR
SRINAGAR the city of LAKES and GARDENS SUMMER CAPITAL16.90% Significant population live in slum like condition at the peripheral areas of city

2. Baseline Information
97%Piped Water
supply coverage
35%NRW
104 lpcdPer capita water
supply
0%Extent of water
metering
33%Area covered by trunk sewerage
network
35%HHs connected
by Sewerage network
6 (52 MLD)Number of STPs
with capacity
1No. of under-construction
STPs
47%Area covered by
storm water drainage
100%Sewerage
mixing in the drains
75 timesWater logging
in a year
93 pointsNumber of
water logging points
60%door to door
collection coverage
90%Collection efficiency
0%Segregation
450 MTTotal solid
waste generation in
the city
Public transport ridership
22.5%Non motorised
transport
200Parks and gardens
2.6 sqmPer person in recreational
greens
950Identified heritage
structures in Master Plan
10%Green Area
(Srinagar Planning Area)
Source: AMRUT Slips, INTACH and different line departments
80%
Water Supply
Sewerage
Storm Drainage
Solid Waste

3.Citizen Engagement
Vision Development
1. Protect Natural and Cultural Heritage
2. Eco-Friendly and Clean City
3. Job creation and economy
Area Based Development
Pan City Solutions
1. Disaster Management
2. Urban Mobility
3. Waste Management
Men
79%
Women
21%
0
5
10
15
20
25
30
1 2 3 4 5 6
Series1
Series2
Men
Women
<13 18-24 24-35 35-45 55-64 64<
Mass Campaign Programme by SMC and Other Agencies
Bulk SMS
4,50,000
FM Radio
250,000
News Paper
160,000
TV Shows
20,00,000
Flyers
1,50,000
Consultation Outreach: 30,00,000+
Sta
keh
old
ers
Suggestions4,13,564
Modes of
Citizen
EngagementWard Sabhas
36,344
SMC Website
Visitors
1,55,137
14525
863
Internet
Media
Questionnaires1,95,815
Public 231consultations 132
Offline Poll
9246Twitter
35
Hot Line
1,236
Offline Online
Modes of Engagement
Citizen Engagement Rate
Active Participation by Young Citizens
Citizen Aspirations/ Priorities
Srinagar Smart City Workshop Meeting with HODs of Line Departments Active Participation at Ward Level

CREATING RESILIENT andsustainable infrastructure,
disaster preparedness and management
Location, cultural & historic
heritage and complex
urban morphology
Strength Haphazard urban growthChallenges
Eco-Friendly and
Green City Target
Developing Srinagar as Eco-friendlybrand tourist Destination byENHANCING THE IDENTITY of thecity based on the uniqueness of thecultural heritage of its people
Strong
Natural, Built
& Cultural
Heritage
Fragile
Ecological
Setting
Center for
Trade and
Commerce in
Kashmior
Valley
Only Metro
City and
Summer
Capital
Ke
y D
rive
rs
Str
ate
gic
Dir
ec
tio
ns/
Asp
ira
tio
ns
Resilient
Sustainable
and liveable
Srinagar
Promoting
Inclusion
Promoting
Srinagar's
Identity
Vision“Transforming Srinagar into an Eco-friendly
and Resilient and socio economically
vibrant city that celebrates its natural and
cultural heritage creating Harmony and
Opportunities for all’’
PerformPromoteParticipate
Strategic Focus
Blueprint for Srinagar Smart City
CREATING socio economic opportunities
for all
4. Vision for Smart City

Pathways and Cycle Tracks along Bund Road
Improvement of Ghats along Jhelum
Dredging and silt removal of Jhelum and tributaries
Water Transport along Jhelum
Interceptors for sewage treatment
Retrofitting and conservation of heritage buildings
Baba Demb water quality rejuvenation (STP augmentation)
Desilting and capacity enhancement
Boardwalks, walkways and Cycle tracks
Temple restoration
Water transport to Dal Lake
Floating Wet Land Interpretation and training Center
Urban Renewal along Nallah-i-Mar and Brari Nambal
SHER GARHI INTERNATIONAL CENTRE
Conservation of Existing Shrines
YARKAND SERAI REVISTED - BOUTIQUE CRAFT MARKET
Lal Ded Centre, Ganpatyar - City History Museum
Maharajganj Market
Bohri Kadal Market
Zaina Kadal Market
Adaptive Reuse of Lower Court as Boutique Hotel and Mixed Use Zone
Redevelopment of FCI godowns as Commercial District
Pedastrian Pathway (using local stone) in heritage prescient
Retrofitting, conservation and facde improvement in heritage network
Street Furniture, Signages and Urban Art
Advertisement panels and Dashboards display at interecstions
Advertisement panels and Dashboards display on street lights
Pedestrian Walkways and Footpaths
Road Redevelopment Works
Number of Battery Cars for IPT Route (identified routes)
EV charging stations
Bicycle Sharing Scheme (Number of Cycles)
Bicycle Sharing Scheme (Cycle Stands)
Multilevel Parking Lots
24*7 Water Supply
Smart power metering
24*7 Power Supply
Smart Street Lighting (LED Street Lights with Display panels and day
light sensors)
Smart Solar City
Drainage
GPS enabled vehicles for waste collection
Reverse Vending Machines (Pilot project)
3 Bin Segregation Dustbins
Electromagnetic Plastic Disintegrator
Electric Buses
Smart Bus Stops with Passesnge System
EV charging stations
Provision of Common Mobility Card (dsitribution at city civic center)
Intelligent Traffic Management System
Community engagement and grievance management system - Civic
services App and Civic Service Centers
Smart Data Center (City Civic Services, Traffic Management, Disaster
Response Integration)
Inundation mapping and flood management measures
Emergency Response System
Earthquake Resistance Structural Audit and Building level inventory &
multi-hazard risk mapping, with focus on seismic risk
Social protection plan and capacity building, covering safety of women,
children, persons with disabilities from disasters
Water front improvement
Lake Rejuvenation
Heritage Discovery and
Revival
Upgrading Historic Market
&
Craft Revival
Hospitality and Tourism
Infrastructure
Disaster Management &
Environment Protection
Promoting
Srinagar's
Identity
Resilient
Sustainable
and liveable
Srinagar
Promoting
Inclusion
Urban Mobility
Smart Utilities
Wifi Hubs
Green Corridors (Including revival of parks)
Hawkers' Zone
Smart health centres and telemedicine
Sports Infrastructure (3 Stadiums + 5 Schools)
Smart Classrooms (7 Schools)
E- governance
Promoting historic houses as destination spaces (13 identified houses)
Capacity building and Skill development for hospitality and tourism
Kawdara, Nallah-i-Mar Road - Craft Exhibition Centre
Institutional strengthening, CDI
Common Facilities
Car Parking at (7 locations)
Junction Improvements (12 junctions)
Provision of cycle track on the motorable road (2.5 meters width)
Utility Removal
Multi-services underground ducting
Smart water metering
Development and Operation & maintenance - of Property development
and approval system
Discover Srinagar One Stop App
Establishment of community based trained task forces, anchored with
educational institutions for sustainability
Local forecast through weather station grid
Rapid warning dissemination through multiple media, including SMS,
USSD, social media & instant messaging apps.
Fire-fighting system
Training and awareness on response
Aereation Fountain (incl. light and sound)
5.Strategic Plan
STRATEGIC DIRECTIONS PLANNING INTERVENTIONS IDENTIFIED PROJECTS

6.ABD Specifications
Ass
ets
-B
uil
t an
d N
atu
ral H
eri
tage
Water Bodies, Open & Green Spaces Built HeritagePedestrian NetworkRoad Network
Mobility Environment
Total Road Length: 150 Km Total Footpath: 18.68 Km Water: 152 Acres (14% of ABD) Open &
Green: 22.17 Acres
636 Heritage Structures identified in ABD
Heritage
ABD – Salient Features
Total Area of ABD: 1180 Acre
Total Population of
ABD: 1,19,172
IDENTITY
• City with a rejuvenated
Urban Fabric and State
Capital
• Reinstate the
Historical, Cultural
identity
• Rendering the City
Clean and Green with
focus on Sustainable
development
• Rejuvenating the
Religious, Built heritage
and recreational
tourism
• Provision of global
infrastructure
ACCESSIBILITY
• Well connected,
accessible, walkable
city
• Seamless
unobstructed
movement within Old
city
• Rendering the area
walkable and provision
of NMTZ ones
• Enhanced, Smart and
Sustainable
transportation network
for old and disabled
• Congestion free ease
movement city
INCLUSITIVITY
• High quality of Life with
Diverse Economic
Opportunities
• Cultural amalgamation
with social inclusion
• Universal access to
smart infrastructure
• Boos to Economic
Activities
• Equal opportunity for
all
• Improved economic
status and increase of
GDP
Historic
significance.
Origin of
Srinagar Town.
High
concentration of
mixed use, PSP
and commercial
activities
Presence of key
landmarks and
tourism
infrastructure
Main
commercial
centre and
market areas.
1.5 % of city
area
accommodating
10% of its
population
High
concentration of
Heritage
Monuments
5.38 Km of
River Passing
Through Site
Network of
streams
connecting river
to Dal lake
Housholds:
18,476
Location of
ABD in City
FootpathOpen/Green
Water
Built
Heritage

UPGRADING
HISTORIC MARKETS
LAKE
REJUVENATION
HERITAGE
DISCOVERY AND
REVIVAL
WATERFRONT
IMPROVEMENT
CRAFT
PROMOTION
INFRASTRUCTURE
HOSPITALITY AND
COMMERCIAL
DEVELOPMENT
Proposed Vision
Sokalipora Shamswari Baba Demb Chinkral Mohalla Barbar Shah Maisuma Lal ChowkNowhatta
Safakadal
Maharajgunj
Zaldagar Sayed Ali Akbar TankiporaShaheed Gunj
Jhelum River
Nawa Kadal
Safa Kadal
Ali Kadal
Zaina Kadal
Fateh Kadal
Habba Kadal
Budshah Bridge
Amira Kadal
HERITAGE DISCOVERY AND
REVIVAL
UPGRADING HISTORIC
MARKETS
LAKE REJUVENATION WATERFRONT IMPROVEMENT HOSPITALITY AND COMMERCIAL
DEVELOPMENT
CRAFT PROMOTION
INFRASTRUCTURE
Transforming 5.3 km of
Jhelum waterfront through
improvement of water quality
Facade impovement of
Maharaj Gunj, Bohri Kadal
and Zaina Kadal markets,
Wayfinding
Wastewater treatment and
reuse, storm water reuse,
introduction of boardwalks,
footpaths and cycle tracks
Adaptive reuse of Sher Garhi
Palace as Heritage Complex,
Development of 8.6km of
Heritage Walks, Upliftment of
11 major Heritage Shrines
Adaptive Reuse of Lower
Court Complex as Boutique
Hotels, Development of FCI
Godowns as Commercial
Centre for entrepreneurs.
Craft Exhibition Centre at Safa
Kadal, Visitor parking facility,
Institutional Strengthening of
CDI Common Facilities, and
Skill Upgrading
7.ABD Major Projects

8. ABD- Mobility
Bicycle Sharing
Booth
Inland
Waterways
Junction
Improvemen
t
Proposed Surface
Parking
Existing
Surface Parking
Enhancement
Boat Stop
Heritage Walks
Cycle
Tracks
Baba
Demb
To Leh
Multilevel Car
Parking
Junction Improvement
Multilevel Car Parking
Surface Car Parking
Bicycle Sharing Booth
Bridge
LEGEND
Other
Arterial
Collector
Local
Roads
Sub Arterial
Heritage Walk
Waterways
Geometric
Improvement of
12 Junctions
Junction
Improvemen
t
Inland Waterways
Improvement of 14 Ghats
for Boat Stops
De-cielting Embankment 4
Km of River Front.
Reviving existing
waterways for
reimagining old
city and banks of
Jhelum.
Parking
Enhancement of 7 existing
surfaced parking and
Proposed 4 surfaced parking
1200 ECS
Multilevel
450 ECS
Providing alternate
transport option by
strengthening waterways
Cycle Track 16 Km
200 Bicycle 5
Sharing Booths
Cycle
Tracks
Reconfiguration of existing pedestrian
street and 16.5 Km of Proposed
interconnected walkways
Cycle Tracks

Community engagement is central to the design of inclusive spaces. The strategy is to develop mixed-use
areas that reinforce social sustainability, vibrancy, and financial success for the community. Plazas,
sidewalks and trails tie the natural landscape with civic, cultural and entertainment spaces allowing the
community to connect with nature and with each other.
Highly developed and connected public realm consisting of a linked network of parks, streets, private open
spaces, natural areas, trails and regional recreational destinations.
To achieve a connected public realm, streets needs to perform as both a place and a linkage. In Srinagar
open space within the historic core is almost negligible, streets gain additional important.
Renewed Hope. The community supports the concept to build a tight urban core catalyzing
places for people in a lively downtown business district.
Streetscape Synergies. Integrate pedestrian amenities with storm-water management,
innovative material use, and energy efficiency measures.
Pedestrian Experience. Benches, street trees, bike racks, stone paved walkways,
vegetated planters, safe crossings for a comfortable and welcoming pedestrian experience.
Walkable Destinations. Strong pedestrian and bicycle network encourages the
development of additional destinations in close proximity.
Streetscape Synergies. The Streetscape seeks to create an attractive and connected
public realm by re-positioning mobility streets as an essential component of the city's overall open
Rediscover
ReimagineRevive
Restore
DOWNTOWN
Integration of dedicated cycle
tracks
Road Beautification
Maulana Azad Road Retrofit
Street trees
Smart Bus Stops
Riverfront Heritage GreenwayBefore After
Hari Singh High Street PlazaBefore After
Wide Pedestrian + Bistro ZonePedestrian-priority zone
Wayfinding
Locations
9A. ABD interventions
Residency Road Retrofit
Wa
yfin
din
g S
ign
ag
e

9B. ABD interventions
IPT ROUTES
SMART HEALTH CENTERS
SMART CLASSROOM
SPORT FACILITIES
Improvement of
44 Ghats for
improved
network for water
transport
Development Tea Houses
and Cuisine Culture
along Ghats
Introduction of Heritage
Waterways Drive
Provision of NMT
(pedestrian/
Cycle tracks)
lanes on 17 km
Stretch across the old city
Area.
Provision of 9 Bicycle
Sharing Booth. Bicycle on
rent.
Facade
Improvement of
4 Km Stretch
Underground utility
provision
Improvement of
16 km road
network for PT
provision
60 battery cars to be launched
for old age and disabled
citizens
Seven electric car stands have
been identified across old city
The Trail would connect
345 heritage structures
The Audio Visual kit will
be available for the
tourists to guide through
Development of
8.6 km
pedestrianized 6
Heritage trail.
Improvement of
10 junctions
Provision of two
Parking areas around
old city with a capacity
of almost 500 vehicles
Smart Social
Infrastructure
Smart Classrooms
1. SPS GHSS
2. Nowhatta GHSS
3. Khanyar GHSS
4. MP HSS
5. GHSS Kothibagh
Sport Facilities
1. Gani Memorial Stadium
2. Khwaja Naqashban Sahib,
Radpora Stadium
3. MP Ground
4. Chinkral Mohalla Stadium
5. SP College Ground
Identified Health Centres
1. PHC Narwara
2. UPHC S.R. Gunj
3. JLNM Hospital
4. Goussia CHC
5. UPHC Chinkral Mohalla
6. NTPHC Habba Kadal
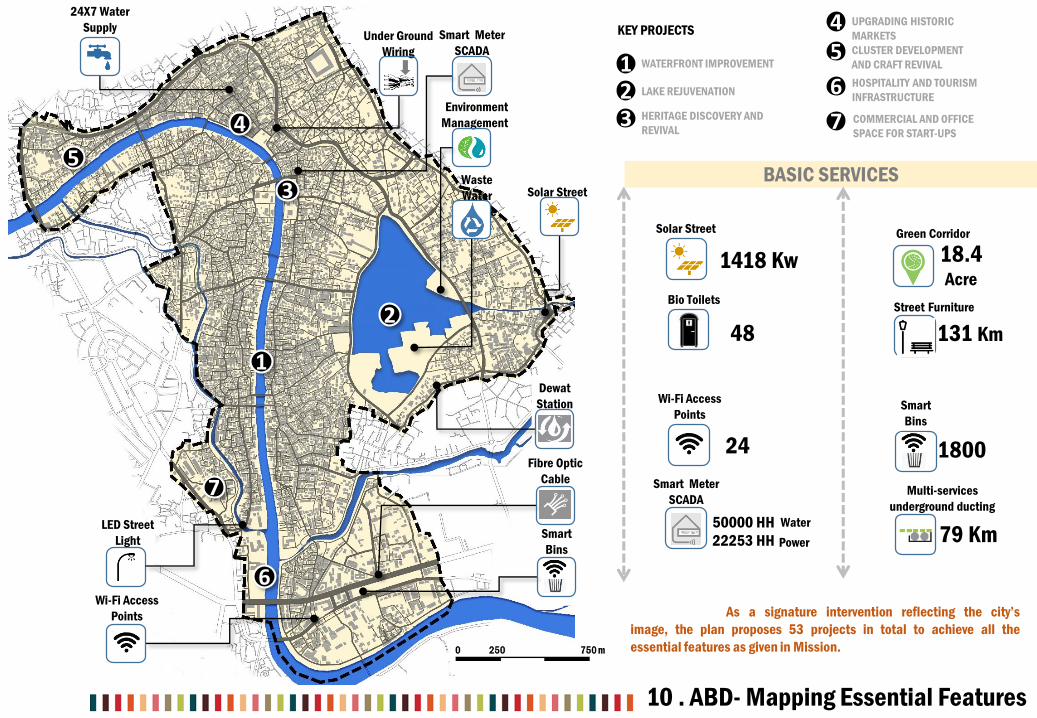
BASIC SERVICES
Under Ground
Wiring
Waste
Water
Recycle
LED Street
Light
24X7 Water
Supply
2
1
3
4
5
6
7
1 WATERFRONT IMPROVEMENT
23
45
6
7
LAKE REJUVENATION
HERITAGE DISCOVERY AND
REVIVAL
UPGRADING HISTORIC
MARKETS
CLUSTER DEVELOPMENT
AND CRAFT REVIVAL
HOSPITALITY AND TOURISM
INFRASTRUCTURE
COMMERCIAL AND OFFICE
SPACE FOR START-UPS
KEY PROJECTS
Environment
Management
As a signature intervention reflecting the city’s
image, the plan proposes 53 projects in total to achieve all the
essential features as given in Mission.
Smart Meter
SCADA
Solar Street
Dewat
Station
Fibre Optic
Cable
Smart
Bins
Wi-Fi Access
Points
Wi-Fi Access
Points
24
Solar Street
1418 Kw
Smart Meter
SCADA
50000 HH
22253 HH
Water
Power
Bio Toilets
48
Smart
Bins
1800
79 Km
Multi-services
underground ducting
Green Corridor
18.4 Acre
Street Furniture
131 Km
10 . ABD- Mapping Essential Features

1
2
3
4
5
6
7
8
Pavilions
Boardwalk
Temple
Floating Lake and
Wetland Discovery
Centre
Wetland Experience
Area
Entrance
Road Rationalization
with Cycle Track
Pedestrian Bridge
Baba Demb water quality rejuvenation (STP
augmentation)
Real Time water quality monitoring
Desilting and capacity enhancement
Boardwalks, walkways and Cycle tracks
Landscaping and beautification
Temple restoration
Floating Restaurant
Fountain show (incl. light and sound)
Proposed Lake View of Baba Demb
Re
al T
ime
wa
ter
qu
ali
ty m
on
ito
rin
g
11. ABD Interventions: Lake Revival
Interventions
Baba Demb Lake Rejuvenation
Wetland Created Green Space Integrated Water Quality Improved
Key Map
1
2
3
45
6
7
8
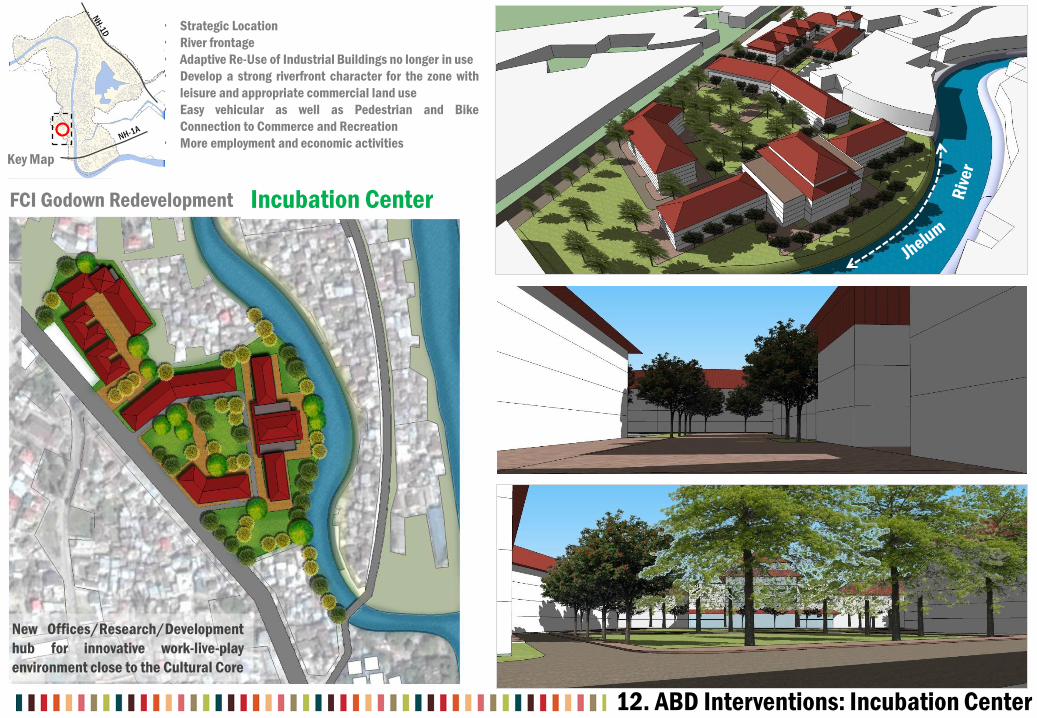
12. ABD Interventions: Incubation Center
Incubation Center
New Offices/Research/Development
hub for innovative work-live-play
environment close to the Cultural Core
• Strategic Location
• River frontage
• Adaptive Re-Use of Industrial Buildings no longer in use
• Develop a strong riverfront character for the zone with
leisure and appropriate commercial land use
• Easy vehicular as well as Pedestrian and Bike
Connection to Commerce and Recreation
• More employment and economic activities
Key Map
FCI Godown Redevelopment

13. ABD Interventions: Hospitality Complex
Hospitality Complex
Key MapAdaptive Reuse of Old Lower Court Complex as
Boutique Hotels at The Bund

(6.78 Acres)
• Museum/
Interpretation Centre
• Auditorium and Shows
• Guide Tours and
Tourism Reception
• Restaurants and Crafts
Expo
14. ABD Interventions: Tourism and Interpretation Centre
Sher Garhi Complex Tourism and Interpretation Centre
Jhelum River
Budshah Bridge
Adaptive reuse
of Sher Garhi
Palace as
Heritage
Complex
Key Map

Smart + Connected City Operations Centre
Key Operations
1. Disaster Management and Emergency
Response
2. Safety, Surveillance and Incident
Management
3. Traffic Management and Transit
Operations
4. City Utilities Coordination (Water, SWM,
Wastewater, WiFi etc.) and Asset
Management
5. Real time environmental quality
Video
Wall
Workstations
Data Centre
GIS
Environment
Emergency
Comms.
VMS, PIS
Data Feed
COMPONENTS
15. Pan City Solutions

Intelligent Traffic Management1
Non-polluting Public Transport2
Smart Bus Stop, PIS, VMS3
Intelligent Traffic Management4
Flood mitigation1
Earthquake resilience 2
Fire protection 3
Emergency response4
URBAN MOBILITY
DISASTER
MANAGEMENT
IMPROVEMENT OF URBAN ENVIRONMENT
Cleanliness: Smart Waste
Management1
Improvement of environmental
quality: Water and Air Quality
2
Disaster proof structures
Sensors on embankment
Cycle Tracks
ICT driven PT
Smart Bins Smart Waste Management
Intelligent Traffic
ManagementSmart PolesSmart Bus Stops
16. Pan City Solutions

Thre
e T
ier
Str
uct
ure
fo
r S
rin
ag
ar
Sm
art
Cit
y SPVState level Advisory Committee
(chaired by Chief Minister)
State Level High Powered Steering Committee
(chaired by Chief Secretary)
Special
Requirement 1
The Independent Directors will be selected from the data
bank(s) maintained by the Ministry of Corporate Affairs
Special
Requirement 2 At least 1 director to be a woman director
1 Commissioner Secretary H&UDD Chairman
2
Chief Executive Officer (CEO)
“To be appointed by the Government, not below the
rank of Special Secretary to the Govt. of J&K”
Convener
Board of Directors:
3 Inspector General of Police, Srinagar Director
4 Commissioner, SMC Director
5 Deputy Commissioner, Srinagar Director
6 Vice Chairman, SDA Director
7 Director, Archives, Archaeology and Museum, Jammu Director
8 Nominee of Ministry of Urban Development, GoI Director
Independent Directors
17. SPV
Development
of Heritage
Trail &
Improvement
of chowks
Smart Utilities
Management
and Basic
Service
provision
Green Space
Development
and SWM
Mobility IT
Connectivity
Redevelopmen
t zones
Urban
MobilitySWM
Smart City Proposal
Smart city SPV
Industry Stakeholders
Industries
Research Institutions
Construction companies
SMC H&UDD
Tourism PWD
Revenue
Dept.
PHED
Power Dept.Transport
Dept.
SDA
Traffic
Police
Deptt of Power
Private T&D
Private O&M
JV
Disaster
Response
Management
Lending Agencies
Investors
Debt
Equity
Private equity
Banks/ FIs as lenders
Heritage Map
Routes/NMT
lanes
Smart Parking
Street
Furniture
Smart Infra
Smart Streets
SCADA/Smart
Meters
Sensors/IT
Waste water
management
Landscape
Riverfront
Development
Smart bins/
Bio Toilets
Walkways/
NMT lanes
Smart Bus
stops
WiFi/
Dashboards
Smart poles
Commercial
zones
Wi-Fi Zones
Bio-
Toilets/smart
bins
Optical Fibre
Traffic
Management
Transport
Mobility card
Public
Information
display
E-Services
Application
Smart
Bins/Smart
Collection
Waste to
Energy
CCC Center
Integrated
Bodies
CCTVs
Sensors
Area Based Development PAN City
JV Partners / PPP
UtilitiesFacilitie
s
Developers / Operators
Govt. Stakeholders
Convergence
SBM
SDA Projects
Tourism
Projects
AMRUT
SMC Projects
State Government
Grants Bridge
Funding
Major Lending Institutions
Nodal Agencies
SMC
12
3
4
4
Heritage
SocietyERAHeritage
Society project

Sr. No. PROJECTSTotal Cost (Rs. Crore) YoY Phasing CONVERGENCE Smart City Funding PPP Debt
YEAR 1 (Rs. Cr)
YEAR 2 (Rs. Cr)
YEAR 3 (Rs. Cr)
YEAR 4 (Rs. Cr)
YEAR 1 (Rs. Cr)
YEAR 2 (Rs. Cr)
YEAR 3 (Rs. Cr)
YEAR 4 (Rs. Cr)
YEAR 1 (Rs. Cr)
YEAR 2 (Rs. Cr)
YEAR 3 (Rs. Cr)
YEAR 4 (Rs. Cr)
YEAR 1 (Rs. Cr)
YEAR 2 (Rs. Cr)
YEAR 3 (Rs. Cr)
YEAR 4 (Rs. Cr)
YEAR 1 (Rs. Cr)
YEAR 2 (Rs. Cr)
YEAR 3 (Rs. Cr)
YEAR 4 (Rs. Cr)
ABD PROJECTSRECONNECTING DOWN TOWN WITH JHELUM 130.94
1 Pathways and Cycle Tracks along Bund Road 6.23 0.62 3.12 2.49 0.00 0.62 3.12 2.49 0.00 0.00 0.00 0.00 0.00 0.00 0.00 0.00 0.00 0.00 0.00 0.00 0.002 Improvement of Ghats along Jhelum 4.50 0.45 2.25 1.80 0.00 0.45 2.25 1.80 0.00 0.00 0.00 0.00 0.00 0.00 0.00 0.00 0.00 0.00 0.00 0.00 0.003 Dredging and silt removal of Jhelum and tributaries 41.50 12.45 16.60 12.45 0.00 12.45 16.60 12.45 0.00 0.00 0.00 0.00 0.00 0.00 0.00 0.00 0.00 0.00 0.00 0.00 0.004 Water Transport along Jhelum - terminal, ticket, amenities 21.00 0.00 10.50 10.50 0.00 0.00 0.00 0.00 0.00 0.00 0.00 0.00 0.00 0.00 10.50 10.50 0.00 0.00 0.00 0.00 0.005 Water Transport along Jhelum - boats, shikaras etc. 3.00 0.00 1.50 1.50 0.00 0.00 0.00 0.00 0.00 0.00 0.00 0.00 0.00 0.00 1.50 1.50 0.00 0.00 0.00 0.00 0.006 Area Illumination along riverbanks 3.32 1.99 1.33 0.00 0.00 1.99 1.33 0.00 0.00 0.00 0.00 0.00 0.00 0.00 0.00 0.00 0.00 0.00 0.00 0.00 0.007 Rivetment and Embankments along Riverbank 10.00 4.00 5.00 1.00 0.00 4.00 5.00 1.00 0.00 0.00 0.00 0.00 0.00 0.00 0.00 0.00 0.00 0.00 0.00 0.00 0.008 Interceptors for sewage treatment 6.38 0.00 1.92 4.47 0.00 0.00 0.00 0.00 0.00 0.00 1.92 4.47 0.00 0.00 0.00 0.00 0.00 0.00 0.00 0.00 0.009 Biological Waste Water Treatment System 5.00 0.00 1.50 3.50 0.00 0.00 0.00 0.00 0.00 0.00 1.50 3.50 0.00 0.00 0.00 0.00 0.00 0.00 0.00 0.00 0.00
10 Retroffiting and conservation of heritage buildings 30.00 3.00 6.00 6.00 15.00 0.00 0.00 0.00 0.00 3.00 6.00 6.00 15.00 0.00 0.00 0.00 0.00 0.00 0.00 0.00 0.00BABA DEMB LAKE REJUVENATION 199.90
11 Baba Demb water quality rejuvenation (STP augmentation) 24.00 4.80 9.60 9.60 0.00 4.80 9.60 9.60 0.00 0.00 0.00 0.00 0.00 0.00 0.00 0.00 0.00 0.00 0.00 0.00 0.0012 Desilting and capacity enhancement 7.17 0.72 2.87 3.59 0.00 0.72 2.87 3.59 0.00 0.00 0.00 0.00 0.00 0.00 0.00 0.00 0.00 0.00 0.00 0.00 0.0013 Desilting and cleaning of Canal leading to Dal lake 7.84 0.39 3.53 3.92 0.00 0.39 3.53 3.92 0.00 0.00 0.00 0.00 0.00 0.00 0.00 0.00 0.00 0.00 0.00 0.00 0.0014 Boardwalks, walkways and Cycle tracks 5.00 0.00 3.00 2.00 0.00 0.00 3.00 2.00 0.00 0.00 0.00 0.00 0.00 0.00 0.00 0.00 0.00 0.00 0.00 0.00 0.00
15Open space Landscape and ecological gardens along the lake edge and Interceptor drain and Biological Treatment of Stormwater 8.00 0.00 4.00 4.00 0.00 0.00 0.00 0.00 0.00 0.00 4.00 4.00 0.00 0.00 0.00 0.00 0.00 0.00 0.00 0.00 0.00
16 Temple restoration 0.89 0.00 0.00 0.89 0.00 0.00 0.00 0.89 0.00 0.00 0.00 0.00 0.00 0.00 0.00 0.00 0.00 0.00 0.00 0.00 0.0017 Water transport to Dal Lake 2.00 0.00 0.00 0.80 1.20 0.00 0.00 0.00 0.00 0.00 0.00 0.00 0.00 0.00 0.00 0.80 1.20 0.00 0.00 0.00 0.0018 Floating Wet Land Interpretation and training Center 2.50 0.00 2.50 0.00 0.00 0.00 2.50 0.00 0.00 0.00 0.00 0.00 0.00 0.00 0.00 0.00 0.00 0.00 0.00 0.00 0.0019 Aereation Fountain (incl. light and sound) 2.50 0.00 2.50 0.00 0.00 0.00 2.50 0.00 0.00 0.00 0.00 0.00 0.00 0.00 0.00 0.00 0.00 0.00 0.00 0.00 0.0020 Urban Renewal along Nallah-i-Mar and Brari Nambal 140.00 0.00 28.00 42.00 70.00 0.00 0.00 0.00 0.00 0.00 2.80 4.20 7.00 0.00 25.20 37.80 63.00 0.00 0.00 0.00 0.00
REVITALIZATION OF HERITAGE AND CULTURAL TOURISM 158.2821 SHER GARHI INTERNATIONAL CENTRE 80.00 8.00 24.00 24.00 24.00 2.40 7.20 7.20 7.20 0.00 0.00 0.00 0.00 5.60 16.80 16.80 16.80 0.00 0.00 0.00 0.0022 Conservation of Existing Shrines 6.05 3.63 2.42 0.00 0.00 0.00 0.00 0.00 0.00 3.63 2.42 0.00 0.00 0.00 0.00 0.00 0.00 0.00 0.00 0.00 0.0023 YARKAND SERAI REVISTED - BOUTIQUE CRAFT MARKET 19.00 1.90 7.60 9.50 0.00 0.95 3.80 4.75 0.00 0.95 3.80 4.75 0.00 0.00 0.00 0.00 0.00 0.00 0.00 0.00 0.0024 Lal Ded Centre, Ganpatyar - City History Museum 1.50 0.15 0.60 0.75 0.00 0.00 0.00 0.00 0.00 0.15 0.60 0.75 0.00 0.00 0.00 0.00 0.00 0.00 0.00 0.00 0.0025 Promoting historic houses as destination spaces (13 identified houses) 13.00 1.30 5.20 6.50 0.00 0.00 0.00 0.00 0.00 1.30 5.20 6.50 0.00 0.00 0.00 0.00 0.00 0.00 0.00 0.00 0.0026 Capacity building and Skill development for hospitality and tourism 38.73 3.87 7.75 11.62 15.49 3.87 7.75 11.62 15.49 0.00 0.00 0.00 0.00 0.00 0.00 0.00 0.00 0.00 0.00 0.00 0.00
REJUVINATION OF ARTISAN CLUSTERS AND HISTORIC MARKETS 50.0027 Maharajganj Market 10.00 1.00 4.00 3.00 2.00 0.00 0.00 0.00 0.00 1.00 4.00 3.00 2.00 0.00 0.00 0.00 0.00 0.00 0.00 0.00 0.0028 Bohri Kadal Market 10.00 1.00 4.00 3.00 2.00 0.00 0.00 0.00 0.00 1.00 4.00 3.00 2.00 0.00 0.00 0.00 0.00 0.00 0.00 0.00 0.0029 Zaina Kadal Market 10.00 1.00 4.00 3.00 2.00 0.00 0.00 0.00 0.00 1.00 4.00 3.00 2.00 0.00 0.00 0.00 0.00 0.00 0.00 0.00 0.0030 Kawdara, Nallah-i-Mar Road - Craft Exhibition Centre 10.00 0.50 5.00 4.50 0.00 0.00 0.00 0.00 0.00 0.50 5.00 4.50 0.00 0.00 0.00 0.00 0.00 0.00 0.00 0.00 0.0031 Institutional strengthening, CDI 5.00 0.25 2.50 2.25 0.00 0.25 2.50 2.25 0.00 0.00 0.00 0.00 0.00 0.00 0.00 0.00 0.00 0.00 0.00 0.00 0.0032 Common Facilities 5.00 0.75 2.50 1.75 0.00 0.75 2.50 1.75 0.00 0.00 0.00 0.00 0.00 0.00 0.00 0.00 0.00 0.00 0.00 0.00 0.00
ECONOMIC REVIVAL OF DOWNTOWN 603.46
33 Adaptive Reuse of Lower Court as Boutique Hotel /Mixed Use Zone 0.00 0.00 0.00 0.00 0.00 0.00 0.00 0.00 0.00 0.00 0.00 0.00 0.00 0.00 0.00 0.00 0.00 0.00 0.00 0.00Infrastructure development cost 3.66 0.73 2.20 0.73 0.00 0.00 0.00 0.00 0.00 0.00 0.00 0.00 0.00 0.73 2.20 0.73 0.00 0.00 0.00 0.00 0.00Project Development and Construction Cost 115.59 0.00 23.12 34.68 57.79 0.00 0.00 0.00 0.00 0.00 0.00 0.00 0.00 0.00 23.12 34.68 57.79 0.00 0.00 0.00 0.00
34 Redevelopment of FCI godowns as Commercial District 0.00 0.00 0.00 0.00 0.00 0.00 0.00 0.00 0.00 0.00 0.00 0.00 0.00 0.00 0.00 0.00 0.00 0.00 0.00 0.00Infrastructure development cost 10.50 2.10 5.25 3.15 0.00 0.00 0.00 0.00 0.00 0.00 0.00 0.00 0.00 2.10 5.25 3.15 0.00 0.00 0.00 0.00 0.00Project Development and Construction Cost 473.72 0.00 94.74 189.49 189.49 0.00 0.00 0.00 0.00 0.00 0.00 0.00 0.00 0.00 94.74 189.49 189.49 0.00 0.00 0.00 0.00DOWNTOWN URBAN RENEWAL 143.81
35 Pedastrian Pathway (using local stone) in heritage prescint 31.18 6.24 15.59 9.35 0.00 0.00 0.00 0.00 0.00 6.24 15.59 9.35 0.00 0.00 0.00 0.00 0.00 0.00 0.00 0.00 0.00
36Retrofitting, conservation and facde improvement in heritage network
39.60 7.92 19.80 11.88 0.00 0.00 0.00 0.00 0.00 7.92 19.80 11.88 0.00 0.00 0.00 0.00 0.00 0.00 0.00 0.00 0.0037 Street Furniture, Signages and Urban Art 15.72 6.29 6.29 3.14 0.00 0.00 0.00 0.00 0.00 6.29 6.29 3.14 0.00 0.00 0.00 0.00 0.00 0.00 0.00 0.00 0.0038 Advertisement panels and Dashboards display at interecstions 13.82 6.91 6.91 0.00 0.00 0.00 0.00 0.00 0.00 6.91 6.91 0.00 0.00 0.00 0.00 0.00 0.00 0.00 0.00 0.00 0.0039 Advertisement panels and Dashboards display on street lights 3.28 1.64 1.64 0.00 0.00 0.00 0.00 0.00 0.00 1.64 1.64 0.00 0.00 0.00 0.00 0.00 0.00 0.00 0.00 0.00 0.0040 Wifi Hubs 1.20 1.20 0.00 0.00 0.00 0.00 0.00 0.00 0.00 0.00 0.00 0.00 0.00 1.20 0.00 0.00 0.00 0.00 0.00 0.00 0.0041 Green Corridors (Including revival of parks) 5.52 1.66 2.21 1.66 0.00 0.00 0.00 0.00 0.00 1.66 2.21 1.66 0.00 0.00 0.00 0.00 0.00 0.00 0.00 0.00 0.0042 Hawkers' Zone 4.50 0.00 2.25 2.25 0.00 0.00 0.00 0.00 0.00 0.00 2.25 2.25 0.00 0.00 0.00 0.00 0.00 0.00 0.00 0.00 0.0043 Smart health centres and telemedicine 3.50 0.00 1.40 2.10 0.00 0.00 0.00 0.00 0.00 0.00 1.40 2.10 0.00 0.00 0.00 0.00 0.00 0.00 0.00 0.00 0.0044 Sports Infrastructure (3 Stadiums + 5 Schools) 25.00 5.00 10.00 10.00 0.00 5.00 10.00 10.00 0.00 0.00 0.00 0.00 0.00 0.00 0.00 0.00 0.00 0.00 0.00 0.00 0.0045 Smart Classrooms (7 Schools) 0.49 0.49 0.00 0.00 0.00 0.49 0.00 0.00 0.00 0.00 0.00 0.00 0.00 0.00 0.00 0.00 0.00 0.00 0.00 0.00 0.00
18 A. Project Cost

Sr. No. PROJECTSTotal Cost (Rs.
Crore) YoY Phasing CONVERGENCE Smart City Funding PPP Debt
YEAR 1 (Rs. Cr)
YEAR 2 (Rs. Cr)
YEAR 3 (Rs. Cr)
YEAR 4 (Rs. Cr)
YEAR 1 (Rs. Cr)
YEAR 2 (Rs. Cr)
YEAR 3 (Rs. Cr)
YEAR 4 (Rs. Cr)
YEAR 1 (Rs. Cr)
YEAR 2 (Rs. Cr)
YEAR 3 (Rs. Cr)
YEAR 4 (Rs. Cr)
YEAR 1 (Rs. Cr)
YEAR 2 (Rs. Cr)
YEAR 3 (Rs. Cr)
YEAR 4 (Rs. Cr)
YEAR 1 (Rs. Cr)
YEAR 2 (Rs. Cr)
YEAR 3 (Rs. Cr)
YEAR 4 (Rs. Cr)
ABD PROJECTS
IMPROVED URBAN MOBILITY 293.47
46 Pedestrian Walkways and Footpaths 14.74 0.00 2.95 5.90 5.90 0.00 1.47 2.95 2.95 0.00 1.47 2.95 2.95 0.00 0.00 0.00 0.00 0.00 0.00 0.00 0.00
47 Road Redevelopment Works 110.04 5.50 27.51 44.02 33.01 3.30 16.51 26.41 19.81 2.20 11.00 17.61 13.20 0.00 0.00 0.00 0.00 0.00 0.00 0.00 0.00
48 Number of Battery Cars for IPT Route (identified routes) 3.00 0.00 3.00 0.00 0.00 0.00 3.00 0.00 0.00 0.00 0.00 0.00 0.00 0.00 0.00 0.00 0.00 0.00 0.00 0.00 0.00
49 EV charging stations 0.15 0.00 0.15 0.00 0.00 0.00 0.15 0.00 0.00 0.00 0.00 0.00 0.00 0.00 0.00 0.00 0.00 0.00 0.00 0.00 0.00
50 Bicycle Sharing Scheme (Number of Cycles) 0.20 0.20 0.00 0.00 0.00 0.00 0.00 0.00 0.00 0.20 0.00 0.00 0.00 0.00 0.00 0.00 0.00 0.00 0.00 0.00 0.00
51 Bicycle Sharing Scheme (Cycle Stands) 0.15 0.15 0.00 0.00 0.00 0.00 0.00 0.00 0.00 0.15 0.00 0.00 0.00 0.00 0.00 0.00 0.00 0.00 0.00 0.00 0.00
52 Multilevel Parking Lots 102.00 15.30 45.90 40.80 0.00 0.00 0.00 0.00 0.00 0.00 0.00 0.00 0.00 0.00 0.00 0.00 0.00 15.30 45.90 40.80 0.00
53 Car Parking at (7 locations) 25.00 3.75 12.50 8.75 0.00 0.00 0.00 0.00 0.00 0.75 2.50 1.75 0.00 3.00 10.00 7.00 0.00 0.00 0.00 0.00 0.00
54 Junction Improvements (12 junctions) 30.00 0.00 12.00 12.00 6.00 0.00 6.00 6.00 3.00 0.00 6.00 6.00 3.00 0.00 0.00 0.00 0.00 0.00 0.00 0.00 0.00
55 Provision of cycle track on the motorable road (2.5 meters width) 8.19 0.00 4.09 4.09 0.00 0.00 2.05 2.05 0.00 0.00 2.05 2.05 0.00 0.00 0.00 0.00 0.00 0.00 0.00 0.00 0.00
SMART UTILITIES MANAGEMENT 972.1556 Utility Removal 4.06 0.41 1.42 1.62 0.61 0.00 0.00 0.00 0.00 0.41 1.42 1.62 0.61 0.00 0.00 0.00 0.00 0.00 0.00 0.00 0.00
57 Multi-services underground ducting 276.15 27.61 69.04 96.65 82.84 0.00 0.00 0.00 0.00 27.61 69.04 96.65 82.84 0.00 0.00 0.00 0.00 0.00 0.00 0.00 0.0058 Smart water metering 44.51 6.68 22.25 15.58 0.00 0.00 0.00 0.00 0.00 6.68 22.25 15.58 0.00 0.00 0.00 0.00 0.00 0.00 0.00 0.00 0.00
59 24*7 Water Supply 263.50 26.35 79.05 79.05 79.05 26.35 79.05 79.05 79.05 0.00 0.00 0.00 0.00 0.00 0.00 0.00 0.00 0.00 0.00 0.00 0.0060 Smart power metering 25.00 3.75 12.50 8.75 0.00 1.13 3.75 2.63 0.00 2.63 8.75 6.13 0.00 0.00 0.00 0.00 0.00 0.00 0.00 0.00 0.00
61 24*7 Power Supply 300.00 30.00 60.00 90.00 120.00 30.00 60.00 90.00 120.00 0.00 0.00 0.00 0.00 0.00 0.00 0.00 0.00 0.00 0.00 0.00 0.00
62Smart Street Lighting (LED Street Lights with Display panels and day light sensors) 2.62 0.79 0.79 1.05 0.00 0.79 0.79 1.05 0.00 0.00 0.00 0.00 0.00 0.00 0.00 0.00 0.00 0.00 0.00 0.00 0.00
63 Smart Solar City 17.01 0.00 6.81 8.51 1.70 0.00 6.12 7.66 1.53 0.00 0.68 0.85 0.17 0.00 0.00 0.00 0.00 0.00 0.00 0.00 0.0064 Drainage 39.30 7.86 13.76 13.76 3.93 5.50 9.63 9.63 2.75 2.36 4.13 4.13 1.18 0.00 0.00 0.00 0.00 0.00 0.00 0.00 0.00
SEWAGE and SANITATION 305.04
65 Sewerage Connection and Network 300.00 60.00 105.00 105.00 30.00 0.00 0.00 0.00 0.00 0.00 0.00 0.00 0.00 0.00 0.00 0.00 0.00 60.00 105.00 105.00 30.00
66 Bio-Toilets at major nodes 5.04 2.52 2.52 0.00 0.00 1.26 1.26 0.00 0.00 1.26 1.26 0.00 0.00 0.00 0.00 0.00 0.00 0.00 0.00 0.00 0.00
SOLID WASTE 12.20
67 GPS enabled vehicles for waste collection 1.00 1.00 0.00 0.00 0.00 1.00 0.00 0.00 0.00 0.00 0.00 0.00 0.00 0.00 0.00 0.00 0.00 0.00 0.00 0.00 0.00
68 Reverse Vending Machines (Pilot project) 0.64 0.64 0.00 0.00 0.00 0.64 0.00 0.00 0.00 0.00 0.00 0.00 0.00 0.00 0.00 0.00 0.00 0.00 0.00 0.00 0.00
69 3 Bin Segregation Dustbins 3.96 1.98 1.98 0.00 0.00 1.98 1.98 0.00 0.00 0.00 0.00 0.00 0.00 0.00 0.00 0.00 0.00 0.00 0.00 0.00 0.00
70 Community Waste Composting (Organic / kitchen waste) 1.00 1.00 0.00 0.00 0.00 0.80 0.00 0.00 0.00 0.20 0.00 0.00 0.00 0.00 0.00 0.00 0.00 0.00 0.00 0.00 0.00
71 Electromagnatic Plastic Disintegrator 5.60 2.80 2.80 0.00 0.00 2.24 2.24 0.00 0.00 0.56 0.56 0.00 0.00 0.00 0.00 0.00 0.00 0.00 0.00 0.00 0.00
PAN CITY PROJECTS
URBAN MOBILITY 284.94
72 Electric Buses 198.00 79.20 118.80 0.00 0.00 71.28 106.92 0.00 0.00 7.92 11.88 0.00 0.00 0.00 0.00 0.00 0.00 0.00 0.00 0.00 0.00
73 Smart Bus Stops with Passesnge System 31.44 9.43 18.86 3.14 0.00 0.00 0.00 0.00 0.00 0.00 0.00 0.00 0.00 9.43 18.86 3.14 0.00 0.00 0.00 0.00 0.00
74 EV charging stations 0.50 0.50 0.00 0.00 0.00 0.50 0.00 0.00 0.00 0.00 0.00 0.00 0.00 0.00 0.00 0.00 0.00 0.00 0.00 0.00 0.00
75 Provision of Common Mobility Card (dsitribution at city civic center) 5.00 0.00 5.00 0.00 0.00 0.00 0.00 0.00 0.00 0.00 5.00 0.00 0.00 0.00 0.00 0.00 0.00 0.00 0.00 0.00 0.00
76 Intelligent Traffic Management System 50.00 0.00 10.00 25.00 15.00 0.00 3.00 7.50 4.50 0.00 7.00 17.50 10.50 0.00 0.00 0.00 0.00 0.00 0.00 0.00 0.00
E-GOVERNACE 37.50
77Community engagement and grievance management system - Civic services App and Civic Service Centers 3.00 0.60 0.90 1.50 0.00 0.00 0.00 0.00 0.00 0.60 0.90 1.50 0.00 0.00 0.00 0.00 0.00 0.00 0.00 0.00 0.00
78
Smart Data Center (City Civic Services, Traffic Management, Disaster Response Integration) including GIS based Property Assessment and management system 25.00 2.50 12.50 10.00 0.00 0.00 0.00 0.00 0.00 2.50 12.50 10.00 0.00 0.00 0.00 0.00 0.00 0.00 0.00 0.00 0.00
79Development and Operation & maintenance - of Property development and approval system 8.00 0.80 2.40 3.20 1.60 0.00 0.00 0.00 0.00 0.80 2.40 3.20 1.60 0.00 0.00 0.00 0.00 0.00 0.00 0.00 0.00
80 Discover Srinagar One Stop App 1.50 1.50 0.00 0.00 0.00 0.00 0.00 0.00 0.00 1.50 0.00 0.00 0.00 0.00 0.00 0.00 0.00 0.00 0.00 0.00 0.00
DISASTER MANAGEMENT ad ENVIRONMENT PROTECTION 384.55
81
River bank development (Flood management program) - Inundation mapping and flood management measures, including river bank development) 358.00 17.90 71.60 143.20 125.30 17.90 71.60 143.20 125.30 0.00 0.00 0.00 0.00 0.00 0.00 0.00 0.00 0.00 0.00 0.00 0.00
82
Emergency Response System (Early warning and evacuation system) -Emergency Operations Centre with real time surveillance using citywide CCTV and communications network 10.00 4.00 5.00 1.00 0.00 0.00 0.00 0.00 0.00 4.00 5.00 1.00 0.00 0.00 0.00 0.00 0.00 0.00 0.00 0.00 0.00
83Earthquake Resistance Structural Audit and Building level inventory and multi-hazard risk mapping, with focus on seismic risk 0.50 0.10 0.20 0.20 0.00 0.00 0.00 0.00 0.00 0.10 0.20 0.20 0.00 0.00 0.00 0.00 0.00 0.00 0.00 0.00 0.00
18 B. Project Cost

Sr. No. PROJECTSTotal Cost (Rs. Crore) YoY Phasing CONVERGENCE Smart City Funding PPP Debt
YEAR 1 (Rs. Cr)
YEAR 2 (Rs. Cr)
YEAR 3 (Rs. Cr)
YEAR 4 (Rs. Cr)
YEAR 1 (Rs. Cr)
YEAR 2 (Rs. Cr)
YEAR 3 (Rs. Cr)
YEAR 4 (Rs. Cr)
YEAR 1 (Rs. Cr)
YEAR 2 (Rs. Cr)
YEAR 3 (Rs. Cr)
YEAR 4 (Rs. Cr)
YEAR 1 (Rs. Cr)
YEAR 2 (Rs. Cr)
YEAR 3 (Rs. Cr)
YEAR 4 (Rs. Cr)
YEAR 1 (Rs. Cr)
YEAR 2 (Rs. Cr)
YEAR 3 (Rs. Cr)
YEAR 4 (Rs. Cr)
PAN CITY PROJECTSDISASTER MANAGEMENT ad ENVIRONMENT PROTECTION 384.55
84
Safety plans of lifeline buildings (hospitals, fire stations, police stations, schools, power and communication installations), including retrofitting if required 5.00 2.50 2.50 0.00 0.00 1.25 1.25 0.00 0.00 1.25 1.25 0.00 0.00 0.00 0.00 0.00 0.00 0.00 0.00 0.00 0.00
85Social protection plan and capacity building, covering safety of women, children, persons with disabilities from disasters 0.25 0.13 0.13 0.00 0.00 0.06 0.06 0.00 0.00 0.06 0.06 0.00 0.00 0.00 0.00 0.00 0.00 0.00 0.00 0.00 0.00
86Establishment of community based trained task forces, anchored with educational institutions for sustainability 0.25 0.13 0.13 0.00 0.00 0.06 0.06 0.00 0.00 0.06 0.06 0.00 0.00 0.00 0.00 0.00 0.00 0.00 0.00 0.00 0.00
87 Local forecast through weather station grid 1.50 0.75 0.75 0.00 0.00 0.00 0.00 0.00 0.00 0.75 0.75 0.00 0.00 0.00 0.00 0.00 0.00 0.00 0.00 0.00 0.00
88Rapid warning dissemination through multiple media, including SMS, USSD, social media & instant messaging apps. 0.25 0.13 0.13 0.00 0.00 0.00 0.00 0.00 0.00 0.13 0.13 0.00 0.00 0.00 0.00 0.00 0.00 0.00 0.00 0.00 0.00
89
Fire-fighting including hydrants, fire stations and developing plans for evacuation, and search and rescue, including community based approaches 6.55 3.28 3.28 0.00 0.00 0.00 0.00 0.00 0.00 3.28 3.28 0.00 0.00 0.00 0.00 0.00 0.00 0.00 0.00 0.00 0.00
90 Relief shelters identification, pre-positioning and relief shelter inventory 2.00 1.00 1.00 0.00 0.00 0.00 0.00 0.00 0.00 1.00 1.00 0.00 0.00 0.00 0.00 0.00 0.00 0.00 0.0091 Training and awareness on response, across all stakeholders 0.25 0.13 0.13 0.00 0.00 0.00 0.00 0.00 0.00 0.13 0.13 0.00 0.00 0.00 0.00 0.00 0.00 0.00 0.00
SERVICES AND FACILITIES 58.0492 Real time water quality monitoring system 0.50 0.50 0.00 0.00 0.00 0.00 0.00 0.00 0.00 0.50 0.00 0.00 0.00 0.00 0.00 0.00 0.00 0.00 0.00 0.00 0.0093 Air pollution monitoring units and real time display boards 0.60 0.60 0.00 0.00 0.00 0.00 0.00 0.00 0.00 0.60 0.00 0.00 0.00 0.00 0.00 0.00 0.00 0.00 0.00 0.00 0.0094 Soild waste land fill area development 15.00 4.50 10.50 0.00 0.00 4.50 10.50 0.00 0.00 0.00 0.00 0.00 0.00 0.00 0.00 0.00 0.00 0.00 0.00 0.00 0.0095 Modern Abbatoir with Waste managemet system 28.00 5.60 11.20 11.20 0.00 5.60 11.20 11.20 0.00 0.00 0.00 0.00 0.00 0.00 0.00 0.00 0.00 0.00 0.00 0.00 0.0096 Green Corridors (Including revival of parks) 13.94 1.39 2.79 2.79 6.97 1.39 2.79 2.79 6.97 0.00 0.00 0.00 0.00 0.00 0.00 0.00 0.00 0.00 0.00 0.00 0.00
Pro
ject
Co
st
18 C . Project Cost
Description Total Cost (INR Crore)
Grand Cost (PAN CITY) 765.03
Grand Cost (ABD) 2869.24
Project Cost 3634.27
PMC fees @5% 181.71
Total Project Cost (including PMC and Escalation) 3815.98
Cost Through Convergence of Various Schemes 1560.04
Cost reduction through PPP route 864.10
Project cost covered through Debt (sourced by other departments /
authorities) 402.00
Actual Project Cost 989.84
Financial Summary Capital Cost Phasing
TOTAL CAPITAL COST PHASING
(Rs.Crore) 2017 2018 2019 2020
GoI Grant (Smart City Fund) 67.36 170.24 163.02 94.30
State Contribution 67.36 170.24 163.02 94.30
Convergence 216.67 487.42 467.41 388.55
PPP 22.06 208.17 305.59 328.28
Debt 75.30 150.90 145.80 30.00
TOTAL 451.65 1090.04 1153.80 846.89
13% 31% 33% 24%
Project Bundling (Scenarios based on project criticality) (rs. Crore)
TOTAL CAPITAL
INVESTMENTYEAR 1 YEAR 2 YEAR 3 YEAR 4
High Priority Projects 1907.43 310.13 654.62 597.83 344.86
Medium Priority Projects 989.00 94.72 291.98 316.97 285.34
Less Critical Projects 737.84 22.54 183.86 270.76 260.69

Q1 Q2 Q3 Q4 Q1 Q2 Q3 Q4 Q1 Q2 Q3 Q4 Q1 Q2 Q3 Q4
SR. NO. AREA BASED PROJECTS PREDECESSOR
RECONNECTING DOWN TOWN WITH JHELUM
1Pathways and Cycle Tracks along Bund Road 57, 64, 65
2Improvement of Ghats along Jhelum 3
3Dredging and silt removal of Jhelum/ tributaries
4Water Transport along Jhelum - terminal, ticket, amenities 3
5Water Transport along Jhelum - boats, shikaras etc. 3
6Area Illumination along riverbanks 57
7Rivetment and Embankments along Riverbank
8Interceptors for sewage treatment 57
9
Biological Waste Water Treatment System8
10Retrofitting and conservation of heritage buildings
BABA DEMB LAKE REJUVENATION
11Baba Demb water quality rejuvenation (STP augmentation)
12Desilting and capacity enhancement
13Desilting and cleaning of Canal leading to Dal lake
14Boardwalks, walkways and Cycle tracks 57, 11,12
15Landscaping and ecological restoration of lake 11, 12
16Temple restoration
17Water transport to Dal Lake 11,12,13
18Floating Wet Land Interpretation and training Centre 11,12
19Aeration Fountain (incl. light and sound) 18
20
Urban Renewal along Nallah-i-Mar and Brari Nambal
REVITALIZATION OF HERITAGE AND CULTURAL TOURISM
21SHER GARHI INTERNATIONAL CENTRE
22Conservation of Existing Shrines
23YARKAND SERAI REVISTED - BOUTIQUE CRAFT MARKET
24Lal Ded Centre, Ganpatyar - City History Museum
25Promoting historic houses as destination spaces (13 houses)
26Capacity building, skill development (hospitality & tourism)
REJUVINATION OF ARTISAN CLUSTERS AND HISTORIC
MARKETS
27Maharajganj Market
28Bohri Kadal Market
29Zaina Kadal Market
30
Kawdara, Nallah-i-Mar Road - Craft Exhibition Centre
31Institutional strengthening, CDI
32Common Facilities
ECONOMIC REVIVAL OF DOWNTOWN
33Adaptive Reuse of Lower Court as Hotel & Mixed Use Zone
34Redevelopment of FCI godowns as Commercial District
DOWNTOWN URBAN RENEWAL
35Pedestrian Pathway (using local stone) in heritage prescient
36
Retrofitting, conservation and facde improvement in
heritage network
37 Street Furniture, Signages and Urban Art57
38 Advertisement panels & Dashboards at intersections
2017-18 YEAR 1 2018-19 YEAR 2 2019-20 YEAR 3 2020-21 YEAR 4
Continuous Process
Continuous Process
Potential Phase-1 Potential Phase-2 Potential Phase-3
Potential Phase-1 Potential Phase-2 Potential Phase-3
Q1 Q2 Q3 Q4 Q1 Q2 Q3 Q4 Q1 Q2 Q3 Q4 Q1 Q2 Q3 Q4
SR. NO. AREA BASED PROJECTS PRDECESSOR
39 Advertisement panels & Dashboards display on street lights
40 Wifi Hubs
41Green Corridors (Including revival of parks)
42Hawkers' Zone
43
Smart health centres and telemedicine
44
Sports Infrastructure (3 Stadiums + 5 Schools)
45
Smart Classrooms (7 Schools)
IMPROVED URBAN MOBILITY
46 Pedestrian Walkways and Footpaths57
47 Road Redevelopment Works
48 Number of Battery Cars for IPT Route (identified routes)
49 EV charging stations
50 Bicycle Sharing Scheme (Number of Cycles)
51Bicycle Sharing Scheme (Cycle Stands)
52Multilevel Parking Lots
53Car Parking at (7 locations)
54Junction Improvements (12 junctions) 57
55 Provision of cycle track on the motorable road 57
SMART UTILITIES MANAGEMENT
56Utility Removal
57 Multi-services underground ducting
58 Smart water metering
59 24*7 Water Supply57
60 Smart power metering
61 24*7 Power Supply57
62 Smart Street Lighting (LED Street Lights with sensors)
63 Smart Solar City
64 Drainage
SEWAGE and SANITATION
65 Sewerage Connection and Network
66 Bio-Toilets at major nodes
SOLID WASTE
67 GPS enabled vehicles for waste collection
68 Reverse Vending Machines (Pilot project)
69 3 Bin Segregation Dustbins
70 Community Waste Composting (Organic / kitchen waste)
71 Electromagnetic Plastic waste segregator
PAN CITY PROJECTS
URBAN MOBILITY
72 Electric Buses
73 Smart Bus Stops with Passenger System
74 EV charging stations
75 Provision of Common Mobility Card
76 Intelligent Traffic Management System
YEAR 1 YEAR 2 YEAR 3 YEAR 4
Potential Phase-1 Potential Phase-2 Potential Phase-3
Potential Phase-1 Potential Phase-2 Potential Phase-3
Potential Phase-1 Potential Phase-2 Potential Phase-3
19 A. Project Implementation
Co
nce
ptd
eve
lop
me
nt/
Pro
ject
Ide
atio
n
Co
nsu
ltin
gA
rch
ite
ct/
Tran
sact
ion
Ad
viso
r/Te
chn
ical
Co
nsu
ltan
t/M
aste
r P
lan
nin
g C
on
sult
ant
De
sign
Re
po
rt/
De
tail
ed
Pro
ject
Re
po
rt
Ten
de
r Do
cum
en
t/C
on
cess
ion
Agr
ee
me
nt
Sele
ctio
n-A
war
d/
Pre
ferr
ed
Bid
de
r
Co
mp
leti
on
/St
age
Co
mp
leti
on
Co
mm
issi
on
ing/
Co
mm
erc
ialO
pe
rati
on
/

Q1 Q2 Q3 Q4 Q1 Q2 Q3 Q4 Q1 Q2 Q3 Q4 Q1 Q2 Q3 Q4
SR. NO. PAN CITY PROJECTS PREDECESSOR
E-GOVERNACE
77
Civic services App and Civic Service Centres - Community/
Citizen Grievange Redressal
78
Smart Data Centre (City Civic Services, Traffic Management,
Disaster Response Integration)
79
Development and Operation & maintenance - of Property
development and approval system
80 Discover Srinagar One Stop App
DISASTER MANAGEMENT ad ENVIRONMENT PROTECTION
81 River bank development (Flood management program)
82
Emergency Response System and Operations Centre with
real time surveillance
83
Building level inventory and multi-hazard risk mapping,
with focus on seismic risk
84
Safety plans of lifeline buildings including retrofitting if
required
85 Social protection plan and capacity building
86
Establishment of community based trained task forces for
sustainability
87Local forecast through weather station grid
88
Rapid warning dissemination through multiple media (SMS,
USSD, social media & apps)
89
Fire-fighting including hydrants, fire stations
90
Relief shelters identification, pre-positioning and relief
shelter inventory
91
Training and awareness on response, across all stakeholders
SERVICES AND FACILITIES
92Real time water quality monitoring system
93Air pollution monitoring units and real time display boards
94Soild waste land fill area development
95Modern Abbatoir with Waste managemet system
95Green Corridors (Including revival of parks)
YEAR 1 YEAR 2 YEAR 3 YEAR 4
Concept development/Project Ideation
Consulting Architect/Transaction Advisor/Technical Consultant/Master Planning Consultant
Design Report/Detailed Project Report
Tender Document/Concession Agreement
Selection-Award/Preferred Bidder
Completion/Stage Completion
Commissioning/Commercial Operation/
19 B. Project Implementation

REVENUE PROJECTION
All figures in INR Crore
Sr. No. REVENUE SOURCES 2018 2019 2020 2021 2022 2023 2024 2025 2026 2027
1 CAPITAL CONTRIBUTION AND GRANTS
a Government of India Grant - Smart City Mission 67.36 170.24 163.02 94.30
b Government of Jammu & Kashmir 67.36 170.24 163.02 94.30
2 CAPITAL RECEIPTS
a RECONNECTING DOWN TOWN WITH JHELUM - Other Source 0.00 12.00 12.00 0.00
b RECONNECTING DOWN TOWN WITH JHELUM - Convergence 19.52 28.29 17.74 0.00
c BABA DEMB LAKE REJUVENATION - Other Source 0.00 25.20 38.60 64.20
d BABA DEMB LAKE REJUVENATION - Convergence 5.91 24.00 20.00 0.00
e REVITALIZATION OF HERITAGE AND CULTURAL TOURISM - Other Source 5.60 16.80 16.80 16.80
f REVITALIZATION OF HERITAGE AND CULTURAL TOURISM - Convergence 7.22 18.75 23.57 22.69
g REJUVINATION OF ARTISAN CLUSTERS AND HISTORIC MARKETS - Convergence 1.00 5.00 4.00 0.00
h ECONOMIC REVIVAL OF DOWNTOWN - Other Source 2.83 125.31 228.04 247.28
i DOWNTOWN URBAN RENEWAL - Other Source 1.20 0.00 0.00 0.00
j DOWNTOWN URBAN RENEWAL - Convergence 5.49 10.00 10.00 0.00
k URBAN MOBILITY - Other Source 12.43 28.86 10.14 0.00
l URBAN MOBILITY - Convergence 75.08 139.10 44.90 30.25
m SMART UTILITIES MANAGEMENT - Convergence 63.76 159.34 190.01 203.33
n SEWAGE and SANITATION - Convergence 1.26 1.26 0.00 0.00
o SOLID WASTE - Convergence 6.66 4.22 0.00 0.00
p DISASTER MANAGEMENT - Convergence 19.28 72.98 143.20 125.30
q SERVICES AND UTILLITIES - Convergence 11.49 24.49 13.99 6.97
3 Value Capture (TDR, Development Charges, Additional FAR etc.) 0.00 0.00 4.04 8.47 32.30 48.45 80.47 82.08 83.72 89.58
a Betterment Charges 0.00 0.00 0.20 0.42 1.61 2.42 4.02 4.10 4.19 4.48
b Impact Fees 0.00 0.00 0.40 0.85 3.23 4.84 8.05 8.21 8.37 8.96
c Fire Tax 0.00 0.00 0.04 0.08 0.32 0.48 0.80 0.82 0.84 0.90
4 Advertisement charges 0.48 1.46 4.13 6.25 8.84 10.04 10.65 10.76 11.41 11.52
5 Utility Charges
a Water Supply 0.00 1.81 3.69 10.17 14.52 19.04 20.97 21.39 21.82 24.03
b Solid Waste 1.98 2.02 2.06 2.27 2.31 2.36 2.60 2.65 2.70 2.98
6 Parking spaces
a Rental from parking spaces 0.19 0.42 0.91 1.76 2.63 2.89 3.18 3.50 3.85 4.23
7 Revenue Generating Projects (ABD)
a WATER TRANSPORT ALONG JHELUM and DAL LAKE 1.68 1.71 1.75 1.96 2.00 2.04 2.29 2.34 2.38 2.67
b MUSEUM ATTRACTION 0.00 0.37 1.12 1.68 4.29 5.25 6.87 8.01 8.17 9.16
c FLOATING RESTAURANT 0.24 0.24 0.24 0.26 0.26 0.26 0.29 0.29 0.29 0.32
d HAWKER / VEDOR ZONE 0.03 0.03 0.04 0.04 0.04 0.04 0.04 0.04 0.04 0.04
e RENTAL FROM MAJOR MARKETS 0.03 0.08 0.16 0.17 0.18 0.19 0.20 0.21 0.22 0.23
f RENTAL FROM ARTISAN CLUSTERS AND EXHIBITION CENTER 0.05 0.12 0.12 0.13 0.13 0.14 0.15 0.15 0.16 0.17
g CYCLE RENTAL INCOME 0.07 0.15 0.22 0.31 0.37 0.38 0.39 0.39 0.40 0.41
h BATTREY OPERATED CARS 0.22 0.32 0.48 0.50 0.53 0.55 0.58 0.61 0.64 0.67
i RVM (Reverse Vending Machine) and COMPOST PROJECT 0.02 0.02 0.02 0.02 0.02 0.02 0.02 0.02 0.02 0.02
j BIO TOILETS 0.27 0.28 0.28 0.29 0.29 0.30 0.30 0.31 0.32 0.32
k PPP LAREGE AREA DEVELOPMENT 0.00 0.46 0.97 3.05 4.27 6.72 9.41 11.12 11.67 12.26
l UTILITY DUCT USER CHARGES 0.00 1.39 2.82 5.69 10.06 14.51 20.52 26.65 26.91 27.18
m SMART POWER METERING 0.16 0.48 0.81 1.31 1.65 1.67 1.69 1.70 1.72 1.74
n SOLAR POWER GENERATION 0.00 0.68 1.71 2.74 3.42 3.52 3.52 3.52 3.52 3.52
8 Revenue Generating Projects (PAN CITY)
a DISCOVER SRINAGAR APP 0.02 0.07 0.11 0.19 0.24 0.24 0.25 0.25 0.26 0.26
ABBATOIR RENTAL INCOME 0.00 0.00 0.00 0.00 0.00 0.00 0.00 0.00 0.00 0.00
b E-BUSES 1.79 2.69 4.40 6.32 8.32 8.52 8.73 8.95 9.16 9.39
TOTAL 380.69 1050.85 1129.76 960.33 101.82 134.88 185.98 198.06 202.78 215.05
20 A. Revenue Projection

EXPENDITURE PROJECTION
20 B. Expenditure projection
All figures in INR Crore
Sr. No. EXPENDITURE 2018 2019 2020 2021 2022 2023 2024 2025 2026 2027
1 CAPITAL COSTS
a RECONNECTING DOWN TOWN WITH JHELUM 23.82 52.55 46.23 15.82
b BABA DEMB LAKE REJUVENATION 6.53 59.44 70.75 74.89
c REVITALIZATION OF HERITAGE AND CULTURAL TOURISM 20.02 50.40 55.42 41.56
d REJUVINATION OF ARTISAN CLUSTERS AND HISTORIC MARKETS 4.77 23.18 18.45 6.32
f ECONOMIC REVIVAL OF DOWNTOWN 3.80 133.22 241.00 259.97
g DOWNTOWN URBAN RENEWAL 39.35 69.67 42.73 0.00
h IMPROVED URBAN MOBILITY 10.31 65.76 78.92 47.24
i SMART UTILITIES MANAGEMENT 109.93 281.51 333.19 303.07
j SEWAGE and SANITATION 2.65 2.68 0.00 0.00
k SOLID WASTE 7.82 5.13 0.00 0.00
m URBAN MOBILITY 93.98 161.07 30.29 15.91
n E-GOVERNACE 5.72 16.69 15.55 1.68
o DISASTER MANAGEMENT ad ENVIRONMENT PROTECTION 31.45 88.86 151.64 131.61
p SERVICES AND UTILITIES 13.32 25.91 14.87 7.37
2 OPERATING EXPENSE
a RECONNECTING DOWN TOWN WITH JHELUM 0.48 0.97 1.80 2.35 4.72 5.10 5.50 5.94 6.42 6.93
b BABA DEMB LAKE REJUVENATION 0.37 0.66 1.83 3.19 4.76 6.56 7.85 8.48 9.16 9.89
c REVITALIZATION OF HERITAGE AND CULTURAL TOURISM 0.43 0.61 1.13 1.56 1.87 2.02 2.18 2.35 2.54 2.75
d REJUVINATION OF ARTISAN CLUSTERS AND HISTORIC MARKETS 0.34 0.53 0.83 1.09 1.28 1.38 1.49 1.61 1.74 1.88
e 0 0.60 0.65 0.70 0.76 0.82 0.88 0.95 1.03 1.11 1.20
f ECONOMIC REVIVAL OF DOWNTOWN - 1.02 1.11 1.19 1.29 1.39 1.50 1.62 1.75 1.89
g DOWNTOWN URBAN RENEWAL 0.32 0.96 1.86 3.56 4.97 7.26 9.46 10.21 11.03 11.91
h IMPROVED URBAN MOBILITY 1.06 2.44 4.06 6.38 10.38 14.99 20.26 22.31 24.10 26.02
i SMART UTILITIES MANAGEMENT 0.93 1.59 2.69 4.64 8.01 11.08 15.46 20.48 22.11 23.88
j SEWAGE and SANITATION 0.80 1.51 2.33 3.28 4.36 5.59 7.94 10.63 11.48 12.40
k SOLID WASTE 0.19 0.24 0.30 0.40 0.52 0.56 0.61 0.66 0.71 0.76
m E-GOVERNACE 0.05 0.12 0.25 0.34 0.59 0.79 0.86 0.93 1.00 1.08
n DISASTER MANAGEMENT ad ENVIRONMENT PROTECTION 0.15 0.42 1.35 2.42 4.19 6.22 9.15 11.86 14.24 15.37
o SERVICES AND UTILITIES 0.12 0.25 0.54 0.88 1.26 1.71 1.84 1.99 2.15 2.32
3 SPV OPERATION COST
a SALARIES AND WAGES 1.12 1.32 1.67 2.06 2.64 3.00 3.24 3.85 4.15 4.71b SPV OPERATION COST 0.17 0.18 0.28 0.35 0.45 0.49 0.53 0.57 0.61 0.66
TOTAL OUTFLOW 380.59 1,049.55 1,121.75 939.87 52.09 69.00 88.82 104.52 114.30 123.67

SPV – P&L STATEMENT
20 C. SPV – P&L Statement
All figures in INR Crore
Figures are in 2018 2019 2020 2021 2022 2023 2024 2025 2026 2027
INR Crore 1 2 3 4 5 6 7 8 9 10
Total Income
Usage and Development Charges 2.65 5.70 15.47 30.27 65.76 90.53 130.74 133.51 136.89 146.68
Revenue from Area Based Projects 2.77 6.33 10.74 18.13 27.51 35.59 46.26 55.35 56.46 58.72
Revenue from Pan City Soutions 1.81 2.75 4.52 6.50 8.56 8.76 8.98 9.20 9.42 9.65
Other Income 0.00 0.00 0.00 0.00 0.00 0.00 0.00 0.00 0.00 0.007.23 14.78 30.73 54.91 101.82 134.88 185.98 198.06 202.78 215.05
Total Expenses
Personnel Cost 1.12 1.32 1.67 2.06 2.64 3.00 3.24 3.85 4.15 4.71
Repair & Maint 5.85 11.97 20.78 32.04 49.01 65.51 85.06 100.10 109.54 118.30
Admin Expenses 0.11 0.11 0.17 0.20 0.29 0.31 0.34 0.36 0.39 0.42Electricity & Water 0.06 0.06 0.10 0.15 0.16 0.18 0.19 0.21 0.22 0.24
7.14 13.47 22.72 34.45 52.09 69.00 88.82 104.52 114.30 123.67
EBITDA 0.09 1.31 8.00 20.46 49.73 65.89 97.16 93.54 88.47 91.38
Tax 0.00 0.00 0.00 0.00 0.00 0.00 0.00 0.00 0.00 0.00
PAT 0.09 1.31 8.00 20.46 49.73 65.89 97.16 93.54 88.47 91.38
PROFIT & LOSS STATEMENT - SPV

20 D. O&M Estimates
OPERATION AND MAINTENANCEOPERATING EXPENDITURE 2018 2019 2020 2021 2022 2023 2024 2025
SPV O&MPERSONNEL COST
PARTICULARS
Annual
Salary
(INR)
No. of People
MANAGERIAL
MD cum CEO 3000000 1 3000000 3240000 3499200 3779136 4081467 4407984 4760623 5141473
General Managers 1800000 5 9000000 9720000 10497600 11337408 12244401 13223953 14281869 15424418
Administrative staff & Finance Staff 480000 10 4800000 5184000 5598720 6046618 6530347 7052775 7616997 8226356
Sub-total (INR crore) 16 1.68 1.81 1.96 2.12 2.29 2.47 2.67 2.88
SUPPORT SERVICE
Typists 360000 2 720000 777600 839808 906993 979552 1057916 1142550 1233953
Jr. Assistants 540000 5 2700000 2916000 3149280 3401222 3673320 3967186 4284561 4627326
Peons 180000 2 180000 194400 209952 226748 244888 264479 285637 308488
Sub-total (INR crore) 9 0.36 0.39 0.42 0.45 0.49 0.53 0.57 0.62
Annual Hiring 55% 60% 70% 80% 95% 100% 100% 110%
Total Cost Human Resource 25 Persons 1.12 1.32 1.67 2.06 2.64 3.00 3.24 3.85
YEAR 1 YEAR 2 YEAR 3 YEAR 4 YEAR 5 YEAR 6 YEAR 7 YEAR 8
REPAIRS & MAINTENANCE COST ASSUMPTION 1 2 3 4 5 6 7 8
RECONNECTING DOWN TOWN WITH JHELUM 3.0% of capex 0.481 0.69 1.50 2.02 4.36 4.71 5.09 5.50
BABA DEMB LAKE REJUVENATION 2.5% of capex 0.241 0.52 1.69 3.04 4.59 6.38 7.65 8.26
REVITALIZATION OF HERITAGE AND CULTURAL TOURISM 3.0% of capex 0.403 0.58 1.10 1.52 1.83 1.97 2.13 2.30
REJUVINATION OF ARTISAN CLUSTERS AND HISTORIC MARKETS 1.0% of capex 0.190 0.21 0.22 0.24 0.26 0.28 0.30 0.33
ECONOMIC REVIVAL OF DOWNTOWN 1.0% of capex - - - - - - -
DOWNTOWN URBAN RENEWAL 2.0% of capex 0.121 0.26 0.71 1.68 2.47 3.56 3.84 4.15
IMPROVED URBAN MOBILITY 3.0% of capex 0.564 1.22 1.97 2.84 4.60 6.63 8.95 9.66
SMART UTILITIES MANAGEMENT 1.5% of capex - 0.30 0.64 1.39 2.99 4.85 6.98 9.43
SEWAGE and SANITATION 2.0% of capex 0.600 1.30 2.10 3.02 4.08 5.29 7.62 10.28
SOLID WASTE 3.0% of capex 0.127 0.17 0.22 0.32 0.43 0.47 0.50 0.54
URBAN MOBILITY 2.5% of capex 0.025 0.07 0.15 0.31 0.68 1.10 1.59 2.14
E-GOVERNACE 1.5% of capex 0.054 0.12 0.25 0.34 0.59 0.79 0.86 0.93
DISASTER MANAGEMENT ad ENVIRONMENT PROTECTION 2.0% of capex 0.154 0.42 1.35 2.42 4.19 6.22 9.15 11.86
UTILITIES AND SERVICES 2.0% of capex 0.116 0.25 0.54 0.88 1.26 1.71 1.84 1.99
REPAIRS ANDMAINTENANCE OF ABD and PAN PROJECTS (REVENUE GENERATING)
WATER TRANSPORT ALONG JHELUM and DAL LAKE 2.0% of capex - 0.28 0.30 0.33 0.35 0.38 0.41 0.45
REVITALIZATION OF HERITAGE AND CULTURAL TOURISM 3.0% of capex 0.068 0.6 1.0 1.7 2.3 3.5 5.4 5.8
Floating Wet Land Interpretation and training Center 2.5% of capex 0.125 0.1 0.1 0.2 0.2 0.2 0.2 0.2
HAWKER / VEDOR ZONE 3.0% of capex 0.135 0.1 0.2 0.2 0.2 0.2 0.2 0.2
RENTAL FROM MAJOR MARKETS 2.5% of capex 0.150 0.3 0.6 0.9 1.0 1.1 1.2 1.3
RENTAL FROM ARTISAN CLUSTERS AND EXHIBITION CENTER 3.0% of capex 0.600 0.6 0.7 0.8 0.8 0.9 1.0 1.0
CYCLE RENTAL INCOME 5.0% of capex 0.018 0.0 0.0 0.0 0.0 0.0 0.0 0.0
BATTREY OPERATED CARS 5.0% of capex 0.158 0.2 0.2 0.2 0.2 0.2 0.2 0.3
RVM (Reverse Vending Machine) and COMPOST PROJECT 4.0% of capex 0.066 0.1 0.1 0.1 0.1 0.1 0.1 0.1
BIO TOILETS 4.0% of capex 0.202 0.2 0.2 0.3 0.3 0.3 0.3 0.3
PPP LAREGE AREA DEVELOPMENT 2.0% of capex - 1.0 1.1 1.2 1.3 1.4 1.5 1.6
UTILITY DUCT USER CHARGES 2.0% of capex - 0.3 1.0 2.1 3.8 4.9 7.0 9.5
SMART POWER METERING 2.0% of capex 0.500 0.5 0.6 0.6 0.7 0.7 0.8 0.9
SOLAR POWER GENERATION 2.5% of capex 0.425 0.5 0.5 0.5 0.6 0.6 0.7 0.7
DISCOVER SRINAGAR APP 2.0% of capex 0.030 0.0 0.0 0.0 0.0 0.0 0.0 0.1
E-BUSES 3.0% of capex 0.298 0.96 1.74 3.00 4.86 7.00 9.45 10.21
Total (INR crore) 5.85 11.97 20.78 32.04 49.01 65.51 85.06 100.10
ADMINISTRATION EXPENSES INR/month
Communication /staff/year 3,000 576,000 622,080 671,846 725,594 783,642 846,333 914,040 987,163
Printing & Stationery /staff/year 1,200 230,400 248,832 268,739 290,238 313,457 338,533 365,616 394,865
Vehicle & Conveyenace Rent 15,000 900,000 972,000 1,049,760 1,133,741 1,224,440 1,322,395 1,428,187 1,542,442
Miscellaneous Expense Assumption 2% of admin exp 409,536 442,299 477,683 515,897 557,169 601,743 649,882 701,873
Yearly Increase 50% 50% 70% 75% 100% 100% 100% 100%
Total (INR crore) 0.11 0.11 0.17 0.20 0.29 0.31 0.34 0.36
ELECTRICITY & WATER
Electricity Expenditure at Facil ity/Util ity 0.90 MW 225,000 243,000 262,440 283,435 306,110 330,599 357,047 385,610
Water Consumption (Landscaping, Firefighting) 150.00 KLD 975,240 1,053,259 1,137,520 1,228,522 1,326,803 1,432,948 1,547,583 1,671,390
Yearly Increase 50% 50% 75% 100% 100% 100% 100% 100%
Total (INR crore) 0.06 0.06 0.10 0.15 0.16 0.18 0.19 0.21