Embed Size (px)
Citation preview
[1]
A GLOBAL/COUNTRY STUDY AND REPORT
ON
SRILANKA (TEA SECTOR)
Submitted to:
GUJARAT TECHNOLOGICAL UNIVERSITY
IN PARTIAL FULFILLMENT OF THE
REQUIREMENT OF THE AWARD FOR THE DEGREE OF
Masters of Business Administration
UNDER THE GUIDANCE OF
Ms. Shyma Gokul
Assistant Professor
Submitted by:
Shri H.D. Gardi MBA College,
Nyara, Rajkot.
College Code: 780
Affiliated to Gujarat Technological University Ahmedabad
May, 2012

[2]
Chapter-I
Introduction
[3]
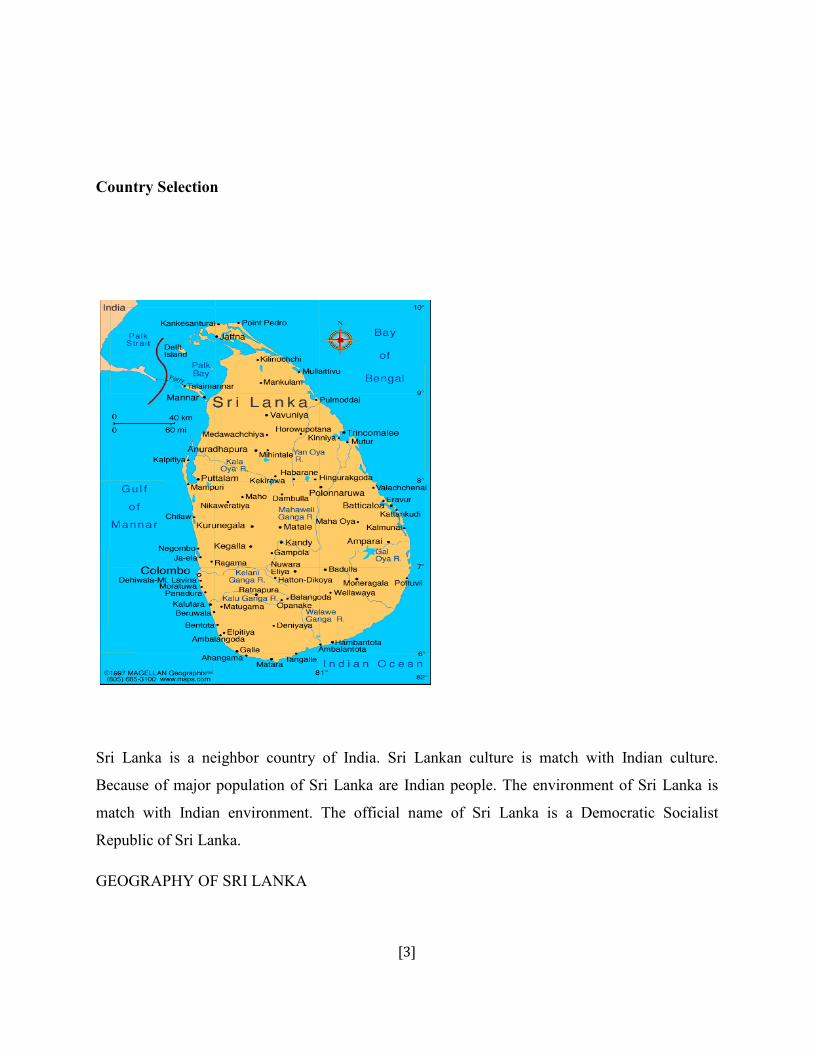
Country Selection
Sri Lanka is a neighbor country of India. Sri Lankan culture is match with Indian culture.
Because of major population of Sri Lanka are Indian people. The environment of Sri Lanka is
match with Indian environment. The official name of Sri Lanka is a Democratic Socialist
Republic of Sri Lanka.
GEOGRAPHY OF SRI LANKA
[4]
Area 65,610 sq. km. (25,332 sq. me.).
Population 21.30 million of the Sri Lanka.
Annual population growth rate 0.9% of the Sri Lanka.
Cities: Capital- Colombo population 1.30 million, Sri Jaywardenepur Kotte is the officially
designed capital and is the site of the parliament. Other major cities are Kandy with 1,50,000
population, Galle with 1,10,000, and Jaffna with 1,00,000. Terrain is a coastal plains in the
northern side of the Sri Lanka. Hills and Mountains in southern & central Sri Lanka. It is high at
2,133 meters (7,000 ft.)
Climate of Sri Lanka:
Tropical, Rainy seasons light in northeast, fall and winter, with average rain fall of 50 inch.
Heavy rains fall in south-west Sri Lanka i.e. average 200 inch.
Religion wise division of people in Sri Lanka:
Sinhalese 74% of the total population.
Tamils 18% of the total population.
Muslims 7% of the total population.
Other 1% of the total population.
Languages speak in Sri Lanka:
Sinhala and Tamil (official), English.
Educational details of the Sri Lanka:
There is compulsory education up to 14 years children’s. The primary school attendance is
96.50%. In Sri Lanka, Their literacy ratio is very high i.e. 91% literacy rate in Sri Lanka.
Health of the Sri Lankan people:
[5]
The infant mortality rate of the Sri Lankan people is 18.57 per 1000. The life expectancy of men
in Sri Lanka is 73 years. The life expectancy of women is 77 years.
ECONOMY OF SRI LANKA
Sri Lanka has mostly had strong growth rates in previous years. Sri lanka economy has worth $
59 billion, and per capita GDP of about $7000 (PPP). In GDP per capita terms, it is ahead of
other countries in the South Asian region.
Tea export, Apparel, textile, Rice production and other Agricultural products, Tourism are the
country’s main economic factor.
After 2004 the government has concentrated on mass production of goods for domestic
consumption such as rice, grain and other Agricultural products.
Economic growth suffered in the following years as the economy faced many global and
domestic economic and political challenges. Overall, average annual GDP growth was 5.2% over
1991-2000.
In 2001, however, GDP growth was negative 1.4%--the first negative growth since
independence. The economy was badly affected by a series of global and domestic economic
problems and affected by terrorist attacks in Sri Lanka and the United States.
The crisis bare the fundamental policy failures and structural imbalances in the economy and the
need for reforms. Parliamentary elections were held in December, a pro-capitalist party was
elected to Parliament, while the socialism oriented Sri Lanka Freedom Party retained the
Presidency.
[6]
The government of Ranil Wickremasinghe of the United National Party has indicated a strong
commitment to economic and social sector reforms, deregulation, and private sector
development.
In 2002, the economy experienced a slow recovery. Early signs of a peace dividend were visible
throughout the economy—Sri Lanka has been able to reduce defense expenditures and had
started to focus on getting its large, public sector debt under control.
Also, the economy has benefited from lower interest rates, a recovery in domestic demand,
increased tourist arrivals, a revival of the stock exchange, and increased FDI.
In 2002, economic growth reached 4%, helped largely by strong service sector growth. The
agricultural sector of the economy staged a partial recovery. Total FDI inflows during 2002 were
about $246 million.
[7]
Chapter-II
Factors Affecting Selection of
the country
[8]
PESTLE ANALYSIS
PESTLE is an analytical tool which considers external factors and helps to think about their
impacts.
Is a useful tool for understanding the “big picture” of the environment in which we are operating
By understanding our environment, we can take advantage of the opportunities and minimize
the threats.
This provides the context within which more detailed planning can take place to take full
advantage of the opportunities that present themselves.
THE FACTOR IN PESTLE ANALYSIS
P – Political
(The current and potential influences from political pressures)
Government type and stability
Freedom of the press, rule of law and levels of bureaucracy and corruption
Regulation and de-regulation trends
Social and employment legislation
Tax policy, and trade and tariff controls
Environmental and consumer-protection legislation
Likely changes in the political environment
E – Economic
(The local, national and world economic impact)
[9]
Stage of a business cycle
Current and projected economic growth, inflation and interest rates
Unemployment and supply of labor
Labor costs
Levels of disposable income and income distribution
Impact of globalization
S - Sociological
(The ways in which changes in society affect the project)
Cultural aspects, health consciousness, population growth rate, age distribution,
Organizational culture, attitudes to work, management style, staff attitudes
Education, occupations, earning capacity, living standards
Ethical issues, diversity, immigration/emigration, ethnic/religious factors
Media views, law changes affecting social factors, trends, advertisements, publicity
Demographics: age, gender, race, family size
T - Technological
(How new and emerging technology affects our project / organization)
Maturity of technology, competing technological developments, research funding, technology
legislation, new discoveries
Information technology, internet, global and local communications
Technology access, licensing, patents, potential innovation, replacement technology/solutions,
inventions, research, intellectual property issues, advances in manufacturing
[10]
Transportation, energy uses/sources/fuels, associated/dependent technologies, rates of
obsolescence, waste removal/recycling
L - Legal
(How local, national and global legislation affects the project)
Current home market legislation, future legislation
European/international legislation
Regulatory bodies and processes
Environmental regulations, employment law, consumer protection
Industry-specific regulations, competitive regulations
E - Environmental
(Local, national and global environmental issues)
Ecological, environmental issues, environmental regulations
Customer values, market values, stakeholder/ investor values
Management style, staff attitudes, organizational culture, staff engagement
[11]
SWOT ANALYSIS of Sri Lanka
Strengths:
• Low operational costs
• Presence of established distribution networks in both urban and rural areas
• Presence of well-known brands in sector
Weaknesses:
• Lower scope of investing in technology and achieving economies of scale, especially in
small sectors
• Low exports levels
•"Me-too products, which illegally mimic the labels of the established brands. These products
narrow the scope of products in rural and semi-urban market.
Opportunities:
• Untapped rural market
• Rising income levels, i.e. increase in purchasing power of consumers
• Large domestic market- a population of over one billion.
• Export potential
• High consumer goods spending
Threats:
• Removal of import restrictions resulting in replacing of domestic brands
• Slowdown in rural demand
[12]
• Tax and regulatory structure
DEMOGRAPHIC PROFILE OF SRILANKA
Geography
Sri Lanka is an island in the Indian Ocean off the southeast tip of India. Most of the land is flat
and rolling; mountains in the south-central region rise to over 8,000 ft.
Government
Republic.
[13]
History
Indo-Aryan emigration from India in the 5th century B.C. came to form the largest ethnic group
on Sri Lanka today, the Sinhalese. Tamils, the second-largest ethnic group on the island, were
originally from Tamil region and emigrated between the 3rd century B.C. and A.D. 1200. Until
colonial powers controlled Ceylon, Sinhalese and Tamil rulers fought for dominance over the
island. The Tamils, mostly Hindus, claimed the northern section of the island and the Sinhalese,
who are predominantly Buddhist, controlled the south. In 1505 the Portuguese took possession of
Ceylon until the Dutch India Company took control (1658–1796). The British took over in 1796,
and Ceylon became an English colony in 1802. The British developed coffee, tea, and rubber
plantations. On Feb. 4, 1948, after pressure from Ceylonese nationalist leaders, Ceylon became a
self-governing dominion of the Commonwealth of Nations.
S.W.R.D. Bandaranaike became prime minister in 1956 and championed Sinhalese nationalism,
making Sinhala the country's only official language and including state support of Buddhism,
further marginalizing the Tamil minority. He was assassinated in 1959 by a Buddhist monk. His
widow, Sirimavo Bandaranaike, became the world's first female prime minister in 1960. The
name Ceylon was changed to Sri Lanka on May 22, 1972.
The Tamil minority's resentment toward the Sinhalese majority's monopoly on political and
economic power, made worse by cultural and religious differences, erupted in bloody violence in
1983. Tamil rebel groups, the strongest of which were the Liberation Tigers of Tamil Eelam,
began a civil war to fight for separate nation.
President Premadasa was assassinated at a May Day political rally in 1993, when a Tamil rebel
detonated explosives strapped to him. Tamil tigers have frequently resorted to terrorist attacks
against civilians. The next president, Chandrika Kumaratunga was herself wounded in a terrorist
attack in Dec 1999. By early 2000, 18 years of war had claimed the lives of more than 64,000,
mostly civilians.
[14]
After Dec. 2001 elections, Ranil Wickremesinghe, a longtime bitter rival of President
Kumaratunga, was sworn in as prime minister. Wickremesinghe's victory precipitated a formal
cease-fire with the Tamil rebels, signed in Feb. 2002. In September talks, the government lifted
its ban on the group, and the Tigers dropped their demand for an independent Tamil state.
Another significant breakthrough came in December when the Tigers and the government struck
a power-sharing deal that would give the rebels regional autonomy. But negotiations in 2003
achieved little.
Intense political rivalry threatened the peace process. In Nov. 2003, President Kumaratunga,
convinced that Prime Minister Wickremesinghe was too soft in his negotiations with the Tigers,
wrested away some of his powers. In Feb. 2004, the president dissolved parliament and called for
elections in the hope of further eroding the power of the prime minister. The gamble paid off for
Kumaratunga—her United People's Freedom Alliance won April's parliamentary elections, and
Wickremesinghe was replaced by a new prime minister, MahindaRajapaksa, a high-ranking
member of Kumaratunga's party.
On Dec. 26, 2004, a tremendously powerful tsunami ravaged 12 Asian countries. About 38,000
people were reported killed in Sri Lanka. President Kumaratunga and the Tamil Tigers reached a
deal in June 2005 to share about $4.5 billion in international aid to rebuild the country. But
intensifying violence in the eastern part of the country threatened the cease-fire and jeopardized
the aid package. In Aug. 2005, Foreign Minister Lakshman Kadirgamar was assassinated and the
government declared a state of emergency.
Prime Minister Mahinda Rajapaksa won November's presidential elections, taking 50% of the
vote to former prime ministerRanilWickremesinghe's 48%. Rajapaksa is expected to take a hard
line with the Tamil Tigers. Rajapaksa appointed RatnasiriWickremanayaka as prime minister.
In 2006, repeated violations of the 2002 cease-fire on both sides turned into outright war. Since
April 2006, about 1,000 soldiers and civilians have been killed, and 135,000, mostly Tamils,
[15]
have been displaced. Efforts by Norway, which brokered the 2002 cease-fire, to bring both sides
to the negotiating table were unsuccessful throughout the summer.
Fighting between the rebels and government troops continued into 2007. After a weeks of deadly
battles, the military took control of rebel-held regions of eastern Sri Lanka in March, leaving tens
of thousands more civilians displaced. In April, the Tamil Tigers launched their first air raid,
using small airplanes to bomb an air force base near Colombo. An attack by the Sri Lankan air
force in November killed the leader of the Tigers' political wing, S. P. Tamilselvan. Amid
continued fighting, the government abrogated the cease-fire in January 2008.
Sri Lanka was rocked by a series of suicide bombs on the eve of and during the country's
celebration of its 60th anniversary of independence in February. Nearly 40 people died in the
attacks. April was a particularly bloody month in Sri Lanka. Indeed, highways minister
JeyarajFernandopulle was killed in a bombing attributed to Tamil Tiger rebels. Later in the
month, more than 40 soldiers and 100 Tamil Tiger rebels died in a battle in the Jaffna peninsula.
TAMIL TIGERS DEFEATED BY GOVERNMENT TROOPS
The Sri Lankan government tasted success in the fall of 2008, when the military launched an
airstrike on Tamil headquarters in early October in Kilinochi. Plus, ground troops were closing in
on the rebels. In January 2009, the Sri Lankan government captured the northern town of
Kilinochchi, which for ten years had been the administrative headquarters of the Tamil Tigers.
Under the leadership of defense chief Gotabhaya Rajapaksa, the brother of the president, the
army continued to practise the Tigers relentlessly in early 2009. By April, the Tigers were
cornered on a small spread out of coastline in the north-east of the country. Civilian Tamils left
the area and moved into refugee camps that struggled to provide food and medical attention,
while the Tiger fighting force was reduced to 1,000 members.
In May 2009, a UN spokesperson called the situation a "bloodbath." International human rights
organizations claimed that the Sri Lankan army killed at least 500 Tamil civilians in the early
[16]
days of May 2009 alone. That brought the Tamil civilian death toll to at least 8,000 since the
beginning of the year, according to the UN. The Sri Lankan army lost at least 3,800 soldiers by
the period 18-months.
Conflict ended when Velupillai Prabhakaran, the leader of the Tamil Tigers, was killed in
fighting in which government troops took the last bit of reassurance territory. Early elections
were held in January 2010. President Rajapaksa won the election by a huge margin, defeating
former army Chief Gen. SarathFonseka. Fonseka presided over final battle that dense the Tamil
Tigers. He was arrested in March on charges of plotting to conquer the government. Rajapaksa
dissolved Parliament in March.
In April 2010's parliamentary elections, Rajapaksa coalition won another victory. In September,
Parliament endorsed a proposal to rewrite Sri Lanka's constitution to allow Rajapaksa to run for a
third term.
Nearly a year after his successful reelection bid in Jan. 2010, President Rajapaksa, was
inaugurated in a coronation-like ceremony. Slightly damaging his new administration was a UN-
sponsored report concerning the final days of Sri Lanka's civil war. A panel advising the UN
secretary-general found “credible evidence” those war crimes was committed by both sides in
2009, and that the Sri Lankan army killed tens of thousands of civilians.
Tea production in Sri Lanka
Tea production in Sri Lanka is of high importance to the Sri Lankan economy and the world
market. Srilanka is the world's third largest producer of tea and the industry is one of the
country's main sources of foreign exchange and generating significant employment. Tea accounts
for 15% of the GDP, and it generates roughly $700 million annually. In 1995, Sri Lanka was the
world's leading exporter of tea, with 23% of the total world export. The tea sector employs,
directly or indirectly over 1 million people in Sri Lanka and in 1995 directly employed 215,338
on tea plantations and estates. The climate of the country favours the production of high quality
[17]
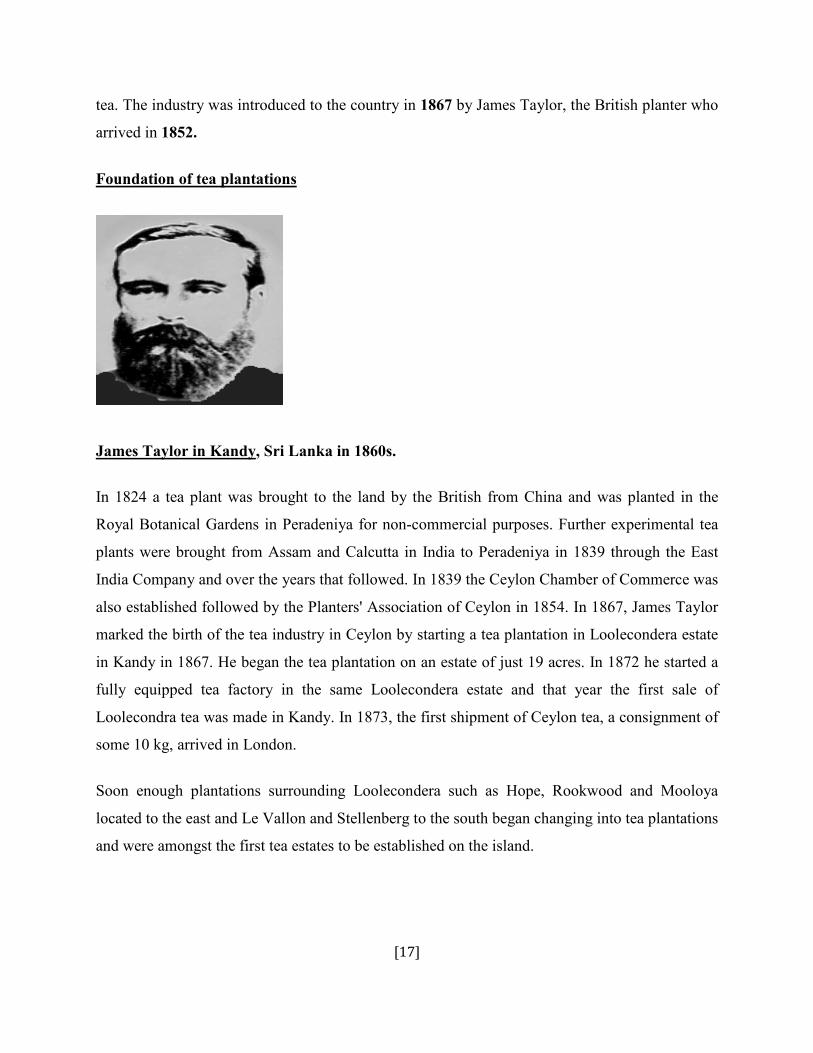
tea. The industry was introduced to the country in 1867 by James Taylor, the British planter who
arrived in 1852.
Foundation of tea plantations
James Taylor in Kandy, Sri Lanka in 1860s.
In 1824 a tea plant was brought to the land by the British from China and was planted in the
Royal Botanical Gardens in Peradeniya for non-commercial purposes. Further experimental tea
plants were brought from Assam and Calcutta in India to Peradeniya in 1839 through the East
India Company and over the years that followed. In 1839 the Ceylon Chamber of Commerce was
also established followed by the Planters' Association of Ceylon in 1854. In 1867, James Taylor
marked the birth of the tea industry in Ceylon by starting a tea plantation in Loolecondera estate
in Kandy in 1867. He began the tea plantation on an estate of just 19 acres. In 1872 he started a
fully equipped tea factory in the same Loolecondera estate and that year the first sale of
Loolecondra tea was made in Kandy. In 1873, the first shipment of Ceylon tea, a consignment of
some 10 kg, arrived in London.
Soon enough plantations surrounding Loolecondera such as Hope, Rookwood and Mooloya
located to the east and Le Vallon and Stellenberg to the south began changing into tea plantations
and were amongst the first tea estates to be established on the island.
[18]
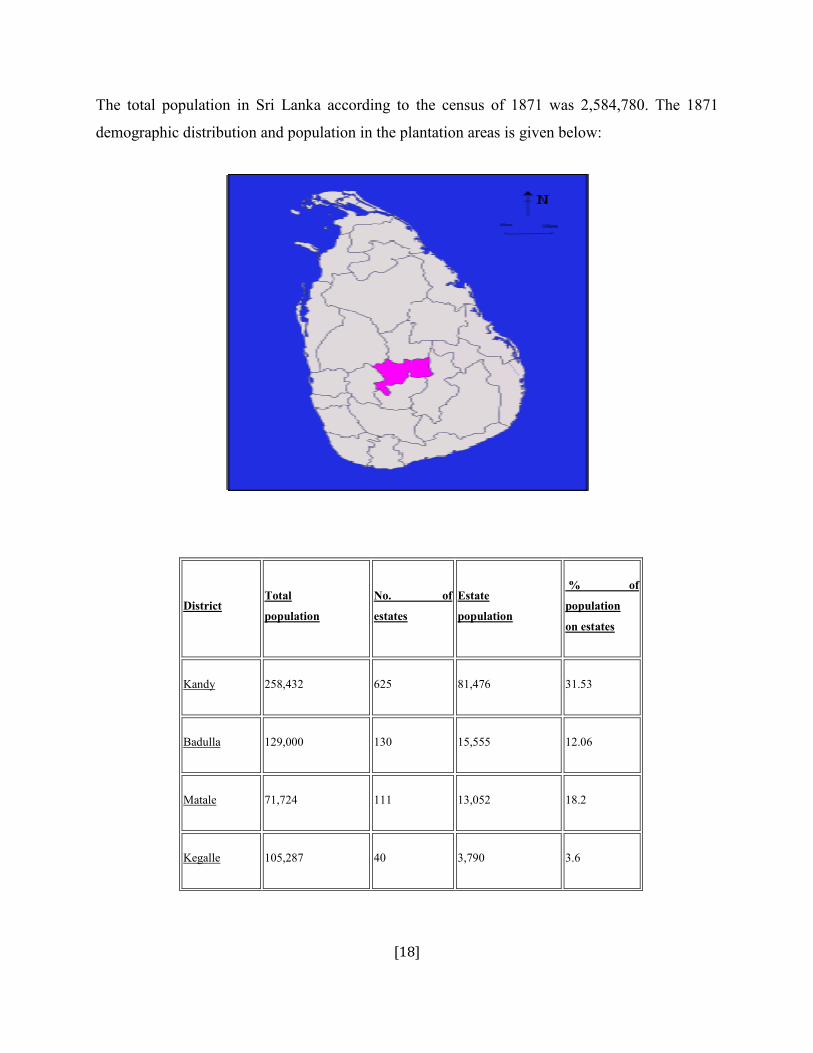
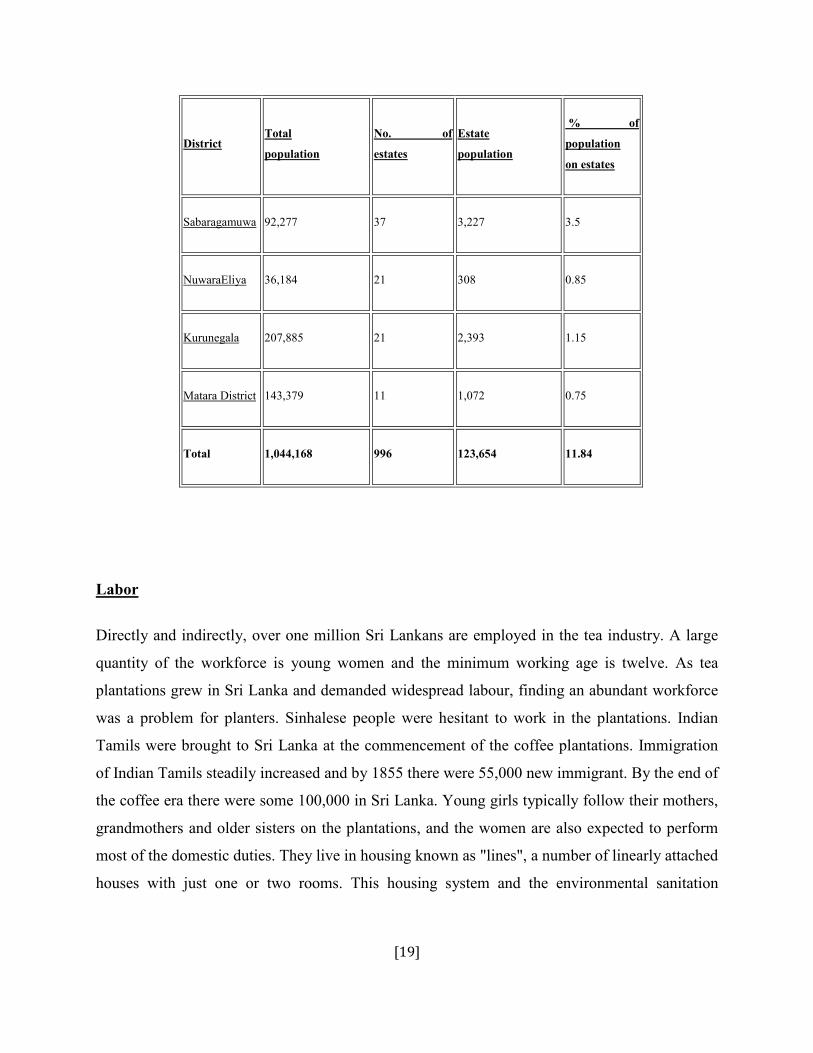
The total population in Sri Lanka according to the census of 1871 was 2,584,780. The 1871
demographic distribution and population in the plantation areas is given below:
District Total
population
No. of
estates
Estate
population
% of
population
on estates
Kandy 258,432 625 81,476 31.53
Badulla 129,000 130 15,555 12.06
Matale 71,724 111 13,052 18.2
Kegalle 105,287 40 3,790 3.6
[19]
District Total
population
No. of
estates
Estate
population
% of
population
on estates
Sabaragamuwa 92,277 37 3,227 3.5
NuwaraEliya 36,184 21 308 0.85
Kurunegala 207,885 21 2,393 1.15
Matara District 143,379 11 1,072 0.75
Total 1,044,168 996 123,654 11.84
Labor
Directly and indirectly, over one million Sri Lankans are employed in the tea industry. A large
quantity of the workforce is young women and the minimum working age is twelve. As tea
plantations grew in Sri Lanka and demanded widespread labour, finding an abundant workforce
was a problem for planters. Sinhalese people were hesitant to work in the plantations. Indian
Tamils were brought to Sri Lanka at the commencement of the coffee plantations. Immigration
of Indian Tamils steadily increased and by 1855 there were 55,000 new immigrant. By the end of
the coffee era there were some 100,000 in Sri Lanka. Young girls typically follow their mothers,
grandmothers and older sisters on the plantations, and the women are also expected to perform
most of the domestic duties. They live in housing known as "lines", a number of linearly attached
houses with just one or two rooms. This housing system and the environmental sanitation
[20]
conditions are generally poor for laborers in the plantation sector. There are typically 6 to 12 or
24 line rooms in one line barrack. Often rooms for laborers are without windows and there is
little or no ventilation and as many as 6 to 11 members may often live in one room together. In
the housing system for plantation workers in Sri Lanka, women and girls have no privacy from
the male workers, which places them at a higher risk for sexual harassment. In June 2007, a
study conducted in the NuwaraEliya tea growing area revealed that the serious lack of privacy
has led several women to commit suicide, especially newly wedded women. According to
studies by Christian Aid, the female Indian Tamil plantation workers are particularly at risk from
discrimination and victimization. Some concern towards women's rights have been made in
regards to the female plantation workers in Sri Lanka, resulting in some 85 neighborhood
women's groups being formed across the country, educating them in gender, leadership and
preventing violence against women.
The tea plantation is prearranged in a social chain of command and the women,they consist of
75%-85% of the work force in the tea industry, are at the lowest social strata and are powerless.
This is not unusual as the sub regulation of women under men is present domestically and in the
social community in many parts of Sri Lanka. Wages are typically chiefly low. In NuwaraEliya,
women were once paid as little as 7 rupees per kilogram, the equivalent of 4 pence, or 7 cents,
and many must complete 16 kilograms a day. Given the social stratification in Sri Lanka's past,
the pay had to be collected by a husband or father. The men who work on the tea plantations
typically cut down trees or operate machinery and are better paid at 155 rupees (82p) a day and
finish the day hours earlier. Due to the severely low wages, industrial action took place in 2006.
Wages in the tea sector were enlarged with the average daily wage earned in the sector now
significantly higher at 378 rupees for men and 261 for women in some places.Studies show that
poverty is still a major problem and despite the tea industry employing a large number of poor
people, employment has failed to improve poverty since workers are often highly uneducated
and unskilled. Poverty levels on plantations have consistently been higher than the national
average and although overall poverty in Sri Lanka has declined in the last thirty years, it is now
significantly concentrated in rural areas. Poverty in the estate sector has been reported to be
increasing with roughly one in three suffering from poverty, rising from 30 percent in 2002 to 32
[21]
percent in 2006/07. NuwaraEliya showed a significant increase in poverty among workers from
2002 to 2007 from 22.6 percent in 2002 to 33.8 percent in 2006/07. But by no means is
employment secure in the tea sector in Sri Lanka. Like other industries, job security in the tea
industry has been threatened by the current financial crisis. Sri Lanka over 50,000 private sector
employees are expected to lose their jobs in 2009 due to the current slump.
BRIEF INTRODUCTION ABOUT SRI LANKA
Population growth rate
0.934% (2011 est.)
Birth rate
17.42 births/1,000 population (2011 est.)
Death rate
5.92 deaths/1,000 population (July 2011 est.)
Net migration rate
-2.16 migrant(s)/1,000 population (2011 est.)
Urbanization
Ø Urban population: 14% of total population (2010)
Ø Rate of urbanization: 1.1% annual rate of change (2010-15 est.)
Sex ratio
Ø At birth: 1.04 male(s)/female
Ø Under 15 years: 1.04 male(s)/female
Ø 15-64 years: 0.96 male(s)/female
[22]
Ø 65 years and over: 0.86 male(s)/female
Ø Total population: 0.97 male(s)/female (2011 est.)
Infant mortality rate
Ø Total: 9.7 deaths/1,000 live births
Ø Male: 10.68 deaths/1,000 live births
Ø Female: 8.68 deaths/1,000 live births (2011 est.)
Life expectancy at birth
Ø Total population: 75.73 years
Ø Male: 72.21 years
Ø Female: 79.38 years (2011 est.)
Total fertility rate
2.2 children born/woman (2011 est.)
Major infectious diseases
Ø Degree of risk: high
Ø food or waterborne diseases: Bacterial diarrhea and hepatitis A
Ø vector borne disease: Dengue fever and Chikungunya
Ø water contact disease: Leptospirosis
Ø animal contact disease: rabies (2009)
Nationality
Noun: Sri Lankan(s)
Adjective: Sri Lankan
Ethnic groups
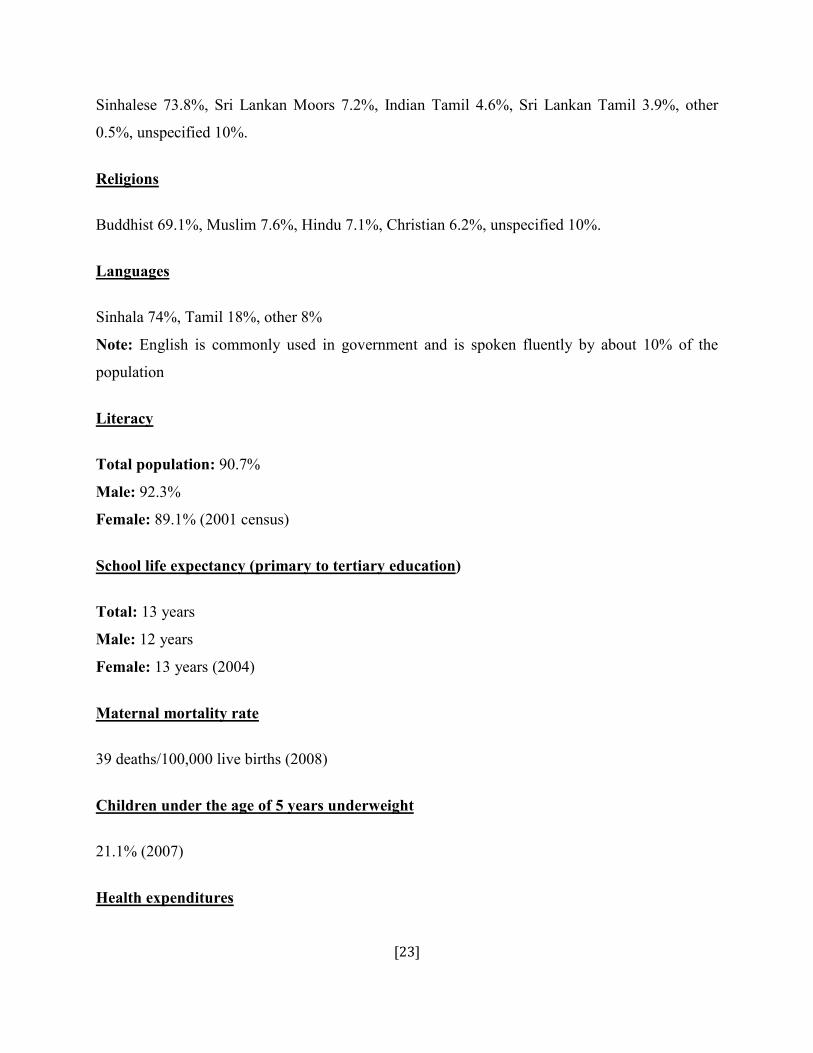
[23]
Sinhalese 73.8%, Sri Lankan Moors 7.2%, Indian Tamil 4.6%, Sri Lankan Tamil 3.9%, other
0.5%, unspecified 10%.
Religions
Buddhist 69.1%, Muslim 7.6%, Hindu 7.1%, Christian 6.2%, unspecified 10%.
Languages
Sinhala 74%, Tamil 18%, other 8%
Note: English is commonly used in government and is spoken fluently by about 10% of the
population
Literacy
Total population: 90.7%
Male: 92.3%
Female: 89.1% (2001 census)
School life expectancy (primary to tertiary education)
Total: 13 years
Male: 12 years
Female: 13 years (2004)
Maternal mortality rate
39 deaths/100,000 live births (2008)
Children under the age of 5 years underweight
21.1% (2007)
Health expenditures
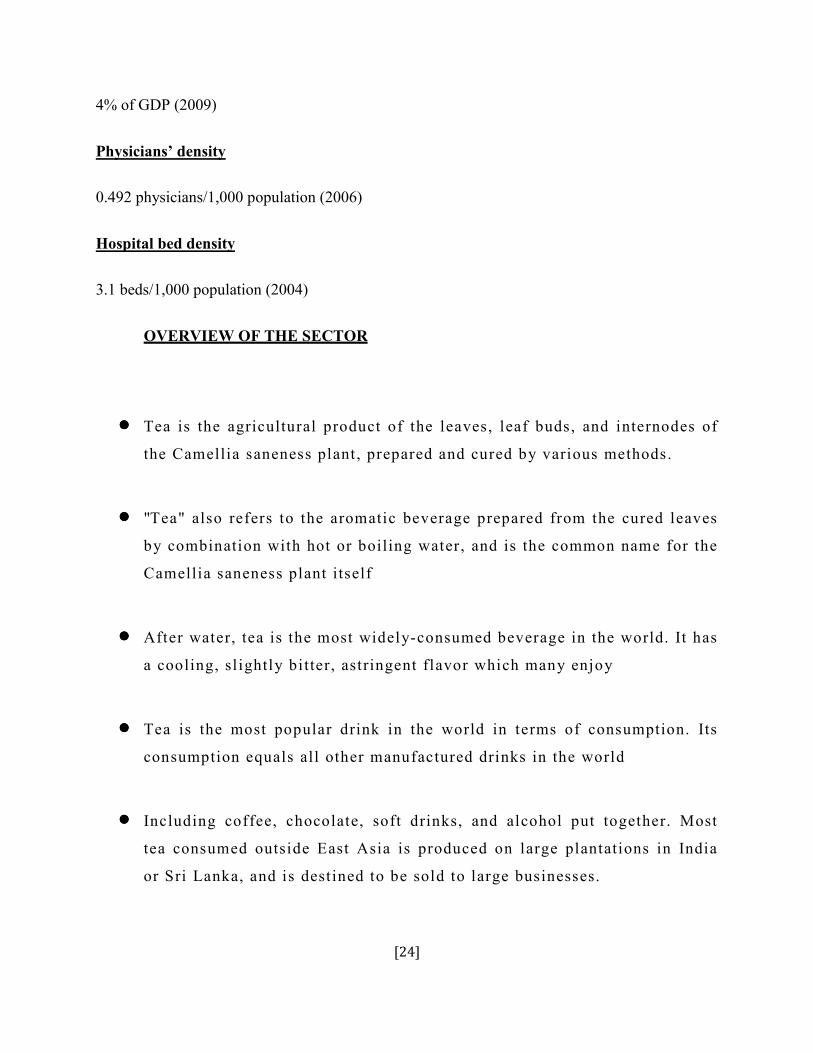
[24]
4% of GDP (2009)
Physicians’ density
0.492 physicians/1,000 population (2006)
Hospital bed density
3.1 beds/1,000 population (2004)
OVERVIEW OF THE SECTOR
•••• Tea is the agricultural product of the leaves, leaf buds, and internodes of the Camellia saneness plant , prepared and cured by various methods.
•••• "Tea" also refers to the aromatic beverage prepared from the cured leaves
by combination with hot or boiling water, and is the common name for the
Camellia saneness plant itself
•••• After water, tea is the most widely-consumed beverage in the world. It has
a cooling, sl ightly bitter, astringent flavor which many enjoy
•••• Tea is the most popular drink in the world in terms of consumption. Its
consumption equals all other manufactured drinks in the world
•••• Including coffee, chocolate, soft drinks, and alcohol put together. Most
tea consumed outside East Asia is produced on large plantations in India
or Sri Lanka, and is destined to be sold to large businesses.
[25]
•••• Opposite this large-scale industrial production there are many small
"gardens", sometimes minuscule plantations that produce highly sought-
after teas prized by gourmets
•••• The last two decades have witnessed a virtual explosion in the number of
free trade agreements , some of them involving several countries
•••• Many of them bilateral. The proliferation of free trade agreements has led
to fierce debate about the merits of these agreements.
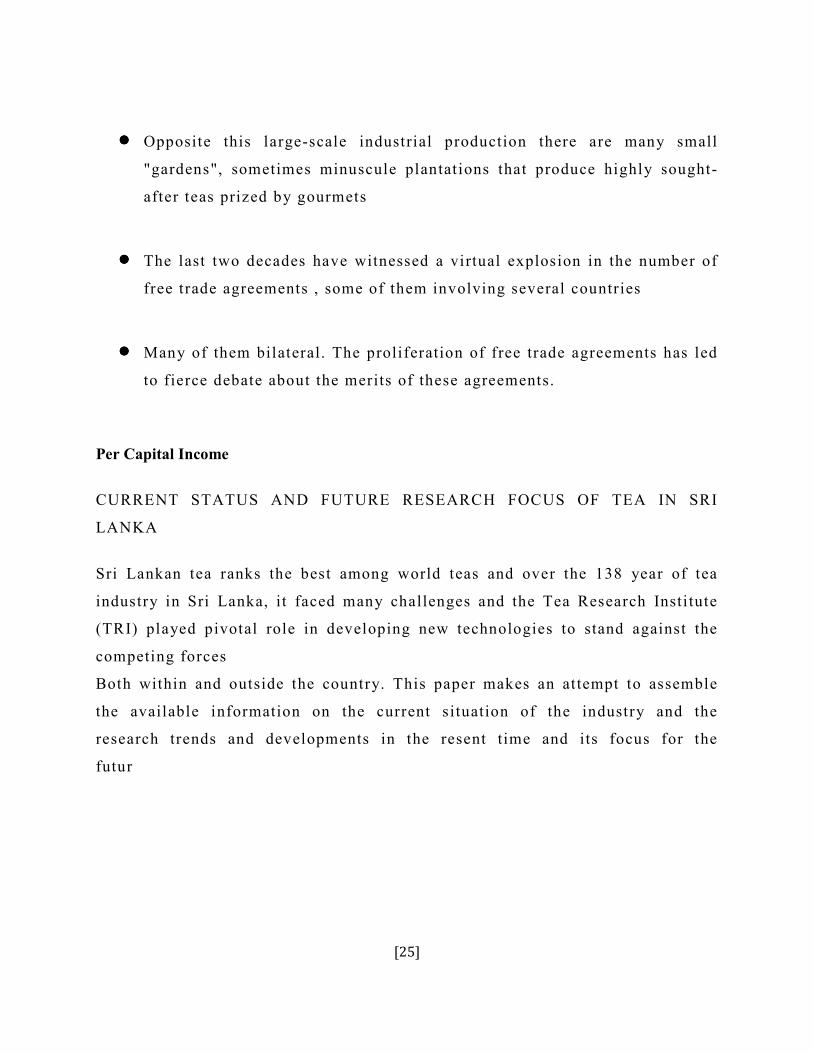
Per Capital Income
CURRENT STATUS AND FUTURE RESEARCH FOCUS OF TEA IN SRI
LANKA
Sri Lankan tea ranks the best among world teas and over the 138 year of tea
industry in Sri Lanka, it faced many challenges and the Tea Research Insti tute
(TRI) played pivotal role in developing new technologies to stand against the
competing forces
Both within and outside the country. This paper makes an attempt to assemble
the available information on the current situation of the industry and the
research trends and developments in the resent time and its focus for the
futur
[26]
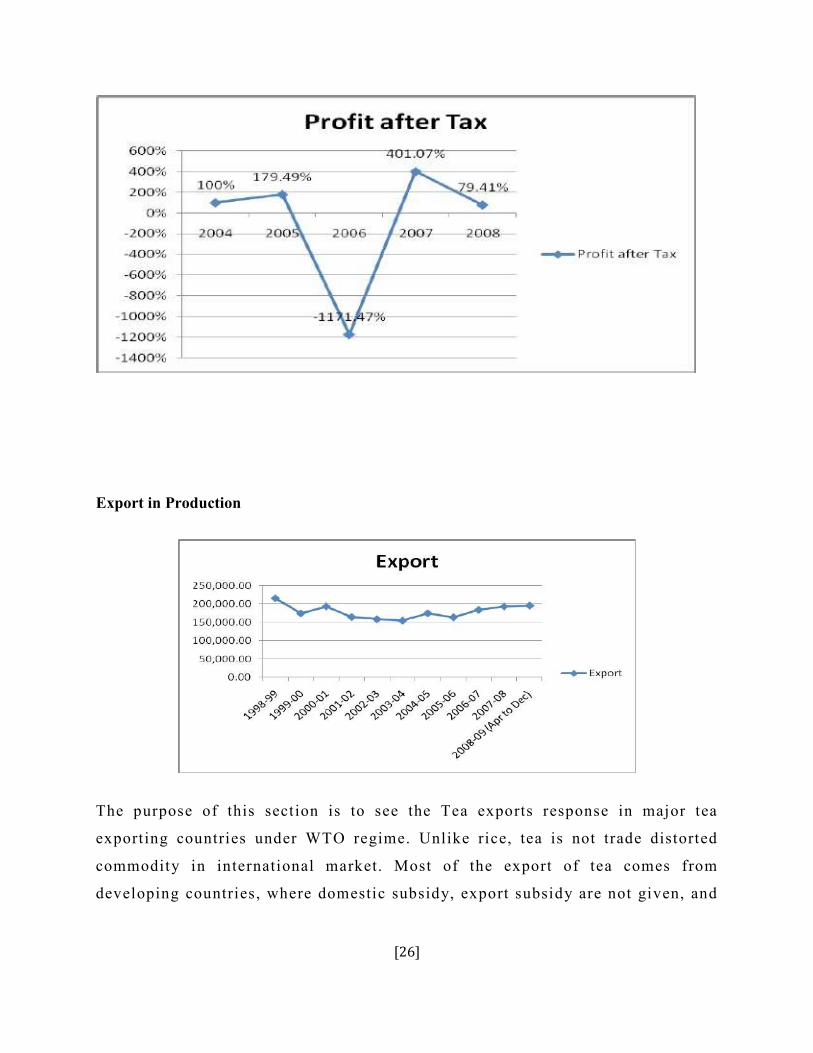
Export in Production
The purpose of this section is to see the Tea exports response in major tea
exporting countries under WTO regime. Unlike rice, tea is not trade distorted
commodity in international market. Most of the export of tea comes from
developing countries, where domestic subsidy, export subsidy are not given, and
[27]
it is believed that in these countries tea export is taxed for the purpose of
revenue tote government
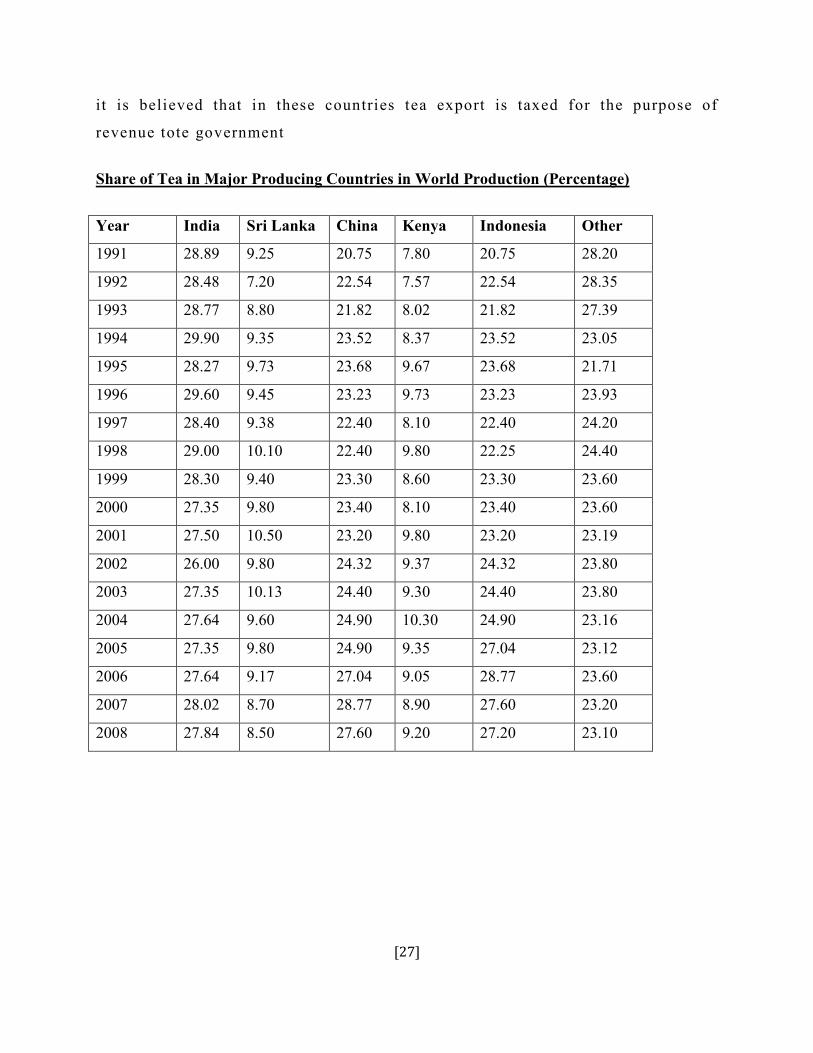
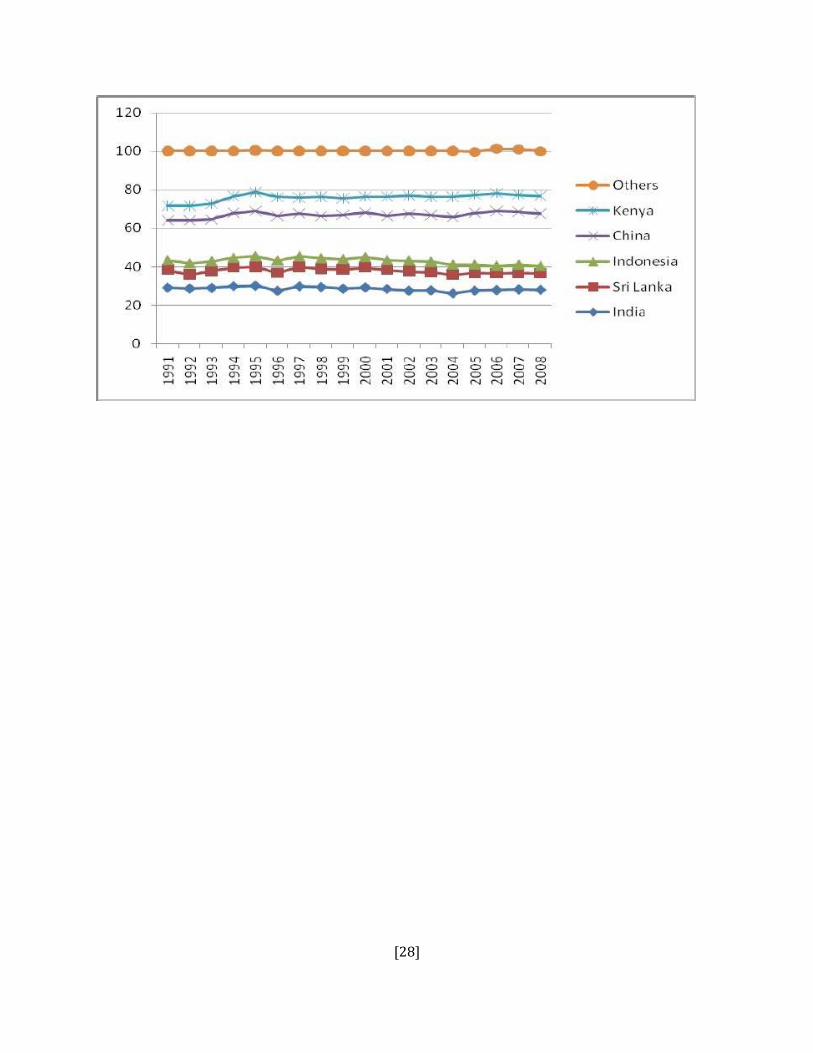
Share of Tea in Major Producing Countries in World Production (Percentage)
Year India Sri Lanka China Kenya Indonesia Other
1991 28.89 9.25 20.75 7.80 20.75 28.20
1992 28.48 7.20 22.54 7.57 22.54 28.35
1993 28.77 8.80 21.82 8.02 21.82 27.39
1994 29.90 9.35 23.52 8.37 23.52 23.05
1995 28.27 9.73 23.68 9.67 23.68 21.71
1996 29.60 9.45 23.23 9.73 23.23 23.93
1997 28.40 9.38 22.40 8.10 22.40 24.20
1998 29.00 10.10 22.40 9.80 22.25 24.40
1999 28.30 9.40 23.30 8.60 23.30 23.60
2000 27.35 9.80 23.40 8.10 23.40 23.60
2001 27.50 10.50 23.20 9.80 23.20 23.19
2002 26.00 9.80 24.32 9.37 24.32 23.80
2003 27.35 10.13 24.40 9.30 24.40 23.80
2004 27.64 9.60 24.90 10.30 24.90 23.16
2005 27.35 9.80 24.90 9.35 27.04 23.12
2006 27.64 9.17 27.04 9.05 28.77 23.60
2007 28.02 8.70 28.77 8.90 27.60 23.20
2008 27.84 8.50 27.60 9.20 27.20 23.10
[28]
[29]
Chapter-III
Operations Management of
Tea Sector
[30]
Market Basics
The Economics of Tea
The price of tea has been in long-term turn down while production costs have risen, putting
downward pressure on farmers’ incomes and laborers’ working conditions.
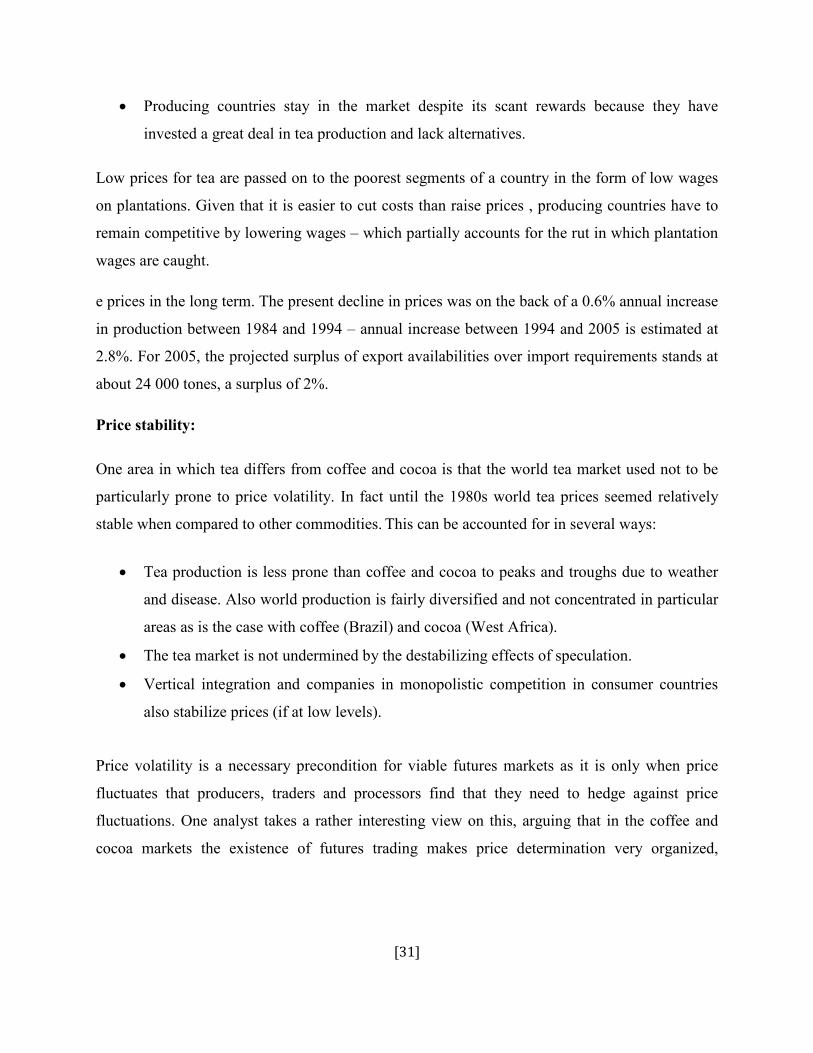
Since 1980, the real price of tea has fallen by 1 5%. As the chart below shows, another problem
has been price instability. In the last two decades, the annual average price has fluctuated
between a high of 333 kgs to a low of 142 kgs in 1980 terms, and the instability index has
averaged 13, which means that the price deviated from the exponential trend by 13% in any
given year.
Price decline:
The decline in prices has been primarily due to the strong growth in supply in the face of
sluggish demand. Unlike with cocoa and coffee, the ratio of stocks to demand play only a minor
role in determining the price level because the quantity of tea stocks held is relatively low.
Instead stocks function more as a transitory ‘pipeline’ stage in the supply chain.Competition
between producer countries for a share of the world market is concentrated for a number of
reasons, all of which contribute to low prices:
• A large number of countries produce tea and many of them are big enough to prevent the
Establishment of a clear monopolistic leader, which allows for fierce competition.
• Demand is rising slowly and so the only way to increase significantly the amount of tea
exported is at the expense of competitors.
• As tea deteriorate fairly quickly it is frequently necessary to cut prices in order to clear
stocks.
• Tea supply is greater than demand from manufacturers.
[31]
• Producing countries stay in the market despite its scant rewards because they have
invested a great deal in tea production and lack alternatives.
Low prices for tea are passed on to the poorest segments of a country in the form of low wages
on plantations. Given that it is easier to cut costs than raise prices , producing countries have to
remain competitive by lowering wages – which partially accounts for the rut in which plantation
wages are caught.
e prices in the long term. The present decline in prices was on the back of a 0.6% annual increase
in production between 1984 and 1994 – annual increase between 1994 and 2005 is estimated at
2.8%. For 2005, the projected surplus of export availabilities over import requirements stands at
about 24 000 tones, a surplus of 2%.
Price stability:
One area in which tea differs from coffee and cocoa is that the world tea market used not to be
particularly prone to price volatility. In fact until the 1980s world tea prices seemed relatively
stable when compared to other commodities. This can be accounted for in several ways:
• Tea production is less prone than coffee and cocoa to peaks and troughs due to weather
and disease. Also world production is fairly diversified and not concentrated in particular
areas as is the case with coffee (Brazil) and cocoa (West Africa).
• The tea market is not undermined by the destabilizing effects of speculation.
• Vertical integration and companies in monopolistic competition in consumer countries
also stabilize prices (if at low levels).
Price volatility is a necessary precondition for viable futures markets as it is only when price
fluctuates that producers, traders and processors find that they need to hedge against price
fluctuations. One analyst takes a rather interesting view on this, arguing that in the coffee and
cocoa markets the existence of futures trading makes price determination very organized,
[32]
centralized and transparent. By contrast the tea markets are not held around one international
price but according to different auction prices in producing countries. The entire market is th
The relative stability of the tea market was true until fairly recently – there was a noticeable
increase in the volatility of the markets in the 1990s. This volatility first began in the mid-1970s
when prices became twice as unstable as they had been the decade before. There began to be a.
Production:
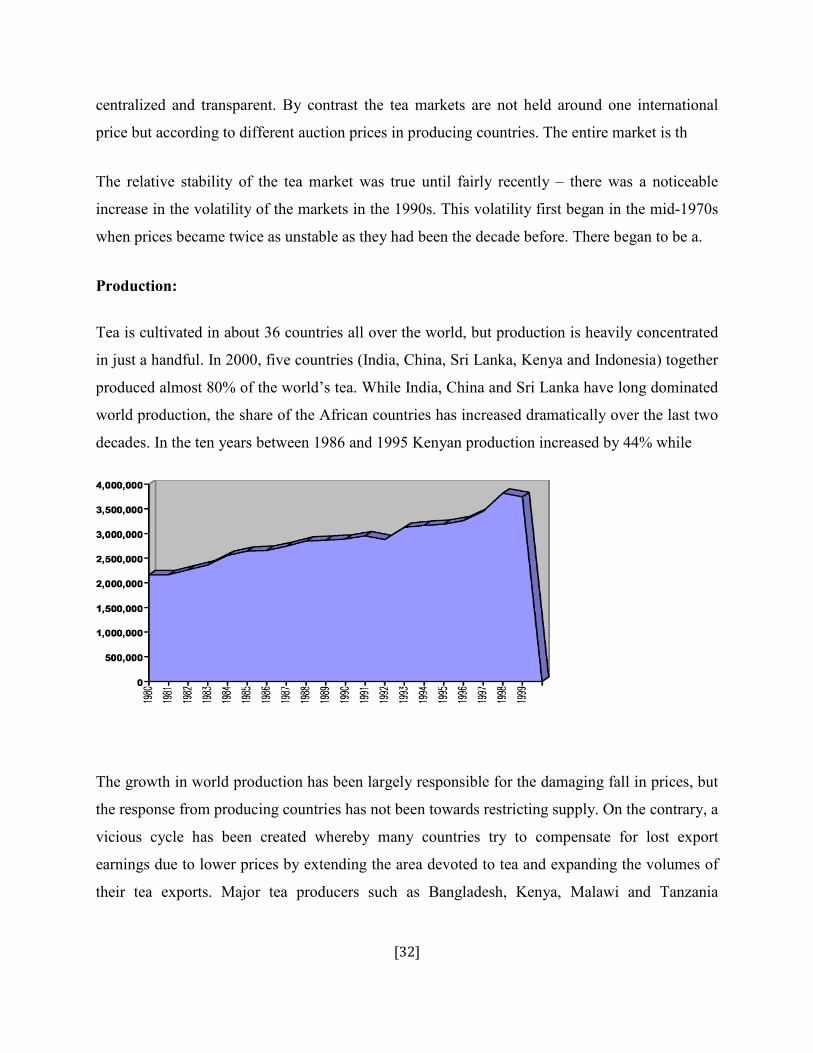
Tea is cultivated in about 36 countries all over the world, but production is heavily concentrated
in just a handful. In 2000, five countries (India, China, Sri Lanka, Kenya and Indonesia) together
produced almost 80% of the world’s tea. While India, China and Sri Lanka have long dominated
world production, the share of the African countries has increased dramatically over the last two
decades. In the ten years between 1986 and 1995 Kenyan production increased by 44% while
The growth in world production has been largely responsible for the damaging fall in prices, but
the response from producing countries has not been towards restricting supply. On the contrary, a
vicious cycle has been created whereby many countries try to compensate for lost export
earnings due to lower prices by extending the area devoted to tea and expanding the volumes of
their tea exports. Major tea producers such as Bangladesh, Kenya, Malawi and Tanzania
[33]
expanded their tea production area by more than 130,000 hectares in the first half of the 1990s.
Prices have been forced down further by strong competition from the ‘new’ African producers
who emerged onto the tea market relatively late.
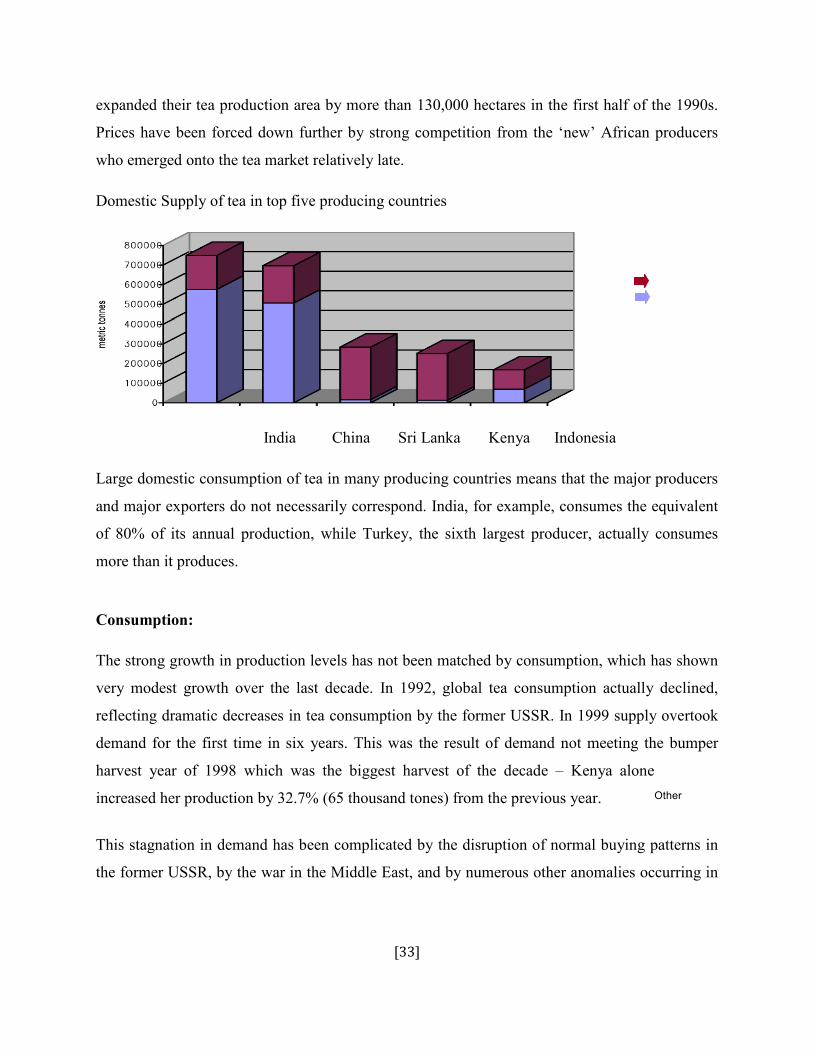
Domestic Supply of tea in top five producing countries
India China Sri Lanka Kenya Indonesia
Large domestic consumption of tea in many producing countries means that the major producers
and major exporters do not necessarily correspond. India, for example, consumes the equivalent
of 80% of its annual production, while Turkey, the sixth largest producer, actually co sumes
more than it produces.
Consumption:
The strong growth in production levels has not been matched by consumption, which has shown
very modest growth over the last decade. In 1992, global tea consumption actually declined,
reflecting dramatic decreases in tea consumption by the former USSR. In 1999 supply overtook
demand for the first time in six years. This was the result of demand not meeting the bumper
harvest year of 1998 which was the biggest harvest of the decade – Kenya alone
increased her production by 32.7% (65 thousand tones) from the previous year.
This stagnation in demand has been complicated by the disruption of normal buying patterns in
the former USSR, by the war in the Middle East, and by numerous other anomalies occurring in
Other
n
[34]
tea, has been flat. In an effort to make tea more convenient to prepare, the tea industry has gone
as far as to introduce a ‘tea tablet’, which was recently invented in Japan.
The paradox of the growth in tea in more convenient forms is that, while demand for tea products
may increase, less tea leaf is required to satisfy that demand. For example, CTC tea, which is
used in tea bags, yields twice the cup page per given weight of tea. A shift in tea-drinking
behavior towards the increasing use of tea bags and soluble instant tea effectively reduces the
quantity of tea needed per cup and also raises the demand for plain cheaper tea at the expense of
those of high quality.
A large proportion of the world’s tea (more than half) is consumed in producing countries
(unlike coffee and cocoa). India is both the world’s largest producer of tea and the world’s
thirstiest consumer. Although India produces almost 30% of the world’s tea it exports less than
20% of the world’s supply. Given that tea is the national drink for two thirds of the world’s
population and that much of the consumption is in the South where population is growing, there .
The promotion of ready-to-drink tea is also being explored as it can better compete with soft
drinks.
As the graph below on major importers of tea shows, the export trade must cater to very different
markets. Major buyers of tea in the Middle East want a very different product from what is in
demand in Europe. The United Arab Emirates buys low grows Sri Lankan tea which is not at all
in demand in the UK.
Germany and Japan buy First Flush Darjeeling at more than $30 per kg, while the UK would
only reluctantly pay $2.50 for a top quality Kenyan. Consumer tastes differ not only with regard
to quality and origin: continental Europe buys leafy orthodox teas, while the UK prefers CTC’s
(tea further processed by Crush, Tear and Curl) more suitable for tea bags. A tea producer,
therefore, will typically produce 5 main grades and 2 or 3 secondary grades, and must find a
market for each.
Profitability: Rising cost vs. rising productivity:
[35]
While market prices for tea have been falling, the costs of production have been on the rise,
putting downward pressure on profitability. The rise in costs has been partially outweighed by
increases in yields and productivity, but the extent of this varies across regions and according to
whether it is a smallholding or a plantation.
Governments frequently worsen the problem of high production costs in tea manufacture by
levying excise tax, which is disconnected to the sale price and thus punishes factories for the
production process itself13. Moreover, the final manufactured product is routinely under-utilized
because whatever is left at the final point in the manufacturing cycle gets dubbed ‘tea residue’,
which cannot legally be sold, impeding further use of the leaf by-product.
The world averages for tea yields in 1999 were 1077.1 kg/hectare, but average yields vary
enormously from country to country. At the top end, Kenya produced 2123.4 kg of tea per
hectare in 1999, while Nepal has one of the lowest productivities in the world at 200 kg per
hectare.
A major determinant of yield and cost of production in each country is lab our productivity.
Labor costs account for around half of the unit cost of production and approximately 75% of that
labor cost is on plucking. This explains the high cost of production in Sri Lanka, where even
high-yielding plantations have excess labor, except during heavy cropping months when they are
faced instead with a worker shortage. Another factor influencing yield is the quality of seedlings
and the land. Again, Sri Lanka tends to retain old low-yielding seedling tea and the land is
degraded. Availability of chemical inputs can also be a factor.
Kenyan smallholders have access to fertilizers on credit from the Kenya Tea Development
Agency, which may explain their relatively high yields.
Differences in yields, cost of production and prices have made the profitability of tea vary widely
across different countries. Among the various countries the highest profitability has been
obtained by Kenya , followed by India with the lowest being Sri Lanka.
[36]
With rising input costs and falling prices, there is pressure to limit labor costs, which constitute
around 55-60% of the total cost of production for tea. This has damaging implications for
workers on tea estates, who figure as a cost to be minimized by plantation companies despite the
desperate need for an improvement in their working and living conditions.
Forecast:
There is a danger that prices will drop yet further due to ambitious plans for increased tea
production in several countries, against a backdrop of sluggish demand.
The Vietnam Tea Association in 2000 agreed on concrete measures to increase production from
around 60,000 tons to 214,000 tons by 2010, with exports rising almost threefold. Similarly,
Nepal’s policy is to boost production to more than 46,000 tones by quality end of the market in
Russia, the Middle East and other developing countries. These are also the countries where
consumption is projected to grow at the fastest rate over the next five years. Oversupply in any
part of the market, however, is undesirable and potentially harmful for the whole market as lower
prices in the low-quality sector may drag down prices in other sectors.
To avoid further decline in prices, there must be an adequate amount of growth in consumption.
The FAO predicts, however, that the annual growth rate for both production and consumption
will be 2.8% until 2005.given the starting point of production being greater than consumption;
this will effectively mean a widening gap between supply and demand and therefore lower
prices.
The prospect is brighter for green tea, which is enjoying growing popularity in the west.
The Politics of Tea:
Developing countries’ dependence on tea:
Several countries are heavily dependent on tea for their export earnings, and have suffered
acutely due to low and volatile prices. In 1994 Rwanda was exceptionally dependent on tea and
coffee – earning more than 90% of its foreign exchange through the sale of those two
[37]
commodities. Kenya in 1998 earned almost 30% of its total exports value from the sale of tea.
Tea accounts for more than 20% of the value of exports from Sri Lanka.
This reliance on tea means that these countries are particularly badly hit by unfavorable price
trends in the tea market. When the price for tea declines, their terms of trade suffer as they have
less foreign currency to buy imports, which are generally increasing in price. The decline of tea
prices between 1980 and 1993 resulted in a loss of $580m in the terms of trade of developing
countries.
The intervention of politics in the tea trade:
As was shown by the Boston Tea Party, tea makes a good pawn in international affairs and the
politicization of tea is further compounded by the prevalence of consumption by the South,
unlike with coffee or cocoa.
omestic politics also plays an important part in tea production. The activities of the Tamil Tigers
in the tea-growing regions of Sri Lanka have been described as the greatest cost to the Sri
Lankan tea industry; while in India over 450 armed separatist extremist organizations disrupt the
operating environment.
The organization with jurisdiction over tea as an export commodity is the World Trade
Organization, which would ultimately have authority in mediating any dispute. For example, the
WTO has been pressuring the EU to abolish tea tariff ‘preference’ to Kenya, which bestows a
major price advantage to that nation. The WTO, however, has traditionally kept out of regulating
commodities markets, including tea, except in tariff issues. The Tea Working Group of the Food
and Agriculture Organization (FAO) of the UN, therefore, are more relevant as the international
body for the tea industry. On a regional level, organizations gaining in prestige and legal clout
include SAARC in South Asia and the Common Market for East and South Africa (COMESA)
in Africa.
A difficult issue that needs to be addressed in the international tea trade is re-exports, and this is
further discussed in the box below.
[38]
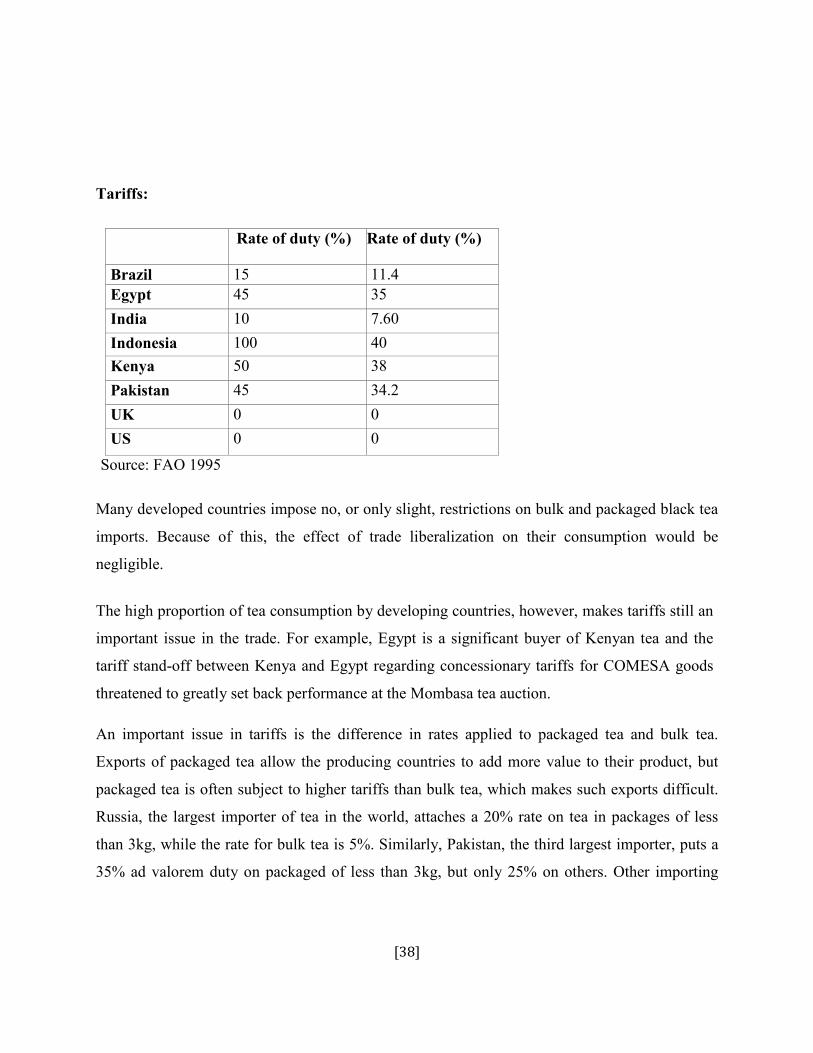
Tariffs:
Rate of duty (%) Rate of duty (%)
Brazil 15 11.4 Egypt 45 35
India 10 7.60
Indonesia 100 40 Kenya 50 38
Pakistan 45 34.2
UK 0 0
US 0 0
Source: FAO 1995
Many developed countries impose no, or only slight, restrictions on bulk and packaged black tea
imports. Because of this, the effect of trade liberalization on their consumption would be
negligible.
The high proportion of tea consumption by developing countries, however, makes tariffs still an
important issue in the trade. For example, Egypt is a significant buyer of Kenyan tea and the
tariff stand-off between Kenya and Egypt regarding concessionary tariffs for COMESA goods
threatened to greatly set back performance at the Mombasa tea auction.
An important issue in tariffs is the difference in rates applied to packaged tea and bulk tea.
Exports of packaged tea allow the producing countries to add more value to their product, but
packaged tea is often subject to higher tariffs than bulk tea, which makes such exports difficult.
Russia, the largest importer of tea in the world, attaches a 20% rate on tea in packages of less
than 3kg, while the rate for bulk tea is 5%. Similarly, Pakistan, the third largest importer, puts a
35% ad valorem duty on packaged of less than 3kg, but only 25% on others. Other importing
[39]
countries charging differentiated rates include Belarus, Kazakhstan, Ukraine, Saudi Arabia,
Jordan, Ethiopia and Morocco.
North America and the EU do not charge tariffs on either bulk or packaged black tea, but most
EU countries do charge 3.1% on green on packaged green tea, which discourages green tea
producers from adding more value to their tea. Spain and Portugal also charge around 12% on
soluble tea from outside the EC , against discouraging imports of value-added tea from
developing nations.
CAPTURING VALUE ALONG THE SUPPLY CHAIN
Further up the supply chain:
The role of the auction houses:
Unlike for coffee and cocoa there is no single indicator price for tea. Rather pricing is dominated
by the auction system, whereby the price of tea from each estate is determined on a day-to-day
basis, according to the quality and supply and demand on the day. This is because tea quality will
India, and one each in Sri Lanka (Colombo), Indonesia (Jakarta), Malawi (Limbe), eastern Africa
(Mombasa) and Bangladesh (Chittagong). Chinese tea is sold at commodity fairs in Guangzhou.
At auction, buyers bid for one particular grade from a particular tea garden at a time, after tasting
the tea and judging its value. The auctioneer plays an important role in the tea market. Apart
from personally tasting and evaluating each and every invoice, he has to use his knowledge of
the world demand and marketing skill in judging the marketability of the tea. He has final
jurisdiction and his judgment determines the selling price of the tea, to a certain extent.
Pros and Cons:
[40]
More than 70% of Kenya’s total tea sales are through auctions, while the figure for Sri Lanka is
almost 90%. There are several advantages of the dominance of the auction system for the tea
industry:
• The auction system is praised for allowing the highest price possible to be paid for the tea
in a way that equilibrates market demand and supply.
• The cost of going through the system is also fairly low. In India, auctioning costs less
than 2% of the merchandise including free sampling to prospective buyers, while in
Kenya the commission to the broker is 1% from the producer and 0.5% from the buyer.
• It is a transparent trading forum.
• Because buyers must buy the tea in its physical form rather than just on paper, it is
protected from destabilizing speculators.
Although the auction system would on the surface seem to approximate a perfectly fair market
where prices are determined solely by the interplay of supply and demand, a more detailed
picture is less attractive:
• In the 1970s, a Commission of Enquiry into the tea auction system set up by the Sri
Lanka government concluded that it appears that there is ‘a high degree of collusion that
prevails in buy and wide scope for collusion between brokers and buyers’. Such
collusion, if it occurred, would tend to reduce the price at which producers could sell tea
at the auctions, and would also affect prices of direct sales.
• Auction houses are usually seen as ‘middlemen’ that soak up cost.
• It is alleged that, when the situation is to their advantage, they increase price uncertainty,
delay and speculation.
There is some possibility that auction houses will become redundant with technological
advances. At the moment, almost all tea fields are located in regions where land phone lines
[41]
intermittently fail or simply do not exist. With the development of the internet through mobile
phones, however, and given that many plantations are financed by large companies, it is not
inconceivable that tea estates in the future will be able to post real-time data daily on the internet,
enabling a viable futures market. The global process for bringing buyers and sellers more
directly together, termed ‘disintermediation’, is already taking place with catalogue sales of
premium tea. This trend, combined with advanced internet systems, could potentially support a
price-stabilizing tea futures market, assuming that the market is financially transparent, reliably
instituted and justly enforced.
Recently more and more tea has been sold through forward contracts and private sales. The
benefit of this to producers is often considerable; they get payment faster, have less uncertainty
about sales and price, and can avoid the charges associated with auctioning tea (brokers fees,
warehousing).
The global tea brokers:
A few firms dominate the sales in each auction centre. J. Thomas & Co. Pvt. Ltd., the largest tea
broker in the world, handles over 155 million kg of tea a year, i.e. one-third of all tea auctioned
in India. Carritt Moran and Co. Ltd., the world’s second largest tea broker, handles 24% of
auctioned teas in India.
Brokers must be registered with the appropriate tea board in order to operate, which limits the
number of auction houses where tea can be sold. 11 brokers are registered with the Tea Board of
Kenya, while there are 4 registered brokers at Calcutta (J. Thomas & Co., Carritt Moran & Co.,
Contemporary Target and Paramount Tea Marketing) who together sell the majority of
Darjeeling tea.
The concentration of buyers at auction:
[42]
The concentration of buyers in most auction centers has traditionally been very high. New buyers
are inherently discriminated against for a number of reasons. Firstly, brokers generally do not
most of which are owned by the other companies competing with them in the same auction.
Blending:
Tea is generally exported with minimal processing to consumer countries, where it is blended
and packaged by the tea companies. Whilst many producers try to export pre-processed tea the
export of ‘ready-for-use’ tea is often hindered by the absence of money for expensive, glitzy
marketing strategies.
The consumer markets are dominated by the popular blended brands (over 70% of the UK
market). These are blends than can contain up to 35 different types of tea, necessitating blending
in the consuming country. They are designed to keep their taste constant despite the loss of one
or other source due to adverse weather or high prices.
By exporting tea in bulk, developing countries are missing the opportunity for significantly
increased export earnings. The producing countries currently sell tea most often as a generic
without branding and packaging, despite the fact that branded tea fetches prices which are six
times higher than bulk exports. Sri Lanka is an exception, and has succeeded in capturing more
value in the supply chain through value-added production.
Retail:
With the growth of the supermarket in Europe and North America the character of tea buying
changed quite dramatically in the 1990s. There has been a centralization of tea buying, increased
buying by individual companies and the bypassing of wholesalers with direct links between the
tea buyers and tea packers. The leading companies spend a great deal on promoting their
products. In Japan the advertising expenditure was 8%, compared to 4% in the US and 2.5% in
the UK. They also spend a great deal on offering trade seem to add small margins on the tea but
make their money from these promotional margin allowances from the packers.
[43]
The Ministry of Finance & Planning and the Treasury of Sri Lanka is a ministry of
the Government of Sri Lanka responsible for developing and executing the government's public
finance policy, economic policy and long term planning. The Treasury is housed at the General
Treasury Building in Colombo fort.
Sri lanka applaying very good financial policies which become the helpful for the got the strong
shri lanka with financial strong.
Although the officer of the treasurer of the British Government of Ceylon dates back to the early
nineteenth century the Ministry of Finance was established in 1947 prior to the independence of
Ceylon as the Ministry of Finance and the Treasury of Ceylon with young J.R Jayawardena as
the first Minister of Finance. Over time the Ministry took over the policy planning which it
currently undertakes.
The Financial Services Authority (FSA) is a quasi-judicial body responsible for the regulation
of the financial services industry in the Shri lanka. Its board is appointed by the Treasury,
although it operates independently of government. It is structured as a company limited by
guarantee and is funded entirely by fees charged to the financial services industry.Its main office
is based in Canary Wharf, London, with another office in Edinburgh. The FSA's Chairman and
CEO are currently Lord Turner of Ecchins well and Hector Sants, although on 16 March 2012
announced his resignation, effective from the end of June that year.
Foreign Investment in Sri Lanka
The Central Bank of Sri Lanka has introduced a new Direction for the investments by eligible
investors in Government securities and equity capital of companies, incorporated in Sri Lanka
and units of unit trusts in Sri Lanka.
Hence, Share Investment External Rupee Accounts (SIERA), Treasury bond Investment External
Rupee Accounts (TIERA), Treasury bill Investment External Rupee Account (TIERA 2) and
Treasury bonds/bills Investment External Rupee Accounts- Deshabhimani (TIERA-D) is now
amalgamated to one single account named as Securities Investment Accounts (SIA).
[44]
Account Features
• Sri Lankan Diaspora, migrant workforce and Citizens of foreign states now have the
ability to invest in Sri Lanka Government Securities, Equity capital of companies
incorporated in Sri Lanka and Units of unit trusts in Sri Lanka
• Remittances to the SIA would automatically be converted at the prevailing exchange rate
to Sri Lankan Rupees (local currency) and can be invested in the above
• Original investment and any income realized, can be repatriated in any designated foreign
currency to an account specified by the investor
• Transfer of funds between SIA of the same account holder is permitted
• SIA maybe held jointly by eligible investors
• Further, eligible investors who invest in T-bonds/T-bills are permitted to enter into
repurchase and reverse repurchase transactions using T-bonds/T-bills purchased under
this scheme as collateral
Eligible Investors
• Foreign institutional investors such as country funds regional funds or mutual funds
• Corporate bodies incorporated outside Sri Lanka
• Citizens of foreign states whether resident in Sri Lanka or outside Sri Lanka
• Non- resident Sri Lankans
• Sri Lankan Professionals living in Sri Lanka who receive inward remittances
• Dual citizens who receive inward remittances
Permitted Credits
• Inward remittances received from aboard through banking systems
• Transfer of funds from NRFC/FCBU/RNNFC accounts of the same account holder
• Sale proceeds realized out of sale or transfer or maturity of T-bonds/T-bills or any
income realized by way of capital gain thereof
[45]
• Sale proceeds of shares supported by documentary evidence (Broker’s Contract Notes
and evidence of payments of tax etc.) and dividends
• Dividend income and units of unit trusts net of tax supported by documentary evidence
• Proceeds on redemption of units net of tax supported by documentary evidence
• Commissions relating to share transactions with supporting evidence
• Liquidation proceeds of companies
• Interest received on T-bonds
The Government has launched an agenda for vigorous growth titled Regaining Sri Lanka. There
the private sector is given a central role in driving the nation's economic recovery. The prospect
of internal peace provides a springboard to undertake the improvements necessary for Sri Lanka
to compete effectively with the best investment and growth performers in Asia.
This report considers the improvements and reforms needed for private investment to accelerate
and foreign direct investment (FDI) inflows to expand markedly.
Sri Lanka’s performance in generating private investment. Economic growth and private
investment, including FDI, have been low by the standards of the best performers in Asia. Poor
policies inhibited private investment from independence in 1948 until 1977. A fitful easing of
restrictive business-related policies began in the late 1970s. Notable events were the creation of
the Board of Investment, or BOI (as it is now known), the formation of economic zones and the
successful 1990s privatization programme. FDI increased sharply in the 1990s, but it is still
narrowly based and reliant on one-off privatization opportunities. Moreover, it remains below the
levels achieved in the more dynamic regional countries. As a consequence of these trends, Sri
Lanka's economic structure has shifted little towards higher value-adding manufacturing and
services, although there are notable success stories such as the emergence of a competitive
textiles and garments industry. Yet a capable established business sector is poised to increase
investment and could provide a good platform for joint ventures with dynamic foreign investors.
The country's good educational system is a sound base for providing skilled managers and
professionals and trainable labour. But shortcomings in physical infrastructure have to be
[46]
overcome to capitalize on the human resources that Sri Lanka offers. With suitable
improvements and policy reforms, FDI inflows could at least double from recent levels.
The investment framework, outlining reforms that can lead to a more attractive investment
climate. The legacy of past restrictive policies is still reflected in some legislation – for example,
in land regulation – but administrative practice is often better. The Government has already
reformed important areas of business regulation, including competition law and protection of
intellectual property rights. This builds on sound sector regulatory regimes developed earlier
(e.g. in mining and telecommunications). The major extant weaknesses are the restrictions on
labour severance and a business taxation system that requires case-by-case grant of incentives
and is biased against smaller investors. A package of balanced labour measures is proposed.
Taxation should be reformed to provide an accessible and competitive fiscal regime for all
investors. Easing of FDI entry restrictions should continue. Moves underway to abolish foreign
exchange controls are endorsed, and current good business immigration practices can be
formalized and promoted. An important theme is that the haven of good regulation and
administrative practice afforded to larger investors under the BOI's extensive powers should
become the norm throughout the economy. All these changes would facilitate Sri Lanka's goal of
becoming an international business hub.
PRIVATE INVESTMENT: TRENDS AND IMPACT
Until 1965, Sri Lanka's economic performance surpassed that in several of today's dynamic
economies of East Asia. It subsequently lagged behind, while the East Asian economies
accelerated, fuelled mainly by high growth in private domestic investment and FDI. With
Government policy now emphasizing private-sector-led growth, Sri Lanka could yet witness
dynamism similar to that in East Asia.
COMPARATIVE PERSPECTIVE
At the time of independence in 1948, Sri Lanka’s development indicators compared favourably
with those of other South Asian countries and most of the East and South-East Asian countries.
[47]
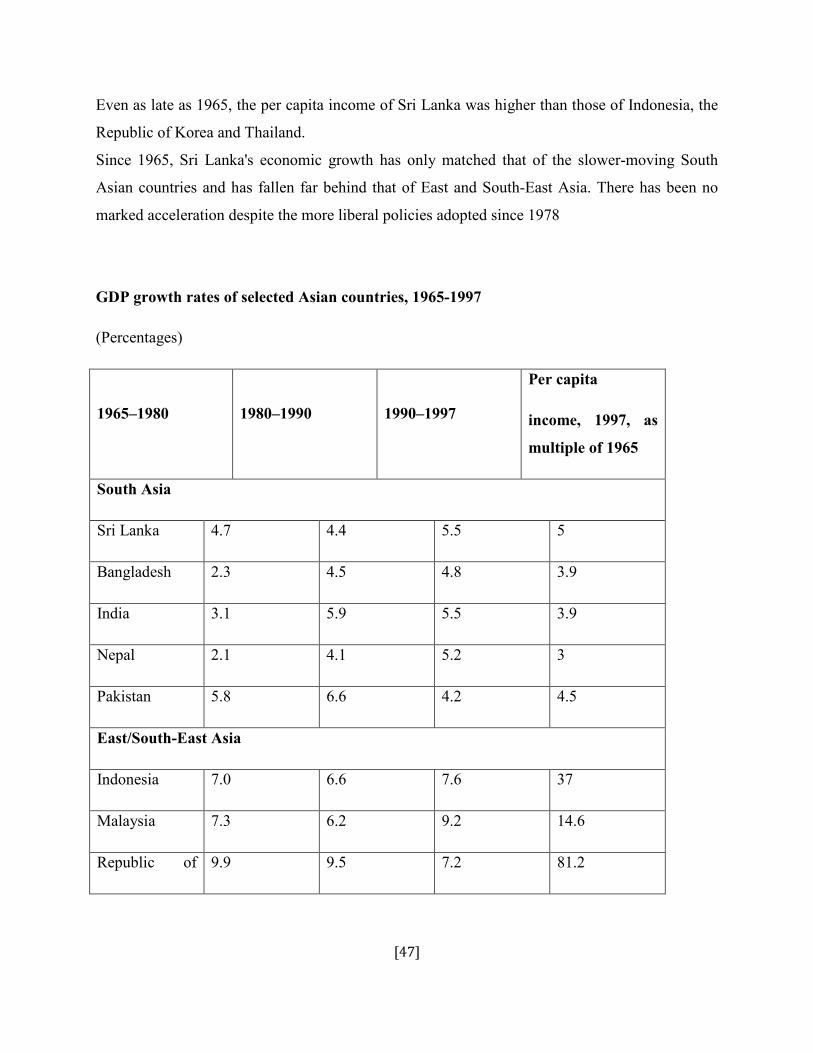
Even as late as 1965, the per capita income of Sri Lanka was higher than those of Indonesia, the
Republic of Korea and Thailand.
Since 1965, Sri Lanka's economic growth has only matched that of the slower-moving South
Asian countries and has fallen far behind that of East and South-East Asia. There has been no
marked acceleration despite the more liberal policies adopted since 1978
GDP growth rates of selected Asian countries, 1965-1997
(Percentages)
1965–1980 1980–1990 1990–1997
Per capita
income, 1997, as
multiple of 1965
South Asia
Sri Lanka 4.7 4.4 5.5 5
Bangladesh 2.3 4.5 4.8 3.9
India 3.1 5.9 5.5 3.9
Nepal 2.1 4.1 5.2 3
Pakistan 5.8 6.6 4.2 4.5
East/South-East Asia
Indonesia 7.0 6.6 7.6 37
Malaysia 7.3 6.2 9.2 14.6
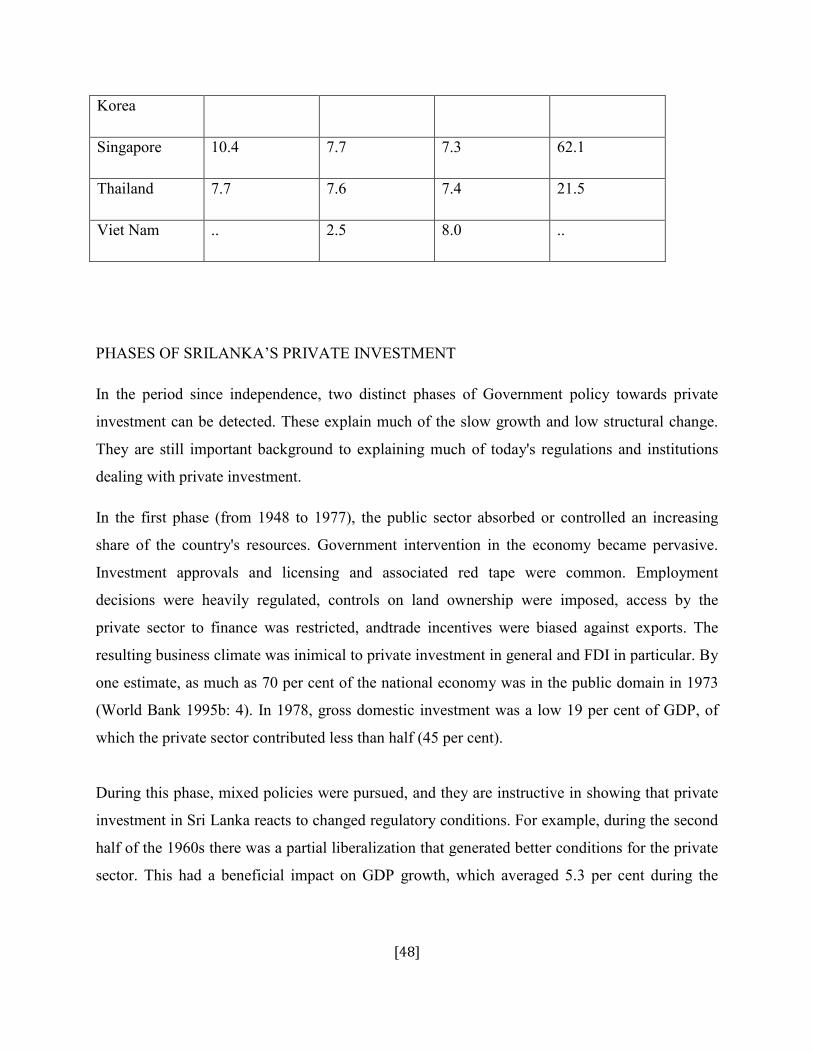
Republic of 9.9 9.5 7.2 81.2
[48]
Korea
Singapore 10.4 7.7 7.3 62.1
Thailand 7.7 7.6 7.4 21.5
Viet Nam .. 2.5 8.0 ..
PHASES OF SRILANKA’S PRIVATE INVESTMENT
In the period since independence, two distinct phases of Government policy towards private
investment can be detected. These explain much of the slow growth and low structural change.
They are still important background to explaining much of today's regulations and institutions
dealing with private investment.
In the first phase (from 1948 to 1977), the public sector absorbed or controlled an increasing
share of the country's resources. Government intervention in the economy became pervasive.
Investment approvals and licensing and associated red tape were common. Employment
decisions were heavily regulated, controls on land ownership were imposed, access by the
private sector to finance was restricted, andtrade incentives were biased against exports. The
resulting business climate was inimical to private investment in general and FDI in particular. By
one estimate, as much as 70 per cent of the national economy was in the public domain in 1973
(World Bank 1995b: 4). In 1978, gross domestic investment was a low 19 per cent of GDP, of
which the private sector contributed less than half (45 per cent).
During this phase, mixed policies were pursued, and they are instructive in showing that private
investment in Sri Lanka reacts to changed regulatory conditions. For example, during the second
half of the 1960s there was a partial liberalization that generated better conditions for the private
sector. This had a beneficial impact on GDP growth, which averaged 5.3 per cent during the
[49]
period 1966–1970. The period 1971–1977 saw a reversal of intensified government intervention
and several policy measures that were adverse for private-sector investment. As a result, GDP
growth sharply decelerated to an annual average of 2.9 per cent during 1971–1977.
The second phase of Government policy was marked by liberalization. The poor economic
performance of 1971–1977 prompted a policy reorientation in 1977 to the pursuit of private-
sector-led, export-oriented development, including a greater role for FDI. Initially some of the
most severe controls were removed for all investors. These included dismantling of trade and
payment barriers, unification of the exchange rate, restructuring of agricultural and export taxes,
adjustment of administered prices, liberalization of interest rates and reduced restrictions on
pricing and investment by the private sector (IMF Institute 1996 and World Bank 1995b).
Later policies (including the issuance of the Industrialization Policy Statement in 1989)
introduced reforms to the tariff system (to lower tariff rates and reduce dispersion) and the tax
system (to reduce exemptions and lower rates).
However, comprehensive reforms of the regulations, taxes and administrative machinery
weighing down private investment were not tackled at the start. Instead the Greater Colombo
Economic Commission (which was reconstituted as the Board of Investment (BOI) in 1992) was
created in 1978 with wide powers of tax relief and administrative discretion for larger or priority
investors. No doubt this partial approach to liberalization was judged to be the only feasible
approach at the time.
Forms of FDI
FDI into the country has been mainly through 100 per cent foreign ownership rather than joint
ventures. Between 1979 and 2000, wholly foreign owned enterprises accounted for about 60 per
cent of estimated FDI by value and 45 per cent by number of projects.
However, the important feature of this statistic is that national investor participation in joint
ventures is unusually high given Sri Lanka's comparatively low per capita income. To some
extent this might reflect the preference for joint ventures in foreign investment policy and in
[50]
some privatizations. But it also suggests that Sri Lanka has a local private sector with the
technical and financial capability to provide strong partnerships with foreign investors.
Privatization has been an important channel of FDI into Sri Lanka. The 11 largest privatization
transactions between 1990 and 2000 accounted for $609 million of the $1,791 million in FDI
during the period. Cumulative data for the period February 1990–June 2001 shows that a little
more than two-thirds of privatization proceeds was raised from these foreign investors.
Since independence in 1948, conditions have never permitted national or foreign private
investment to flourish for sustained periods in Sri Lanka. The statistics show that Sri Lanka is
still a very low-income country with an economic structure not far removed from that of the
colonial era. Fortunately, the local skills base in both general education and business disciplines
is much better than would be expected in a country with a per capita income of only $800. There
is a well-established national private sector. There are good grounds for believing that private
investment will respond well to the prospects of greater stability and to reforms in the investment
framework. Sri Lanka's ambition to be an international business hub is realizable if regulatory,
tax and institutional reforms are made and Sri Lanka's strong points are developed and promoted
well. Preferential trade access to India and possibly to the United States presents enormous
opportunities.
Sri Lanka should aim high. There will be a substantial payoff in the size and quality of private
investment to the first South Asian country to implement a vision of becoming the first-choice
base for regional business operations. To be the first choice, Sri Lanka, a relatively small
country, must deliver a superb investment climate and highly effective investment generation.
The immediate areas to tackle in implementing such a vision are the weak points in the
regulatory and tax environment for private investment:
(i) Over-regulation and unpredictable administration of labour severance. This is by far the
most serious negative factor. A package of reforms is recommended. If fundamental
reforms are not made, any ambition to be the first-choice regional business hub will
have fallen at the first hurdle.
[51]
(ii) A business taxation system that is not competitive for all investors and is insufficiently
developed to cater to highly tax-sensitive activities. An overhaul of business taxation is
recommended to correct this.
(iii) Weaknesses in pro-competition policies, as manifested in sectoral and other legislation,
and a protectionist (but liberalizing) stance in FDI policy. The new Consumer Affairs
Authority should be tasked to investigate. All FDI entry restrictions should be re-
examined.
(iv) A continuing legacy of intrusive State powers in commercial matters (e.g. in land
powers).
(v) Provision of high-quality regulatory services through the BOI only for larger investors, in
contrast to services available to small- and medium-scale investors from the line
agencies.
HUMAN RESOURCE POLICIES OF SRI LANKA
According to the policy, the tea industry is operating by the Ministry of Public Estate
Management and Development and it is one of the important industries in Sri Lanka. It became
the world's leading exporter in 1995 with a 23% share of global tea export, higher
than Kenya's 22% share. The industry was introduced in the country in 1867 by James Taylor, a
British planter who arrived in 1852.
Now, Sri Lanka has become one of the countries exporting fair trade tea to the UK and other
many countries.
Tea which was one of the Sri Lanka's largest export commodities has crises over the past three
decades. According to statistics, in 1966 the value of the tea sector as a percentage of the gross
domestic product was only 2.2 per cent. But the contribution made by the tea sector to GDP in
1995 compared with other sectors of the economy is 1.9 per cent.
[52]
In 1996 the tea sector contributed 15 per cent of total export value. Export earnings from tea
sector in 1996 as compared to the other sectors are 15.05 per cent.
Recently, the tea industry is a major export producer, and particular tea sector as its net foreign
exchange earnings are very high. In 1991, Sri Lankan leading emerged the largest exporter of tea
to the world market. In international markets the share of Sri Lankan tea in 1995 was 23 per cent
compare to the Kenya was reported to have overtaken Sri Lanka in 1996 as the largest tea
exporter. Nowadays, in the international market tea export in bulk form, Sri Lanka has now
developed country and enters into the largest producer of retail consumer packets and bags to
other country.
The tea sector provides directly or indirectly employment to over 1 million people in Sri Lanka.
After the liberalization of economic policies, the development process for the sustainable use of
the natural resources and the government has also recognized the need to integrate environmental
concerns, in order to address national as well as international environmental concerns.
After the privatization of State plantations, the focus on environmental issues on tea plantation
sector becomes complicated and challenging. Tea sector appears that those issues are not solve
through contracts with the private sector at the time of privatization,
For example, land-use issues related to environmental degradation. Therefore, those issues may
need to be more addressed through normal laws and regulations of Sri lankan tea industries,
while at the same developmental needs time taking into account. In that level, balance measures
with awareness and training through assistance programmers appears to be a big challenge for
the authorities.
LABOUR STANDARDS OF TEA SECTOR IN SRI LANKA
Policy statement given by the board of investment of Sri lanka. Their support the Global
Compact addressed to the business community and proposed by the secretary-general of the
[53]
United Nations, which is incorporates the core labor standards of the international labor
organization.
The board of investment is also committed the related international labor standards by the
employers in the board of investment enterprises, and promoting to the application of the
principles underlying the Global Compact and both within and outside the export processing
Zones of Sri lanka.
EMPLOYMENT
1. Classification on the basis of Workers
Trainees workers:
Those are undergoing training for a period of not less than 6 months or 156 working days are
classified as trainees’ workers.
Semi-skilled workers:
Those are successfully completion of a training period of 6 month that worker called as a semi-
skilled workers.
Un-skilled workers:
Those works which does not related any training is called as un-skilled work.
Skilled workers:
Workers which have good skills for the job related is called as a skilled worker.
2. Recruitment and Retirement of workers:
- Minimum age for recruitment shall be 18 years
- Normal age of retirement is 55 years.
[54]
Persons who have attained the age of 16 years but below the age of 18 years can be employed,
subject to the following conditions:-
a) Persons under the age of 18 years cannot be employed for more than 50 hours of overtime
during any month.
b) Persons under the age of 18 years cannot be employed after 10.00 p.m. and before 6.00
a.m.
3. Prohibition on Child Labor:
Not employer should use any child labor through any contractor or sub-contractors with directly
or indirectly.
4. Contract of Employment:
a contract of employment is written with terms and conditions of service including the
designation or category of the employee, training period, probationary period, leave period,
holidays and others benefits, normal hours of work, rate of payment, has to be issued to every
worker including trainees and job obtained by the employer.
5. Equal Status
All male and female workers shall be paid equal remuneration for work and gives opportunity in
employment and occupation is also equal.
HOURS OF WORK
1. Normal Working Day:
One-Shift Operation:
Monday to Friday
A working day of 9 hours per day including of an interval of one hour for a meal or rest.
Saturday
[55]
A short working day of 6, 6 ½ or 7 hours including of an interval of one hour for a meal or rest.
Two/ Three-Shift Operation:
Monday to Friday
A working day of 8 hours per day including of an interval of half an hour for a meal or rest.
Saturday
A short working day of 5 ½ hours including of an interval of half an hour for a meal or rest.
2. Night Work:
There is no restriction on employment of male workers on night shift.
Employments of female workers on night work from 10.00 p.m. to 6.00 a.m. on the following
day will be allowed as a third shift, subject to the following conditions:-
a) Written consent of the worker to be available.
b) The employer to obtain approval from the department of labor for night work. The industrial
relations department of the board of investment will provide assistance depend upon request.
c) Payment of 1 ½ times the daily rate of wages for the normal night shift.
d) Maximum of 10 days night work per female worker in any one month.
e) A worker employed between 6.00 a.m. and 6.00 p.m. not to be employed on night shift on
same day.
f) A worker employed on night work to be allowed an adequate period for rest after such work.
[56]
Chapter-IV
Export and Import Strategies
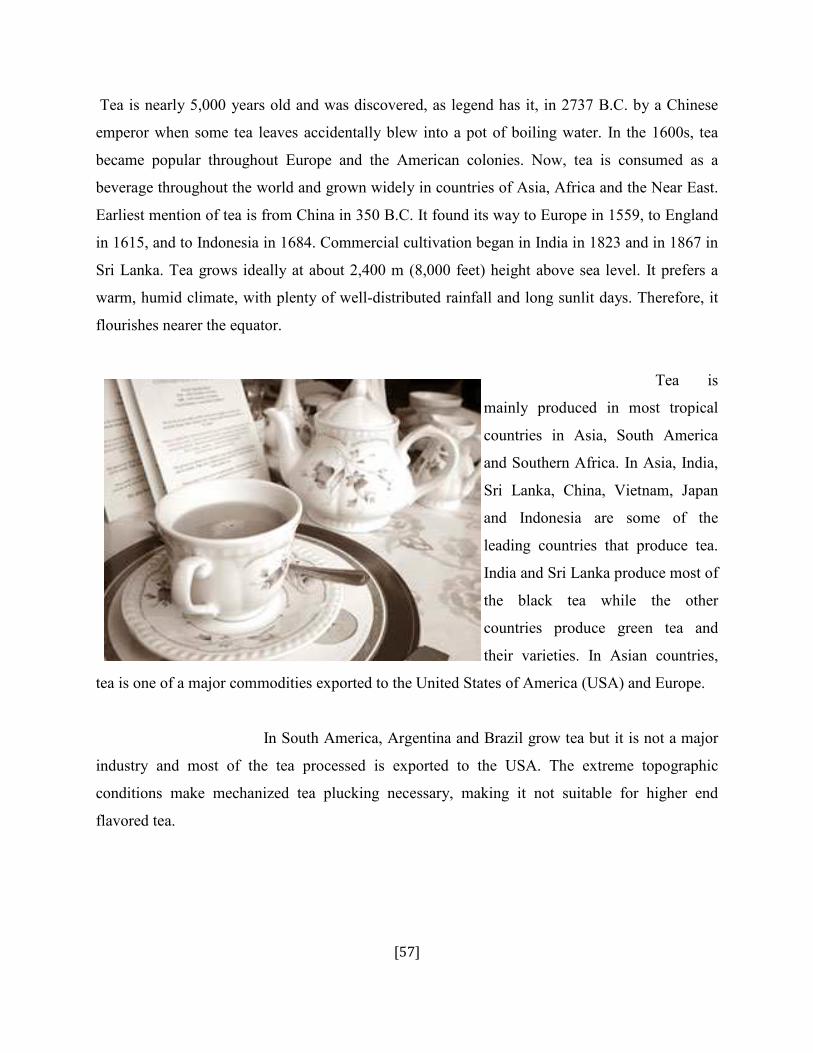
[57]
Tea is nearly 5,000 years old and was discovered, as legend has it, in 2737 B.C. by a Chinese
emperor when some tea leaves accidentally blew into a pot of boiling water. In the 1600s, tea
became popular throughout Europe and the American colonies. Now, tea is consumed as a
beverage throughout the world and grown widely in countries of Asia, Africa and the Near East.
Earliest mention of tea is from China in 350 B.C. It found its way to Europe in 1559, to England
in 1615, and to Indonesia in 1684. Commercial cultivation began in India in 1823 and in 1867 in
Sri Lanka. Tea grows ideally at about 2,400 m (8,000 feet) height above sea level. It prefers a
warm, humid climate, with plenty of well-distributed rainfall and long sunlit days. Therefore, it
flourishes nearer the equator.
Tea is
mainly produced in most tropical
countries in Asia, South America
and Southern Africa. In Asia, India,
Sri Lanka, China, Vietnam, Japan
and Indonesia are some of the
leading countries that produce tea.
India and Sri Lanka produce most of
the black tea while the other
countries produce green tea and
their varieties. In Asian countries,
tea is one of a major commodities exported to the United States of America (USA) and Europe.
In South America, Argentina and Brazil grow tea but it is not a major
industry and most of the tea processed is exported to the USA. The extreme topographic
conditions make mechanized tea plucking necessary, making it not suitable for higher end
flavored tea.
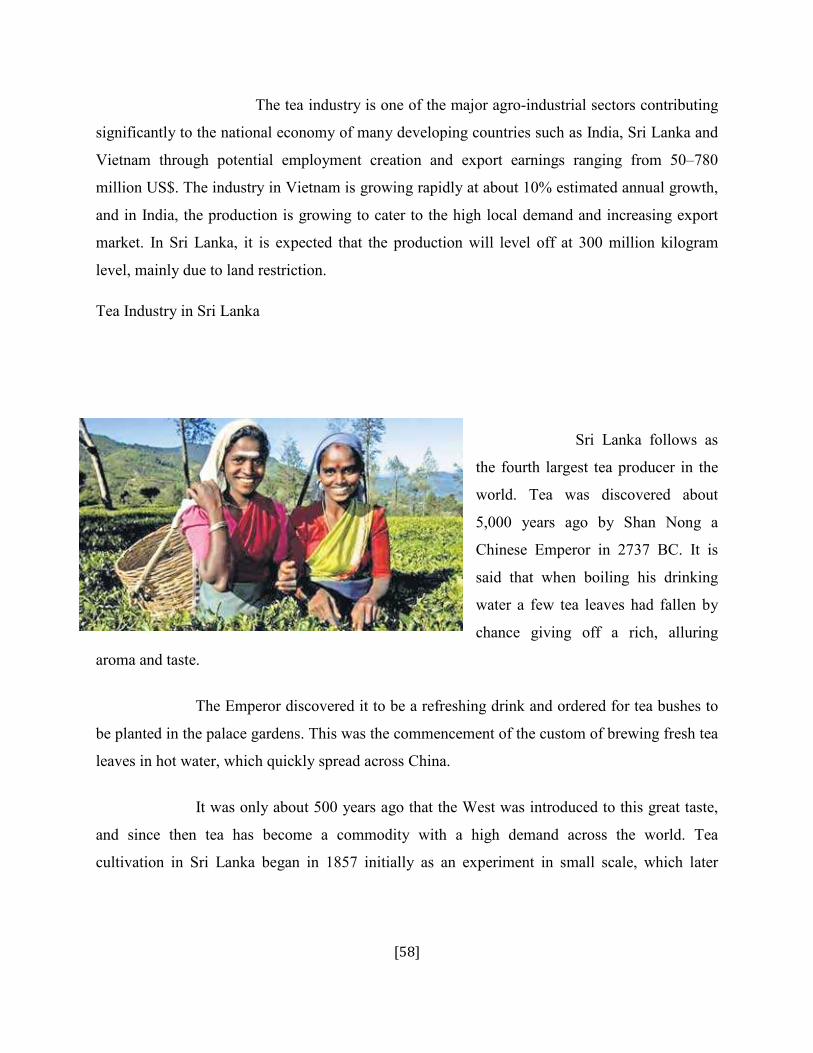
[58]
The tea industry is one of the major agro-industrial sectors contributing
significantly to the national economy of many developing countries such as India, Sri Lanka and
Vietnam through potential employment creation and export earnings ranging from 50–780
million US$. The industry in Vietnam is growing rapidly at about 10% estimated annual growth,
and in India, the production is growing to cater to the high local demand and increasing export
market. In Sri Lanka, it is expected that the production will level off at 300 million kilogram
level, mainly due to land restriction.
Tea Industry in Sri Lanka
Sri Lanka follows as
the fourth largest tea producer in the
world. Tea was discovered about
5,000 years ago by Shan Nong a
Chinese Emperor in 2737 BC. It is
said that when boiling his drinking
water a few tea leaves had fallen by
chance giving off a rich, alluring
aroma and taste.
The Emperor discovered it to be a refreshing drink and ordered for tea bushes to
be planted in the palace gardens. This was the commencement of the custom of brewing fresh tea
leaves in hot water, which quickly spread across China.
It was only about 500 years ago that the West was introduced to this great taste,
and since then tea has become a commodity with a high demand across the world. Tea
cultivation in Sri Lanka began in 1857 initially as an experiment in small scale, which later
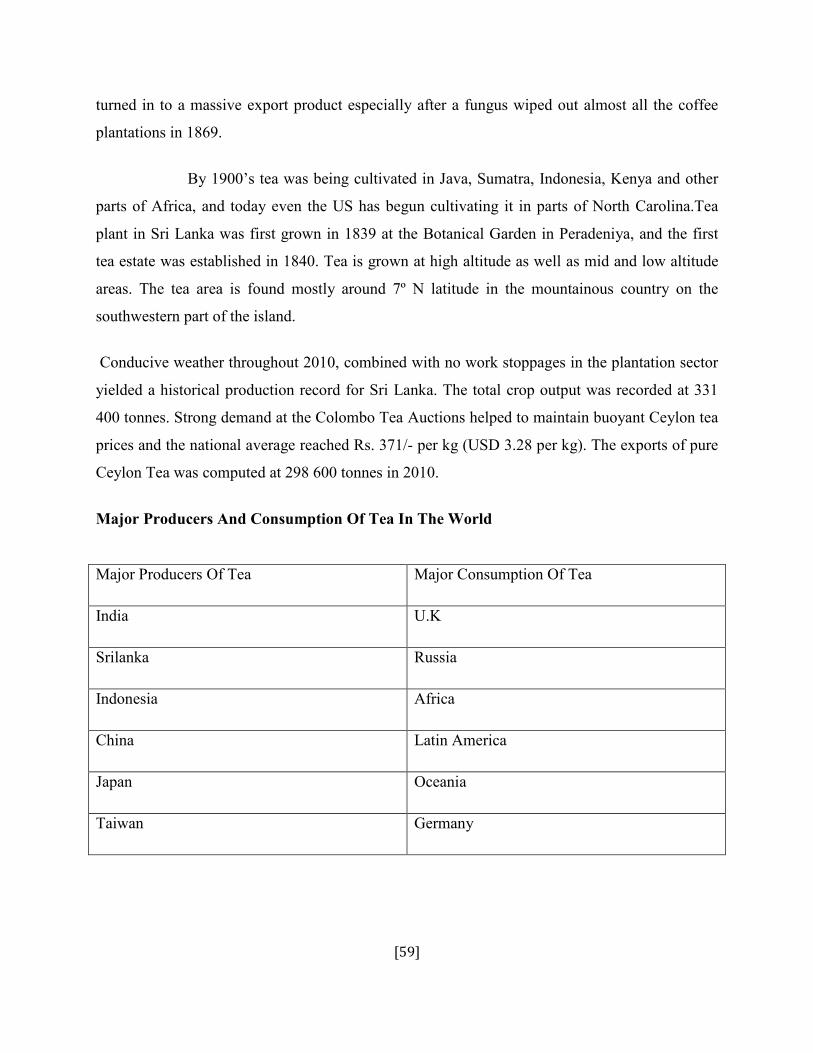
[59]
turned in to a massive export product especially after a fungus wiped out almost all the coffee
plantations in 1869.
By 1900’s tea was being cultivated in Java, Sumatra, Indonesia, Kenya and other
parts of Africa, and today even the US has begun cultivating it in parts of North Carolina.Tea
plant in Sri Lanka was first grown in 1839 at the Botanical Garden in Peradeniya, and the first
tea estate was established in 1840. Tea is grown at high altitude as well as mid and low altitude
areas. The tea area is found mostly around 7º N latitude in the mountainous country on the
southwestern part of the island.
Conducive weather throughout 2010, combined with no work stoppages in the plantation sector
yielded a historical production record for Sri Lanka. The total crop output was recorded at 331
400 tonnes. Strong demand at the Colombo Tea Auctions helped to maintain buoyant Ceylon tea
prices and the national average reached Rs. 371/- per kg (USD 3.28 per kg). The exports of pure
Ceylon Tea was computed at 298 600 tonnes in 2010.
Major Producers And Consumption Of Tea In The World
Major Producers Of Tea Major Consumption Of Tea
India U.K
Srilanka Russia
Indonesia Africa
China Latin America
Japan Oceania
Taiwan Germany
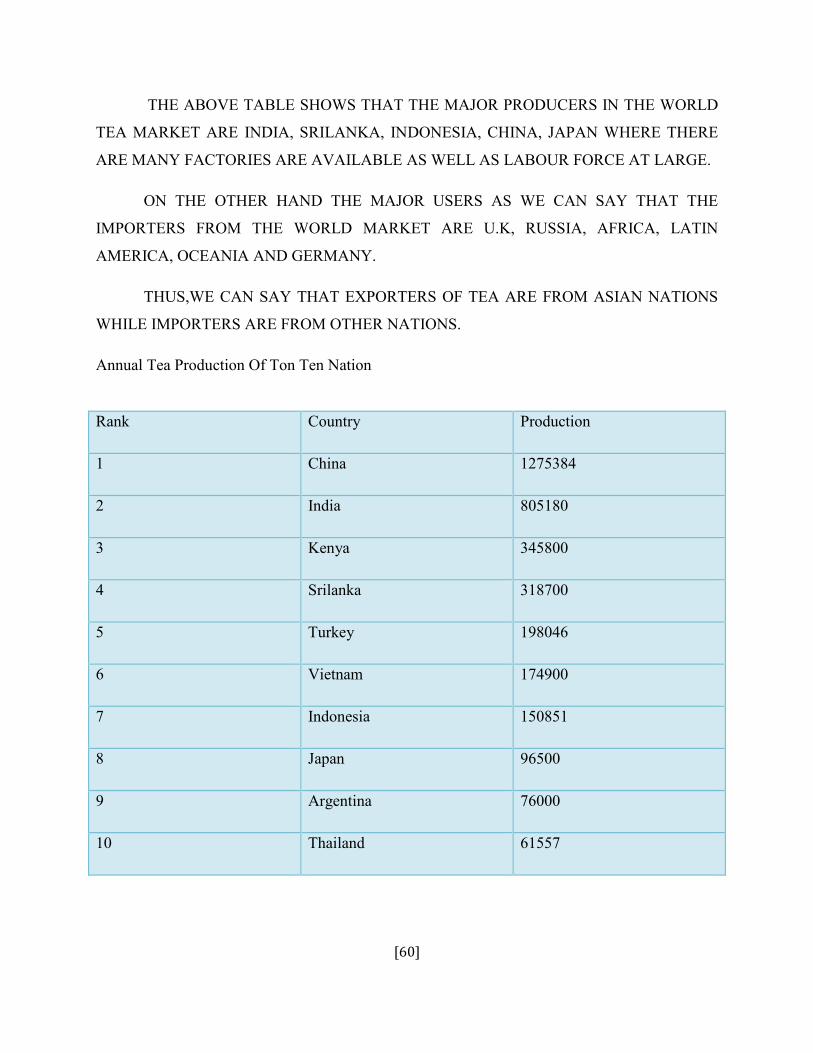
[60]
THE ABOVE TABLE SHOWS THAT THE MAJOR PRODUCERS IN THE WORLD
TEA MARKET ARE INDIA, SRILANKA, INDONESIA, CHINA, JAPAN WHERE THERE
ARE MANY FACTORIES ARE AVAILABLE AS WELL AS LABOUR FORCE AT LARGE.
ON THE OTHER HAND THE MAJOR USERS AS WE CAN SAY THAT THE
IMPORTERS FROM THE WORLD MARKET ARE U.K, RUSSIA, AFRICA, LATIN
AMERICA, OCEANIA AND GERMANY.
THUS,WE CAN SAY THAT EXPORTERS OF TEA ARE FROM ASIAN NATIONS
WHILE IMPORTERS ARE FROM OTHER NATIONS.
Annual Tea Production Of Ton Ten Nation
Rank Country Production
1 China 1275384
2 India 805180
3 Kenya 345800
4 Srilanka 318700
5 Turkey 198046
6 Vietnam 174900
7 Indonesia 150851
8 Japan 96500
9 Argentina 76000
10 Thailand 61557
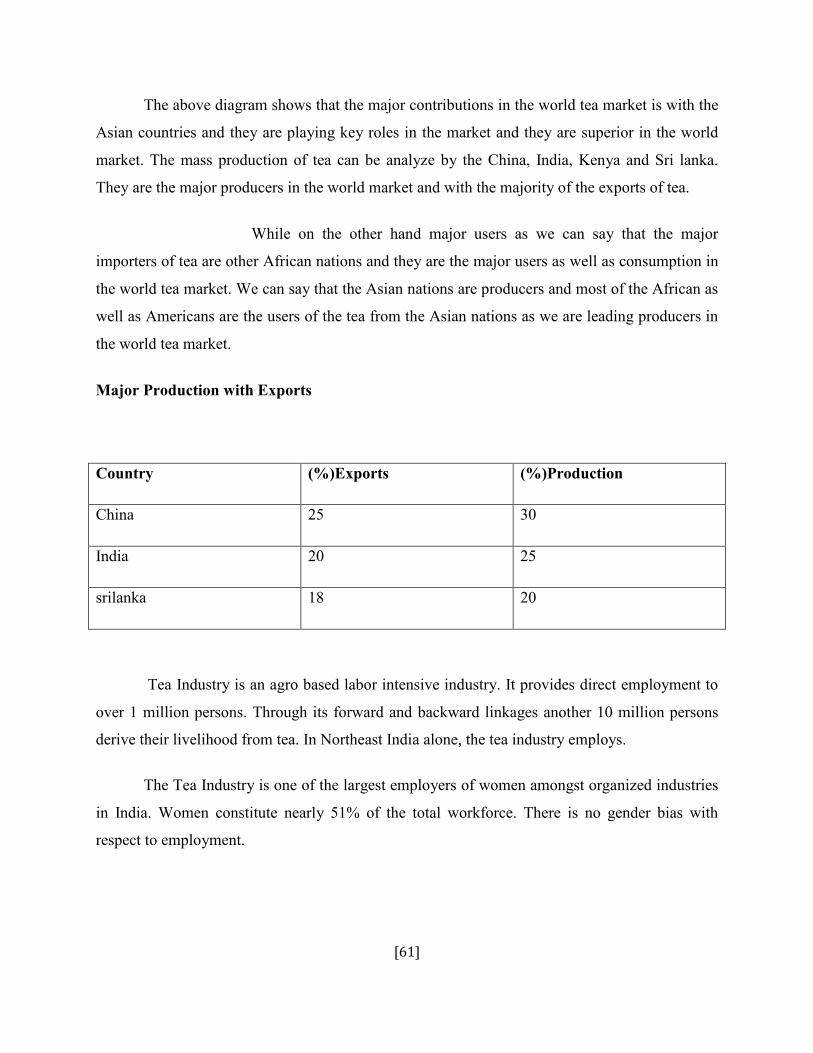
[61]
The above diagram shows that the major contributions in the world tea market is with the
Asian countries and they are playing key roles in the market and they are superior in the world
market. The mass production of tea can be analyze by the China, India, Kenya and Sri lanka.
They are the major producers in the world market and with the majority of the exports of tea.
While on the other hand major users as we can say that the major
importers of tea are other African nations and they are the major users as well as consumption in
the world tea market. We can say that the Asian nations are producers and most of the African as
well as Americans are the users of the tea from the Asian nations as we are leading producers in
the world tea market.
Major Production with Exports
Country (%)Exports (%)Production
China 25 30
India 20 25
srilanka 18 20
Tea Industry is an agro based labor intensive industry. It provides direct employment to
over 1 million persons. Through its forward and backward linkages another 10 million persons
derive their livelihood from tea. In Northeast India alone, the tea industry employs.
The Tea Industry is one of the largest employers of women amongst organized industries
in India. Women constitute nearly 51% of the total workforce. There is no gender bias with
respect to employment.
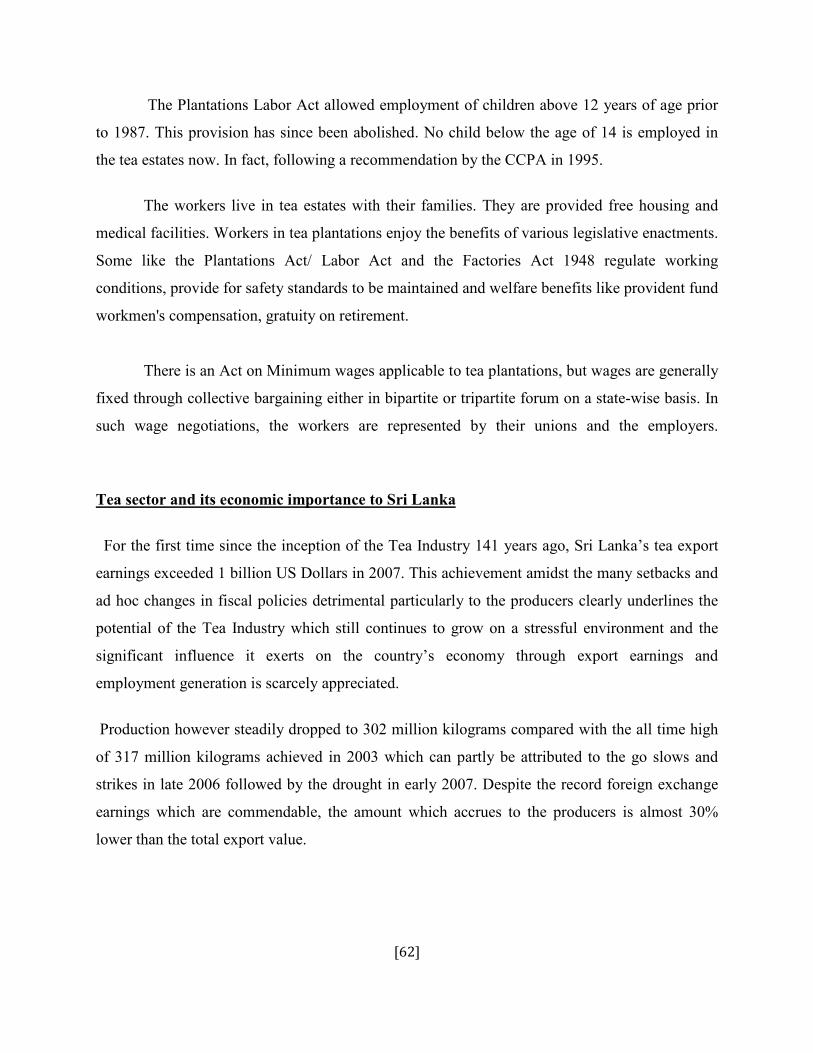
[62]
The Plantations Labor Act allowed employment of children above 12 years of age prior
to 1987. This provision has since been abolished. No child below the age of 14 is employed in
the tea estates now. In fact, following a recommendation by the CCPA in 1995.
The workers live in tea estates with their families. They are provided free housing and
medical facilities. Workers in tea plantations enjoy the benefits of various legislative enactments.
Some like the Plantations Act/ Labor Act and the Factories Act 1948 regulate working
conditions, provide for safety standards to be maintained and welfare benefits like provident fund
workmen's compensation, gratuity on retirement.
There is an Act on Minimum wages applicable to tea plantations, but wages are generally
fixed through collective bargaining either in bipartite or tripartite forum on a state-wise basis. In
such wage negotiations, the workers are represented by their unions and the employers.
Tea sector and its economic importance to Sri Lanka
For the first time since the inception of the Tea Industry 141 years ago, Sri Lanka’s tea export
earnings exceeded 1 billion US Dollars in 2007. This achievement amidst the many setbacks and
ad hoc changes in fiscal policies detrimental particularly to the producers clearly underlines the
potential of the Tea Industry which still continues to grow on a stressful environment and the
significant influence it exerts on the country’s economy through export earnings and
employment generation is scarcely appreciated.
Production however steadily dropped to 302 million kilograms compared with the all time high
of 317 million kilograms achieved in 2003 which can partly be attributed to the go slows and
strikes in late 2006 followed by the drought in early 2007. Despite the record foreign exchange
earnings which are commendable, the amount which accrues to the producers is almost 30%
lower than the total export value.
[63]
Tea, once Sri Lanka’s largest export commodity has experienced and surmounted intermittent
crises over the past several decades and continues to be perhaps the highest Nett Foreign
Exchange earning Industry and merits the support from the powers that be, to ensure its
sustainability and growth.
Fortunately, Ceylon Tea is still synonymous with high quality and its particular strength lies in
its diversity and hence the continuing demand from consuming countries. Therefore, some key
strategic decisions need to be made and support meted out at every level in order to attain at least
2 – 2.5% of the country’s GDP held 3 decades ago from the current 1.5% as quoted by the
Central Bank, contributing 13% of Sri Lanka’s total exports.
Local Employment Generation
The estates managed by the Regional Plantation Companies employ in excess of 300,000
workers while the Industry provides direct and indirect employment to over one million people
which is some 13% of the country’s total labour force. Little known and appreciated is the fact
that many townships and villages within the plantation areas have steadily developed with their
economic situation totally dependant on the well being of the Industry.
In this context, the Plantation Sector takes precedence over all others in
terms of the Economic, Social and Environmental benefits that accrue to the country. Further, the
State is relieved of having to provide facilities such as housing, water and sanitation and other
infrastructure provided by the estates not only to the workers but to the entire resident population
along with other administrative support such as facilitation of ID cards, Birth & Death
Certificates and not least the maintenance of Law and Order in these areas.
Contribution to the Capital Market and related industries
The eighteen Plantation Companies listed on the Colombo Stock Exchange account for 1.64% of
total market capitalization which is significantly higher than apparel, tourism and other foreign
exchange earning avenues. Despite the declining harvest, export levels and earnings there from
[64]
have shown positive gains with good demand from Sri Lanka’s traditional markets such as the
CIS countries, Iran, UAE and other Middle Eastern destinations.
The volume of value added teas in the form of Packets and Tea Bags is
steadily increasing and the expansion of the product range to Instant Tea, Green Tea, Organic
Tea, a variety of flavoured teas albeit in limited quantities, apart from creating opportunities and
growth through exports, have indirectly benefited Industries such as Printing and Packaging,
Logistics and Freight Forwarding as well as the Local Handicrafts Sector.
Challenges Faced
Sri Lanka cannot be complacent any longer with the changing Global scenario
where competing countries are aggressively promoting and supporting production and exploring
new markets.
The Indian Government is said to be embarking on a series of measures
commencing with enhancing productivity. Union Minister of State for Commerce, Jairam
Ramesh is quoted having said that the Indian Government was considering sharing 50% of the
social security expenditure on estates due to the high social welfare costs which the Indian Tea
Companies were finding difficult to bear.
Among the host of issues plaguing the Plantation Industry, critical and
significant are problems that directly relate to land and labour. Frequent Government
intervention and politicised trade unions add to the severity of the problem. A burning issue is
the looming labour shortage due to out migration, voluntary unemployment and the ageing work
force.
In as much as the onus is on the companies and employees, Trade Unions too
have a key role to play in encouraging their members to greater productivity thereby realising the
true potential of the industry. Unwarranted work stoppages and other similar set backs, while
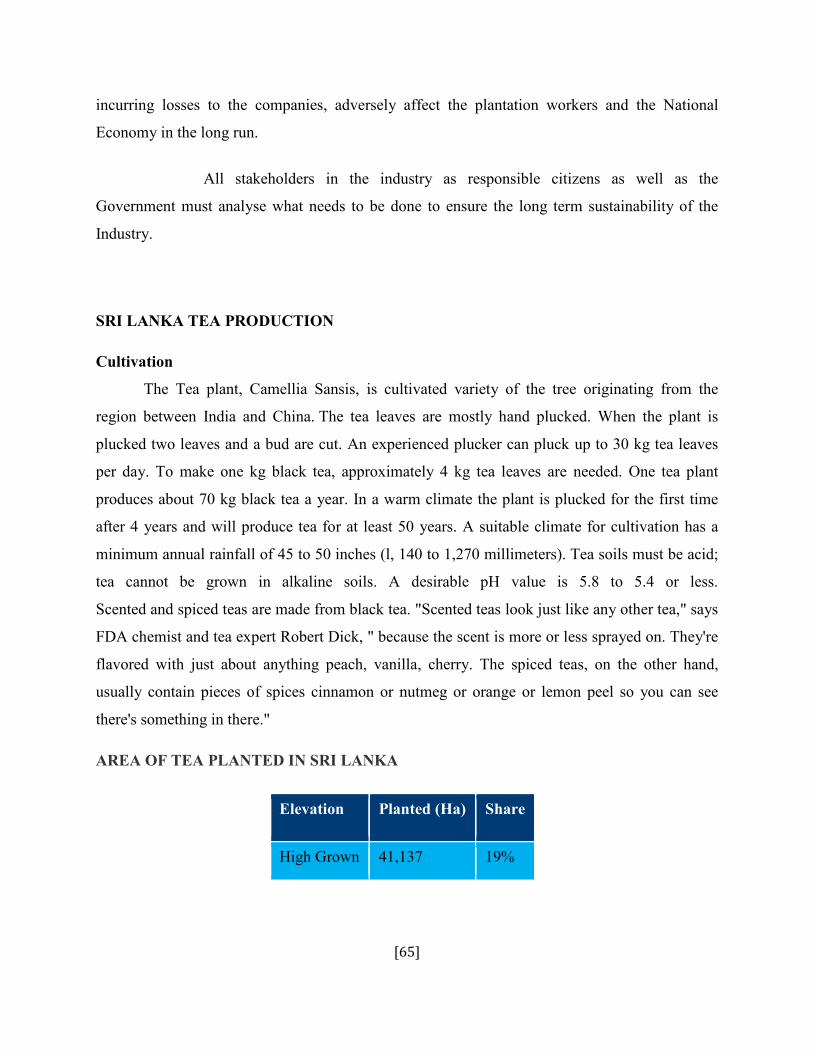
[65]
incurring losses to the companies, adversely affect the plantation workers and the National
Economy in the long run.
All stakeholders in the industry as responsible citizens as well as the
Government must analyse what needs to be done to ensure the long term sustainability of the
Industry.
SRI LANKA TEA PRODUCTION
Cultivation
The Tea plant, Camellia Sansis, is cultivated variety of the tree originating from the
region between India and China. The tea leaves are mostly hand plucked. When the plant is
plucked two leaves and a bud are cut. An experienced plucker can pluck up to 30 kg tea leaves
per day. To make one kg black tea, approximately 4 kg tea leaves are needed. One tea plant
produces about 70 kg black tea a year. In a warm climate the plant is plucked for the first time
after 4 years and will produce tea for at least 50 years. A suitable climate for cultivation has a
minimum annual rainfall of 45 to 50 inches (l, 140 to 1,270 millimeters). Tea soils must be acid;
tea cannot be grown in alkaline soils. A desirable pH value is 5.8 to 5.4 or less.
Scented and spiced teas are made from black tea. "Scented teas look just like any other tea," says
FDA chemist and tea expert Robert Dick, " because the scent is more or less sprayed on. They're
flavored with just about anything peach, vanilla, cherry. The spiced teas, on the other hand,
usually contain pieces of spices cinnamon or nutmeg or orange or lemon peel so you can see
there's something in there."
AREA OF TEA PLANTED IN SRI LANKA
Elevation Planted (Ha) Share
High Grown 41,137 19%
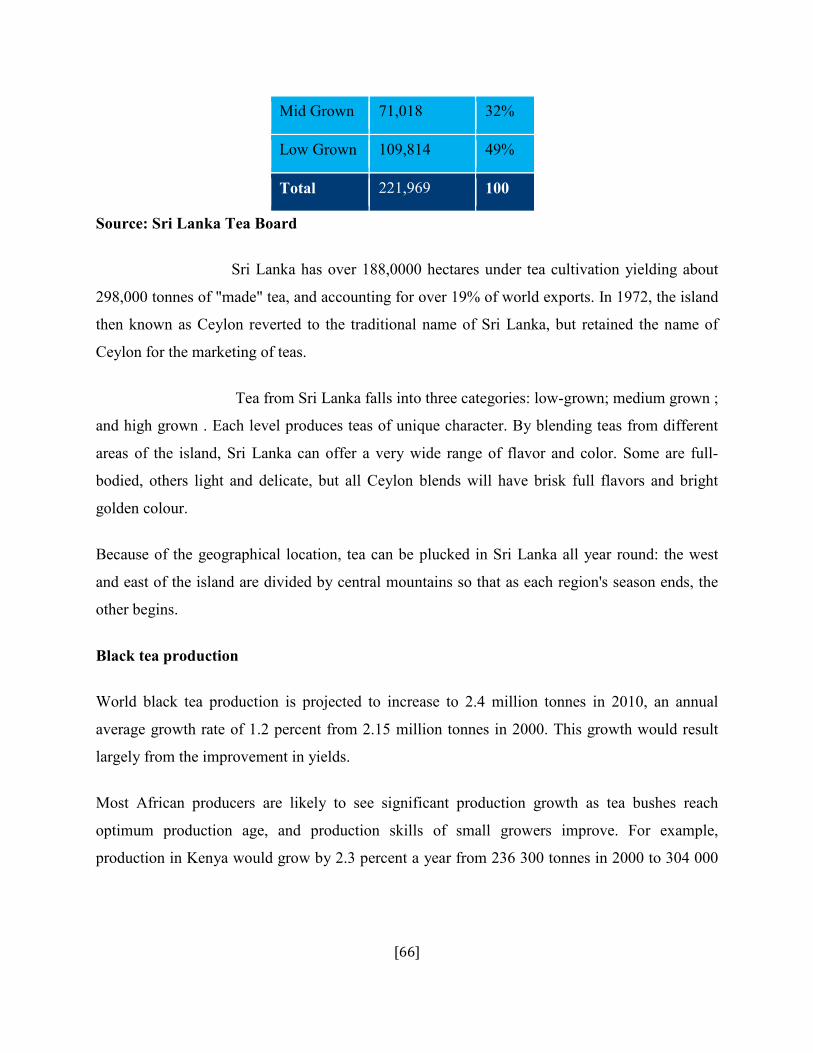
[66]
Mid Grown 71,018 32%
Low Grown 109,814 49%
Total 221,969 100
Source: Sri Lanka Tea Board
Sri Lanka has over 188,0000 hectares under tea cultivation yielding about
298,000 tonnes of "made" tea, and accounting for over 19% of world exports. In 1972, the island
then known as Ceylon reverted to the traditional name of Sri Lanka, but retained the name of
Ceylon for the marketing of teas.
Tea from Sri Lanka falls into three categories: low-grown; medium grown ;
and high grown . Each level produces teas of unique character. By blending teas from different
areas of the island, Sri Lanka can offer a very wide range of flavor and color. Some are full-
bodied, others light and delicate, but all Ceylon blends will have brisk full flavors and bright
golden colour.
Because of the geographical location, tea can be plucked in Sri Lanka all year round: the west
and east of the island are divided by central mountains so that as each region's season ends, the
other begins.
Black tea production
World black tea production is projected to increase to 2.4 million tonnes in 2010, an annual
average growth rate of 1.2 percent from 2.15 million tonnes in 2000. This growth would result
largely from the improvement in yields.
Most African producers are likely to see significant production growth as tea bushes reach
optimum production age, and production skills of small growers improve. For example,
production in Kenya would grow by 2.3 percent a year from 236 300 tonnes in 2000 to 304 000
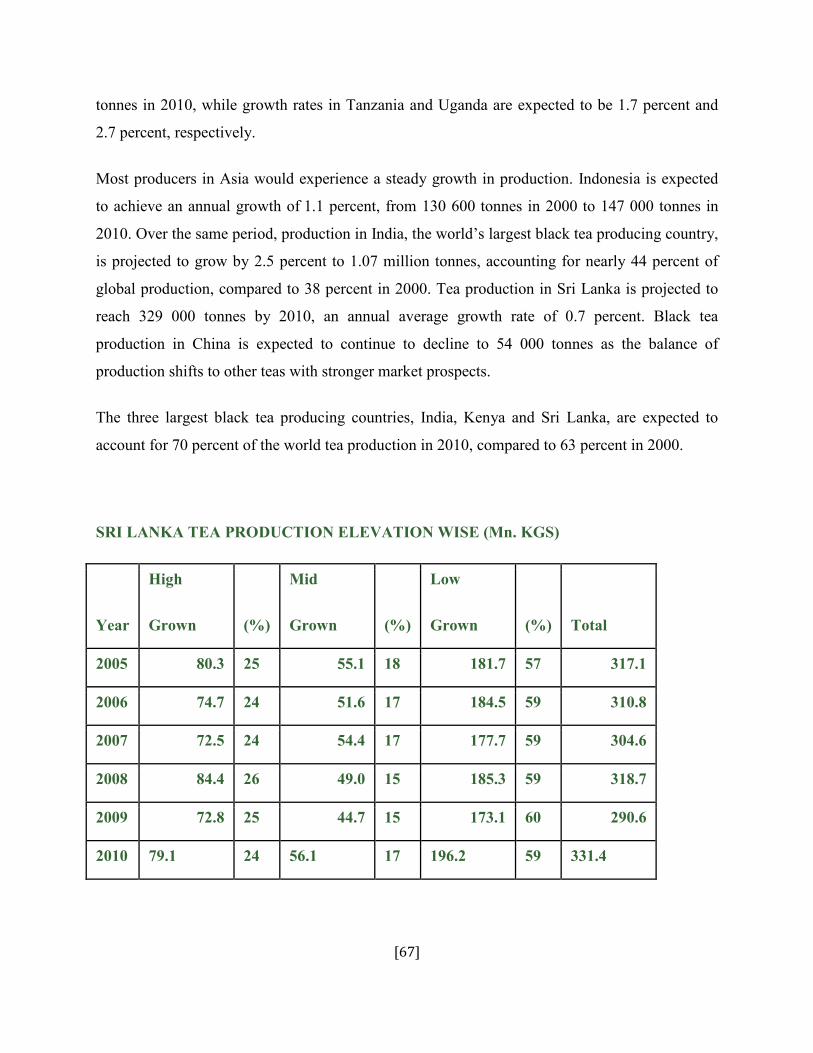
[67]
tonnes in 2010, while growth rates in Tanzania and Uganda are expected to be 1.7 percent and
2.7 percent, respectively.
Most producers in Asia would experience a steady growth in production. Indonesia is expected
to achieve an annual growth of 1.1 percent, from 130 600 tonnes in 2000 to 147 000 tonnes in
2010. Over the same period, production in India, the world’s largest black tea producing country,
is projected to grow by 2.5 percent to 1.07 million tonnes, accounting for nearly 44 percent of
global production, compared to 38 percent in 2000. Tea production in Sri Lanka is projected to
reach 329 000 tonnes by 2010, an annual average growth rate of 0.7 percent. Black tea
production in China is expected to continue to decline to 54 000 tonnes as the balance of
production shifts to other teas with stronger market prospects.
The three largest black tea producing countries, India, Kenya and Sri Lanka, are expected to
account for 70 percent of the world tea production in 2010, compared to 63 percent in 2000.
SRI LANKA TEA PRODUCTION ELEVATION WISE (Mn. KGS)
Year
High
Grown (%)
Mid
Grown (%)
Low
Grown (%) Total
2005 80.3 25 55.1 18 181.7 57 317.1
2006 74.7 24 51.6 17 184.5 59 310.8
2007 72.5 24 54.4 17 177.7 59 304.6
2008 84.4 26 49.0 15 185.3 59 318.7
2009 72.8 25 44.7 15 173.1 60 290.6
2010 79.1 24 56.1 17 196.2 59 331.4
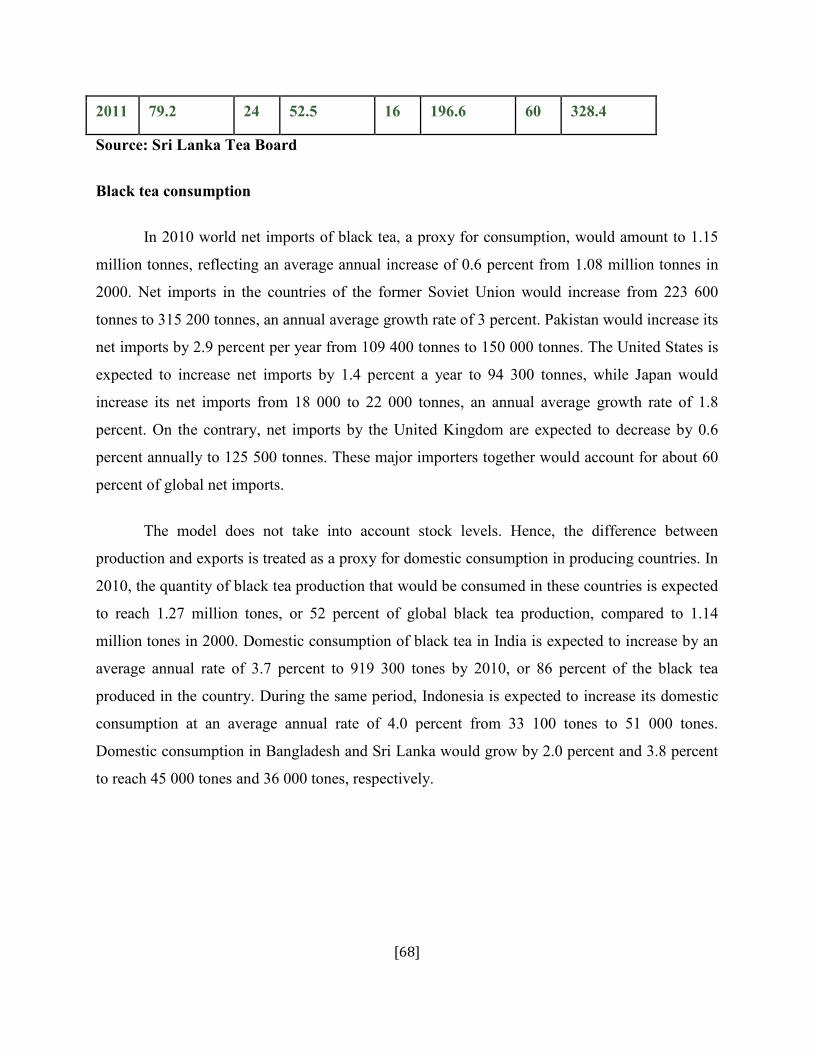
[68]
2011 79.2 24 52.5 16 196.6 60 328.4
Source: Sri Lanka Tea Board
Black tea consumption
In 2010 world net imports of black tea, a proxy for consumption, would amount to 1.15
million tonnes, reflecting an average annual increase of 0.6 percent from 1.08 million tonnes in
2000. Net imports in the countries of the former Soviet Union would increase from 223 600
tonnes to 315 200 tonnes, an annual average growth rate of 3 percent. Pakistan would increase its
net imports by 2.9 percent per year from 109 400 tonnes to 150 000 tonnes. The United States is
expected to increase net imports by 1.4 percent a year to 94 300 tonnes, while Japan would
increase its net imports from 18 000 to 22 000 tonnes, an annual average growth rate of 1.8
percent. On the contrary, net imports by the United Kingdom are expected to decrease by 0.6
percent annually to 125 500 tonnes. These major importers together would account for about 60
percent of global net imports.
The model does not take into account stock levels. Hence, the difference between
production and exports is treated as a proxy for domestic consumption in producing countries. In
2010, the quantity of black tea production that would be consumed in these countries is expected
to reach 1.27 million tones, or 52 percent of global black tea production, compared to 1.14
million tones in 2000. Domestic consumption of black tea in India is expected to increase by an
average annual rate of 3.7 percent to 919 300 tones by 2010, or 86 percent of the black tea
produced in the country. During the same period, Indonesia is expected to increase its domestic
consumption at an average annual rate of 4.0 percent from 33 100 tones to 51 000 tones.
Domestic consumption in Bangladesh and Sri Lanka would grow by 2.0 percent and 3.8 percent
to reach 45 000 tones and 36 000 tones, respectively.
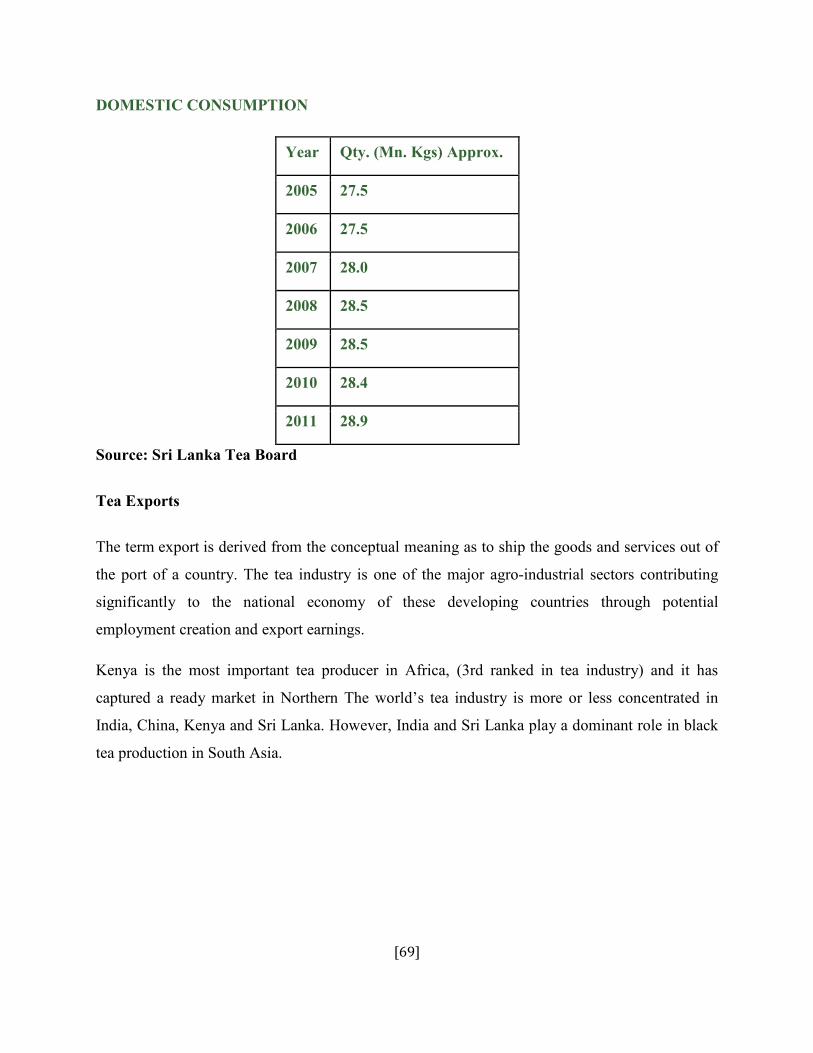
[69]
DOMESTIC CONSUMPTION
Year Qty. (Mn. Kgs) Approx.
2005 27.5
2006 27.5
2007 28.0
2008 28.5
2009 28.5
2010 28.4
2011 28.9
Source: Sri Lanka Tea Board
Tea Exports
The term export is derived from the conceptual meaning as to ship the goods and services out of
the port of a country. The tea industry is one of the major agro-industrial sectors contributing
significantly to the national economy of these developing countries through potential
employment creation and export earnings.
Kenya is the most important tea producer in Africa, (3rd ranked in tea industry) and it has
captured a ready market in Northern The world’s tea industry is more or less concentrated in
India, China, Kenya and Sri Lanka. However, India and Sri Lanka play a dominant role in black
tea production in South Asia.
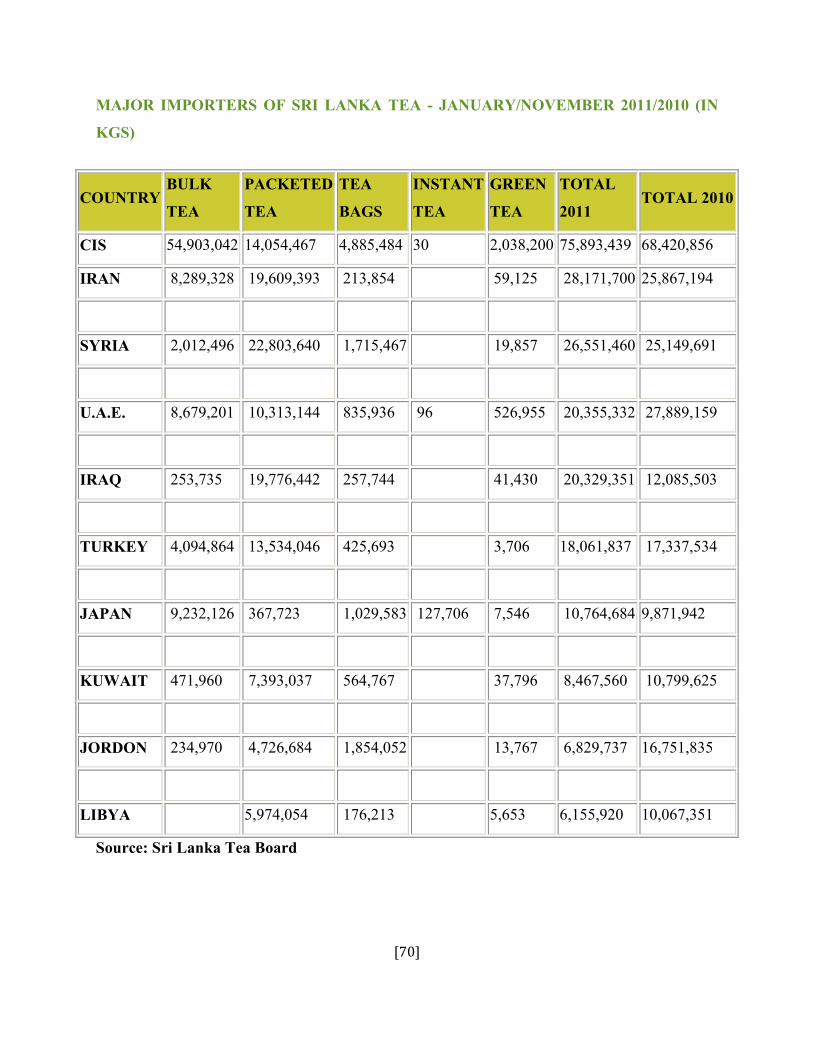
[70]
MAJOR IMPORTERS OF SRI LANKA TEA - JANUARY/NOVEMBER 2011/2010 (IN
KGS)
COUNTRY BULK
TEA
PACKETED
TEA
TEA
BAGS
INSTANT
TEA
GREEN
TEA
TOTAL
2011 TOTAL 2010
CIS 54,903,042 14,054,467 4,885,484 30 2,038,200 75,893,439 68,420,856
IRAN 8,289,328 19,609,393 213,854 59,125 28,171,700 25,867,194
SYRIA 2,012,496 22,803,640 1,715,467 19,857 26,551,460 25,149,691
U.A.E. 8,679,201 10,313,144 835,936 96 526,955 20,355,332 27,889,159
IRAQ 253,735 19,776,442 257,744 41,430 20,329,351 12,085,503
TURKEY 4,094,864 13,534,046 425,693 3,706 18,061,837 17,337,534
JAPAN 9,232,126 367,723 1,029,583 127,706 7,546 10,764,684 9,871,942
KUWAIT 471,960 7,393,037 564,767 37,796 8,467,560 10,799,625
JORDON 234,970 4,726,684 1,854,052 13,767 6,829,737 16,751,835
LIBYA 5,974,054 176,213 5,653 6,155,920 10,067,351
Source: Sri Lanka Tea Board
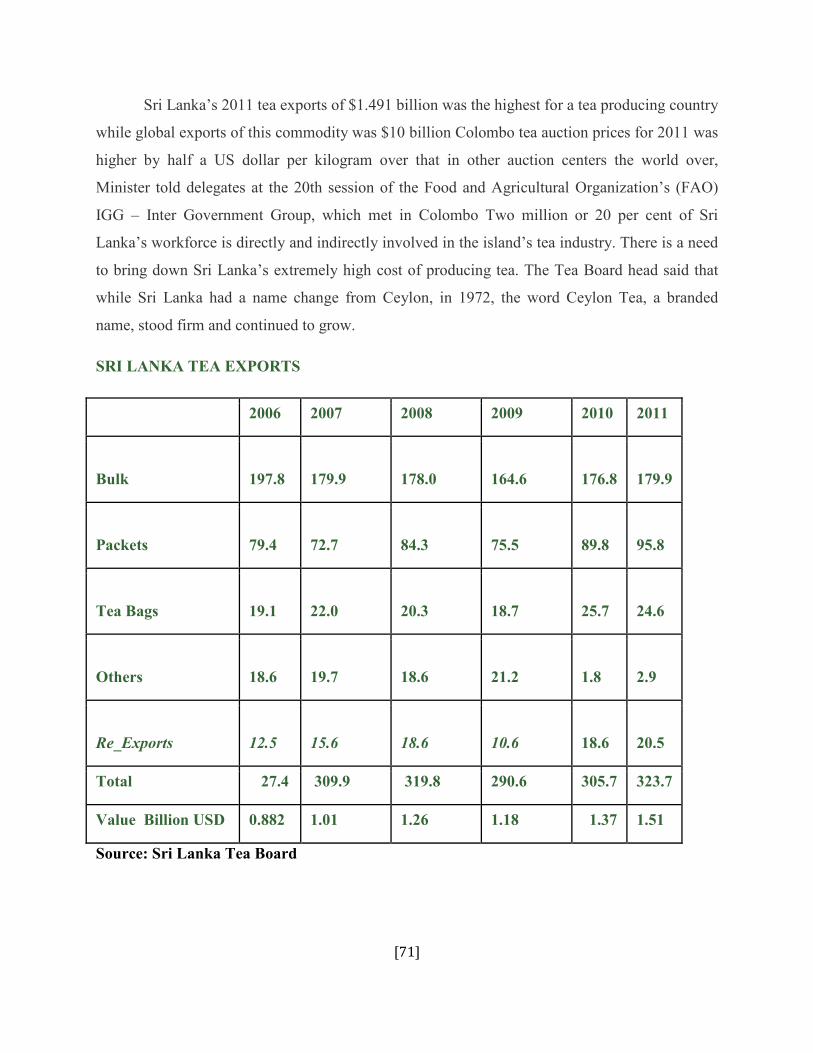
[71]
Sri Lanka’s 2011 tea exports of $1.491 billion was the highest for a tea producing country
while global exports of this commodity was $10 billion Colombo tea auction prices for 2011 was
higher by half a US dollar per kilogram over that in other auction centers the world over,
Minister told delegates at the 20th session of the Food and Agricultural Organization’s (FAO)
IGG – Inter Government Group, which met in Colombo Two million or 20 per cent of Sri
Lanka’s workforce is directly and indirectly involved in the island’s tea industry. There is a need
to bring down Sri Lanka’s extremely high cost of producing tea. The Tea Board head said that
while Sri Lanka had a name change from Ceylon, in 1972, the word Ceylon Tea, a branded
name, stood firm and continued to grow.
SRI LANKA TEA EXPORTS
2006 2007 2008 2009 2010 2011
Bulk
197.8
179.9
178.0
164.6 176.8 179.9
Packets
79.4
72.7
84.3
75.5 89.8 95.8
Tea Bags
19.1
22.0
20.3
18.7 25.7 24.6
Others
18.6
19.7
18.6
21.2 1.8 2.9
Re_Exports
12.5
15.6
18.6 10.6 18.6 20.5
Total 27.4 309.9 319.8 290.6 305.7 323.7
Value Billion USD 0.882 1.01 1.26 1.18 1.37 1.51
Source: Sri Lanka Tea Board
[72]
Black tea exports
World black tea exports in 2010 are projected at 1.14 million tonnes, reflecting an average
annual increase of 1.1 percent from 1 million tonnes in 2000.
Most of this increase would take place in Africa, where production is likely to continue to grow
while domestic consumption remains small. Exports from Kenya would increase by 2.6 percent
annually from 208 200 tonnes in 2000 to 275 000 tonnes in 2010, giving Kenya 32 percent of
global exports. Over the same period, export availability in Malawi would remain unchanged at
38 000 tonnes.
Most major tea exporting countries in Asia are expected to experience slight declines in exports
in line with expected growth in income and population that would foster domestic consumption.
For example, exports from India and Indonesia would decrease by 2.4 percent to 150 890 tonnes
and by 1.1 percent to 87 000 tonnes, respectively. Conversely, exports from Sri Lanka would
increase from 281 000 tonnes to 293 400 tonnes, an annual average growth rate of 0.4 percent.
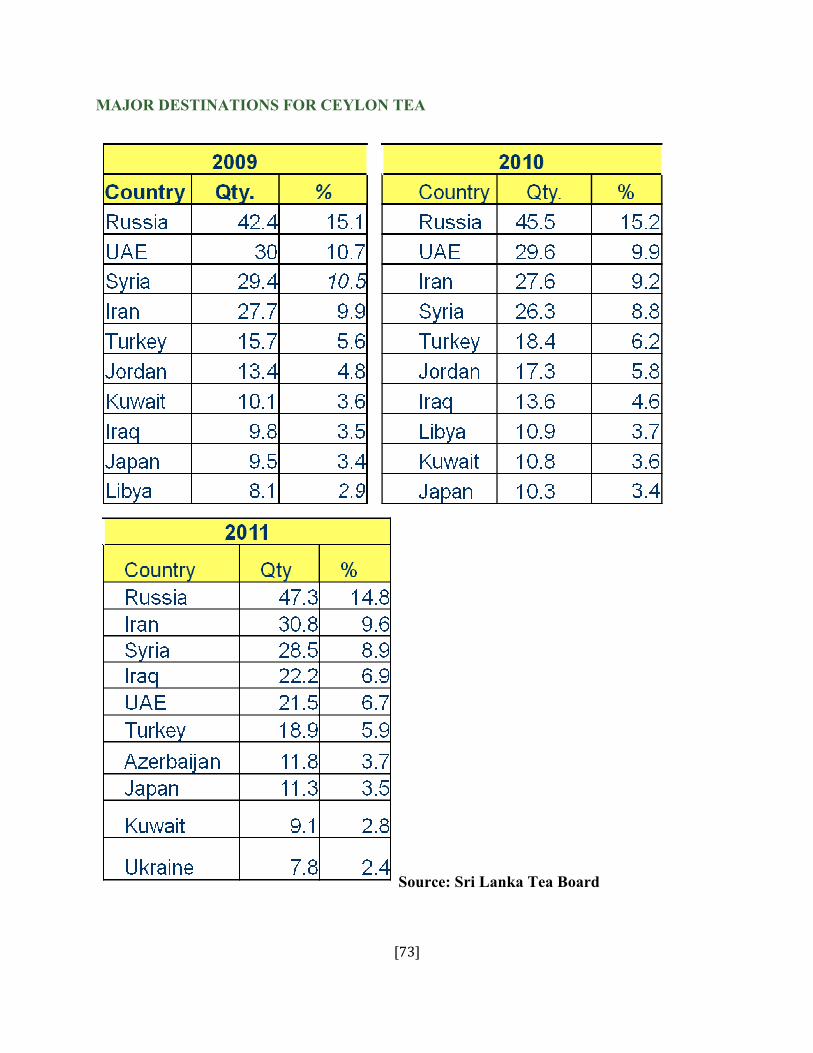
[73]
MAJOR DESTINATIONS FOR CEYLON TEA
Source: Sri Lanka Tea Board
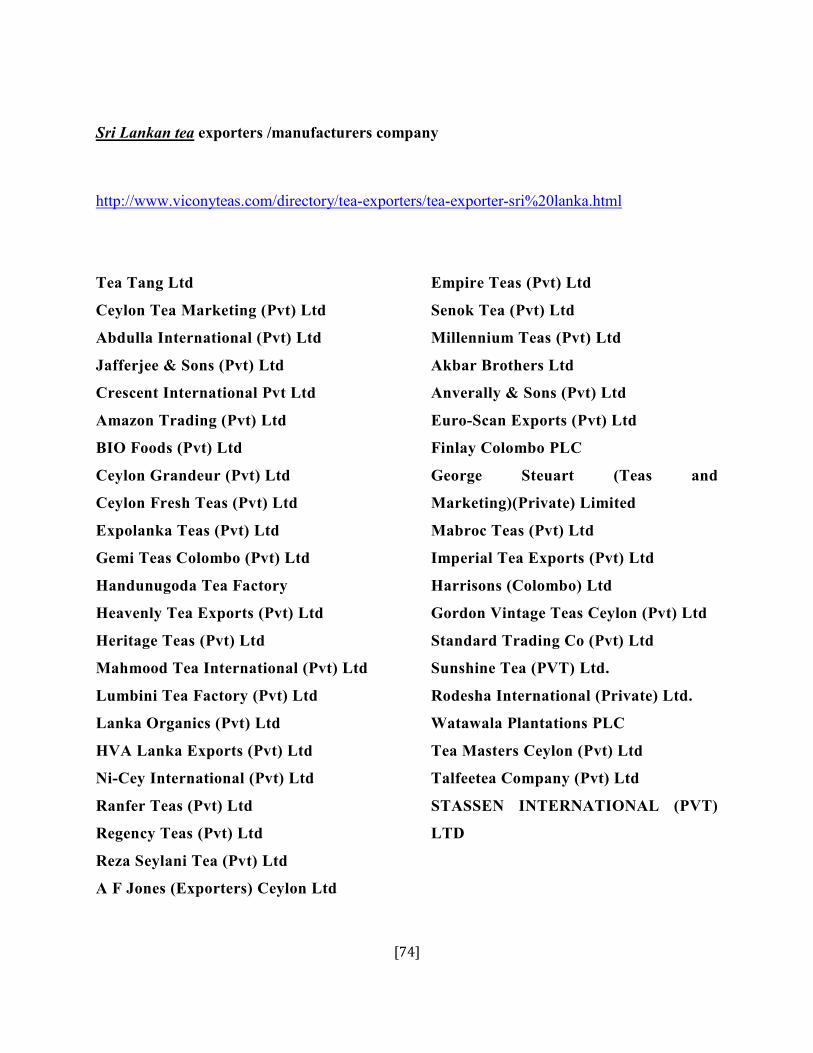
[74]
Sri Lankan tea exporters /manufacturers company
http://www.viconyteas.com/directory/tea-exporters/tea-exporter-sri%20lanka.html
Company name:
Tea Tang Ltd
Ceylon Tea Marketing (Pvt) Ltd
Abdulla International (Pvt) Ltd
Jafferjee & Sons (Pvt) Ltd
Crescent International Pvt Ltd
Amazon Trading (Pvt) Ltd
BIO Foods (Pvt) LtdCompany name:
Ceylon Grandeur (Pvt) Ltd
Ceylon Fresh Teas (Pvt) Ltd
Expolanka Teas (Pvt) Ltd
Gemi Teas Colombo (Pvt) Ltd
Handunugoda Tea Factory
Heavenly Tea Exports (Pvt) Ltd
Heritage Teas (Pvt) Ltd
Mahmood Tea International (Pvt) Ltd
Lumbini Tea Factory (Pvt) Ltd
Lanka Organics (Pvt) Ltd
HVA Lanka Exports (Pvt) Ltd
Ni-Cey International (Pvt) Ltd
Ranfer Teas (Pvt) Ltd
Regency Teas (Pvt) Ltd
Reza Seylani Tea (Pvt) Ltd
A F Jones (Exporters) Ceylon Ltd
Empire Teas (Pvt) Ltd
Senok Tea (Pvt) Ltd
Millennium Teas (Pvt) Ltd
Akbar Brothers Ltd
Anverally & Sons (Pvt) Ltd
Euro-Scan Exports (Pvt) Ltd
Finlay Colombo PLC
George Steuart (Teas and
Marketing)(Private) Limited
Mabroc Teas (Pvt) Ltd
Imperial Tea Exports (Pvt) Ltd
Harrisons (Colombo) Ltd
Gordon Vintage Teas Ceylon (Pvt) Ltd
Standard Trading Co (Pvt) Ltd
Sunshine Tea (PVT) Ltd.
Rodesha International (Private) Ltd.
Watawala Plantations PLC
Tea Masters Ceylon (Pvt) Ltd
Talfeetea Company (Pvt) Ltd
STASSEN INTERNATIONAL (PVT)
LTD
[75]
Introduction: Tea Industry in India
The tea industry has an important and special place in the Indian economy. India’s primary
beverage is tea, with almost 85% of total households in the India consuming tea. India is the
world’s second largest producer after China and second largest consumer of tea, with India
accounting for 25‐27% of world tea production. India’s family expenditure on beverages and
processed foods accounts for 8% of food expenditure in rural areas, and 15% in urban areas.
India is also an important tea exporter, accounting for around 10‐12% of world tea exports.
However India’s share in world tea exports has declined from 21% in 1990. Further, only in
India certain varieties of tea are grown like Darjeeling and are in great demand across the world.
All Darjeeling teas possess the lightness of flavour and fine colouring that set them apart from all
other teas.
According to statistics released by the Government of India, India’s tea exports were estimated at
Rs. 23,764 million during 11MFY2009 (April 2008‐February 2009), accounting for 0.34% of
India’s exports. The share has been declined from 1.1% in FY2000. Statistics released by the
TBI (Tea Board India) for 2008 (January‐December 2008) indicate tea exports of 203 mkg
(million kg) valued at Rs. 23,929 million. In terms of employment, the tea industry employs
around 1.26 million people at tea plantations, and 2 million people indirectly, of which 50% are
women. The last fact is particularly important when we consider that tea industry, to a large
extent, drives the economies of regions such as Assam (average employment of 0.6 million), and
Nilgiris (average employment of 0.24 million). With estimated consumption of 802 mkg in 2008,
tea is the prime beverage consumed in India, and domestic private final consumption expenditure
(PFCE) on tea, coffee and cocoa aggregated Rs. 69.16 billion in FY2008, accounting for around
0.3% of India’s PFCE. Around 88% for India’s consumption of stimulants (tea, coffee, and
cocoa beans) for Tea accounts, followed by coffee (10%), and cocoa beans (1.7%). In value
terms, consumption of these beverages peaked at Rs. 115.43 billion in FY2008, and has declined
in recent years caused by higher prices, and a shift in consumer preferences towards cold
beverages.
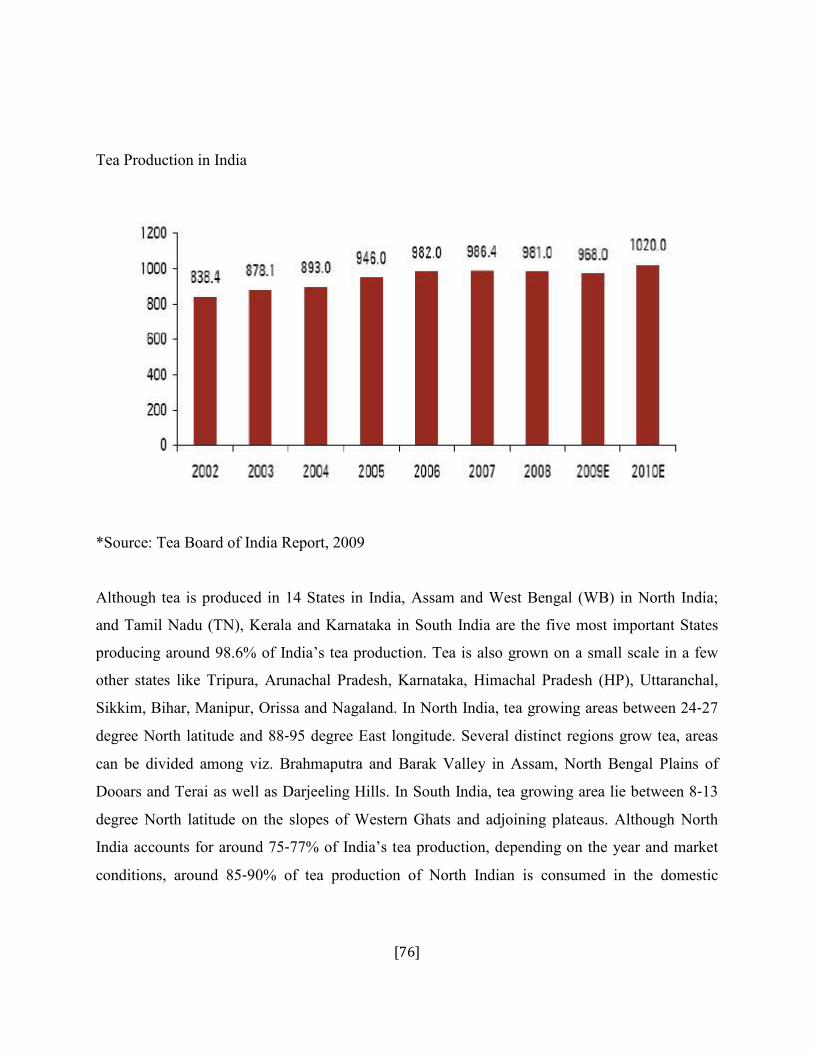
[76]
Tea Production in India
*Source: Tea Board of India Report, 2009
Although tea is produced in 14 States in India, Assam and West Bengal (WB) in North India;
and Tamil Nadu (TN), Kerala and Karnataka in South India are the five most important States
producing around 98.6% of India’s tea production. Tea is also grown on a small scale in a few
other states like Tripura, Arunachal Pradesh, Karnataka, Himachal Pradesh (HP), Uttaranchal,
Sikkim, Bihar, Manipur, Orissa and Nagaland. In North India, tea growing areas between 24‐27
degree North latitude and 88‐95 degree East longitude. Several distinct regions grow tea, areas
can be divided among viz. Brahmaputra and Barak Valley in Assam, North Bengal Plains of
Dooars and Terai as well as Darjeeling Hills. In South India, tea growing area lie between 8‐13
degree North latitude on the slopes of Western Ghats and adjoining plateaus. Although North
India accounts for around 75‐77% of India’s tea production, depending on the year and market
conditions, around 85‐90% of tea production of North Indian is consumed in the domestic
[77]
market. The balance, much of it of high quality, is exported. Although South India accounts for
around 23‐25% of India’s tea production, around 30‐50% of its production is exported.
Depending on the year, South India accounts for around 50% of India’s tea exports by volume
Objectives and Scope
Having determined the importance of the tea industry in the Indian industry, we also realized that
Export is essential for the sustenance of this industry. We shall elaborate on later, Indian tea
export has been losing out to competition from Kenya, Sri Lanka, China and other new‐age tea
exporting nations. It is in this point of view that it is extremely important for us to search out new
markets.
Where we can have a competitive edge. Thus in this report we try to analyses the European
Unionmember nations as potential markets where we can find a niche for ourselves.
The scope of this project thus includes an in depth view of the prevailing conditions in each of
the EU member nations that India exports tea to. This includes an analysis of current market
trends in consumption, consumer preferences and competitive environment. The attempt has
been made to analyses the opportunities and threats thus afforded by each of these markets for
Indian tea exports units.
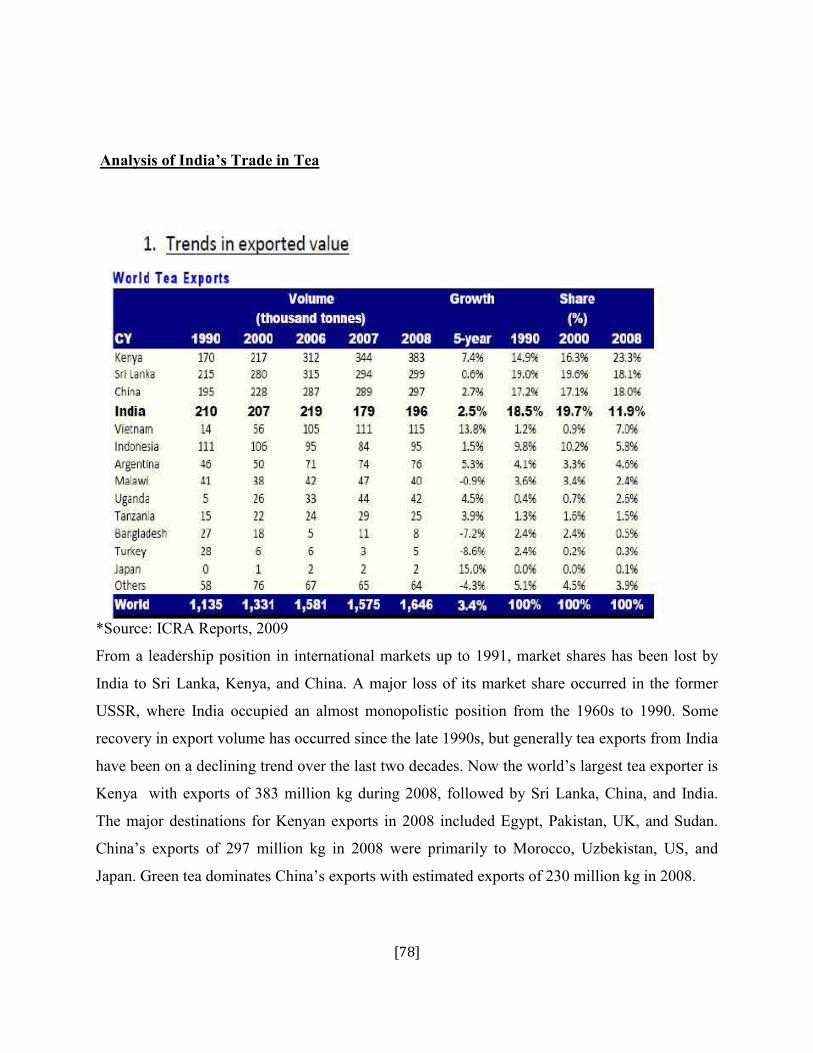
[78]
Analysis of India’s Trade in Tea
*Source: ICRA Reports, 2009
From a leadership position in international markets up to 1991, market shares has been lost by
India to Sri Lanka, Kenya, and China. A major loss of its market share occurred in the former
USSR, where India occupied an almost monopolistic position from the 1960s to 1990. Some
recovery in export volume has occurred since the late 1990s, but generally tea exports from India
have been on a declining trend over the last two decades. Now the world’s largest tea exporter is
Kenya with exports of 383 million kg during 2008, followed by Sri Lanka, China, and India.
The major destinations for Kenyan exports in 2008 included Egypt, Pakistan, UK, and Sudan.
China’s exports of 297 million kg in 2008 were primarily to Morocco, Uzbekistan, US, and
Japan. Green tea dominates China’s exports with estimated exports of 230 million kg in 2008.
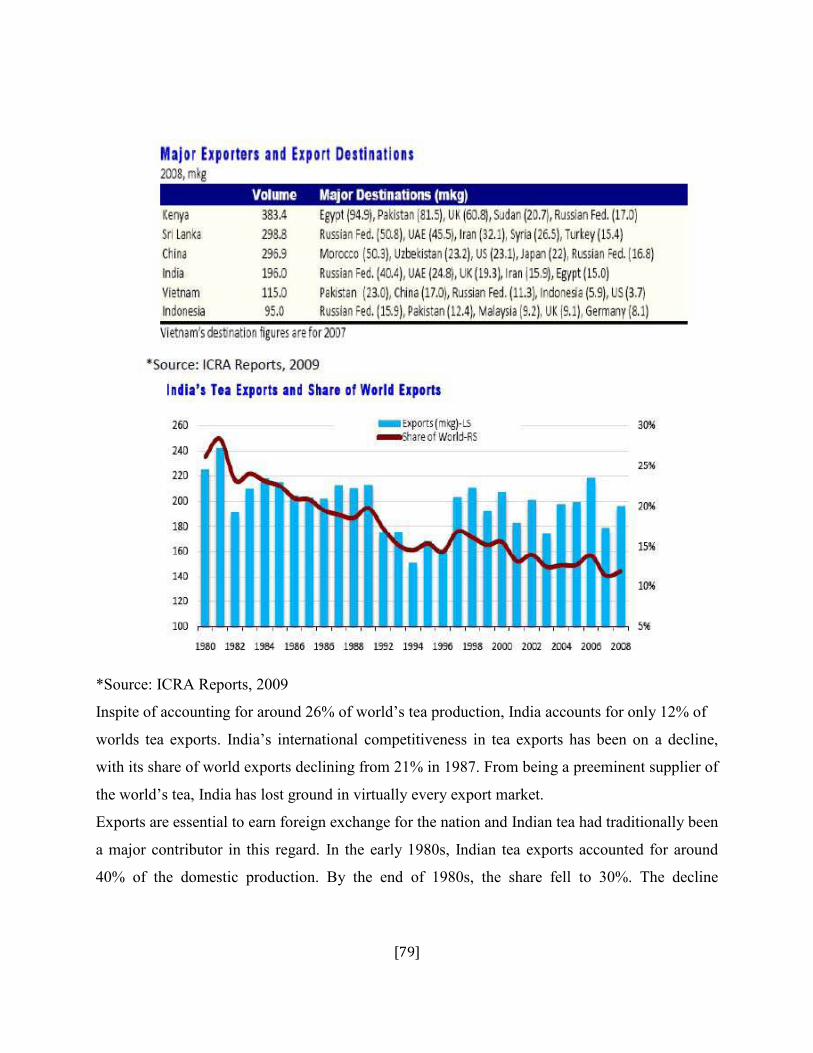
[79]
*Source: ICRA Reports, 2009
Inspite of accounting for around 26% of world’s tea production, India accounts for only 12% of
worlds tea exports. India’s international competitiveness in tea exports has been on a decline,
with its share of world exports declining from 21% in 1987. From being a preeminent supplier of
the world’s tea, India has lost ground in virtually every export market.
Exports are essential to earn foreign exchange for the nation and Indian tea had traditionally been
a major contributor in this regard. In the early 1980s, Indian tea exports accounted for around
40% of the domestic production. By the end of 1980s, the share fell to 30%. The decline
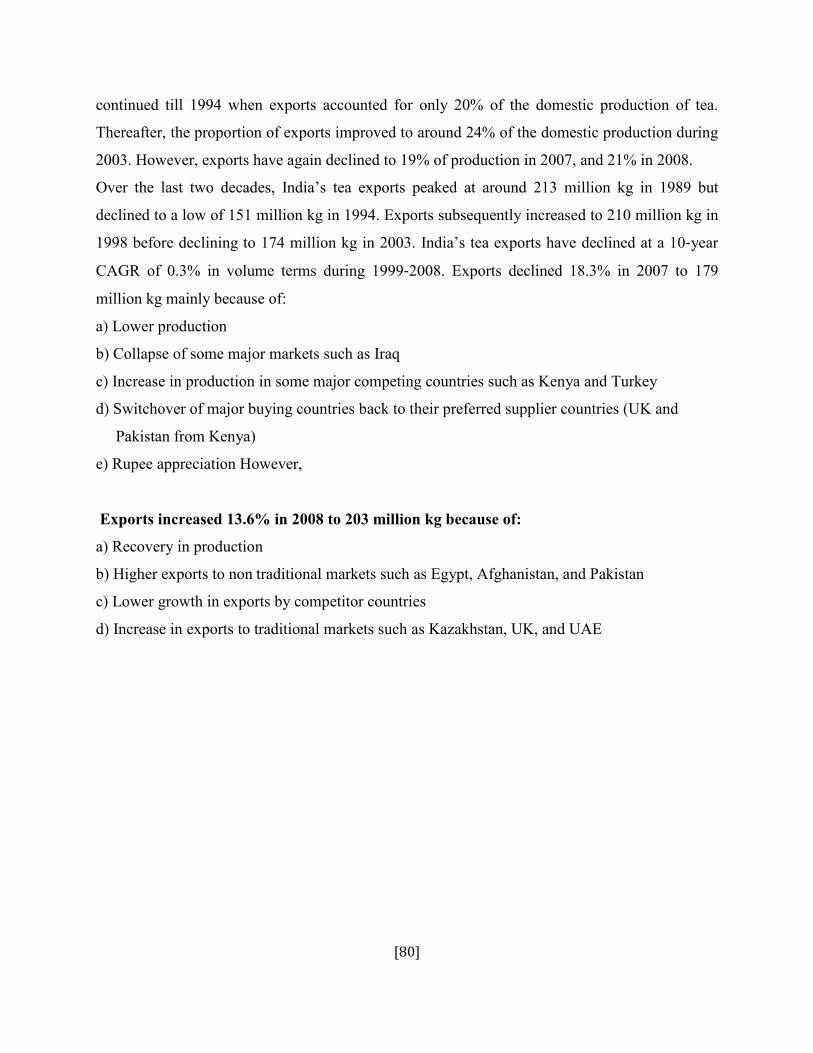
[80]
continued till 1994 when exports accounted for only 20% of the domestic production of tea.
Thereafter, the proportion of exports improved to around 24% of the domestic production during
2003. However, exports have again declined to 19% of production in 2007, and 21% in 2008.
Over the last two decades, India’s tea exports peaked at around 213 million kg in 1989 but
declined to a low of 151 million kg in 1994. Exports subsequently increased to 210 million kg in
1998 before declining to 174 million kg in 2003. India’s tea exports have declined at a 10‐year
CAGR of 0.3% in volume terms during 1999‐2008. Exports declined 18.3% in 2007 to 179
million kg mainly because of:
a) Lower production
b) Collapse of some major markets such as Iraq
c) Increase in production in some major competing countries such as Kenya and Turkey
d) Switchover of major buying countries back to their preferred supplier countries (UK and
Pakistan from Kenya)
e) Rupee appreciation However,
Exports increased 13.6% in 2008 to 203 million kg because of:
a) Recovery in production
b) Higher exports to non traditional markets such as Egypt, Afghanistan, and Pakistan
c) Lower growth in exports by competitor countries
d) Increase in exports to traditional markets such as Kazakhstan, UK, and UAE
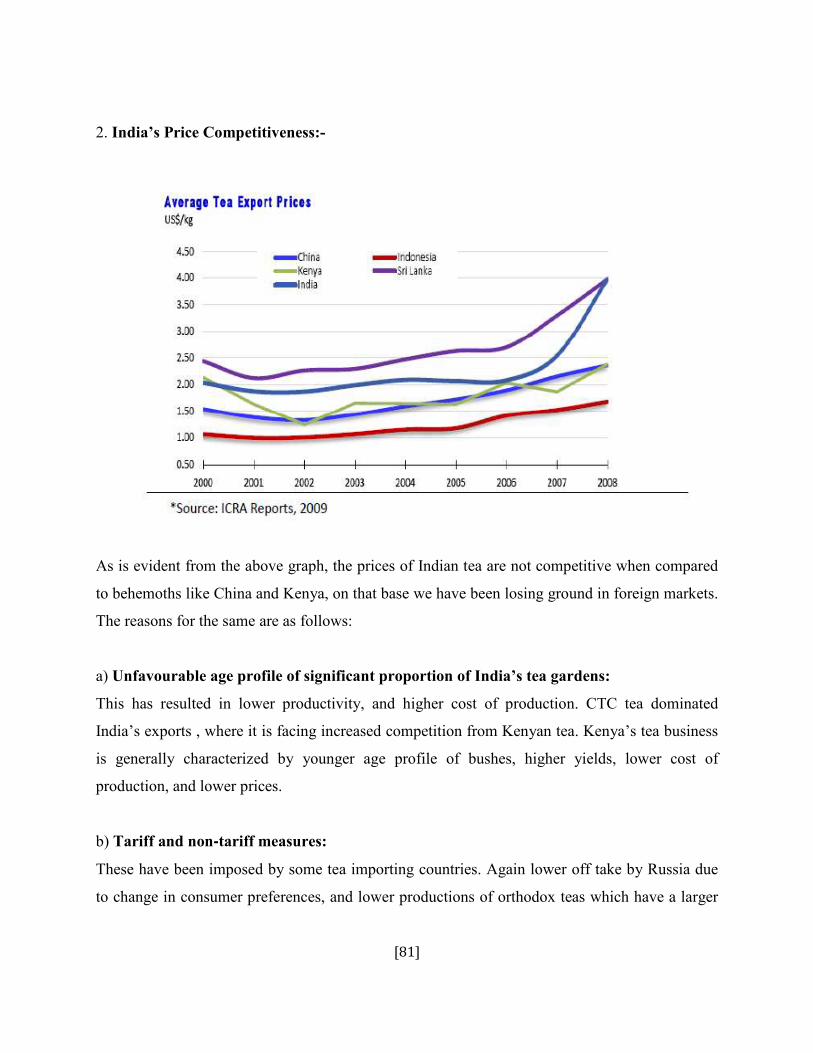
[81]
2. India’s Price Competitiveness:-
As is evident from the above graph, the prices of Indian tea are not competitive when compared
to behemoths like China and Kenya, on that base we have been losing ground in foreign markets.
The reasons for the same are as follows:
a) Unfavourable age profile of significant proportion of India’s tea gardens:
This has resulted in lower productivity, and higher cost of production. CTC tea dominated
India’s exports , where it is facing increased competition from Kenyan tea. Kenya’s tea business
is generally characterized by younger age profile of bushes, higher yields, lower cost of
production, and lower prices.
b) Tariff and non‐‐‐‐tariff measures:
These have been imposed by some tea importing countries. Again lower off take by Russia due
to change in consumer preferences, and lower productions of orthodox teas which have a larger
[82]
demand worldwide are other causes of the decline. This resulted in the emergence of Sri Lanka
and Indonesia as major exporters, primarily because of their ability to supply good quality
orthodox tea.
c) Changing Consumer Preferences:
Traditionally, loose standard BT was the most common format of consumption and import.
However, since the 1990s, changing consumer preferences in major importing countries such as
UK and Russia have been resulted in higher growth for tea bags vis‐a‐versa loose tea. In Russia,
tea bags are preferred by the working class, and consumption in this form has grown. This has
favored Sri Lankan tea in Russia.
d) Shift in India’s production:
The shift in production from orthodox to CTC tea is another cause. By comparison, other
competing countries have continued to produce their respective traditional types of tea,
maintaining consistency of type of supplies to their export destinations.
e) Decline in quality:
This has been caused by mushrooming BLFs which produce cheap quality tea by buying and
processing green leaf from small growers. The growing share of poor quality tea produced by
these players not only affects the domestic price levels but also damages the quality perception
of Indian tea in the export markets. Further, blending of Indian teas with cheaper varieties and
export of the same as Indian tea has also impaired the quality perception.
f) Spurious varieties:
Lower quality of teas that are often passed on as Darjeeling tea. Because of its proximity, some
Darjeeling tea producers are bringing in green leaf from gardens in Nepal and selling them as
`Darjeeling tea’, thereby jeopardizing the geographical indication value of Darjeeling tea.
g) Lack of marketing initiatives:
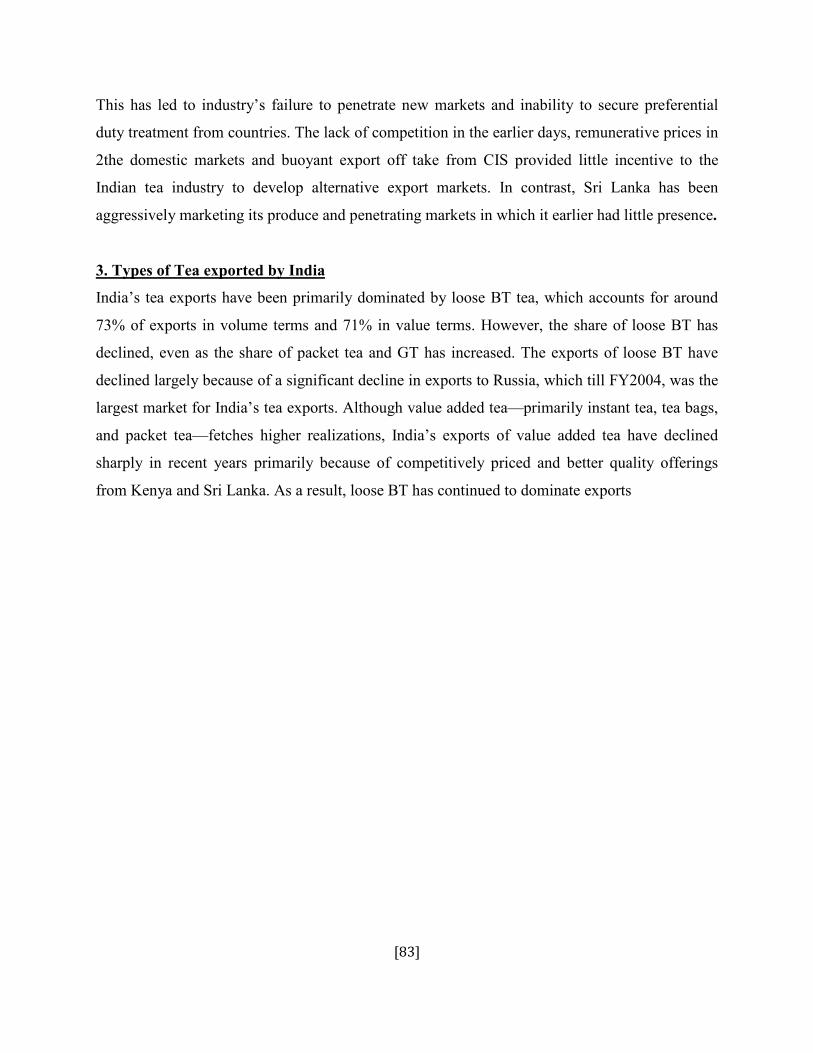
[83]
This has led to industry’s failure to penetrate new markets and inability to secure preferential
duty treatment from countries. The lack of competition in the earlier days, remunerative prices in
2the domestic markets and buoyant export off take from CIS provided little incentive to the
Indian tea industry to develop alternative export markets. In contrast, Sri Lanka has been
aggressively marketing its produce and penetrating markets in which it earlier had little presence.
3. Types of Tea exported by India
India’s tea exports have been primarily dominated by loose BT tea, which accounts for around
73% of exports in volume terms and 71% in value terms. However, the share of loose BT has
declined, even as the share of packet tea and GT has increased. The exports of loose BT have
declined largely because of a significant decline in exports to Russia, which till FY2004, was the
largest market for India’s tea exports. Although value added tea—primarily instant tea, tea bags,
and packet tea—fetches higher realizations, India’s exports of value added tea have declined
sharply in recent years primarily because of competitively priced and better quality offerings
from Kenya and Sri Lanka. As a result, loose BT has continued to dominate exports
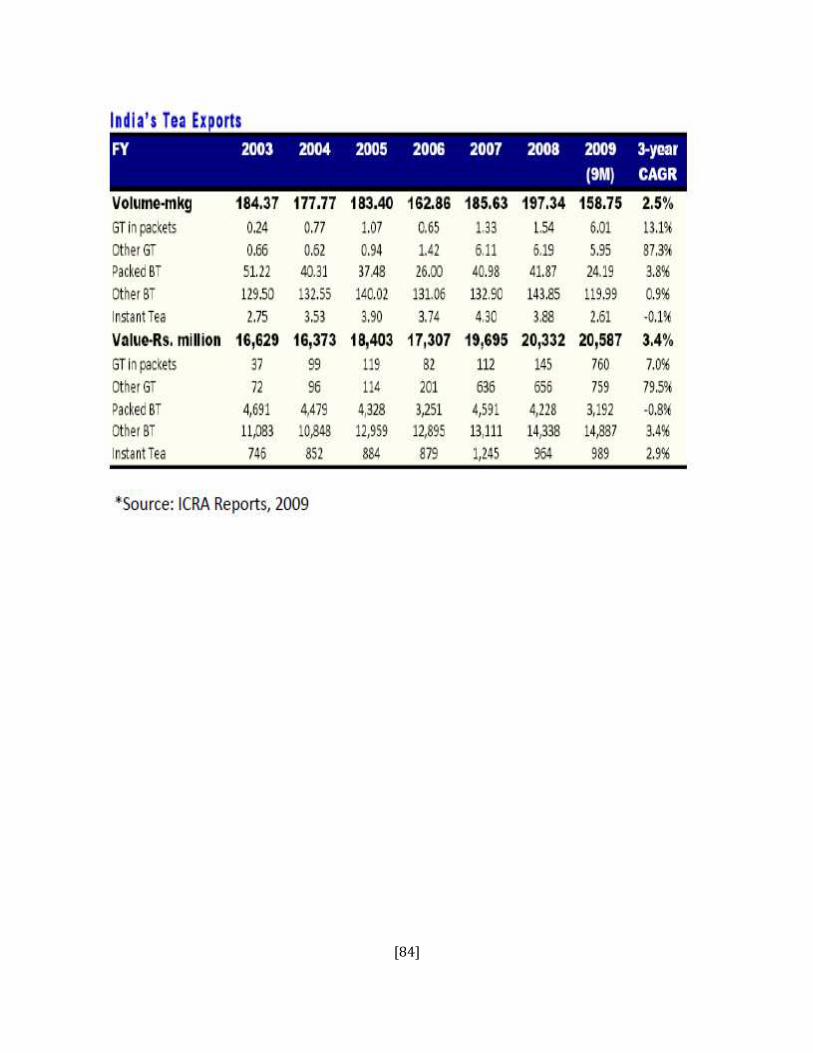
[84]
[85]
Indian Tea
Tea is indigenous to India and is an area where the country can take a lot of pride. This is mainly
because of its pre-eminence as a foreign exchange earner and its contributions to the country's
GNP.
In all aspects of tea production, consumption and export, India has emerged to be the world
leader, mainly because it accounts for 31% of global production. It is perhaps the only industry
where India has retained its leadership over the last 150 years.
[86]
The range of tea offered by India - from the original Orthodox to CTC and Green Tea, from
the aroma and flavor of Darjeeling Tea to the strong Assam and Nilgiri Tea- remains
unparalleled in the world.
Here are some statistical facts about the Indian Tea Industry:
The total turnover of the tea industry is around Rs. 10,000 crores.
Since independence tea production has grown over 250%, while land area has
just grown by 40%.
There has been a considerable increase in export too in the past few years.
Total net foreign exchange earned per annum is around Rs. 1847 crores.
The labour intensive tea industry directly employs over 1.1 million workers
and generates income for another 10 million people approximately. Women
constitute 50% of the workforce.
• Tea trading in the domestic market is done in two ways- Auction and Private Selling.
Market Reports are received from the six major auction centers in India, namely,
Calcutta, Guwahati, Siliguri, Cochin, Coonoor, Coimbatore. Bulk trading is done through
the auctions held in these centre.
• The main economic sectors of the country are tourism, tea export, apparel, textile, rice ...
Tea industry: File:Sri Lanka-Tea plantation.
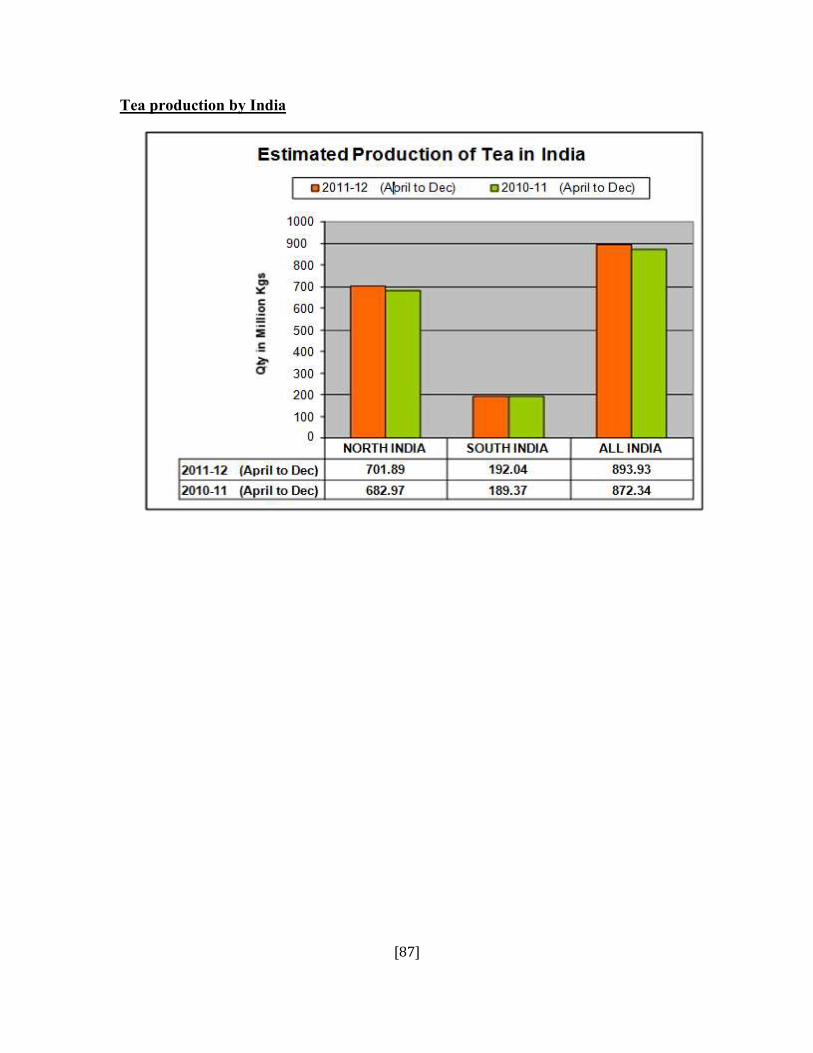
[87]
Tea production by India
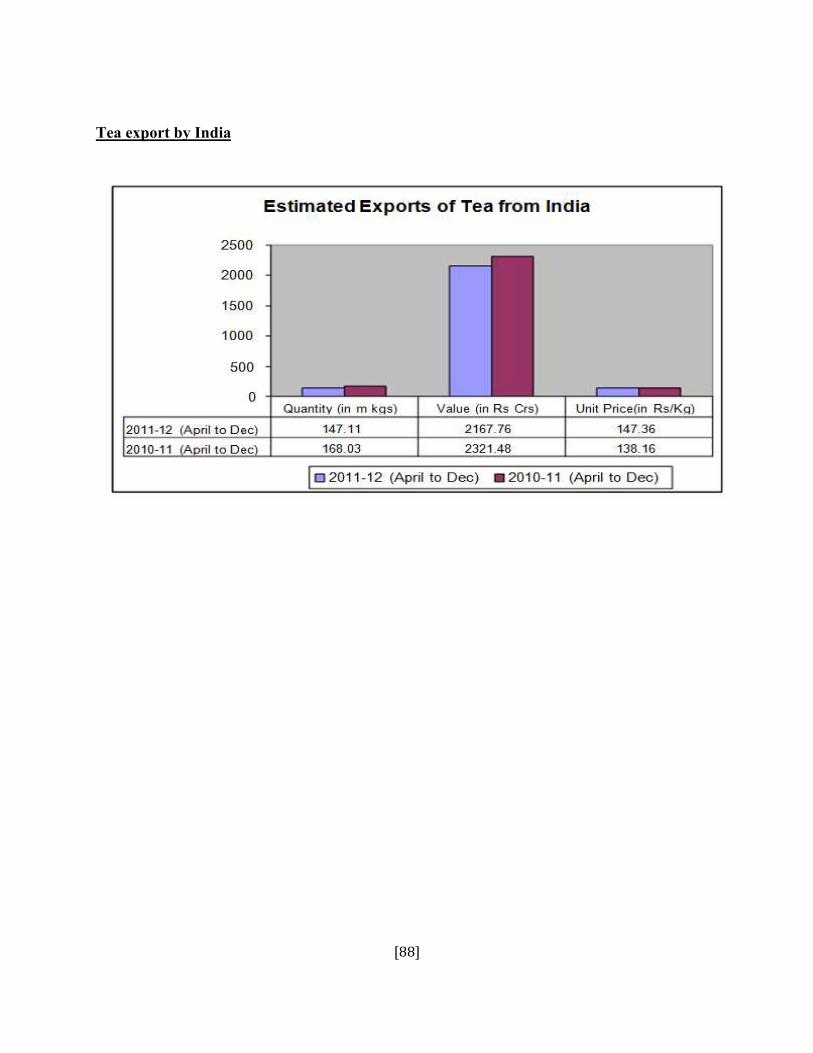
[88]
Tea export by India
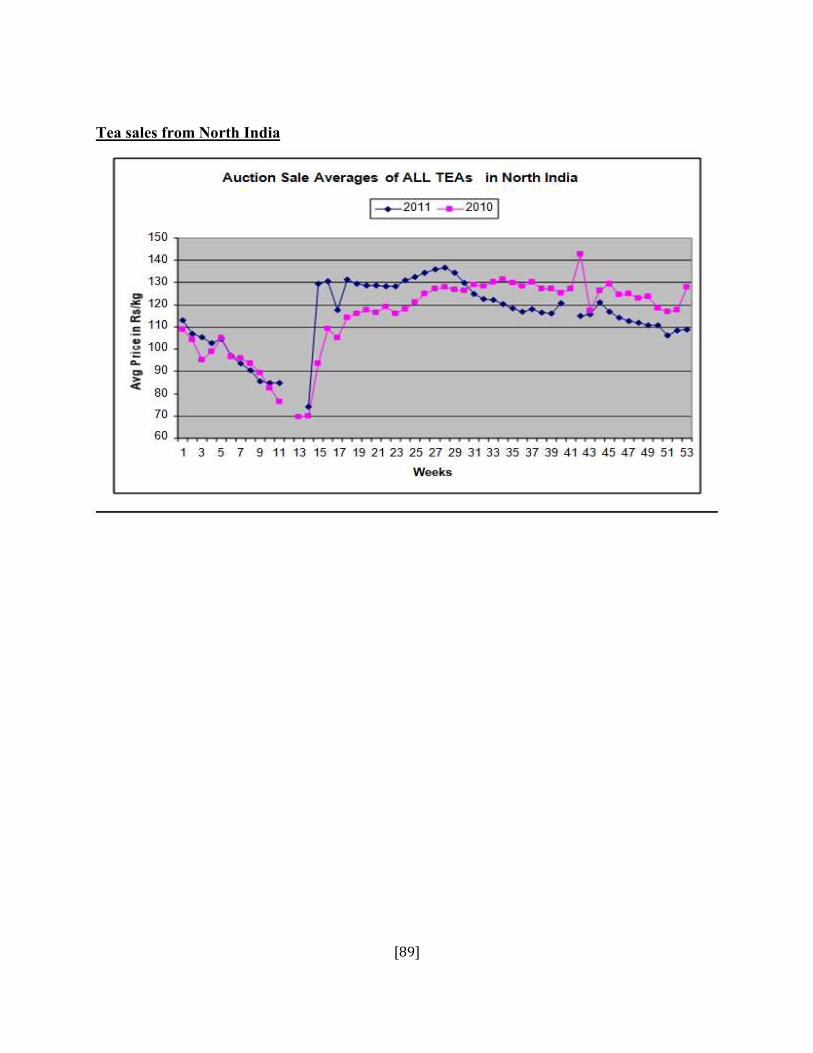
[89]
Tea sales from North India
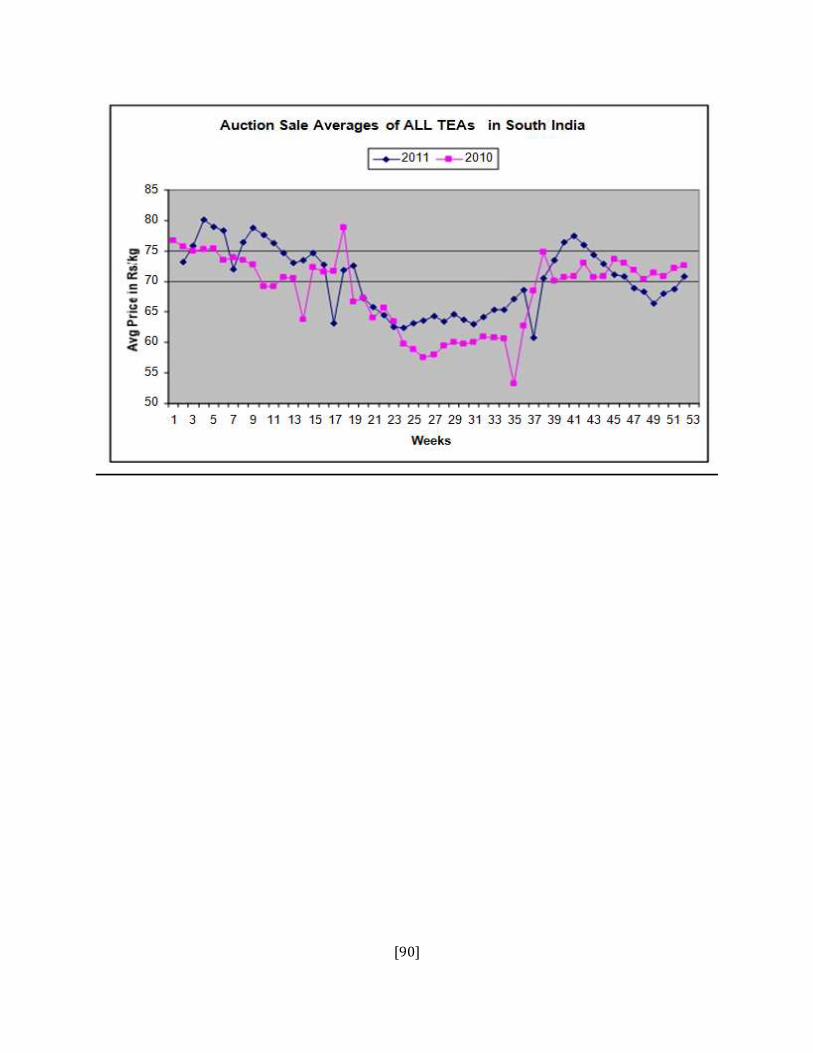
[90]
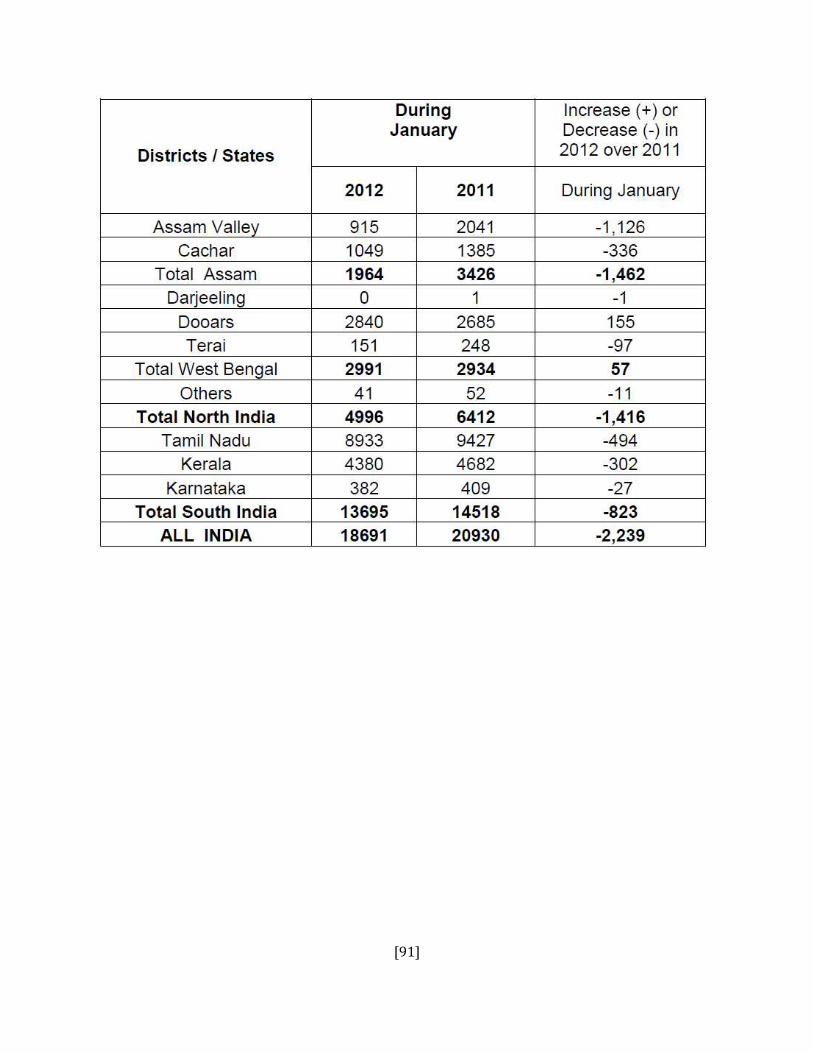
[91]
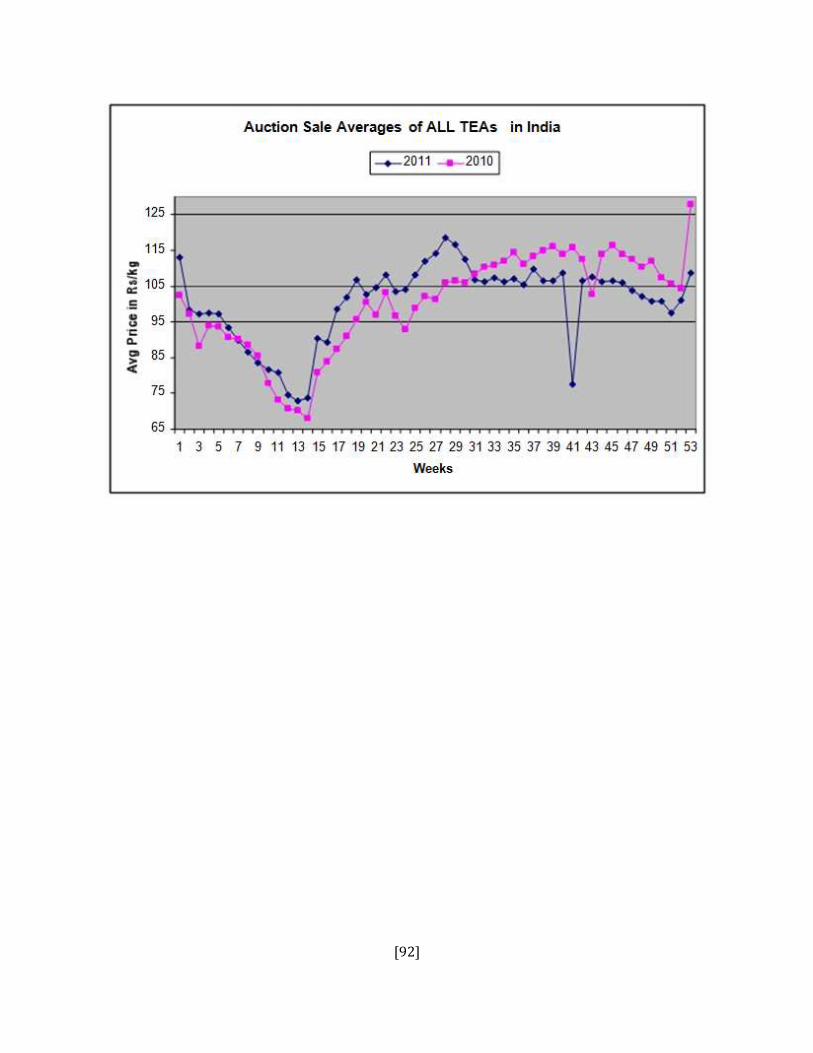
[92]
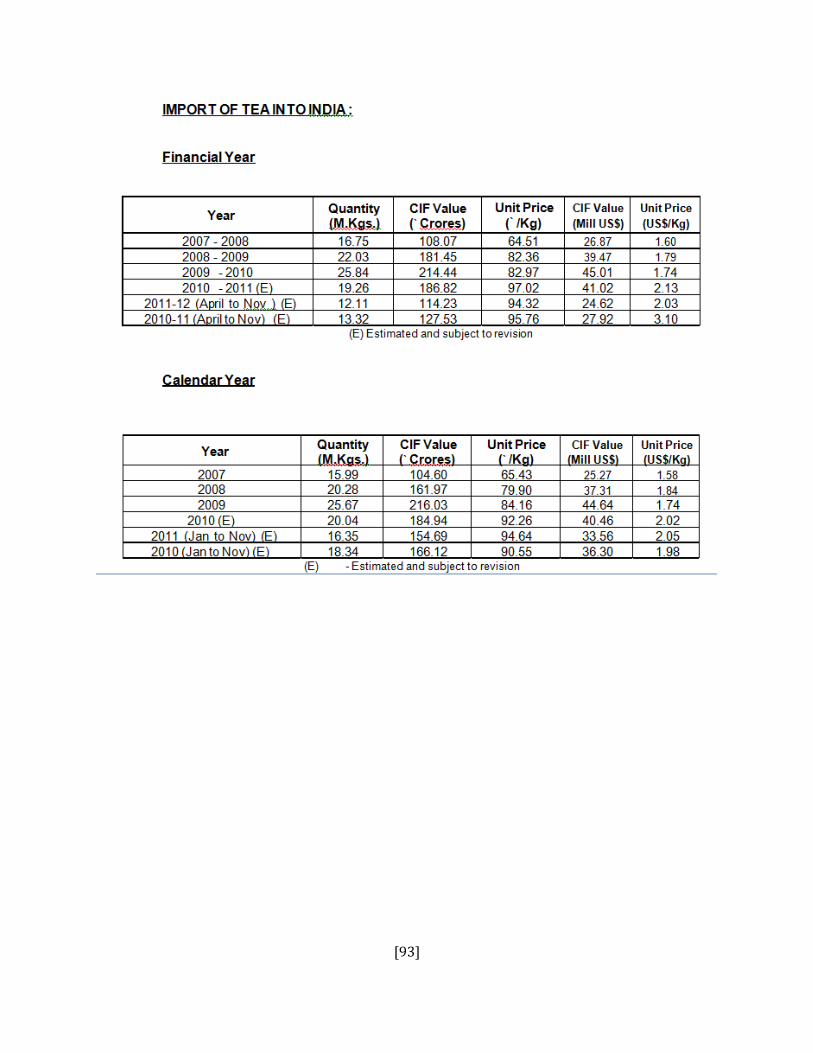
[93]
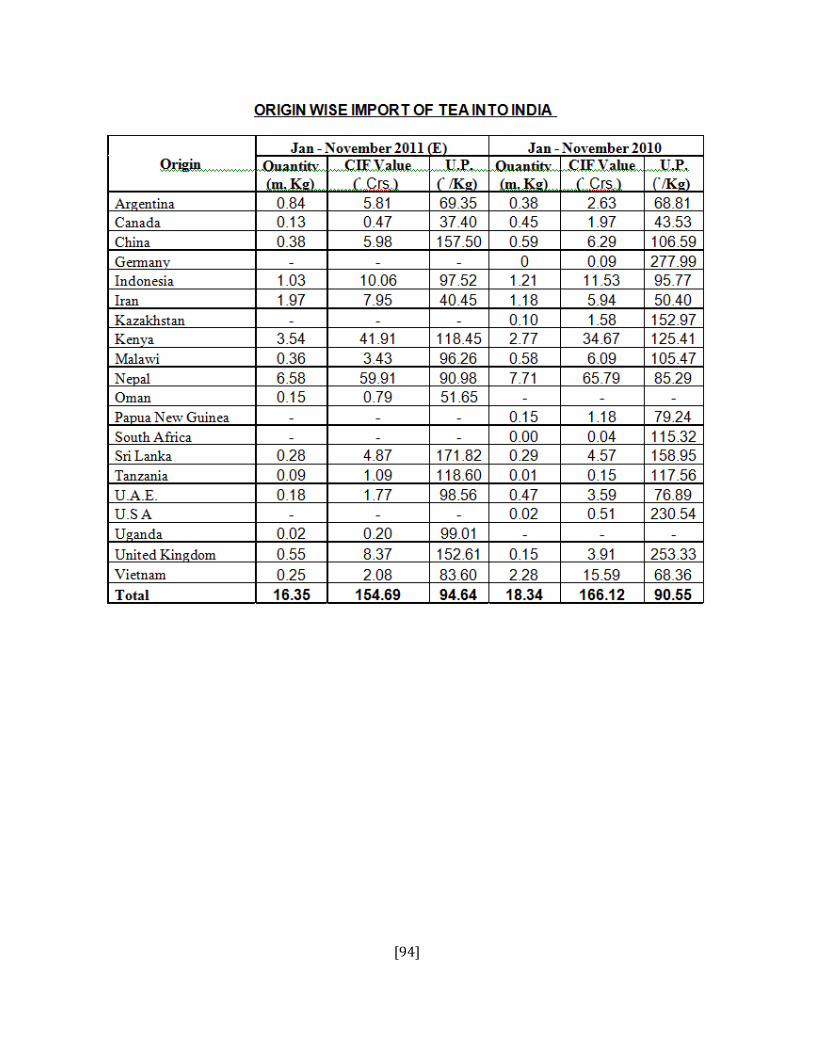
[94]
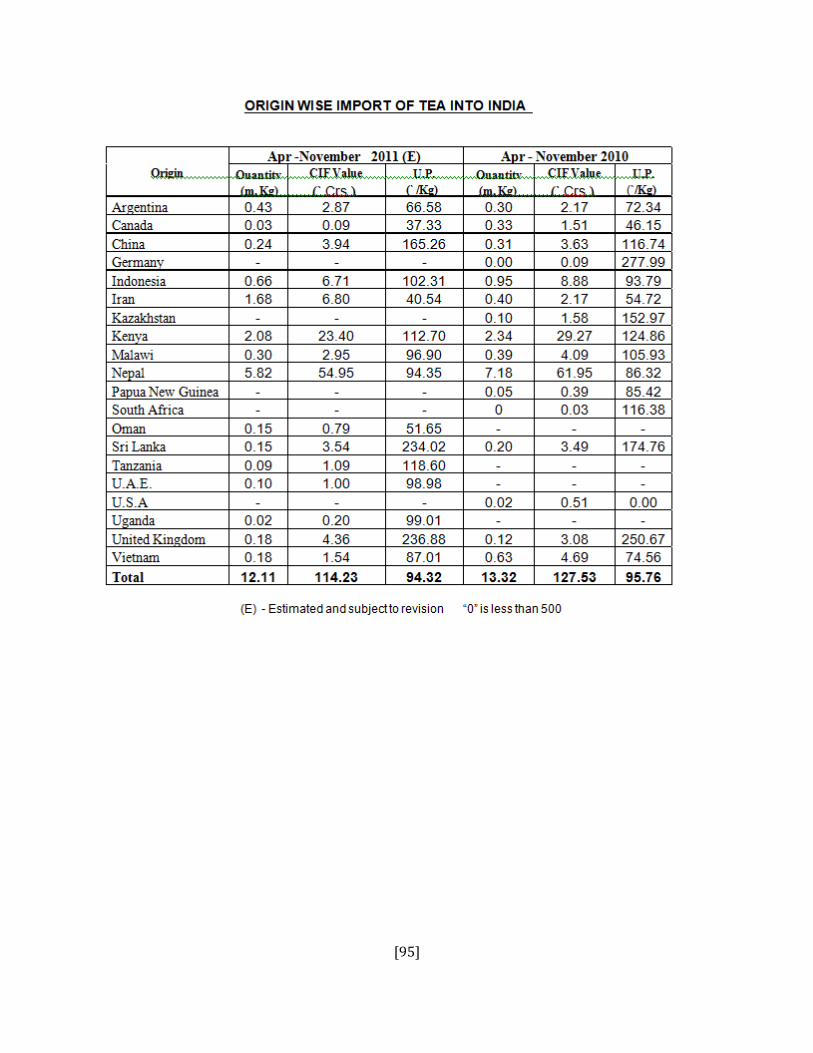
[95]
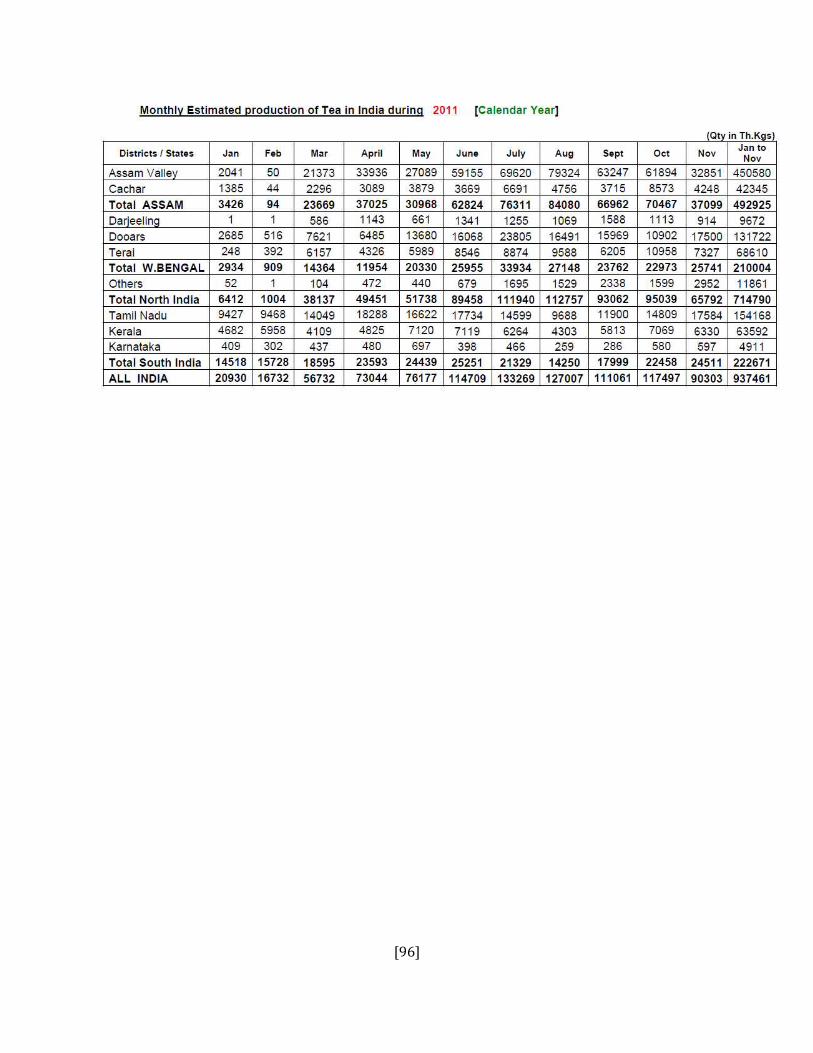
[96]
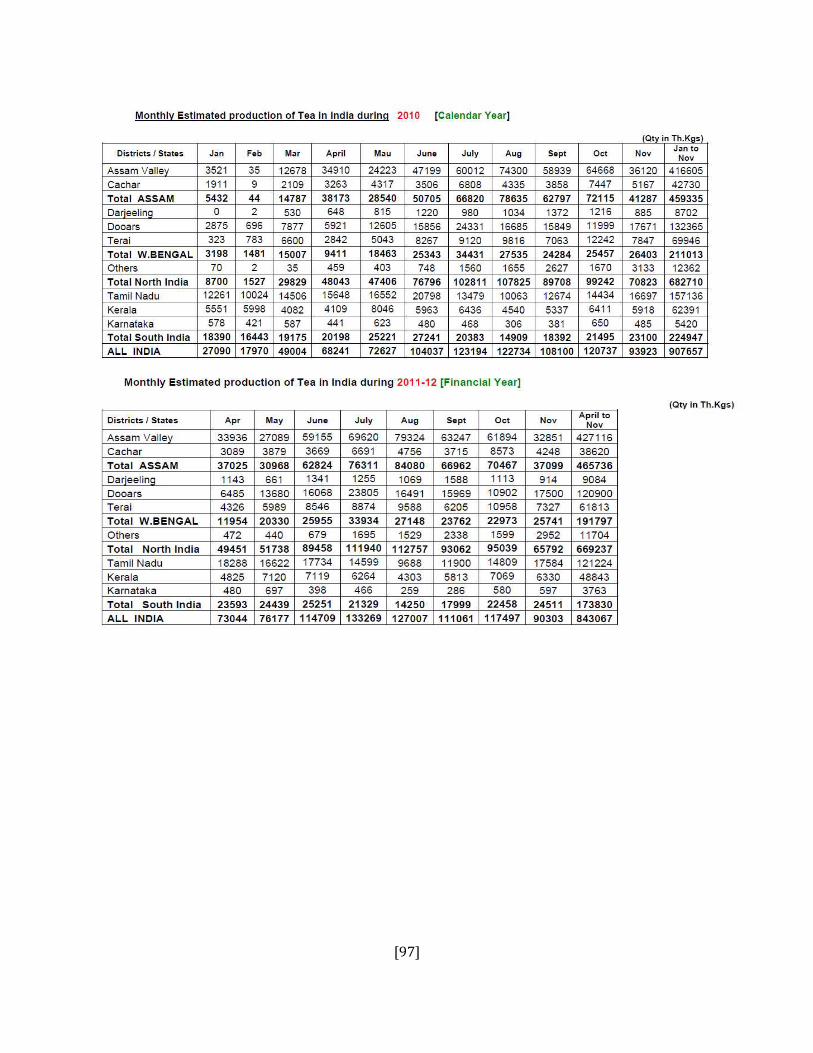
[97]
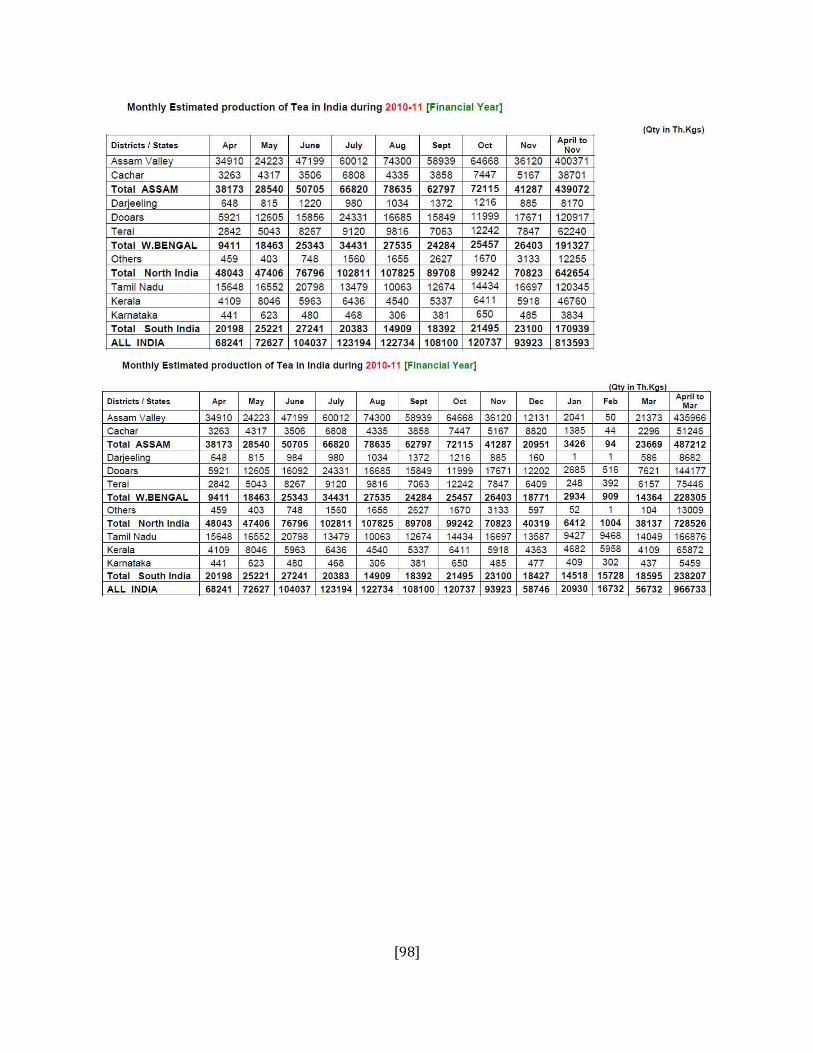
[98]
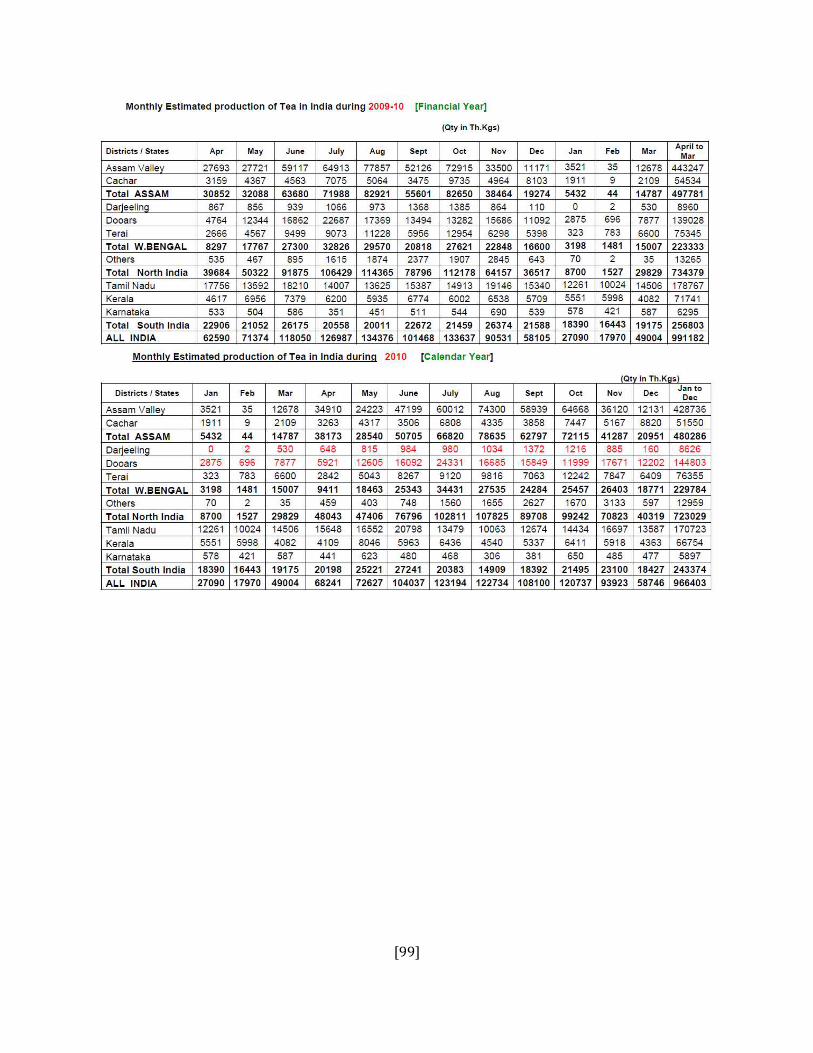
[99]
[100]
Chapter-V
Benefits of Tea Sector
[101]
BENEFITS OF TEA SECTOR TO SRI LANKA
1) Tea sector increase the Export Earning in Sri lanka:
Tea, which was once Sri Lanka's largest export commodity, has experienced intermittent crises
over the past three decades. According to available statistics, in 1966 the value added of the tea
sector as a percentage of the gross domestic product (GDP) was only 2.2 per cent. The
contribution made by the tea sector to GDP in 1995 compared with other sectors of the economy.
In 1996 the tea sector contributed 15 per cent of total export value. Manufactured garments have
emerged as the leading single export product in Sri Lanka and accounted for 46.44 per cent of
total exports in 1996. An export earnings of the tea sector in 1996 as compared to the other
sectors is shown in table.
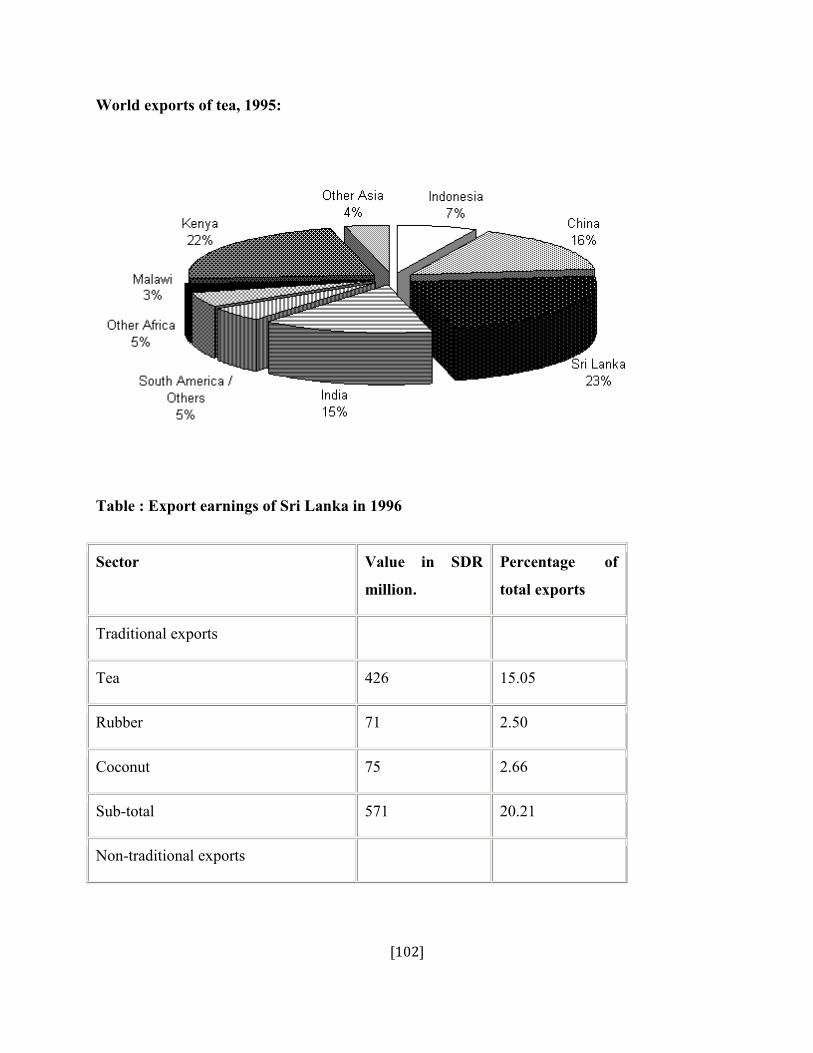
[102]
World exports of tea, 1995:
Table : Export earnings of Sri Lanka in 1996
Sector Value in SDR
million.
Percentage of
total exports
Traditional exports
Tea 426 15.05
Rubber 71 2.50
Coconut 75 2.66
Sub-total 571 20.21
Non-traditional exports
[103]
Other export crops 86 3.04
Fisheries products 51 1.80
Gems and jewellery 193 6.85
Textile and garments 1,310 46.44
Manufactures 503 17.81
Petroleum products 72 2.54
Re-exports 16 0.57
Others 21 0.73
Sub-total 2,252 79.79
In absolute terms, the tea industry is a major export producer, particularly as its net foreign
exchange earnings are very high. In 1991, Sri Lanka emerged as the largest exporter of tea to the
world market. The share of Sri Lankan tea in international markets in 1995 was 23 per cent
(figure I). However, Kenya was reported to have overtaken Sri Lanka in 1996 as the largest tea
exporter. Nevertheless, as an exporter of tea in bulk form, Sri Lanka has now developed into the
largest producer-cum-exporter of retail consumer packets and bags to the international market.
2 ) Tea sector plays an important role for growth & development of sri lanka:
Nevertheless, Sri Lankan tea is reputed to be of high quality and is one of the cleanest teas on the
world markets. Analysis shows that residue levels of pesticides, etc. are insignificant. Countries
[104]
such as Germany impose strict standards and the quality of Sri Lankan teas is within such
standards. An example of that recognition was provided recently by the Chairman of the
European Tea Technical Committee at the seventeenth meeting of the Technical Committee on
Tea of the International Standards Organization (ISO/TC), held in Colombo, when he noted that
Sri Lankan tea was the cleanest in the world because pesticide residues in Sri Lanka tea were of
no significance.
In the late 1970s, Sri Lanka became the first country in South Asia to adopt an outward looking
economic policy. The most important feature of that policy was an export-led growth strategy
aimed at promoting and sustaining rapid economic growth. Since then, successive governments
have been firmly committed to that policy and have recognized the private sector as the engine of
growth for rapid and sustainable economic development.
Consequent to that policy, in 1992 the government decided on a program me for restructuring the
tea industry. Initially, the management of a majority of the State-owned plantations was handed
over to private management companies on five-year contracts. As the management companies
did not have a stake in the ownership, and as the leases were short term, there was no incentive
for capital investment. In 1995, the government took the courageous decision to privatize State-
owned regional plantation companies on a long-term lease basis (50 years) through the sale of 51
per cent ownership of the companies. Several regional plantation companies were privatized in
1996 and the remaining companies were to be privatized during 1997.
3) Tea sector provides direct and indirect employment:
The tea sector provides direct and indirect employment to over 1 million people in Sri Lanka.
Total labor employed on the tea estates in 1995 was 215,338. It is the most important agricultural
product sector in Sri Lanka with respect to economic, social and environmental benefits.
However, for sustainability, tea requires a long-term growth-oriented strategy with regard to land
use.
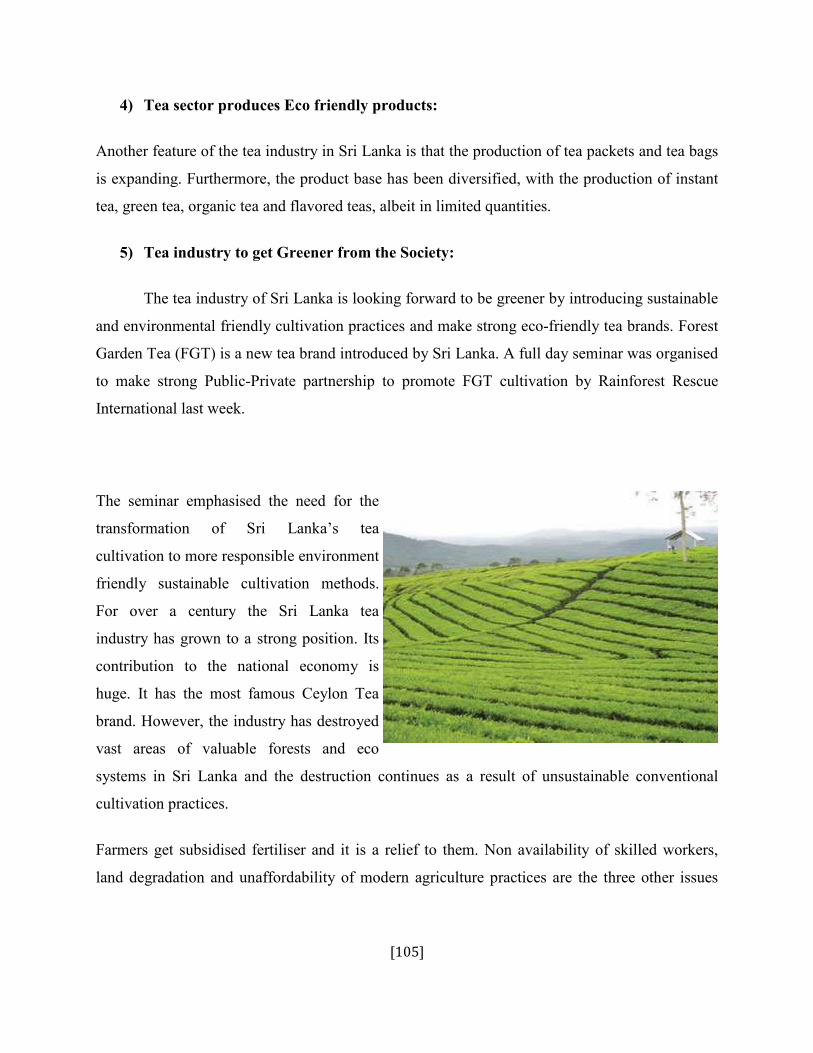
[105]
4) Tea sector produces Eco friendly products:
Another feature of the tea industry in Sri Lanka is that the production of tea packets and tea bags
is expanding. Furthermore, the product base has been diversified, with the production of instant
tea, green tea, organic tea and flavored teas, albeit in limited quantities.
5) Tea industry to get Greener from the Society:
The tea industry of Sri Lanka is looking forward to be greener by introducing sustainable
and environmental friendly cultivation practices and make strong eco-friendly tea brands. Forest
Garden Tea (FGT) is a new tea brand introduced by Sri Lanka. A full day seminar was organised
to make strong Public-Private partnership to promote FGT cultivation by Rainforest Rescue
International last week.
The seminar emphasised the need for the
transformation of Sri Lanka’s tea
cultivation to more responsible environment
friendly sustainable cultivation methods.
For over a century the Sri Lanka tea
industry has grown to a strong position. Its
contribution to the national economy is
huge. It has the most famous Ceylon Tea
brand. However, the industry has destroyed
vast areas of valuable forests and eco
systems in Sri Lanka and the destruction continues as a result of unsustainable conventional
cultivation practices.
Farmers get subsidised fertiliser and it is a relief to them. Non availability of skilled workers,
land degradation and unaffordability of modern agriculture practices are the three other issues
[106]
faced by the small-holders. Director, Tea Research Institute (TRI) Dr. spoke of the recent
research of the TRI on organic tea farming. There were several concepts in our tea industry and
earlier we focused on value addition. Today we talk about different concepts-organic farming
and eco-friendly tea cultivation. The most important thing is introducing these concepts to the
small-holders who account for the bulk of the green tea supply.
6) Health Benefits of tea:
BENEFITS OF GREEN TEA FOR WOMEN
Green tea is Among the Ideal Beverages that could be experienced by Anybody And Very much
more so by women. Healthy lunch ideas are the best approach to stay fit and healthy in today’s
quick paced and mostly automated way of life. There are Loads of benefits which Occur with
this As Properly as your immune Technique May be Noticeably enriched instead of Consuming
One other caffeinated Beverages Obtainable In your market. The only Issue which green teahas
Could be the caffeine Articles but A single Must Understand The Simple fact that caffeine
Amounts On this Consume is Lower than Fifty percent of what is there in Java and Power
Beverages Getting Marketed Inside the market. Many green tea benefits could be gotten by
Possessing this drink. To Begin with There are Plenty of Anti-oxidants Inside tea which Aid To
Minimize back cholesterol and lessen Our blood Stress for women. Besides this, green tea also
Aids in strengthening the immunity On the System and So Creating us resistant to Many
Varieties of ailments and diseases. The Variety of green tea benefits is Massive and This could
Confirm Very helpful to Anybody and everyone. Best from prevention of Most cancers to
Excess fat loss, green tea is loved by Individuals The earth More than As a Outcome of its
Several benefits.
[107]
GREEN TEA BENEFITS FOR MEN
All true teas---green, black and white---contain disease-fighting antioxidants because they come
from the same plant. But green tea has much higher levels than most of catechin, a particularly
potent antioxidant. While the evidence to support green tea's use in preventing or treating any
health problem is not crystal clear, research in both animals and humans has shown some
possible associations between these naturally occurring antioxidants in green tea and protection
against health problems that affect men. Many of the studies showing positive results have been
performed in Asian countries, where large populations of men drink green tea on a regular basis.
Cardiovascular Protection
One animal study, supported by the World Health Organization and published in 2004 in The
Journal of Nutrition, showed that antioxidants in both green and black teas can lower both
systolic and diastolic blood pressure measurements. A human study, conducted by researchers
from Harvard Medical School, Brigham and Women's Hospital and the University of Florida,
confirmed that green tea can reduce blood pressure slightly and also reduces total cholesterol and
levels of a marker of chronic inflammation, which is also linked to cardiovascular disease. A
review of epidemiological studies in Japan, also published in The Journal of Nutrition in 2008,
indicated that more than half of the randomized studies performed in parts of that country
outlined a positive benefit of green tea or green tea supplements on cardiovascular disease and
strokes.
Tea increases the chance of living a heart attack
Tea may protect the body from disease myocardial infarction.
New research shows that people who drink tea for survival after a heart attack than those without
crushing it. Drink 19 cups of tea per week were 44% lower risk of death. This effect is due to
antioxidants in tea offers.
[108]
The disciples of tea are less likely to die within 3-4 years after a heart attack than those who
prefer other beverages. This conclusion is of American scientists came after research conducted
on 1,900 patients aged 60 suffered a heart attack. They were followed within four years, starting
about 4 days after stroke above and divided into three groups:
- Group 1: Do not drink tea.
- Group 2: moderate amounts of tea (less than 14 cups / week for a year before his heart attack).
- Group 3: Drink a lot (more than 14 cups / week).
TEA AN HERBAL MAGIC OF NATURE
Tea tree has the scientific name is Camellia sinensis plant leaves and buds that are used to
produce tea Camellia sinensis is native to parts of Asia, but now widely planted in many parts of
the world in the area tropics and subtropics. Apart from India and China today tea is grown
mostly in Sri Lanka and Kenya.
Green tea is good year round, with white flowers, possibly tens of meters high, but the farms are
trimmed to two meters lower than the second means. Tea seeds can be pressed for oil. Tea leaves
about 2.5 to 4 cm long and 2-5cm wide from younger leaves and pale green leaves are harvested
to produce tea of the leaves below the surface while the silk short white hairs. The old leaves are
dark green. The different age of the tea leaves to create different products for quality by the
chemical composition of the different leaves.
Drink tea is available on almost every country in the world, not only because tea is a common
beverage.
[109]
JASMINE GREEN TEA PROTECTS, FIGHTS INFECTION, AND DECREASES BODY
FAT
Though most teas are made from only the leaves of herbs, jasmine green tea is different. It is
made by adding the jasmine flower to the tea Cultivated widely for its beautiful flowers, jasmine
is any of more than 200 species with fragrant white, yellow or red flowers.
The jasmine plant was brought to China from Persia sometime in the third century AD but never
became popular there until about 1000 years ago. Yin Hao is considered the finest jasmine tea
Other popular versions are Xiang Pian, Dragon Phoenix Pearl, and Mo Li Hua Cha, the latter
being possibly the most popular scented tea worldwide.
Jasmine green tea is made by starting with a Chinese green tea for a base. Some will use
pouchong/oolong or black tea but green is more common. The tea leaves are plucked and
processed in April and May and then kept dry until the jasmine flowers bloom in August and
September.
The flowers are gathered when they are fully open, either at midnight or early in the morning.
Then they are placed with the tea so that the scent of the flower can be absorbed over the next
four hours. The flowers are then removed. This will be repeated from two to seven times over a
month's processing before the tea is ready for sale. Grading of the tea is determined by how
many scentings the tea has gotten over a month. Low grade is 2-3 scentings. Higher grades will
use seven scentings over the month.
BENEFITS OF PEPPERMINT TEA
Peppermint tea is made of cut-leaf peppermint. Depending on the amount used and the brewing
time, the tea can be faintly minty or awfully powerful, almost like a breath mint. Mint tea can be
made of any range of the herb, fresh or dried. Use dried for mixing, however. Depending on the
length of the brew, peppermint tea brews to a pale or medium green.
Benefits of Peppermint Tea - Peppermint Tea Health
Peppermint tea benefits are widely-acknowledged all over the world!
[110]
An herb prized for its medicinal benefits and distinctive flavor, peppermint is a naturally
occurring hybrid of spearmint and water mint . Unlike other mints, however, peppermint
contains in its healing volatile oil the powerful therapeutic ingredient menthol, as well as
menthone, menthyl acetate and some 40 other compounds.
DRINKING GREEN TEA IS BENEFICIAL FOR THE CIRCULATORY SYSTEM
Drinking green tea rapidly improves endothelial function of cells of the circulatory system.
Tea (or tea) are associated with a reduced risk of cardiovascular disease. Dilatation depends on
the flow (Flux-mediated Dilatation - FMD) of brachial artery is related to endothelial function
and coronary arteries is a predictor of cardiovascular risk.
A group of Greek researchers followed 14 healthy people (average age 30) and no cardiovascular
risk factors. At three different times, they have consumed 6 grams of green tea, and 125mg
caffeine (or the equivalent of 6 grams of tea), and finally hot water.
Treatment of stomach pains
Camomile tea is good friend of the stomach. Type this chrysanthemum contain anti-
inflammatory and antispasmodic so strong spasms of the stomach and intestines is very
effective.
Take a cup of tea in a way that the instructions on the packaging and drink twice a day morning
and evening when encountering these symptoms. Chamomile tea is often blended with
peppermint to aid digestion.
Irritable bowel syndrome (IBS)
Roman chamomile reduces spasms, intestinal cramps and gas treatment.
7) Area of Tea Cultivation in Sri lanka:
The total land area under tea cultivation in Sri Lanka has declined over the years as a result of
the closure of uneconomic tea plantations. According to Department of Agriculture statistics, the
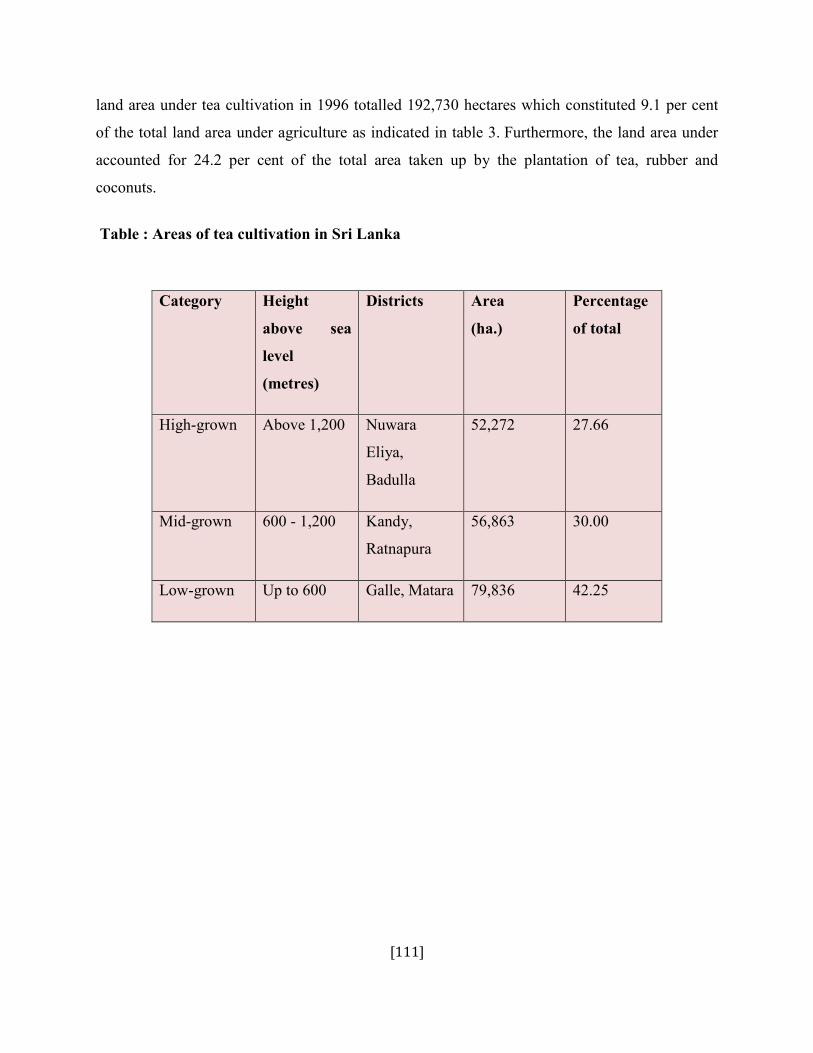
[111]
land area under tea cultivation in 1996 totalled 192,730 hectares which constituted 9.1 per cent
of the total land area under agriculture as indicated in table 3. Furthermore, the land area under
accounted for 24.2 per cent of the total area taken up by the plantation of tea, rubber and
coconuts.
Table : Areas of tea cultivation in Sri Lanka
Category Height
above sea
level
(metres)
Districts Area
(ha.)
Percentage
of total
High-grown Above 1,200 Nuwara
Eliya,
Badulla
52,272 27.66
Mid-grown 600 - 1,200 Kandy,
Ratnapura
56,863 30.00
Low-grown Up to 600 Galle, Matara 79,836 42.25
[112]
Chapter-VI
Key Indicators of Sri lanka
Tea Sector
[113]
Key indicators of Sri Lankan tea industry
Basic information
Sri Lanka is one of the oldest tea producing countries in the world – commercial production was
started in 1867 by the British planter James Taylor in Loolecondera estate in Kandy. The tea
produced in this country, popularly known as “Ceylon Tea”, ranks among the best available teas
in international trade. In 2007, Sri Lanka was the third-largest tea-producing country globally,
with a 9% share of global production, producing 30.6 million kilograms of tea. The total extent
of land under tea cultivation has been estimated at approximately 187,309 hectares.
Sri Lanka produces tea throughout the year, and the growing areas are mainly concentrated in the
central highlands and southern inland areas of the island. They are broadly grouped under these
headings according to their elevations, with high growns ranging from 1200 m upwards, medium
growns covering between 600 m to 1200 m. and low growns from sea level up to 600 m. High
grown teas from Sri Lanka are renowned for their taste and aroma. The two types of seasonal tea
produced in these areas, Dimbula and Nuwara Eliya, are much sought-after by blenders in tea
importing countries, teas from the Eastern Highlands contain unique seasonal characteristics and
are widely used in many quality blends, particularly in Germany and Japan.
The medium grown teas provide a thick colour variety which is popular in Australia, Europe,
Japan and North America. The teas produced in low grown areas are mainly popular in Western
Asia, Middle Eastern countries and CIS countries. Most factories in these areas produce what is
known as a leafy grade of tea, the tea leaves of which are highly twisted and can grade into long
particles. Sri Lankan tea is grown on large plantations as well as on smallholdings. According to
A survey carried out in 2005, there are approximately 118,275 hectares of smallholdings (Census
of Tea Small Holdings, Department of Census and Statistics,2005). Of the total land on which
tea is cultivated, around 43% is managed by the corporate sector, with a production of about
[114]
35%, while the balance of 57% is in the smallholder sector, with a production of 65% of the
total.
Economic characteristics
Employment
The tea sector in Sri Lanka has always been a vital component of its economy. It is also the
country's largest employer, providing employment both directly and indirectly to over 1 million
people. It also contributes a significant amount to Government revenue and to the gross domestic
product.
Exports
Sri Lanka has emerged as one of the world's leading tea exporters, with a share of around 19% of
the global demand. With around 305 million kg black tea being exported per annum, the current
foreign exchange earnings from tea exports amount to approximately Rs. 81 billion (USD 750
million), which is nearly 14 per cent of the total national foreign exchange earnings. Income
from the agriculture sector contributes about 19.7 per cent of the total GNP, around 70% of
which is made up of tea.
Price formation
Corporate sector:
The cost of green leaf depends on the field productivity, cost of other inputs, wages, plucker
intake, etc., and usually works out at around Rs 14.50 – 21.50 per kg (or Rs 65 – 90 per kg of
made tea)
Smallholder sector:
The cost of production of green leaf in the smallholder sector is estimated to be around Rs 16 –
25/= per kg) (Source: Tea Small Holdings Development Authority). Smallholder leaf is
[115]
processed mainly in private bought-leaf factories. The Tea Control Act stipulates the payment of
a reasonable price for green leaf supplied by smallholders (directly or through a leaf dealer) as
well as for the cost of manufacturing the same. The scheme of cost sharing between smallholders
and factories is based on a formula proposed by the government which takes into consideration
the cost of production at the field level and at the processing factory separately. The cost of
production in Sri Lanka is generally considered to be the highest (USD 1.70 – 2.20 / kg)
compared to costs in other tea growing countries.
Trading
The Colombo tea auction centre is one of the largest in the world, and on average it trades about
5-6 million kg of tea weekly. Colombo auction prices are the highest 184 1 USD is equal to 107
Sri Lankan Rupees. (about USD 1.80-1.90 per kg of made tea), as are the FOB prices (about
USD 2.63 per kg), compared to those fetched for tea exported from other countries. Of the total
quantity of exports, about 40% is in value added form, which is considered to be high, compared
to figures from other countries exporting tea.
Social characteristics
Sri Lankan tea plantations are covered by various laws and regulations, some of which are
specific to the tea sector. These laws include the Estate Labour (Indian) Ordinance No. 13 of
1889, Medical Wants Ordinance No.09 of 1912, Diseases among laborers ordinance No 10 0f
1912, Minimum Wage (Indian Labour) No.27 of 1927, Trade Union Representatives (Entry into
Estates) Act No.25 of 1970, Estates Quarters (Special Provisions) Act No 2 of 1971, to name but
a few. In addition to the above, the Government of Sri Lanka has ratified several conventions
relating to workers in plantations, passed by the ILO (International Labour Organization).
[116]
Employment
However, in spite of all the legal measures, it is becoming clear that plantation work is no longer
attractive. The labor situation on plantations has gone from one of surplus to deficit, with an
annual decline at the rate of 10 – 20% of the workforce. There are new areas of concern, such as
the out-grower system. Under this new system, a plot of land is allocated to a worker family
which works on the estate. The family is given fertilizer and other technical assistance to manage
the land. The companies will pay the worker family whenever they supply green leaf to the
factory. As a result the worker becomes a harvester in which the company sets the price of green
tea leaf.
The company avoids having to pay into the Employees Provident Fund, Employees provident
fund, Maternity fund etc. Although the system has been implemented in some state and privately
owned estates, it was opposed by the trade unions.
Housing and electricity
The housing available to estate workers is still inadequate, and only about 52% of estate
households have access to mains electricity, while more than 74% of the total population of the
country enjoys this facility. The rest of the estate population depends on kerosene for lighting.
The recent increase in the price of kerosene by Rs 16 per liter has had a major effect on living
conditions.
Health
The infant mortality rate amongst the estate population remains high. According to the 2002-3
figures, neonatal mortality rate is 31 percent (the highest in the country) on the tea estates,
compared to 13.5 percent in rural areas. The infant mortality rate remains the highest (47.5%),
compared to 7.4 percent in rural areas.
[117]
Environmental characteristics
There have been some high-profile changes on the environmental front in Sri Lanka, but these
have primarily been among the big multinational tea companies. Finlay’s tea estates in Sri Lanka
are run by two subsidiaries: Hapugastenne Plantations Limited and Udapussellawa Plantations
Limited, comprising 18 tea estates. These have adopted a more systematic triple bottom line
reporting method which covers the full spectrum of economic, environmental and social impacts.
With over 15,000 hectares of tea, rubber and forest plantations, they have a significant impact on
Sri Lanka’s environment. Finlay’s factories are now entirely powered by renewable sources of
timber and they are in the process of developing a system of establishing their carbon balance
sheet or footprint, with the aim of reducing emissions of global greenhouse gases. Tata Tea,
which manages the Watawalla estate, has launched a project of cultivating Caliandra with a view
to enriching the organic matter content of the soil through mulching, and to minimizing the use
of furnace oils for tea drying. Using calliandra firewood for drying would lead to savings in
foreign exchange owing to fewer imports, while providing employment for surplus labour.
They have also started hydroelectric power generation on the plantation, which helps the country
to meet its energy needs at low cost and saves foreign exchange through the low consumption of
oil.
Similarly, two plantation companies owned and managed by Hayleys, Kelani Valley Plantations
(KVPL) and Talawakelle Tea Estates (TTEL), have launched an Eco project to protect the fragile
eco-system on the up-country mountain ranges. TTEL has now preserved all the naturally
generated water resources such as water falls, springs and streams on the Great Western Estate,
and has completely stopped the spraying of pesticides185, making use of natural pest controllers
such as birds. There was a campaign by the Government through the Tea Board, which has led to
some action on the environmental front from the major tea companies in Sri Lanka.
Stakeholders of the tea supply chain
State sector institutions
[118]
The Ministry of Plantation Industries (MPI) deals with policy issues affecting the tea
industry, with various bodies in place to implement the policy. The Sri Lanka Tea Board (SLTB)
is responsible for monitoring tea marketing and promotional activities, the collection and
interpretation of tea statistics, monitoring subsidies for upgrading factories and policy
formulation and implementation in the area of quality assurance of tea.
The Tea Research Institute (TRI) has a mandate to carry out research on all aspects of tea
cultivation, processing and product development. The National Institute of Plantation
Management (NIPM) deals with the human resource development requirements of the industry,
by providing training to all personnel working in the industry.
The Tea Small Holdings Development Authority (TSHDA) looks after the operations of the
smallholder sector in the country. It provides the necessary extension services to disseminate
technical know-how to smallholders on tea cultivation, maintains the Tea Shakthi Fund and acts
as the coordinating body for the sector. The Tea Shakthi Fund operates/manages around 12
factories in various parts of the tea-growing districts in which the leaf from the smallholders is
processed.
Private sector organizations
There are several private-sector organizations, which have major roles, as large parts of the state-
owned land have been managed by the private sector since 1992.
These are:
The Tea Association of Sri Lanka (TASL), which was established very recently, is claimed to
be the apex body, comprising membership from all the private-sector stakeholders. Its function is
to ensure production and export of quality teas to the market.
The Planters Association (PA) of Ceylon: There are 20 Regional Plantation Companies
managing nearly 81,592 ha, about 78,188 ha of which is given over to tea cultivation. This
covers 304 estates (Anon, RPCs 2003).
[119]
The Federation of Tea Smallholder Societies (FTSHS): There are nearly 400,000 smallholders
, scattered across various tea-growing districts, but more than 80% of them are in lowlying land.
Since there was no common organization to represent issues facing them, FTSHS was formed.
The Private Tea Factory Owners Association (PTFOA): The PTFOA was formed in 1990
mainly to protect the interests of the private tea factory owners against the Sri Lankan
Government's policy of stipulating the price payable for green leaf. The private factory owners
are represented in the CTTA as an observer. However, they felt that a separate organisation was
required to specifically address the problems related to the tea factory owners.
The Colombo Brokers Association (CBA): The teas produced at the factory are sold at the
Colombo auctions through the brokers. A nominal sum of 1% on the sale price per kg is charged
by the brokers.
The Colombo Tea Traders Association (CTTA): The tea buyers, sellers and brokers
associated with the Ceylon Chambers of Commerce (CCC) formed the CTTA in 1894. Apart
from lobbying government officials on behalf of their members, the other important function of
CTTA has been to conduct the weekly tea auctions in Sri Lanka, through which roughly 90% of
the tea is sold in Sri Lanka.
Trade Unions: The major trade unions in Sri Lanka are the Ceylon Workers’ Congress (CWC),
Lanka Jathika Estate Workers’ Union and the Joint Plantation Trade Union Center. These unions
are quite powerful. In December 2006 and October 2007 new wage collective agreements were
concluded, which raised wages after the direct intervention of the President of Sri Lanka. The
bulk of the tea is produced by smallholders, however, and they are not
covered by the plantation trade unions. In addition, the focus of the trade unions which are
politically affiliated has been mainly on wage issues, and they have not been able to focus on
other aspects of labour.
[120]
Civil Society Organizations’: The CSOs focus primarily on activities related to livelihood,
peace building, rights of children, gender, prevention of HIV/AIDS etc., and very few focus on
issues related to rights in the plantation community. The INGOs, such as Care International, Plan
International, WUSC (World University Services Canada), World Vision etc., directly
implement projects related to livelihood in the plantation sector. Whereas CSOs such as Oxfam,
Save the Children Fund, CORAID, Christian Aid, HIVOS and also agencies
such as NORAD, USAID, Aus-AID, SIDA, CIDA, assist the Local NGOs in implementing
specific activities agreed upon by both parties through consultation. At the present time, very few
CSOs are concentrating on environmental, occupational health and safety issues in the tea sector.
Recommendations
Plantation companies
Explore the possibilities of upgrading plantation jobs, by providing upward movement, to attract
more workers to work in the estate. The price share supplement in the wage structure should not
be based on the national average price of tea, but rather on either the net sale average price
(NSA) of that particular estate or the average price recorded in the corporate sector at that
elevation, somewhat similar to the green leaf price formula, in place. There should not be any
effort from the plantation companies to dilute the existing labour laws which protect the workers
in the tea industry, on the grounds of declining returns. The big companies could also tie up with
the ILO and other civil society organisations to help small growers achieve minimum labour and
environmental standards. Adherence to such standards will give an additional product value to
the tea being sold at the retail level. In return, the companies could provide incentives in terms of
better prices to the small growers. These practices could work to the advantage of both.
The government
Provide technical and marketing assistance to the small and marginalized. Farmers Provide credit
schemes and debt management services to the plantations. Ensure that labor laws are not violated
on the large plantations and that the ILO's decent work standards are maintained. The social
security mechanism of tea estate workers should be strengthened, and for these purpose special
[121]
agencies, an implementation mechanism and a fund should be created and trade unions involved
in implementing and monitoring them. Grant preferential procurement of the tea for government
departments which adhere to acceptable codes of conduct, and provide incentives to companies
which adhere to such codes. Strengthen the relationships between small tea growers and private
processing factories. Develop a strategic intervention in order to help each actor aware of their
rights and responsibilities within the value chain.
International tea buyers
Take responsibility for conditions in their entire tea value chains, particularly where they have
more influence. Provide support to the small tea growers through technical and marketing
Assistance .Pay a higher price for tea produced in a sustainable process .Do not lobby to dilute
the social protections available to tea estate workers. Conduct multi-stakeholder monitoring and
verification of the social and environmental standards on the tea estates from which tea is
procured
NGOs and INGOs
NGOs could provide technical assistance and other commercially oriented support, including
quality improvement training, sales, and marketing skill building, support of participation in
trade shows .Training small-scale tea growers on social, economic and environmental aspects,
and improve their understanding of the tea value chain. Adapt Codes of Conducts to the local
realities of Sri Lanka through a participatory process .Support for broad-based rural development
including the development of local processing capacity and producer associations, and measures
to improve credit and risk management facilities. Encourage tea traders to implement an
effective Code of Conduct
Critical issues in the tea sector
As in many other tropical commodity sectors all is not well in the tea industry. The areas in
which tea is produced are some of the most beautiful in the world, but also some of the poorest.
The contrast between wide mountain panoramas with luscious green tea fields and the sometimes
[122]
miserable conditions for workers and smallholders can be striking. In this chapter, we will be
looking more closely at some of the most pressing sustainability problems in tea-producing
countries. The focus will be especially on those issues affecting the workers and smallholders
who are the most vulnerable people in the tea sector.
Social issues
Low wages
Throughout the decades the often large tea plantations have benefited from low cost local or
migrant laborers. The wages are often still very low; often around minimum wage levels,
although this does not normally constitute a living wage in tea-producing countries.
In Sri Lanka, workers on both smallholder farms and large plantations are paid USD 2.80 (RS
300, this includes a number of benefits) a day. On the face of it, this seems a reasonable wage at
present, but workers and unions are claiming that these collectively bargained wages are not paid
appropriately. In India workers on smallholder gardens get paid at much lower rates than at the
estates and they have hardly any rights compared to their plantation counterparts. The wage rates
of tea garden workers that fall under the plantation labor act (estates) are generally fixed through
bipartite agreement between the representatives of employers and employees of the tea gardens
and ranged from approximately USD 1.19 (RS 49, inclusive food grain) in Tiripura to USD 1.90
(RS 78) in Kerala in 2007.
Housing
On the large tea estates, workers – permanent but often also temporary workers - live on the
plantation in houses provided by the plantation company as long as they have work. The housing
situation is often far from ideal, however. On the large estates in Kenya, for example, such as
those of Unilever and James Finlay41, estate houses tend be overcrowded especially during peak
[123]
season and are sometimes in deplorable condition (see boxed text). Moreover, their allocation is
riddled with allegations of corruption, tribalism and sexual harassment.
Over crowded tea estate houses
Living conditions in Sri Lankan and Malawian estates are also sometimes poor and unsanitary.
A domestically owned large plantation company in Malawi, Conforzi Plantations, made only one
pit latrine available for almost a hundred people, for example. In Sri Lanka, most tea workers
live in housing units called “lines”. These are usually rooms in old barracks that are sometimes
overcrowded, mostly do not have access to (piped) drinking water and lack proper sanitation
facilities. There are programs to build 160,000 units of new housing on the estates that need to
replace old structures, and to add to the total of 200,000 units counted in 2004, although progress
has been slow. Only about 52% of the estate households have access to mains electricity, while
more than 74% of the total population of the country enjoys this facility43. In India the workers
covered in the large plantations examined all had basic facilities such housing, drinking water
and sanitation available.
Health and safety
Tea plucking is difficult, hazardous work. Workers are on their feet for hours on end, carrying
tea-collecting baskets on their backs; back problems are therefore common. The uneven terrain
and sometimes steep slopes on which tea is picked raises the risks of accidents and as a result
fractures due to falling (from height) are quite common. In addition they are exposed to harsh
weather conditions (hot, cold, wet), pesticides, mosquitoes and other insects, and poisonous
snakes. Most large estates in Kenya, Indonesia, Malawi and Sri Lanka offer health care to
employees and their families. However, these services range from estate hospitals that are better
equipped than state hospitals down to “only” having an ambulance onhand. In Malawi, a lack of
medicine and qualified personnel was noted in some estates, but as in Sri Lanka ambulances
[124]
were available on all the estates surveyed. HIV/AIDS is a very serious problem in the tea sector
in Malawi and Kenya.
Dying of hunger
The crisis as a result of low market prices in the tea sector has probably affected India most. Ever
since the onset of the crisis at the end of the nineties, many tea estates have been closed
or abandoned because they were deemed to be unprofitable or not profitable enough. This tea
sector restructuring has caused great misery for the plantation community. Today there are still
heartbreaking reports of hundreds of people dying of hunger on tea estates that have been
abandoned or closed. In Indonesia, Sri Lanka and Malawi, protective clothing, such as masks to
protect oneself from inhaling pesticides when applying these chemicals, are often not provided or
used. Workers in Sri Lanka report severe respiratory as well as skin problems due to such
unprotected application. In India and elsewhere, workers in tea gardens are often isolated from
mainstream society and interaction with mainstream society is very low. The low rate of literacy
giving them access to major health, educational and development initiatives and program me of
the state government and other organizations.
Discrimination and gender
As mentioned earlier historically, the opening up of tea and other plantations worldwide has been
built on unskilled migrant labor. Generations on, tea plantation workers are still discriminated
against because of this historical context. Most of the workers on Indian tea plantations for
example are from migrant, marginal and tribal communities. In Sri Lanka, the vast majority of
tea estate workers are “tea Tamils” who is isolated even within their own community as the
indigenous Sri Lanka Tamils consider them to be ‘second class citizens’.
[125]
Representation of Workers
In India and Sri Lanka, plantation workers often originate from specific ethnic, tribal and/or
lower caste groups, which make their position even more vulnerable.
Actualization of Labour
Smallholder tea gardens rely solely on casual (and family) labor, although the majority of the
workers on large estates in most of the countries studied were also temporary. One important
reason for this is that tea work is often seasonal, in other words the amount of work available
may vary from month to month but also from year to year, depending on climatic conditions.
Apart from offering flexibility, however, temporary workers are also popular because they tend
to be cheaper than permanent workers. Actualization of labor is a major concern, because
workers are not guaranteed job security (contracts) and other benefits that permanent workers
accrue, such as pension rights and access to medical care for their children.
Child labor and child work
According to the literature the use of child labor in tea-producing countries is common,
especially on smallholder tea plantations. Due to financial need and a lack of nursery or
educational facilities, women plantation workers are often obliged to take their children to the
plantation. On the tea plantations in East Java, Indonesia, many children work to help their
parents meet their daily targets or to earn some extra money58. Between 100,000 and 500,000
children are employed illegally in Sri Lanka, according to unofficial estimates, many of them on
tea plantations. In 2002, IPEC conducted an assessment of tea estates in Tanzania, and found that
children were working without proper protective clothing, that they were working on average
eight hours, were exposed to toxic herbicides, and that sexual harassment of girls took place.
[126]
Gender and declining workforce
As mentioned above, most of the workers in the tea sector are pickers and the majority of these
are female. They have often had very little education, but they have the skills for picking tea
leaves, handed down by the previous generations. In Sri Lanka, for example, the country’s male
literacy rate is 95%, while among the plantation males it is 88%. The female literacy rate is 91%,
while among the plantation women it is 75%. In Sri Lanka, in spite of all the legal measures to
protect worker welfare, it is clear that plantation work is no longer attractive.
Environmental Issues
Habitat conversion
Habitat conversion is seen as the main harmful environmental impact of tea production69. The
reason being that the habitat for cultivation is often located in more rugged and remote areas,
which tend to be those with the highest biodiversity. Converting such habitats leads to species
reduction and due to the slope of the land, among other things; considerable soil is lost before the
plantations are fully established to protect the soil.
Energy use
The environmental impact of tea processing depends on such factors as the use of
renewable/renewed feedstock and the energy efficiency of the machinery. Drying, the most
energy-intensive phase of tea processing, is mainly carried out using firewood from natural
forests. In some regions of India, for instance, the use of firewood has caused extensive
deforestation.
[127]
Tree logging for the tea sector is also a serious issue in Sri Lanka, Malawi and Kenya. By using
high-sulphur rubber wood, the tea industry in Sri Lanka has caused high acid pollution. Some
estates, for example in Sri Lanka and Kenya have initiated tree planting schemes for feedstock
Agrochemical use
Different agrochemicals are used throughout the growing cycle on tea plantations to protect tea
bushes and to enhance productivity. The types and amounts of pesticides (herbicides, insecticides
and fungicides) and fertilizers applied will vary considerably between and within countries. Tea
is often produced in monoculture and plantations therefore lack natural enemies and protection
by diversity to pests. Therefore sometimes large amounts of pesticides are used to control for
pests. For example crop loss is 14 to 50 percent in extreme cases in India.
Some of the tea gardens use pesticides, or did so until recently, which are banned in developed
countries, such as DDT. There are indications that usage is more pronounced in Asia (India, Sri
Lanka but also China, Vietnam82 and Nepal) than in Africa. Because of high pesticide residue
levels, exports from various Asian countries are occasionally restricted. In Malawi tea
smallholders are often too poor to afford pesticides.
Economic issues
Uneven value distribution
The tea value chain comprises all the stages from green leaf production through conversion into
a bulk packaged product available for blending and sale to consumers. Value is added to the tea
leaves at each stage of the supply chain, each with associated costs .This includes the cost of
plucking and sorting, factory packing, internal transport, warehousing, sales charges (auction and
direct), freight, insurance, interest, blending and packaging and retailers' sales costs. In general
across (agricultural) commodity sectors most added value is created downstream in the higher
processing and retail stages of a supply chain. The tea value chain is no exception to this rule.
While tea is “ready to drink” when exported by producing countries, the downstream stages such
[128]
as blending, packing and marketing are the most profitable. Out of every dollar spent on Sri
Lankan organic fair trade black tea in Italy,87.30 cents accounts for the free on board price
which includes the price paid to the producer and the costs of local transport and taxes of tea in
Sri Lanka.
Smallholders
There is an overlap in the economic, environmental and social issues affecting smallholders and
large tea producers. However there are also a number of factors that uniquely bedevil the
smallholder sub-sector. This section will be looking briefly at some of the most of important of
these, including low farm gate prices, poor extension services, poor access to credit and low level
of farmer organization.
Limited market channels
Small tea farmers are mostly price takers. With the exception of individual small farmers in
Vietnam they only produce green leaf not made tea in the countries studied. They may sell their
green leaves to middlemen, plantations or processors. After picking the leaf, they need to get
their produce to a processing factory as quickly as possible, in order to prevent loss of quality. In
many cases, however, they have only one or limited number of outlets for their produce. This
could be due to a lack of transportation, or that there is only one factory in the area to process
their tea.
Institutional support for smallholders
Smallholders are increasingly important for tea production around the world. In all the countries
in the study, there is or was institutional support to develop this sub-sector. For example,
smallholders in Kenya and Sri Lanka are supported through (former) dedicated government
institutions such as The Tea Small Holdings Development Authority (TSHDA) in Sri Lanka and
the Kenya Tea Development Agency (KTDA). There are also program me and projects, which
[129]
are sometimes also funded by multilateral financial institutions such as the World Bank or Asian
Development Bank, that
provide all kinds of extension services, training, loans and material.
Low level of organization and representation
The information flow and sharing of market demands such as quality, price, sustainability and
good farm practices within the sub-sector in most countries studied is poor and in some cases
lacking completely. This means that farmers are often unaware of for example auction prices or
quality demands that are relevant for fixing the price of green leaf. This further undermines their
bargaining power. Price formulation by a single or limited number of buyers such as in SRI
LANKA, Kenya and Malawi is not transparent and does not involve effective smallholder
governance.
In India there is a limited group of tea smallholders that may be organized in many different
ways from co-operatives to self help groups. The latter for instance were initiated by the Indian
tea board for the improvement of quality and enhancement of the productivity of the existing tea
areas such as the states Assam and Kerala. However while some of these organizations are
effective in for example improving farm practices and quality through sharing of information or
improving tea collection they generally have limited their role to the initial phase of production
and are mostly incapable to move up further in the value chain.
Low farm gate prices
Except for Vietnam in all countries studied small scale farmer indicated that prices for green leaf
are low . For instance in Malawi green leaf prices are fixed by the large private companies at
USD 0.082 per kilo. The price does not discriminate for quality or fluctuates with current world
market prices. Farmers claim that this price is below the cost of production and because of the
fixed price there is no incentive for them to produce better quality green leaf. Hence most of the
farmers surveyed grow other crops as well to supplement income. Poverty among smallholders
[130]
was evident some small-scale farmers interviewed wore rags and could not afford even shoes. In
India and Indonesia almost all cultivators interviewed reported that they are unable to meet the
high cost of production. As a result in Indonesia they frequently come to the last solution, sell
their land or change to more profitable commodities. Also in Kenya low payments for green leaf
to smallholders were beginning to negatively affect production.
Indicative prices for green leaf from smallholders in 2007 (in USD)
Country Price
Sri Lanka 0.34
India 0.13
Land rights
Lack of title deeds for cultivable land for tea cultivation is a major concern for small tea
segments in India. The absence of title deeds there prevents small-scale cultivators from
registering with the Tea Board thereby failing to avail themselves of subsidies and financial
assistance under various schemes of the Tea Board and other financial institutions. In Indonesia
the industry has also been plagued by conflicts over land as well. Two recent cases occurred in
Bengkulu, Sumatra and West Java. In the first case, private-owned estates PT Agro Tea illegally
acquired 105 hectares of protected forest and land of coffee (and vanilla) growers. In the second,
PTPN VII was in conflict with the locals over the land it used.
Lack of extension services, poor farm practices and logistics
Another important issue is the lack of extension services. Extension services provided by KTDA
to small scale farmers in Kenya are reportedly insufficient. Fertilizer prices that were imposed
were considered too high and the amount supplied often excessively higher than the amounts
needed. The sporadic poor services at the Tea Collection Centers (TCC) and the Tea Factories
negatively affect tea quality and incomes for farmers. Critical issues range from poor
transportation affecting tea quality, poor tea sacks resulting in loss of tea, too few staff at the
TCCs resulting in farmers having to wait for long periods and/or, not being served at all due to
[131]
fraud and theft. In India tea smallholders often face similar problems. It was observed that as a
result of low prices and a lack of proper training and awareness on the part the cultivators they
fail to maintain their gardens properly. This in turn leads to deteriorating quality. In some regions
especially a lack of transport facilities and a long distance from gardens to factory are
detrimental to the quality of leaves. It was also noted in India that large-scale conversion of
forest land to tea cultivation, and measures to correct ecological imbalance and other
environmental problems, are sometimes not Addressed by smallholders and the Government.
Workers becoming out-growers
In Sri Lanka, converting workers to independent out-growers is an increasingly popular method
of cutting labour costs. In this system, a plot of land is allocated to a worker family working on
an estate. They are given fertilizer and other technical assistance to manage this tea-growing
land. From then on, they are paid for the green leaf supplied to the factory, at a price decided by
the company. This is cheaper for the estates, because they can avoid paying the benefits that
workers are entitled to through the collective bargaining agreement applicable in this sector.
[132]
Bibliography
http://www.slideshare.net/vyas_kundan/ProjectReport
http://www.teauction.com/industry/indiantea.asp
http://www.indianmirror.com/indian-industries/tea.html
http://www.eximguru.com/india-trade-data/more-info.aspx
http://www.infodriveindia.com/India-Trade-Data/Benefits.aspx
http://www.eximguru.com/india-trade-data/default.aspx
http://www.infodriveindia.com/India-Trade-Data/More-Info.aspx
http://www.eximguru.com/india-trade-data/benefits.aspx
http://www.ideamarketers.com/?articleid=2115263
http://planetexim.net/Indian-Export-Data/Trade-info.aspx
http://commerceweaverpro.com/indian-exporters-and-importers-database-its-importance-for-the-
international-trading-community.html
http://www.mkinternational.net/products.html
http://www.niir.org/profiles/profiles/identified-project-opportunities-west-
bengal/z,,9c,0,a/index.html
http://www.niir.org/profiles/profiles/identified-project-opportunities-
assam/z,,8d,0,a/index.html
http://www.epwrf.res.in/includefiles/c10523.htm
http://kamaljeetkondal.blogspot.com/2011/08/last-six-months-gk_10.html
http://kamaljeetkondal.blogspot.com/
[133]
http://www.scribd.com/doc/25520333/Report-Wagh-Bakri-Tea
http://unjobs.org/duty_stations/india/assam/sonitpur
http://www.scribd.com/doc/36315703/Indian-Tea-Industry
http://industrytracker.wordpress.com/2010/06/30/tea-industry-in-india/
http://indonesiatea.blogspot.com/2010/07/world-tea-market-projections.html
http://www.topssrilanka.com/article20616-trends-in-global-tea-consumption.html
http://www.dailynews.lk/2010/06/15/bus24.asp
http://www.tops.lk/article20616-trends-in-global-tea-consumption.html
http://www.indiatea.org/unique/unique.html
http://www.ahmadtea.com/index.php/srilankapage
http://www.tea.co.uk/teas-from-india-and-sri-lanka
http://withanage.tripod.com/ceyl_tea.htm
http://www.tea.co.uk/tea-4-healthtea_news_latest01.html?id=43
http://www.lanka.com/sri-lanka/ceylon-tea-136.html
http://expoteas.com/about-tea/history-of-ceylon-tea/
http://ceylon-puretea.blogspot.com/2010/07/types-of-ceylon-tea.html
http://slfoxtours.com/index.php?option=com_content&view=article&id=68
[134]
http://www.indianmirror.com/indian-industries/tea.html
http://www.tea.lk/ceylon-tea/
http://sisiradissanayake.wordpress.com/2008/11/24/tea-industry-of-sri-lanka/
http://sisiradissanayake.wordpress.com/
http://www.intea.info/
http://www.intea.info/2011/08/jasmine-green-tea-protects-fights.html
http://www.intea.info/2011/08/green-tea-benefits-for-men.html
http://www.benefitofgreentea.info/health-benefits-of-green-tea-for-women/
http://www.intea.info/2011/08/benefits-of-green-tea-for-women.html
http://ezinearticles.com/?Jasmine-Green-Tea-Protects,-Fights-Infection,-and-Decreases-Body-
Fat&id=1479101
http://www.naturalremedyhealth.com/vitamins-suplements/2419-jasmine-green-tea-benefits-
those-with-diabetes
http://www.intea.info/2011/09/tea-herbal-magic-of-nature.html
http://www.intea.info/2011/09/tea-increases-chance-of-living-heart.html
http://www.intea.info/2011/09/tea-herbal-magic-of-nature.html
[135]
http://herbhealth.rcpartnership.org/
http://www.healthyeatingworld.com/healthy-eating/3486-jasmine-green-tea-benefits-
problems-with-high-blood-pressure
file:///E:/shrilanka financial policies/download.htm
file:///E:/financial policies in shrilanka.htm
http://unctad.org/en/docs/iteipc20038_en.pdf