Embed Size (px)
Citation preview
C E N T R E D ' E T U D E S E T D E R E C H E R C H E S S U R L E D E V E L O P P E M E N T I N T E R N A T I O N A L
SÉRIE ÉTUDES ET DOCUMENTS
Impact Evaluation in a Landscape: Protected Natural Forests, Anthropized Forested Lands and Deforestation Leakages in
Madagascar's Rainforests
Sébastien Desbureaux Eric Kéré
Pascale Combes Motel
Études et Documents n° 13
June 2016
To cite this document:
Desbureaux S., Kéré E., Combes Motel P. (2016) “Impact Evaluation in a Landscape: Protected Natural Forests, Anthropized Forested Lands and Deforestation Leakages in Madagascar’s Rainforests”, Études et Documents, n° 13, CERDI. http://cerdi.org/production/show/id/1817/type_production_id/1
CERDI 65 BD. F. MITTERRAND 63000 CLERMONT FERRAND – FRANCE TEL. + 33 4 73 17 74 00 FAX + 33 4 73 17 74 28 www.cerdi.org
Études et Documents n° 13, CERDI, 2016
2
The authors : Sébastien Desbureaux PhD Student in Economics, CERDI – Clermont Université, Université d’Auvergne, UMR CNRS 6587, 63009 Clermont-Ferrand, France. E-mail : [email protected] Eric N. Kéré PhD in Economics, Research economist at African Development Bank, Avenue Joseph Anoma 01 BP 1387 Abidjan 01, Côte d’Ivoire. Côte d'Ivoire E-mail: [email protected] Pascale Combes Motel Professor, CERDI – Clermont Université, Université d’Auvergne, UMR CNRS 6587, 63009 Clermont-Ferrand, France. E-mail : [email protected] Corresponding author: Sébastien Desbureaux
This work was supported by the LABEX IDGM+ (ANR-10-LABX-14-01) within the program “Investissements d’Avenir” operated by the French National Research Agency (ANR).
Études et Documents are available online at: http://www.cerdi.org/ed Director of Publication: Vianney Dequiedt Editor: Catherine Araujo Bonjean Publisher: Mariannick Cornec ISSN: 2114 - 7957 Disclaimer:
Études et Documents is a working papers series. Working Papers are not refereed, they constitute research in progress. Responsibility for the contents and opinions expressed in the working papers rests solely with the authors. Comments and suggestions are welcome and should be addressed to the authors.
Études et Documents n° 13, CERDI, 2016
3
Abstract This paper analyzes deforestation leakages from natural rainforests to anthropized habitats following the creation of Protected Areas in Madagascar. A simple theoretical framework highlights that a conservation constraint does not necessarily create deforestation leakages on secondary forests. An original dataset is built combining fine scale vegetation cover images and spatialized census data over the period 2000 to 2012. Cover images allow us to distinguish a mosaic of landscapes. Multilevel panel regressions and matching techniques indicate a causal effect of Protected Areas on deforestation leakages. Though Protected Areas reduce deforestation in protected natural forests, forest clearing is mostly reported on other types of anthropized forests. Our results demonstrate the limitations of Porter-like mechanism in agricultural innovation. They also support the hypothesis of a conservation dilemma: protecting biodiversity may come at the expense of the welfare of locals who rely on local (provisioning) ecosystem services. Keywords Land use patterns, Deforestation, Environmental policies, Agricultural innovation. JEL codes O12, O13, Q15, Q23, R14 Acknowledgment Sébastien Desbureaux thanks the DP Forêts et Biodiversité for its institutional support in Madagascar and Emilson Rakotorisoa for his research assistance; and acknowledges the financial support of the National Geographic Society through the Young Explorer Program (#C293-15). Eric Kéré was supported by the French government's Agence Nationale de la Recherche through the "Investissements d’avenir" program (ANR-10-LABX-14-01). This project started while he was a Research Fellow at CERDI. Viewpoints and any errors are our own.
1 Introduction
Human beings have been modifying tropical forests for tens of thousands of years. Between
2000 to 2012 alone, an estimated 2.3 million square kilometers of forests have been lost world-
wide (Hansen et al. 2013). These forests have been transformed mainly into agricultural lands
(Kissinger and Herold 2012) but also into anthropized forested landscapes that supply direct
ecosystem services to locals (construction wood, fueldwood, charcoal etc), resulting in the de-
velopment of many human-modified mosaic landscapes. Today 410 million people to depend
highly on the access to natural and anthropized forests to support their livelihoods (WRI
2005).
International efforts to tackle tropical deforestation have increased since the early 1990s,
partly in the name of the global ecosystem services forests provide to human beings, such
as biodiversity conservation, carbon storage and sequestration (Costanza, d’Arge, et al. 1997;
MEA 2005; Costanza, Groot, et al. 2014). Protected Areas (PAs) remain the dominant policy
answer to stopping deforestation of natural forests and have proven to be effective at attaining
this objective (Miteva, Pattanayak, and Ferraro 2012). Yet locals may simply displace defor-
estation from the created PA to elsewhere in the landscape. This phenomenon is known in
the literature as deforestation leakage 1.
This paper examines the possibility of deforestation leakages from natural forests to an-
thropized forested areas following the creation of PAs in the context of Madagascar’s rain-
forests. Madagascar is one of the top three countries worldwide in terms of mega-biodiversity
(Goodman and Benstead 2003). Most of its terrestrial biodiversity is concentrated in natural
forests. Over the last 60 years, the country has probably lost around 50% of its natural
forest cover (Harper et al. 2007; McConnell and Kull 2014), making Madagascar one of the
hottest spots for global biodiversity conservation (Myers et al. 2000). Approximately 9 million
hectares of natural forests remain in Madagascar, of which about 5.6 million are rainforest,
located in the eastern ecoregion. According to our calculations, around 1.5 million people live
in highly forested areas in Madagascar. Family agriculture is the principal economic activity
of about 90% of these forest inhabitants, with slash and burn being the dominant agricultural
technique for rice production (ed, the staple food in Madagascar). In a context of rapid pop-
ulation growth (2.9% average according to the World Bank), of an observed sharp decrease of
fallow lengths (Styger et al. 2007)and of limited adoptions of agricultural innovations (Minten
1The possibility of leakages also appears for other types of conservation instruments such as Payments forEnvironmental Services (Alix-Garcia, Shapiro, and Sims 2012; Le Velly, Sauquet, and Cortina-Villar 2015) ; re-forestation policies (Meyfroidt and Lambin 2009, forest concessions in Brazil (Oliveira et al. 2007) or REDD+initiatives (Aukland, Costa, and Brown 2003)
4
Études et Documents n° 13, CERDI, 2016
and Barrett 2008), slash and burn is the primary driver of deforestation, despite its practice
on natural forests being prohibited since 1881 (Jarosz 1993). As a result, a growing network
of PAs now covers around 40% of the remaining forests (3.6 million hectares) and appear to
have been effective in slightly reducing (but not in halting) deforestation on natural forests
(Gimenez 2012; Desbureaux, Aubert, et al. 2015).
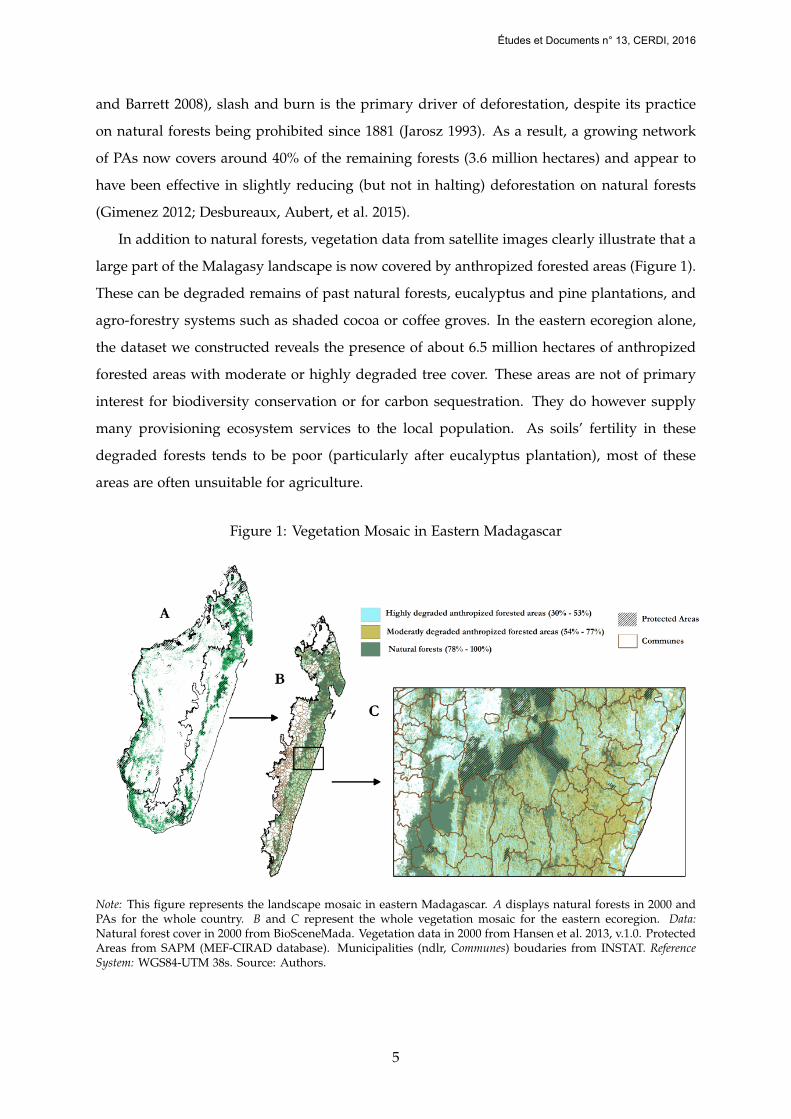
In addition to natural forests, vegetation data from satellite images clearly illustrate that a
large part of the Malagasy landscape is now covered by anthropized forested areas (Figure 1).
These can be degraded remains of past natural forests, eucalyptus and pine plantations, and
agro-forestry systems such as shaded cocoa or coffee groves. In the eastern ecoregion alone,
the dataset we constructed reveals the presence of about 6.5 million hectares of anthropized
forested areas with moderate or highly degraded tree cover. These areas are not of primary
interest for biodiversity conservation or for carbon sequestration. They do however supply
many provisioning ecosystem services to the local population. As soils’ fertility in these
degraded forests tends to be poor (particularly after eucalyptus plantation), most of these
areas are often unsuitable for agriculture.
Figure 1: Vegetation Mosaic in Eastern Madagascar
Note: This figure represents the landscape mosaic in eastern Madagascar. A displays natural forests in 2000 andPAs for the whole country. B and C represent the whole vegetation mosaic for the eastern ecoregion. Data:Natural forest cover in 2000 from BioSceneMada. Vegetation data in 2000 from Hansen et al. 2013, v.1.0. ProtectedAreas from SAPM (MEF-CIRAD database). Municipalities (ndlr, Communes) boudaries from INSTAT. ReferenceSystem: WGS84-UTM 38s. Source: Authors.
5
Études et Documents n° 13, CERDI, 2016
However, anecdotal evidence from our field visits reveals a significant transformation of
anthropized forests – namely the conversion of eucalyptus plantations into rice plantations
at the edge of some PAs where we have previously worked (see Figure A1 in the Appendix).
Some villagers repeatedly stated during informal discussions that they had decided to cul-
tivate rice on eucalyptus parcels because clearing natural [ed, protected] forests was illegal.
Thus, they simply displace rice production and deforestation elsewhere in the landscape
rather than investing in more intensive agricultural techniques as predicted in a Porter-like
hypothesis (Porter and Van der Linde 1995). By contrast, a recent study by geographers has
reported notable intensification of agricultural practices in the north-east part of Madagas-
car where large PAs have been established (Zaehringer et al. 2016). The authors hypothesize
that this intensification may have been propelled by the establishment of PAs. Our defor-
estation dataset indicates that 57,000 hectares of highly degraded forested areas and 260,000
hectares of moderately degraded forested in the eastern ecoregion were lost lost between
2000 and 2012. Part of these losses may correspond to deforestation leakages from natural
protected forests. If so, the protection of natural forests to conserve global ecosystem services
may negatively impact local inhabitants who would experienced a weakening of provisioning
ecosystem services provided by antrhopized areas.
The paper begins by theoretically highlighting via an agricultural household model tak-
ing into account ecosystem services how and under what conditions leakages from natural
habitats to anthropized forests can occur after the establishment of PAs. In our model, the
household can produce an agricultural commodity (rice) by clearing natural forests or by
clearing anthropized forested areas (e.g., plantations). Standing anthropized forests provide
the household provisioning ecosystem services (e.g. charcoal) when associated with some
labor time. The household thus faces a land use conflict over anthropized forests: either it
converts plantations in agricultural lands, harvests rice but loses direct ecosystem services,
or it keeps the plantation and enjoys the ecosystem services. We show that conservation con-
straints on natural forests such as the creation of PAs if effective, release labor time for the
household. Whether the household reallocate this time to agricultural production (the leak-
age effect), or to the production of ecosystem service will in the end depend on differences
in marginal labor productivities for the two activities. Second, we empirically test for the
presence of leakages from natural to human impacted forests between 2000 and 2012 for the
entire Malagasy rainforest. We use a panel of 13 years of fine scale Landsat vegetation cover
images to distinguish between three types of anthropized habitats: natural forests, a slightly
degraded habitat and a highly degraded one. We spatialize census data then use multi-level
6
Études et Documents n° 13, CERDI, 2016
panel regressions and matching techniques to exhibit a potential causal leakage effect of PAs.
This study contributes to the impact evaluation literature regarding nature conservation
policies. Recent studies converge to show that PAs have allowed for a reduction in defor-
estation of about 10% to 20%2. These studies have mainly focused on a small number of
countries in Latin America and South East Asia, but few concern Africa with the exception
of Gimenez (2012) and Desbureaux, Aubert, et al. (2015) that look at Madagascar. We add
to this literature by focusing on leakages. Previous studies find both close to no leakages
(Macedo et al. 2012; Soares-Filho et al. 2010), particularly negative leakages (Ewers and A. S.
Rodrigues 2008) or positive leakages (Honey-Roseés, Baylis, and Ramirez 2011; Gaveau et al.
2009; Robalino and Pfaff 2012. Our findings suggest that PAs have allowed for decreased
deforestation in Madagascar within the protected natural forests themselves but have caused
negative leakages: after the creation of PAs, deforestation in adjacent areas has increased.
To our knowledge, this papers is the first to examine leakages in a landscape, i.e. leakages
from natural habitats to already anthropized areas instead of leakages from protected natural
forests to other natural yet unprotected forests. In Madagascar, PAs are large in sizes. New
PAs cover areas of up to more than 600,000ha. Thus, leakages from protected natural forests
to other unprotected natural forests would involve population migrations and resettlement,
and would be a mid- to long-term phenomenon. By studying leakages from the protected
natural forests to anthropized forests within a municipality, our approach emphasizes a more
short-term adaptation of the behaviors of farmers. We show that the leakages on anhropized
areas have surpassed the observed decrease in deforestation within protected natural forests
during the period studied.
Additionaly, the idea of negative leakages is closely related to the literature focused on
the adoption of agricultural innovations: instead of innovating to comply with new land
use restrictions as in a Porter-like hypothesis of a forced innovation (Porter and Van der
Linde 1995), farmers stick with the same land-extensive agricultural practice and fulfill their
needs for fertile lands by displacing deforestation to unprotected areas. The hypothesis of
contextual-driven innovation has been proposed for long in the case of agrarian transitions
(Boserup 1965). This hypothesis of adjustment remains debated today, as in Madagascar
(Zaehringer et al. 2016). We discuss our results in the light of this literature to provide
thoughts on why an agricultural transition has not yet emerged for Malagasy family farmers.
The paper proceeds as follows: Section 2 provides the theoretical foundations for our
2Examples of recent studies are Andam et al. 2008; Pfaff et al. 2009; Arriagada et al. 2012 in Costa Rica ; Gaveauet al. 2009 in Indonesia ; Nolte et al. 2013 in Brazil ; Sims 2010 in Thaïland ; Alix-Garcia, Sims, and Yañez-Pagans2015; Blackman, Pfaff, and Robalino 2015 in Mexico and Nelson and Chomitz 2011 for a set of tropical countriesbut using fire data instead of direct deforestation data.
7
Études et Documents n° 13, CERDI, 2016
analysis, Section 3 describes the data, Section 4 describes the empirical strategy and Section 5
presents the empirical results of leakages for Madagascar’s rainforests. We discuss our results
in Section 6 and then conclude.
2 Theoretical Framework
In Madagascar, 80% of the population live in rural areas and rely on subsistence agriculture
for their living (Instat - EPM 2010) Rice is the staple food and the dominant crop in the
country: 87% of agricultural households grow rice as the dominant commodity (Instat –
EPM 2010). They are probably about 1.5 million individuals living directly in highly forested
areas. These forests provide them with a stock of potential fertile lands for their agricultural
activities with slash and burn being the dominant agricultural technique.
Households’ welfare also depends on local forest ecosystem services (ES hereafter) whether
they come from natural forests or anthropized forested areas. Local ES do not obviously em-
bed global ES such as forest carbon storage which can represent the main part of the value
of standing forests (e.g. Bulte et al. 2002). Local ES are rather privately appropriated by
households. They mainly consist in the provision of charcoal and construction woods. All
subsistence generating activities depend on land and labor inputs.
2.1 The Setup
We model the production choice of a welfare maximizing agricultural household in the pres-
ence of multiple types of lands that provide different ES. Motivated by the Malagasy context
and following several authors (e.g. De Janvry, Fafchamps, and Sadoulet 1991), it is assumed
that the labor market is shallow (i.e. households are self-sufficient in labor), and that labor
cannot be traded on the market. There is neither off-farm labor nor rented labor. We denote
L the stock of labor held by the household.
We assume that the household produces a single agricultural commodity, let’s say rice,
for subsistence purposes. Subsistence cropping is mainly conducted on cleared land, through
slash-and-burn agriculture (only 12% of agricultural lands are irrigated rice parcels in the
eastern eco-region, Table 1). Land can be cleared either on natural forests (practiced known
as tavy in Madagascar) or on secondary forested areas (teviala). We call A1 the amount of
converted lands by the household on natural forests. When no conservation effort is imple-
mented, natural forests are de facto freely accessible. The implementation of protected areas is
modeled as an upper constraint A on land converted from natural forests. Secondary forests
8
Études et Documents n° 13, CERDI, 2016
are constituted for instance by eucalyptus plantations. Since they stem from previously con-
verted forests, it is assumed that their surfaces A2 is fixed. Two types of activities can take
place in secondary forests: A2 can be cleared once again for subsistence purposes (rice pro-
duction) while A2− A2 can be kept in place for the provision of ES (e.g., charcoal production).
The household therefore faces a double trade-off: (i) Producing rice on land plots encroached
either on natural or secondary forests; and (ii) Allocating secondary forested areas to rice or
ES provision.
We call Y1(A1, L1) the return on rice grown on A1 units of cleared natural forests with
L1 units of labor. Y2(A2, L2) is the return on rice grown on A2 units of cleared secondary
forests with L2 units of labor. Y3(A2 − A2, L− L1 − L2) stands for the return on the provision
of local ES which rely on remained secondary forested areas A2 − A2 and on remained labor
L− L1 − L2. Yi are net of labor and other input costs.
The question is whether an increase i, conservation effort such as the implementation of
PAs will induce deforestation leakages i.e., an increase in deforestation on secondary forests
A2?.
Our model shares several features with the agricultural household models’ literature ini-
tiated by Singh, Squire, and Strauss (1986). It is however different in several ways. First,
production and consumption decisions are separable. Consequently labor allocation deci-
sions do not depend on household composition (see e.g. Benjamin 1992). Second, the model
does not address the question of market failures (e.g. De Janvry, Fafchamps, and Sadoulet
1991). There exists several examples of models of land conversion (among several authors:
Angelsen and Kaimowitz 1999; Barbier 2007; Delacote and Angelsen 2015) but to the best of
our knowledge, none explicitly modeled deforestation leakages induced by the implementa-
tion of PAs.
2.2 The household maximization program
Once the Yi are aggregated, they constitute the net return from agricultural production and
local ES provision, denoted π. π is supposed to be strictly quasi-concave. Cross derivatives
are assumed to be strictly positive. More generally, it is supposed to be well-behaved so that
all solutions are interior. Formally, the problem is:
maxA1,A2,L1,L2 π ≡ Y1(A1, L1) + Y2(A2, L2) + Y3(A2 − A2, L− L1 − L2) such that A1 < A
The inequality constraint A1 < A corresponds to the conservation constraint: a decrease
9
Études et Documents n° 13, CERDI, 2016
in A denotes an increase in the conservation effort i.e. an increase in natural forests included
in PAs. The corresponding Lagrangean function writes as:
LA1,A2,L1,L2,µ;A,A2,L ≡ Y1(A1, L1) + Y2(A2, L2) + Y3(A2 − A2, L− L1 − L2)− µ(A1 − A)
where µ is the non-negative multiplier. It represents the implicit additional cost born by
households when PAs are implemented. This theoretical setting allows taking into account
local benefits extracted from standing forests but without internalizing global benefits such
as carbon storage. The potential conflict between local and global benefits from conservation
initiatives is not taken into account (Perrings and Gadgil 2003).
First order necessary conditions (FONC) for an interior solution are:
FONC :
∂L?
∂A1= 0⇔ ∂Y1
∂A1− µ = 0
∂L?
∂A2= 0⇔ ∂Y2
∂A2− ∂Y3
∂A = 0
∂L?
∂L1= 0⇔ ∂Y1
∂L1− ∂Y3
∂L = 0
∂L?
∂L2= 0⇔ ∂Y2
∂L2− ∂Y3
∂L = 0 ∂L?
∂µ ≥ 0, µ ≥ 0
and µ ∂L?
∂µ = 0 i.e. −A1 + A ≥ 0, µ(
A1 − A)= 0
From the envelope theorem, the overall effect of the conservation effort is shown to have
a non-positive impact on the maximized profit: ∂π?
∂A = ∂L∗∂A = µ > 0. The quasi-concavity
of π ensures the existence of a maximum (Appendix B1). As a consequence, FONC allows
defining A1, A2, L1 and L2 as implicit functions of exogenous parameters. In the following,
we are particularly interested in the effect of A on the demands for agricultural factors.
Remark 1: For the sake of simplicity it is assumed that conservation effort is linear in A.
However, one hectare of PA often does not mean one hectare effectively protected because of
imperfect law enforcement in tropical countries. See in the appendix the discussion on that.
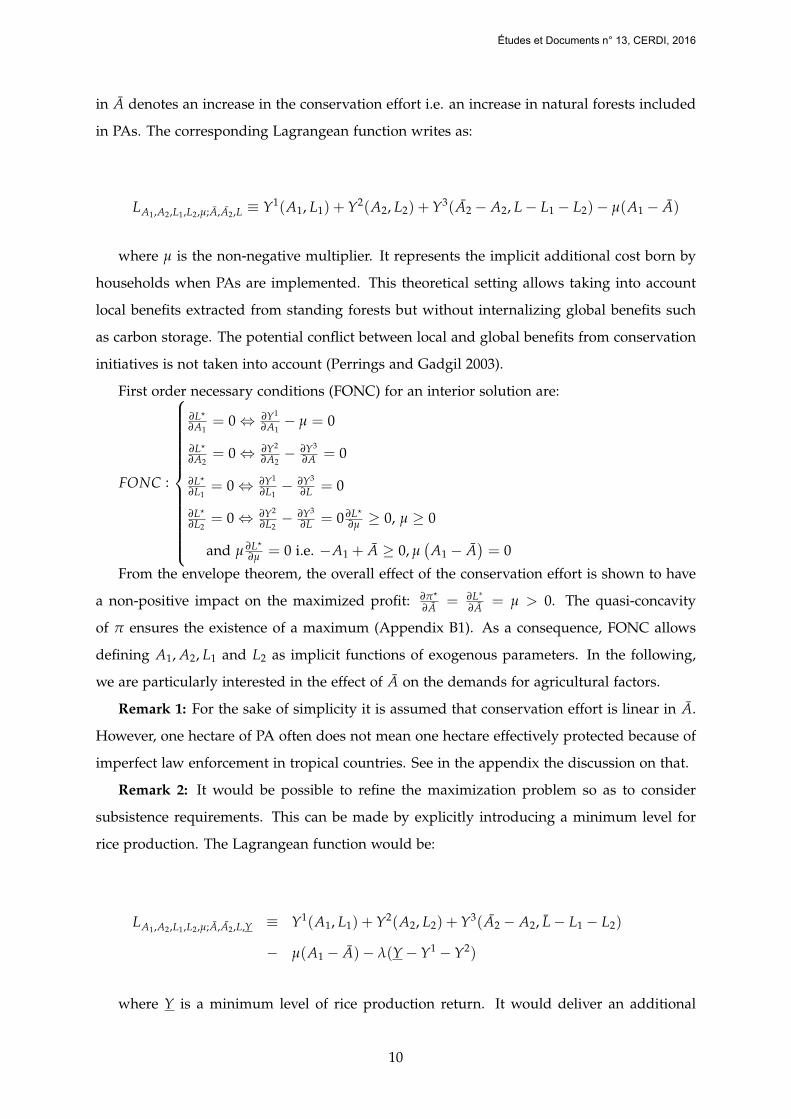
Remark 2: It would be possible to refine the maximization problem so as to consider
subsistence requirements. This can be made by explicitly introducing a minimum level for
rice production. The Lagrangean function would be:
LA1,A2,L1,L2,µ;A,A2,L,Y ≡ Y1(A1, L1) + Y2(A2, L2) + Y3(A2 − A2, L− L1 − L2)
− µ(A1 − A)− λ(Y−Y1 −Y2)
where Y is a minimum level of rice production return. It would deliver an additional
10
Études et Documents n° 13, CERDI, 2016
FONC written as: ∂L?
∂λ ≥ 0, λ ≥ 0 and λ ∂L?
∂λ = 0.
Another possibility would be to maximize the indirect utility function V of the returns
from rice production and local SE provision: V(Y1(A1, L1) + Y2(A2, L2) + Y3(A2 − A2, L −
L1 − L2)) under the additional constraint V(Y1(A1, L1) + Y2(A2, L2) + Y3(A2 − A2, L− L1 −
L2)) ≥ V0. This idea was explored by Pagiola (1995) in a dynamic setting.
Remark 3: We present here a static model. As highlighted by Porter, in a dynamic model
the establishment of environmental regulations might incite the household to invest in new
and more intensive agricultural practice to comply with the law, and in our case, thus ensure
the provision of ES. However in Madagascar, we observe a limited adoption of agricultural
practices in general (Minten and Barrett 2008). We thus believe that our static framework is
sufficient to capture insights in the Malagasy context.
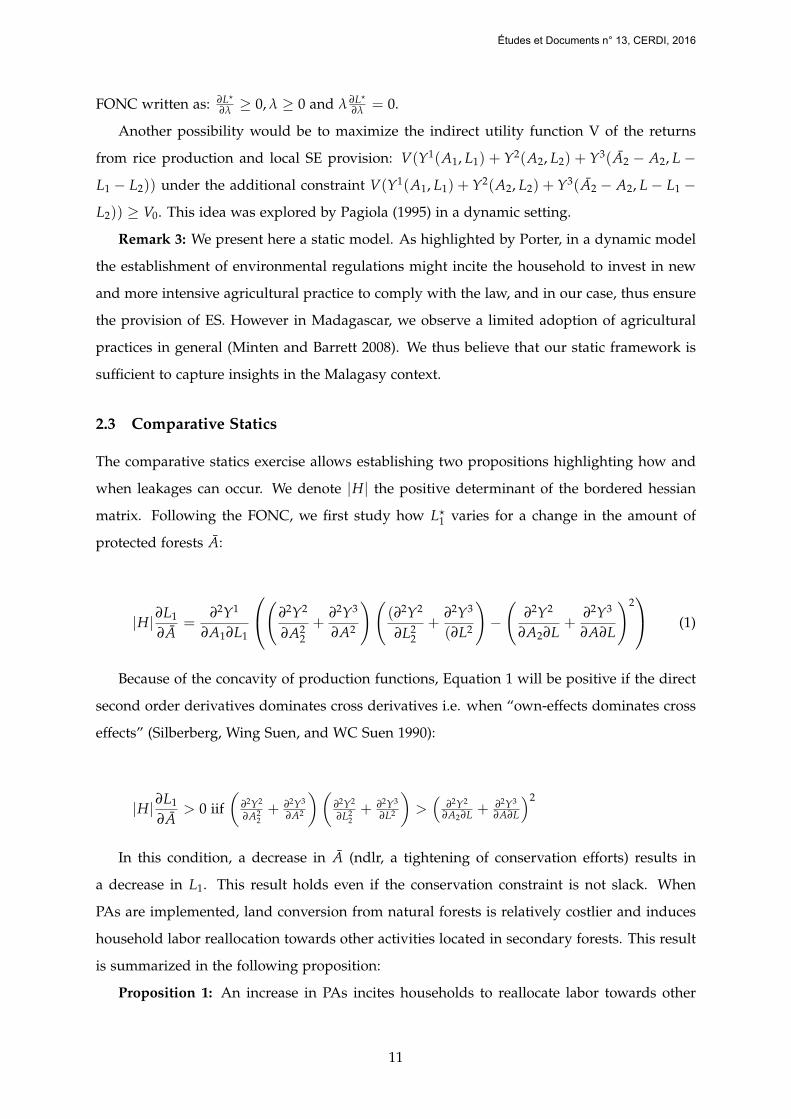
2.3 Comparative Statics
The comparative statics exercise allows establishing two propositions highlighting how and
when leakages can occur. We denote |H| the positive determinant of the bordered hessian
matrix. Following the FONC, we first study how L?1 varies for a change in the amount of
protected forests A:
|H|∂L1
∂A=
∂2Y1
∂A1∂L1
(∂2Y2
∂A22+
∂2Y3
∂A2
)((∂2Y2
∂L22
+∂2Y3
(∂L2
)−(
∂2Y2
∂A2∂L+
∂2Y3
∂A∂L
)2 (1)
Because of the concavity of production functions, Equation 1 will be positive if the direct
second order derivatives dominates cross derivatives i.e. when “own-effects dominates cross
effects” (Silberberg, Wing Suen, and WC Suen 1990):
|H|∂L1
∂A> 0 iif
(∂2Y2
∂A22+ ∂2Y3
∂A2
)(∂2Y2
∂L22+ ∂2Y3
∂L2
)>(
∂2Y2
∂A2∂L + ∂2Y3
∂A∂L
)2
In this condition, a decrease in A (ndlr, a tightening of conservation efforts) results in
a decrease in L1. This result holds even if the conservation constraint is not slack. When
PAs are implemented, land conversion from natural forests is relatively costlier and induces
household labor reallocation towards other activities located in secondary forests. This result
is summarized in the following proposition:
Proposition 1: An increase in PAs incites households to reallocate labor towards other
11
Études et Documents n° 13, CERDI, 2016
activities under rapidly decreasing marginal productivity of labor on secondary forests.
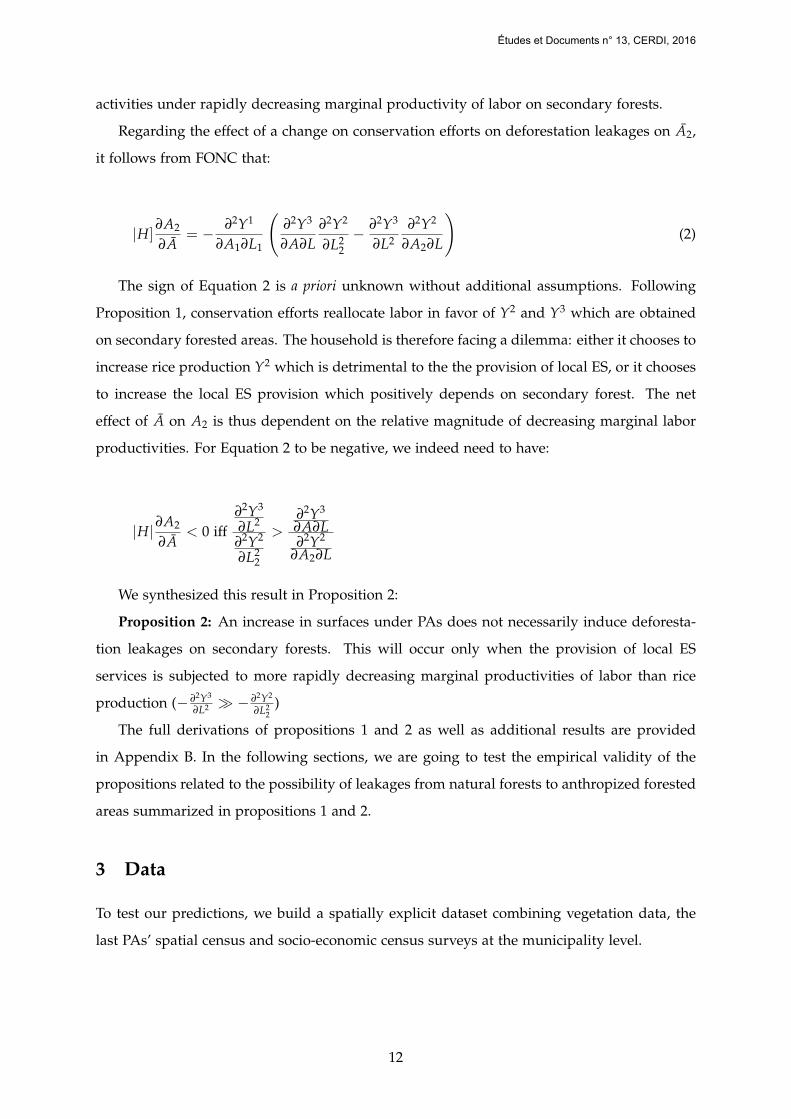
Regarding the effect of a change on conservation efforts on deforestation leakages on A2,
it follows from FONC that:
|H]∂A2
∂A= − ∂2Y1
∂A1∂L1
(∂2Y3
∂A∂L∂2Y2
∂L22− ∂2Y3
∂L2∂2Y2
∂A2∂L
)(2)
The sign of Equation 2 is a priori unknown without additional assumptions. Following
Proposition 1, conservation efforts reallocate labor in favor of Y2 and Y3 which are obtained
on secondary forested areas. The household is therefore facing a dilemma: either it chooses to
increase rice production Y2 which is detrimental to the the provision of local ES, or it chooses
to increase the local ES provision which positively depends on secondary forest. The net
effect of A on A2 is thus dependent on the relative magnitude of decreasing marginal labor
productivities. For Equation 2 to be negative, we indeed need to have:
|H|∂A2
∂A< 0 iff
∂2Y3
∂L2
∂2Y2
∂L22
>∂2Y3
∂A∂L∂2Y2
∂A2∂L
We synthesized this result in Proposition 2:
Proposition 2: An increase in surfaces under PAs does not necessarily induce deforesta-
tion leakages on secondary forests. This will occur only when the provision of local ES
services is subjected to more rapidly decreasing marginal productivities of labor than rice
production (− ∂2Y3
∂L2 � − ∂2Y2
∂L22
)
The full derivations of propositions 1 and 2 as well as additional results are provided
in Appendix B. In the following sections, we are going to test the empirical validity of the
propositions related to the possibility of leakages from natural forests to anthropized forested
areas summarized in propositions 1 and 2.
3 Data
To test our predictions, we build a spatially explicit dataset combining vegetation data, the
last PAs’ spatial census and socio-economic census surveys at the municipality level.
12
Études et Documents n° 13, CERDI, 2016
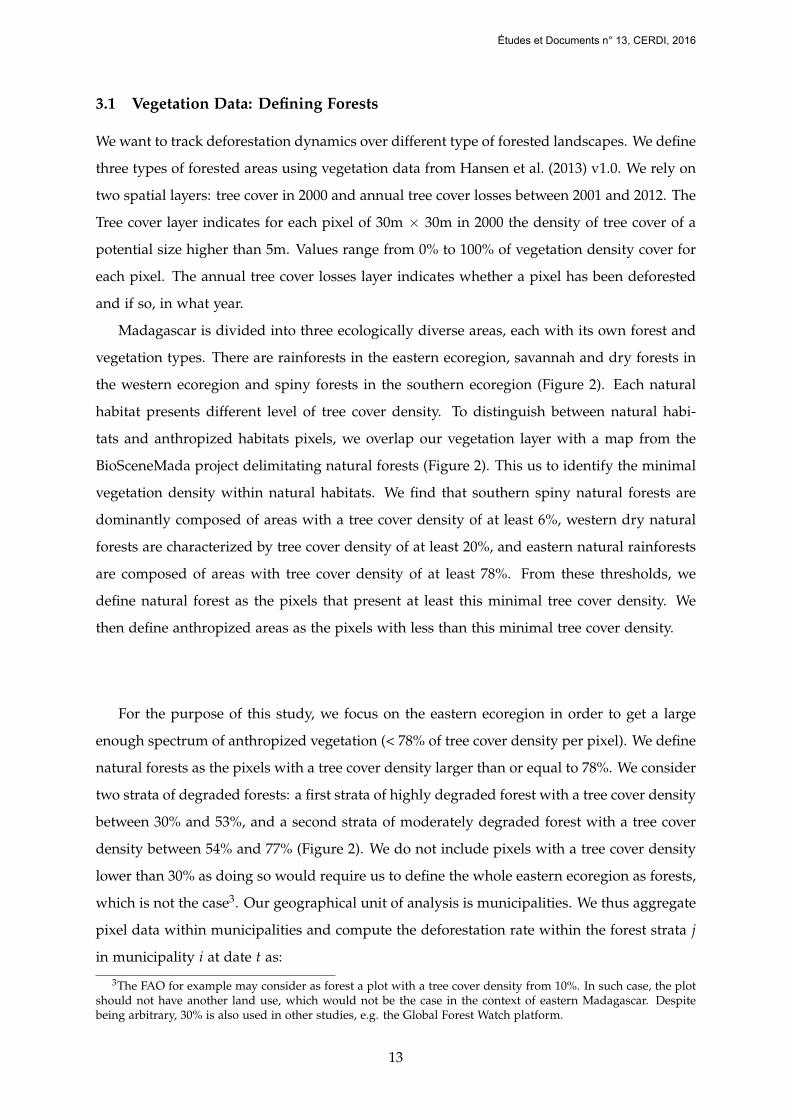
3.1 Vegetation Data: Defining Forests
We want to track deforestation dynamics over different type of forested landscapes. We define
three types of forested areas using vegetation data from Hansen et al. (2013) v1.0. We rely on
two spatial layers: tree cover in 2000 and annual tree cover losses between 2001 and 2012. The
Tree cover layer indicates for each pixel of 30m × 30m in 2000 the density of tree cover of a
potential size higher than 5m. Values range from 0% to 100% of vegetation density cover for
each pixel. The annual tree cover losses layer indicates whether a pixel has been deforested
and if so, in what year.
Madagascar is divided into three ecologically diverse areas, each with its own forest and
vegetation types. There are rainforests in the eastern ecoregion, savannah and dry forests in
the western ecoregion and spiny forests in the southern ecoregion (Figure 2). Each natural
habitat presents different level of tree cover density. To distinguish between natural habi-
tats and anthropized habitats pixels, we overlap our vegetation layer with a map from the
BioSceneMada project delimitating natural forests (Figure 2). This us to identify the minimal
vegetation density within natural habitats. We find that southern spiny natural forests are
dominantly composed of areas with a tree cover density of at least 6%, western dry natural
forests are characterized by tree cover density of at least 20%, and eastern natural rainforests
are composed of areas with tree cover density of at least 78%. From these thresholds, we
define natural forest as the pixels that present at least this minimal tree cover density. We
then define anthropized areas as the pixels with less than this minimal tree cover density.
For the purpose of this study, we focus on the eastern ecoregion in order to get a large
enough spectrum of anthropized vegetation (< 78% of tree cover density per pixel). We define
natural forests as the pixels with a tree cover density larger than or equal to 78%. We consider
two strata of degraded forests: a first strata of highly degraded forest with a tree cover density
between 30% and 53%, and a second strata of moderately degraded forest with a tree cover
density between 54% and 77% (Figure 2). We do not include pixels with a tree cover density
lower than 30% as doing so would require us to define the whole eastern ecoregion as forests,
which is not the case3. Our geographical unit of analysis is municipalities. We thus aggregate
pixel data within municipalities and compute the deforestation rate within the forest strata j
in municipality i at date t as:
3The FAO for example may consider as forest a plot with a tree cover density from 10%. In such case, the plotshould not have another land use, which would not be the case in the context of eastern Madagascar. Despitebeing arbitrary, 30% is also used in other studies, e.g. the Global Forest Watch platform.
13
Études et Documents n° 13, CERDI, 2016
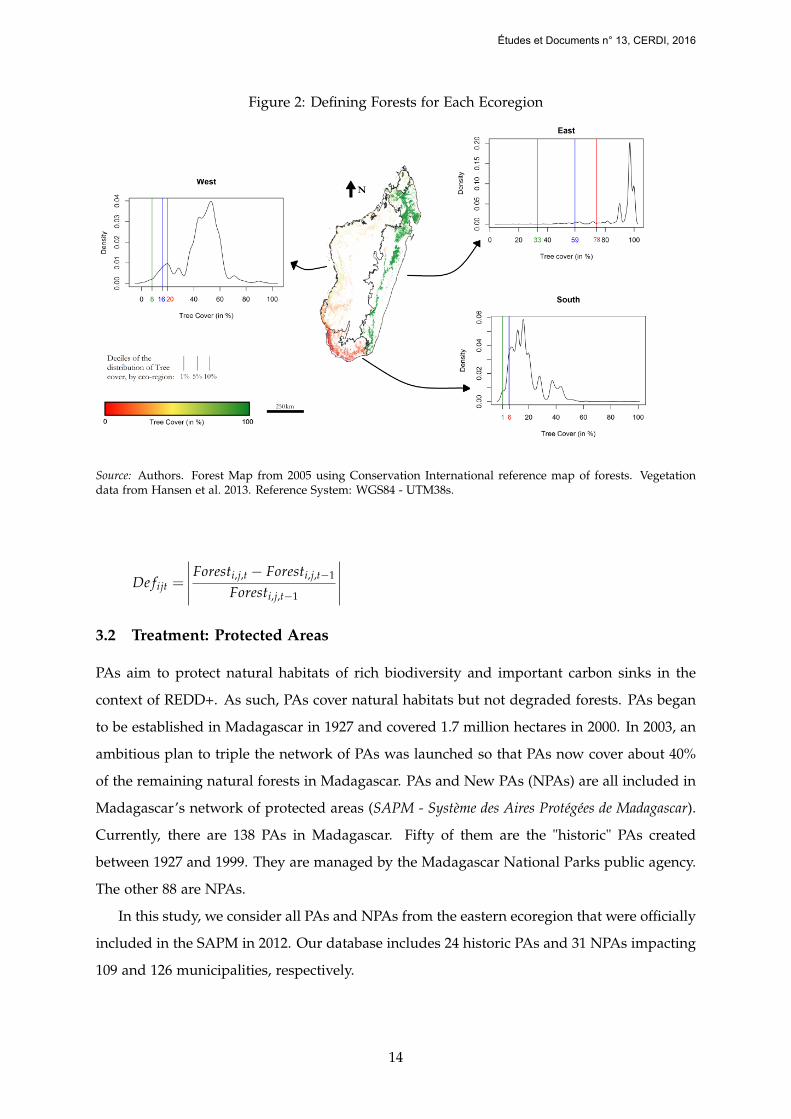
Figure 2: Defining Forests for Each Ecoregion
Source: Authors. Forest Map from 2005 using Conservation International reference map of forests. Vegetationdata from Hansen et al. 2013. Reference System: WGS84 - UTM38s.
De fijt =
∣∣∣∣∣Foresti,j,t − Foresti,j,t−1
Foresti,j,t−1
∣∣∣∣∣3.2 Treatment: Protected Areas
PAs aim to protect natural habitats of rich biodiversity and important carbon sinks in the
context of REDD+. As such, PAs cover natural habitats but not degraded forests. PAs began
to be established in Madagascar in 1927 and covered 1.7 million hectares in 2000. In 2003, an
ambitious plan to triple the network of PAs was launched so that PAs now cover about 40%
of the remaining natural forests in Madagascar. PAs and New PAs (NPAs) are all included in
Madagascar’s network of protected areas (SAPM - Système des Aires Protégées de Madagascar).
Currently, there are 138 PAs in Madagascar. Fifty of them are the "historic" PAs created
between 1927 and 1999. They are managed by the Madagascar National Parks public agency.
The other 88 are NPAs.
In this study, we consider all PAs and NPAs from the eastern ecoregion that were officially
included in the SAPM in 2012. Our database includes 24 historic PAs and 31 NPAs impacting
109 and 126 municipalities, respectively.
14
Études et Documents n° 13, CERDI, 2016
3.3 Control Variables
Finally, we construct a set of control covariates. First, we use census data from the ILO
Cornell project (2001). The census includes information on economic, social and political
characteristics for 1,385 of the country’s 1,392 municipalities, known in Madagascar as com-
munes. Particularly, we use information regarding the size of the population, the share of
irrigated rice parcels (i.e., the alternative to slash and burn) and the share of impoverished
people (people who face recurrent food shortage every years). These three variables will
have a direct impact on deforestation. We spatialize the census and match it with official
municipality’ boundaries.
Second, we construct a set of bio-physical covariates for each municipality: average slope,
average elevation, average Euclidean distance to nearest road (Deininger and Minten 2002).
Within each municipality, we determine the same bio-physical measures for each of the three
vegetation strata. To compute them, we draw a random sample of 60,000 pixels for each strata
and average the values inside each municipality.
At the end, we have a sample of 688 municipalities of which 561 have a natural forest
cover larger than 50 hectares4. Data sources and summary statistics are provided in Table 1.
4 Empirical Strategy
For each municipality, we consider the three main categories of forest cover: natural forest
(more than 78% forest cover density), slightly degraded anthropized forest (forest cover be-
tween 54 and 78% density) and highly degraded anthropized forest (between 30 and 54%
of forest cover density). We seek to determine if the establishment of a PA within a given
municipality has decreased deforestation on natural forests but has caused an increase in
deforestation on anthropized areas in the same municipality.
To avoid confounding effects, we control for other determinants of deforestation. These
include both the location characteristics of forest cover (altitude, slope and distance to the
nearest road of each type of forest within a municipality) and the characteristics of the mu-
nicipality itself. For example, two natural forests with similar characteristics may have very
different rates of deforestation if the municipal context is not the same. The context can be
captured here by including demographic or agricultural pressures. The characteristics of the
municipality allow for capturing contextual effects (Manski 1993). The hierarchical nature
4We drop municipalities with less than 50 hectares of natural forest cover as PAs aim at protecting large pathsof remaining natural forests. Hence, including localities with almost no forest would bias estimates as thesemunicipalities are structurally different from those still covered by important areas of natural forests.
15
Études et Documents n° 13, CERDI, 2016
of the determinants (forest strata and municipal) allows us to estimate a multilevel model.
Multilevel models provide a natural framework for accounting for the correlation of observa-
tions within the municipalities. This correlation refers to correlated effects (Manski 1993), and
according to Anselin (2002) and Wendland et al. (2011) they allow for taking into account the
spatial correlation of the error term in municipalities. However, multilevel models assume
that the explanatory variables and random effects are independent. If this assumption is vio-
lated the estimation results may be biased. This problem of correlation can be dealt with by
a within (-group) transformation of the explanatory variables.
The econometric model has the following specification:
De fijt = β0 + β1Cover54ijt + β2Cover30ijt + β3PAjt + β4Cover54ijt × PAjt + β5Cover30ijt × PAjt
+ β6
(Xijt − Xijt
)+ β7Xijt + β8Zj + νt + µj + εi jt
where index i represents the forest cover category, j refers to the municipality and t is a
time index. De fijt is the deforestation rate of each forest cover category i in municipality j in
year t, Cover54ij and Cover30ij are the fixed effects associated with forest cover. They are set to
1 when the forest cover is between 54 and 78% and between 30 and 54% respectively. PAjt is a
binary variable equal to 1 if the natural forest is protected in the municipality j in year t. Xijt
are location variables measured for each forest cover category i in municipality j at year t and
Zj are contextual variables. We crossed the protected area variable with forest cover categories
(Cover54ijt× PAjt and Cover30ijt× PAjt) in order to capture the leakage effect of deforestation
of protected natural forests protected on secondary forests within municipalities. Parameters
β0, β1, β2, β3, β4, β5, β6, β7 and β8 are the regression coefficients to be estimated.
The error term is broken down into three parts. The first component νt ∼ N(0, σν2) is spe-
cific to the year and constant between forest cover categories and municipalities. The second
component is µj ∼ N(0, σµ2) which is specific to the municipality and constant between forest
cover categories of the same municipality. The last component varies between year, forest
cover categories and municipalities, and is designated as εijt ∼ N(0, σε2).
5 Empirical Results
Compared to natural forests, anthropized forests are found at a lower altitude and on flat-
ter areas, closer to roads. In other words, Anthropized forests are in areas more prone to
economic activities (Angelsen and Kaimowitz 1999) and consequently were the first to be
16
Études et Documents n° 13, CERDI, 2016
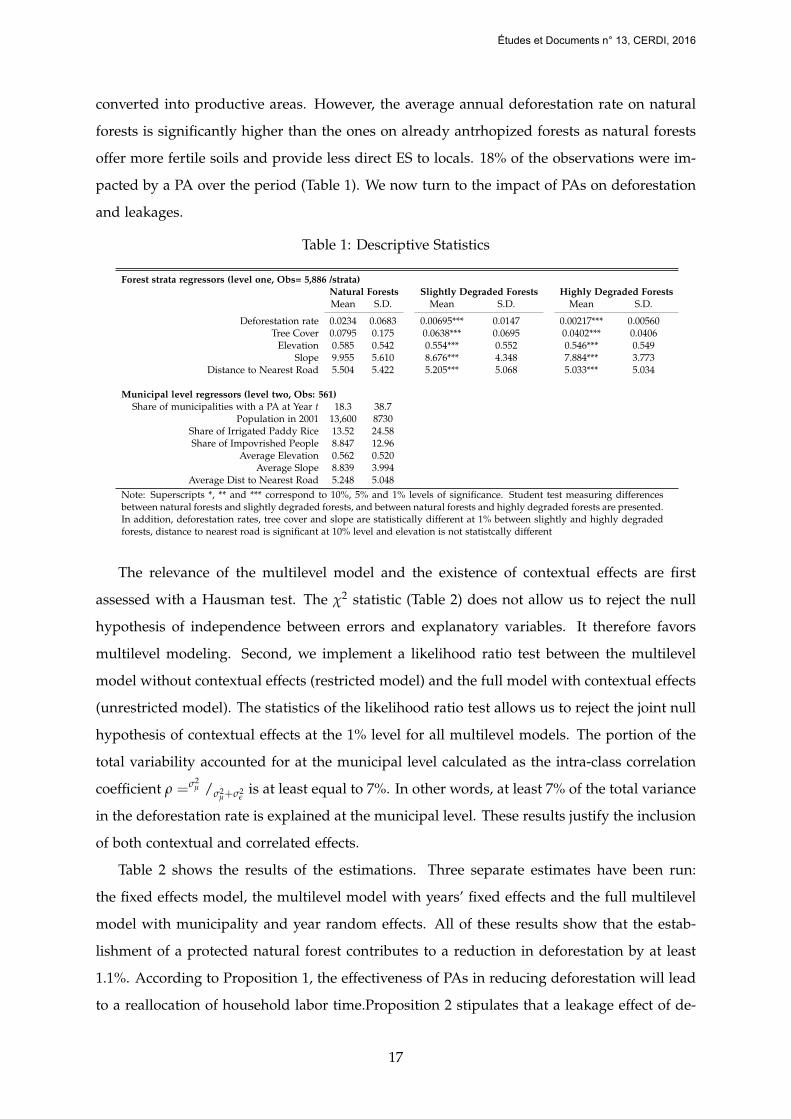
converted into productive areas. However, the average annual deforestation rate on natural
forests is significantly higher than the ones on already antrhopized forests as natural forests
offer more fertile soils and provide less direct ES to locals. 18% of the observations were im-
pacted by a PA over the period (Table 1). We now turn to the impact of PAs on deforestation
and leakages.
Table 1: Descriptive Statistics
Forest strata regressors (level one, Obs= 5,886 /strata)Natural Forests Slightly Degraded Forests Highly Degraded ForestsMean S.D. Mean S.D. Mean S.D.
Deforestation rate 0.0234 0.0683 0.00695*** 0.0147 0.00217*** 0.00560Tree Cover 0.0795 0.175 0.0638*** 0.0695 0.0402*** 0.0406
Elevation 0.585 0.542 0.554*** 0.552 0.546*** 0.549Slope 9.955 5.610 8.676*** 4.348 7.884*** 3.773
Distance to Nearest Road 5.504 5.422 5.205*** 5.068 5.033*** 5.034
Municipal level regressors (level two, Obs: 561)Share of municipalities with a PA at Year t 18.3 38.7
Population in 2001 13,600 8730Share of Irrigated Paddy Rice 13.52 24.58Share of Impovrished People 8.847 12.96
Average Elevation 0.562 0.520Average Slope 8.839 3.994
Average Dist to Nearest Road 5.248 5.048Note: Superscripts *, ** and *** correspond to 10%, 5% and 1% levels of significance. Student test measuring differencesbetween natural forests and slightly degraded forests, and between natural forests and highly degraded forests are presented.In addition, deforestation rates, tree cover and slope are statistically different at 1% between slightly and highly degradedforests, distance to nearest road is significant at 10% level and elevation is not statistcally different
The relevance of the multilevel model and the existence of contextual effects are first
assessed with a Hausman test. The χ2 statistic (Table 2) does not allow us to reject the null
hypothesis of independence between errors and explanatory variables. It therefore favors
multilevel modeling. Second, we implement a likelihood ratio test between the multilevel
model without contextual effects (restricted model) and the full model with contextual effects
(unrestricted model). The statistics of the likelihood ratio test allows us to reject the joint null
hypothesis of contextual effects at the 1% level for all multilevel models. The portion of the
total variability accounted for at the municipal level calculated as the intra-class correlation
coefficient ρ =σ2µ /σ2
µ+σ2ε
is at least equal to 7%. In other words, at least 7% of the total variance
in the deforestation rate is explained at the municipal level. These results justify the inclusion
of both contextual and correlated effects.
Table 2 shows the results of the estimations. Three separate estimates have been run:
the fixed effects model, the multilevel model with years’ fixed effects and the full multilevel
model with municipality and year random effects. All of these results show that the estab-
lishment of a protected natural forest contributes to a reduction in deforestation by at least
1.1%. According to Proposition 1, the effectiveness of PAs in reducing deforestation will lead
to a reallocation of household labor time.Proposition 2 stipulates that a leakage effect of de-
17
Études et Documents n° 13, CERDI, 2016
forestation is not automatic. Here, the coefficients associated with multiplicative variables
(Cover30ijt × PAjt and Cover54ijt × PAjt) are positive and significant. This indicates that de-
forestation increases by about 1% in each of the two categories of anthropized forests that are
located in the municipalities where the natural forest is protected. In other words, there is a
leakage of deforestation from protected natural forests to anthropized forests in the same mu-
nicipality. Based on Proposition 2, this leakage effect can partly be explained by more rapidly
decreasing marginal productivity of labor in the provision of local ES over rice production.
Taken globally, because of the leakage effect, PAs seem ineffective or even counterproduc-
tive in terms of vegetation cover changes. Indeed, one can define the net impact of PAs on
cover changes is the sum of avoided deforestation and the induced leakages. Tests on the sum
of the coefficients (β3 + β4 + β5) presented in Table 1 show that PAs generate a net increase
of 1% in vegetation clearing. Indeed, as the anthropized forests are less fertile, households
must clear more land for the same level of agricultural productivity. Therefore, the leakage of
deforestation from natural forests to anthropized forests exceeds avoided deforestation. We
would, however, need to convert these physical land use changes in economically more rele-
vant values (ecosystem services, rice production) to get a broader view of the welfare impact
of PAs (Vincent 2015).
Finally, our results show that forest cover, slope, elevation, distance from roads and the
percentage of land devoted to rice production are associated with lower deforestation. For
better efficiency, conservation policies must be supported by rural development policies in
particular the promotion of agricultural intensification techniques (use of fertilizers or irri-
gation land), processing of agricultural products and the development of non-agricultural
income generating activities.
5.1 Robustness Check: Evidence from Matching Techniques
The regression results may be biased if treated and non-treated municipalities do not have
the same average deforestation rate. For example, if treated municipalities are intrinsically
exposed to lower deforestation than those from the control group, traditional models would
overestimate the impact of PAs (Ferraro 2009; Joppa and Pfaff 2009). Therefore, we need to
find an acceptable counterfactual group to estimate an unbiased effect of protected areas and
their leakage effects. We use a reweighting technique, entropy balancing (Hainmueller 2012),
in order to ensure that the distribution of covariates is the same in the control group and
in the treated group. Entropy balancing attains more effective results than propensity score
or mahanolobis methods when reducing covariate imbalances. In practice in a first step, we
18
Études et Documents n° 13, CERDI, 2016
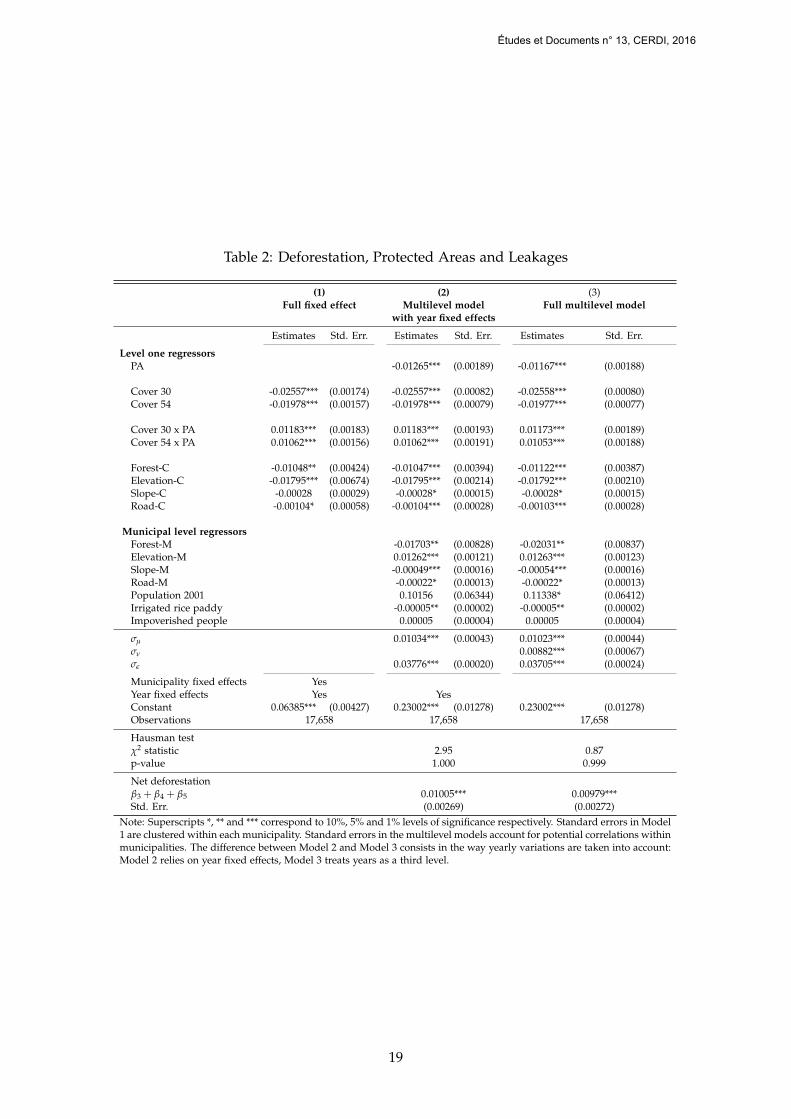
Table 2: Deforestation, Protected Areas and Leakages
(1) (2) (3)Full fixed effect Multilevel model Full multilevel model
with year fixed effects
Estimates Std. Err. Estimates Std. Err. Estimates Std. Err.
Level one regressorsPA -0.01265*** (0.00189) -0.01167*** (0.00188)
Cover 30 -0.02557*** (0.00174) -0.02557*** (0.00082) -0.02558*** (0.00080)Cover 54 -0.01978*** (0.00157) -0.01978*** (0.00079) -0.01977*** (0.00077)
Cover 30 x PA 0.01183*** (0.00183) 0.01183*** (0.00193) 0.01173*** (0.00189)Cover 54 x PA 0.01062*** (0.00156) 0.01062*** (0.00191) 0.01053*** (0.00188)
Forest-C -0.01048** (0.00424) -0.01047*** (0.00394) -0.01122*** (0.00387)Elevation-C -0.01795*** (0.00674) -0.01795*** (0.00214) -0.01792*** (0.00210)Slope-C -0.00028 (0.00029) -0.00028* (0.00015) -0.00028* (0.00015)Road-C -0.00104* (0.00058) -0.00104*** (0.00028) -0.00103*** (0.00028)
Municipal level regressorsForest-M -0.01703** (0.00828) -0.02031** (0.00837)Elevation-M 0.01262*** (0.00121) 0.01263*** (0.00123)Slope-M -0.00049*** (0.00016) -0.00054*** (0.00016)Road-M -0.00022* (0.00013) -0.00022* (0.00013)Population 2001 0.10156 (0.06344) 0.11338* (0.06412)Irrigated rice paddy -0.00005** (0.00002) -0.00005** (0.00002)Impoverished people 0.00005 (0.00004) 0.00005 (0.00004)
σµ 0.01034*** (0.00043) 0.01023*** (0.00044)σν 0.00882*** (0.00067)σε 0.03776*** (0.00020) 0.03705*** (0.00024)
Municipality fixed effects YesYear fixed effects Yes YesConstant 0.06385*** (0.00427) 0.23002*** (0.01278) 0.23002*** (0.01278)Observations 17,658 17,658 17,658
Hausman testχ2 statistic 2.95 0.87p-value 1.000 0.999
Net deforestationβ3 + β4 + β5 0.01005*** 0.00979***Std. Err. (0.00269) (0.00272)
Note: Superscripts *, ** and *** correspond to 10%, 5% and 1% levels of significance respectively. Standard errors in Model1 are clustered within each municipality. Standard errors in the multilevel models account for potential correlations withinmunicipalities. The difference between Model 2 and Model 3 consists in the way yearly variations are taken into account:Model 2 relies on year fixed effects, Model 3 treats years as a third level.
19
Études et Documents n° 13, CERDI, 2016
determine a set of entropy weights that allows us to match the means of the covariates in the
treatment group with those in the reweighted control group. In a second step, we perform
the multilevel model by weighting this regression with the entropy weights. The coefficient
associated with the treatment variable can be considered as the average treatment effect. Ta-
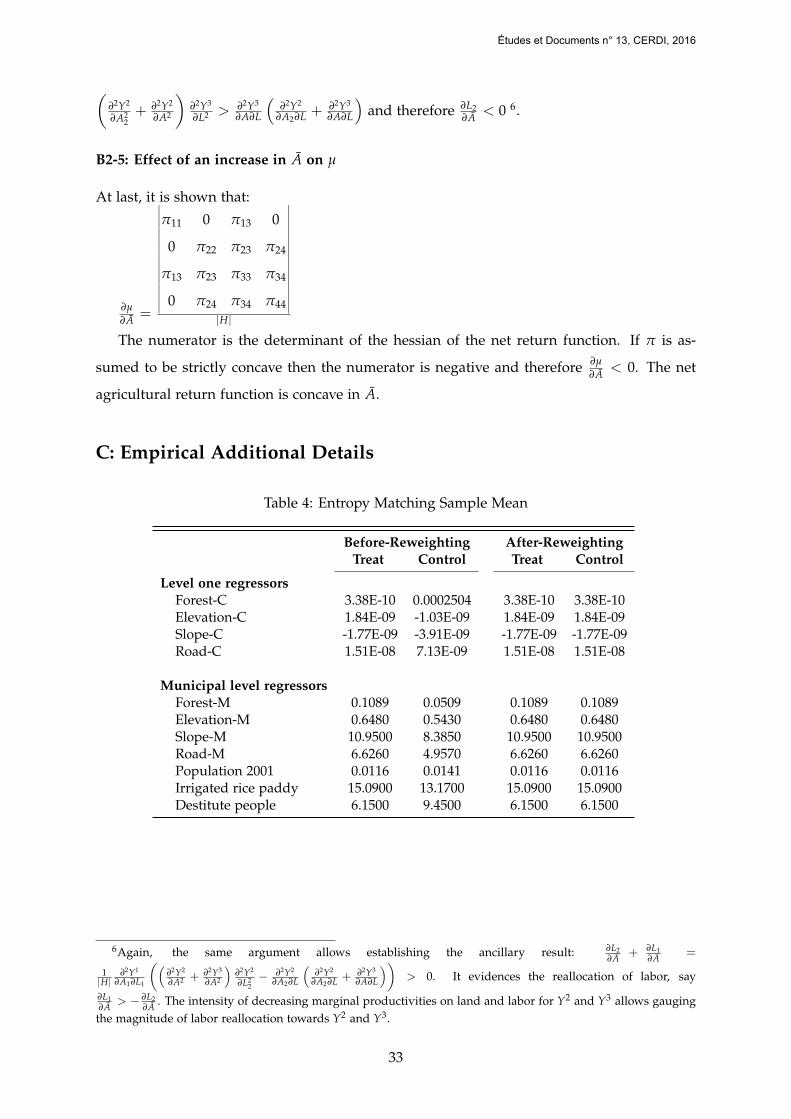
ble C.1 in Appendix C presents the mean of the distribution of covariates before and after the
reweighting. This table shows that after the reweighting procedure, the control and treated
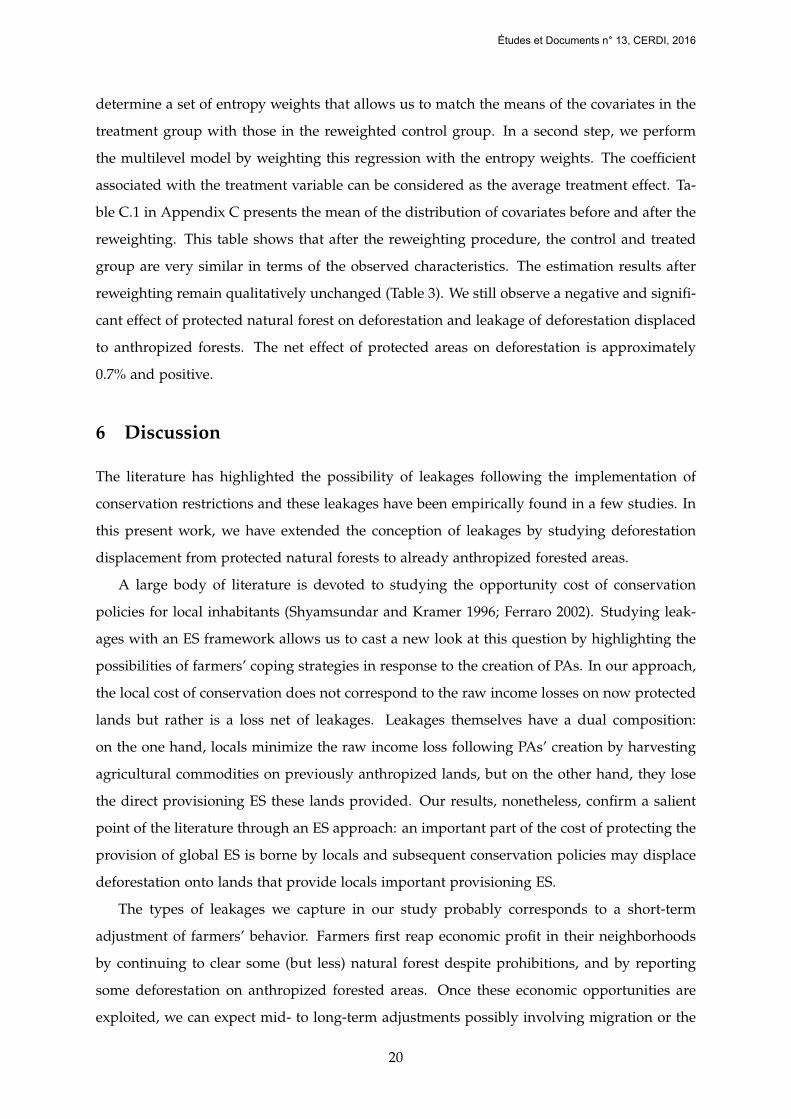
group are very similar in terms of the observed characteristics. The estimation results after
reweighting remain qualitatively unchanged (Table 3). We still observe a negative and signifi-
cant effect of protected natural forest on deforestation and leakage of deforestation displaced
to anthropized forests. The net effect of protected areas on deforestation is approximately
0.7% and positive.
6 Discussion
The literature has highlighted the possibility of leakages following the implementation of
conservation restrictions and these leakages have been empirically found in a few studies. In
this present work, we have extended the conception of leakages by studying deforestation
displacement from protected natural forests to already anthropized forested areas.
A large body of literature is devoted to studying the opportunity cost of conservation
policies for local inhabitants (Shyamsundar and Kramer 1996; Ferraro 2002). Studying leak-
ages with an ES framework allows us to cast a new look at this question by highlighting the
possibilities of farmers’ coping strategies in response to the creation of PAs. In our approach,
the local cost of conservation does not correspond to the raw income losses on now protected
lands but rather is a loss net of leakages. Leakages themselves have a dual composition:
on the one hand, locals minimize the raw income loss following PAs’ creation by harvesting
agricultural commodities on previously anthropized lands, but on the other hand, they lose
the direct provisioning ES these lands provided. Our results, nonetheless, confirm a salient
point of the literature through an ES approach: an important part of the cost of protecting the
provision of global ES is borne by locals and subsequent conservation policies may displace
deforestation onto lands that provide locals important provisioning ES.
The types of leakages we capture in our study probably corresponds to a short-term
adjustment of farmers’ behavior. Farmers first reap economic profit in their neighborhoods
by continuing to clear some (but less) natural forest despite prohibitions, and by reporting
some deforestation on anthropized forested areas. Once these economic opportunities are
exploited, we can expect mid- to long-term adjustments possibly involving migration or the
20
Études et Documents n° 13, CERDI, 2016
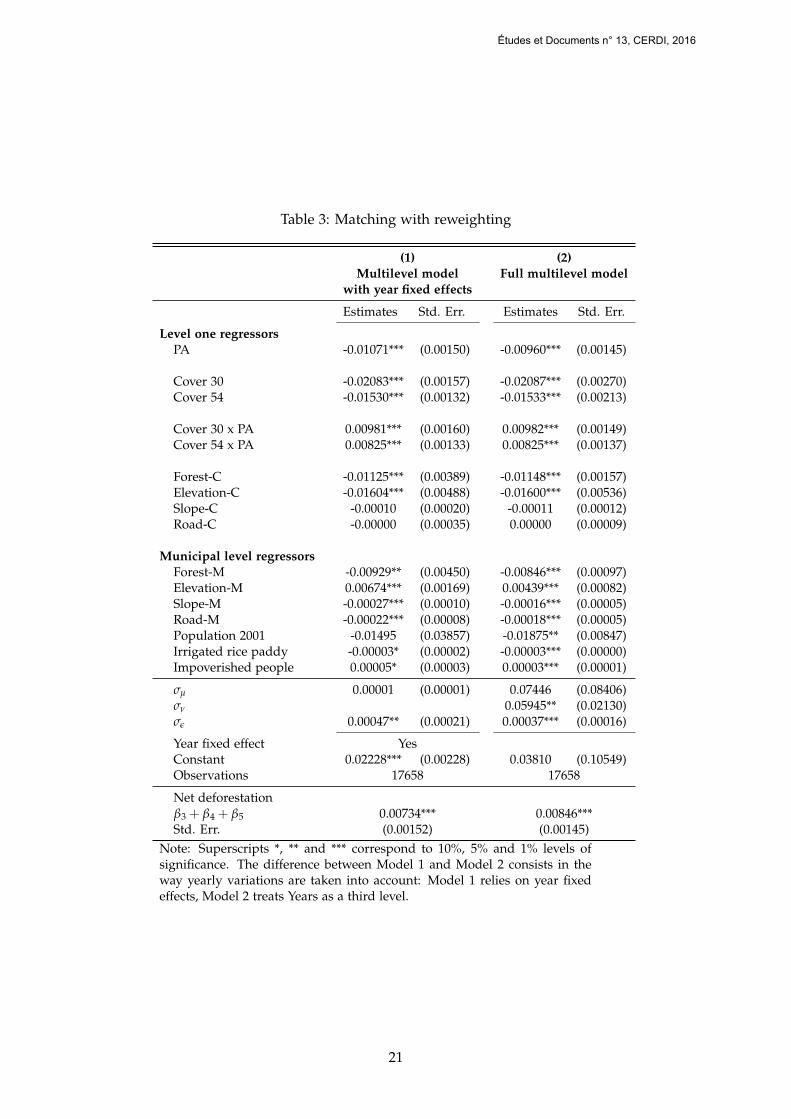
Table 3: Matching with reweighting
(1) (2)Multilevel model Full multilevel model
with year fixed effects
Estimates Std. Err. Estimates Std. Err.
Level one regressorsPA -0.01071*** (0.00150) -0.00960*** (0.00145)
Cover 30 -0.02083*** (0.00157) -0.02087*** (0.00270)Cover 54 -0.01530*** (0.00132) -0.01533*** (0.00213)
Cover 30 x PA 0.00981*** (0.00160) 0.00982*** (0.00149)Cover 54 x PA 0.00825*** (0.00133) 0.00825*** (0.00137)
Forest-C -0.01125*** (0.00389) -0.01148*** (0.00157)Elevation-C -0.01604*** (0.00488) -0.01600*** (0.00536)Slope-C -0.00010 (0.00020) -0.00011 (0.00012)Road-C -0.00000 (0.00035) 0.00000 (0.00009)
Municipal level regressorsForest-M -0.00929** (0.00450) -0.00846*** (0.00097)Elevation-M 0.00674*** (0.00169) 0.00439*** (0.00082)Slope-M -0.00027*** (0.00010) -0.00016*** (0.00005)Road-M -0.00022*** (0.00008) -0.00018*** (0.00005)Population 2001 -0.01495 (0.03857) -0.01875** (0.00847)Irrigated rice paddy -0.00003* (0.00002) -0.00003*** (0.00000)Impoverished people 0.00005* (0.00003) 0.00003*** (0.00001)
σµ 0.00001 (0.00001) 0.07446 (0.08406)σν 0.05945** (0.02130)σε 0.00047** (0.00021) 0.00037*** (0.00016)
Year fixed effect YesConstant 0.02228*** (0.00228) 0.03810 (0.10549)Observations 17658 17658
Net deforestationβ3 + β4 + β5 0.00734*** 0.00846***Std. Err. (0.00152) (0.00145)
Note: Superscripts *, ** and *** correspond to 10%, 5% and 1% levels ofsignificance. The difference between Model 1 and Model 2 consists in theway yearly variations are taken into account: Model 1 relies on year fixedeffects, Model 2 treats Years as a third level.
21
Études et Documents n° 13, CERDI, 2016
intensification of current agricultural techniques (eg, terrace cultivation).
6.1 Distinguishing between Anthropized Forests
In order to study the displacement of deforestation from protected natural forests to an-
thropized habitats, we use vegetation data and distinguish the two types of habitats based
on differences in their tree cover density. In our case, natural rainforests present a higher
percentage of tree cover density than anthropized habitats. We set up a threshold between
natural and anthropized areas (ed, 78% of tree cover density) using official forest maps. Then,
in order to differentiate between slightly degraded and highly degraded habitats, we cut our
anthropized forested areas (30% to 77%) into two equal parts (30% to 53% and 54% to 77%).
However, in doing that, we can’t precisely determine the composition of the two strata of an-
thropized forested areas, i.e. eucalyptus or pine plantation, agri-forestry systems, old fallows
etc. Official land use maps would have allowed us to distinguish between each land use. Yet
no such recent and precise maps are available for Madagascar.
An alternative to official land use maps would have been to conduct some ground check-
ing for the vegetation data that we have: for each category of tree cover density, we could go
observe to which they correspond. Nonetheless, Hansen et al. (2013) vegetation data provide
percent of tree cover density only for the year 2000. Field observation 15 years later would
clearly not informative. Therefore, we believe there is still room for future research to bet-
ter understand the interaction between conflicting land use with the help of land use maps,
perhaps in the context of a country with richer data than Madagascar.
6.2 Understanding the Absence of Agricultural Intensification in Madagascar
Whether forests are protected or not, slash-and-burn agriculture on natural forests in Mada-
gascar is illegal5. Yet it remains the principal agricultural technology used and few farmers
have invested in new practices to comply with the law. In conservationists’ theory of change
relative to the creation of PAs, a Porter-like hypothesis (Porter and Van der Linde 1995) is
implicit: new legal restrictions will incite farmers to invest in order to comply with the rule
(Phalan et al. 2011). Yet, the adoption of innovations has remained extremely limited in
Madagascar (Moser and Barrett 2003) and our results show that people have chosen to dis-
place deforestation and continue the practice of slash and burn even on anthropized forested
areas, despite the fact that it it might impede the provision of local ES and despite lower
5Actually, some permits may be accorded to farmers to clear forests. However, permits are never requested bylocals making the clearing of forest illegal.
22
Études et Documents n° 13, CERDI, 2016
yields. Understanding the reasons why little agricultural innovation has occurred in Mada-
gascar remains a key policy challenge.
The economic literature has pointed out several factors that limit the adoption of new
practices in the agricultural domain. They are the lack of access to credits and information,
insufficient human capital and aversion to risk among others (Feder, Just, and Zilberman
1985; Abdulai and Huffman 2005; Moser and Barrett 2006; Foster and Rosenzweig 2010).
Among these factors, risk aversion appears as a key explanation in the specific context of
Madagascar’s eastern ecoregion (Brimont et al. 2015). Madagascar is among the countries
most vulnerable to climate risks and high levels of poverty make Malagasy farmers particu-
larly risk-averse (Nielsen 2001). Even if it provides low yields, slash and burn on uplands is an
efficient risk-management strategy to cope with climatic vulnerability (Aubert, Razafiarison,
and Bertrand 2003; Delille 2011) as opposed to many alternative practices.
Recent findings have also highlighted the role of social interactions in the adoption of
new agricultural practices (Bandiera and Rasul 2006; Conley and Udry 2010). This stream
of literature somehow echoes the findings of Moser and Barrett (2006) that underline the
research of social conformity as a determinant of technological adoption (or non-adoption)
of agricultural innovations in Madagascar. The authors argue that people may adopt (or
not) an innovation so as to comply with the group’s social norms. As slash and burn is
at the basis of the social organization of forests community in Madagascar, it serves as a
mechanism to establish the elders’ authority in collective decision processes and as a support
of cultural and religious rites (Aubert, Razafiarison, and Bertrand 2003; Desbureaux and
Brimont 2015). Conformity with the dominant social norm then requires local farmers to
continue the practice of slash and burn instead of adopting alternative practices.
In order to reduce deforestation leakages from protected natural forests to anthropized
ones, it might be useful to put in place policies for intensification of agricultural produc-
tion oriented toward peers (elderly, traditional and religious authorities) and based on the
access to credit, training and insurance to manage risks. Indeed, a policy supported by the
peers would help to break down social barriers. Access to credit and training would enable
populations to switch to more intensive techniques.
7 Concluding Remarks
This paper presents evidence that deforestation leakages have constituted a significant adap-
tation strategy of Malagasy farmers to the creation of PAs in the eastern rainforest. We use
fine scale vegetation satellite images to distinguish natural forests from already anthropized
23
Études et Documents n° 13, CERDI, 2016
forested areas and construct a panel dataset of annual deforestation between 2000 and 2012
for each vegetation type. We found that PAs contributed to decrease deforestation of natural
forests in Madagascar. This decrease, however, has resulted in an increase in deforestation of
already anthropized forested areas despite the fact that anthropized forested areas provide
crucial provisioning ecosystem services to locals’ inhabitants. This result confirms the idea
through a ecosystem services approach that locals bear an important cost of conservation poli-
cies. In addition, this deforestation leakage contradicts a Porter hypothesis reasoning which
suggests that a change in institutional rules, herethe creation of PAs, should have increased
the adoption of new more land-intensive agriculture practices. Risk aversion in a context of
a highly risky environment and collective action dynamics appear as a possible explanation
for the absence of adoption of alternate agricultural practices.
References
Abdulai, Awudu and Wallace E Huffman (2005). “The diffusion of new agricultural technolo-
gies: the case of crossbred-cow technology in Tanzania.” In: American Journal of Agricultural
Economics 87.3, pp. 645–659.
Alix-Garcia, Jennifer, Elizabeth N Shapiro, and Katharine Sims (2012). “Forest conservation
and slippage: Evidence from Mexico’s national payments for ecosystem services pro-
gram.” In: Land Economics 88.4, pp. 613–638.
Alix-Garcia, Jennifer, Katharine Sims, and Patricia Yañez-Pagans (2015). “Only One Tree from
Each Seed? Environmental Effectiveness and Poverty Alleviation in Mexico’s Payments for
Ecosystem Services Program.” In: American Economic Journal: Economic Policy 7.4, pp. 1–40.
Andam, Kwaw S. et al. (2008). “Measuring the effectiveness of protected area networks in re-
ducing deforestation.” In: Proceedings of the National Academy of Sciences 105.42, pp. 16089–
16094. issn: 0027-8424, 1091-6490. doi: 10.1073/pnas.0800437105. url: http://www.
pnas.org/content/105/42/16089 (visited on 11/29/2014).
Angelsen, Arild and David Kaimowitz (1999). “Rethinking the Causes of Deforestation: Lessons
from Economic Models.” In: The World Bank Research Observer 14.1, pp. 73–98. issn: 0257-
3032, 1564-6971. doi: 10.1093/wbro/14.1.73. url: http://wbro.oxfordjournals.org/
content/14/1/73.
Anselin, Luc (2002). “Under the hood issues in the specification and interpretation of spatial
regression models.” In: Agricultural economics 27.3, pp. 247–267.
Arriagada, Rodrigo A. et al. (2012). “Do Payments for Environmental Services Affect Forest
Cover? A Farm-Level Evaluation from Costa Rica.” In: Land Economics 2.
24
Études et Documents n° 13, CERDI, 2016
Aubert, Sigrid, Serge Razafiarison, and Alain Bertrand (2003). Déforestation et systèmes agraires
à Madagascar: les dynamiques des tavy sur la côte orientale. Editions Quae.
Aukland, Louise, Pedro Moura Costa, and Sandra Brown (2003). “A conceptual framework
and its application for addressing leakage: the case of avoided deforestation.” In: Climate
Policy 3.2, pp. 123–136.
Bandiera, Oriana and Imran Rasul (2006). “Social networks and technology adoption in north-
ern mozambique*.” In: The Economic Journal 116.514, pp. 869–902.
Barbier, Edward B (2007). Valuing ecosystem services as productive inputs. Vol. 22. 49. The Oxford
University Press, pp. 178–229.
Benjamin, Dwayne (1992). “Household composition, labor markets, and labor demand: testing
for separation in agricultural household models.” In: Econometrica: Journal of the Economet-
ric Society, pp. 287–322.
Blackman, Allen, Alexander Pfaff, and Juan Robalino (2015). “Paper park performance: Mex-
ico’s natural protected areas in the 1990s.” In: Global Environmental Change 31, pp. 50–61.
Boserup, Ester (1965). The Conditions of Agricultural Growth: The Economics of Agrarian Change
Under Population Pressure. Transaction Publishers. 138 pp.
Brimont, Laura et al. (2015). “Achieving Conservation and Equity amidst Extreme Poverty
and Climate Risk: The Makira REDD+ Project in Madagascar.” In: Forests 6.3, pp. 748–768.
Bulte, Erwin et al. (2002). “Forest conservation in Costa Rica when nonuse benefits are uncer-
tain but rising.” In: American Journal of Agricultural Economics 84.1, pp. 150–160.
Conley, Timothy G and Christopher R Udry (2010). “Learning about a new technology:
Pineapple in Ghana.” In: The American Economic Review, pp. 35–69.
Costanza, Robert, Ralph d’Arge, et al. (1997). “The value of the world’s ecosystem services
and natural capital.” In: Nature 387, p. 253.
Costanza, Robert, Rudolf de Groot, et al. (2014). “Changes in the global value of ecosystem
services.” In: Global Environmental Change 26, pp. 152–158.
De Janvry, Alain, Marcel Fafchamps, and Elisabeth Sadoulet (1991). “Peasant household
behaviour with missing markets: some paradoxes explained.” In: The Economic Journal
101.409, pp. 1400–1417.
Deininger, Klaus and Bart Minten (2002). “Determinants of deforestation and the economics
of protection: An application to Mexico.” In: American Journal of Agricultural Economics
84.4, pp. 943–960.
Delacote, Philippe and Arild Angelsen (2015). “Reducing Deforestation and Forest Degrada-
tion: Leakage or Synergy?” In: Land Economics 91.3, pp. 501–515.
25
Études et Documents n° 13, CERDI, 2016
Delille, Hélène (2011). “Perceptions et stratégies d’adaptation paysannes face aux change-
ments climatiques à Madagascar.” In: Agronomes et vétérinaires sans frontières (AVSF).
Desbureaux, Sébastien, Sigrid Aubert, et al. (2015). The impact of Protected Areas on Defor-
estation? An Exploration of the Economic and Political Channels for Madagascar’s Rainforests
(2001-12)*. Tech. rep. HAL.
Desbureaux, Sébastien and Laura Brimont (2015). “Between economic loss and social identity:
The multi-dimensional cost of avoiding deforestation in eastern Madagascar.” In: Ecologi-
cal Economics 118, pp. 10–20.
Ewers, Robert M and Ana SL Rodrigues (2008). “Estimates of reserve effectiveness are con-
founded by leakage.” In: Trends in Ecology & Evolution 23.3, pp. 113–116.
Feder, Gershon, Richard E Just, and David Zilberman (1985). “Adoption of agricultural in-
novations in developing countries: A survey.” In: Economic development and cultural change
33.2, pp. 255–298.
Ferraro, Paul (2002). “The local costs of establishing protected areas in low-income nations:
Ranomafana National Park, Madagascar.” In: Ecological Economics 43.2, pp. 261–275.
— (2009). “Counterfactual thinking and impact evaluation in environmental policy.” In: New
Directions for Evaluation 2009.122, pp. 75–84.
Foster, Andrew D and Mark R Rosenzweig (2010). “Microeconomics of technology adoption.”
In: Annual review of Economics 2.
Gaveau, David L. A. et al. (2009). “Evaluating whether protected areas reduce tropical defor-
estation in Sumatra.” In: Journal of Biogeography 36.11, pp. 2165–2175. issn: 1365-2699. doi:
10.1111/j.1365-2699.2009.02147.x.
Gimenez, Theo (2012). “Impact of Protected Areas on Forests in Madagascar.” PhD thesis.
Duke University.
Goodman, Steven M and Jonathan P Benstead (2003). Natural history of Madagascar. University
of Chicago Press.
Hainmueller, Jens (2012). “Entropy balancing for causal effects: A multivariate reweighting
method to produce balanced samples in observational studies.” In: Political Analysis 20.1,
pp. 25–46.
Hansen, M. C. et al. (2013). “High-Resolution Global Maps of 21st-Century Forest Cover
Change.” In: Science 342.6160, pp. 850–853. issn: 0036-8075, 1095-9203. doi: 10 . 1126 /
science.1244693. url: http://www.sciencemag.org/content/342/6160/850 (visited on
11/29/2014).
26
Études et Documents n° 13, CERDI, 2016
Harper, Grady J. et al. (2007). “Fifty years of deforestation and forest fragmentation in Mada-
gascar.” In: Environmental Conservation 34.4, pp. 325–333. issn: 1469-4387. doi: 10.1017/
S0376892907004262. url: http://journals.cambridge.org/article_S0376892907004262
(visited on 11/29/2014).
Honey-Roseés, Jordi, Kathy Baylis, and M Isabel Ramirez (2011). “A spatially explicit estimate
of avoided forest loss.” In: Conservation Biology 25.5, pp. 1032–1043.
Jarosz, Lucy (1993). “Defining and Explaining Tropical Deforestation: Shifting Cultivation
and Population Growth in Colonial Madagascar (1896-1940).” In: Economic Geography 69.4,
p. 366. issn: 00130095. doi: 10.2307/143595. url: http://www.jstor.org/discover/10.
2307/143595?uid=3739368&uid=2129&uid=2&uid=70&uid=4&sid=21105323274873 (visited
on 11/29/2014).
Joppa, Lucas N. and Alexander Pfaff (2009). “High and Far: Biases in the Location of Protected
Areas.” In: PLoS ONE 4.12, e8273. doi: 10.1371/journal.pone.0008273. url: http:
//dx.doi.org/10.1371/journal.pone.0008273 (visited on 11/30/2014).
Kissinger, Gabrielle and Martin Herold (2012). “Drivers of deforestation and forest degrada-
tion.” In: A synthesis report for REDD+ Policymakers.
Le Velly, Gwenole, Alexandre Sauquet, and Sergio Cortina-Villar (2015). “PES Impact and
Leakages over Several Cohorts: The Case of PSA-H in Yucatan, Mexico.” In:
Macedo, Marcia N et al. (2012). “Decoupling of deforestation and soy production in the south-
ern Amazon during the late 2000s.” In: Proceedings of the National Academy of Sciences 109.4,
pp. 1341–1346.
Manski, Charles F (1993). “Identification of endogenous social effects: The reflection prob-
lem.” In: The review of economic studies 60.3, pp. 531–542.
McConnell, William J. and Christian A. Kull (2014). “Protecting lemurs: Madagascar’s forests.”
In: Science 344.6182, p. 358. doi: 10.1126/science.344.6182.358-a.
MEA (2005). Ecosystems and human well-being. Vol. 5. Island press Washington, DC:
Meyfroidt, Patrick and Eric F Lambin (2009). “Forest transition in Vietnam and displace-
ment of deforestation abroad.” In: Proceedings of the National Academy of Sciences 106.38,
pp. 16139–16144.
Minten, Bart and Christopher Barrett (2008). “Agricultural Technology, Productivity, and
Poverty in Madagascar.” In: World Development 36.5, pp. 797–822. doi: 10.1016/j.worlddev.
2007.05.004.
Miteva, Daniela, Subhrendu Pattanayak, and Paul Ferraro (2012). “Evaluation of biodiversity
policy instruments: what works and what doesn’t?” In: Oxford Review of Economic Policy
27
Études et Documents n° 13, CERDI, 2016
28.1, pp. 69–92. issn: 0266-903X, 1460-2121. doi: 10 . 1093 / oxrep / grs009. url: http :
//oxrep.oxfordjournals.org/content/28/1/69 (visited on 11/29/2014).
Moser, Christine and Christopher Barrett (2003). “The disappointing adoption dynamics of a
yield-increasing, low external-input technology: the case of SRI in Madagascar.” In: Agri-
cultural Systems 76.3, pp. 1085–1100. issn: 0308-521X. doi: 10.1016/S0308-521X(02)00041-
0. url: http://www.sciencedirect.com/science/article/pii/S0308521X02000410 (vis-
ited on 11/30/2014).
— (2006). “The complex dynamics of smallholder technology adoption: the case of SRI in
Madagascar.” In: Agricultural Economics 35.3, pp. 373–388.
Myers, Norman et al. (2000). “Biodiversity hotspots for conservation priorities.” In: Nature
403.6772, pp. 853–858. issn: 0028-0836. doi: 10.1038/35002501. url: http://www.nature.
com/nature/journal/v403/n6772/abs/403853a0.html (visited on 11/29/2014).
Nelson, Andrew and Kenneth M. Chomitz (2011). “Effectiveness of Strict vs. Multiple Use
Protected Areas in Reducing Tropical Forest Fires: A Global Analysis Using Matching
Methods.” In: PLoS ONE 6.8. doi: 10.1371/journal.pone.0022722.
Nielsen, Uffe (2001). Poverty and attitudes towards time and risk: Experimental evidence from Mada-
gascar. Royal Veterinary and Agricultural Univ.
Nolte, Christoph et al. (2013). “Governance regime and location influence avoided deforesta-
tion success of protected areas in the Brazilian Amazon.” In: Proceedings of the National
Academy of Sciences 110.13, pp. 4956–4961.
Oliveira, Paulo JC et al. (2007). “Land-use allocation protects the Peruvian Amazon.” In: Sci-
ence 317.5842, pp. 1233–1236.
Pagiola, Stefano (1995). “The effect of subsistence requirements on sustainable land use prac-
tices.” In: Annual Meeting of the American Agricultural Economics Association. Indianapolis.
Perrings, Charles and Madhav Gadgil (2003). Conserving biodiversity: Reconciling local and global
public benefits.
Pfaff, Alexander et al. (2009). “Park location affects forest protection: Land characteristics
cause differences in park impacts across Costa Rica.” In: The BE Journal of Economic Analysis
& Policy 9.2.
Phalan, Ben et al. (2011). “Reconciling food production and biodiversity conservation: land
sharing and land sparing compared.” In: Science 333.6047, pp. 1289–1291.
Porter, Michael E and Claas Van der Linde (1995). “Toward a new conception of the environment-
competitiveness relationship.” In: The journal of economic perspectives 9.4, pp. 97–118.
28
Études et Documents n° 13, CERDI, 2016
Robalino, Juan and Alexander Pfaff (2012). “Contagious development: Neighbor interactions
in deforestation.” In: Journal of Development Economics 97.2, pp. 427–436.
Shyamsundar, Priya and Randall A Kramer (1996). “Tropical forest protection: an empiri-
cal analysis of the costs borne by local people.” In: Journal of environmental economics and
management 31.2, pp. 129–144.
Silberberg, Eugene, Wing Suen, and WC Suen (1990). “The Structure of Economics: A Math-
ematical Approach.” In: Englewood Cliffs.
Sims, Katharine (2010). “Conservation and development: Evidence from Thai protected ar-
eas.” In: Journal of Environmental Economics and Management 2, pp. 94–114. issn: 1556-5068.
doi: 10.1016/j.jeem.2010.05.003.
Singh, Inderjit, Lyn Squire, and John Strauss (1986). Agricultural household models: Extensions,
applications, and policy. The World Bank.
Soares-Filho, Britaldo et al. (2010). “Role of Brazilian Amazon protected areas in climate
change mitigation.” In: Proceedings of the National Academy of Sciences 107.24, pp. 10821–
10826.
Styger, Erika et al. (2007). “Influence of slash-and-burn farming practices on fallow succession
and land degradation in the rainforest region of Madagascar.” In: Agriculture, Ecosystems
& Environment 119.3, pp. 257–269. issn: 0167-8809. doi: 10.1016/j.agee.2006.07.012.
url: http://www.sciencedirect.com/science/article/pii/S0167880906002866.
Vincent, Jeffrey R (2015). “Impact Evaluation of Forest Conservation Programs: Benefit-Cost
Analysis, Without the Economics.” In: Environmental and Resource Economics, pp. 1–14.
Wendland, Kelly J et al. (2011). “Regional-and district-level drivers of timber harvesting in
European Russia after the collapse of the Soviet Union.” In: Global Environmental Change
21.4, pp. 1290–1300.
WRI (2005). World Resources, 2005: The Wealth of the Poor: Managing Ecosystems to Fight Poverty.
World Resources Inst.
Zaehringer, Julie G et al. (2016). “Beyond deforestation monitoring in conservation hotspots:
Analysing landscape mosaic dynamics in north-eastern Madagascar.” In: Applied Geogra-
phy 68, pp. 9–19.
29
Études et Documents n° 13, CERDI, 2016
8 Appendix
A: Rice Plantation After Eucalyptus
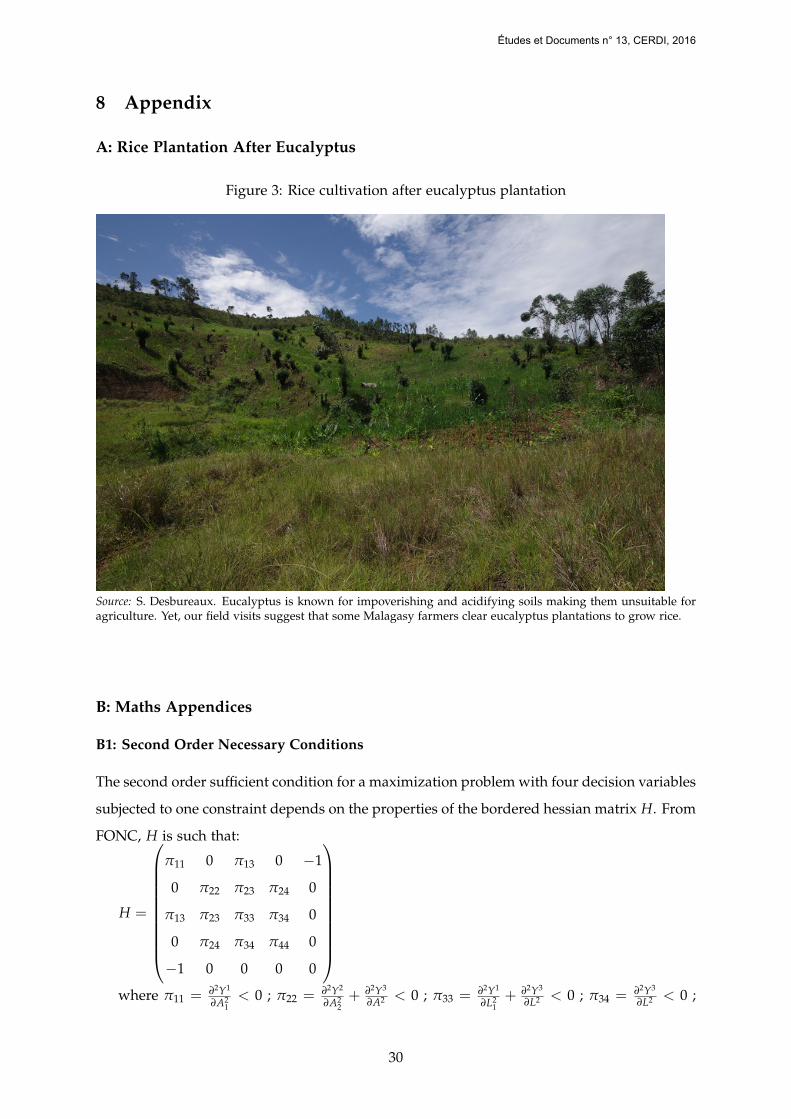
Figure 3: Rice cultivation after eucalyptus plantation
Source: S. Desbureaux. Eucalyptus is known for impoverishing and acidifying soils making them unsuitable foragriculture. Yet, our field visits suggest that some Malagasy farmers clear eucalyptus plantations to grow rice.
B: Maths Appendices
B1: Second Order Necessary Conditions
The second order sufficient condition for a maximization problem with four decision variables
subjected to one constraint depends on the properties of the bordered hessian matrix H. From
FONC, H is such that:
H =
π11 0 π13 0 −1
0 π22 π23 π24 0
π13 π23 π33 π34 0
0 π24 π34 π44 0
−1 0 0 0 0
where π11 = ∂2Y1
∂A21< 0 ; π22 = ∂2Y2
∂A22+ ∂2Y3
∂A2 < 0 ; π33 = ∂2Y1
∂L21+ ∂2Y3
∂L2 < 0 ; π34 = ∂2Y3
∂L2 < 0 ;
30
Études et Documents n° 13, CERDI, 2016
π44 = ∂2Y2
∂L22+ ∂2Y3
∂L2 < 0. Moreover, π13 = ∂2Y1
∂A1∂L1> 0 ; π23 = ∂2Y3
∂A∂L > 0 and π24 = ∂2Y2
∂A2∂L + ∂2Y3
∂A∂L <
0.
The sufficient condition for a maximum is that the principal minors Mk of order k (which
have k + 1 rows and columns), k = 2, 3 and 4, alternate in sign with M4 = |H| > 0. Under the
assumption that π is quasi-concave the sufficient second order condition for a maximization
is fulfilled (Arrow & Enthoven 1961).
B2: Full derivation of propositions 1 and 2 and additional results
Generally speaking the effect of A on all endogenous variables is obtained while solving the
following system:
H
∂A1∂A∂A2∂A∂L1∂A∂L2∂A∂µ
∂A
=
0
0
0
0
0
−1
It can be calculated that |H| = −
∣∣∣∣∣∣∣∣∣∣f22 f23 f24
f23 f33 f34
f24 f34 f44
∣∣∣∣∣∣∣∣∣∣> 0.
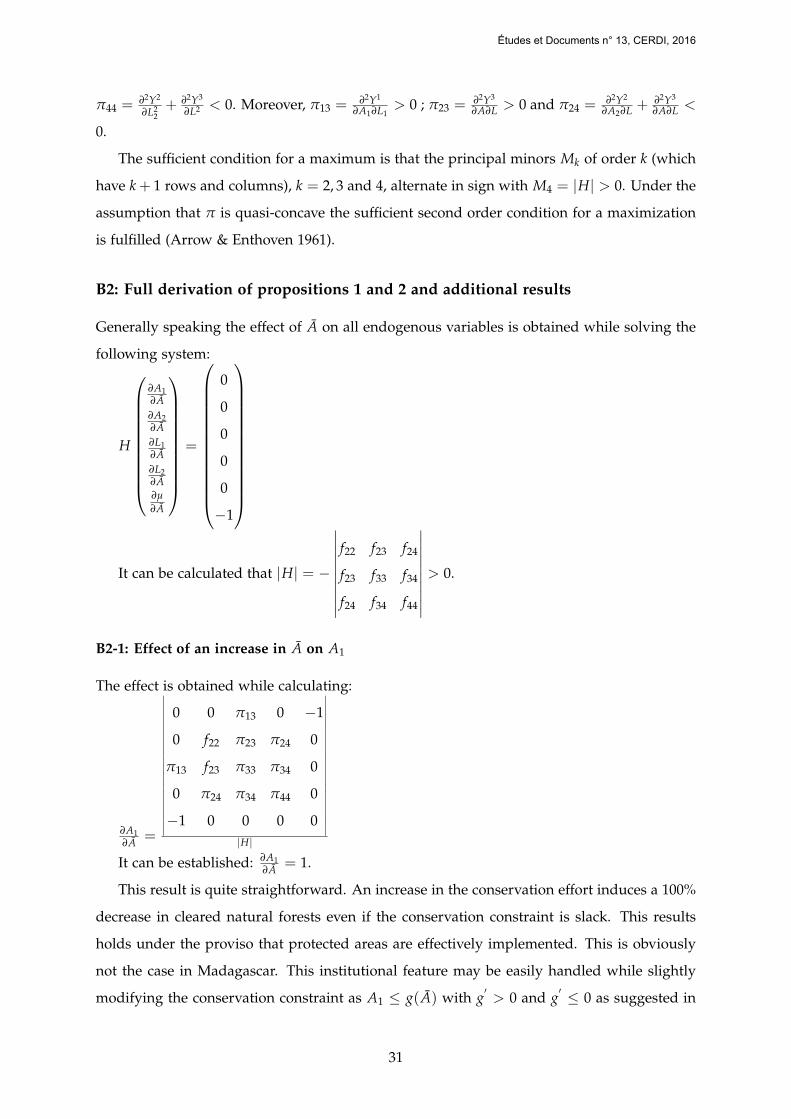
B2-1: Effect of an increase in A on A1
The effect is obtained while calculating:
∂A1∂A =
∣∣∣∣∣∣∣∣∣∣∣∣∣∣∣∣∣∣∣∣∣∣
0 0 π13 0 −1
0 f22 π23 π24 0
π13 f23 π33 π34 0
0 π24 π34 π44 0
−1 0 0 0 0
∣∣∣∣∣∣∣∣∣∣∣∣∣∣∣∣∣∣∣∣∣∣|H|
It can be established: ∂A1∂A = 1.
This result is quite straightforward. An increase in the conservation effort induces a 100%
decrease in cleared natural forests even if the conservation constraint is slack. This results
holds under the proviso that protected areas are effectively implemented. This is obviously
not the case in Madagascar. This institutional feature may be easily handled while slightly
modifying the conservation constraint as A1 ≤ g(A) with g′> 0 and g
′ ≤ 0 as suggested in
31
Études et Documents n° 13, CERDI, 2016
(Delacote & Angelsen 2015).
B2-2: Effect of an increase in A on L1 (Proposition 1)
The effect is obtained while calculating:
∂L1∂A =
∣∣∣∣∣∣∣∣∣∣∣∣∣∣∣∣∣∣∣∣∣∣
π11 0 0 0 −1
0 π22 0 π24 0
π13 π23 0 π34 0
0 π24 0 π44 0
−1 0 −1 0 0
∣∣∣∣∣∣∣∣∣∣∣∣∣∣∣∣∣∣∣∣∣∣|H|
It comes that |H| ∂L1∂A = ∂2Y1
∂A1∂L1
((∂2Y2
∂A22+ ∂2Y3
∂A2
)(∂2Y2
∂L22+ ∂2Y3
∂L2
)−(
∂2Y2
∂A2∂L + ∂2Y3
∂A∂L
)2)
> 0 iif(∂2Y2
∂A22+ ∂2Y3
∂A2
)(∂2Y2
∂L22+ ∂2Y3
∂L2
)>(
∂2Y2
∂A2∂L + ∂2Y3
∂A∂L
)2. This property reads as when “own-effects
dominate cross effects” (Silberberg 1990, p.164), then the expression in parentheses is positive.
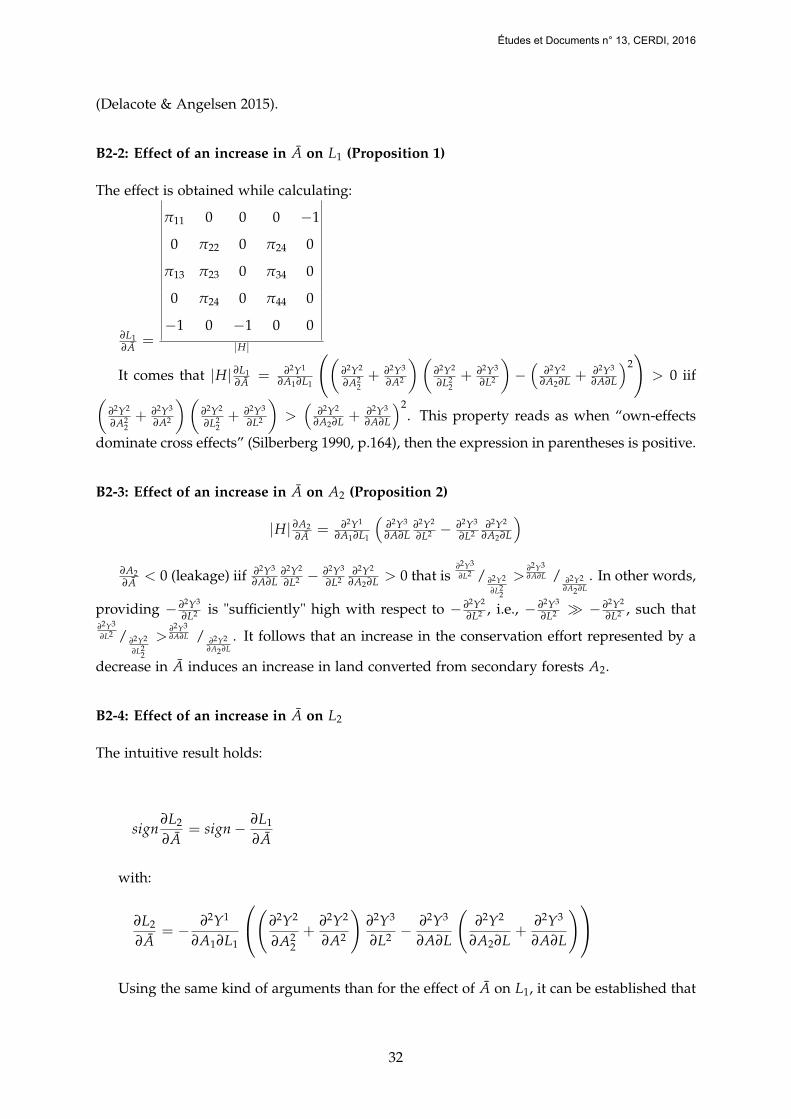
B2-3: Effect of an increase in A on A2 (Proposition 2)
|H| ∂A2∂A = ∂2Y1
∂A1∂L1
(∂2Y3
∂A∂L∂2Y2
∂L2 − ∂2Y3
∂L2∂2Y2
∂A2∂L
)∂A2∂A < 0 (leakage) iif ∂2Y3
∂A∂L∂2Y2
∂L2 − ∂2Y3
∂L2∂2Y2
∂A2∂L > 0 that is∂2Y3
∂L2 / ∂2Y2
∂L22
>∂2Y3∂A∂L / ∂2Y2
∂A2∂L. In other words,
providing − ∂2Y3
∂L2 is "sufficiently" high with respect to − ∂2Y2
∂L2 , i.e., − ∂2Y3
∂L2 � − ∂2Y2
∂L2 , such that∂2Y3
∂L2 / ∂2Y2
∂L22
>∂2Y3∂A∂L / ∂2Y2
∂A2∂L. It follows that an increase in the conservation effort represented by a
decrease in A induces an increase in land converted from secondary forests A2.
B2-4: Effect of an increase in A on L2
The intuitive result holds:
sign∂L2
∂A= sign− ∂L1
∂A
with:
∂L2
∂A= − ∂2Y1
∂A1∂L1
(∂2Y2
∂A22+
∂2Y2
∂A2
)∂2Y3
∂L2 −∂2Y3
∂A∂L
(∂2Y2
∂A2∂L+
∂2Y3
∂A∂L
)Using the same kind of arguments than for the effect of A on L1, it can be established that
32
Études et Documents n° 13, CERDI, 2016
(∂2Y2
∂A22+ ∂2Y2
∂A2
)∂2Y3
∂L2 > ∂2Y3
∂A∂L
(∂2Y2
∂A2∂L + ∂2Y3
∂A∂L
)and therefore ∂L2
∂A < 0 6.
B2-5: Effect of an increase in A on µ
At last, it is shown that:
∂µ
∂A =
∣∣∣∣∣∣∣∣∣∣∣∣∣∣∣∣∣
π11 0 π13 0
0 π22 π23 π24
π13 π23 π33 π34
0 π24 π34 π44
∣∣∣∣∣∣∣∣∣∣∣∣∣∣∣∣∣|H|
The numerator is the determinant of the hessian of the net return function. If π is as-
sumed to be strictly concave then the numerator is negative and therefore ∂µ
∂A < 0. The net
agricultural return function is concave in A.
C: Empirical Additional Details
Table 4: Entropy Matching Sample Mean
Before-Reweighting After-ReweightingTreat Control Treat Control
Level one regressorsForest-C 3.38E-10 0.0002504 3.38E-10 3.38E-10Elevation-C 1.84E-09 -1.03E-09 1.84E-09 1.84E-09Slope-C -1.77E-09 -3.91E-09 -1.77E-09 -1.77E-09Road-C 1.51E-08 7.13E-09 1.51E-08 1.51E-08
Municipal level regressorsForest-M 0.1089 0.0509 0.1089 0.1089Elevation-M 0.6480 0.5430 0.6480 0.6480Slope-M 10.9500 8.3850 10.9500 10.9500Road-M 6.6260 4.9570 6.6260 6.6260Population 2001 0.0116 0.0141 0.0116 0.0116Irrigated rice paddy 15.0900 13.1700 15.0900 15.0900Destitute people 6.1500 9.4500 6.1500 6.1500
6Again, the same argument allows establishing the ancillary result: ∂L2∂A + ∂L1
∂A =
1|H|
∂2Y1
∂A1∂L1
((∂2Y2
∂A2 + ∂2Y3
∂A2
)∂2Y2
∂L22− ∂2Y2
∂A2∂L
(∂2Y2
∂A2∂L + ∂2Y3
∂A∂L
))> 0. It evidences the reallocation of labor, say
∂L1∂A > − ∂L2
∂A . The intensity of decreasing marginal productivities on land and labor for Y2 and Y3 allows gaugingthe magnitude of labor reallocation towards Y2 and Y3.
33
Études et Documents n° 13, CERDI, 2016