Embed Size (px)
Citation preview

SEEDS SURREY Surrey Energy Economics ENERGY Discussion paper Series ECONOMICS CENTRE
Sri Lankan Electricity Supply Industry: A Critique of
Proposed Reforms
Himanshu A. Amarawickrama and Lester C. Hunt
July 2004
SEEDS 109 Department of Economics ISSN 1749-8384 University of Surrey

The Surrey Energy Economics Centre (SEEC) consists of members of the Department of Economics who work on energy economics, environmental economics and regulation. The Department of Economics has a long-standing tradition of energy economics research from its early origins under the leadership of Professor Colin Robinson. This was consolidated in 1983 when the University established SEEC, with Colin as the Director; to study the economics of energy and energy markets.
SEEC undertakes original energy economics research and since being established it has conducted research across the whole spectrum of energy economics, including the international oil market, North Sea oil & gas, UK & international coal, gas privatisation & regulation, electricity privatisation & regulation, measurement of efficiency in energy industries, energy & development, energy demand modelling & forecasting, and energy & the environment.
SEEC research output includes SEEDS - Surrey Energy Economic Discussion paper Series (details at www.seec.surrey.ac.uk/Research/SEEDS.htm) as well as a range of other academic papers, books and monographs. SEEC also runs workshops and conferences that bring together academics and practitioners to explore and discuss the important energy issues of the day.
SEEC also attracts a large proportion of the department’s PhD students and oversees the MSc in Energy Economics & Policy. Many students have successfully completed their MSc and/or PhD in energy economics and gone on to very interesting and rewarding careers, both in academia and the energy industry.
Enquiries: Director of SEEC and Editor of SEEDS: Lester C Hunt SEEC, Department of Economics, University of Surrey, Guildford GU2 7XH, UK. Tel: +44 (0)1483 686956 Fax: +44 (0)1483 689548 Email: [email protected] www.seec.surrey.ac.uk

i
defg1111111111111111111111111111111111111111111111111111111111111 1111111111
Surrey Energy Economics Centre (SEEC)
Department of Economics
SEEDS 109 ISSN 1749-8384
___________________________________________________________
SRI LANKAN ELECTRICITY SUPPLY INDUSTRY: A CRITIQUE OF PROPOSED REFORMS
Himanshu A. Amarawickrama
and Lester C. Hunt
July 2004 ___________________________________________________________
This paper may not be quoted or reproduced without permission.

ii
ABSTRACT In 2002 the Government of Sri Lanka proposed power sector policy guidelines for the first time in its history in order to facilitate the restructuring of the sector. This paper attempts to critically examine and appraise the Government’s proposals with suggestions for improvements. The methodology employed is to first examine the requirements of the Sri Lankan power sector by analysing the current problems that the power sector faces and to empirically estimate electricity demand to identify the future consumption and capacity expansion needs of the sector. Secondly, it is assessed to what extent the proposed reforms address the requirements of the sector identified above. Finally, alternative proposals are introduced in order to address the identified flaws in the current proposed reforms. JEL Classification: Q48, Q41 Key Words: Developing Countries, Electricity Supply Industry, Power Policy, Sri Lanka

1
Sri Lankan Electricity Supply Industry:
A Critique of Proposed Reforms•
Himanshu A. Amarawickrama Lester C. Hunt
Surrey Energy Economics Centre (SEEC) Surrey Energy Economics Centre (SEEC) Department of Economics Department of Economics University of Surrey, UK University of Surrey, UK
1 INTRODUCTION
Over the last couple of decades there has been a substantial focus on power sector reforms
of developing countries. A substantial number of countries have initiated massive
economic development programmes including reforms in the Electricity Supply Industry
(ESI) in order to try and achieve higher economic growth. However, different countries
have introduced reforms in their respective ESIs for a different blend of reasons, in
different ways, at different times, using different restructuring models and at a different
pace. Arguably this is because the power industry in each country is unique in
composition, development and structure. Also, the general attitudes of society, political
will and the leadership that ultimately decide on the reforms vary considerably. Like most
developing countries, it is generally assumed that the growth of the Sri Lankan economy is
inextricably linked with the growth in electricity consumption and hence the quality of life
of its citizens1, as illustrated in Figure 1. Based on this the Government of Sri Lanka
• Acknowledgement The authors would like to thank Professor Priyantha DC Wijayatunga from University of Moratuwa, Dr. Thilak Siyambalapitiya from Resource Management Associates (Private) Limited and Mr. Jayasiri Karunanayake from LECO for their help towards this study, especially with the data on the Sri Lankan system. Of course any errors and omissions are due to the authors. 1 Morimoto & Hope (2004) have shown that Sri Lanka could produce an extra output of USD 1120-1740 for every 1MWh increase in electricity supply. M Morimoto and C Hope, “The impact of electricity supply on economic growth in Sri Lanka”, Energy Economics, Vol. 26, No. 1, 2004 Jan, pp 77-85.

2
(GOSL) proposed new power sector policy guidelines2 and introduced the electricity
reforms act3 to restructure the ESI in late 2002.
0%
2%
4%
6%
8%
10%
1977
1979
1981
1983
1985
1987
1989
1991
1993
1995
1997
1999
Year
Gro
wth
Rat
e (G
DP)
-10%
-4%
2%
8%
14%
20%
Gro
wth
Rat
e (E
lect
ricity
)
GDP Electricity
Figure 1 Variation of Economic Growth and Electricity Demand Growth4 Sri Lanka (often still referred to as Ceylon) is an island that covers around 65,000km2 area
with a population of around 19 million; out of which just over 60% of households were
electrified in 2002. Sri Lanka is shaped like a giant teardrop falling from the southern tip
of the vast Indian subcontinent, separated from India by the 50km wide Palk Strait. This
isolates the Sri Lankan electrical power system from that of the Indian sub continent, hence
at present there are no imports or exports of electricity.5 The island is just 435km long and
only 225km wide at its widest6 and is administratively divided into 8 provinces as shown
in Figure 2 and 24 districts.
2 Proposed Power Sector Policy Guidelines, Ministry of Power and Energy, Sri Lanka, November 2002 (PPSPG, 2002). 3 Electricity Reforms Act No. 28 of 2002 (Reforms Act, 2002). 4 Athalage R A and Wijayathunga P D C, “Sri Lanka electricity industry: long term thermal generation fuel options” Centre for Energy studies, University of Moratuwa, 2002. 5 Wijayathunga P D C and Wijeratne D G D C, “Sri Lanka energy supply status and cross boarder energy trade issues” Workshop on Regional Power Trade, SARI/Energy, USAID, Kathmandu, Nepal, 2001. 6 Sri Lanka is about the same size as Ireland, West Virginia or Tasmania.

3
Figure 2: A map of Sri Lanka7 Sri Lanka has a very high literacy rate of more than 90% and its other social development
indicators are remarkably higher than those of developing countries and the countries of
the region. Sri Lanka’s HDI (Human Development Index) rank was 81 in 2001, ahead of
countries like South Africa and Turkey, whose per capita GDP is more than double of that
of Sri Lanka.8
The country’s per capita GDP (PPP) was around US$ 3,5009 in 2002 out of which the
service sector contributed around 54%, the industrial sector around 26% and the
agricultural sector around 20%. The predominant contribution of the service sector reflects
7 University of Texas at Austin Library online. http://www.lib.utexas.edu/maps/sri_lanka.html 8 Human Development Report, 2001, UNDP and World Development Indicators, 2003, World Bank.

4
an extensive government apparatus for social services but also includes the repatriated
earnings of overseas workers, a large trading sector, and a rapidly expanding
communication sector.
Sri Lanka’s GDP grew at an average annual rate of 5.5% throughout the early 1990s until a
drought and a deteriorating security situation lowered growth to 3.8% in 1996. The
economy rebounded in 1997-2000 with average annual growth of 5.3%. But 2001 saw the
first contraction in the country's history, due to a combination of power shortages, severe
budgetary problems and the global slowdown. However, recovering from 2001, in 2002
the country recorded a growth rate of 3.7%.10 But this is well below the average growth
rate of lower middle-income countries for 2002 of around 5%.11
From the mid 1990s the economy has faced a series of challenges due to increased defence
spending and a higher oil bill, resulting in a budget deficit of around 10% in 2001. Hence,
Sri Lanka is highly dependent on foreign assistance with Japan being its largest donor. The
GOSL is also pursuing development activities with the funding and technical assistance of
the Word Bank (WB) group and the Asian Development Bank (ADB).
As far is known there has been very little academic analysis of the Sri Lankan electricity
sector other than David et al. (2002)12 and Siyambalapitiya (2002)13. David et al. refers to
the pre-reform period in Sri Lanka (in addition to other Asian developing countries)
identifying some of the key characteristics of the Sri Lankan ESI system: capacity
shortfall, overstretched distribution networks in most cities and associated poor quality of
supply and reliability problems and inadequate supply to rural areas. David et al. go on to
9 World Development Indicators, 2003, World Bank. 10 Central Bank of Sri Lanka Annual Report (CBSL AR), 2000, 2001 and 2002. 11 World Development Indicators, 2003, World Bank. 12 David A K, Leeprechanon N, Liu F and Moorthy S S, “Transition to an electricity market: A model for developing countries”, IEEE Transactions on Power Systems, 2002, vol. 17, No. 3 pp 885-894. 13 Siyambalapitiya T, “A review of the energy policy in Sri Lanka and its implementation”, Energy for Sustainable Development, Vol. VI, No. 1 (2002), pp 5-13.

5
propose a framework as the best alternative under the above constraints, including the need
for private participation, foreign investment, greater rural electrification, privatisation and
a centrally planned, government owned National Transmission Authority (NTA).
Siyambalapitiya (2002) (published in the same year as, but before, the GOSL proposals for
reforms) criticizes general energy policy in Sri Lanka since the publication of the energy
policy document in 1997.14 In particular he concludes that “energy policy for Sri Lanka,
though accepted by the government, is largely forgotten by almost all decision makers”
adding that the “policy has no action plans or monitoring system that are essential for its
implementation” (p. 13). But this all changed to some extent with the GOSL’s proposals in
late 2002, although as argued later, these proposals are not without problems.
Given the background above this paper proceeds as follows: The next section outlines and
discusses the demand and supply fundamentals of the Sri Lankan electricity sector
followed by section 3 that considers the proposed power sector reforms by the GOSL.
Section 4 evaluates the Sri Lankan ESI and proposed reforms. Section 5 introduces
suggestions for an alternative structure and policy (drawing on forecast simulations in the
Appendix), followed by a summary and conclusion in Section 6.
14 Report of the National Committee to Formulate the National Energy Policy of Sri Lanka, 1997, Ministry of Irrigation and Power.

6
2 CURRENT STRUCTURE OF ESI IN SRI LANKA
2.1 The demand side
2.1.1 Consumption Consumption of electricity in Sri Lanka was around 290 kWh per capita per year in 200115
having grown rapidly over the last three decades, as illustrated in Figure 3. From 1986 to
2001 consumption increased on average by 6.0% per annum and peak demand increased
on average by 6.5% per annum from 540 MW to 1445 MW.16 Despite this strong growth,
Sri Lanka’s per capita electricity consumption was about 60% of that of its neighbours,
India and Pakistan.17
-
50.00
100.00
150.00
200.00
250.00
300.00
1970 1975 1980 1985 1990 1995 2000
Year
Con
sum
ptio
n (k
Wh
per c
apita
)
Figure 3: Per capita electricity consumption in Sri Lanka
15 Statistical Digest 2001, Statistical Unit, Information Management Branch, CEB. 16 Long Term Generation Expansion Plan 2002-2016, Generation Planning Branch, Ceylon Electricity Board, December 2001 (LTGEP, 2001). 17 Athalage R A and Wijayathunga P D C, op. cit.

7
Electricity consumption by sector from 1978-2000 is given in Figure 4. This illustrates the
growth both in the domestic and industrial & commercial sectors.
Domestic
Industrial & Commercial
Other
0
1000
2000
3000
4000
5000
6000
1978
1979
1980
1981
1982
1983
1984
1985
1986
1987
1988
1989
1990
1991
1992
1993
1994
1995
1996
1997
1998
1999
2000
Year
Con
sum
ptio
n (G
Wh)
Figure 4: Electricity consumption by sector from 1978-200018
2.1.2 Electrification The proportion of grid-connected houses has been ever increasing from 7% in 1976 to 61%
in 2002 (altogether around 3.1 million customers out of around 5 million households).19
The new connections to the system are on average around 230,000 consumers every year.20
Figure 5 shows that in 2000 electrification varied from less than 20% households in some
districts in the North to almost 92% in Colombo.21 Household electrification was as high
as 85% in the urban areas while the rural areas recorded only 47% as average
electrification in 2001.22
18 LTGEP, 2001. 19 Sri Lanka rural electrification policy, Ministry of Power and Energy, Sri Lanka, November 2002. 20 LTGEP, 2001. 21 PPSPG, 2002. 22 Athalage R A and Wijayathunga P D C, op. cit.

8
2.2 Structure of the ESI
0%
20%
40%
60%
80%
100%C
olom
bo
Gam
paha
Gal
le
Nuw
arae
liya
Mat
ara
Kal
utar
a
Kan
dy
Puttl
am
Bad
ulla
Keg
alle
Am
para
Kur
uneg
ala
Anu
radh
apur
a
Rat
napu
ra
Mat
ale
Ham
bant
ota
Polo
nnar
uwa
Vav
uniy
a
Trin
com
alee
Jaff
na
Bat
ical
oa
Mon
arag
ala
Oth
er
Elec
trific
atio
n R
ate
Figure 5: Electrification rates in different districts in 2000 23
The electric power sector in Sri Lanka is organised under the Ministry of Power and
Energy (MOPE). The Ceylon Electricity Board (CEB) undertakes the generation and
transmission of electric power in the whole country and distribution and supply of electric
power in areas other than those areas served by the Lanka Electricity Company (Private)
Limited (LECO), which is responsible for about 15% of total electricity distribution and
supply of the country. 24 The current structure of the ESI is given in Figure 6. It can be
seen that this is a typical version of model 1 according to Hunt & Shuttleworth’s (1996)
23 Athalage R A and Wijayathunga P D C, op. cit. 24 LECO is a limited liability company, which started operations on 1st June 1984 and now operates in 32 Local Government areas in the Western and Southern coastal belt townships around Colombo. Its customer base has grown from about 12,000 to over 300,000 Customers and has a staff of 1,345 in 2001. LECO remains a profitable company with a private management but the majority of the shares are owned by CEB. More details can be found at www.lanka.net/leco

9
Figure 6: Current Structure of the ESI (The arrows show the power flow and the dotted lines show the control or regulatory activities)
Generation (Hydro + Thermal)
Transmission
Distribution LECO (15%)
IPPs Emergency power Cogeneration
Chief Electrical Inspector (Regulator)
Distribution CEB
(85%)
CEB • Generation planning • System load dispatch • Investments
Minister of Power and Energy
Appointment of BOD of CEB

10
classification.25
2.2.1 The CEB The CEB was set up in 1969 as the national power utility. At the time of writing the CEB
still operated as a monopoly and according to the last published accounts employed a staff
of around 14.3 thousand and had a customer base of around 2.7 million.26 Control of an
organisation this big is often very difficult, with no clear incentives for management to
perform better. The hiring and firing is difficult due to bureaucracy and powerful workers’
unions. 27 Furthermore, given the monopsony position the CEB has strong bargaining
power that arguably causes problems such as one-sided fuel contracts with the fuel supplier
Ceylon Petroleum Corporation (CPC). In addition, given its strong position the CEB is
arguably ignorant of the environment norms and standards. This all creates economic
inefficiencies and environmental problems. The Board of Directors (BOD) of the CEB are
currently direct appointees of the minister of power and energy; and the GOSL has the
power to hire and fire the BOD directly and top management indirectly in the CEB. As the
sole shareholder, the GOSL has a fundamental right to appoint the BOD, which has
arguably resulted in too much political intervention in the sector and discontinuity in the
planning at top level at regular intervals. Due to bureaucracy and high level of political
25 Hunt and Shuttleworth (1996) identified four basic models for an ESI. Obviously, in practice structures may deviate in particular ways and circumstances, but ultimately most existing structures can be incorporated in these 4 models. They depend upon the varying degrees of monopoly, competition and choice for consumers. Model 1 is where a single monopoly company/utility handles generation, transmission and distribution which is known as “monopoly at all levels”. Model 2 is where competition is introduced in generation, which is known as “single buyer model” or “purchasing agency”. In addition to competition in generation in Model 3 there is open access to transmission wires so that distribution companies can buy directly from the generators. This is known as “wholesale competition”; thus competition is at distribution level. Model 4 is where competition is introduced to retail market. Hence the distribution is separated from the retail supply. This permits ultimate choice to all the customers to select their suppliers and is known as “retail competition”. See Hunt S, Shuttleworth G, Competition and choice in electricity, 1996, Wiley, New York, USA. Bhattacharyya (1995) describes a fifth model, which is a publicly owned monopoly with an operation and management contract to a private party. To promote better management, the utility’s operation and maintenance is contracted out to a private party (third party) but the ownership still remains with the state. Examples are the model existing in Ivory Cost. See Bhattacharyya S C, “Power sector privatisation in developing countries: Will it solve all problems?” Energy Sources, Vol. 17, 1995, pp 373-389. 26 Ceylon Electricity Board, Annual Report, 1999 (CEB AR, 1999). 27 There are two strong workers unions in CEB. They are CEB Workers’ Union and CEB Engineers’ Union.

11
intervention there is a lack of accountability in the sector.28 E.g. there is no single
department or person in the CEB who is accountable for the delay in execution of the
generation expansion plan.29 However it could be argued that the CEB is one of the best-
managed government owned entities in Sri Lanka30 although it did have some financial
losses due to the high oil bill and insufficient tariff to cover its costs in the early 2000s.31
The CEB handles the system dispatch activities and its generation planning branch
prepares the Long Term Generation Expansion Plan (LTGEP) and the transmission and the
distribution planning divisions prepare their system expansion plans respectively to cater
for the LTGEP commitments. Apart from these main functions, as a government owned
utility the CEB is required to provide ancillary electricity services to government
buildings, hospitals, security and street lighting on non commercial basis.
2.3 Sector regulation
The legal regulatory framework of the sector is facilitated by the Electricity Act No. 19 of
1950 and as amended from time to time.32 The act specifies that the generation and
transmission of electric power is carried out as a public utility (CEB) and the distribution
through a licensee under the licence provided by Chief Electrical Inspector (CEI). Any
IPPs are required to get a generating licence from the CEI. The administrator of the act or
the regulator is the Chief Electrical Inspector who is under the MOPE. But according to
PPSPG 2002 this does not function adequately (p. 4).
28 David et al., op. cit. 29 The generation planning branch is traditionally accountable only for academic activities like producing LTGEP every year, but not for execution of such plan. 30 But still there are lot of inefficiencies in the system although consumers per employee rate is around 157 (CEB AR, 1999) which is in comparison with the internationally accepted standard 160 given in Wamukonya (2003), p. 1277 (Wamukonya N, “Power sector reform in developing countries; mismatched agendas”, Energy Policy, Vol. 31, 2003, pp 1273-1289). 31 CBSL AR, 2002. 32 PPSPG, 2002, p. 4.

12
2.4 The supply side
2.4.1 Generation capacity In 2000 total electricity generation was 6687MWh in order to meet a demand of
5258MWh and average system losses for this period were 21.4%.33 The country’s
electricity generation capacity was around 2000 MW34 in 2001.
2.4.2 Hydro power generation The Sri Lankan system was predominantly a hydropower-based system, but since 1996
there has been a high contribution of thermal generation due to new IPP plants and
emergency power. This can be seen in Figure 7, which shows the hydrothermal share
variation over past years. In 2001 about 60% of installed generating capacity were hydro
plants, however in the same year hydro only contributed to around 48% of the electricity
actually generated.35
The total estimated hydro potential of Sri Lanka is around 2000MW out of which around
1350MW has already been developed. Further exploitation is becoming increasingly
difficult due to impacts on the environment and human resettlement. Sri Lanka’s hydro
plants can be divided into two main complexes namely the Mahaweli system (660MW)
and the Kelani System (335MW). Unlike the Kelani system, the Mahaweli system is
operated as a multi purpose system and hence power generated from the associated power
stations is governed by the down stream irrigation and flood control requirements.36 Table
1 gives the details of these plants.
33 LTEGP, 2001. 34 Statistical Digest, 2001, CEB. At the time of writing it is around 2100MW as given by Table 1 (excluding committed plants, but uncommissioned). But it should be noted that this is the machine nameplate capacity and it is unlikely to be available at any given point in time due to high hydro dependency. 35 Statistical Digest, 2001. 36 Ibid.

13
0
2,000
4,000
6,000
8,000
1970
1972
1974
1976
1978
1980
1982
1984
1986
1988
1990
1992
1994
1996
1998
2000
Gen
erat
ion
(GW
h)
Hydro
Utility Therma
l
Self Generation
Figure 7: Hydro Thermal share in the recent past37
2.4.3 Thermal generation Table 1 also shows that the CEB has about 563MW of thermal power generation capacity,
mainly concentrated in two locations namely Sapugaskanda and Kelanitissa within the
proximity of Colombo.
2.4.4 IPPs In the mid 1990s the GOSL introduced a new policy package for the power sector aiming
to sustain an adequate level of investment in the power sector, by attracting private sector
investment. With these latest developments Sri Lanka in late 2003 had around 350MW of
IPPs belonging to different developers (see Table 1).
37 LTGEP, 2001.

14
Plant Name Ownership Year of Commissioning Capacity (MW) Annual Avg.
Energy (GWh)
Laxapana Complex
Canyon CEB 1983,1988 2*30=60 163
Wimalasurendra CEB 1965 2*25=50 114
Old Laxapana CEB 1950,1958 3*8.33+2*12.5=50
279
New Laxapana CEB 1974 2*50=100 467
Polpitiya CEB 1969 2*37.5=75 409
Laxapana total 335 1432
Mahaweli Complex
Victoria CEB 1984,1985, 1986 3*70=210 769
Kotmale CEB 1985, 1988, 1988 3*67=201 494
Randenigala CEB 1986 2*61=122 392
Ukuwela CEB 1976 2*19=38 172
Bowatenna CEB 1981 1*40 54
Rantambe CEB 1990 2*24.5=49 219
Mahaweli Total 660 2100
Other Hydro
Samanalawewa CEB 1992 2*60=120 361
Inginiyagala CEB 1963 2*2.5+2*3=11 NA
Udawalawe CEB 1969 3*2=6 NA
Nilambe CEB 1988 2*1.5=3 NA
Small Hydro Plants Private 12.25 NA
Kukule (committed)** CEB 2003 2*35=70 303
Upper Kothmale (committed)** CEB 2008 2*75=150 530
Hydro Total 1367
Kelanitissa Complex
GT (Old) CEB 1980,1981,1982 6*20=120 600
GT (New) CEB 1997 1*115 813
Steam Plant CEB 1962,1963 2*25=50 250
CCGT CEB 2001,2002 1*165 1253
Sapugaskanda Complex
Diesel (old) CEB 1984 4*20=80 488
Diesel (new) CEB 1997, 1999 8*10=80 444
Small thermal CEB 1999 1*8 NA
IPPs
Lakdhanavi Private 1997 22.5 156
Asia Power Private 1998 51 330
Colombo Power Private 2000 64 420

15
Plant Name Ownership Year of Commissioning Capacity (MW) Annual Avg. Energy (GWh)
AES Private 2003 163 1314
Ace Power Private 2002 2*25=50 272
Thermal total38 969
Grand Total 2336
**Kukule and Upper Kotmale are not yet commissioned.
Table 1: Details of existing and committed plants39
2.4.5 Under investment crisis in generation The very high rate of growth in demand for electricity combined with the variability of the
supply of hydroelectricity means that at the time of writing there is an urgent requirement
for greater, reliable and more diversified generation capacity in order to ensure security of
supply, which was clearly reflected by the severe power cuts that occurred during the 1996
and 2001 drought periods. As a result, the GOSL and the CEB have looked at alternative
ways of meeting the anticipated shortfall in electricity.
According to LTGEP the best solution for Sri Lanka’s ever-increasing electricity demand
and increasing fuel bill is to have a coal fired plant with imported high quality coal from
Australia/Indonesia or South Africa. Although there are few ideal sites for this plant,
finalising a site took almost 10 years and eventually the coastal site of Kalpitiya (see
Figure 2) was identified as the location. However the political mandate was never given to
this proposed 900 MW40 coal fired power plant, even after the funding had been approved
by the JBIC (Japanese Bank for International Corporation) as a soft loan to the GOSL. This
is due to the political sensitivity of the area and the major environmental lobbies against
coal. As the planned generation expansion did not kick off due to various political reasons
38 In addition to these plants there are two main CEB hired power plants namely Aggreko 58MW and Lakdhanavi 21MW. 39 LTGEP, 2001. 40 Initially it is planned to build 300 MW and capacity additions of 300MW each at two stages.

16
the CEB had to go for hired power plants at greater unit costs of electricity. These plants
cause more environmental deterioration due to lack of planning for mitigation.
2.4.6 Transmission and distribution losses Transmission and distribution losses were around 21.4% in 2000 having increased every
year from 199841although the CEB had plans to reduce the losses by 14.6% in the 2009.
Since the system Load Factor (LF)42 is around 55%,43 there is a very high peak demand
than the system average load requirement. Therefore the country needs to pay high peaking
power prices in the peak periods.
2.5 Electricity tariff
The CEB is expected to function as an independent autonomous body from the government
and function on sound commercial principles, but is also required to have the tariff
endorsed by the government. This often results in a conflict of interest given the desire of
the GOSL to keep prices low in order to help attain its social objectives. Hence, there has
been significant political influence in tariff setting over a number of years, with prices
being less than the cost of supply. Consequently, this has produced two types of implicit
subsidies; (a) subsidies between sectors (industrial and commercial consumers subsidise
the domestic consumers) and (b) subsidies within the same sector (high demand domestic
consumers subsidise low demand domestic consumers). LECO is also governed by the
same tariff structure.44 In 2001 the average real electricity tariff was about Rs. 6.69 at
1996 prices (equal to about 0.06 US dollars) per kWh, Figure 8 illustrates the variation of
41 According to LTGEP 2001, this is attributable to the increase in un-metered connections during last few years, with nearly 230,000 new customers getting connected every year. 42 LF is defined as LF=(average load/ peak load)*100 and average load is calculated by Avg. load= (generation (GWh)/number of hours per year (h)). 43 LTGEP, 2001. 44 CEB’s tariff to LECO is back calculated so that LECO runs as a profitable company. This can also be thought as another subsidy.

17
the real tariff from 1970 to 2001. It is interesting to note the price spikes, usually brought
about by the ‘political’ tariff setting.
-
1.00
2.00
3.00
4.00
5.00
6.00
7.00
1970 1975 1980 1985 1990 1995 2000
Year
Rs.
(199
6=10
0)
Figure 8: Average Real Electricity Tariff per kWh from 1970-2001
3 PROPOSED REFORMS BY THE GOSL
3.1 Introduction
In November 2002 the Ministry of Power and Energy issued the Proposed Power Sector
Policy Guidelines (PPSPG) with the basic objective:
“…..to meet the demand for electricity at all times at least economic, social and
environmental cost and thereby promote economic development and social well-
being”45
Furthermore, the guidelines highlight the vision of the power sector as:
• Creating an efficient and dynamic power sector to facilitate rapid
economic growth.
45 PPSPG, 2002, p. 1.

18
• Having at least 80% of the population accessible to electricity grid at
affordable prices.
• Having a cost based tariff and a reliable supply to industrial sector to
sustain their competitiveness in respective international markets.
• Having a power sector which will operate with sound commercial and
business like principles with a non-monopolistic structure.
• Having a substantial private sector investment in the power sector.
• Having a reliable electricity transportation system with loss levels
reduced to internationally acceptable levels.
• Having a transparent regulatory process to be established that will
safeguard the interest of all the parties including customers, investors and
environmentalists.46
Therefore creating competition, attracting private investment and improving efficiency are
the major driving forces behind the reforms.
3.2 Restructuring
It is proposed that the power sector reform process in Sri Lanka as announced by the
Electricity Reforms Act of 2002 (Reforms Act) will start with the restructuring of the
sector. It is not expressed anywhere in the documents that the restructured companies are
to be privatised although the Act does provide provisions for future privatisation.47 But the
proposed policy guidelines express the concern of MOPE about increased private sector
participation. However it is proposed that the restructuring ensures that the new
companies will be more independent, efficient and operate in an economical manner, while
ensuring security of supply.
46 PPSPG, 2002, p. 6. 47 “….the Committee shall discharge its functions under subsection (4) in relation to a successor Company, only so long as the Government owns at least fifty per centum of shares of that successor company” - Section 50(5) (p. 48) of the Reforms Act (2002). This implies that the government has provided provision for future privatisation .

19
The GOSL plans to separate out its role as the owner, operator and regulator of the electric
power sector, with each role clearly defined and separated.48 The proposed new structure
for the Sri Lankan ESI is illustrated in Figure 9. This shows that the proposal is for all the
CEB’s hydro and thermal power generation stations to be transferred to a new generation
company, which will be in charge of all hydro and thermal stations. This company is
referred to as Genco hereafter.
It is also proposed that all transmission activities of the CEB are transformed to another
newly formed company. This company is referred to as Transco hereafter. It is implied
from Section 42 of the Reform Act that bulk power trading, dispatch, transmission
operations and investment decisions in future generation (long term generation planning)
and tendering for such plants will be the responsibility of Transco. Therefore it is evident
that any investment decision whether public or private should only be taken in accordance
with this LTGEP, which is prepared by Transco.
Furthermore the proposal is for all distribution activities including LECO’s area, to be
divided in to 349 or more distribution companies by area and act as regulated local
monopolies (these companies are referred to as Distcos hereafter50). Although it is now
understood that there will be 5 distribution companies, as shown in Figure 10. In addition
there is a provision in the proposals to form another company, known as the CEB residual
company (shown as company 8 in Figure 9), to take care of other ancillary duties of
CEB.51
48 PPSPG, 2002, p. 11. 49 PPSPG, 2002, p. 11. But in the same document in p. 15 it says that a minimum 4 distribution companies will be set up. 50 Genco, Transco and Distcos will be Public Companies under Public Company Act No. 23 of 1987. 51 This company will act as an intermediate company and then will be dismantled once these functions can be taken care of by other means.

20
.
Figure 9: The GOSL’s Proposed Structure of the ESI (The arrows show the power flow and the dotted lines show the control or regulatory activities)
Holding company of hydro and thermal generation plants of CEB
(Company 1: Genco)
Holding company of Transmission wires System load dispatch centre Investment decisions in generation (Company 2: Transco)
IPPs Emergency power Cogeneration
Public Utilities Commission (economic, technical & safety Regulator)
Monitoring and Advisory Committee Monitoring the companies Recommend BOD to the minister
Minister of Power and Energy
To take over any other action by
CEB (Company 8)
Distribution Area 1 (Co. 3:
Distco 1)
Distribution Area 2 (Co. 4:
Distco 2)
Distribution Area 3 (Co. 5:
Distco 3)
Distribution Area 4 (Co. 6:
Distco 4)
Distribution Area 5 (Co. 7:
Distco 5)
Minister of policy development and implementation

21
Figure 10: The GOSL’s proposed Distco boundaries

22
According to the proposals, directors of any newly formed company will be appointed by
the minister of power and energy under the recommendation of Monitoring and Advisory
Committee (M&AC) which will be a monitoring body for financial and operational
performances of the companies as far as government owns at least 50% of shares of them.
Finally, it is proposed that the existing and new IPPs, emergency power generators (as far
as there is a system shortage of power) and co generators will also supply power to
Transco, apart from the main publicly owned generator. In summary the proposed
structure for Sri Lanka would be similar to Model 2 of Hunt & Shuttleworth (1996)
classification with vertical deintegration, but with limited provision for future competition
in generation.
3.3 Regulation
It is proposed that all companies in the power sector will be subject to economic, technical
and safety regulation by the Public Utilities Commission (PUC), which is a body,
constituted by the Public Utilities Commission of Sri Lanka Act No. 35 of 2002.52
The PUC will act as the regulator of the electricity sector in Sri Lanka particularly for the
objectives given below:
• Protect consumer interest by promoting efficiency improvements.
• Regulate tariff and charges.
• Ensure all reasonable consumer demands are met.
• Ensure that all efficient licensees are able to finance their activities as
demanded by their licence conditions.
• Promote efficient use of electricity.
52 See Public Utilities Commission of Sri Lanka Act No. 35 of 2002.

23
• Promote safety in electrical systems.
• Protect environmental norms from electrical activities.
• Promote Competition.
• Benchmark power sector companies with international standards.53
3.4 Tariff
Both transmission and bulk supply tariffs as well as distribution and retail supply tariffs
shall be applicable as given in licence conditions and according to the proposals, the tariff
should be set by the Distcos and Transco and approved by the PUC and should adequately
reflect costs. According to the Reforms Act the companies will be permitted to recover all
reasonable costs (as authorised by the PUC) they incur when carrying out such services in
an efficient manner. If the PUC sets tariffs which may require the company to subsidise
any group of consumers the PUC will make sure that the GOSL compensates the licensee
for such subsidies and the GOSL has an adequate provision for such subsidies. The tariff
policy is based on the following principles.
• The tariff will be based on sound commercial principals, i.e. the
customers have to pay the cost they make on the system.
• Assurance of price stability at reasonable levels.
• The tariff should generate sufficient revenues for the financial
investments of the sector.
• Tariff structure should be simple and should facilitate metering and
billing.
• Assurance of at least minimum level of services to low income domestic
customers (but when it is economically feasible).54
53 Section 4 of the Reforms Act, 2002 and Section 14 of the PUC of Sri Lanka Act, 2002. 54 PPSPG, 2002, p. 14.

24
3.5 Private sector participation
The policy guideline specifically states that the private sector will play a key role in the
power sector, but as explained below the private participation is not encourage in some
areas of the ESI. The thermal additions will continue to seek private sector financing on a
Build Own Operate (BOO) or a Build Own Transfer (BOT) basis. It is proposed that
public finance, including concessionary loans, will only be utilised for the improvement of
general infrastructure of the thermal power projects.
As part of the proposals Transco will produce the LTGEP as a least cost, reliable and
environmentally acceptable generation expansion plan. The projects identified in such a
plan will then be tendered out accordingly. In addition, there is a provision for private
proposals (which are referred to as unsolicited proposals in the PPSPG) if such proposals
are based on alternative sources of energy and new technology which are more cost
effective than the other forms of energy.
Furthermore, there is provision for major hydropower generation (more than 50 MW) to be
developed to its full potential and function under the newly formed Genco. It is proposed
that Genco should remain under government control for the foreseeable future, although
medium hydro (from 10MW to 50MW) projects will be open to the private sector on a 20
year BOT basis. However the policy guideline prefers the new medium hydro plants to be
owned by the Genco. 55 Only mini and micro hydro projects will be 100% open to the
private sector. The proposals encourage the private sector to develop all renewable
energy56 up to a ceiling of 10% of total Sri Lanka electricity demand. However there is no
justification for this arbitrary ceiling.
55 The reason given is the importance in hydro electricity as the only indigenous source of energy and complications in having to agree on a minimum availability with an IPP. It is however noted that there are number of hydro IPPs throughout the world. 56 Referred to as non-traditional energy in the PPSPG, 2002.

25
Having outlined the key proposals for reform, the following section analyses them in more
detail.
4 EVALUATION OF THE CURRENT SITUATION AND PROPOSED REFORMS
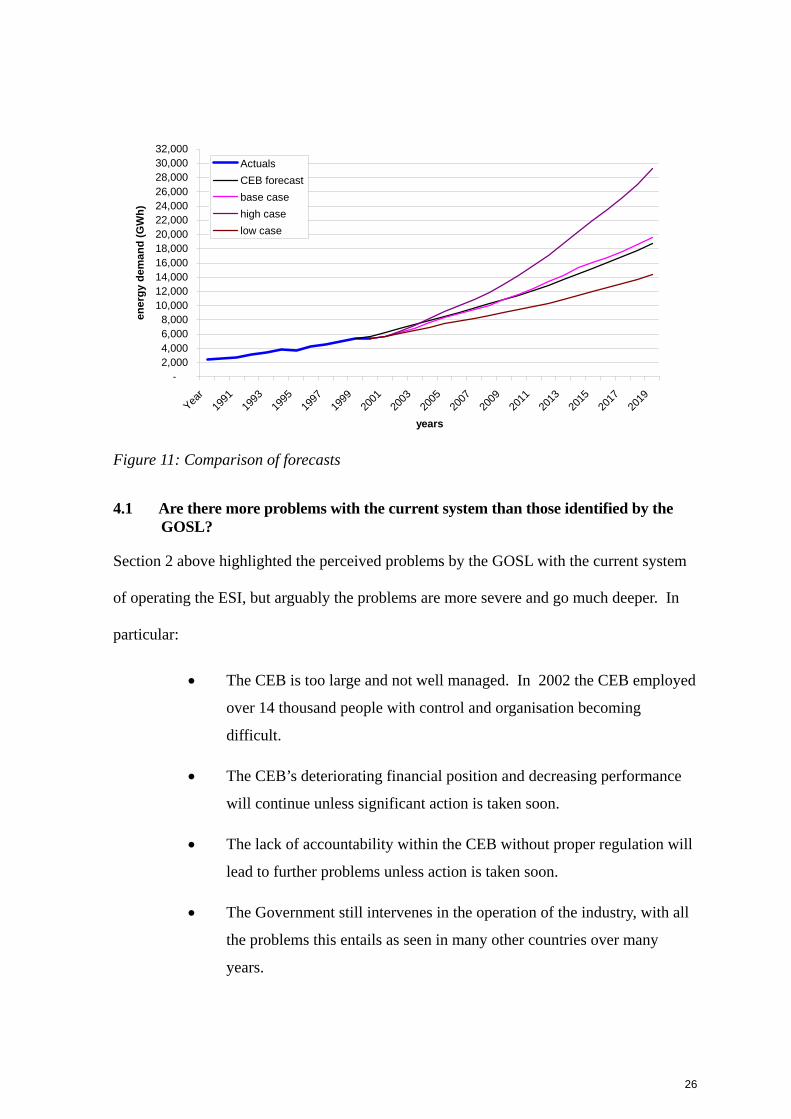
It is shown in the Appendix that the Sri Lankan power sector requires rapid system
expansion over the next couple of decades. Figure 11 illustrates the forecasts up to 2020
based on the estimation given in the Appendix with three scenarios plus the CEB LTGEP
(2001) projections. It can be seen that the base case scenario is very similar to that of the
CEB projection, however, the high and low cases show that there is potential for a
substantial difference depending on the otturn of Sri Lanka’s economic growth over the
next two decades.
This suggests that a capacity addition of around 125 – 250 MW is required every year from
2002 to 2020 (as shown in Table A3 in the Appendix). Even if electricity demand is as
given by the low case scenario then there would still need an additional capacity of 75 –
165 MW per year. This increase in capacity needs to be coupled with the necessary
transmission and distribution network expansion. With this backdrop the problems with
the current system are re-considered along with the proposed changes by the GOSL.
26
-2,0004,0006,0008,000
10,00012,00014,00016,00018,00020,00022,00024,00026,00028,00030,00032,000
Year
1991
1993
1995
1997
1999
2001
2003
2005
2007
2009
2011
2013
2015
2017
2019
years
ener
gy d
eman
d (G
Wh)
ActualsCEB forecastbase casehigh caselow case
Figure 11: Comparison of forecasts
4.1 Are there more problems with the current system than those identified by the GOSL?
Section 2 above highlighted the perceived problems by the GOSL with the current system
of operating the ESI, but arguably the problems are more severe and go much deeper. In
particular:
• The CEB is too large and not well managed. In 2002 the CEB employed
over 14 thousand people with control and organisation becoming
difficult.
• The CEB’s deteriorating financial position and decreasing performance
will continue unless significant action is taken soon.
• The lack of accountability within the CEB without proper regulation will
lead to further problems unless action is taken soon.
• The Government still intervenes in the operation of the industry, with all
the problems this entails as seen in many other countries over many
years.

27
• There is significant under capacity in generation and investment in the
network, as illustrated by the scenarios presented in the Appendix.
• The tariff remains subsidised and does not reflect the ‘economic’ cost of
production.
4.2 Do the GOSL’s proposed reforms go far enough?
Given the above, we are of the opinion that the GOSL’s proposed reforms do not go far
enough.
4.2.1 Restructuring Although the proposed reforms, outlined in section 3, would result in the vertical
separation of the CEB with a number of smaller companies replacing the existing ‘large’
monopoly, Genco and Transco which will be public companies, initially owned by the
government with no immediate plan for privatisation (with the plan to keep Transco as a
state owned company for the foreseeable future) will still hold significant influence in the
ESI. It appears that the Genco will behave almost as a monopoly in the proposed structure
due to its superior size. It holds about 75% of current generation capacity and all the hydro
stations and old thermal stations where marginal cost (MC) of operation is lower. This
may make Genco superior to other generators. Transco will be able to make powerful
decisions like system control and deciding on the future generation options in addition to
transmission activities. This may create a conflict of interest of Transco’s transmission
business and LTGEP activities. Therefore although the vertical unbundling is consistent
with electricity reforms in a number of countries and would appear a sensible development,
the detail of the changes requires further examination.
With the five ex-officio members (apart from the three members appointed by the
minister), the M&AC should be more independent57 since it reduces the chances for
57 Because the five ex officio members are non political appointees.

28
political interference. Therefore proposed new arrangements for appointing the BOD of
the new publicly owned companies (as explained above) will mean that the power of the
minister will be curtailed to some extent but arguably the reforms do not go far enough.
It is widely accepted that restructuring of electricity sector should happen before
privatization.58 The proposed power sector changes in Sri Lanka do follow this sequence.
Also it is acknowledged here that the importance of political leadership and government
willingness are required if the goals set for the Sri Lankan ESI are to be achieved. Bacon
(1995)59 mentions that governments are the fundamental agents for reforms. However in
the context of current restructuring of the ESI in Sri Lanka it is doubtful that such a
political mandate is given apart from mere pressure from multilateral lenders.
The proposed Distcos will have access to a similar geographical portion of the load centre
western province and the remote rural areas of the country in order to ensure that they all
have the same cross section of consumers. But this could well create more complicated
problems and an additional burden on the system, which is discussed, in more detail in
Section 5.
4.2.2 Regulation In developing countries like Sri Lanka the credibility and the independence of the regulator
is very important as described in Bell (2000).60 Arguably, the proposed regulator PUC
should create such confidence in the way it is structured.
The regulator will be appointed by the minister of policy development and
implementation61 with the concurrence of the constitutional council.62 Therefore arguably
58 Tenenbaum B, Lock R, and Baker J, “Electricity privatisation; structural, competitive, and regulatory options, Energy Policy, 1992, pp 1134-1160. 59 Bacon, R W “Privatisation and reform in the global electricity supply industry”, Annual Review of Energy and the Environment, 20, 1995, pp 119-143. 60 Bell M, “Regulation in developing countries is different: avoiding negotiation, renegotiation and frustration” Energy Policy, 2003, pp 299-305.

29
the PUC is structured as a supreme and a credible committee appointed by a distinct
authority, compared to the CEI who is under the same ministry. This will make the
regulatory arm separate from the operations arm. But again, in our view the proposals do
not go far enough. Although promoting competition is one of the statutory duties of the
regulator it is however not clear how it is going to be implemented given the very powerful
position of Genco and Transco.
4.2.3 Tariff/Prices The proposed policy does recognise the need for electricity tariffs to cover the operating
costs and future investment in the sector. It is proposed that the all cross subsidies will be
eliminated or separately supported by the government without burden to any other
consumer or sector companies. This should ensure that the new companies are financially
viable. However it is not yet clear how the prices/tariff for electricity are to be regulated
and will be decided by the PUC, although it would appear that price cap regulation is to be
favoured over ROR regulation.63
4.2.4 Privatisation It seems that the privatisation in the newly formed companies will not be encouraged
immediately, although there is a vague provision in the act. Perhaps it would have been
more prudent to keep relevant private participation options clearly identified because this
will avoid necessary amendments to the Act at the time of private participation in the
future. Nevertheless new thermal generation is open to the private sector, although there
are limitations in private participation in hydro generation (except mini and micro hydro),
transmission and distribution activities. The private sector is encouraged to invest in
61 Traditionally this post is held by the head of the state. Currently this role is assumed by the Prime Minister and hence arguably the credibility level is high. 62 Constitutional Council is a committee appointed by the parliament of Sri Lanka. 63 Rate of Return Regulation is proven to be a failure in the state of Orissa, India where a similar structure is implemented.

30
renewable energy technologies and in rural electrification however there is no clear plan as
to how the incentives are to be provided to encourage private participation.
In summary; it is our view, that the proposed policy guidelines are not the best available
remedy for the crisis situation of the Sri Lankan power sector. Arguably the GOSL
proposals will not ensure that the goals of the sector (to meet the demand for electricity at
all times at least economic, social and environmental cost to promote economic social
development of the country) will be met.
5 ALTERNATIVE PROPOSALS
5.1 An alternative structure
It is our view that vertical separation of the sector as well as horizontal separation of
generation and distribution to introduce as much competition as possible, (consistent with
basic economic theory) is required to solve the concerns discussed in Section 4. To ensure
competition in generation develops quickly it is vital that there are a number of relatively
equal sized companies established. According to Green (1996)64 it is important to avoid
the mistake made in the UK where the development of competition in generation was
hampered due to the inadequate split of the old CEGB at privatisation.
Therefore our proposed ‘alternative structure’ for Sri Lanka is to brake up the CEB
generating stations into smaller economically viable business units as illustrated in Figure
12. The CEB’s hydro plants should be separated to form three different companies. From
a location perspective the division of Mahaweli and Kelani hydro systems to two
generating companies is suitable. Also since they are independent cascading systems there
can be no significant effect of one plant operation to the other. All other hydro systems
namely Samanalawewa (120MW) plant and Kukule plant (70MW) together with other

31
small hydro plants should form another company. Proximity wise Kukule and
Samanalawewa are not as close as desired and the other small plants are scattered all
around. But arguably this alternative proposal would allow generation to be split into
manageable smaller units.
Furthermore the thermal generation of CEB should, in our view, be divested in to different
companies by location and technology. Sapugaskanda power station (144 MW), which
includes CEB owned Diesel generators, should form a separate company. The Kelanitissa
complex should be divided in to two companies. The old stations including GT(old),
GT(new) and steam plants (which are scheduled to be retired) should form one company
(with around 250 MW capacity) and the new 165MW CCGT should form a separate
company.65
Therefore, as described above, the CEB owned power stations should be broken up in to 6
companies to enhance the development of competition. The transmission company should
be a completely separate entity, which should be responsible for bulk power trading (to
start with), transmission operations and economic dispatch. Unlike the GOSL proposals, it
is our view that the LTGEP function should be removed from Transco. Instead this
function should be undertaken by the regulator (PUC). This will address the conflict of
interest discussed above and make sure this important aspect of ESI is under direct
supervision of the regulator.
64 Green R, “Reforms of the electricity supply industry in UK”, The Journal of Energy Literature, Vol. II (1), 1996, pp 3-24. 65 There are two reasons to suggest that the CCGT as a separate company. Firstly it may create a good comparison with the similar private CCGT plant (AES Plant), with same technology specifications, at the same proximity. Secondly most of the new power plant additions in Sri Lanka will be CCGTs hence it can be arguably expected that creating competition among CCGTs will force them to make more onerous efficiency gains.

32
Figure 12: Proposed Alternative Structure for the ESI (The arrows show the power flow and the dotted lines show the control or regulatory activities66)
66 The control of M&AC over the companies applicable only when the GOSL holds management control.
Transco Holding company of -Transmission operations -Bulk power trading -Dispatch
Distribution Area A
Public Utilities Commission (economic, technical & safety Regulator and generation planning)
Monitoring and Advisory Committee Monitoring the companies Recommend BOD to the minister
Minister of Power and EnergyMinister of policy development
and implementation
To take over any other action by
CEB
Mahaweli 660 MW
Kelani 335 MW
Sapugaskanda 144 MW
Kelanitissa Old 251 MW
Kelanitissa CCGT 165 MW
Ace Power 50 MW
Asia Power 51 MW
Colombo Power 64 MW
Lakdhanavi 22.5 MW
AES Kelanitissa 165 MW
Distribution Area B
Distribution Area D
Distribution Area E
Distribution Area F
Other hydro 210MW
Distribution Area C
Generation companies (Ex-CEB)
Generation companies (IPP)

33
It can be argued that the proposed distribution company division has a number of flaws.
Sri Lanka is administratively divided into 8 provinces and electricity is one of the services
where concurrence of the Provincial Council is required. In the GOSL proposals every
distribution company is spread across the country and they need to deal with number of
local authorities and every local authority has to deal with number of distribution
companies. This could well create administrative problems, unnecessary political stress
and cumbersome administrative procedures resulting in additional cost burdens to the
consumer. However it may not be appropriate to have every province declared as a
separate distribution company since it may create unattractive companies and higher costs
due to more information requirements. Also the current proposal of segregation of Distcos
involves an excessive amount of accounting and physical asset separation. Therefore this
separation can be done smoothly and less costly if the segregation is done by separating the
companies by the divisions already identified by the CEB for its operational purposes.67
Hence it is proposed here that the distribution companies should be divided as illustrated in
Table 2 and Figure 13.
Table 2 illustrates that according to percentage revenue and sales this division is almost
even, except for company F. North and Eastern Provinces should be separated due to the
high political unrest in these areas due to terrorism. Also the new funding is expected to
rehabilitate the systems and increase electrification after the ceasefire agreement between
the terrorists and the GOSL. The funding and rehabilitation work should be easily handled
by one company.
67 Sri Lankan distribution system is divided currently in to 11 areas for administration purposes namely; Colombo City, Western (South) Western (North), North Western, Central, North Central, Southern, Uva, Sabaragamuwa, Nothern and Eastern.

34
Company Area No. of customers (%)
Sales in GWh (%)
Revenue (%)
A Colombo City, 4.4 13.8 18.6
B Western (North) 13.3 20.6 19.9
C Western (South) 13.3 23.7 21.5
D Central, North Central, North Western
33.6 21.1 20.8
E Southern, Uva and Sabaragamuwa
28.2 16.6 15.4
F North and Eastern 8.0 4.2 3.8 , (All the divisions are as identified by CEB for operational purposes)
Table 2: Details of alternative proposal for Distcos68
In terms of the number of customers the distribution is biased towards the two
geographically large companies (D and E) but these would have a wide dispersion of
customers with a low per capita consumption (most of the rural electrification schemes are
under these areas); in contrast to companies A, B and C that would enjoy a highly dense
population with higher consumption rates. But by proper comparative regulation these
company performances can be assessed giving due considerations to the adverse conditions
of company D, E and F69 and the dominant position of company A. In our opinion, the
alternative distribution company proposal is the best way to address the above
administrative constraints.
5.2 Privatisation
To attract private investment and to reduce inefficiency and the ever-increasing GOSL
PSBR requirement (due to the power sector), we argue that the privatisation of the sector is
desirable and inevitable; as quoted in Tanenbaum et al. (1992) “When the state owns, no
68 The data were taken from Statistical Digest, 2001. 69 Though company F is a special case as explained above.

35
body owns; and when nobody owns, nobody cares” (p.1).70 There is a general acceptance
that private ownership leads to cost reductions and efficiency gains.
However some of the companies may not be attractive enough for privatisation but
management contracts may be introduced in the event if privatisation fails. 71 This might
be expected in the old CEB plants and distribution companies D, E and F.
In Sri Lanka, power sector privatisation has inherent opposition from the CEB workers’
union as well as the engineers’ union, which are very powerful bodies within the current
structure. But given our proposals it would result in at least 10 new companies, that should
lead to less resistance from trade unions.
We argue that in a less advance power system like the Sri Lankan system it should not be
desirable to privatise in the same way as elsewhere in the world in more advanced systems.
Therefore we propose a phased partial privatisation with private management. It is
understood that the market conditions has to be sufficiently attractive for private
investment. Also due to the current economic storm going through the IPPs and other
power sector investors72; in the near future it may be hard to attract foreign investment to a
small ESI like the Sri Lankan system. In our view, local investment should be exploited as
much as possible especially in the distribution sector where in general the network,
although not perfect, is well established. Also listing of the companies in the Colombo
Stock Exchange may help them raise money for necessary investment (however some of
the companies may not be attractive enough).
70 Tenenbaum et al., op. cit. Tanenbaum et al. quotes this from Putnam, Hayes and Bartlett, Report on Conference on Reconstruction/Privatisation, Moscow, 4-5 Spetember 1991, pp. 3-5. 71 Parts of the business like maintenance work, repair, operations and construction etc may be attractive for the private sector. Badelt and Yehia (2000) identified 4 ways to create private participation in ESI. They are management contracts, leasing, concession and divestiture. For details see Badelt G, Yahia M, “The way to restructure the Lebanese electric power sector: a challenge for the transitional management” Energy Policy, Vol. 28, 2000, pp 39-47. 72 Especially after the Enron collapse in late 2001 and Alsthom bankruptcy in mid 2003.

36
Figure 13: Alternative geographical division of the distribution companies
37
The existing generation companies should be privatised partly with the management rights
or operational contracts to the private investor. The other advantage is that when the
government privatise parts of the business, and the privatisation has the desired effects, it
may increase the share prices of the company. At this point any subsequent divestiture by
the GOSL can make additional money.73
In the privatisation of the existing thermal generation; proper Fuel Supply Agreements
(FSA) for supply of fuel has to be written in a bankable way. The risk allocation may be
very complicated. A proper way of risk mitigation has to be addressed at least for the
initial years of deregulation. Out of the five distribution companies the first three (A, B
and C) will be very attractive to a private investor and also D and E may be for some
extent to local private investors. But the company F may remain government owned for a
foreseeable future. The distribution company privatisation also should be done in stages.
For transmission we do not agree with the view of David et al. (2002) or that of the GOSL,
that the new Transco should remain in the public sector. Although there might be a case
for the GOSL to continue to own the majority of shares in the short run, we see no reason
why it should not be privatised during the medium to longer term when the new structure
matures.
It is important to make sure that all the physical and accounting separations of assets are
completed and all the audited accounts are approved for all the divested companies before
privatisation. This can be a very lengthy process. But success of the privatisation depends
to a large extent on the rigorous and accurate execution of this process.74
73 Green R, “Lessons from electricity privatisation in UK”, Pacific and Asian Journal of Energy, Vol. 5(2), 1995, pp 235-247. 74 At the time of privatisation in the State of Orissa, India, the asset finalisation and the accounting for segregated companies were done only provisionally and this caused litigation and unnecessary administration hurdles for the newly formed companies.
38
5.3 Regulation and competition
Section 5 of the Reforms Act gives power to the minister of power and energy to forward
general policy guidelines in the power sector to the cabinet for approval. The PUC need to
take such guidelines into consideration when discharging functions. Unfortunately such an
arrangement is likely to interfere with the PUC’s independence. In our view this section of
the Act should not be required to be implemented unless absolutely necessary.
It is alternatively proposed that the best way to create more competition is in the generating
sector. The generating companies will be encouraged to compete with each other; however
due to under capacity in generation this may be seen only in the off peak and favourable
hydro conditions. There is a reasonable apprehension that the bulk consumers will
negotiate with the low cost hydro and old thermal generators for cheaper electricity
contracts than the average cost of electricity production in the country. Hence the low
demand domestic customers may have to pay for expensive power. On the other hand with
the horizontal separation the take or pay obligations given to IPPs may need to be assigned
to a credible source of electricity demand. Therfore in the first few years75 the IPP
obligations should in our opinion be passed on to Distco A to C76 proportionately.
However when the gap between supply and demand reduces full competition in generation
should be created with minimum regulation.
We expect that the regulator would encourage efficiency gains in all the functions of the
sector. Namely investment decisions, decisions on best choice of fuel, right location and
right timing. Also efficiency in production and investment, electricity conservation and
allocative efficiency (i.e. the products are allocated to the consumers who value them most
75 May be at least till the IPPs manage to clear there long term debts fully. 76 Since Distcos A to C has the consumers with best paying capacity.

39
(Hunt and Shuttleworth, 1996)) to be encouraged. Also proper public awareness of the
matters related to ESI has to be promoted by the regulator.
5.4 Tariff/Prices
In our view proper tariff structure which covers costs and investments as well as
appropriate incentives for the cost savings has to be provided. It is apprehend that during
the first few years the electricity prices for subsidised (currently) customers will rise due to
the removal of subsidies. However due to the low price elasticity of demand for electricity
in Sri Lanka (-0.3 %, as shown in Appendix) it is thought that this may not be an economic
concern though may be an equity and social concern.
The LTGEP aspect should be handled by the regulator by promoting proper generation
expansion by way of providing incentives to new addition of power plants at lower cost,
and high operational efficiency. The regulator can select the fuel source since Sri Lanka
imports all its primary fuels for electricity generation.
5.5 Phasing of changes
The above has set out a phased approach to the ‘alternative’ changes as follows:
5.5.1 Period 1 The generators should be asked to give their LRMC and SRMC for the consideration and
the tariff should be set to match the MC. Hence tariff regulation can be linked to MC
minus efficiency gains plus Consumer Price Index (CPI), with around 3 to 5 year revisions.
The similar type companies (by technology) can be compared by yardstick competition to
create artificial competition. The Transco will decide on the dispatch to arrive at a
minimum average cost of electricity at the selling end.
Arguably in the same way RPI-X regulation linked to CPI is preferred in transmission and
distribution. Empirical studies suggest that price cap regulation is superior to traditional

40
ROR regulation.77 Proper incentives to more efficient dispatch will be given to Transco
and Distcos. This gives first hand incentives for better performances.
Distcos can be compared with yardstick regulation with RPI-X regime as in the case of the
RECs78 in the England and Wales system. These should incentivise the Distcos with
respect to loss reduction (billing), bill collection79, meter installation, technical reliability
and reliability in billing, less voltage fluctuations and customer care. Parallel to the
suggested price cap regulation it is vital that the quality of service in transmission and
distribution be regularly monitored by the regulator.80 Retail competition may not be
encouraged in the near future due to high cost involved with it as suggested by Green
(1995). He argues that at the starting of deregulation, competition should be introduced
only in generation or in supply but not in both cases. Also Tanenbaum (1992) suggested
that for the first few years of privatisation it is better to limit competition to only
generation part of the business. In summary the structure proposed here is an advanced
version of Model 2 as given by Hunt and Shuttleworth (1996).
5.5.2 Period 2 As discussed above in Period 2, open access to transmission grid should begin to help
create competition. So the bulk consumer should be given access to the grid up to a limit
so that they can have bilateral contracts with the generators. That is, the bulk consumers
will have choice in identifying and choosing their buyer. Thus slowly helping to establish
competition in generation. Still the Transco and Distcos should be regulated using RPI-X
77 Dahl C and Mendonca A F, “The Brazilian electrical system reforms”, Energy Policy, Vol. 27, 1999, pp 73-83. 78 Regional Electricity Companies. 79 There are two types of non-technical losses in distribution. One is the billing as a % of electricity consumption by the Distco (this has technical loss plus billing loss). Second is how much can be collected from the billed amount (this is known as collection loss). 80 Tenenbaum et al., op. cit.

41
tariff regime coupled with yardstick competition. Thus the structure of ESI will be Model
3 according to Hunt and Shuttleworth (1996) classification.81
5.6 Concerns of the alternative proposal
To help facilitate future competition in generation, take or pay guarantees for new
investments should be stopped as soon as possible. But since the country do not even have
a long term non recourse credit rating,82 it is unlikely that international/national investors
will be encouraged to build generating stations on their own without take or pay guarantee
by the utility,83 backed by the GOSL. This will be a challenge for competition in
generation. However multilateral support and introduction of proper guarantee companies
(at present the exposure of this type of arrangements in the world is limited) could be seen
as an option for the GOSL.
Another concern is that the uncertainty associated with the impact of the possible
deregulation and liberalisation of the petroleum sector in Sri Lanka. It is not clear what the
impact will be on the ESI given the high percentage of thermal power generation expected
in the future.
81 The ultimate aim is to reach Model 4 (Hunt and Shuttleworth, 1996) with choice of selecting supplier at all
levels, by separating retail supply and distribution. 82 Fitch Sovereign Ratings, April 2004, www.fitchratings.com 83 It will be an assigned distco in the post reform structure.

42
6 SUMMARY AND CONCLUSION
It has been demonstrated that although the GOSL’s proposed policy guidelines and reforms
are going in the right direction, they could be further improved. Table 3 below summarise
the current ESI, proposed reforms by GOSL and the alternative proposals discussed here.
We have recommended that there should not be, in the long run, any hindrance to private
participation in any part of the sector namely generation, transmission and distribution84
although at the beginning transmission company should be encouraged to have private-
public partnership. However it is stressed that we do not suggest outright privatisation of
the sector (as in the case of England and Wales), but a no hindrance policy to the private
investor. It is acknowledged that the pace of privatisation should be managed so that
undesired effects like economic shocks can be avoided.
It has been argued that the proposed monopoly structure for generation, by creating one
huge company should be re-considered, in the spirit of competition. In addition the
introduction of choice into electricity supply to bulk consumers should be considered as
early as possible with the reforms.
We have proposed that the government intervention, by way of its ownership in the
businesses in the sector and by way of policy, should be reduced gradually so that the
government intervention and regulatory intervention will be slowly replaced by market.
One may argue how far efficiency can be improved with a stock of employees who have
been working in a typical monopolistic utility mind set for a large part of their career; we
should not therefore expect improvements overnight.
84 Private participation will be encouraged in supply when separated from distribution later when the sector moves towards Model 4. However at this stage the ESI will assume to be matured and hence anyway attract private participation.

43
Finally we reiterate that in our view the GOSL needs to grasp the initiative of the reforms
of the ESI and ensure that they are completed in an efficient and effective way. Otherwise
the full benefits of the changes will not be enjoyed by the Sri Lankan citizens in the longer
term.

44
Identified concerns Current structure Proposed reforms by GOSL Alternative/additional proposed reforms
Deintegration of the monopoly No Yes, but limited Yes
Improving competition No Not adequate (due to large GOSL companies)
Yes
Private investment and management Yes (only limited to BOO/BOT projects)
Yes (subject to limitations) Yes (unlimited encouragement)
Efficiency gains Not adequate Yes (through regulation) Yes (through regulation and competition)
Timely implementation of system expansion
Not adequate Not addressed Addressed
Cost reflecting tariff structure No Yes Yes
Improved rural electrification No Yes Yes
Less political interference and independent regulator
No Yes Yes, but with added caution about minister’s intervention
Loss reduction and reliability improvement
No Not adequate (GOSL can direct policies)
Yes (GOSL should not give policy directions, unless absolutely necessary)
Type of regulation for natural monopolies
CEI (no effective regulation) PUC (not yet finalised) PUC (RPI-X with yardstick competition)
Public awareness and support No No Yes
Hunt & Shuttleworth (1996) classification
Model 1 Model 2 Model 2 but reaching Model 3
Table 3: Summary of the features in proposed and alternative reforms

45
Appendix : Data Sources, Estimation and Forecast Results Electricity Demand Estimation
In this Appendix an electricity demand function for Sri Lanka is estimated and used to
forecast future electricity requirements for Sri Lanka. LTGEP (2001) provide forecasts for
the domestic, industrial and commercial sectors, with the total obtained by aggregating the
three sectors. Low, medium and high economic growth scenarios are predicted and the
medium growth values are taken as the base case. However the methodology used is not
clear. Therefore the forecasts obtained from the estimated equation are compared with the
CEB projections from LTGEP (2001).
Methodology There are various ways to estimate electricity demand functions. Given data availability
and that the forecast derived here is used as an indicative prediction, the commonly used
two stage Engle-Granger Error Correction Model (ECM)85 was used (see Hendry and
Juselius, 200086 for a full explanation of the technique).
It was therefore assumed that there exists for Sri Lanka, a simple long-run equilibrium log-
linear cointegrating relationship between electricity consumption per capita (Et), GDP per
capita (Yt), the real Electricity Price per kWh (Pt), and the Underlying Energy Demand
Trend (T) given by:
et = β0 + β1yt + β2pt + β3 t (1)
where et = natural logarithm of per capita electricity demand in kWh;
85 Engle R F and Granger C W J “Co-integration and Error Correction: Representation, Estimation and
Testing” Econometrica, March 1987, pp 251-76. 86 Hendry D and Juselius K, “Explaining cointegration analysis: Part I, Energy Journal, Vol. 21, 2000, pp 1-42.

46
yt = natural logarithm of per capita GDP at 1996 constant (factor cost)
prices in Sri Lankan Rupees;
pt = natural logarithm of average unit (per kWh) price of electricity at
constant 1996 prices in Sri Lankan Rupees;
t = 1970 – 2000.
The time series properties of the variables were initially tested to see if they were
stationary using the Augmented Dickey Fuler (ADF) test. Equation (1) was then estimated
by Ordinary Least Squares (OLS) and the residuals used, via the ADF statistic, to test for
cointegration. In addition the Johansen multivariate method was used to check that the
assumption of one cointegrating vector was acceptable (see Hendry and Juselius 200187).
The residuals from the preferred cointegrating vector were then used as the error correction
(EC) term in the following short-run dynamic equation:
∆et = α0 + α1∆et + α2∆et-1 +α3∆et-2 + α4∆yt + α5∆yt-1 + α6∆yt-2 + α7∆pt + α8∆pt-1 + α9∆pt-2+
α10raint + α11tempt + α12ECt-1 (2)
where ∆ is the difference operator,
raint = Annual rainfall at Nuwaraeliya88 measured in metres,
tempt = Annual average temperature data in Colombo89 in multiples of 10 degree
Celsius
(Note the two additional variables, rain and temp were added here since they were found to
be stationary in levels, see below.) The preferred equation was found by selecting a
87 Hendry D and Juselius K, “Explaining cointegration analysis: Part II, Energy Journal, Vol. 22, 2001, pp 75-120. 88 In this model the rain fall data was used as a proxy for reservoir water level in the hydro plants, therefore the monitoring station closest to the hydro plants were taken. Hence the data from the observation station at Nuwara-eliya is chosen. 89 Since Colombo is the load centre of the country the temperature data for Colombo is chosen.

47
restricted model by testing down from the over-parameterised model of equation (2) that
satisfied parameter restrictions without violating a range of diagnostic tests. In particular,
the equation residuals were tested for the presence of non-normality, serial correlation and
heteroscedasticity. The estimated preferred equation was used to generate the indicative
forecast of Sri Lankan electricity demand until 2020 discussed in section 4 of the main
text.
Data Data used in the estimation consisted of annual data over the period 1970 – 2001 inclusive.
The data for electricity consumption for Sri Lanka were taken from the MOPE data base90
for 1970 – 2000 and from Statistical Digest, CEB for 2001. These were divided by
estimates of the population taken from CBSL, AR 2002 to give per capita consumption, Et.
Data for GDP at 1996 prices were taken from the Special Statistical Appendix of the CBSL
AR, 2002 and divided by population estimates to give the variable Yt. Data for the average
nominal electricity price per unit were taken from the MOPE data base for 1970 – 2000
and from the CBSL AR for 2001. These were deflated by the GDP deflator taken from
Special Statistical Appendix to give Pt. Data for raint and tempt were taken from the
Meteorological Department of Sri Lanka.
Results
All estimations were undertaken using Eviews version 4.1. The calculated ADF statistics
from testing the time series properties of the variables are given in Table A1. It can be seen
that for te , ty and tp the calculated ADF statistics are less than the 1% critical value of -
90 Data Base on Energy, CD from MOPE, Sri Lanka. This is similar to EIA data base of energy balances for non OECD countries.

48
4.29 (in absolute terms) whereas for raint and tempt the calculated statistics are greater than
the 1% critical value. Therefore, it is concluded that te , ty and tp are non stationary and
assumed to be stationary in first differences, whereas raint and tempt are stationary.
Variable ADF Test
Statistic
te -2.50
tp -2.54
ty -2.61
train -5.35
ttemp -4.99
Table A1 : Unit Root Test results A number of versions of equation (1) were estimated with and without the time trend and
with and without the price variable. The preferred relationship being:
tpye ttt 021003.0003361.0116503.1972200.6 +−+−= 20011970 −=t (3)
ADF = -4.45
Cointegration is accepted given the ADF statistic is greater in absolute terms than the 1%
critical value of -3.67. Furthermore, it gives a long-run income elasticity of 1.1 and a long-
run price elasticity of -0.003. The estimated income and price elasticities are consistent
with similar studies for developing countries. Dahl (1994)91 found that for the low energy
91 Dahl C, “A survey of energy demand elasticities for the developing world”, Journal of Energy and Development, Vol. 18, No. 1, 1994, pp 1-47.

49
price countries (most of them are low-income countries and countries from the Gulf
Cooperation Council) produce low price elasticity estimates, which is consistent with the
results here.
Equation (3) also suggests that the Underlying Energy Demand Trend is increasing at
about 2% per annum. Therefore, although this is not reflecting any improvements in
technical progress or increases in energy efficiency it is not rejected given the arguments
by Hunt, et al. (2003).92 Instead, this is picking up other exogenous effects that are leading
to an increase in electricity consumption – quite possibly one important factor being the
increase electrification over the estimation period.
As a further test the Johansen procedure, is used to ensure there is one, and only one
cointegrating vector. The results, given in Table A2, show that one cointegrating equation
is clearly accepted at the 5% level of significance.
Results Unrestricted Cointegration Test
No of CE* Test statistic 5% critical value
0 45.73 42.44
At most 1 13.91 25.32
Trace Statistic
At most 2 3.80 12.25
0 31.82 25.54
At most 1 10.12 18.96
Maximum Eigen Statistic
At most 2 3.80 12.25
92 Hunt L C, Judge G, Ninomiya Y, “Underlying trends and seasonality in UK energy demand: A sectoral analysis”, Energy Economics, Vol. 25, No. 1, January 2003, pp 93-118.

50
Table A2: Johansen Cointegration Tests *(CE=Cointegrating Equation)
Given the acceptance of one CE, the following preferred short-run dynamic equation was
obtained following the testing down of the general model given in equation (2) above:
11 738465.0488248.1211879.0 −− −∆+∆=∆ tttt ECyee 20011970 −=t (4)
[0.09] [0.00] [0.00]
Adj R2 = 0.58; LMSC:F =0.75[0.48]; HET:F= 0.85[0.54]; Norm:χ2 =2.79[0.25];
RESET:F= 0.50[0.49]; Chow BP1995: F=0.72[0.55]; Chow FT1995-2001: F=1.43[0.25]93
Equation 4 passes all diagnostic tests, all coefficients are statistically significant at the 10%
level with the coefficient on the error correction significant and of the right sign and
magnitude – suggesting that nearly ¾ of any disequilibrium is adjusted for each year. Note
neither rain nor temp proved to be significant so they were eliminated.
Forecasting Using the estimated equation (4), with the long-run equation (3) embedded via the EC
term, future energy demand was forecast until 2020. In order to drive the forecast,
assumptions were required for real GDP, the real energy price and population growth. The
projections for population were taken from the department of census and statistics of Sri
Lanka, which gives values for every five years (2006, 2011, 2016 and 2021) so assuming
that the growth is linear, projected population for the intervening years were interpolated.
For GDP, three scenarios were conducted; the base case is taken from the GDP projections
of the CBSL AR 2002, which gives projections up to 2006, after that it is assumed a 4.5%
growth; the high growth scenario is 2% more than the base case and the low growth
93 The probabilities are given in square brackets.

51
scenario is 2% less than the base case94. For the electricity price predictions, the actual
value is taken for 2002 from CBSL AR, 2002 and assumed that this will not change until a
30% real price increase expected in year 2005, since reforms are assumed to be
implemented by this year.95 Thereafter, the real electricity price is assumed to stay
unchanged for 5 years and gradually decline by 2% per annum every year until 2020.
The base case forecasts are given in Table A3. The peak load is calculated by using a loss
level of 18% and 15% (as shown in Table A3) and a system LF of 55% (average LF for
1986-2000 is around 55% as mentioned in Section 2.4.6).
Year Electricity Demand
Gross Losses96
Generation Load Factor (LF)
Peak
(GWh) % Growth (%) (GWh) (%) (MW)
2002 5,700 5.3 18 6,951 55 1,443
2003 6,197 8.7 18 7,558 55 1,569
2004 6,862 10.7 18 8,368 55 1,737
2005 7,592 10.6 18 9,259 55 1,922
2006 8,367 10.2 18 10,204 55 2,118
2007 8,896 6.3 15 10,466 55 2,172
2008 9,448 6.2 15 11,115 55 2,307
2009 10,099 6.9 15 11,881 55 2,466
2010 10,830 7.2 15 12,741 55 2,644
2011 11,616 7.3 15 13,666 55 2,836
2012 12,458 7.2 15 14,656 55 3,042
2013 13,356 7.2 15 15,713 55 3,261
2014 14,315 7.2 15 16,842 55 3,496
2015 15,343 7.2 15 18,051 55 3,746
2016 16,095 4.9 15 18,935 55 3,930
2017 16,827 4.6 15 19,797 55 4,109
94 The growth projections for other south Asian countries except Pakistan and India is given as 4.6% till 2012 (Source: WEFA/DRI - 2002). 95 It is assumed that when the political prices are replaced with MC based prices initially there will be an average price rise of around 30%. 96 Including self generation also as a loss.

52
2018 17,666 5.0 15 20,783 55 4,314
2019 18,618 5.4 15 21,904 55 4,546
2020 19,642 5.5 15 23,108 55 4,796
Table A3: Electricity demand forecasts for Sri Lanka 2002-2020 base case It can be seen from Table A3 that the base scenario produces a fairly high demand growth
of around 10% in the initial years (2003-2006) due to the high GDP growth assumption
(around 7.5% to 9.0%). Thereafter there is a relatively steady growth until 2015 of around
7% per annum, due to the steady GDP growth rate assumption of per annum. From 2016 –
2020 the projected electricity consumption growth is around 5% per annum given the
lower GDP growth assumption of 3% per annum.

Note: This paper may not be quoted or reproduced
without permission
Surrey Energy Economics Centre (SEEC) Department of Economics
University of Surrey Guildford
Surrey GU2 7XH

SURREY
ENERGY
ECONOMICS
DISCUSSION PAPER
SERIES
For further information about SEEC please go to:
www.seec.surrey.ac.uk