Embed Size (px)
Citation preview
2017Annual Statistical Report
SRI LANKA TOURISM DEVELOPMENT AUTHORITY
01Sri Lanka Tourism Development Authority »»» Statistical Report 2017
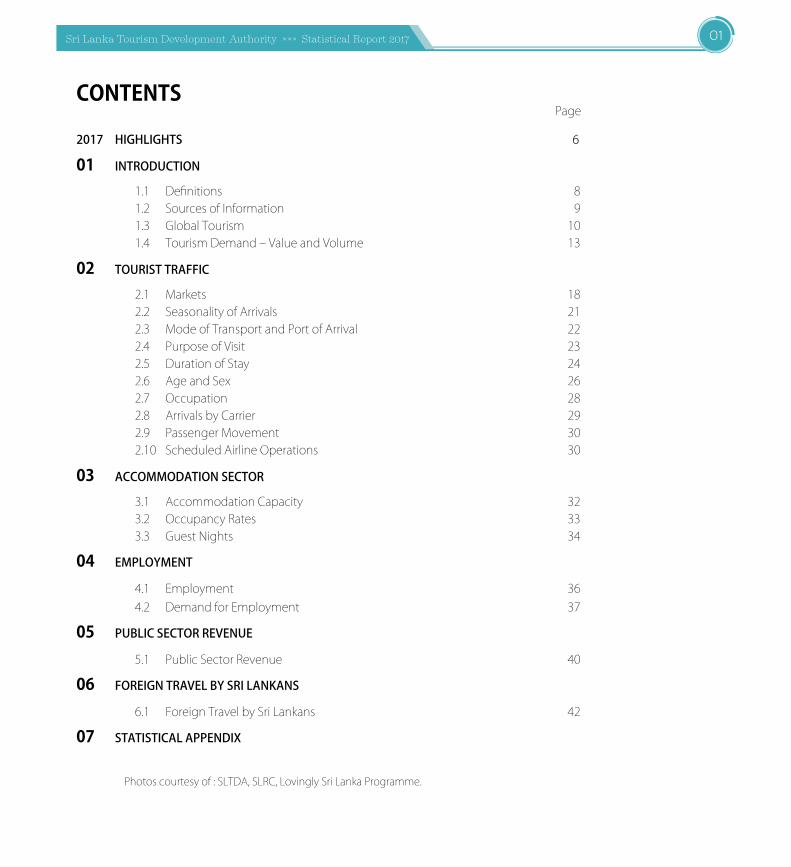
CONTENTS Page
2017 HIGHLIGHTS 6
01 INTRODUCTION
1.1 Definitions 8 1.2 SourcesofInformation 9 1.3 GlobalTourism 10 1.4 TourismDemand–ValueandVolume 13
02 TOURISTTRAFFIC
2.1 Markets 18 2.2 SeasonalityofArrivals 21 2.3 ModeofTransportandPortofArrival 22 2.4 PurposeofVisit 23 2.5 DurationofStay 24 2.6 AgeandSex 26 2.7 Occupation 28 2.8 ArrivalsbyCarrier 29 2.9 PassengerMovement 30 2.10 ScheduledAirlineOperations 30
03 ACCOMMODATIONSECTOR
3.1 AccommodationCapacity 32 3.2 OccupancyRates 33 3.3 GuestNights 34
04 EMPLOYMENT
4.1 Employment 36 4.2 DemandforEmployment 37
05 PUBLICSECTORREVENUE
5.1 PublicSectorRevenue 40
06 FOREIGNTRAVELBYSRILANKANS
6.1 ForeignTravelbySriLankans 42
07 STATISTICALAPPENDIX
Photoscourtesyof:SLTDA,SLRC,LovinglySriLankaProgramme.
Sri Lanka Tourism Development Authority »»» Statistical Report 201702
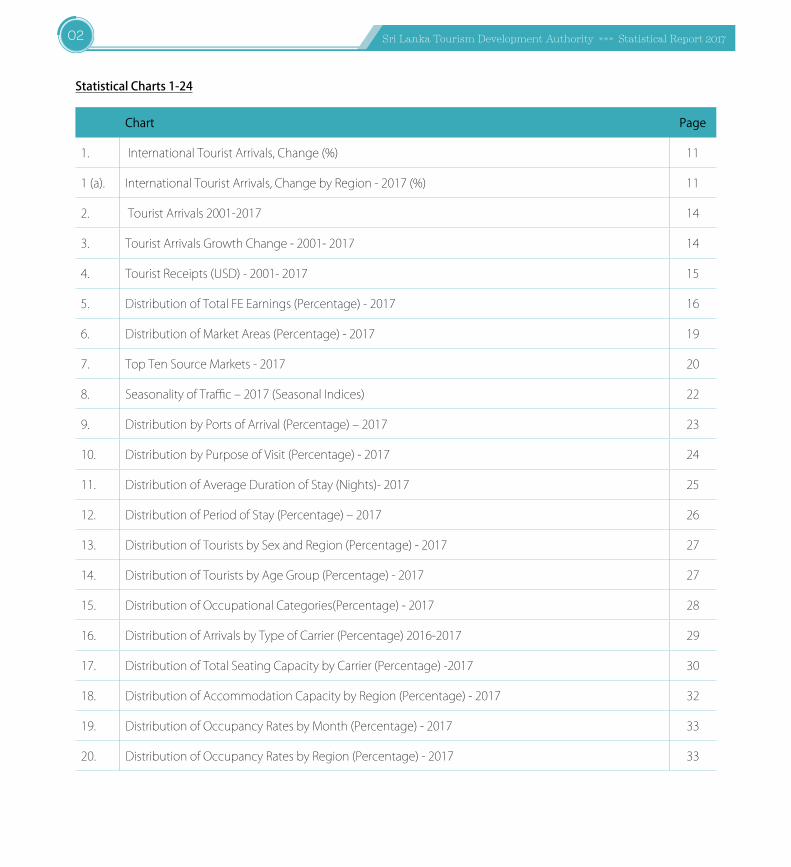
StatisticalCharts1-24
Chart Page
1. InternationalTouristArrivals,Change(%) 11
1(a). InternationalTouristArrivals,ChangebyRegion-2017(%) 11
2. TouristArrivals2001-2017 14
3. TouristArrivalsGrowthChange-2001-2017 14
4. TouristReceipts(USD)-2001-2017 15
5. DistributionofTotalFEEarnings(Percentage)-2017 16
6. DistributionofMarketAreas(Percentage)-2017 19
7. TopTenSourceMarkets-2017 20
8. SeasonalityofTraffic–2017(SeasonalIndices) 22
9. DistributionbyPortsofArrival(Percentage)–2017 23
10. DistributionbyPurposeofVisit(Percentage)-2017 24
11. DistributionofAverageDurationofStay(Nights)-2017 25
12. DistributionofPeriodofStay(Percentage)–2017 26
13. DistributionofTouristsbySexandRegion(Percentage)-2017 27
14. DistributionofTouristsbyAgeGroup(Percentage)-2017 27
15. DistributionofOccupationalCategories(Percentage)-2017 28
16. DistributionofArrivalsbyTypeofCarrier(Percentage)2016-2017 29
17. DistributionofTotalSeatingCapacitybyCarrier(Percentage)-2017 30
18. DistributionofAccommodationCapacitybyRegion(Percentage)-2017 32
19. DistributionofOccupancyRatesbyMonth(Percentage)-2017 33
20. DistributionofOccupancyRatesbyRegion(Percentage)-2017 33
03Sri Lanka Tourism Development Authority »»» Statistical Report 2017
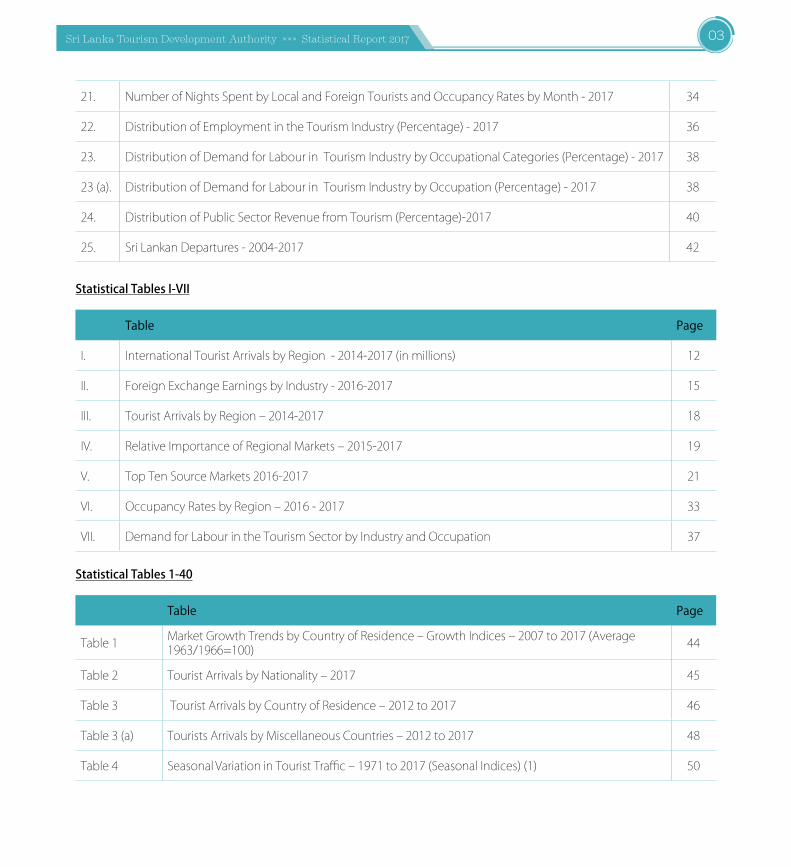
21. NumberofNightsSpentbyLocalandForeignTouristsandOccupancyRatesbyMonth-2017 34
22. DistributionofEmploymentintheTourismIndustry(Percentage)-2017 36
23. DistributionofDemandforLabourinTourismIndustrybyOccupationalCategories(Percentage)-2017 38
23(a). DistributionofDemandforLabourinTourismIndustrybyOccupation(Percentage)-2017 38
24. DistributionofPublicSectorRevenuefromTourism(Percentage)-2017 40
25. SriLankanDepartures-2004-2017 42
StatisticalTablesI-VII
Table Page
I. InternationalTouristArrivalsbyRegion-2014-2017(inmillions) 12
II. ForeignExchangeEarningsbyIndustry-2016-2017 15
III. TouristArrivalsbyRegion–2014-2017 18
IV. RelativeImportanceofRegionalMarkets–2015-2017 19
V. TopTenSourceMarkets2016-2017 21
VI. OccupancyRatesbyRegion–2016-2017 33
VII. DemandforLabourintheTourismSectorbyIndustryandOccupation 37
StatisticalTables1-40
Table Page
Table1 MarketGrowthTrendsbyCountryofResidence–GrowthIndices–2007to2017(Average1963/1966=100) 44
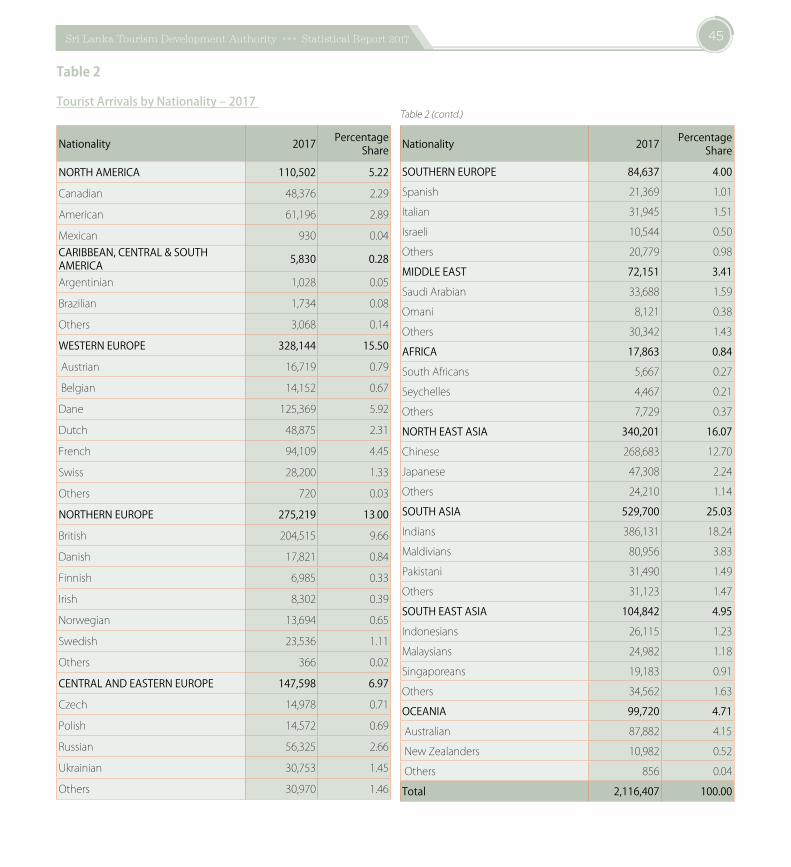
Table2 TouristArrivalsbyNationality–2017 45
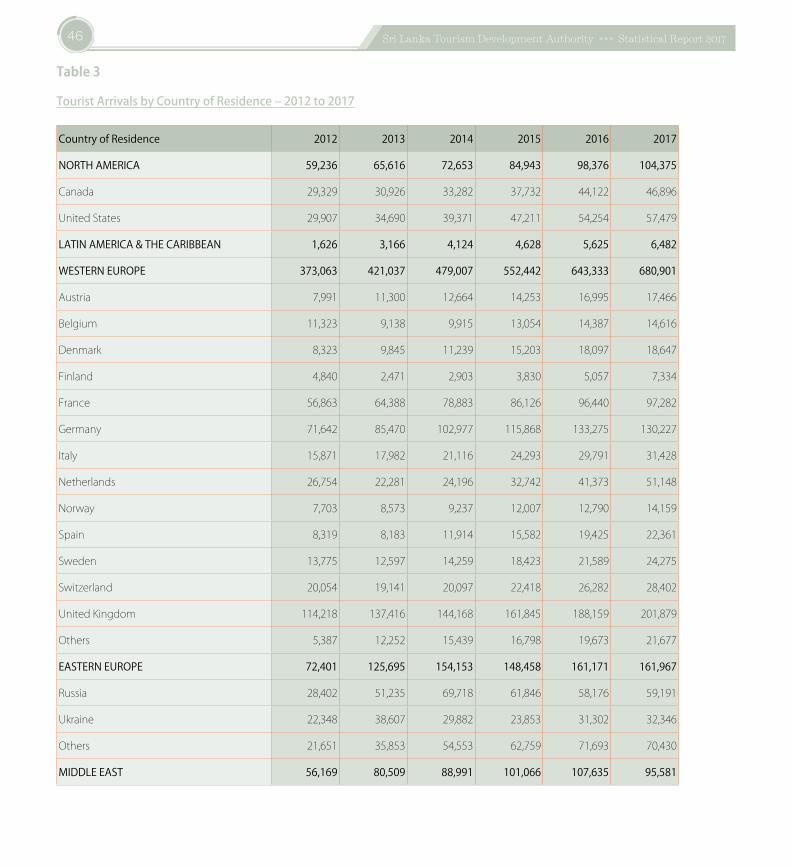
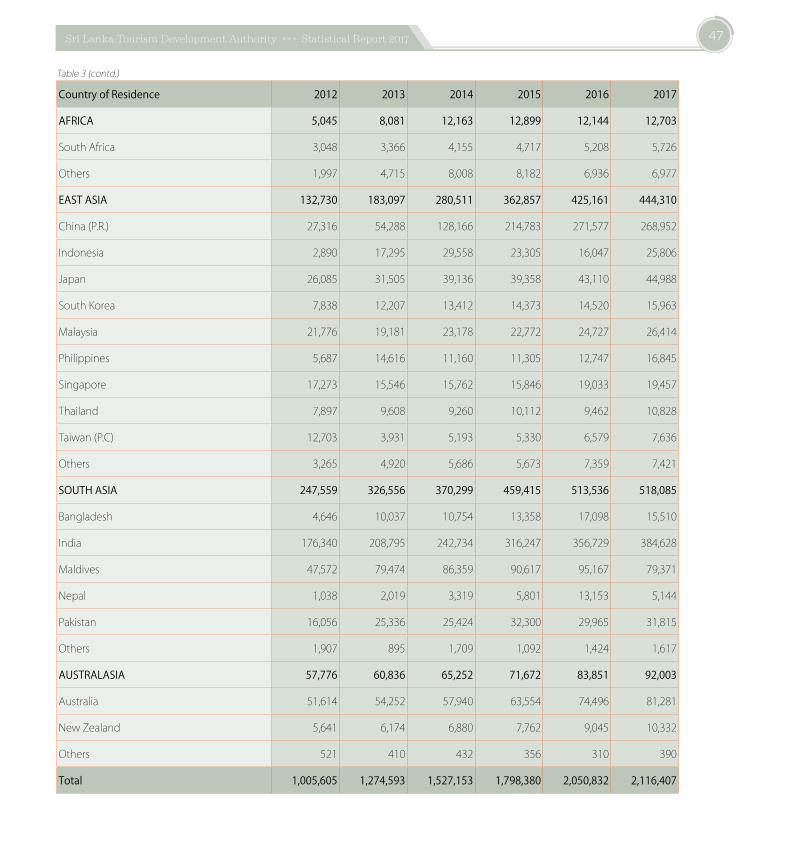
Table3 TouristArrivalsbyCountryofResidence–2012to2017 46
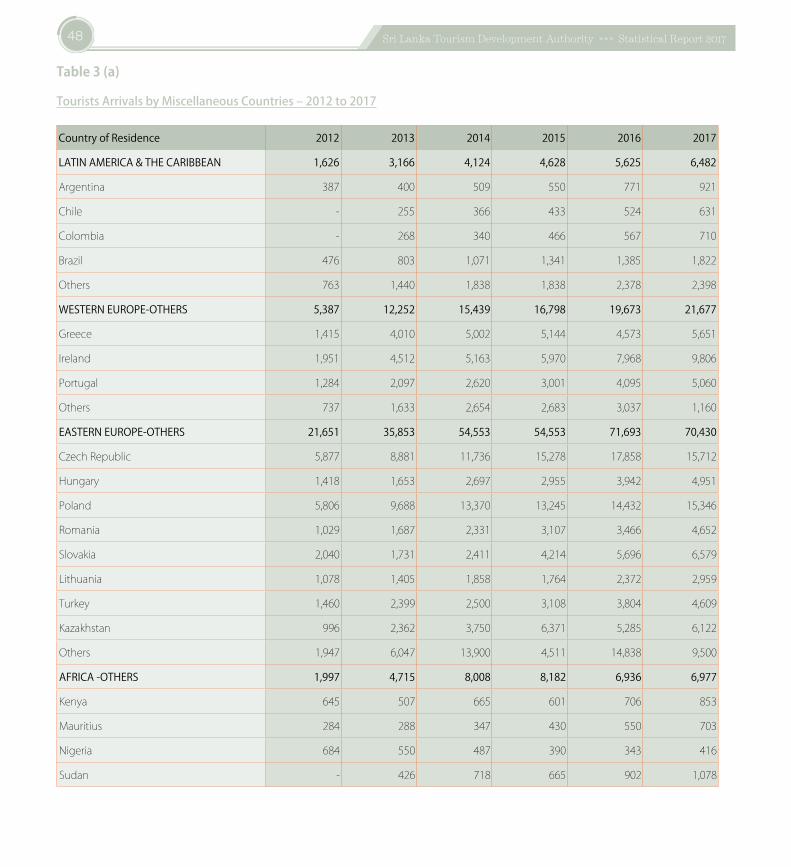
Table3(a) TouristsArrivalsbyMiscellaneousCountries–2012to2017 48
Table4 SeasonalVariationinTouristTraffic–1971to2017(SeasonalIndices)(1) 50
Sri Lanka Tourism Development Authority »»» Statistical Report 201704
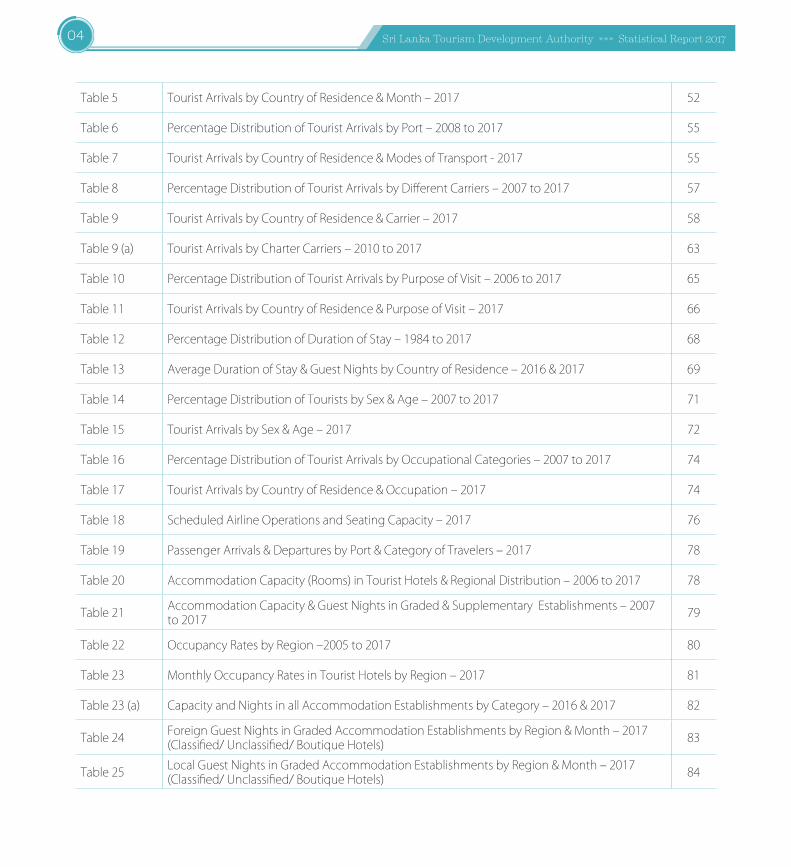
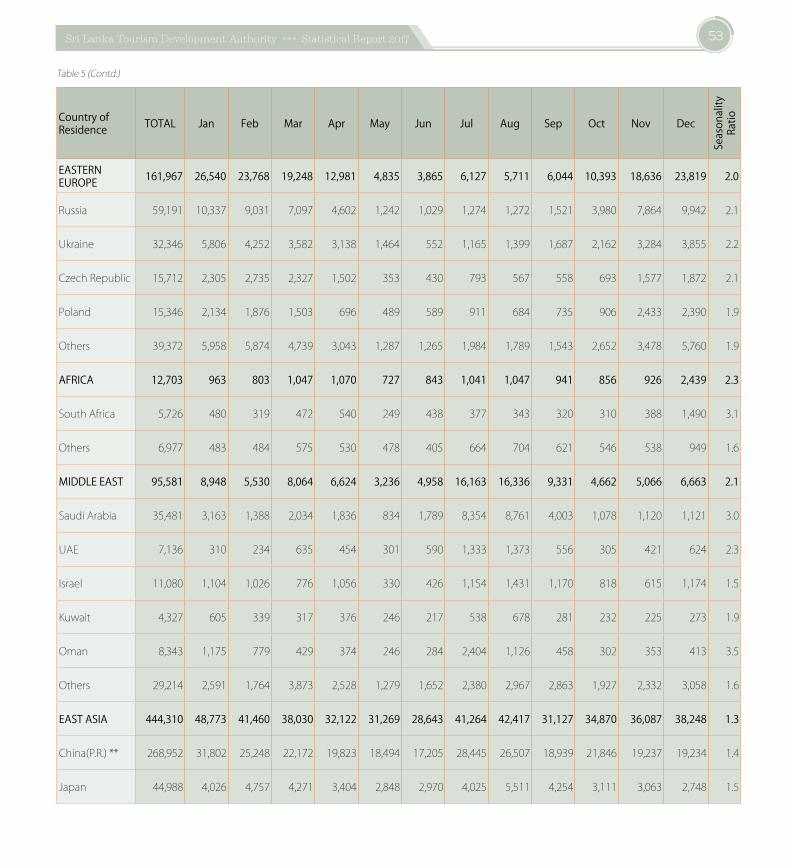
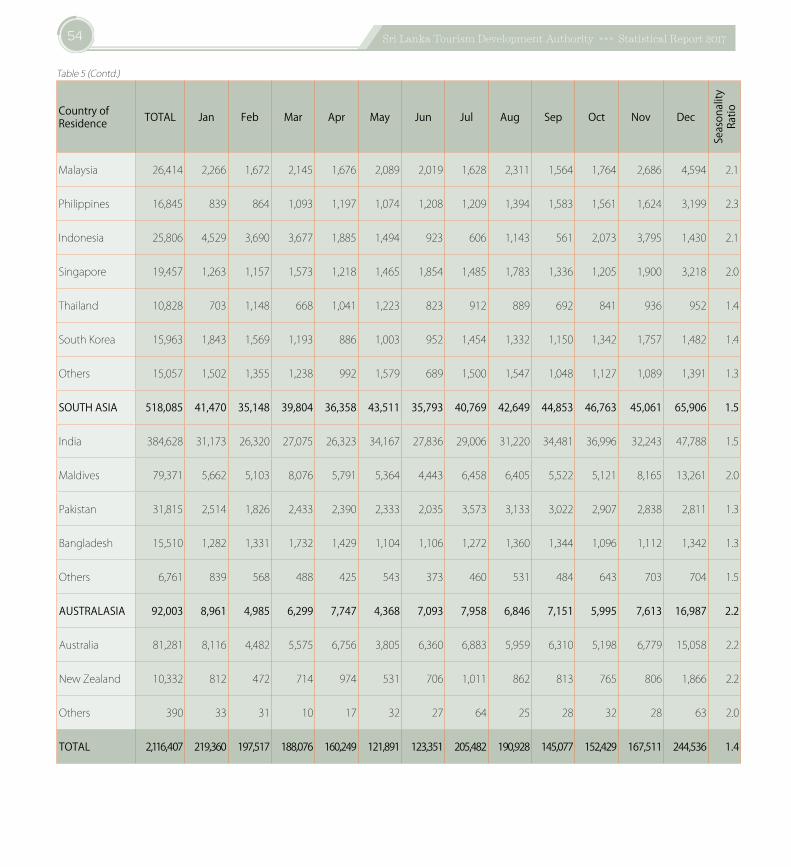
Table5 TouristArrivalsbyCountryofResidence&Month–2017 52
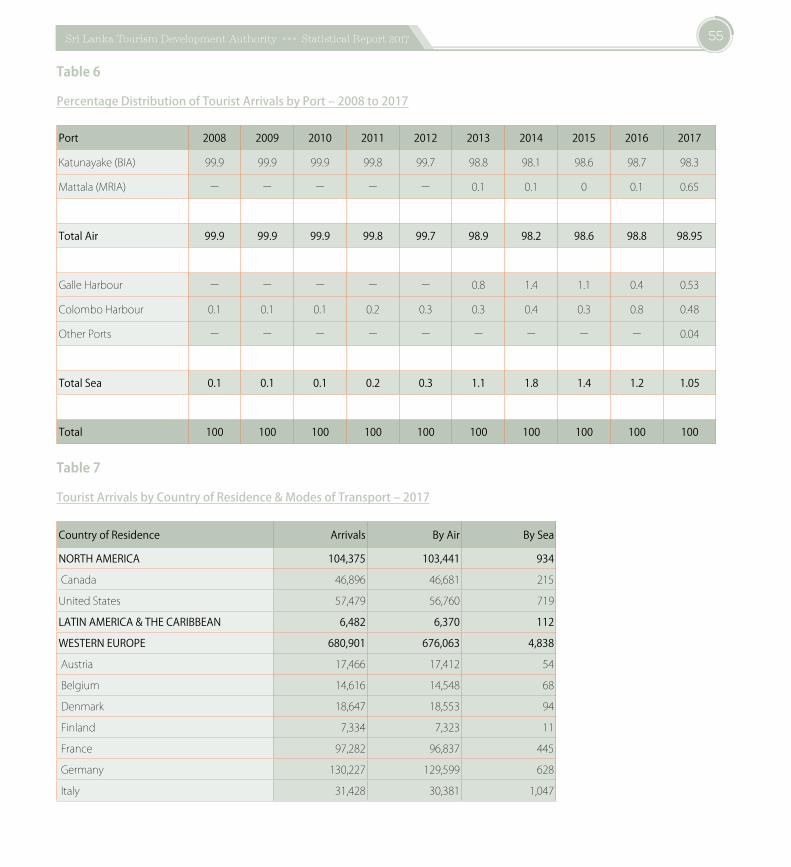
Table6 PercentageDistributionofTouristArrivalsbyPort–2008to2017 55
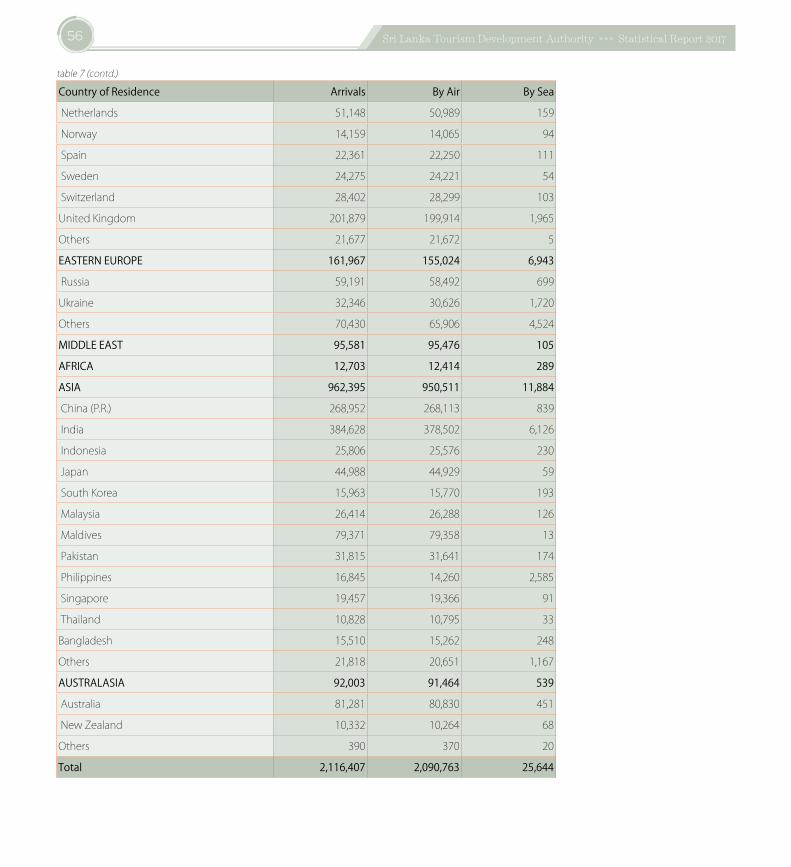
Table7 TouristArrivalsbyCountryofResidence&ModesofTransport-2017 55
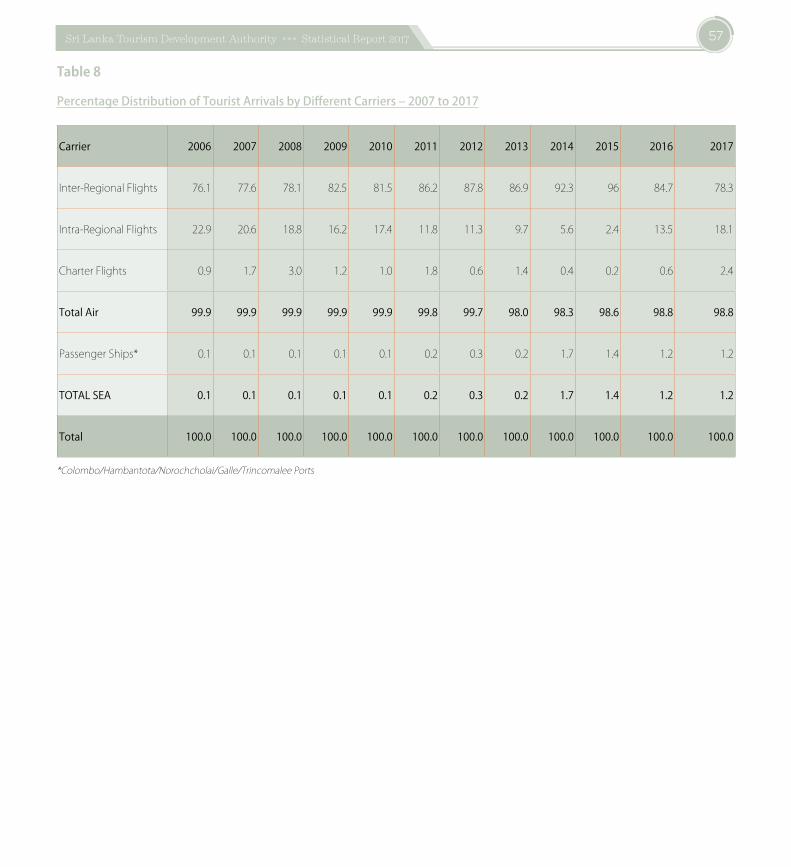
Table8 PercentageDistributionofTouristArrivalsbyDifferentCarriers–2007to2017 57
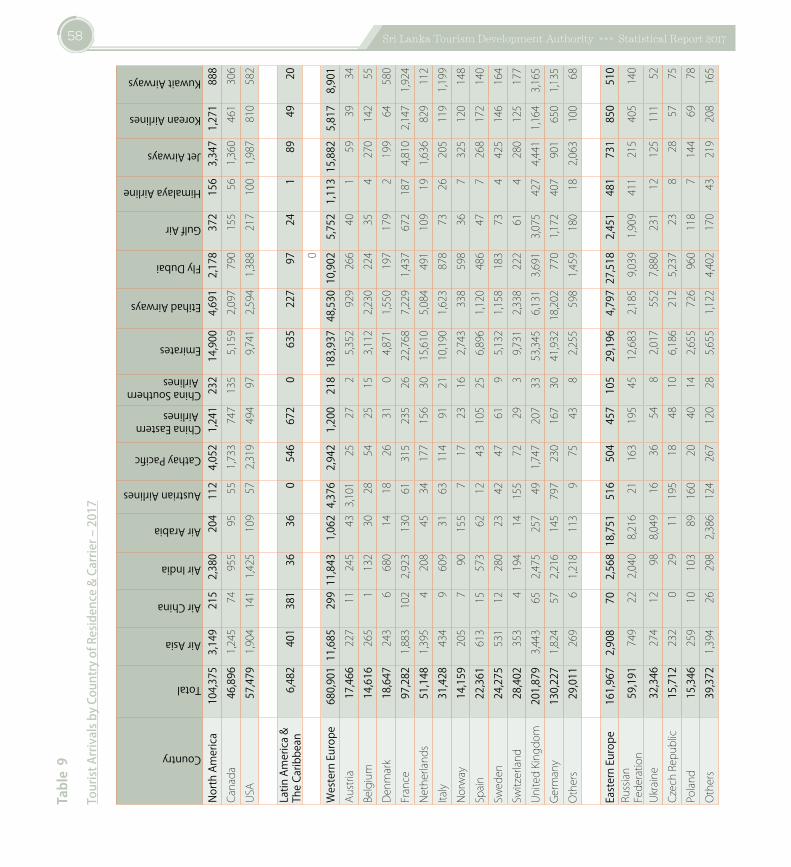
Table9 TouristArrivalsbyCountryofResidence&Carrier–2017 58
Table9(a) TouristArrivalsbyCharterCarriers–2010to2017 63
Table10 PercentageDistributionofTouristArrivalsbyPurposeofVisit–2006to2017 65
Table11 TouristArrivalsbyCountryofResidence&PurposeofVisit–2017 66
Table12 PercentageDistributionofDurationofStay–1984to2017 68
Table13 AverageDurationofStay&GuestNightsbyCountryofResidence–2016&2017 69
Table14 PercentageDistributionofTouristsbySex&Age–2007to2017 71
Table15 TouristArrivalsbySex&Age–2017 72
Table16 PercentageDistributionofTouristArrivalsbyOccupationalCategories–2007to2017 74
Table17 TouristArrivalsbyCountryofResidence&Occupation–2017 74
Table18 ScheduledAirlineOperationsandSeatingCapacity–2017 76
Table19 PassengerArrivals&DeparturesbyPort&CategoryofTravelers–2017 78
Table20 AccommodationCapacity(Rooms)inTouristHotels&RegionalDistribution–2006to2017 78
Table21 AccommodationCapacity&GuestNightsinGraded&SupplementaryEstablishments–2007to2017 79
Table22 OccupancyRatesbyRegion–2005to2017 80
Table23 MonthlyOccupancyRatesinTouristHotelsbyRegion–2017 81
Table23(a) CapacityandNightsinallAccommodationEstablishmentsbyCategory–2016&2017 82
Table24 ForeignGuestNightsinGradedAccommodationEstablishmentsbyRegion&Month–2017(Classified/Unclassified/BoutiqueHotels) 83
Table25 LocalGuestNightsinGradedAccommodationEstablishmentsbyRegion&Month–2017(Classified/Unclassified/BoutiqueHotels) 84
05Sri Lanka Tourism Development Authority »»» Statistical Report 2017
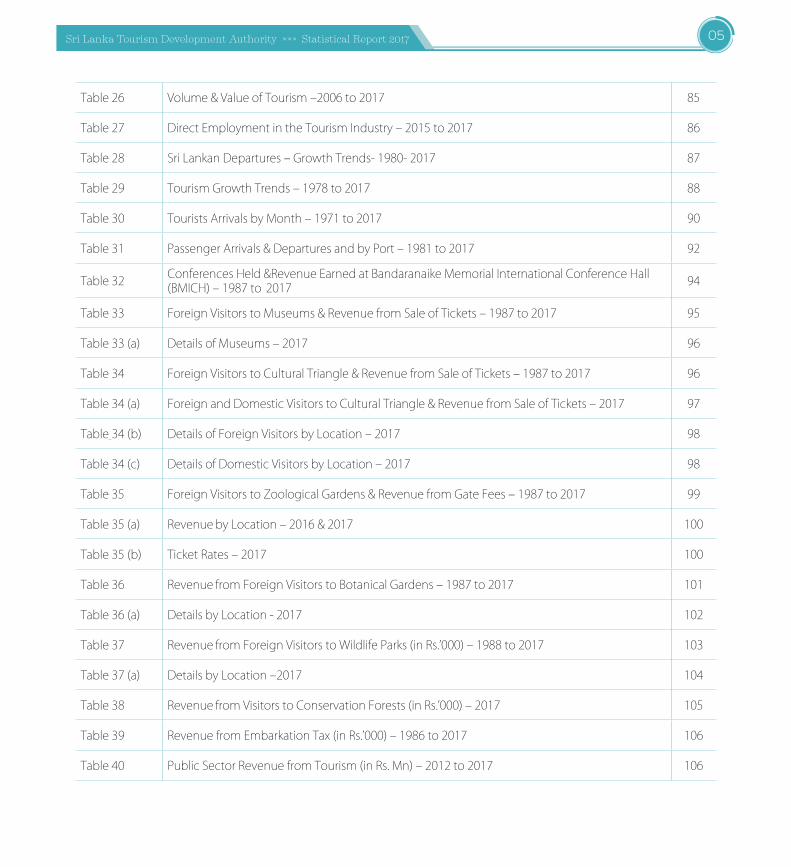
Table26 Volume&ValueofTourism–2006to2017 85
Table27 DirectEmploymentintheTourismIndustry–2015to2017 86
Table28 SriLankanDepartures–GrowthTrends-1980-2017 87
Table29 TourismGrowthTrends–1978to2017 88
Table30 TouristsArrivalsbyMonth–1971to2017 90
Table31 PassengerArrivals&DeparturesandbyPort–1981to2017 92
Table32 ConferencesHeld&RevenueEarnedatBandaranaikeMemorialInternationalConferenceHall(BMICH)–1987to2017 94
Table33 ForeignVisitorstoMuseums&RevenuefromSaleofTickets–1987to2017 95
Table33(a) DetailsofMuseums–2017 96
Table34 ForeignVisitorstoCulturalTriangle&RevenuefromSaleofTickets–1987to2017 96
Table34(a) ForeignandDomesticVisitorstoCulturalTriangle&RevenuefromSaleofTickets–2017 97
Table34(b) DetailsofForeignVisitorsbyLocation–2017 98
Table34(c) DetailsofDomesticVisitorsbyLocation–2017 98
Table35 ForeignVisitorstoZoologicalGardens&RevenuefromGateFees–1987to2017 99
Table35(a) RevenuebyLocation–2016&2017 100
Table35(b) TicketRates–2017 100
Table36 RevenuefromForeignVisitorstoBotanicalGardens–1987to2017 101
Table36(a) DetailsbyLocation-2017 102
Table37 RevenuefromForeignVisitorstoWildlifeParks(inRs.’000)–1988to2017 103
Table37(a) DetailsbyLocation–2017 104
Table38 RevenuefromVisitorstoConservationForests(inRs.’000)–2017 105
Table39 RevenuefromEmbarkationTax(inRs.’000)–1986to2017 106
Table40 PublicSectorRevenuefromTourism(inRs.Mn)–2012to2017 106
Sri Lanka Tourism Development Authority »»» Statistical Report 201706
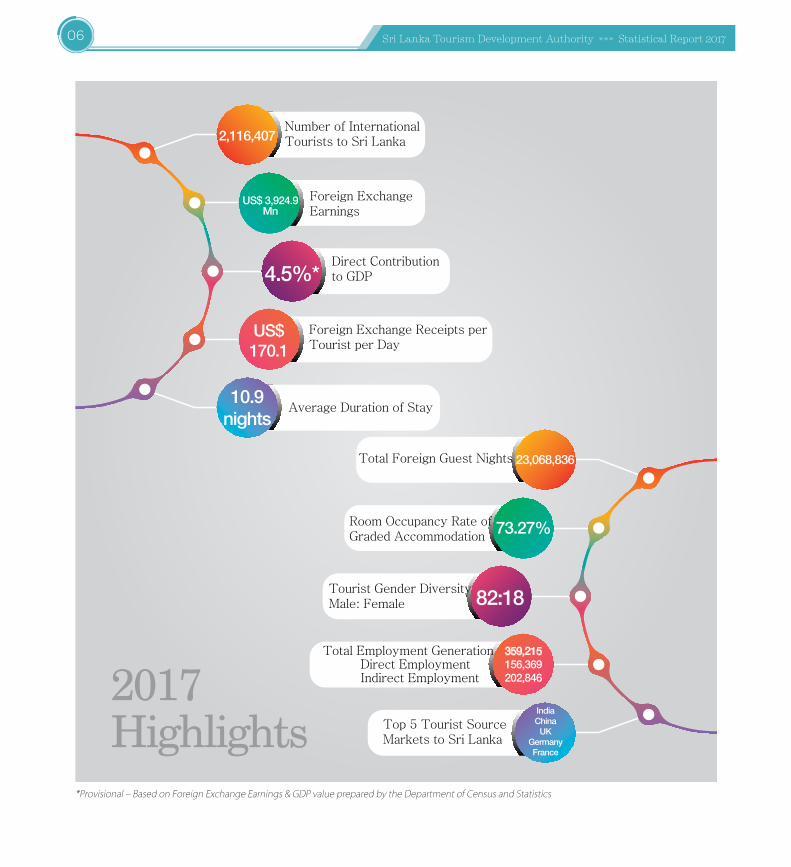
*Provisional–BasedonForeignExchangeEarnings&GDPvaluepreparedbytheDepartmentofCensusandStatistics
Number of InternationalTourists to Sri Lanka
Foreign ExchangeEarnings
Direct Contributionto GDP
Foreign Exchange Receipts perTourist per Day
Average Duration of Stay
Total Foreign Guest Nights
Room Occupancy Rate ofGraded Accommodation
Tourist Gender Diversity Male: Female
Total Employment Generation Direct Employment Indirect Employment
Top 5 Tourist SourceMarkets to Sri Lanka
IndiaChina
UKGermanyFrance
2,116,407
4.5%*
US$170.1
10.9nights
23,068,836
73.27%
82:18
359,215156,369202,846
US$ 3,924.9Mn
2017Highlights

07Sri Lanka Tourism Development Authority »»» Statistical Report 2017
08 Sri Lanka Tourism Development Authority »»» Statistical Report 2017
This is the49th intheseriesof ‘AnnualStatisticalReports’published by the Sri Lanka Tourism DevelopmentAuthority(SLTDA).ThereportsweredesignedtoprovidedataonSriLanka’s tourist industryonaconsistentbasis,which is useful for evidence-based decisionmaking forthedevelopmentandpromotionofthetourismindustry.The data compiled and published in this report seriescoverthefollowingareas:
i. Trends and characteristics of inbound tourism to SriLanka
ii. Scheduledairlineoperatorsandpassengermovements
iii. Accommodationindustry–Capacityanditsutilization
iv. Incomeandemployment
v. Outboundtourism–SriLankanstravellingtooverseasdestinations
vi. Growthoftravelandtourism
vii. Revenuefromtourism
TheAnnualStatisticalReport2017 ispresented in sevenparts. Part I is an introduction including definitions,sources of information, global tourism trends andtourism demand. Part II provides a detailed accountof the structure of tourist traffic received during 2017showingtheprincipalmarkets,seasonalityoftraffic,travelmotivation, duration of stay, age and sex, occupation,passengermovement and scheduled airline operations.PartIIIpresentssectoralinformationincludingastatisticalanalysisofaccommodationshowingthecapacityonofferanditsdistributionandPartIVprovidesvolumeoftourismemployment while public sector revenue and foreigntravelbySriLankansarepresentedinpartVandVI.PartIVisthestatisticalappendix.
1.1Definition
Tourist:
A visitor is a traveller taking a trip to amaindestinationoutside his/her usual environment, for less than a year,foranymainpurpose(business, leisureorotherpersonal
purpose) other than travelling to be a full-time studentortobeemployedbyaresidententity inthecountryorplacevisited.Avisitor(domestic,inboundoroutbound)isclassifiedasatourist, ifhis/hertripincludesanovernightstay. [United Nations World Tourism Organization(UNWTO)definition]
International Visitor:
Aninternationaltravellerqualifiesasaninternationalvisitorwithrespecttothecountryofreferenceif:(a)he/sheisona tourismtripand (b)he/she isanon-resident travellinginthecountryofreferenceoraresidenttravellingoutsideof it. The term ‘International Excursionist’ (same dayvisitor)referstoanInternationalVisitor,whodoesnotstayovernightinthecountryvisited.[UNWTOdefinition]
To clarify further, the following are excluded from thedefinitionof‘InternationalVisitor’:
❖ Allpersonsarrivingwithaspecificpurposeofengagingthemselvesingainfuloccupation,full-timestudyingortoestablishresidenceinSriLankairrespectiveoftheirlengthofstay.
❖ Diplomaticpersonnel.
❖ Crews of ships and aircraft even if they stay for onenightormore.
❖ Dependents of temporary immigrants and childrenbelowthreeyears.
Inthisreporttheterms‘Visitor”,‘Tourist’and‘Excursionist’are used for ‘International Visitor’, ‘International Tourist’and ‘International Excursionist’ respectively. InSri Lanka’stourismstatistics,excursionistsconsistalmostexclusivelyof passengers on sea cruises who come on shore forpurposesof sightseeing, shopping,etc.while the ship isinharbour.
Tourist Arrivals:
Everysinglevisit(orentry)ofatouristtothecountryeitherinthecourseofthesametriporinthecourseofdifferent
09Sri Lanka Tourism Development Authority »»» Statistical Report 2017
trips iscountedasa ‘touristarrival’,providedthevisit (orentry) lasts at least one night in the country (N.B. thosewhodonotcrossbordersarenotregardedasvisitors).
Tourist Night:
A night spent in Sri Lanka by a tourist in any type ofimmobileaccommodation.
Guest Night:
Anightspentinatouristhotel,resthouseorguesthouseapprovedbytheSLTDAasbeingsuitableforoccupationbyforeignvisitors.
Tourist Hotels:
All tourist hotels that are registered under the SLTDA.Therearethreemaincategoriesoftouristhotel:Classified,unclassifiedandboutiquehotels.Statisticsforsomeothercategories(i.e.smallluxuryhotels)areaddedtothereportfromtheyear2014.Supplementary Accommodation:
GuesthouseswhichareapprovedbytheSLTDAasbeingsuitable for occupation by foreign visitors. Home stayunits consist of tourist bungalows, rented tourist home,rented tourist apartments, heritage hotels and heritagebungalows.
Tourism Expenditure:
Tourism expenditure refers to the amount paid for theacquisition of consumption goods and services, as wellasvaluables, forownuseortogiveaway,forandduringtourismtrips.[UNWTOdefinition]
Forms of Tourism:
Therearethreebasicformsoftourism–domestictourism,inboundtourismandoutboundtourism.
1.2SourcesofInformationa) Tourist Statistics:
Tourist arrival reports generatedby the Electronic TravelAuthorizationSystem(ETA)compiledbytheDepartmentofImmigrationandEmigration.
b) Excursionist Statistics:
PassengerarrivalreportscompiledbytheDepartmentofImmigrationandEmigration.
c) Accommodation Statistics:
Monthly reports obtained by the Sri Lanka TourismDevelopment Authority from the SLTDA-registeredaccommodationestablishments.
d) Passenger Statistics:
Passengerarrivalanddeparture reportscompiledbytheDepartmentofImmigrationandEmigration.
e) Air Traffic Statistics:
Quarterly returns obtained by the Sri Lanka TourismDevelopment Authority from the scheduled airlines,whichoperateflightstoSriLanka.
f) Statistics on Official Tourist Receipts:
Information calculated from the Airport Survey ofDepartingForeignTouristsfromSriLanka2017.
g) Employment Statistics:
Annual surveys conducted by the Sri Lanka TourismDevelopment Authority among all registeredaccommodation providers and travel agents as well asinformationfromthelicensingsystem.
10 Sri Lanka Tourism Development Authority »»» Statistical Report 2017
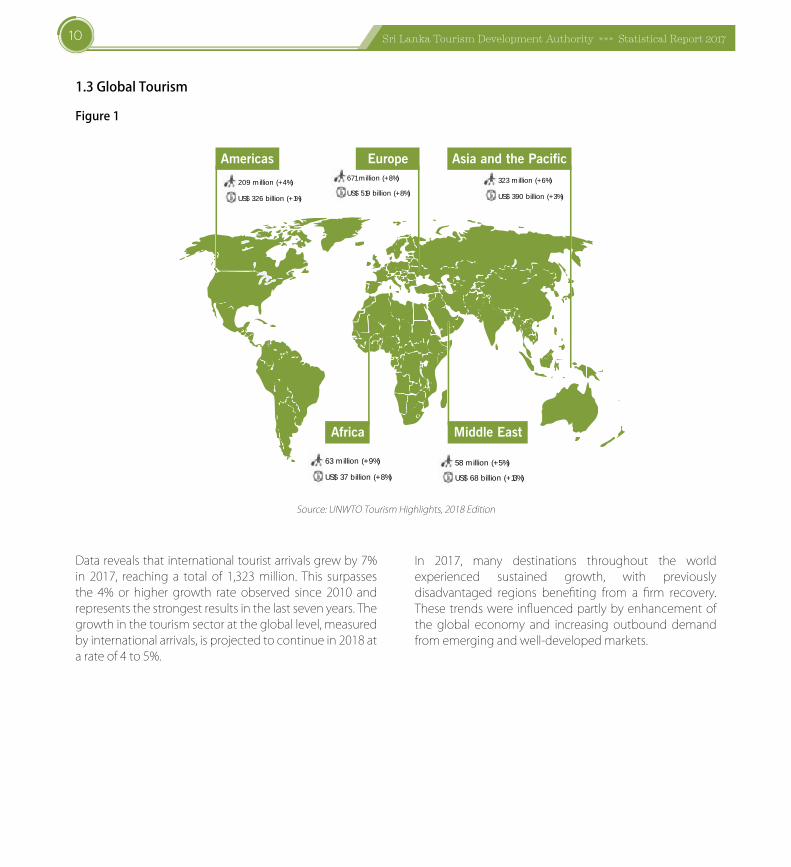
1.3GlobalTourism
Figure1
Europe
Africa Middle East
Asia and the Pacific
63 million (+9%)
US$ 37 billion (+8%)
Americas
209 million (+4%)
US$ 326 billion (+1%)
58 million (+5%)
US$ 68 billion (+13%)
323 million (+6%)
US$ 390 billion (+3%)
671 million (+8%)
US$ 519 billion (+8%)
Source:UNWTOTourismHighlights,2018Edition
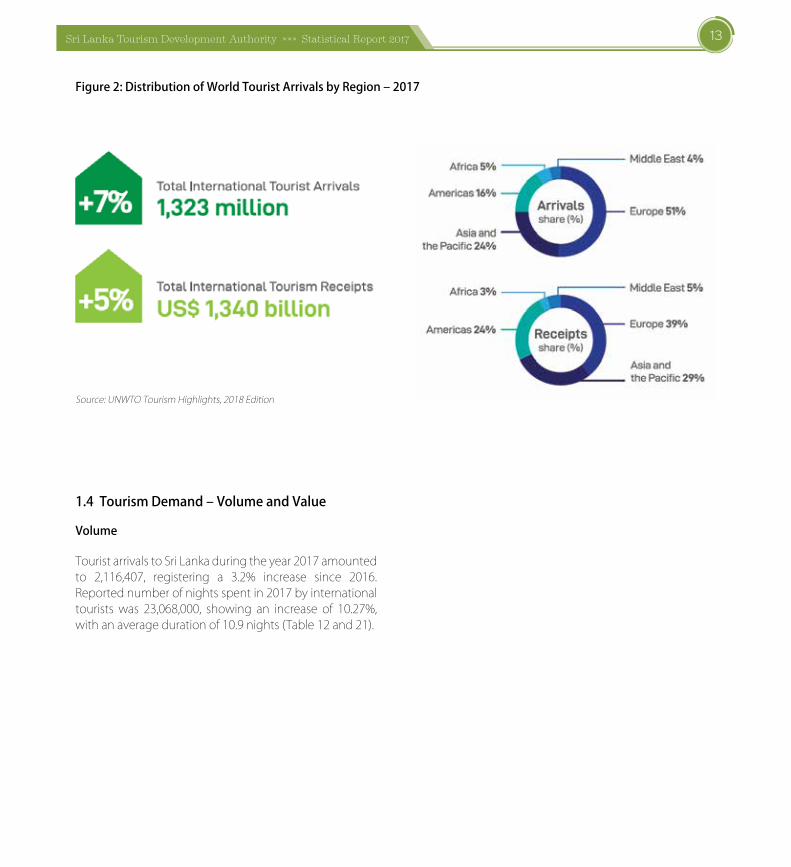
Datarevealsthatinternationaltouristarrivalsgrewby7%in 2017, reaching a total of 1,323million. This surpassesthe 4% or higher growth rate observed since 2010 andrepresentsthestrongestresultsinthelastsevenyears.Thegrowthinthetourismsectoratthegloballevel,measuredbyinternationalarrivals,isprojectedtocontinuein2018atarateof4to5%.
In 2017, many destinations throughout the worldexperienced sustained growth, with previouslydisadvantaged regions benefiting from a firm recovery.Thesetrendswere influencedpartlybyenhancementofthe global economy and increasing outbound demandfromemergingandwell-developedmarkets.
11Sri Lanka Tourism Development Authority »»» Statistical Report 2017
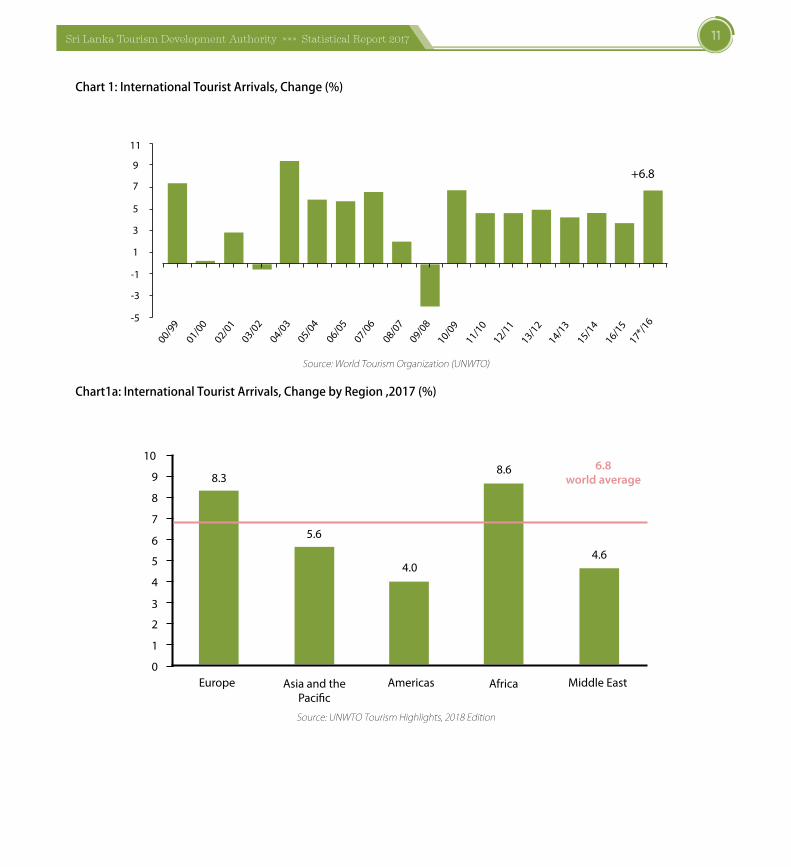
Chart1:InternationalTouristArrivals,Change(%)
11
9
7
5
3
1
-1
-3
-5
00/99
01/00
02/01
03/02
04/03
05/04
06/05
07/06
08/07
09/08
10/09
11/10
12/11
13/12
14/13
15/14
16/15
17*/16
+6.8
Source:WorldTourismOrganization(UNWTO)
Chart1a:InternationalTouristArrivals,ChangebyRegion,2017(%)
10
8.3
5.6
4.0
8.6
4.6
6.8world average9
8
7
6
5
4
3
2
1
0Europe Asia and the
Paci�cAmericas Africa Middle East
Source:UNWTOTourismHighlights,2018Edition
12 Sri Lanka Tourism Development Authority »»» Statistical Report 2017
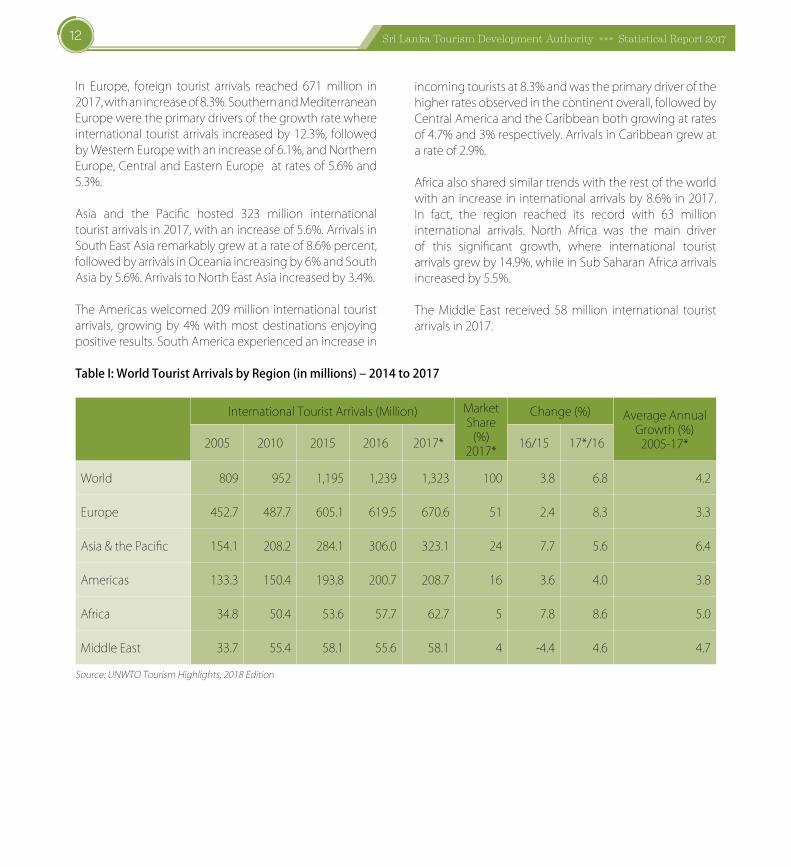
TableI:WorldTouristArrivalsbyRegion(inmillions)–2014to2017
InternationalTouristArrivals(Million) MarketShare(%)2017*
Change(%) AverageAnnualGrowth(%)2005-17*2005 2010 2015 2016 2017* 16/15 17*/16
World 809 952 1,195 1,239 1,323 100 3.8 6.8 4.2
Europe 452.7 487.7 605.1 619.5 670.6 51 2.4 8.3 3.3
Asia&thePacific 154.1 208.2 284.1 306.0 323.1 24 7.7 5.6 6.4
Americas 133.3 150.4 193.8 200.7 208.7 16 3.6 4.0 3.8
Africa 34.8 50.4 53.6 57.7 62.7 5 7.8 8.6 5.0
MiddleEast 33.7 55.4 58.1 55.6 58.1 4 -4.4 4.6 4.7
Source:UNWTOTourismHighlights,2018Edition
In Europe, foreign tourist arrivals reached 671million in2017,withanincreaseof8.3%.SouthernandMediterraneanEuropeweretheprimarydriversofthegrowthratewhereinternational touristarrivals increasedby12.3%, followedbyWesternEuropewithanincreaseof6.1%,andNorthernEurope,CentralandEasternEuropeatratesof5.6%and5.3%.
Asia and the Pacific hosted 323 million internationaltouristarrivalsin2017,withanincreaseof5.6%.ArrivalsinSouthEastAsiaremarkablygrewatarateof8.6%percent,followedbyarrivalsinOceaniaincreasingby6%andSouthAsiaby5.6%.ArrivalstoNorthEastAsiaincreasedby3.4%.
TheAmericaswelcomed209million internationaltouristarrivals, growingby4%withmostdestinations enjoyingpositiveresults.SouthAmericaexperiencedanincreasein
incomingtouristsat8.3%andwastheprimarydriverofthehigherratesobservedinthecontinentoverall,followedbyCentralAmericaandtheCaribbeanbothgrowingatratesof4.7%and3%respectively.ArrivalsinCaribbeangrewatarateof2.9%.
Africaalsosharedsimilartrendswiththerestoftheworldwithan increase in internationalarrivalsby8.6% in2017.In fact, the region reached its record with 63 millioninternational arrivals. North Africa was the main driverof this significant growth, where international touristarrivalsgrewby14.9%,whileinSubSaharanAfricaarrivalsincreasedby5.5%.
TheMiddle East received 58million international touristarrivalsin2017.
13Sri Lanka Tourism Development Authority »»» Statistical Report 2017
Figure2:DistributionofWorldTouristArrivalsbyRegion–2017
Source:UNWTOTourismHighlights,2018Edition
1.4TourismDemand–VolumeandValue
Volume
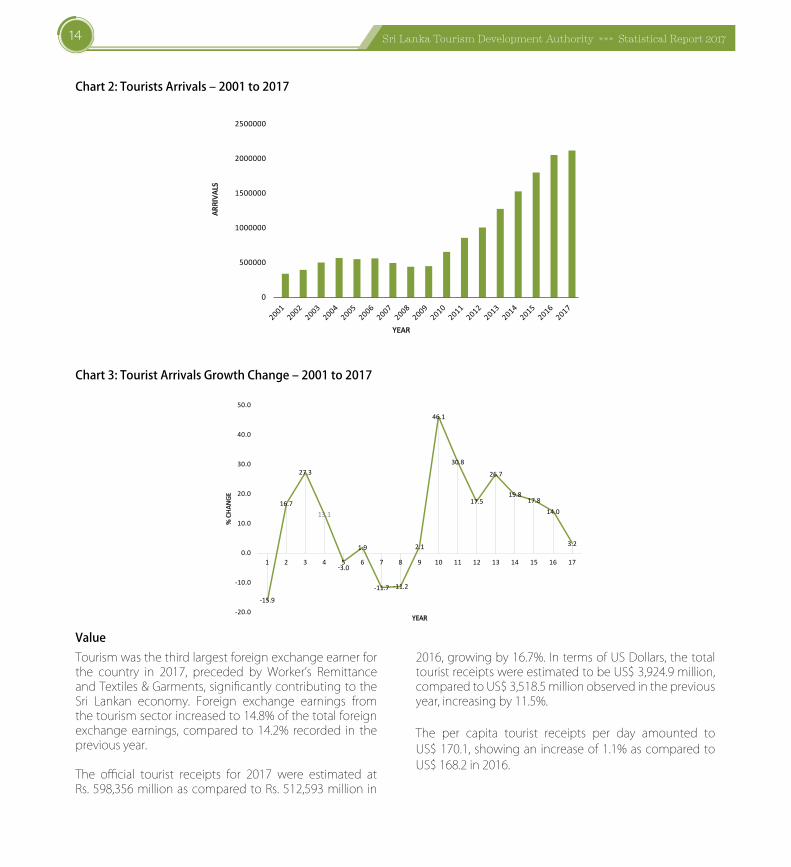
TouristarrivalstoSriLankaduringtheyear2017amountedto 2,116,407, registering a 3.2% increase since 2016.Reportednumberofnightsspentin2017byinternationaltourists was 23,068,000, showing an increase of 10.27%,withanaveragedurationof10.9nights(Table12and21).
14 Sri Lanka Tourism Development Authority »»» Statistical Report 2017
Chart2:TouristsArrivals–2001to2017
0
500000
1000000
1500000
2000000
2500000
ARRI
VALS
YEAR
Chart3:TouristArrivalsGrowthChange–2001to2017
-15.9
16.7
27.3
13.1
-3.0
1.9
-11.7 -11.2
2.1
46.1
30.8
17.5
26.7
19.817.8
14.0
3.2
-20.0
-10.0
0.0
10.0
20.0
30.0
40.0
50.0
1 2 3 4 5 6 7 8 9 10 11 12 13 14 15 16 17
% C
HANG
E
YEAR
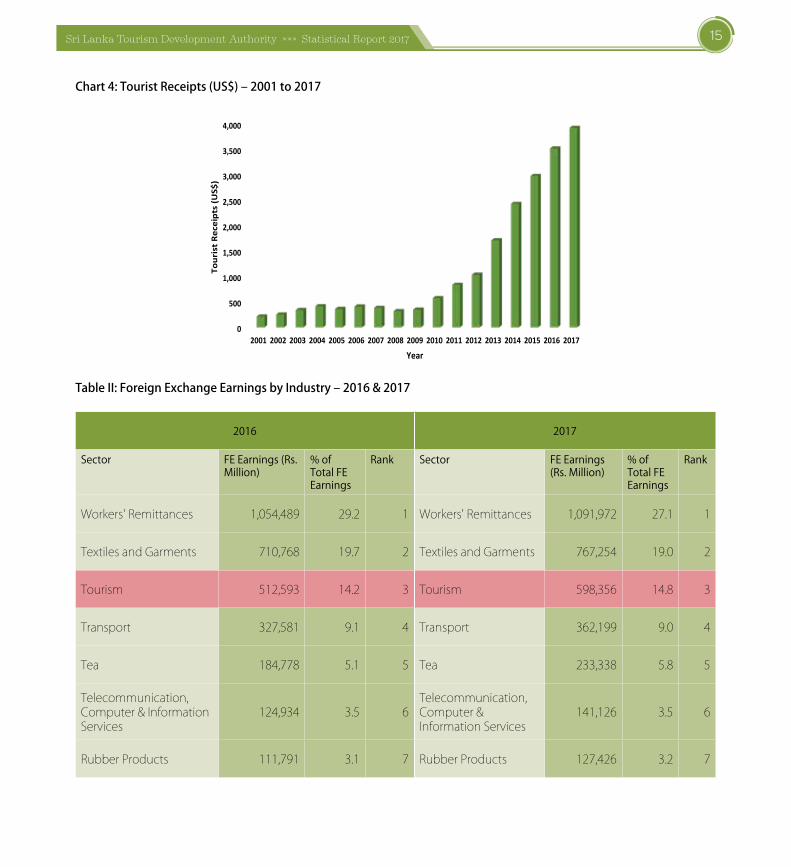
ValueTourismwasthethirdlargestforeignexchangeearnerforthe country in 2017, preceded by Worker’s RemittanceandTextiles&Garments,significantlycontributingtotheSri Lankan economy. Foreign exchange earnings fromthetourismsectorincreasedto14.8%ofthetotalforeignexchange earnings, compared to 14.2% recorded in thepreviousyear.
The official tourist receipts for 2017 were estimated atRs.598,356millionascomparedtoRs.512,593million in
2016,growingby16.7%. IntermsofUSDollars,thetotaltouristreceiptswereestimatedtobeUS$3,924.9million,comparedtoUS$3,518.5millionobservedinthepreviousyear,increasingby11.5%.
The per capita tourist receipts per day amounted toUS$170.1,showingan increaseof1.1%ascomparedtoUS$168.2in2016.
15Sri Lanka Tourism Development Authority »»» Statistical Report 2017
Chart4:TouristReceipts(US$)–2001to2017
0
500
1,000
1,500
2,000
2,500
3,000
3,500
4,000
2001 2002 2003 2004 2005 2006 2007 2008 2009 2010 2011 2012 2013 2014 2015 2016 2017
Tour
ist R
ecei
pts
(US$
)
Year
TableII:ForeignExchangeEarningsbyIndustry–2016&2017
2016 2017
Sector FE Earnings (Rs. Million)
% of Total FE Earnings
Rank Sector FE Earnings (Rs. Million)
% of Total FE Earnings
Rank
Workers'Remittances 1,054,489 29.2 1 Workers'Remittances 1,091,972 27.1 1
TextilesandGarments 710,768 19.7 2 TextilesandGarments 767,254 19.0 2
Tourism 512,593 14.2 3 Tourism 598,356 14.8 3
Transport 327,581 9.1 4 Transport 362,199 9.0 4
Tea 184,778 5.1 5 Tea 233,338 5.8 5
Telecommunication,Computer&InformationServices
124,934 3.5 6Telecommunication,Computer&InformationServices
141,126 3.5 6
RubberProducts 111,791 3.1 7 RubberProducts 127,426 3.2 7
16 Sri Lanka Tourism Development Authority »»» Statistical Report 2017
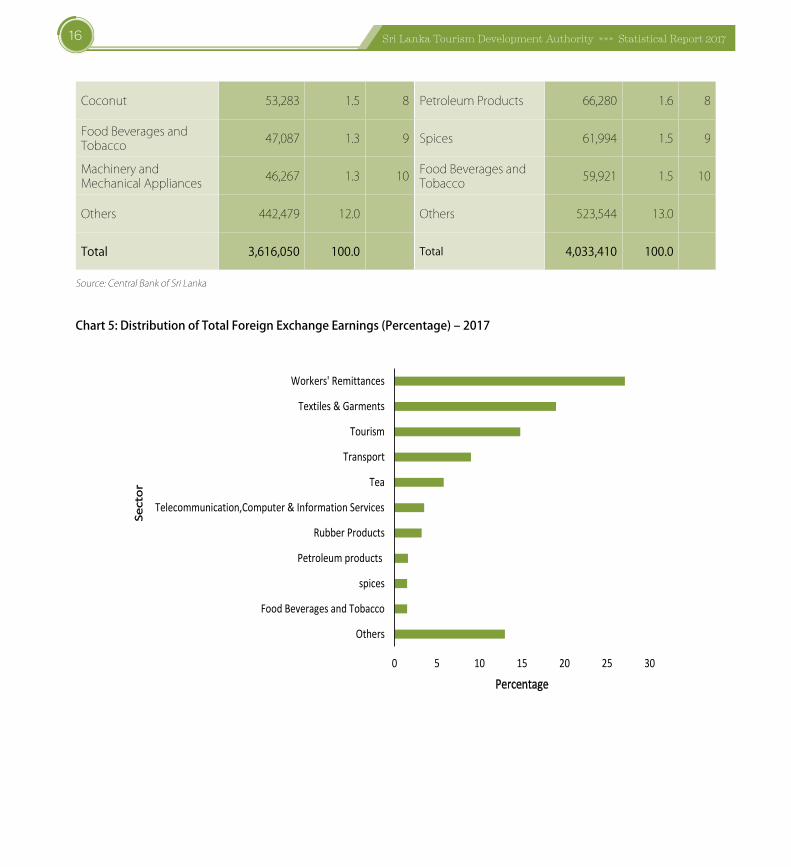
Coconut 53,283 1.5 8 PetroleumProducts 66,280 1.6 8
FoodBeveragesandTobacco 47,087 1.3 9 Spices 61,994 1.5 9
MachineryandMechanicalAppliances 46,267 1.3 10 FoodBeveragesandTobacco 59,921 1.5 10
Others 442,479 12.0 Others 523,544 13.0
Total 3,616,050 100.0 Total 4,033,410 100.0
Source:CentralBankofSriLanka
Chart5:DistributionofTotalForeignExchangeEarnings(Percentage)–2017
0 5 10 15 20 25 30
Others
Food Beverages and Tobacco
spices
Petroleum products
Rubber Products
Telecommunication,Computer & Information Services
Tea
Transport
Tourism
Textiles & Garments
Workers' Remittances
Percentage
Sect
or
17Sri Lanka Tourism Development Authority »»» Statistical Report 2017
Sri Lanka Tourism Development Authority »»» Statistical Report 201718
2.1Markets
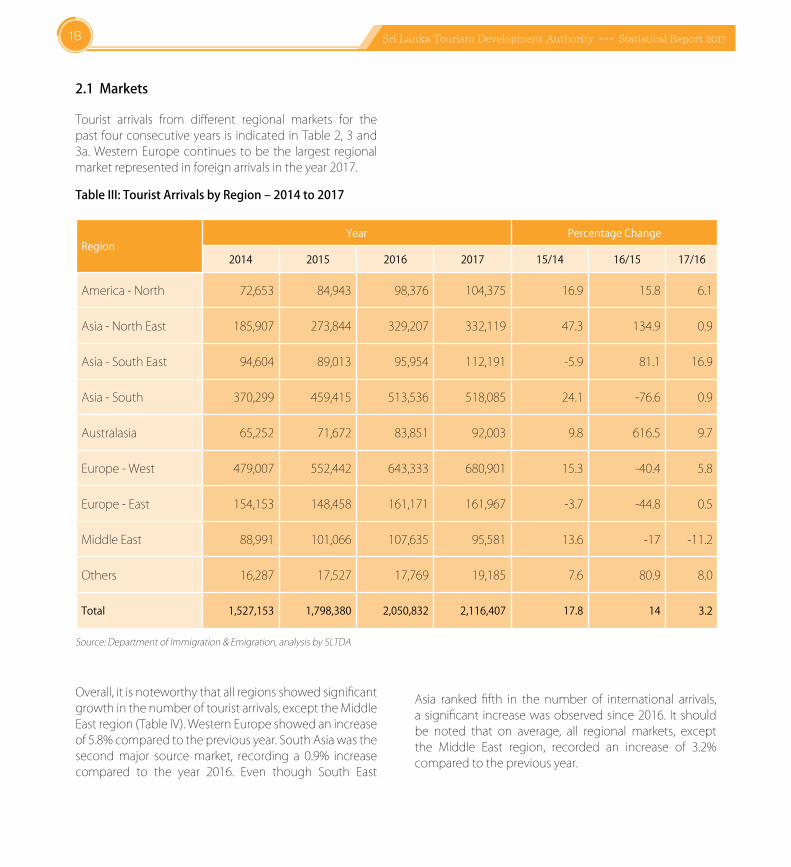
Tourist arrivals from different regional markets for thepast fourconsecutiveyears is indicatedinTable2,3and3a.WesternEuropecontinues tobe the largest regionalmarketrepresentedinforeignarrivalsintheyear2017.
TableIII:TouristArrivalsbyRegion–2014to2017
RegionYear Percentage Change
2014 2015 2016 2017 15/14 16/15 17/16
America-North 72,653 84,943 98,376 104,375 16.9 15.8 6.1
Asia-NorthEast 185,907 273,844 329,207 332,119 47.3 134.9 0.9
Asia-SouthEast 94,604 89,013 95,954 112,191 -5.9 81.1 16.9
Asia-South 370,299 459,415 513,536 518,085 24.1 -76.6 0.9
Australasia 65,252 71,672 83,851 92,003 9.8 616.5 9.7
Europe-West 479,007 552,442 643,333 680,901 15.3 -40.4 5.8
Europe-East 154,153 148,458 161,171 161,967 -3.7 -44.8 0.5
MiddleEast 88,991 101,066 107,635 95,581 13.6 -17 -11.2
Others 16,287 17,527 17,769 19,185 7.6 80.9 8.0
Total 1,527,153 1,798,380 2,050,832 2,116,407 17.8 14 3.2
Source:DepartmentofImmigration&Emigration,analysisbySLTDA
Overall,itisnoteworthythatallregionsshowedsignificantgrowthinthenumberoftouristarrivals,excepttheMiddleEastregion(TableIV).WesternEuropeshowedanincreaseof5.8%comparedtothepreviousyear.SouthAsiawasthesecondmajor sourcemarket, recording a 0.9% increasecompared to the year 2016. Even though South East
Asia ranked fifth in the number of international arrivals,asignificant increasewasobservedsince2016. It shouldbe noted that on average, all regional markets, exceptthe Middle East region, recorded an increase of 3.2%comparedtothepreviousyear.
Sri Lanka Tourism Development Authority »»» Statistical Report 2017 19
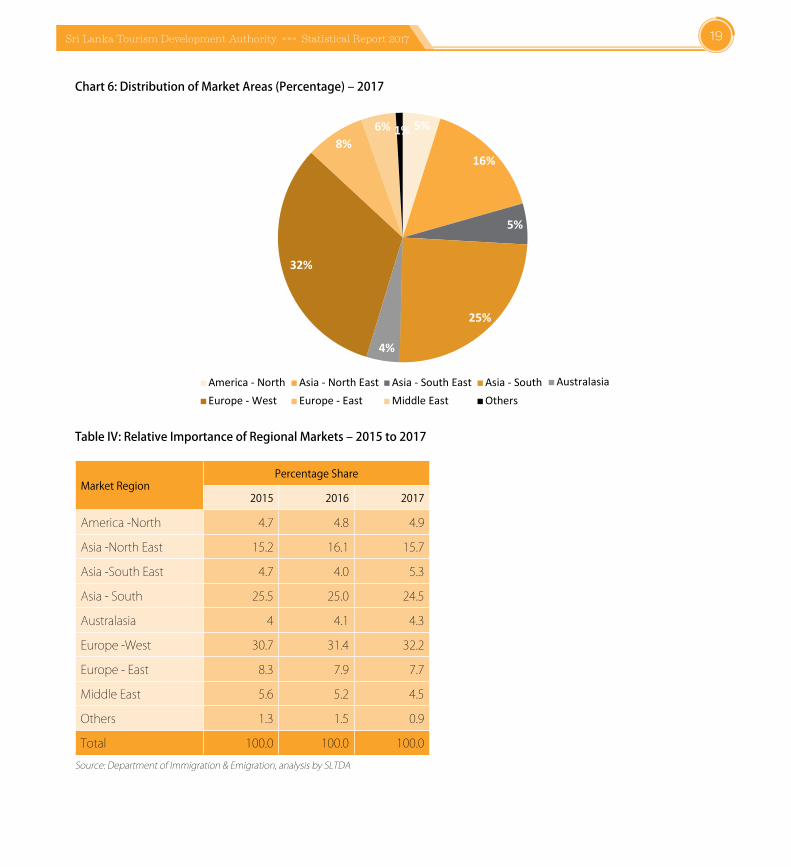
Chart6:DistributionofMarketAreas(Percentage)–2017
5%
16%
5%
25%
4%
32%
8%6% 1%
America - North Asia - North East Asia - South East Asia - South AustralasiaEurope - West Europe - East Middle East Others
TableIV:RelativeImportanceofRegionalMarkets–2015to2017
Market RegionPercentage Share
2015 2016 2017
America-North 4.7 4.8 4.9
Asia-NorthEast 15.2 16.1 15.7
Asia-SouthEast 4.7 4.0 5.3
Asia-South 25.5 25.0 24.5
Australasia 4 4.1 4.3
Europe-West 30.7 31.4 32.2
Europe-East 8.3 7.9 7.7
MiddleEast 5.6 5.2 4.5
Others 1.3 1.5 0.9
Total 100.0 100.0 100.0Source:DepartmentofImmigration&Emigration,analysisbySLTDA
Sri Lanka Tourism Development Authority »»» Statistical Report 201720
Even though EuropeWest held themajormarket sharein2017,therewasonlyaslightincreaseto32.2%in2017from 31.4% in 2016. It is noteworthy that the marketshare of North America, South East Asia and Australasiahadincreasedfrom4.8%to4.9%,4%to5.3%and4.1%to4.3%respectively.However,thesharesofNorthEastAsia,SouthAsia, Eastern Europe,Middle East andOthers haddecreased.
Ananalysisofaverageannualgrowthratesoftheregionsby country of residence from 2007 to 2017 (Table 1)revealedthatWesternEuropewasthemarketregionwiththehighestannualgrowthrateof44.2%,while36.3%wasrecordedastheaverageannualgrowthrateforallmarkets.
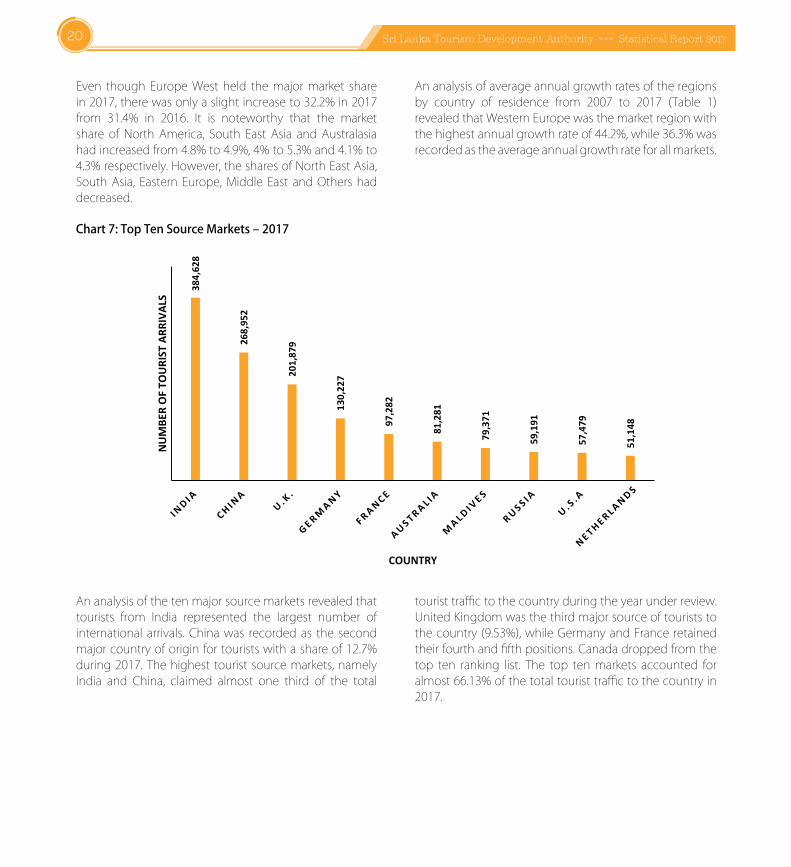
Chart7:TopTenSourceMarkets–2017
384,
628
268,
952
201,
879
130,
227
97,2
82
81,2
81
79,3
71
59,1
91
57,4
79
51,1
48
NUM
BER
OF T
OURI
ST A
RRIV
ALS
COUNTRY
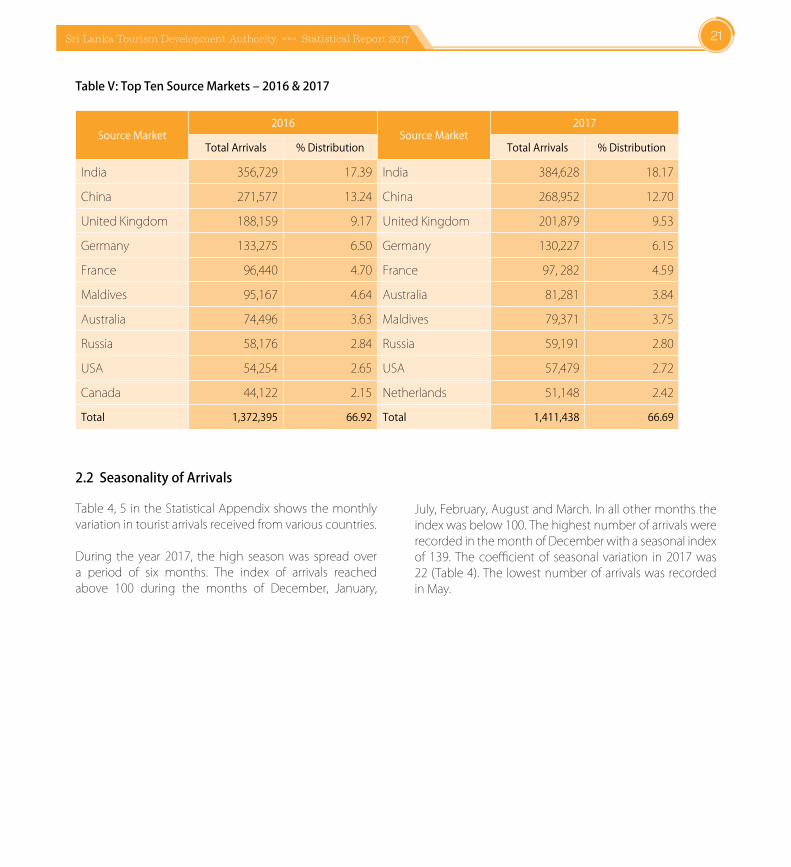
Ananalysisofthetenmajorsourcemarketsrevealedthattourists from India represented the largest number ofinternational arrivals. Chinawas recorded as the secondmajorcountryoforiginfortouristswithashareof12.7%during2017.Thehighest tourist sourcemarkets,namelyIndia and China, claimed almost one third of the total
touristtraffictothecountryduringtheyearunderreview.UnitedKingdomwasthethirdmajorsourceoftouriststothecountry (9.53%),whileGermanyandFrance retainedtheirfourthandfifthpositions.Canadadroppedfromthetop ten ranking list. The top tenmarkets accounted foralmost66.13%ofthetotaltouristtraffictothecountryin2017.
Sri Lanka Tourism Development Authority »»» Statistical Report 2017 21
TableV:TopTenSourceMarkets–2016&2017
Source Market 2016
Source Market2017
Total Arrivals % Distribution Total Arrivals % Distribution
India 356,729 17.39 India 384,628 18.17
China 271,577 13.24 China 268,952 12.70
UnitedKingdom 188,159 9.17 UnitedKingdom 201,879 9.53
Germany 133,275 6.50 Germany 130,227 6.15
France 96,440 4.70 France 97,282 4.59
Maldives 95,167 4.64 Australia 81,281 3.84
Australia 74,496 3.63 Maldives 79,371 3.75
Russia 58,176 2.84 Russia 59,191 2.80
USA 54,254 2.65 USA 57,479 2.72
Canada 44,122 2.15 Netherlands 51,148 2.42
Total 1,372,395 66.92 Total 1,411,438 66.69
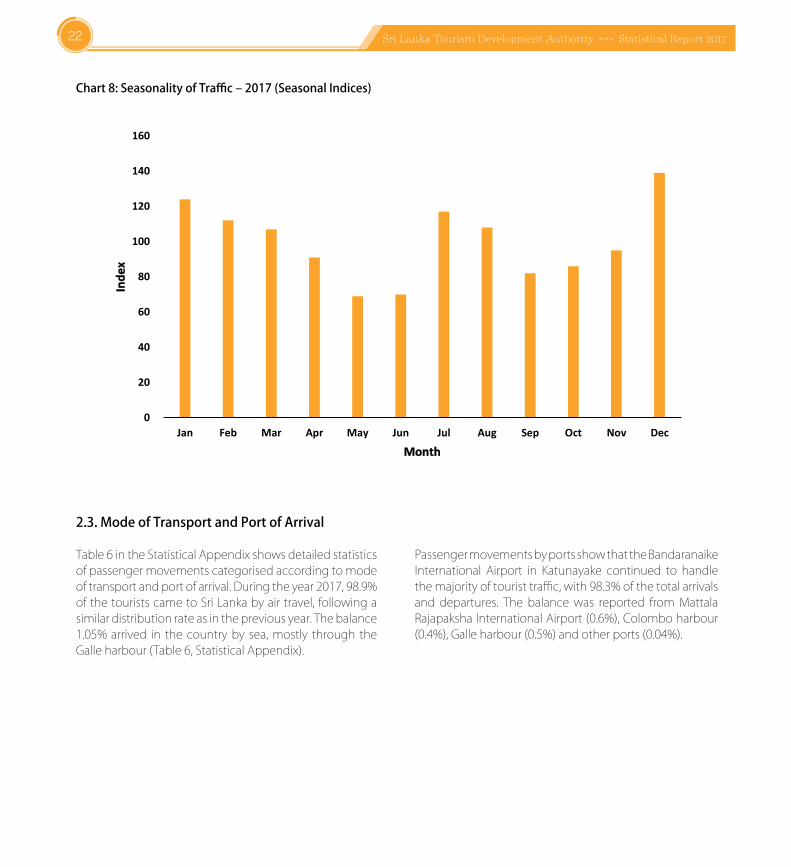
2.2SeasonalityofArrivals
Table4,5 intheStatisticalAppendixshowsthemonthlyvariationintouristarrivalsreceivedfromvariouscountries.
During the year 2017, the high seasonwas spread overa period of six months. The index of arrivals reachedabove 100 during the months of December, January,
July,February,AugustandMarch.Inallothermonthstheindexwasbelow100.ThehighestnumberofarrivalswererecordedinthemonthofDecemberwithaseasonalindexof 139. The coefficientof seasonal variation in 2017was22(Table4).ThelowestnumberofarrivalswasrecordedinMay.
Sri Lanka Tourism Development Authority »»» Statistical Report 201722
Chart8:SeasonalityofTraffic–2017(SeasonalIndices)
0
20
40
60
80
100
120
140
160
Jan Feb Mar Apr May Jun Jul Aug Sep Oct Nov Dec
Inde
x
Month
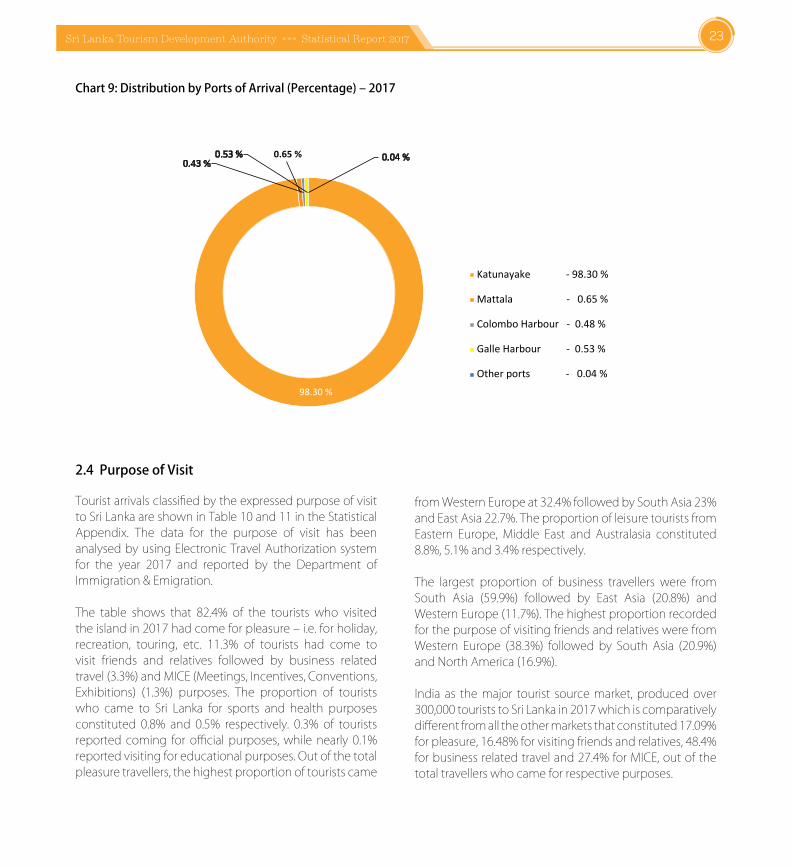
2.3.ModeofTransportandPortofArrival
Table6intheStatisticalAppendixshowsdetailedstatisticsofpassengermovementscategorisedaccordingtomodeoftransportandportofarrival.Duringtheyear2017,98.9%ofthetouristscametoSriLankabyairtravel,followingasimilardistributionrateasinthepreviousyear.Thebalance1.05%arrived in thecountryby sea,mostly through theGalleharbour(Table6,StatisticalAppendix).
PassengermovementsbyportsshowthattheBandaranaikeInternational Airport in Katunayake continued to handlethemajorityoftouristtraffic,with98.3%ofthetotalarrivalsand departures. The balancewas reported fromMattalaRajapakshaInternationalAirport(0.6%),Colomboharbour(0.4%),Galleharbour(0.5%)andotherports(0.04%).
Sri Lanka Tourism Development Authority »»» Statistical Report 2017 23
Chart9:DistributionbyPortsofArrival(Percentage)–2017
98.30 %
0.65 %0.43 %
0.53 % 0.04 %
Katunayake - 98.30 %
Mattala - 0.65 %
Colombo Harbour - 0.48 %
Galle Harbour - 0.53 %
Other ports - 0.04 %
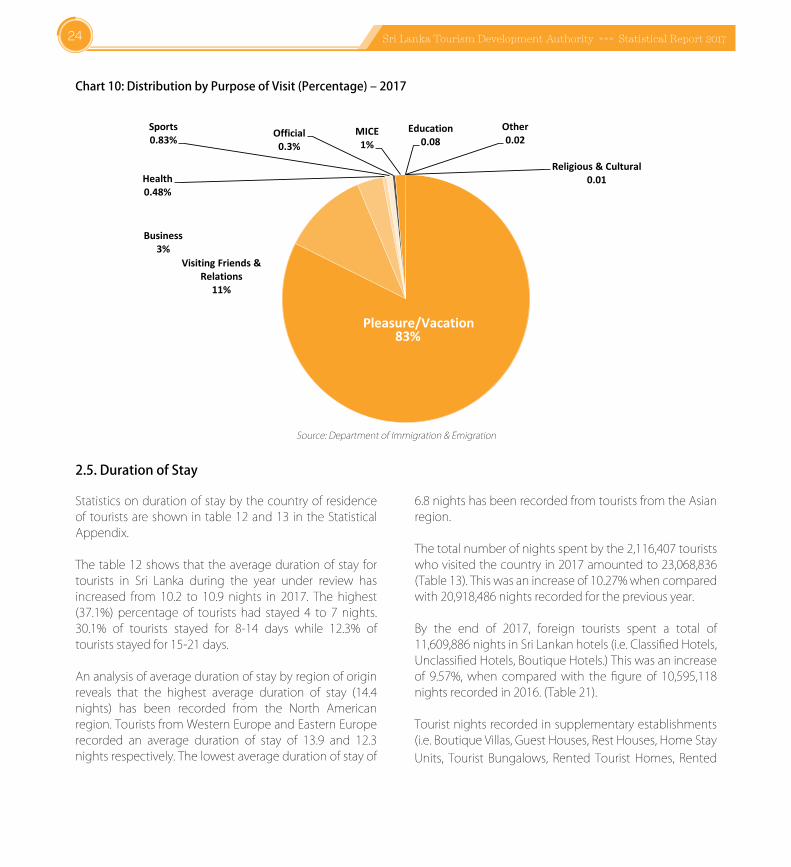
2.4PurposeofVisit
TouristarrivalsclassifiedbytheexpressedpurposeofvisittoSriLankaareshowninTable10and11intheStatisticalAppendix. The data for the purpose of visit has beenanalysedbyusingElectronicTravelAuthorizationsystemfor the year 2017 and reported by the Department ofImmigration&Emigration.
The table shows that 82.4% of the tourists who visitedtheislandin2017hadcomeforpleasure–i.e.forholiday,recreation, touring, etc. 11.3% of tourists had come tovisit friends and relatives followed by business relatedtravel(3.3%)andMICE(Meetings,Incentives,Conventions,Exhibitions) (1.3%) purposes. The proportion of touristswho came to Sri Lanka for sports and health purposesconstituted 0.8% and 0.5% respectively. 0.3% of touristsreported coming for official purposes,while nearly 0.1%reportedvisitingforeducationalpurposes.Outofthetotalpleasuretravellers,thehighestproportionoftouristscame
fromWesternEuropeat32.4%followedbySouthAsia23%andEastAsia22.7%.TheproportionofleisuretouristsfromEastern Europe, Middle East and Australasia constituted8.8%,5.1%and3.4%respectively.
The largest proportion of business travellers were fromSouth Asia (59.9%) followed by East Asia (20.8%) andWesternEurope(11.7%).ThehighestproportionrecordedforthepurposeofvisitingfriendsandrelativeswerefromWestern Europe (38.3%) followed by South Asia (20.9%)andNorthAmerica(16.9%).
India as themajor tourist sourcemarket, producedover300,000touriststoSriLankain2017whichiscomparativelydifferentfromalltheothermarketsthatconstituted17.09%forpleasure,16.48%forvisitingfriendsandrelatives,48.4%forbusinessrelatedtraveland27.4%forMICE,outofthetotaltravellerswhocameforrespectivepurposes.
Sri Lanka Tourism Development Authority »»» Statistical Report 201724
Chart10:DistributionbyPurposeofVisit(Percentage)–2017
Pleasure/Vacation83%
Visiting Friends & Relations
11%
Business3%
Health0.48%
Sports0.83% Official
0.3%MICE
1%Education
0.08
Religious & Cultural0.01
Other0.02
Source:DepartmentofImmigration&Emigration
2.5.DurationofStay
Statisticsondurationofstaybythecountryofresidenceoftouristsareshownintable12and13 intheStatisticalAppendix.
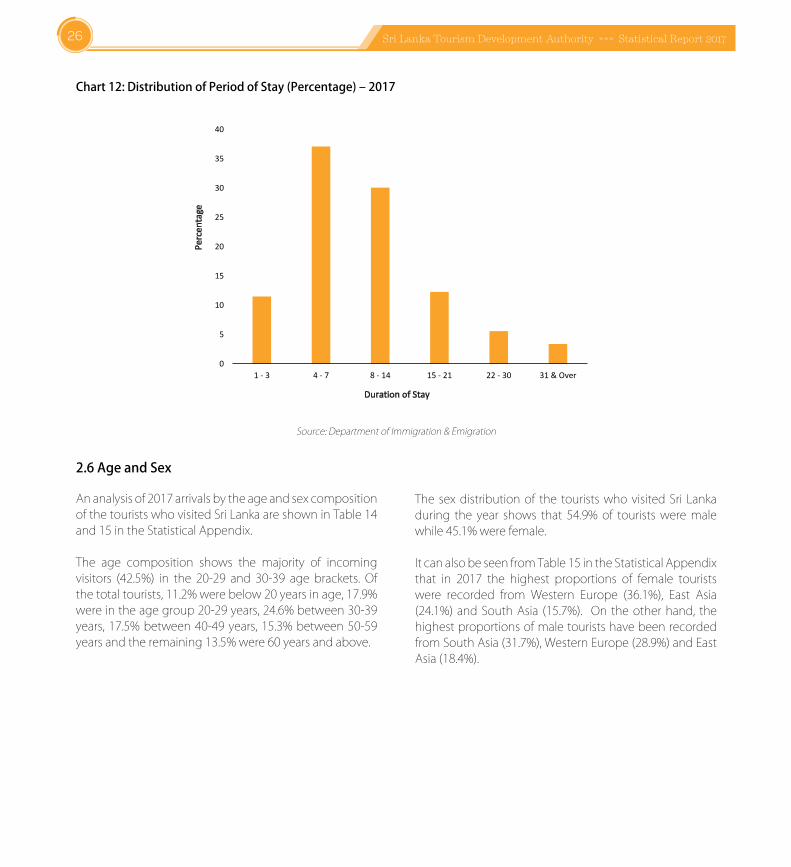
Thetable12showsthattheaveragedurationofstay fortourists in Sri Lanka during the year under review hasincreased from 10.2 to 10.9 nights in 2017. The highest(37.1%) percentage of tourists had stayed 4 to 7 nights.30.1% of tourists stayed for 8-14 days while 12.3% oftouristsstayedfor15-21days.
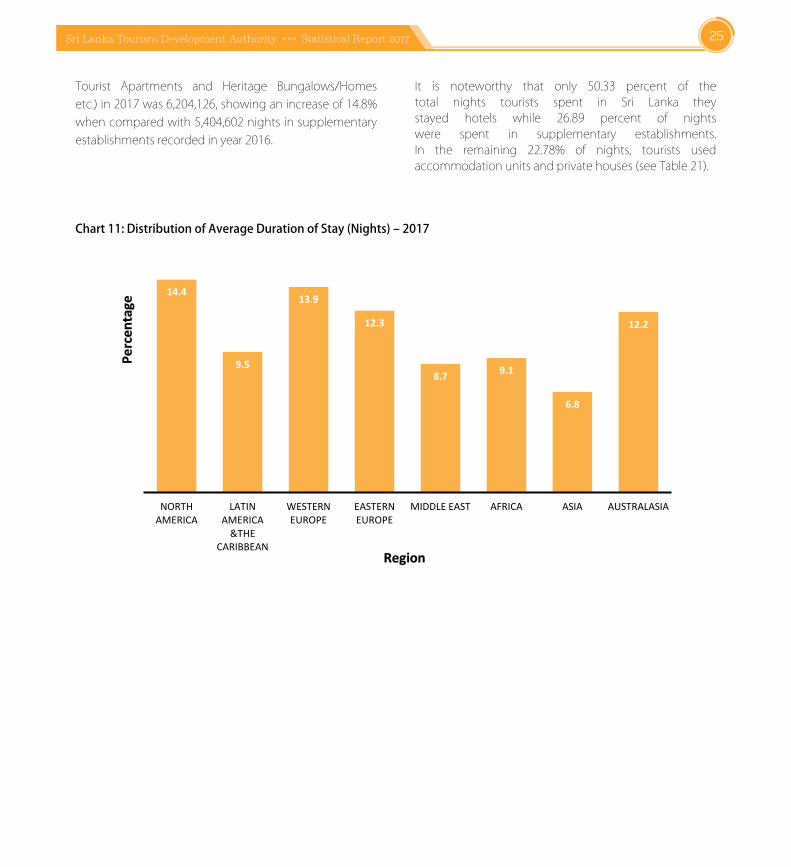
Ananalysisofaveragedurationofstaybyregionoforiginreveals that the highest average duration of stay (14.4nights) has been recorded from the North Americanregion.TouristsfromWesternEuropeandEasternEuroperecorded an average duration of stay of 13.9 and 12.3nightsrespectively.Thelowestaveragedurationofstayof
6.8nightshasbeenrecordedfromtouristsfromtheAsianregion.
Thetotalnumberofnightsspentbythe2,116,407touristswhovisitedthecountryin2017amountedto23,068,836(Table13).Thiswasanincreaseof10.27%whencomparedwith20,918,486nightsrecordedforthepreviousyear.
By the end of 2017, foreign tourists spent a total of11,609,886nightsinSriLankanhotels(i.e.ClassifiedHotels,UnclassifiedHotels,BoutiqueHotels.)Thiswasanincreaseof 9.57%,when comparedwith the figure of 10,595,118nightsrecordedin2016.(Table21).
Touristnightsrecordedinsupplementaryestablishments(i.e.BoutiqueVillas,GuestHouses,RestHouses,HomeStayUnits, Tourist Bungalows, Rented Tourist Homes, Rented
Sri Lanka Tourism Development Authority »»» Statistical Report 2017 25
Tourist Apartments and Heritage Bungalows/Homesetc.)in2017was6,204,126,showinganincreaseof14.8%whencomparedwith5,404,602nightsinsupplementaryestablishmentsrecordedinyear2016.
It is noteworthy that only 50.33 percent of thetotal nights tourists spent in Sri Lanka theystayed hotels while 26.89 percent of nightswere spent in supplementary establishments.In the remaining 22.78% of nights, tourists usedaccommodationunitsandprivatehouses(seeTable21).
Chart11:DistributionofAverageDurationofStay(Nights)–2017
14.4
9.5
13.9
12.3
8.7 9.1
6.8
12.2
NORTH AMERICA
LATIN AMERICA
&THE CARIBBEAN
WESTERN EUROPE
EASTERN EUROPE
MIDDLE EAST AFRICA ASIA AUSTRALASIA
Percen
tage
Region
Sri Lanka Tourism Development Authority »»» Statistical Report 201726
Chart12:DistributionofPeriodofStay(Percentage)–2017
0
5
10
15
20
25
30
35
40
1 - 3 4 - 7 8 - 14 15 - 21 22 - 30 31 & Over
Perc
enta
ge
Duration of Stay
Source:DepartmentofImmigration&Emigration
2.6AgeandSex
Ananalysisof2017arrivalsbytheageandsexcompositionofthetouristswhovisitedSriLankaareshowninTable14and15intheStatisticalAppendix.
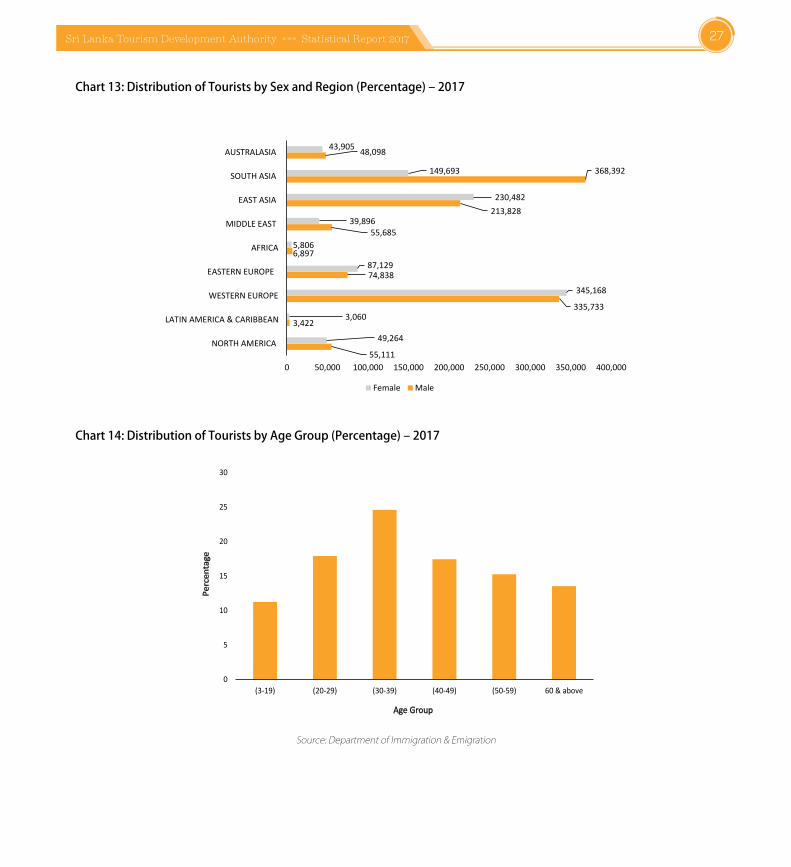
The age composition shows the majority of incomingvisitors (42.5%) in the 20-29 and 30-39 age brackets. Ofthetotaltourists,11.2%werebelow20yearsinage,17.9%wereintheagegroup20-29years,24.6%between30-39years,17.5%between40-49years,15.3%between50-59yearsandtheremaining13.5%were60yearsandabove.
The sexdistributionof the touristswhovisitedSri Lankaduring the year shows that 54.9% of touristsweremalewhile45.1%werefemale.
ItcanalsobeseenfromTable15intheStatisticalAppendixthat in 2017 the highest proportions of female touristswere recorded from Western Europe (36.1%), East Asia(24.1%)andSouthAsia (15.7%). On theotherhand, thehighestproportionsofmaletouristshavebeenrecordedfromSouthAsia(31.7%),WesternEurope(28.9%)andEastAsia(18.4%).
Sri Lanka Tourism Development Authority »»» Statistical Report 2017 27
Chart13:DistributionofTouristsbySexandRegion(Percentage)–2017
55,111
3,422
335,733
74,838
6,897
55,685
213,828
368,392
48,098
49,264
3,060
345,168
87,129
5,806
39,896
230,482
149,693
43,905
0 50,000 100,000 150,000 200,000 250,000 300,000 350,000 400,000
NORTH AMERICA
LATIN AMERICA & CARIBBEAN
WESTERN EUROPE
EASTERN EUROPE
AFRICA
MIDDLE EAST
EAST ASIA
SOUTH ASIA
AUSTRALASIA
Female Male
Chart14:DistributionofTouristsbyAgeGroup(Percentage)–2017
0
5
10
15
20
25
30
(3-19) (20-29) (30-39) (40-49) (50-59) 60 & above
Perc
enta
ge
Age Group
Source:DepartmentofImmigration&Emigration
Sri Lanka Tourism Development Authority »»» Statistical Report 201728
2.7Occupation
OccupationalclassificationoftouristswhovisitedSriLankaduringtheyearunderreviewareshowninTable16and17intheStatisticalAppendix.
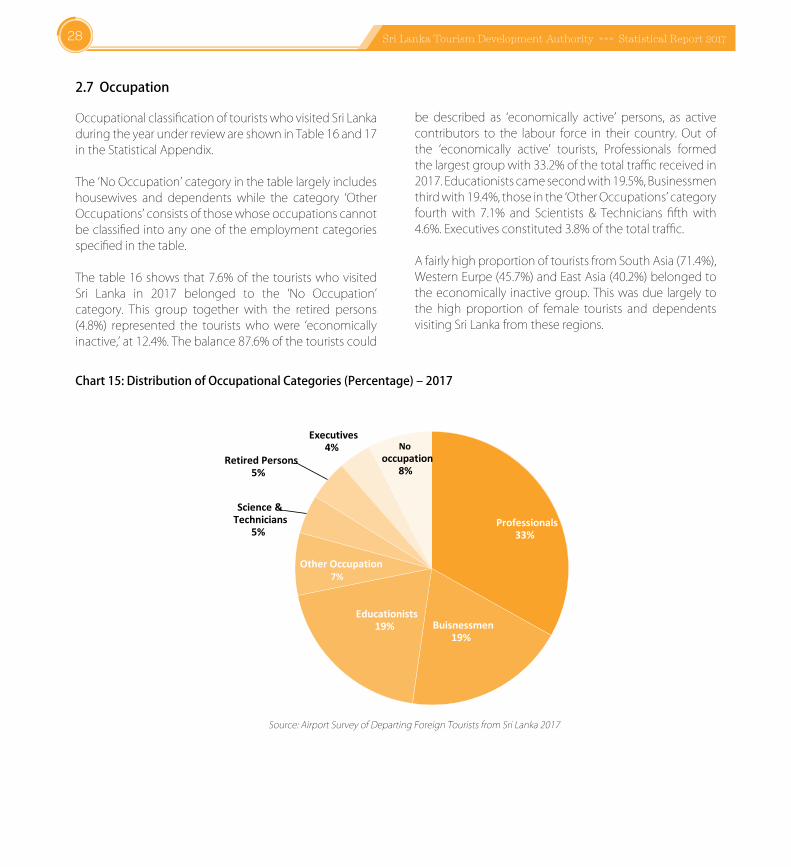
The‘NoOccupation’categoryinthetablelargelyincludeshousewives and dependents while the category ‘OtherOccupations’consistsofthosewhoseoccupationscannotbeclassifiedintoanyoneoftheemploymentcategoriesspecifiedinthetable.
Thetable16showsthat7.6%of thetouristswhovisitedSri Lanka in 2017 belonged to the ‘No Occupation’category. This group together with the retired persons(4.8%) represented the tourists whowere ‘economicallyinactive,’at12.4%.Thebalance87.6%ofthetouristscould
Chart15:DistributionofOccupationalCategories(Percentage)–2017
Professionals33%
Buisnessmen19%
Educationists19%
Other Occupation7%
Science & Technicians
5%
Retired Persons5%
Executives4% No
occupation8%
Source:AirportSurveyofDepartingForeignTouristsfromSriLanka2017
be described as ‘economically active’ persons, as activecontributors to the labour force in their country. Out ofthe ‘economically active’ tourists, Professionals formedthelargestgroupwith33.2%ofthetotaltrafficreceivedin2017.Educationistscamesecondwith19.5%,Businessmenthirdwith19.4%,thoseinthe‘OtherOccupations’categoryfourth with 7.1% and Scientists & Technicians fifth with4.6%.Executivesconstituted3.8%ofthetotaltraffic.
AfairlyhighproportionoftouristsfromSouthAsia(71.4%),WesternEurpe(45.7%)andEastAsia(40.2%)belongedtotheeconomically inactivegroup.Thiswasdue largely tothe high proportion of female tourists and dependentsvisitingSriLankafromtheseregions.
Sri Lanka Tourism Development Authority »»» Statistical Report 2017 29
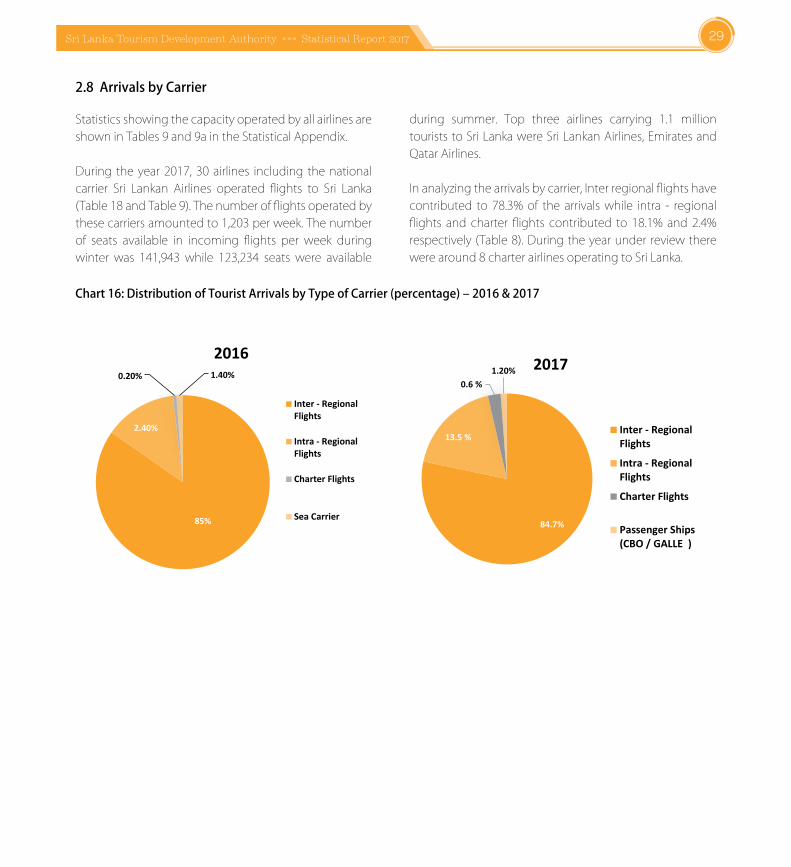
2.8ArrivalsbyCarrier
StatisticsshowingthecapacityoperatedbyallairlinesareshowninTables9and9aintheStatisticalAppendix.
During the year 2017, 30 airlines including thenationalcarrier Sri Lankan Airlines operated flights to Sri Lanka(Table18andTable9).Thenumberofflightsoperatedbythesecarriersamountedto1,203perweek.Thenumberof seats available in incoming flights per week duringwinter was 141,943 while 123,234 seats were available
during summer. Top three airlines carrying 1.1 milliontouriststoSriLankawereSriLankanAirlines,EmiratesandQatarAirlines.
Inanalyzingthearrivalsbycarrier,Interregionalflightshavecontributed to 78.3%of the arrivalswhile intra - regionalflights and charter flights contributed to 18.1% and 2.4%respectively (Table8).Duringtheyearunderreviewtherewerearound8charterairlinesoperatingtoSriLanka.
Chart16:DistributionofTouristArrivalsbyTypeofCarrier(percentage)–2016&2017
85%
2.40%
0.20% 1.40%
2016
Inter - RegionalFlights
Intra - RegionalFlights
Charter Flights
Sea Carrier
84.7%
13.5 %
0.6 %1.20% 2017
Inter - RegionalFlightsIntra - RegionalFlightsCharter Flights
Passenger Ships(CBO / GALLE )
Sri Lanka Tourism Development Authority »»» Statistical Report 201730
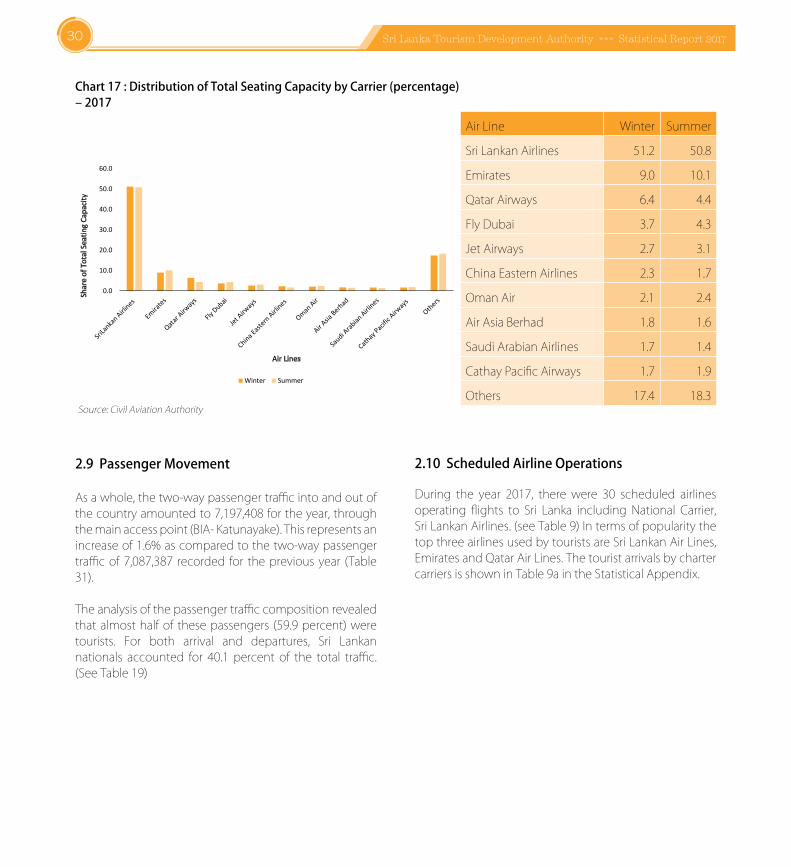
Chart17:DistributionofTotalSeatingCapacitybyCarrier(percentage)–2017
0.0
10.0
20.0
30.0
40.0
50.0
60.0
Shar
e of
Tot
al S
eatin
g Ca
pacit
y
Air Lines
Winter Summer
Source:CivilAviationAuthority
AirLine Winter Summer
SriLankanAirlines 51.2 50.8
Emirates 9.0 10.1
QatarAirways 6.4 4.4
FlyDubai 3.7 4.3
JetAirways 2.7 3.1
ChinaEasternAirlines 2.3 1.7
OmanAir 2.1 2.4
AirAsiaBerhad 1.8 1.6
SaudiArabianAirlines 1.7 1.4
CathayPacificAirways 1.7 1.9
Others 17.4 18.3
2.9PassengerMovement
Asawhole,thetwo-waypassengertrafficintoandoutofthecountryamountedto7,197,408fortheyear,throughthemainaccesspoint(BIA-Katunayake).Thisrepresentsanincreaseof1.6%ascomparedtothetwo-waypassengertrafficof7,087,387 recorded for thepreviousyear (Table31).
Theanalysisofthepassengertrafficcompositionrevealedthatalmosthalfof thesepassengers (59.9percent)weretourists. For both arrival and departures, Sri Lankannationals accounted for 40.1 percent of the total traffic.(SeeTable19)
2.10ScheduledAirlineOperations
During the year 2017, there were 30 scheduled airlinesoperating flights to Sri Lanka including National Carrier,SriLankanAirlines.(seeTable9)IntermsofpopularitythetopthreeairlinesusedbytouristsareSriLankanAirLines,EmiratesandQatarAirLines.ThetouristarrivalsbychartercarriersisshowninTable9aintheStatisticalAppendix.
Sri Lanka Tourism Development Authority »»» Statistical Report 2017 31
32 Sri Lanka Tourism Development Authority »»» Statistical Report 2017
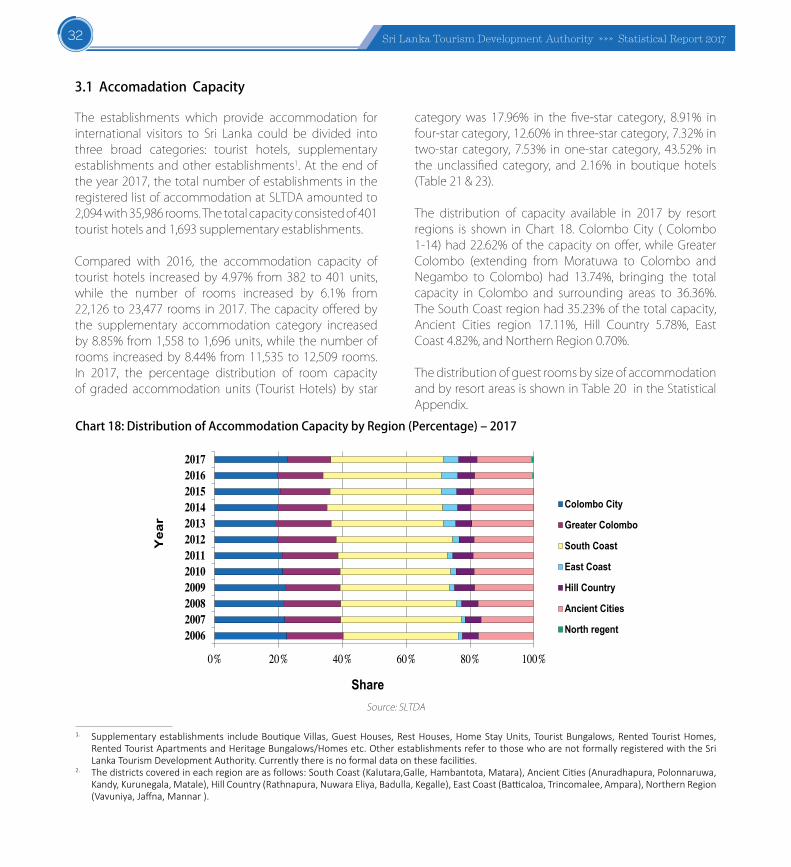
category was 17.96% in the five-star category, 8.91% infour-starcategory,12.60%inthree-starcategory,7.32%intwo-star category, 7.53% in one-star category, 43.52% inthe unclassified category, and 2.16% in boutique hotels(Table21&23).
The distribution of capacity available in 2017 by resortregions is shown in Chart 18. Colombo City ( Colombo1-14)had22.62%of thecapacityonoffer,whileGreaterColombo (extending from Moratuwa to Colombo andNegambo to Colombo) had 13.74%, bringing the totalcapacity in Colombo and surrounding areas to 36.36%.TheSouthCoastregionhad35.23%ofthetotalcapacity,Ancient Cities region 17.11%, Hill Country 5.78%, EastCoast4.82%,andNorthernRegion0.70%.
ThedistributionofguestroomsbysizeofaccommodationandbyresortareasisshowninTable20intheStatisticalAppendix.
3.1AccomadationCapacity
The establishments which provide accommodation forinternational visitors to Sri Lanka could be divided intothree broad categories: tourist hotels, supplementaryestablishmentsandotherestablishments1.At theendoftheyear2017,thetotalnumberofestablishments intheregisteredlistofaccommodationatSLTDAamountedto2,094with35,986rooms.Thetotalcapacityconsistedof401touristhotelsand1,693supplementaryestablishments.
Compared with 2016, the accommodation capacity oftourist hotels increasedby 4.97% from382 to 401units,while the number of rooms increased by 6.1% from22,126 to23,477 rooms in2017. Thecapacityofferedbythe supplementary accommodation category increasedby8.85%from1,558to1,696units,while thenumberofrooms increasedby8.44% from11,535 to12,509 rooms.In 2017, the percentage distribution of room capacityof graded accommodation units (Tourist Hotels) by star
1. Supplementary establishments include Boutique Villas, Guest Houses, Rest Houses, Home Stay Units, Tourist Bungalows, Rented Tourist Homes, Rented Tourist Apartments and Heritage Bungalows/Homes etc. Other establishments refer to those who are not formally registered with the Sri Lanka Tourism Development Authority. Currently there is no formal data on these facilities.
2. The districts covered in each region are as follows: South Coast (Kalutara,Galle, Hambantota, Matara), Ancient Cities (Anuradhapura, Polonnaruwa, Kandy, Kurunegala, Matale), Hill Country (Rathnapura, Nuwara Eliya, Badulla, Kegalle), East Coast (Batticaloa, Trincomalee, Ampara), Northern Region (Vavuniya, Jaffna, Mannar ).
Chart18:DistributionofAccommodationCapacitybyRegion(Percentage)–2017
0% 20% 40% 60% 80% 100%
200620072008200920102011201220132014201520162017
Share
Yea
r
Colombo City
Greater Colombo
South Coast
East Coast
Hill Country
Ancient Cities
North regent
Source:SLTDA
33Sri Lanka Tourism Development Authority »»» Statistical Report 2017
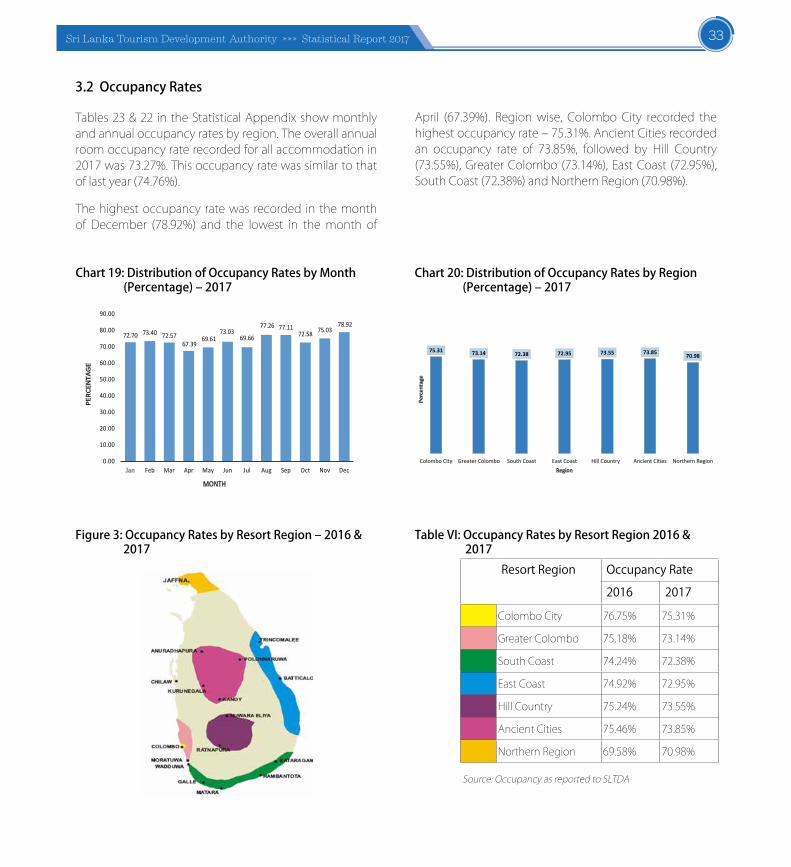
3.2OccupancyRates
Tables23&22 intheStatisticalAppendixshowmonthlyandannualoccupancyratesbyregion.Theoverallannualroomoccupancyraterecordedforallaccommodationin2017was73.27%.Thisoccupancyratewassimilartothatoflastyear(74.76%).
Thehighestoccupancy ratewas recorded in themonthof December (78.92%) and the lowest in themonth of
April (67.39%). Regionwise, Colombo City recorded thehighestoccupancyrate–75.31%.AncientCitiesrecordedan occupancy rate of 73.85%, followed by Hill Country(73.55%),GreaterColombo(73.14%),EastCoast (72.95%),SouthCoast(72.38%)andNorthernRegion(70.98%).
Chart19:DistributionofOccupancyRatesbyMonth (Percentage)–2017
72.70 73.40 72.5767.39
69.6173.03
69.66
77.26 77.1172.58 75.03
78.92
0.00
10.00
20.00
30.00
40.00
50.00
60.00
70.00
80.00
90.00
Jan Feb Mar Apr May Jun Jul Aug Sep Oct Nov Dec
PERC
ENTA
GE
MONTH
Chart20:DistributionofOccupancyRatesbyRegion (Percentage)–2017
75.31 73.14 72.38 72.95 73.55 73.85 70.98
Colombo City Greater Colombo South Coast East Coast Hill Country Ancient Cities Northern Region
Perc
enta
ge
Region
Figure3:OccupancyRatesbyResortRegion–2016& 2017
TableVI:OccupancyRatesbyResortRegion2016& 2017
Resort Region Occupancy Rate2016 2017
ColomboCity 76.75% 75.31%
GreaterColombo 75.18% 73.14%
SouthCoast 74.24% 72.38%
EastCoast 74.92% 72.95%
HillCountry 75.24% 73.55%
AncientCities 75.46% 73.85%
NorthernRegion 69.58% 70.98%
Source:OccupancyasreportedtoSLTDA
34 Sri Lanka Tourism Development Authority »»» Statistical Report 2017
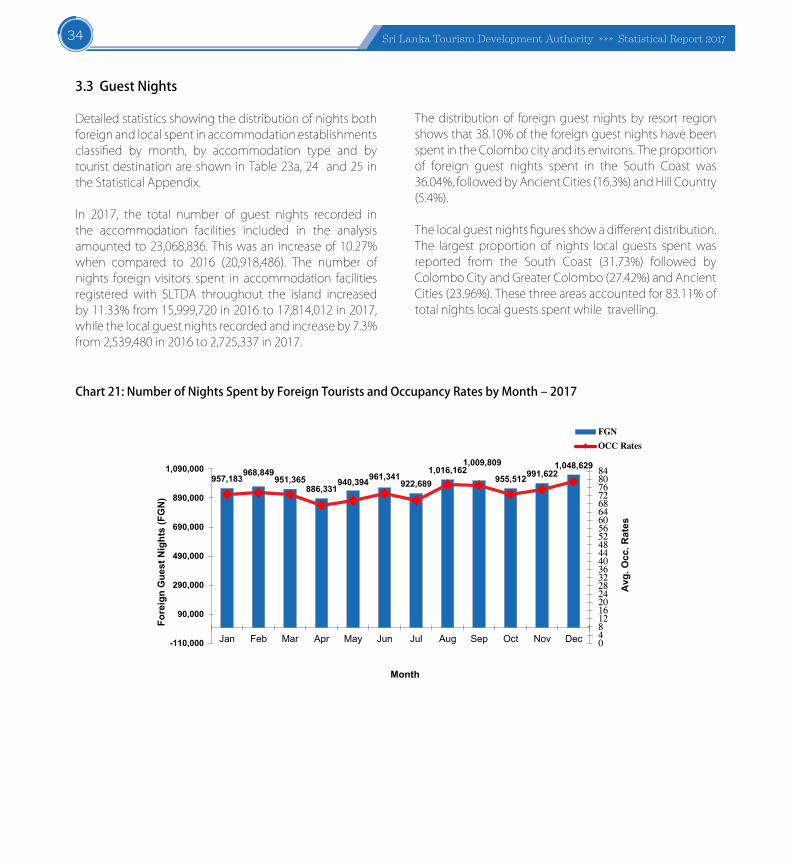
3.3GuestNightsDetailedstatisticsshowingthedistributionofnightsbothforeignandlocalspentinaccommodationestablishmentsclassified by month, by accommodation type and bytouristdestinationareshowninTable23a,24 and25 intheStatisticalAppendix.In 2017, the total number of guest nights recorded inthe accommodation facilities included in the analysisamountedto23,068,836.Thiswasan increaseof10.27%when compared to 2016 (20,918,486). The number ofnights foreign visitors spent in accommodation facilitiesregistered with SLTDA throughout the island increasedby11.33%from15,999,720in2016to17,814,012in2017,whilethelocalguestnightsrecordedandincreaseby7.3%from2,539,480in2016to2,725,337in2017.
Thedistributionof foreignguestnightsby resort regionshowsthat38.10%oftheforeignguestnightshavebeenspentintheColombocityanditsenvirons.Theproportionof foreign guest nights spent in the South Coast was36.04%,followedbyAncientCities(16.3%)andHillCountry(5.4%).
Thelocalguestnightsfiguresshowadifferentdistribution.The largest proportion of nights local guests spentwasreported from the South Coast (31.73%) followed byColomboCityandGreaterColombo(27.42%)andAncientCities(23.96%).Thesethreeareasaccountedfor83.11%oftotalnightslocalguestsspentwhiletravelling.
Chart21:NumberofNightsSpentbyForeignTouristsandOccupancyRatesbyMonth–2017
957,183968,849
951,365886,331
940,394961,341922,689
1,016,1621,009,809
955,512991,6221,048,629
04812162024283236404448525660646872768084
-110,000
90,000
290,000
490,000
690,000
890,000
1,090,000
Jan Feb Mar Apr May Jun Jul Aug Sep Oct Nov DecAv
g. O
cc. R
ates
Fore
ign
Gue
st N
ight
s (F
GN
)
Month
FGN
OCC Rates
35Sri Lanka Tourism Development Authority »»» Statistical Report 2017
36 Sri Lanka Tourism Development Authority »»» Statistical Report 2017
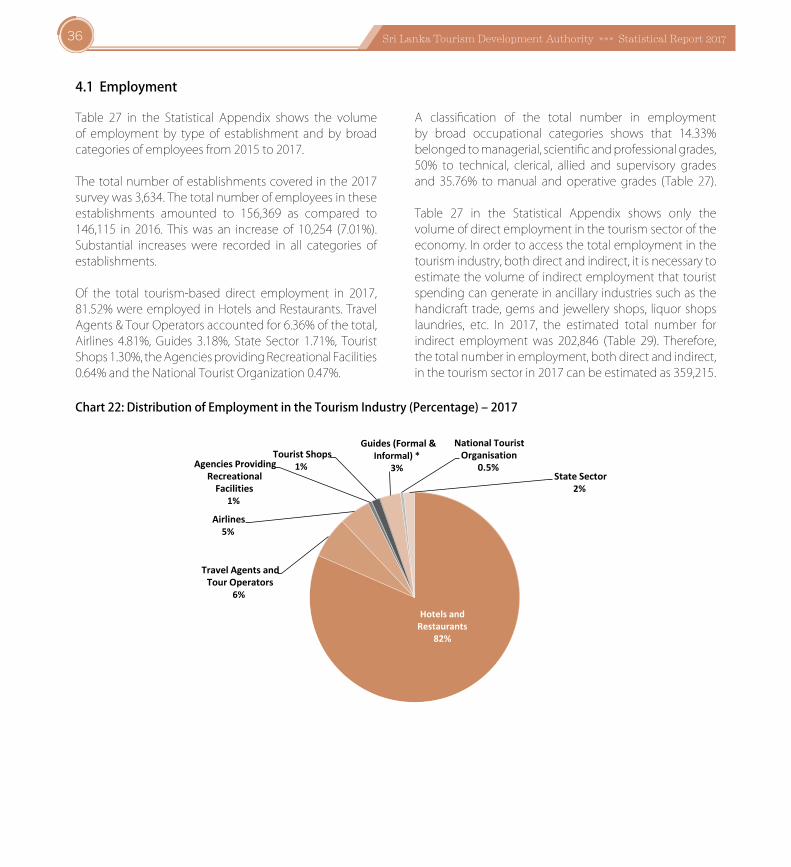
4.1Employment
Table 27 in the Statistical Appendix shows the volumeof employment by type of establishment and by broadcategoriesofemployeesfrom2015to2017.
Thetotalnumberofestablishmentscoveredinthe2017surveywas3,634.Thetotalnumberofemployeesintheseestablishments amounted to 156,369 as compared to146,115 in 2016. Thiswas an increase of 10,254 (7.01%).Substantial increases were recorded in all categories ofestablishments.
Of the total tourism-based direct employment in 2017,81.52%wereemployed inHotelsandRestaurants.TravelAgents&TourOperatorsaccountedfor6.36%ofthetotal,Airlines 4.81%, Guides 3.18%, State Sector 1.71%, TouristShops1.30%,theAgenciesprovidingRecreationalFacilities0.64%andtheNationalTouristOrganization0.47%.
A classification of the total number in employmentby broad occupational categories shows that 14.33%belongedtomanagerial,scientificandprofessionalgrades,50% to technical, clerical, allied and supervisory gradesand 35.76% tomanual and operative grades (Table 27).
Table 27 in the Statistical Appendix shows only thevolumeofdirectemploymentinthetourismsectoroftheeconomy.Inordertoaccessthetotalemploymentinthetourismindustry,bothdirectandindirect,itisnecessarytoestimatethevolumeofindirectemploymentthattouristspendingcangenerateinancillaryindustriessuchasthehandicraft trade,gemsand jewelleryshops, liquorshopslaundries, etc. In 2017, the estimated total number forindirect employment was 202,846 (Table 29). Therefore,thetotalnumberinemployment,bothdirectandindirect,inthetourismsectorin2017canbeestimatedas359,215.
Chart22:DistributionofEmploymentintheTourismIndustry(Percentage)–2017
Hotels and Restaurants
82%
Travel Agents and Tour Operators
6%
Airlines5%
Agencies Providing Recreational
Facilities1%
Tourist Shops1%
Guides (Formal & Informal) *
3%
National Tourist Organisation
0.5%State Sector
2%
37Sri Lanka Tourism Development Authority »»» Statistical Report 2017
4.2DemandforEmployment
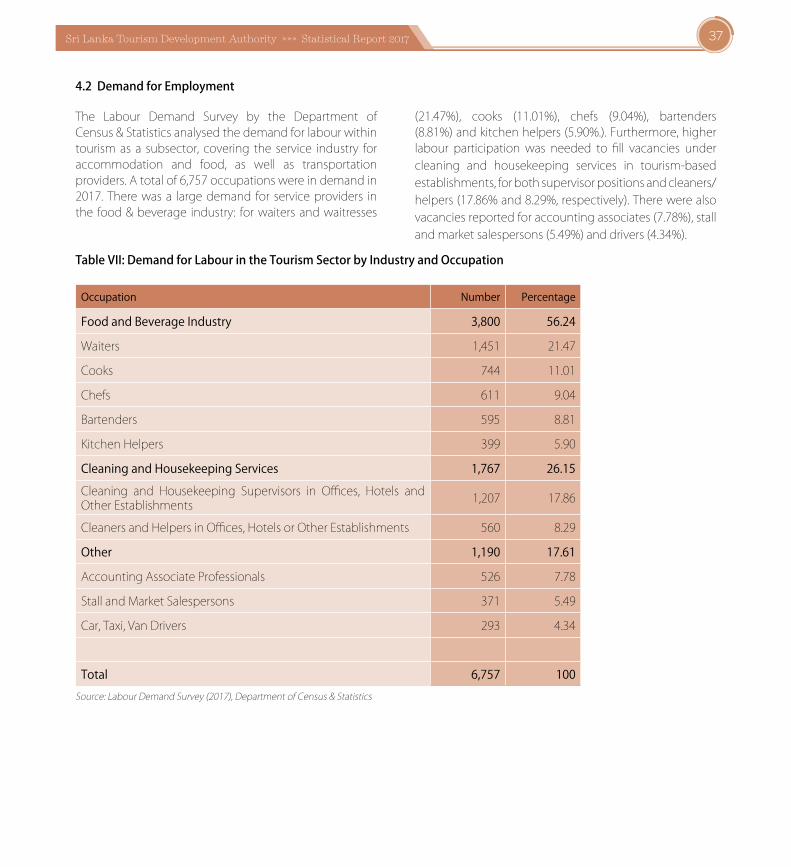
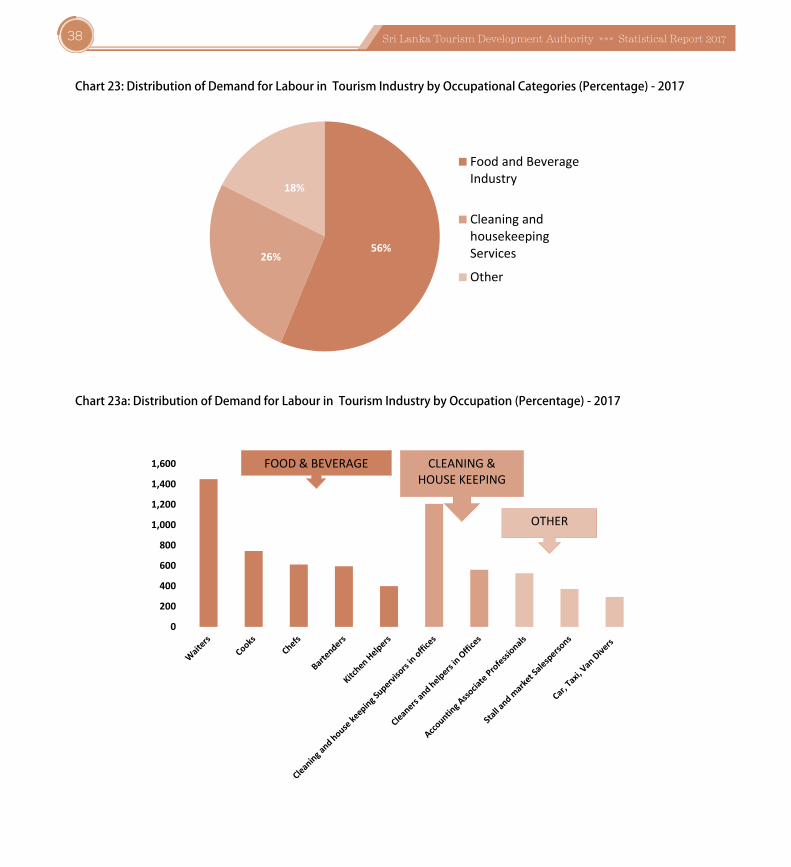
The Labour Demand Survey by the Department ofCensus&Statisticsanalysedthedemandforlabourwithintourismas a subsector, covering the service industry foraccommodation and food, as well as transportationproviders.Atotalof6,757occupationswereindemandin2017. Therewasa largedemand for serviceproviders inthe food&beverage industry: forwaitersandwaitresses
(21.47%), cooks (11.01%), chefs (9.04%), bartenders(8.81%)andkitchenhelpers(5.90%.).Furthermore,higherlabour participation was needed to fill vacancies undercleaning and housekeeping services in tourism-basedestablishments,forbothsupervisorpositionsandcleaners/helpers(17.86%and8.29%,respectively).Therewerealsovacanciesreportedforaccountingassociates(7.78%),stallandmarketsalespersons(5.49%)anddrivers(4.34%).
TableVII:DemandforLabourintheTourismSectorbyIndustryandOccupation
Occupation Number Percentage
Food and Beverage Industry 3,800 56.24
Waiters 1,451 21.47
Cooks 744 11.01
Chefs 611 9.04
Bartenders 595 8.81
KitchenHelpers 399 5.90
Cleaning and Housekeeping Services 1,767 26.15Cleaning and Housekeeping Supervisors in Offices, Hotels andOtherEstablishments 1,207 17.86
CleanersandHelpersinOffices,HotelsorOtherEstablishments 560 8.29
Other 1,190 17.61
AccountingAssociateProfessionals 526 7.78
StallandMarketSalespersons 371 5.49
Car,Taxi,VanDrivers 293 4.34
Total 6,757 100Source:LabourDemandSurvey(2017),DepartmentofCensus&Statistics
38 Sri Lanka Tourism Development Authority »»» Statistical Report 2017
Chart23:DistributionofDemandforLabourinTourismIndustrybyOccupationalCategories(Percentage)-2017
56%26%
18%
Food and BeverageIndustry
Cleaning andhousekeepingServices
Other
Chart23a:DistributionofDemandforLabourinTourismIndustrybyOccupation(Percentage)-2017
0
200
400
600
800
1,000
1,200
1,400
1,600 FOOD & BEVERAGE CLEANING & HOUSE KEEPING
OTHER
39Sri Lanka Tourism Development Authority »»» Statistical Report 2017
40 Sri Lanka Tourism Development Authority »»» Statistical Report 2017
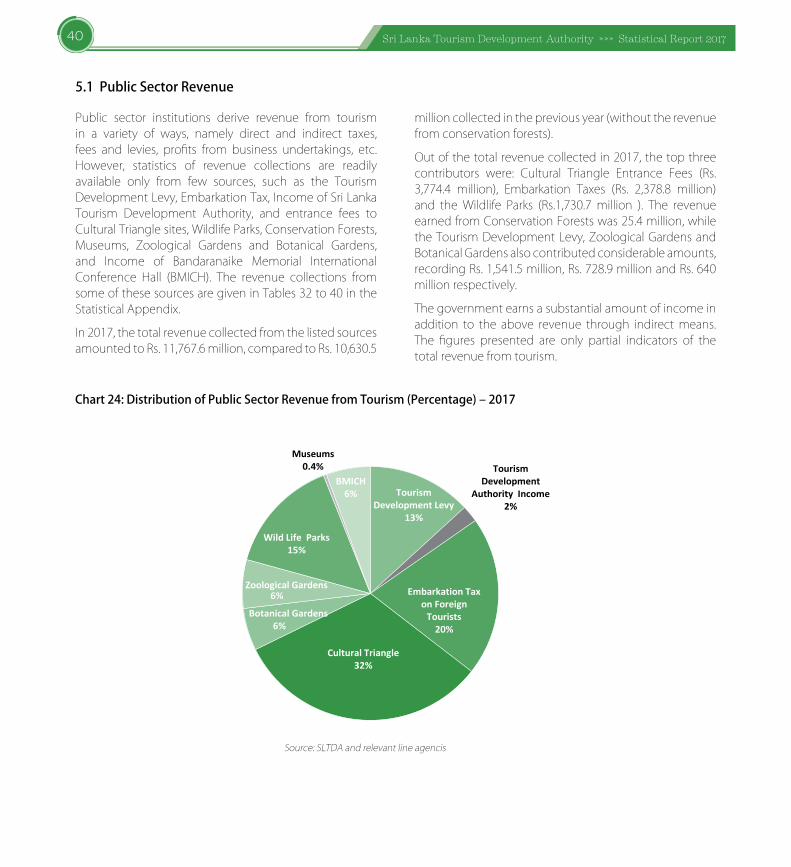
5.1PublicSectorRevenue
Public sector institutions derive revenue from tourismin a variety of ways, namely direct and indirect taxes,fees and levies, profits from business undertakings, etc.However, statistics of revenue collections are readilyavailable only from few sources, such as the TourismDevelopmentLevy,EmbarkationTax,IncomeofSriLankaTourism Development Authority, and entrance fees toCulturalTrianglesites,WildlifeParks,ConservationForests,Museums, Zoological Gardens and Botanical Gardens,and Income of Bandaranaike Memorial InternationalConference Hall (BMICH). The revenue collections fromsomeofthesesourcesaregiveninTables32to40intheStatisticalAppendix.
In2017,thetotalrevenuecollectedfromthelistedsourcesamountedtoRs.11,767.6million,comparedtoRs.10,630.5
millioncollectedinthepreviousyear(withouttherevenuefromconservationforests).
Outofthetotalrevenuecollectedin2017,thetopthreecontributors were: Cultural Triangle Entrance Fees (Rs.3,774.4 million), Embarkation Taxes (Rs. 2,378.8 million)and the Wildlife Parks (Rs.1,730.7 million ). The revenueearnedfromConservationForestswas25.4million,whiletheTourismDevelopmentLevy,ZoologicalGardensandBotanicalGardensalsocontributedconsiderableamounts,recordingRs.1,541.5million,Rs.728.9millionandRs.640millionrespectively.
Thegovernmentearnsasubstantialamountofincomeinaddition to the above revenue through indirectmeans.The figures presented are only partial indicators of thetotalrevenuefromtourism.
Chart24:DistributionofPublicSectorRevenuefromTourism(Percentage)–2017
Tourism Development Levy
13%
Tourism Development
Authority Income2%
Embarkation Tax on Foreign
Tourists20%
Cultural Triangle32%
Zoological Gardens
Wild Life Parks15%
Museums0.4%
BMICH6%
Botanical Gardens6%
6%
Source:SLTDAandrelevantlineagencis
41Sri Lanka Tourism Development Authority »»» Statistical Report 2017
42 Sri Lanka Tourism Development Authority »»» Statistical Report 2017
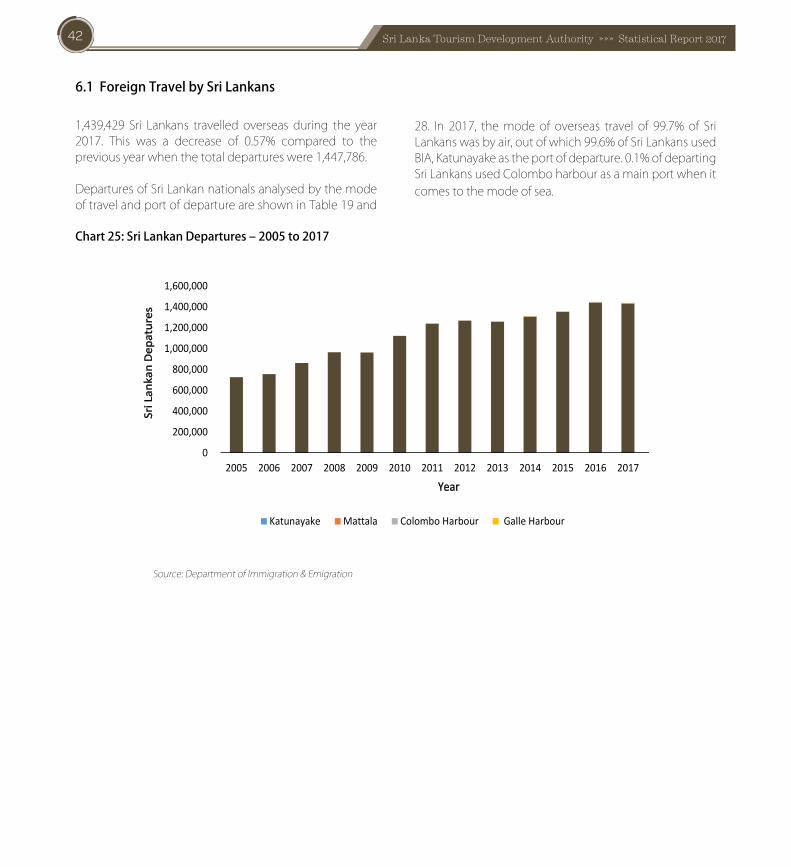
6.1ForeignTravelbySriLankans
1,439,429 Sri Lankans travelled overseas during the year2017. This was a decrease of 0.57% compared to thepreviousyearwhenthetotaldepartureswere1,447,786.
DeparturesofSriLankannationalsanalysedbythemodeoftravelandportofdepartureareshowninTable19and
28. In 2017, themode of overseas travel of 99.7% of SriLankanswasbyair,outofwhich99.6%ofSriLankansusedBIA,Katunayakeastheportofdeparture.0.1%ofdepartingSriLankansusedColomboharbourasamainportwhenitcomestothemodeofsea.
Chart25:SriLankanDepartures–2005to2017
0
200,000
400,000
600,000
800,000
1,000,000
1,200,000
1,400,000
1,600,000
2005 2006 2007 2008 2009 2010 2011 2012 2013 2014 2015 2016 2017
Sri L
anka
n De
patu
res
Year
Katunayake Mattala Colombo Harbour Galle Harbour
Source:DepartmentofImmigration&Emigration
43Sri Lanka Tourism Development Authority »»» Statistical Report 2017
44 Sri Lanka Tourism Development Authority »»» Statistical Report 2017
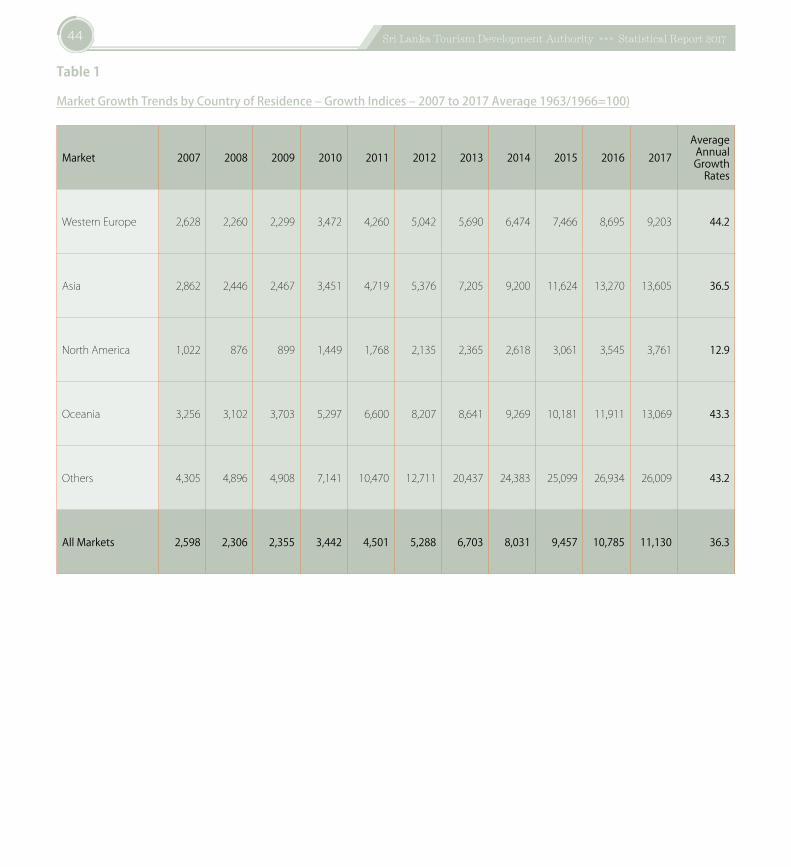
Table1
MarketGrowthTrendsbyCountryofResidence–GrowthIndices–2007to2017Average1963/1966=100)
Market 2007 2008 2009 2010 2011 2012 2013 2014 2015 2016 2017Average
Annual Growth
Rates
WesternEurope 2,628 2,260 2,299 3,472 4,260 5,042 5,690 6,474 7,466 8,695 9,203 44.2
Asia 2,862 2,446 2,467 3,451 4,719 5,376 7,205 9,200 11,624 13,270 13,605 36.5
NorthAmerica 1,022 876 899 1,449 1,768 2,135 2,365 2,618 3,061 3,545 3,761 12.9
Oceania 3,256 3,102 3,703 5,297 6,600 8,207 8,641 9,269 10,181 11,911 13,069 43.3
Others 4,305 4,896 4,908 7,141 10,470 12,711 20,437 24,383 25,099 26,934 26,009 43.2
All Markets 2,598 2,306 2,355 3,442 4,501 5,288 6,703 8,031 9,457 10,785 11,130 36.3
45Sri Lanka Tourism Development Authority »»» Statistical Report 2017
Table2
TouristArrivalsbyNationality–2017
Nationality 2017 Percentage Share
NORTH AMERICA 110,502 5.22
Canadian 48,376 2.29
American 61,196 2.89
Mexican 930 0.04CARIBBEAN, CENTRAL & SOUTH AMERICA 5,830 0.28
Argentinian 1,028 0.05
Brazilian 1,734 0.08
Others 3,068 0.14
WESTERN EUROPE 328,144 15.50
Austrian 16,719 0.79
Belgian 14,152 0.67
Dane 125,369 5.92
Dutch 48,875 2.31
French 94,109 4.45
Swiss 28,200 1.33
Others 720 0.03
NORTHERN EUROPE 275,219 13.00
British 204,515 9.66
Danish 17,821 0.84
Finnish 6,985 0.33
Irish 8,302 0.39
Norwegian 13,694 0.65
Swedish 23,536 1.11
Others 366 0.02
CENTRAL AND EASTERN EUROPE 147,598 6.97
Czech 14,978 0.71
Polish 14,572 0.69
Russian 56,325 2.66
Ukrainian 30,753 1.45
Others 30,970 1.46
Nationality 2017 Percentage Share
SOUTHERN EUROPE 84,637 4.00Spanish 21,369 1.01Italian 31,945 1.51Israeli 10,544 0.50Others 20,779 0.98MIDDLE EAST 72,151 3.41SaudiArabian 33,688 1.59Omani 8,121 0.38Others 30,342 1.43AFRICA 17,863 0.84SouthAfricans 5,667 0.27Seychelles 4,467 0.21Others 7,729 0.37NORTH EAST ASIA 340,201 16.07Chinese 268,683 12.70Japanese 47,308 2.24Others 24,210 1.14SOUTH ASIA 529,700 25.03Indians 386,131 18.24Maldivians 80,956 3.83Pakistani 31,490 1.49Others 31,123 1.47SOUTH EAST ASIA 104,842 4.95Indonesians 26,115 1.23Malaysians 24,982 1.18Singaporeans 19,183 0.91Others 34,562 1.63OCEANIA 99,720 4.71Australian 87,882 4.15NewZealanders 10,982 0.52Others 856 0.04Total 2,116,407 100.00
Table2(contd.)
46 Sri Lanka Tourism Development Authority »»» Statistical Report 2017
Table3
TouristArrivalsbyCountryofResidence–2012to2017
Country of Residence 2012 2013 2014 2015 2016 2017
NORTH AMERICA 59,236 65,616 72,653 84,943 98,376 104,375
Canada 29,329 30,926 33,282 37,732 44,122 46,896
UnitedStates 29,907 34,690 39,371 47,211 54,254 57,479
LATIN AMERICA & THE CARIBBEAN 1,626 3,166 4,124 4,628 5,625 6,482
WESTERN EUROPE 373,063 421,037 479,007 552,442 643,333 680,901
Austria 7,991 11,300 12,664 14,253 16,995 17,466
Belgium 11,323 9,138 9,915 13,054 14,387 14,616
Denmark 8,323 9,845 11,239 15,203 18,097 18,647
Finland 4,840 2,471 2,903 3,830 5,057 7,334
France 56,863 64,388 78,883 86,126 96,440 97,282
Germany 71,642 85,470 102,977 115,868 133,275 130,227
Italy 15,871 17,982 21,116 24,293 29,791 31,428
Netherlands 26,754 22,281 24,196 32,742 41,373 51,148
Norway 7,703 8,573 9,237 12,007 12,790 14,159
Spain 8,319 8,183 11,914 15,582 19,425 22,361
Sweden 13,775 12,597 14,259 18,423 21,589 24,275
Switzerland 20,054 19,141 20,097 22,418 26,282 28,402
UnitedKingdom 114,218 137,416 144,168 161,845 188,159 201,879
Others 5,387 12,252 15,439 16,798 19,673 21,677
EASTERN EUROPE 72,401 125,695 154,153 148,458 161,171 161,967
Russia 28,402 51,235 69,718 61,846 58,176 59,191
Ukraine 22,348 38,607 29,882 23,853 31,302 32,346
Others 21,651 35,853 54,553 62,759 71,693 70,430
MIDDLE EAST 56,169 80,509 88,991 101,066 107,635 95,581
47Sri Lanka Tourism Development Authority »»» Statistical Report 2017
Country of Residence 2012 2013 2014 2015 2016 2017
AFRICA 5,045 8,081 12,163 12,899 12,144 12,703
SouthAfrica 3,048 3,366 4,155 4,717 5,208 5,726
Others 1,997 4,715 8,008 8,182 6,936 6,977
EAST ASIA 132,730 183,097 280,511 362,857 425,161 444,310
China(P.R.) 27,316 54,288 128,166 214,783 271,577 268,952
Indonesia 2,890 17,295 29,558 23,305 16,047 25,806
Japan 26,085 31,505 39,136 39,358 43,110 44,988
SouthKorea 7,838 12,207 13,412 14,373 14,520 15,963
Malaysia 21,776 19,181 23,178 22,772 24,727 26,414
Philippines 5,687 14,616 11,160 11,305 12,747 16,845
Singapore 17,273 15,546 15,762 15,846 19,033 19,457
Thailand 7,897 9,608 9,260 10,112 9,462 10,828
Taiwan(P.C) 12,703 3,931 5,193 5,330 6,579 7,636
Others 3,265 4,920 5,686 5,673 7,359 7,421
SOUTH ASIA 247,559 326,556 370,299 459,415 513,536 518,085
Bangladesh 4,646 10,037 10,754 13,358 17,098 15,510
India 176,340 208,795 242,734 316,247 356,729 384,628
Maldives 47,572 79,474 86,359 90,617 95,167 79,371
Nepal 1,038 2,019 3,319 5,801 13,153 5,144
Pakistan 16,056 25,336 25,424 32,300 29,965 31,815
Others 1,907 895 1,709 1,092 1,424 1,617
AUSTRALASIA 57,776 60,836 65,252 71,672 83,851 92,003
Australia 51,614 54,252 57,940 63,554 74,496 81,281
NewZealand 5,641 6,174 6,880 7,762 9,045 10,332
Others 521 410 432 356 310 390
Total 1,005,605 1,274,593 1,527,153 1,798,380 2,050,832 2,116,407
Table3(contd.)
48 Sri Lanka Tourism Development Authority »»» Statistical Report 2017
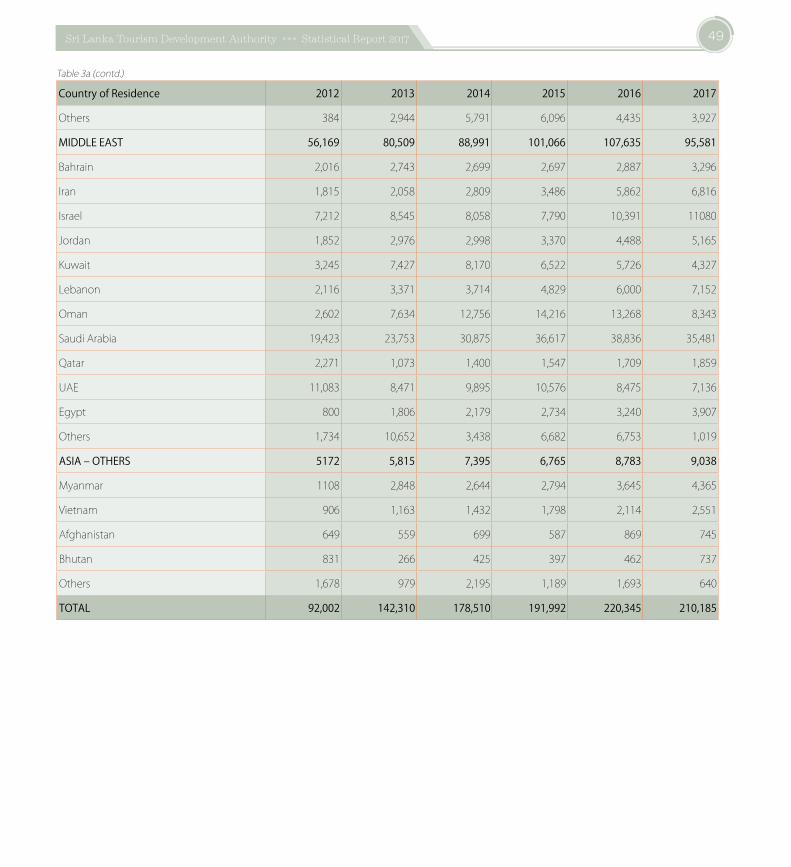
Table3(a)
TouristsArrivalsbyMiscellaneousCountries–2012to2017
Country of Residence 2012 2013 2014 2015 2016 2017
LATIN AMERICA & THE CARIBBEAN 1,626 3,166 4,124 4,628 5,625 6,482
Argentina 387 400 509 550 771 921
Chile - 255 366 433 524 631
Colombia - 268 340 466 567 710
Brazil 476 803 1,071 1,341 1,385 1,822
Others 763 1,440 1,838 1,838 2,378 2,398
WESTERN EUROPE-OTHERS 5,387 12,252 15,439 16,798 19,673 21,677
Greece 1,415 4,010 5,002 5,144 4,573 5,651
Ireland 1,951 4,512 5,163 5,970 7,968 9,806
Portugal 1,284 2,097 2,620 3,001 4,095 5,060
Others 737 1,633 2,654 2,683 3,037 1,160
EASTERN EUROPE-OTHERS 21,651 35,853 54,553 54,553 71,693 70,430
CzechRepublic 5,877 8,881 11,736 15,278 17,858 15,712
Hungary 1,418 1,653 2,697 2,955 3,942 4,951
Poland 5,806 9,688 13,370 13,245 14,432 15,346
Romania 1,029 1,687 2,331 3,107 3,466 4,652
Slovakia 2,040 1,731 2,411 4,214 5,696 6,579
Lithuania 1,078 1,405 1,858 1,764 2,372 2,959
Turkey 1,460 2,399 2,500 3,108 3,804 4,609
Kazakhstan 996 2,362 3,750 6,371 5,285 6,122
Others 1,947 6,047 13,900 4,511 14,838 9,500
AFRICA -OTHERS 1,997 4,715 8,008 8,182 6,936 6,977
Kenya 645 507 665 601 706 853
Mauritius 284 288 347 430 550 703
Nigeria 684 550 487 390 343 416
Sudan - 426 718 665 902 1,078
49Sri Lanka Tourism Development Authority »»» Statistical Report 2017
Country of Residence 2012 2013 2014 2015 2016 2017
Others 384 2,944 5,791 6,096 4,435 3,927
MIDDLE EAST 56,169 80,509 88,991 101,066 107,635 95,581
Bahrain 2,016 2,743 2,699 2,697 2,887 3,296
Iran 1,815 2,058 2,809 3,486 5,862 6,816
Israel 7,212 8,545 8,058 7,790 10,391 11080
Jordan 1,852 2,976 2,998 3,370 4,488 5,165
Kuwait 3,245 7,427 8,170 6,522 5,726 4,327
Lebanon 2,116 3,371 3,714 4,829 6,000 7,152
Oman 2,602 7,634 12,756 14,216 13,268 8,343
SaudiArabia 19,423 23,753 30,875 36,617 38,836 35,481
Qatar 2,271 1,073 1,400 1,547 1,709 1,859
UAE 11,083 8,471 9,895 10,576 8,475 7,136
Egypt 800 1,806 2,179 2,734 3,240 3,907
Others 1,734 10,652 3,438 6,682 6,753 1,019
ASIA – OTHERS 5172 5,815 7,395 6,765 8,783 9,038
Myanmar 1108 2,848 2,644 2,794 3,645 4,365
Vietnam 906 1,163 1,432 1,798 2,114 2,551
Afghanistan 649 559 699 587 869 745
Bhutan 831 266 425 397 462 737
Others 1,678 979 2,195 1,189 1,693 640
TOTAL 92,002 142,310 178,510 191,992 220,345 210,185
Table3a(contd.)
50 Sri Lanka Tourism Development Authority »»» Statistical Report 2017
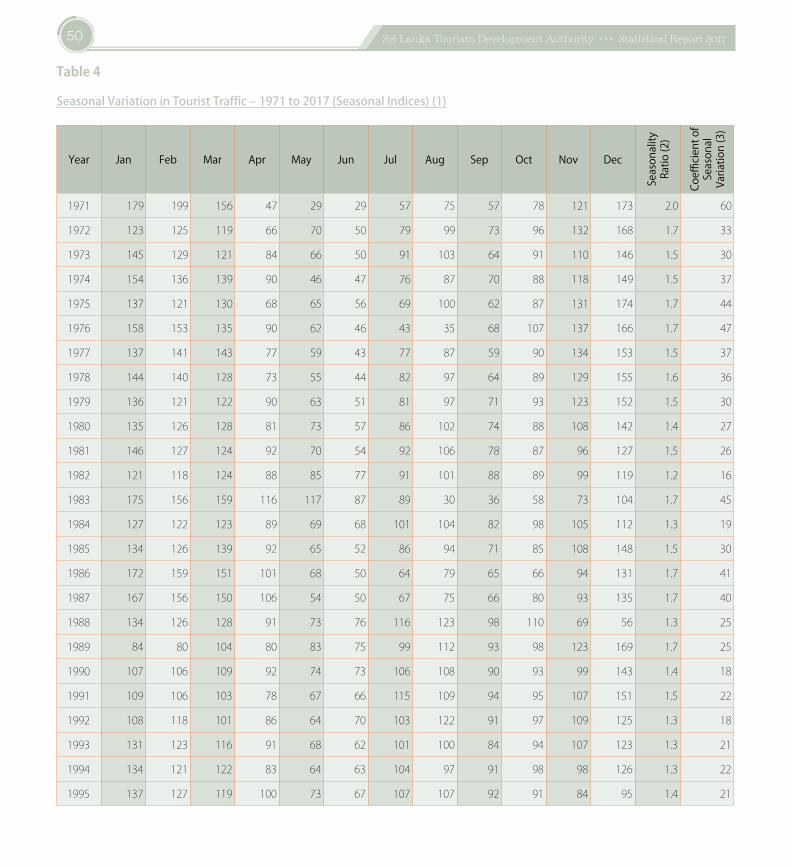
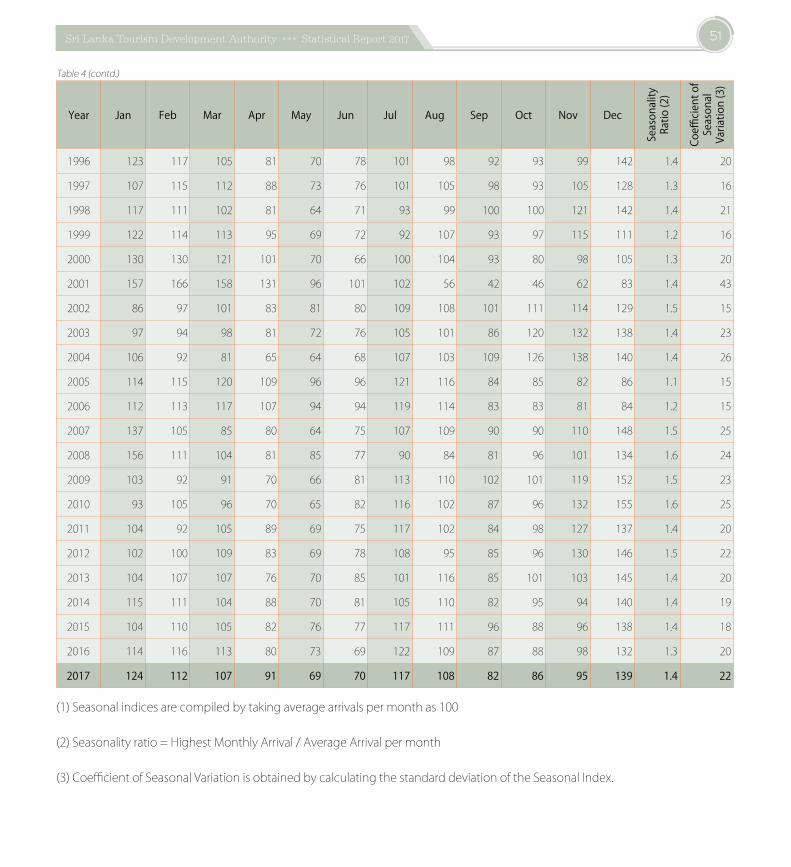
Table4
SeasonalVariationinTouristTraffic–1971to2017(SeasonalIndices)(1)
Year Jan Feb Mar Apr May Jun Jul Aug Sep Oct Nov Dec
Seas
onal
ity
Ratio
(2)
Coeffi
cient
of
Seas
onal
Va
riatio
n (3
)
1971 179 199 156 47 29 29 57 75 57 78 121 173 2.0 60
1972 123 125 119 66 70 50 79 99 73 96 132 168 1.7 33
1973 145 129 121 84 66 50 91 103 64 91 110 146 1.5 30
1974 154 136 139 90 46 47 76 87 70 88 118 149 1.5 37
1975 137 121 130 68 65 56 69 100 62 87 131 174 1.7 44
1976 158 153 135 90 62 46 43 35 68 107 137 166 1.7 47
1977 137 141 143 77 59 43 77 87 59 90 134 153 1.5 37
1978 144 140 128 73 55 44 82 97 64 89 129 155 1.6 36
1979 136 121 122 90 63 51 81 97 71 93 123 152 1.5 30
1980 135 126 128 81 73 57 86 102 74 88 108 142 1.4 27
1981 146 127 124 92 70 54 92 106 78 87 96 127 1.5 26
1982 121 118 124 88 85 77 91 101 88 89 99 119 1.2 16
1983 175 156 159 116 117 87 89 30 36 58 73 104 1.7 45
1984 127 122 123 89 69 68 101 104 82 98 105 112 1.3 19
1985 134 126 139 92 65 52 86 94 71 85 108 148 1.5 30
1986 172 159 151 101 68 50 64 79 65 66 94 131 1.7 41
1987 167 156 150 106 54 50 67 75 66 80 93 135 1.7 40
1988 134 126 128 91 73 76 116 123 98 110 69 56 1.3 25
1989 84 80 104 80 83 75 99 112 93 98 123 169 1.7 25
1990 107 106 109 92 74 73 106 108 90 93 99 143 1.4 18
1991 109 106 103 78 67 66 115 109 94 95 107 151 1.5 22
1992 108 118 101 86 64 70 103 122 91 97 109 125 1.3 18
1993 131 123 116 91 68 62 101 100 84 94 107 123 1.3 21
1994 134 121 122 83 64 63 104 97 91 98 98 126 1.3 22
1995 137 127 119 100 73 67 107 107 92 91 84 95 1.4 21
51Sri Lanka Tourism Development Authority »»» Statistical Report 2017
Year Jan Feb Mar Apr May Jun Jul Aug Sep Oct Nov Dec
Seas
onal
ity
Ratio
(2)
Coeffi
cient
of
Seas
onal
Va
riatio
n (3
)
1996 123 117 105 81 70 78 101 98 92 93 99 142 1.4 20
1997 107 115 112 88 73 76 101 105 98 93 105 128 1.3 16
1998 117 111 102 81 64 71 93 99 100 100 121 142 1.4 21
1999 122 114 113 95 69 72 92 107 93 97 115 111 1.2 16
2000 130 130 121 101 70 66 100 104 93 80 98 105 1.3 20
2001 157 166 158 131 96 101 102 56 42 46 62 83 1.4 43
2002 86 97 101 83 81 80 109 108 101 111 114 129 1.5 15
2003 97 94 98 81 72 76 105 101 86 120 132 138 1.4 23
2004 106 92 81 65 64 68 107 103 109 126 138 140 1.4 26
2005 114 115 120 109 96 96 121 116 84 85 82 86 1.1 15
2006 112 113 117 107 94 94 119 114 83 83 81 84 1.2 15
2007 137 105 85 80 64 75 107 109 90 90 110 148 1.5 25
2008 156 111 104 81 85 77 90 84 81 96 101 134 1.6 24
2009 103 92 91 70 66 81 113 110 102 101 119 152 1.5 23
2010 93 105 96 70 65 82 116 102 87 96 132 155 1.6 25
2011 104 92 105 89 69 75 117 102 84 98 127 137 1.4 20
2012 102 100 109 83 69 78 108 95 85 96 130 146 1.5 22
2013 104 107 107 76 70 85 101 116 85 101 103 145 1.4 20
2014 115 111 104 88 70 81 105 110 82 95 94 140 1.4 19
2015 104 110 105 82 76 77 117 111 96 88 96 138 1.4 18
2016 114 116 113 80 73 69 122 109 87 88 98 132 1.3 20
2017 124 112 107 91 69 70 117 108 82 86 95 139 1.4 22
(1)Seasonalindicesarecompiledbytakingaveragearrivalspermonthas100
(2)Seasonalityratio=HighestMonthlyArrival/AverageArrivalpermonth
(3)CoefficientofSeasonalVariationisobtainedbycalculatingthestandarddeviationoftheSeasonalIndex.
Table4(contd.)
52 Sri Lanka Tourism Development Authority »»» Statistical Report 2017
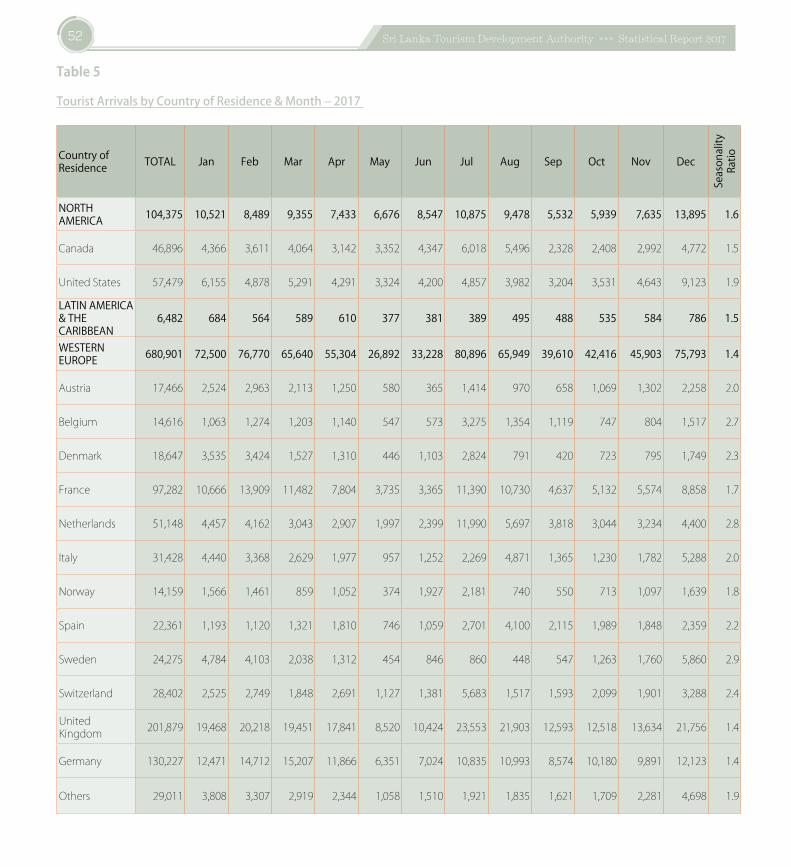
Table5
TouristArrivalsbyCountryofResidence&Month–2017
Country of Residence TOTAL Jan Feb Mar Apr May Jun Jul Aug Sep Oct Nov Dec
Seas
onal
ity
Ratio
NORTH AMERICA 104,375 10,521 8,489 9,355 7,433 6,676 8,547 10,875 9,478 5,532 5,939 7,635 13,895 1.6
Canada 46,896 4,366 3,611 4,064 3,142 3,352 4,347 6,018 5,496 2,328 2,408 2,992 4,772 1.5
UnitedStates 57,479 6,155 4,878 5,291 4,291 3,324 4,200 4,857 3,982 3,204 3,531 4,643 9,123 1.9
LATIN AMERICA & THE CARIBBEAN
6,482 684 564 589 610 377 381 389 495 488 535 584 786 1.5
WESTERN EUROPE 680,901 72,500 76,770 65,640 55,304 26,892 33,228 80,896 65,949 39,610 42,416 45,903 75,793 1.4
Austria 17,466 2,524 2,963 2,113 1,250 580 365 1,414 970 658 1,069 1,302 2,258 2.0
Belgium 14,616 1,063 1,274 1,203 1,140 547 573 3,275 1,354 1,119 747 804 1,517 2.7
Denmark 18,647 3,535 3,424 1,527 1,310 446 1,103 2,824 791 420 723 795 1,749 2.3
France 97,282 10,666 13,909 11,482 7,804 3,735 3,365 11,390 10,730 4,637 5,132 5,574 8,858 1.7
Netherlands 51,148 4,457 4,162 3,043 2,907 1,997 2,399 11,990 5,697 3,818 3,044 3,234 4,400 2.8
Italy 31,428 4,440 3,368 2,629 1,977 957 1,252 2,269 4,871 1,365 1,230 1,782 5,288 2.0
Norway 14,159 1,566 1,461 859 1,052 374 1,927 2,181 740 550 713 1,097 1,639 1.8
Spain 22,361 1,193 1,120 1,321 1,810 746 1,059 2,701 4,100 2,115 1,989 1,848 2,359 2.2
Sweden 24,275 4,784 4,103 2,038 1,312 454 846 860 448 547 1,263 1,760 5,860 2.9
Switzerland 28,402 2,525 2,749 1,848 2,691 1,127 1,381 5,683 1,517 1,593 2,099 1,901 3,288 2.4
UnitedKingdom 201,879 19,468 20,218 19,451 17,841 8,520 10,424 23,553 21,903 12,593 12,518 13,634 21,756 1.4
Germany 130,227 12,471 14,712 15,207 11,866 6,351 7,024 10,835 10,993 8,574 10,180 9,891 12,123 1.4
Others 29,011 3,808 3,307 2,919 2,344 1,058 1,510 1,921 1,835 1,621 1,709 2,281 4,698 1.9
53Sri Lanka Tourism Development Authority »»» Statistical Report 2017
Country of Residence TOTAL Jan Feb Mar Apr May Jun Jul Aug Sep Oct Nov Dec
Seas
onal
ity
Ratio
EASTERN EUROPE 161,967 26,540 23,768 19,248 12,981 4,835 3,865 6,127 5,711 6,044 10,393 18,636 23,819 2.0
Russia 59,191 10,337 9,031 7,097 4,602 1,242 1,029 1,274 1,272 1,521 3,980 7,864 9,942 2.1
Ukraine 32,346 5,806 4,252 3,582 3,138 1,464 552 1,165 1,399 1,687 2,162 3,284 3,855 2.2
CzechRepublic 15,712 2,305 2,735 2,327 1,502 353 430 793 567 558 693 1,577 1,872 2.1
Poland 15,346 2,134 1,876 1,503 696 489 589 911 684 735 906 2,433 2,390 1.9
Others 39,372 5,958 5,874 4,739 3,043 1,287 1,265 1,984 1,789 1,543 2,652 3,478 5,760 1.9
AFRICA 12,703 963 803 1,047 1,070 727 843 1,041 1,047 941 856 926 2,439 2.3
SouthAfrica 5,726 480 319 472 540 249 438 377 343 320 310 388 1,490 3.1
Others 6,977 483 484 575 530 478 405 664 704 621 546 538 949 1.6
MIDDLE EAST 95,581 8,948 5,530 8,064 6,624 3,236 4,958 16,163 16,336 9,331 4,662 5,066 6,663 2.1
SaudiArabia 35,481 3,163 1,388 2,034 1,836 834 1,789 8,354 8,761 4,003 1,078 1,120 1,121 3.0
UAE 7,136 310 234 635 454 301 590 1,333 1,373 556 305 421 624 2.3
Israel 11,080 1,104 1,026 776 1,056 330 426 1,154 1,431 1,170 818 615 1,174 1.5
Kuwait 4,327 605 339 317 376 246 217 538 678 281 232 225 273 1.9
Oman 8,343 1,175 779 429 374 246 284 2,404 1,126 458 302 353 413 3.5
Others 29,214 2,591 1,764 3,873 2,528 1,279 1,652 2,380 2,967 2,863 1,927 2,332 3,058 1.6
EAST ASIA 444,310 48,773 41,460 38,030 32,122 31,269 28,643 41,264 42,417 31,127 34,870 36,087 38,248 1.3
China(P.R.)** 268,952 31,802 25,248 22,172 19,823 18,494 17,205 28,445 26,507 18,939 21,846 19,237 19,234 1.4
Japan 44,988 4,026 4,757 4,271 3,404 2,848 2,970 4,025 5,511 4,254 3,111 3,063 2,748 1.5
Table5(Contd.)
54 Sri Lanka Tourism Development Authority »»» Statistical Report 2017
Country of Residence TOTAL Jan Feb Mar Apr May Jun Jul Aug Sep Oct Nov Dec
Seas
onal
ity
Ratio
Malaysia 26,414 2,266 1,672 2,145 1,676 2,089 2,019 1,628 2,311 1,564 1,764 2,686 4,594 2.1
Philippines 16,845 839 864 1,093 1,197 1,074 1,208 1,209 1,394 1,583 1,561 1,624 3,199 2.3
Indonesia 25,806 4,529 3,690 3,677 1,885 1,494 923 606 1,143 561 2,073 3,795 1,430 2.1
Singapore 19,457 1,263 1,157 1,573 1,218 1,465 1,854 1,485 1,783 1,336 1,205 1,900 3,218 2.0
Thailand 10,828 703 1,148 668 1,041 1,223 823 912 889 692 841 936 952 1.4
SouthKorea 15,963 1,843 1,569 1,193 886 1,003 952 1,454 1,332 1,150 1,342 1,757 1,482 1.4
Others 15,057 1,502 1,355 1,238 992 1,579 689 1,500 1,547 1,048 1,127 1,089 1,391 1.3
SOUTH ASIA 518,085 41,470 35,148 39,804 36,358 43,511 35,793 40,769 42,649 44,853 46,763 45,061 65,906 1.5
India 384,628 31,173 26,320 27,075 26,323 34,167 27,836 29,006 31,220 34,481 36,996 32,243 47,788 1.5
Maldives 79,371 5,662 5,103 8,076 5,791 5,364 4,443 6,458 6,405 5,522 5,121 8,165 13,261 2.0
Pakistan 31,815 2,514 1,826 2,433 2,390 2,333 2,035 3,573 3,133 3,022 2,907 2,838 2,811 1.3
Bangladesh 15,510 1,282 1,331 1,732 1,429 1,104 1,106 1,272 1,360 1,344 1,096 1,112 1,342 1.3
Others 6,761 839 568 488 425 543 373 460 531 484 643 703 704 1.5
AUSTRALASIA 92,003 8,961 4,985 6,299 7,747 4,368 7,093 7,958 6,846 7,151 5,995 7,613 16,987 2.2
Australia 81,281 8,116 4,482 5,575 6,756 3,805 6,360 6,883 5,959 6,310 5,198 6,779 15,058 2.2
NewZealand 10,332 812 472 714 974 531 706 1,011 862 813 765 806 1,866 2.2
Others 390 33 31 10 17 32 27 64 25 28 32 28 63 2.0
TOTAL 2,116,407 219,360 197,517 188,076 160,249 121,891 123,351 205,482 190,928 145,077 152,429 167,511 244,536 1.4
Table5(Contd.)
55Sri Lanka Tourism Development Authority »»» Statistical Report 2017
Table6
PercentageDistributionofTouristArrivalsbyPort–2008to2017
Port 2008 2009 2010 2011 2012 2013 2014 2015 2016 2017
Katunayake(BIA) 99.9 99.9 99.9 99.8 99.7 98.8 98.1 98.6 98.7 98.3
Mattala(MRIA) − − − − − 0.1 0.1 0 0.1 0.65
Total Air 99.9 99.9 99.9 99.8 99.7 98.9 98.2 98.6 98.8 98.95
GalleHarbour − − − − − 0.8 1.4 1.1 0.4 0.53
ColomboHarbour 0.1 0.1 0.1 0.2 0.3 0.3 0.4 0.3 0.8 0.48
OtherPorts − − − − − − − − − 0.04
Total Sea 0.1 0.1 0.1 0.2 0.3 1.1 1.8 1.4 1.2 1.05
Total 100 100 100 100 100 100 100 100 100 100
Table7
TouristArrivalsbyCountryofResidence&ModesofTransport–2017
Country of Residence Arrivals By Air By Sea
NORTH AMERICA 104,375 103,441 934
Canada 46,896 46,681 215
UnitedStates 57,479 56,760 719
LATIN AMERICA & THE CARIBBEAN 6,482 6,370 112
WESTERN EUROPE 680,901 676,063 4,838
Austria 17,466 17,412 54
Belgium 14,616 14,548 68
Denmark 18,647 18,553 94
Finland 7,334 7,323 11
France 97,282 96,837 445
Germany 130,227 129,599 628
Italy 31,428 30,381 1,047
56 Sri Lanka Tourism Development Authority »»» Statistical Report 2017
Country of Residence Arrivals By Air By Sea
Netherlands 51,148 50,989 159
Norway 14,159 14,065 94
Spain 22,361 22,250 111
Sweden 24,275 24,221 54
Switzerland 28,402 28,299 103
UnitedKingdom 201,879 199,914 1,965
Others 21,677 21,672 5
EASTERN EUROPE 161,967 155,024 6,943
Russia 59,191 58,492 699
Ukraine 32,346 30,626 1,720
Others 70,430 65,906 4,524
MIDDLE EAST 95,581 95,476 105
AFRICA 12,703 12,414 289
ASIA 962,395 950,511 11,884
China(P.R.) 268,952 268,113 839
India 384,628 378,502 6,126
Indonesia 25,806 25,576 230
Japan 44,988 44,929 59
SouthKorea 15,963 15,770 193
Malaysia 26,414 26,288 126
Maldives 79,371 79,358 13
Pakistan 31,815 31,641 174
Philippines 16,845 14,260 2,585
Singapore 19,457 19,366 91
Thailand 10,828 10,795 33
Bangladesh 15,510 15,262 248
Others 21,818 20,651 1,167
AUSTRALASIA 92,003 91,464 539
Australia 81,281 80,830 451
NewZealand 10,332 10,264 68
Others 390 370 20
Total 2,116,407 2,090,763 25,644
table7(contd.)
57Sri Lanka Tourism Development Authority »»» Statistical Report 2017
Table8
PercentageDistributionofTouristArrivalsbyDifferentCarriers–2007to2017
Carrier 2006 2007 2008 2009 2010 2011 2012 2013 2014 2015 2016 2017
Inter-RegionalFlights 76.1 77.6 78.1 82.5 81.5 86.2 87.8 86.9 92.3 96 84.7 78.3
Intra-RegionalFlights 22.9 20.6 18.8 16.2 17.4 11.8 11.3 9.7 5.6 2.4 13.5 18.1
CharterFlights 0.9 1.7 3.0 1.2 1.0 1.8 0.6 1.4 0.4 0.2 0.6 2.4
Total Air 99.9 99.9 99.9 99.9 99.9 99.8 99.7 98.0 98.3 98.6 98.8 98.8
PassengerShips* 0.1 0.1 0.1 0.1 0.1 0.2 0.3 0.2 1.7 1.4 1.2 1.2
TOTAL SEA 0.1 0.1 0.1 0.1 0.1 0.2 0.3 0.2 1.7 1.4 1.2 1.2
Total 100.0 100.0 100.0 100.0 100.0 100.0 100.0 100.0 100.0 100.0 100.0 100.0
*Colombo/Hambantota/Norochcholai/Galle/TrincomaleePorts
58 Sri Lanka Tourism Development Authority »»» Statistical Report 2017
Table9
TouristArrivalsbyCountryofResidence&Carrier–2017
Country
Total
Air Asia
Air China
Air India
Air Arabia
Austrian Airlines
Cathay Pacific
China Eastern Airlines
China Southern Airlines
Emirates
Etihad Airways
Fly Dubai
Gulf Air
Himalaya Airline
Jet Airways
Korean Airlines
Kuwait Airways
North
Am
erica
104,
375
3,14
921
52,
380
204
112
4,05
21,
241
232
14,9
004,
691
2,17
837
215
63,
347
1,27
188
8Canada
46,8
961,245
74955
9555
1,733
747135
5,159
2,097
790
155
561,360
461
306
USA
57,4
791,904
1411,425
109
572,319
494
979,741
2,594
1,388
217
1001,987
810
582
Latin
Am
erica
&
The
Carib
bean
6,48
240
138
136
360
546
672
063
522
797
241
8949
20
0
W
este
rn Eu
rope
680,
901
11,6
8529
911
,843
1,06
24,
376
2,94
21,
200
218
183,
937
48,5
3010
,902
5,75
21,
113
15,8
825,
817
8,90
1Austria
17,4
66227
11245
433,101
2527
25,352
929
266
401
5939
34Belgium
14,6
16265
1132
3028
5425
153,112
2,230
224
354
270
142
55Denmark
18,6
47243
6680
1418
2631
04,871
1,550
197
179
2199
64580
France
97,2
821,883
1022,923
130
61315
235
2622,7687,229
1,437
672
1874,810
2,147
1,924
Netherlands
51,1
481,395
4208
4534
177
156
3015,6105,084
491
109
191,636
829
112
Italy
31,4
28434
9609
3163
114
9121
10,1901,623
878
7326
205
1191,199
Norway
14,1
59205
790
155
717
2316
2,743
338
598
367
325
120
148
Spain
22,3
61613
15573
6212
43105
256,896
1,120
486
477
268
172
140
Sweden
24,2
75531
12280
2342
4761
95,132
1,158
183
734
425
146
164
Switzerland
28,4
02353
4194
14155
7229
39,731
2,338
222
614
280
125
177
United Kingdom
201,
8793,443
652,475
257
491,747
207
3353,3456,131
3,691
3,075
4274,441
1,164
3,165
Germany
130,
2271,824
572,216
145
797
230
167
3041,93218,202
7701,172
407
901
6501,135
Others
29,0
11269
61,218
113
975
438
2,255
5981,459
180
182,063
100
68
Ea
ster
n Eu
rope
161,
967
2,90
870
2,56
818
,751
516
504
457
105
29,1
964,
797
27,5
182,
451
481
731
850
510
Russian
Federation
59,1
91749
222,040
8,216
21163
195
4512,6832,185
9,039
1,909
411
215
405
140
Ukraine
32,3
46274
1298
8,049
1636
548
2,017
5527,880
231
12125
111
52Czech Republic
15,7
12232
029
11195
1848
106,186
2125,237
238
2857
75Poland
15,3
46259
10103
89160
2040
142,655
726
960
118
7144
6978
Others
39,3
721,394
262982,386
124
267
120
285,655
1,122
4,402
170
43219
208
165
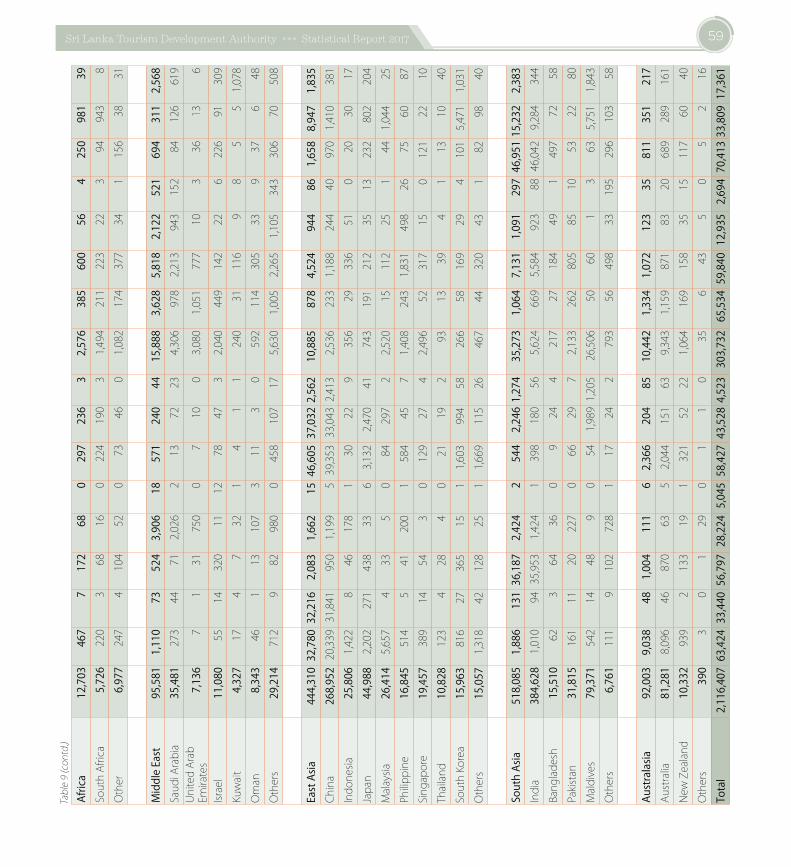
59Sri Lanka Tourism Development Authority »»» Statistical Report 2017
Afric
a12
,703
467
717
268
029
723
63
2,57
638
560
056
425
098
139
SouthAfrica
5,72
6220
368
160
224
190
31,494
211
223
223
94943
8Other
6,97
7247
4104
520
7346
01,082
174
377
341
156
3831
Mid
dle
East
95,5
811,
110
7352
43,
906
1857
124
044
15,8
883,
628
5,81
82,
122
521
694
311
2,56
8SaudiArabia
35,4
81273
4471
2,026
213
7223
4,306
9782,213
943
152
84126
619
UnitedArab
Emirates
7,13
67
131
750
07
100
3,080
1,051
777
103
3613
6
Israel
11,0
8055
14320
1112
7847
32,040
449
142
226
226
91309
Kuwait
4,32
717
47
321
41
1240
31116
98
551,078
Oman
8,34
346
113
107
311
30
592
114
305
339
376
48Others
29,2
14712
982
980
0458
107
175,630
1,005
2,265
1,105
343
306
70508
East
Asia
444,
310
32,7
8032
,216
2,08
31,
662
1546
,605
37,0
322,
562
10,8
8587
84,
524
944
861,
658
8,94
71,
835
China
268,
95220,33931,841
9501,199
539,35333,0432,413
2,536
2331,188
244
409701,410
381
Indonesia
25,8
061,422
846
178
130
229
356
29336
510
2030
17Japan
44,9
882,202
271
438
3363,132
2,470
41743
191
212
3513
232
802
204
Malaysia
26,4
145,657
433
50
84297
22,520
15112
251
441,044
25Philippine
16,8
45514
541
200
1584
457
1,408
2431,831
498
2675
6087
Singapore
19,4
57389
1454
30
129
274
2,496
52317
150
121
2210
Thailand
10,8
28123
428
40
2119
293
1339
41
1310
40SouthKorea
15,9
63816
27365
1511,603
994
58266
58169
294
1015,471
1,031
Others
15,0
571,318
42128
2511,669
115
26467
44320
431
8298
40
So
uth
Asia
518,
085
1,88
613
136
,187
2,42
42
544
2,24
61,
274
35,2
731,
064
7,13
11,
091
297
46,9
5115
,232
2,38
3India
384,
6281,010
9435,9531,424
1398
180
565,624
6695,584
923
8846,0429,284
344
Bangladesh
15,5
1062
364
360
924
4217
27184
491
497
7258
Pakistan
31,8
15161
1120
227
066
297
2,133
262
805
8510
5322
80Maldives
79,3
71542
1448
90
541,9891,205
26,506
5060
13
635,751
1,843
Others
6,76
1111
9102
728
117
242
793
56498
33195
296
103
58
Au
stra
lasia
92,0
039,
038
481,
004
111
62,
366
204
8510
,442
1,33
41,
072
123
3581
135
121
7Australia
81,2
818,096
46870
6352,044
151
639,343
1,159
871
8320
689
289
161
NewZealand
10,3
32939
2133
191
321
5222
1,064
169
158
3515
117
6040
Others
390
30
129
01
10
356
435
05
216
Tota
l2,
116,
407
63,4
2433
,440
56,7
9728
,224
5,04
558
,427
43,5
284,
523
303,
732
65,5
3459
,840
12,9
352,
694
70,4
1333
,809
17,3
61
Table9(contd.)
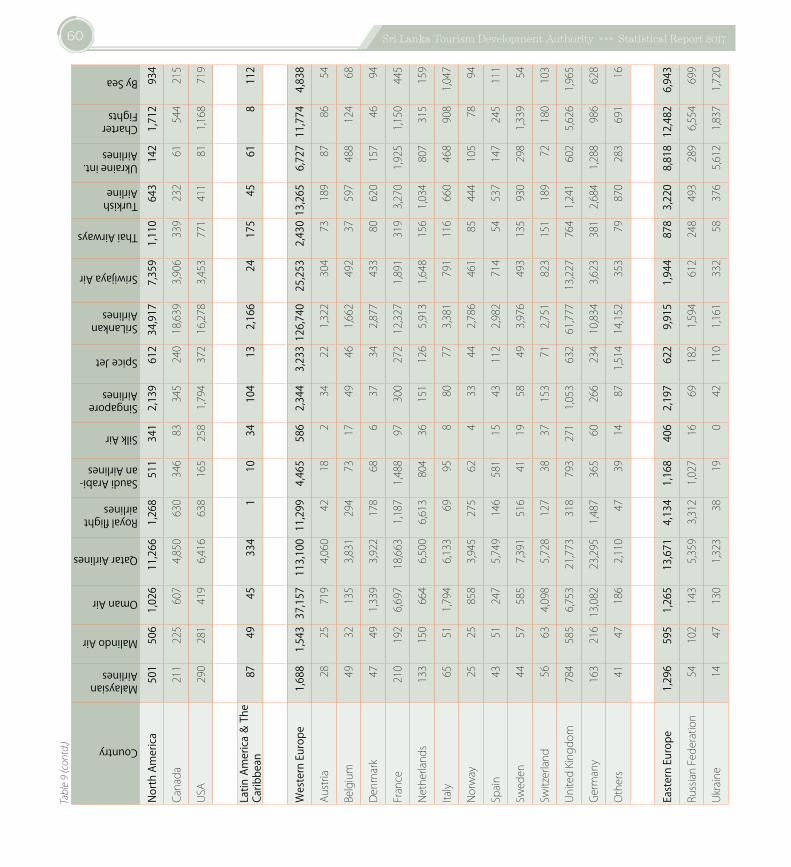
60 Sri Lanka Tourism Development Authority »»» Statistical Report 2017
Country
Malaysian Airlines
Malindo Air
Oman Air
Qatar Airlines
Royal flight airlines
Saudi Arabi-an Airlines
Silk Air
Singapore Airlines
Spice Jet
SriLankan Airlines
Sriwijaya Air
Thai Airways
Turkish Airline
Ukraine int. Airlines
Charter Fights
By Sea
North
Am
erica
501
506
1,02
611
,266
1,26
851
134
12,
139
612
34,9
177,
359
1,11
064
314
21,
712
934
Canada
211
225
607
4,850
630
346
83345
24018,639
3,906
339
232
61544
215
USA
290
281
419
6,416
638
165
2581,794
37216,278
3,453
771
411
811,168
719
La
tin A
mer
ica &
The
Ca
ribbe
an87
4945
334
110
3410
413
2,16
624
175
4561
811
2
Wes
tern
Euro
pe1,
688
1,54
337
,157
113,
100
11,2
994,
465
586
2,34
43,
233
126,
740
25,2
532,
430
13,2
656,
727
11,7
744,
838
Austria
2825
719
4,060
4218
234
221,322
304
73189
8786
54
Belgium
4932
135
3,831
294
7317
4946
1,662
492
37597
488
124
68
Denmark
4749
1,339
3,922
178
686
3734
2,877
433
80620
157
4694
France
210
1926,697
18,6631,187
1,488
97300
27212,327
1,891
3193,270
1,925
1,150
445
Netherlands
133
150
664
6,500
6,613
804
36151
126
5,913
1,648
1561,034
807
315
159
Italy
6551
1,794
6,133
6995
880
773,381
791
116
660
468
9081,047
Norway
2525
858
3,945
275
624
3344
2,786
461
85444
105
7894
Spain
4351
247
5,749
146
581
1543
112
2,982
714
54537
147
245
111
Sweden
4457
585
7,391
516
4119
5849
3,976
493
135
930
2981,339
54
Switzerland
5663
4,098
5,728
127
3837
153
712,751
823
151
189
72180
103
UnitedKingdom
784
5856,753
21,773
318
793
2711,053
63261,77713,227
7641,241
6025,626
1,965
Germany
163
21613,082
23,2951,487
365
60266
23410,834
3,623
3812,684
1,288
986
628
Others
4147
186
2,110
4739
1487
1,514
14,152
353
79870
283
691
16
East
ern
Euro
pe1,
296
595
1,26
513
,671
4,13
41,
168
406
2,19
762
29,
915
1,94
487
83,
220
8,81
812
,482
6,94
3
RussianFederation
54102
143
5,359
3,312
1,027
1669
182
1,594
612
248
493
2896,554
699
Ukraine
1447
130
1,323
3819
042
110
1,161
332
583765,612
1,837
1,720
Table9(contd.)
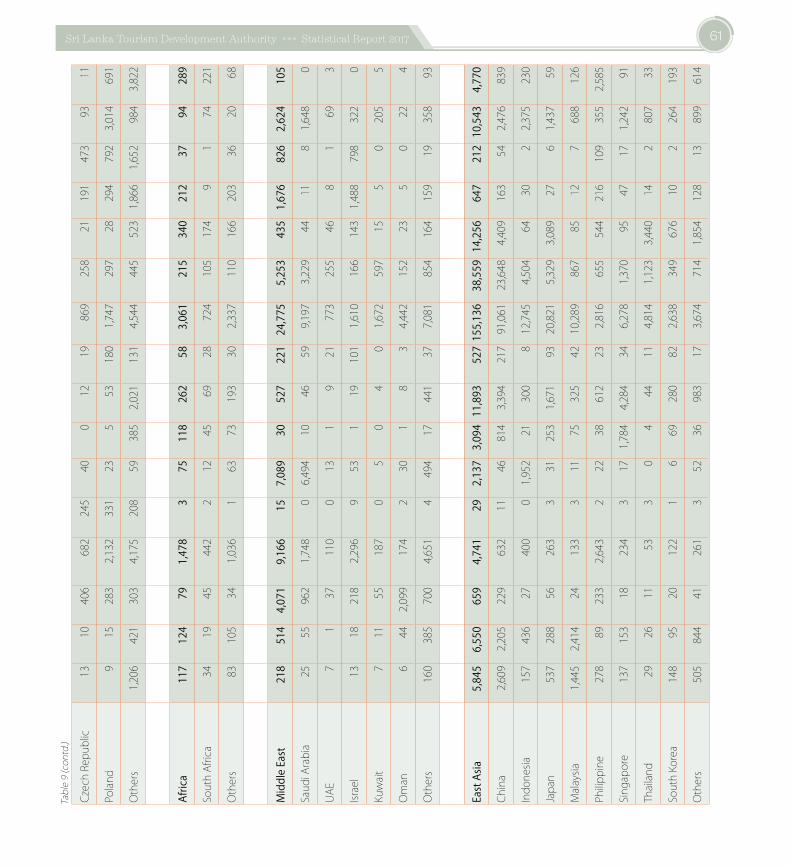
61Sri Lanka Tourism Development Authority »»» Statistical Report 2017
CzechRepublic
1310
406
682
245
400
1219
869
258
21191
473
9311
Poland
915
283
2,132
331
235
53180
1,747
297
28294
7923,014
691
Others
1,206
421
303
4,175
208
593852,021
131
4,544
445
5231,866
1,652
9843,822
Afric
a11
712
479
1,47
83
7511
826
258
3,06
121
534
021
237
9428
9
SouthAfrica
3419
45442
212
4569
28724
105
174
91
74221
Others
83105
341,036
163
73193
302,337
110
166
203
3620
68
Mid
dle
East
218
514
4,07
19,
166
157,
089
3052
722
124
,775
5,25
343
51,
676
826
2,62
410
5
SaudiArabia
2555
962
1,748
06,494
1046
599,197
3,229
4411
81,648
0
UAE
71
37110
013
19
21773
255
468
169
3
Israel
1318
218
2,296
953
119
101
1,610
166
1431,488
798
322
0
Kuwait
711
55187
05
04
01,672
597
155
0205
5
Oman
644
2,099
174
230
18
34,442
152
235
022
4
Others
160
385
700
4,651
4494
17441
377,081
854
164
159
19358
93
East
Asia
5,84
56,
550
659
4,74
129
2,13
73,
094
11,8
9352
715
5,13
638
,559
14,2
5664
721
210
,543
4,77
0
China
2,609
2,205
229
632
1146
8143,394
21791,06123,6484,409
163
542,476
839
Indonesia
157
436
27400
01,952
21300
812,745
4,504
6430
22,375
230
Japan
537
288
56263
331
2531,671
9320,821
5,329
3,089
2761,437
59
Malaysia
1,445
2,414
24133
311
75325
4210,289
867
8512
7688
126
Philippine
278
89233
2,643
222
38612
232,816
655
544
216
109
3552,585
Singapore
137
153
18234
317
1,784
4,284
346,278
1,370
9547
171,242
91
Thailand
2926
1153
30
444
114,814
1,123
3,440
142
807
33
SouthKorea
148
9520
122
16
69280
822,638
349
676
102
264
193
Others
505
844
41261
352
36983
173,674
7141,854
128
13899
614
Table9(contd.)
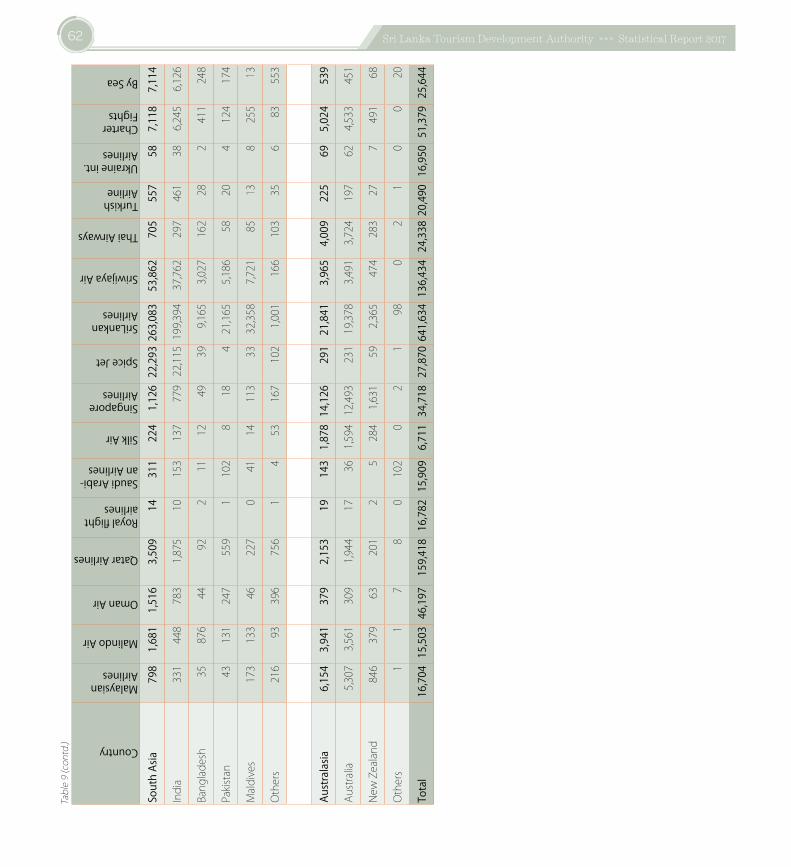
62 Sri Lanka Tourism Development Authority »»» Statistical Report 2017
Country
Malaysian Airlines
Malindo Air
Oman Air
Qatar Airlines
Royal flight airlines
Saudi Arabi-an Airlines
Silk Air
Singapore Airlines
Spice Jet
SriLankan Airlines
Sriwijaya Air
Thai Airways
Turkish Airline
Ukraine int. Airlines
Charter Fights
By Sea
Sout
h As
ia79
81,
681
1,51
63,
509
1431
122
41,
126
22,2
9326
3,08
353
,862
705
557
587,
118
7,11
4
India
331
448
783
1,875
10153
137
77922,115199,394
37,762
297
461
386,245
6,126
Bangladesh
35876
4492
211
1249
399,165
3,027
162
282
411
248
Pakistan
43131
247
559
1102
818
421,165
5,186
5820
4124
174
Maldives
173
133
46227
041
14113
3332,358
7,721
8513
8255
13
Others
216
93396
756
14
53167
102
1,001
166
103
356
83553
Aust
rala
sia6,
154
3,94
137
92,
153
1914
31,
878
14,1
2629
121
,841
3,96
54,
009
225
695,
024
539
Australia
5,307
3,561
309
1,944
1736
1,59412,493
23119,378
3,491
3,724
197
624,533
451
NewZealand
846
379
63201
25
2841,631
592,365
474
283
277
491
68
Others
11
78
0102
02
198
02
10
020
Tota
l16
,704
15,5
0346
,197
159,
418
16,7
8215
,909
6,71
134
,718
27,8
7064
1,63
413
6,43
424
,338
20,4
9016
,950
51,3
7925
,644
Table9(contd.)
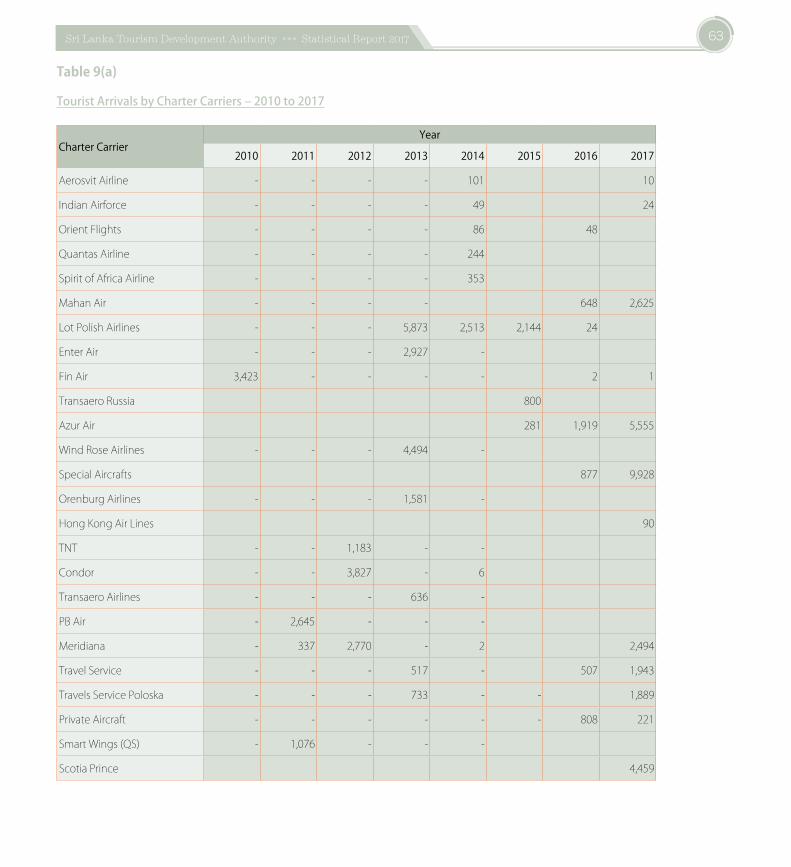
63Sri Lanka Tourism Development Authority »»» Statistical Report 2017
Table9(a)
TouristArrivalsbyCharterCarriers–2010to2017
Charter CarrierYear
2010 2011 2012 2013 2014 2015 2016 2017
AerosvitAirline - - - - 101 10
IndianAirforce - - - - 49 24
OrientFlights - - - - 86 48
QuantasAirline - - - - 244
SpiritofAfricaAirline - - - - 353
MahanAir - - - - 648 2,625
LotPolishAirlines - - - 5,873 2,513 2,144 24
EnterAir - - - 2,927 -
FinAir 3,423 - - - - 2 1
TransaeroRussia 800
AzurAir 281 1,919 5,555
WindRoseAirlines - - - 4,494 -
SpecialAircrafts 877 9,928
OrenburgAirlines - - - 1,581 -
HongKongAirLines 90
TNT - - 1,183 - -
Condor - - 3,827 - 6
TransaeroAirlines - - - 636 -
PBAir - 2,645 - - -
Meridiana - 337 2,770 - 2 2,494
TravelService - - - 517 - 507 1,943
TravelsServicePoloska - - - 733 - - 1,889
PrivateAircraft - - - - - - 808 221
SmartWings(QS) - 1,076 - - -
ScotiaPrince 4,459
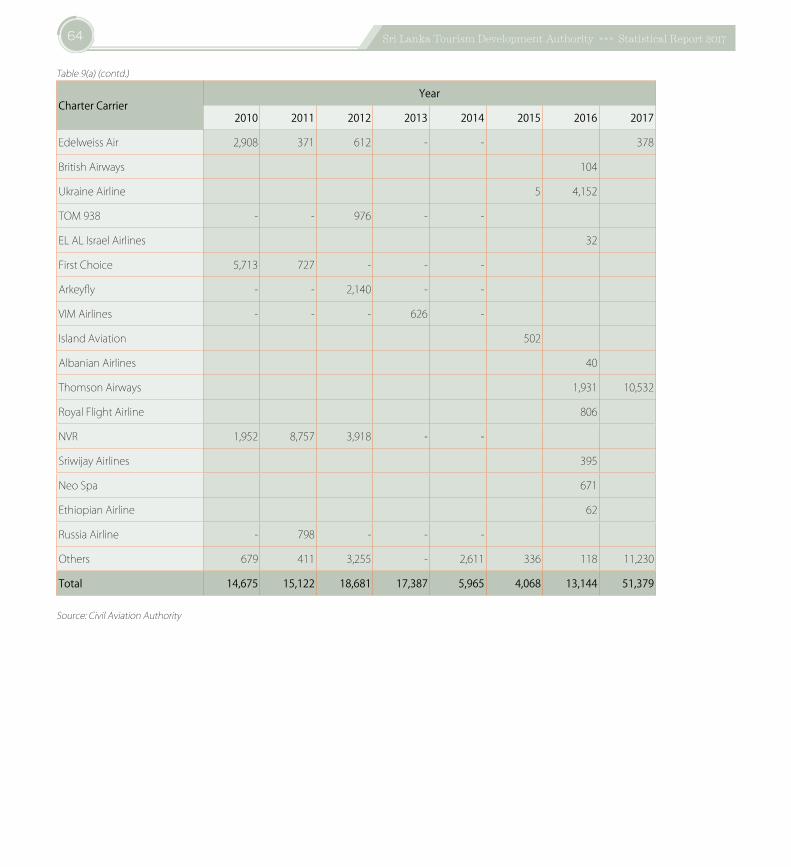
64 Sri Lanka Tourism Development Authority »»» Statistical Report 2017
Charter CarrierYear
2010 2011 2012 2013 2014 2015 2016 2017
EdelweissAir 2,908 371 612 - - 378
BritishAirways 104
UkraineAirline 5 4,152
TOM938 - - 976 - -
ELALIsraelAirlines 32
FirstChoice 5,713 727 - - -
Arkeyfly - - 2,140 - -
VIMAirlines - - - 626 -
IslandAviation 502
AlbanianAirlines 40
ThomsonAirways 1,931 10,532
RoyalFlightAirline 806
NVR 1,952 8,757 3,918 - -
SriwijayAirlines 395
NeoSpa 671
EthiopianAirline 62
RussiaAirline - 798 - - -
Others 679 411 3,255 - 2,611 336 118 11,230
Total 14,675 15,122 18,681 17,387 5,965 4,068 13,144 51,379
Source:CivilAviationAuthority
Table9(a)(contd.)
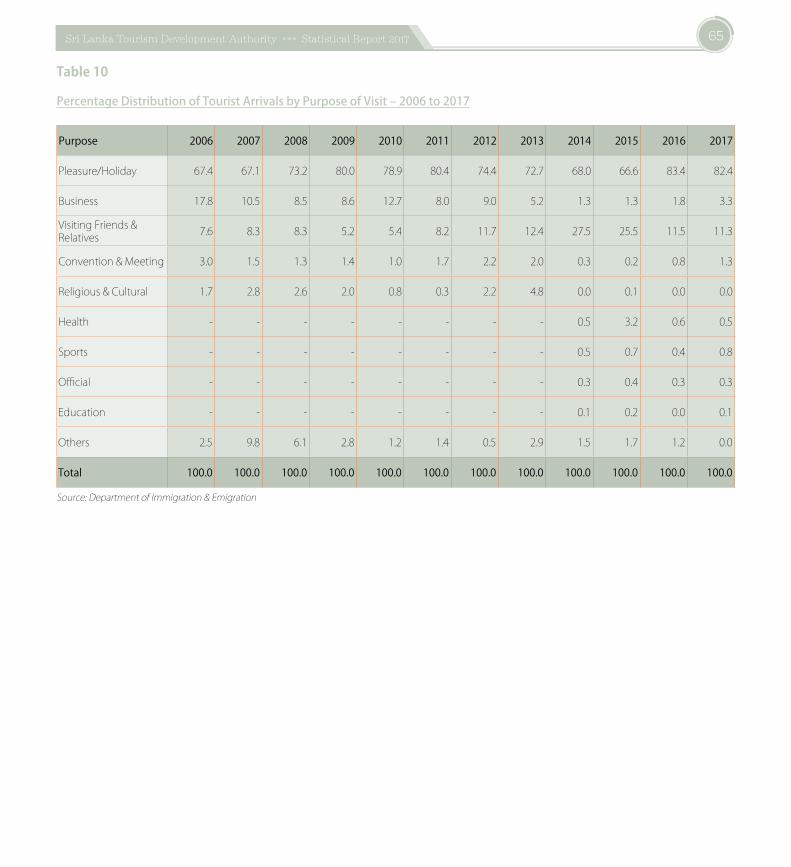
65Sri Lanka Tourism Development Authority »»» Statistical Report 2017
Table10
PercentageDistributionofTouristArrivalsbyPurposeofVisit–2006to2017
Purpose 2006 2007 2008 2009 2010 2011 2012 2013 2014 2015 2016 2017
Pleasure/Holiday 67.4 67.1 73.2 80.0 78.9 80.4 74.4 72.7 68.0 66.6 83.4 82.4
Business 17.8 10.5 8.5 8.6 12.7 8.0 9.0 5.2 1.3 1.3 1.8 3.3
VisitingFriends&Relatives 7.6 8.3 8.3 5.2 5.4 8.2 11.7 12.4 27.5 25.5 11.5 11.3
Convention&Meeting 3.0 1.5 1.3 1.4 1.0 1.7 2.2 2.0 0.3 0.2 0.8 1.3
Religious&Cultural 1.7 2.8 2.6 2.0 0.8 0.3 2.2 4.8 0.0 0.1 0.0 0.0
Health - - - - - - - - 0.5 3.2 0.6 0.5
Sports - - - - - - - - 0.5 0.7 0.4 0.8
Official - - - - - - - - 0.3 0.4 0.3 0.3
Education - - - - - - - - 0.1 0.2 0.0 0.1
Others 2.5 9.8 6.1 2.8 1.2 1.4 0.5 2.9 1.5 1.7 1.2 0.0
Total 100.0 100.0 100.0 100.0 100.0 100.0 100.0 100.0 100.0 100.0 100.0 100.0
Source:DepartmentofImmigration&Emigration
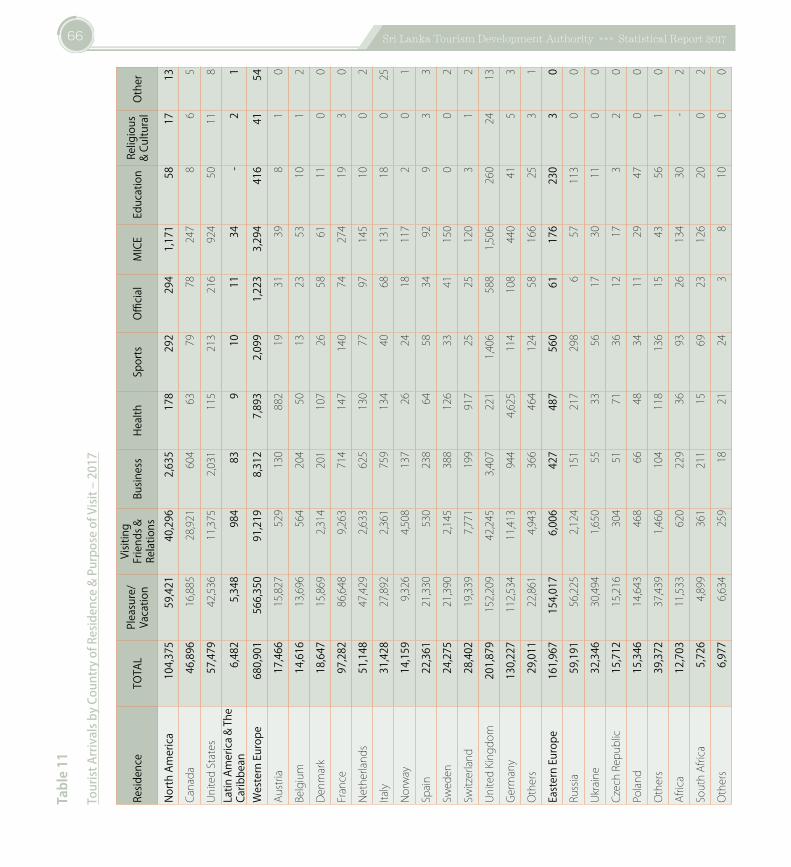
66 Sri Lanka Tourism Development Authority »»» Statistical Report 2017
Table11
TouristArrivalsbyCountryofResidence&PurposeofVisit–2017
Resid
ence
TOTA
LPl
easu
re/
Vaca
tion
Visit
ing
Frie
nds &
Re
latio
nsBu
sines
sHe
alth
Spor
tsOffi
cial
MIC
EEd
ucat
ion
Relig
ious
&
Cultu
ral
Othe
r
North
Am
erica
1
04,3
75
59,
421
40,
296
2,63
5
1
78
292
2
94
1
,171
58
1
7
1
3
Canada
46,
896 16,88528,9216046379
78247865
UnitedStates
57,
479 42,53611,3752,03111521321692450118
Latin
Am
erica
& Th
e Ca
ribbe
an6,
482
5,
348
9
84
8
3
9
1
0
1
1
34
-
2
1
Wes
tern
Euro
pe68
0,90
1
566
,350
9
1,21
9
8,
312
7,89
3
2,
099
1
,223
3,2
94
41
6
41
54
Austria
17,4
6615,82752913088219
313981
0
Belgium
14,6
1613,6965642045013
23531012
Denmark
18,6
4715,8692,31420110726
586111
00
France
97,2
8286,6489,2637141471407427419
30
Netherlands
51,1
4847,4292,63362513077
9714510
02
Italy
31,4
2827,8922,36175913440
6813118
025
Norway
14,1
599,3264,5081372624
181172
01
Spain
22,3
6121,3305302386458
34929
33
Sweden
24,2
7521,3902,14538812633
41150
002
Switzerland
28,4
0219,3397,77119991725
25120312
UnitedKingdom
201,
879152,20942,2453,4072211,4065881,5062602413
Germany
130,
227112,53411,4139444,6251141084404153
Others
29,0
1122,8614,943366464124581662531
East
ern
Euro
pe16
1,96
7
154
,017
6
,006
4
27
487
5
60
61
176
230
3 0
Russia
59,1
9156,2252,124151217298657113
00
Ukraine
32,3
4630,4941,650553356
173011
00
CzechRepublic
15,7
1215,216304517136
12173
20
Poland
15,3
4614,643468664834
112947
00
Others
39,3
7237,4391,460104118136154356
10
Africa
12,7
0311,5336202293693
2613430
-2
SouthAfrica
5,72
64,8993612111569
2312620
02
Others
6,97
76,634259182124
3810
00
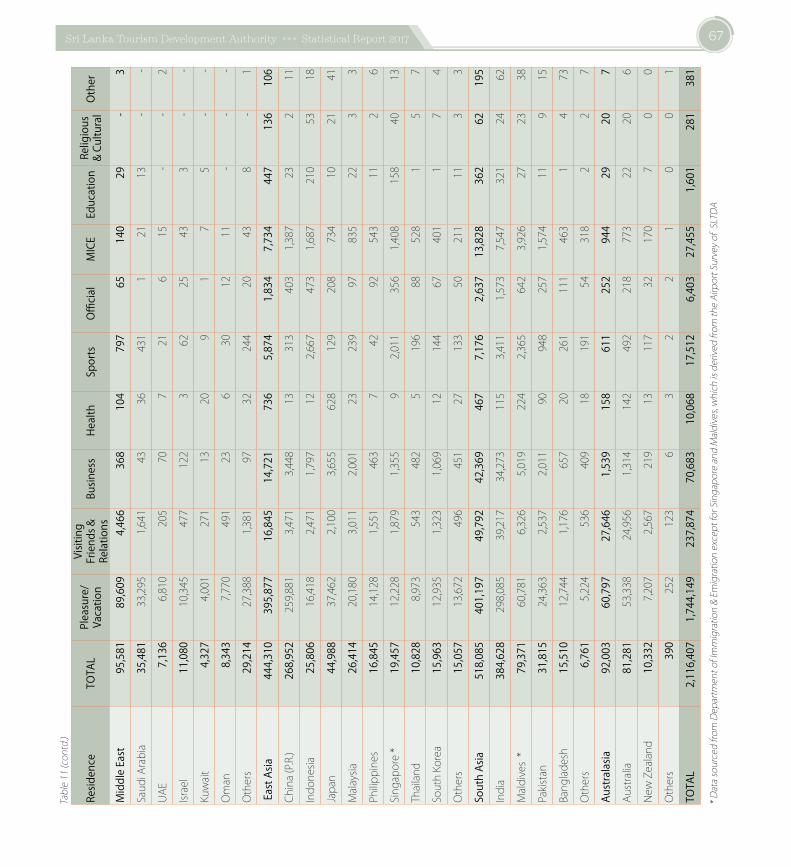
67Sri Lanka Tourism Development Authority »»» Statistical Report 2017
Resid
ence
TOTA
LPl
easu
re/
Vaca
tion
Visit
ing
Frie
nds &
Re
latio
nsBu
sines
sHe
alth
Spor
tsOffi
cial
MIC
EEd
ucat
ion
Relig
ious
&
Cultu
ral
Othe
r
Mid
dle
East
95,5
81
8
9,60
9
4
,466
3
68
104
7
97
65
140
29
-
3
SaudiArabia
35,4
8133,2951,641433643112113
--
UAE
7,13
66,81020570
721
615--2
Israel
11,0
8010,345477122362
25433
--
Kuwait
4,32
74,0012711320
9175
--
Oman
8,34
37,77049123
630
1211---
Others
29,2
1427,3881,381973224420438
-1
East
Asia
44
4,31
0
395
,877
1
6,84
5
14,
721
736
5,
874
1
,834
7,7
34
44
7
1
36
1
06
China(P.R.)
268,
952259,8813,4713,448133134031,38723211
Indonesia
25,8
0616,4182,4711,797122,6674731,6872105318
Japan
44,9
8837,4622,1003,655628129208734102141
Malaysia
26,4
1420,1803,0112,00123239978352233
Philippines
16,8
4514,1281,551463742
925431126
Singapore*
19,4
5712,2281,8791,35592,0113561,4081584013
Thailand
10,8
288,973543482519688528157
SouthKorea
15,9
6312,9351,3231,0691214467401174
Others
15,0
5713,67249645127133502111133
Sout
h As
ia51
8,08
5
401
,197
4
9,79
2
42,
369
467
7,
176
2
,637
13,8
28
36
2
62
1
95
India
384,
628298,08539,21734,2731153,4111,5737,5473212462
Maldives*
79,3
7160,7816,3265,0192242,3656423,926272338
Pakistan
31,8
1524,3632,5372,011909482571,57411915
Bangladesh
15,5
1012,7441,176657202611114631473
Others
6,76
15,2245364091819154318227
Aust
rala
sia92
,003
60,
797
27,
646
1,53
9
1
58
611
2
52
944
29
2
0
7
Australia
81,2
8153,338
24,956
1,314
142
492
218
773
2220
6
NewZealand
10,3
327,207
2,567
219
13117
32170
70
0
Others
390
252
123
63
22
10
01
TOTA
L
2,11
6,40
7
1,7
44,1
49
2
37,8
74
7
0,68
3
10,
068
1
7,51
2
6,4
03
27
,455
1
,601
2
81
3
81
*DatasourcedfromDepartmentofImmigration&EmigrationexceptforSingaporeandMaldives,whichisderivedfromtheAirportSurveyofSLTDA
Table11(contd.)
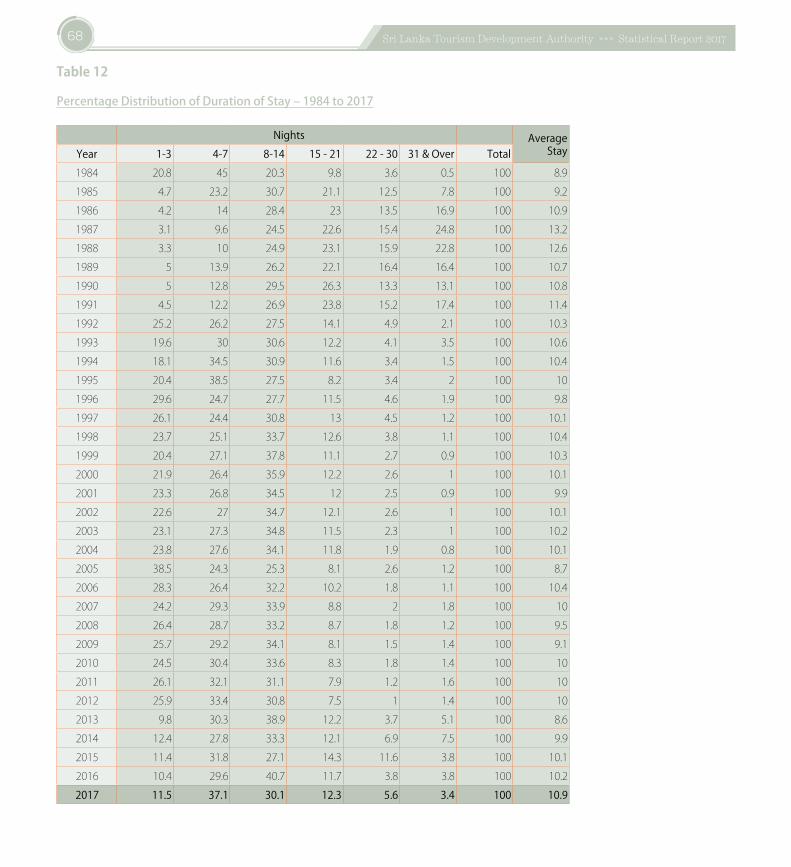
68 Sri Lanka Tourism Development Authority »»» Statistical Report 2017
Table12
PercentageDistributionofDurationofStay–1984to2017
Nights AverageStayYear 1-3 4-7 8-14 15 - 21 22 - 30 31 & Over Total
1984 20.8 45 20.3 9.8 3.6 0.5 100 8.91985 4.7 23.2 30.7 21.1 12.5 7.8 100 9.21986 4.2 14 28.4 23 13.5 16.9 100 10.91987 3.1 9.6 24.5 22.6 15.4 24.8 100 13.21988 3.3 10 24.9 23.1 15.9 22.8 100 12.61989 5 13.9 26.2 22.1 16.4 16.4 100 10.71990 5 12.8 29.5 26.3 13.3 13.1 100 10.81991 4.5 12.2 26.9 23.8 15.2 17.4 100 11.41992 25.2 26.2 27.5 14.1 4.9 2.1 100 10.31993 19.6 30 30.6 12.2 4.1 3.5 100 10.61994 18.1 34.5 30.9 11.6 3.4 1.5 100 10.41995 20.4 38.5 27.5 8.2 3.4 2 100 101996 29.6 24.7 27.7 11.5 4.6 1.9 100 9.81997 26.1 24.4 30.8 13 4.5 1.2 100 10.11998 23.7 25.1 33.7 12.6 3.8 1.1 100 10.41999 20.4 27.1 37.8 11.1 2.7 0.9 100 10.32000 21.9 26.4 35.9 12.2 2.6 1 100 10.12001 23.3 26.8 34.5 12 2.5 0.9 100 9.92002 22.6 27 34.7 12.1 2.6 1 100 10.12003 23.1 27.3 34.8 11.5 2.3 1 100 10.22004 23.8 27.6 34.1 11.8 1.9 0.8 100 10.12005 38.5 24.3 25.3 8.1 2.6 1.2 100 8.72006 28.3 26.4 32.2 10.2 1.8 1.1 100 10.42007 24.2 29.3 33.9 8.8 2 1.8 100 102008 26.4 28.7 33.2 8.7 1.8 1.2 100 9.52009 25.7 29.2 34.1 8.1 1.5 1.4 100 9.12010 24.5 30.4 33.6 8.3 1.8 1.4 100 102011 26.1 32.1 31.1 7.9 1.2 1.6 100 102012 25.9 33.4 30.8 7.5 1 1.4 100 102013 9.8 30.3 38.9 12.2 3.7 5.1 100 8.62014 12.4 27.8 33.3 12.1 6.9 7.5 100 9.92015 11.4 31.8 27.1 14.3 11.6 3.8 100 10.12016 10.4 29.6 40.7 11.7 3.8 3.8 100 10.22017 11.5 37.1 30.1 12.3 5.6 3.4 100 10.9
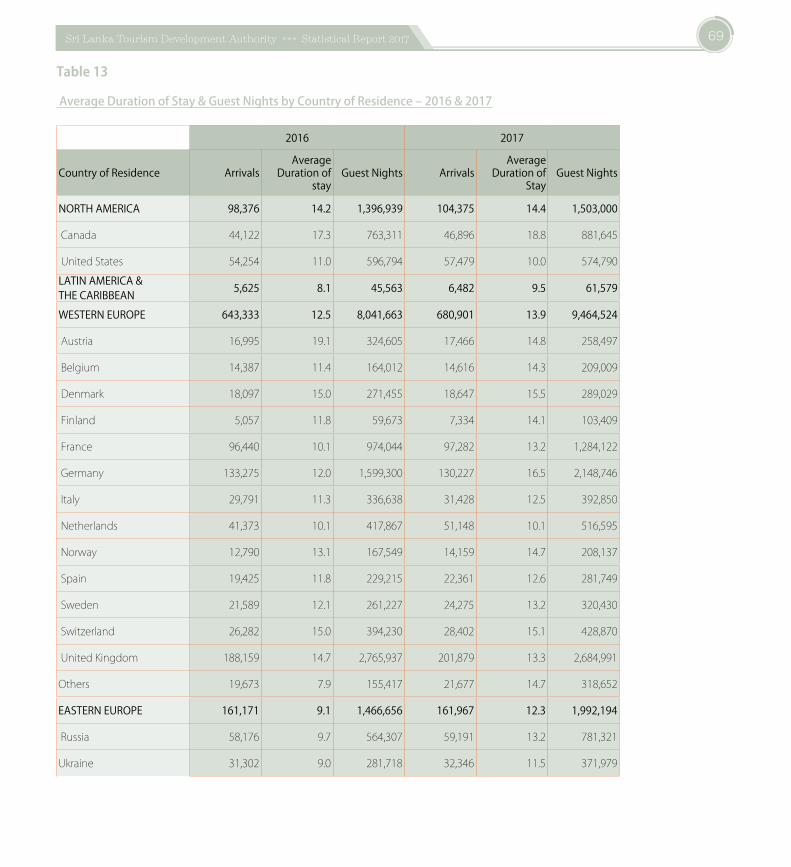
69Sri Lanka Tourism Development Authority »»» Statistical Report 2017
Table13
AverageDurationofStay&GuestNightsbyCountryofResidence–2016&2017
2016 2017
Country of Residence ArrivalsAverage
Duration of stay
Guest Nights ArrivalsAverage
Duration of Stay
Guest Nights
NORTH AMERICA 98,376 14.2 1,396,939 104,375 14.4 1,503,000
Canada 44,122 17.3 763,311 46,896 18.8 881,645
UnitedStates 54,254 11.0 596,794 57,479 10.0 574,790LATIN AMERICA & THE CARIBBEAN 5,625 8.1 45,563 6,482 9.5 61,579
WESTERN EUROPE 643,333 12.5 8,041,663 680,901 13.9 9,464,524
Austria 16,995 19.1 324,605 17,466 14.8 258,497
Belgium 14,387 11.4 164,012 14,616 14.3 209,009
Denmark 18,097 15.0 271,455 18,647 15.5 289,029
Finland 5,057 11.8 59,673 7,334 14.1 103,409
France 96,440 10.1 974,044 97,282 13.2 1,284,122
Germany 133,275 12.0 1,599,300 130,227 16.5 2,148,746
Italy 29,791 11.3 336,638 31,428 12.5 392,850
Netherlands 41,373 10.1 417,867 51,148 10.1 516,595
Norway 12,790 13.1 167,549 14,159 14.7 208,137
Spain 19,425 11.8 229,215 22,361 12.6 281,749
Sweden 21,589 12.1 261,227 24,275 13.2 320,430
Switzerland 26,282 15.0 394,230 28,402 15.1 428,870
UnitedKingdom 188,159 14.7 2,765,937 201,879 13.3 2,684,991
Others 19,673 7.9 155,417 21,677 14.7 318,652
EASTERN EUROPE 161,171 9.1 1,466,656 161,967 12.3 1,992,194
Russia 58,176 9.7 564,307 59,191 13.2 781,321
Ukraine 31,302 9.0 281,718 32,346 11.5 371,979
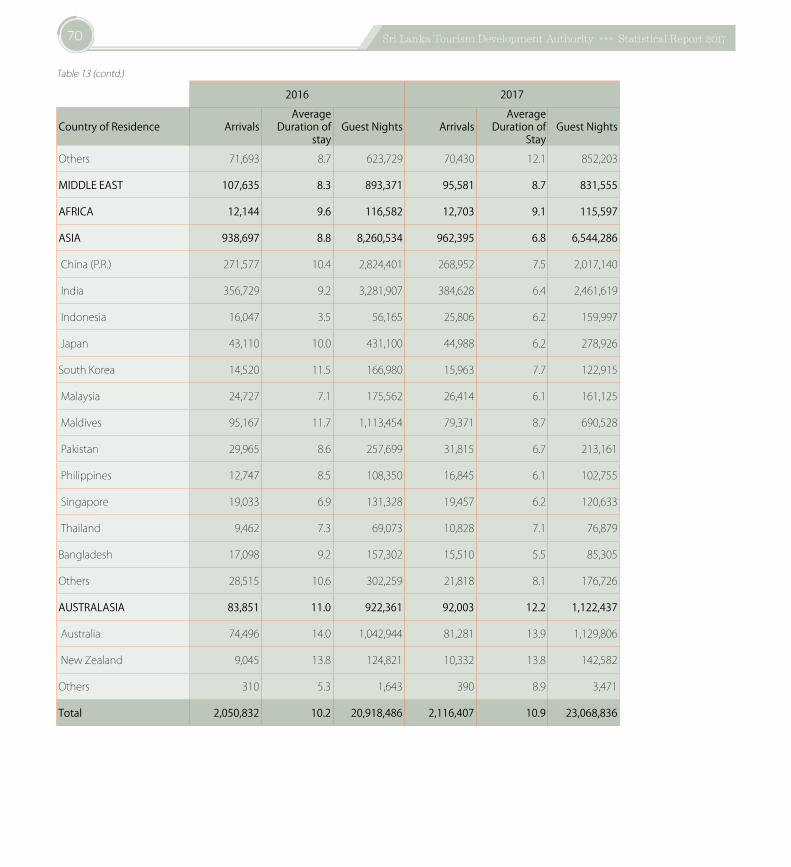
70 Sri Lanka Tourism Development Authority »»» Statistical Report 2017
2016 2017
Country of Residence ArrivalsAverage
Duration of stay
Guest Nights ArrivalsAverage
Duration of Stay
Guest Nights
Others 71,693 8.7 623,729 70,430 12.1 852,203
MIDDLE EAST 107,635 8.3 893,371 95,581 8.7 831,555
AFRICA 12,144 9.6 116,582 12,703 9.1 115,597
ASIA 938,697 8.8 8,260,534 962,395 6.8 6,544,286
China(P.R.) 271,577 10.4 2,824,401 268,952 7.5 2,017,140
India 356,729 9.2 3,281,907 384,628 6.4 2,461,619
Indonesia 16,047 3.5 56,165 25,806 6.2 159,997
Japan 43,110 10.0 431,100 44,988 6.2 278,926
SouthKorea 14,520 11.5 166,980 15,963 7.7 122,915
Malaysia 24,727 7.1 175,562 26,414 6.1 161,125
Maldives 95,167 11.7 1,113,454 79,371 8.7 690,528
Pakistan 29,965 8.6 257,699 31,815 6.7 213,161
Philippines 12,747 8.5 108,350 16,845 6.1 102,755
Singapore 19,033 6.9 131,328 19,457 6.2 120,633
Thailand 9,462 7.3 69,073 10,828 7.1 76,879
Bangladesh 17,098 9.2 157,302 15,510 5.5 85,305
Others 28,515 10.6 302,259 21,818 8.1 176,726
AUSTRALASIA 83,851 11.0 922,361 92,003 12.2 1,122,437
Australia 74,496 14.0 1,042,944 81,281 13.9 1,129,806
NewZealand 9,045 13.8 124,821 10,332 13.8 142,582
Others 310 5.3 1,643 390 8.9 3,471
Total 2,050,832 10.2 20,918,486 2,116,407 10.9 23,068,836
Table13(contd.)
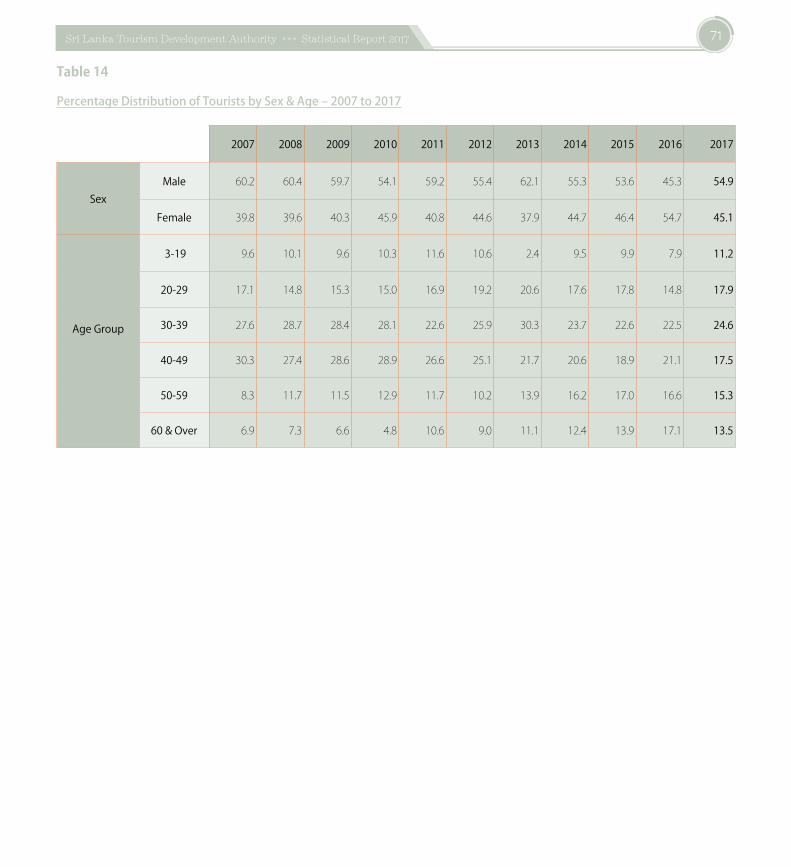
71Sri Lanka Tourism Development Authority »»» Statistical Report 2017
Table14
PercentageDistributionofTouristsbySex&Age–2007to2017
2007 2008 2009 2010 2011 2012 2013 2014 2015 2016 2017
SexMale 60.2 60.4 59.7 54.1 59.2 55.4 62.1 55.3 53.6 45.3 54.9
Female 39.8 39.6 40.3 45.9 40.8 44.6 37.9 44.7 46.4 54.7 45.1
Age Group
3-19 9.6 10.1 9.6 10.3 11.6 10.6 2.4 9.5 9.9 7.9 11.2
20-29 17.1 14.8 15.3 15.0 16.9 19.2 20.6 17.6 17.8 14.8 17.9
30-39 27.6 28.7 28.4 28.1 22.6 25.9 30.3 23.7 22.6 22.5 24.6
40-49 30.3 27.4 28.6 28.9 26.6 25.1 21.7 20.6 18.9 21.1 17.5
50-59 8.3 11.7 11.5 12.9 11.7 10.2 13.9 16.2 17.0 16.6 15.3
60 & Over 6.9 7.3 6.6 4.8 10.6 9.0 11.1 12.4 13.9 17.1 13.5
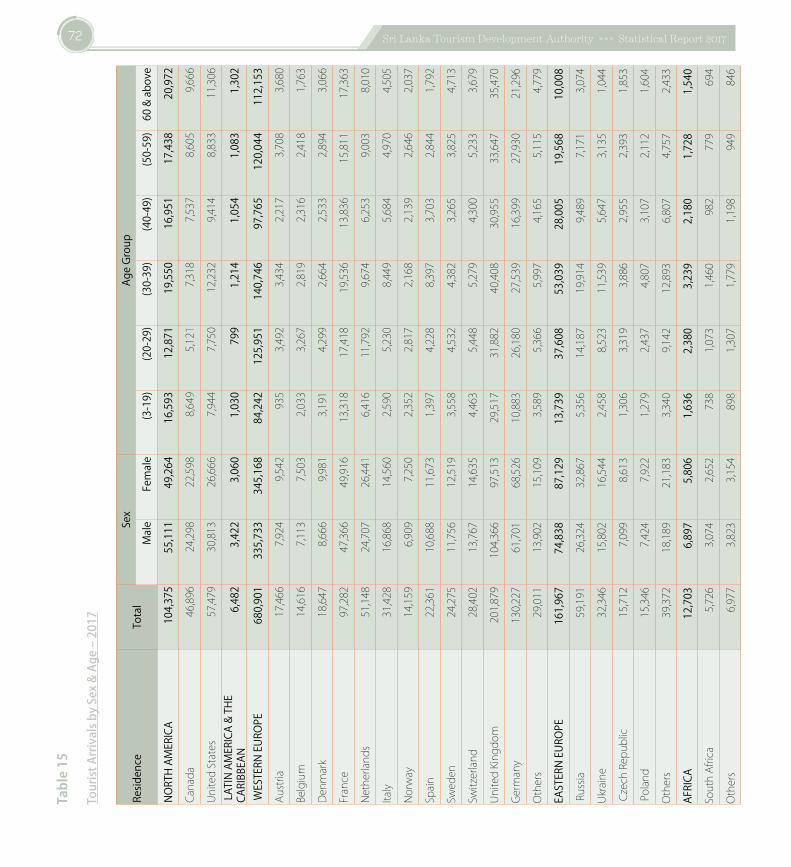
72 Sri Lanka Tourism Development Authority »»» Statistical Report 2017
Table15
TouristArrivalsbySex&Age–2017
Resid
ence
Tota
lSe
xAg
e Gr
oup
Mal
eFe
mal
e(3
-19)
(20-
29)
(30-
39)
(40-
49)
(50-
59)
60 &
abov
e
NORT
H AM
ERIC
A 10
4,37
555
,111
49,2
6416
,593
12,8
7119
,550
16,9
5117
,438
20,9
72
Canada
46,896
24,298
22,598
8,649
5,121
7,318
7,537
8,605
9,666
UnitedStates
57,479
30,813
26,666
7,944
7,750
12,232
9,414
8,833
11,306
LATI
N AM
ERIC
A &
THE
CARI
BBEA
N6,
482
3,42
23,
060
1,03
079
91,
214
1,05
41,
083
1,30
2
WES
TERN
EURO
PE68
0,90
133
5,73
334
5,16
884
,242
125,
951
140,
746
97,7
6512
0,04
411
2,15
3
Austria
17,466
7,924
9,542
935
3,492
3,434
2,217
3,708
3,680
Belgium
14,616
7,113
7,503
2,033
3,267
2,819
2,316
2,418
1,763
Denmark
18,647
8,666
9,981
3,191
4,299
2,664
2,533
2,894
3,066
France
97,282
47,366
49,916
13,318
17,418
19,536
13,836
15,811
17,363
Netherlands
51,148
24,707
26,441
6,416
11,792
9,674
6,253
9,003
8,010
Italy
31,428
16,868
14,560
2,590
5,230
8,449
5,684
4,970
4,505
Norway
14,159
6,909
7,250
2,352
2,817
2,168
2,139
2,646
2,037
Spain
22,361
10,688
11,673
1,397
4,228
8,397
3,703
2,844
1,792
Sweden
24,275
11,756
12,519
3,558
4,532
4,382
3,265
3,825
4,713
Switzerland
28,402
13,767
14,635
4,463
5,448
5,279
4,300
5,233
3,679
UnitedKingdom
201,879
104,366
97,513
29,517
31,882
40,408
30,955
33,647
35,470
Germany
130,227
61,701
68,526
10,883
26,180
27,539
16,399
27,930
21,296
Others
29,011
13,902
15,109
3,589
5,366
5,997
4,165
5,115
4,779
EAST
ERN
EURO
PE
161,
967
74,8
3887
,129
13,7
3937
,608
53,0
3928
,005
19,5
6810
,008
Russia
59,191
26,324
32,867
5,356
14,187
19,914
9,489
7,171
3,074
Ukraine
32,346
15,802
16,544
2,458
8,523
11,539
5,647
3,135
1,044
CzechRepublic
15,712
7,099
8,613
1,306
3,319
3,886
2,955
2,393
1,853
Poland
15,346
7,424
7,922
1,279
2,437
4,807
3,107
2,112
1,604
Others
39,372
18,189
21,183
3,340
9,142
12,893
6,807
4,757
2,433
AFRI
CA12
,703
6,89
75,
806
1,63
62,
380
3,23
92,
180
1,72
81,
540
SouthAfrica
5,726
3,074
2,652
738
1,073
1,460
982
779
694
Others
6,977
3,823
3,154
898
1,307
1,779
1,198
949
846
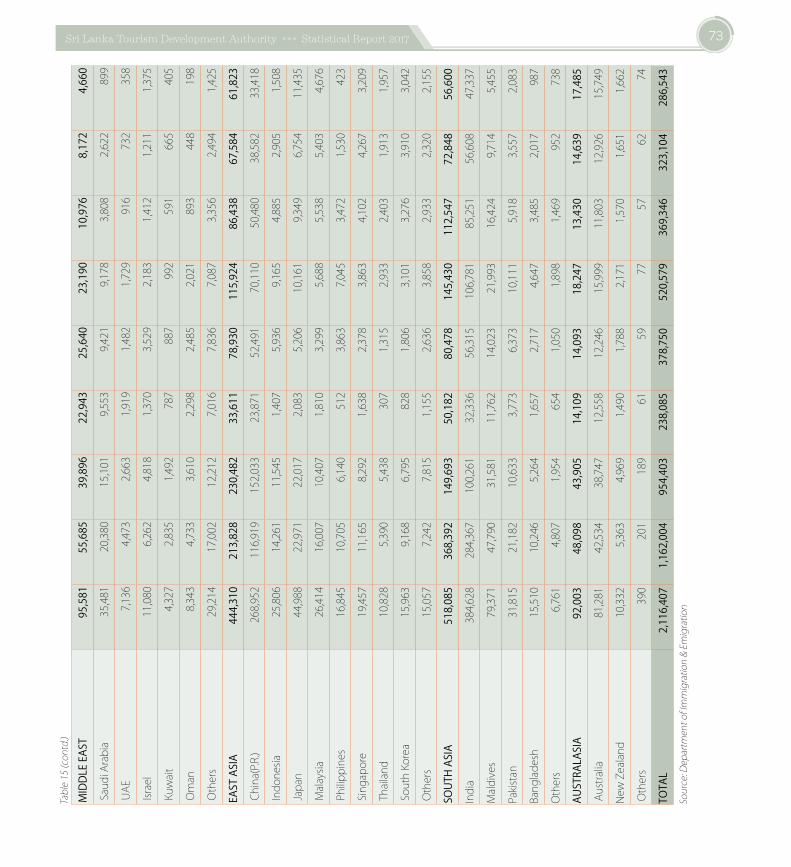
73Sri Lanka Tourism Development Authority »»» Statistical Report 2017
MID
DLE E
AST
95,5
8155
,685
39,8
9622
,943
25,6
4023
,190
10,9
768,
172
4,66
0
SaudiArabia
35,481
20,380
15,101
9,553
9,421
9,178
3,808
2,622
899
UAE
7,136
4,473
2,663
1,919
1,482
1,729
916
732
358
Israel
11,080
6,262
4,818
1,370
3,529
2,183
1,412
1,211
1,375
Kuwait
4,327
2,835
1,492
787
887
992
591
665
405
Oman
8,343
4,733
3,610
2,298
2,485
2,021
893
448
198
Others
29,214
17,002
12,212
7,016
7,836
7,087
3,356
2,494
1,425
EAST
ASI
A 44
4,31
021
3,82
823
0,48
233
,611
78,9
3011
5,92
486
,438
67,5
8461
,823
China(P.R.)
268,952
116,919
152,033
23,871
52,491
70,110
50,480
38,582
33,418
Indonesia
25,806
14,261
11,545
1,407
5,936
9,165
4,885
2,905
1,508
Japan
44,988
22,971
22,017
2,083
5,206
10,161
9,349
6,754
11,435
Malaysia
26,414
16,007
10,407
1,810
3,299
5,688
5,538
5,403
4,676
Philippines
16,845
10,705
6,140
512
3,863
7,045
3,472
1,530
423
Singapore
19,457
11,165
8,292
1,638
2,378
3,863
4,102
4,267
3,209
Thailand
10,828
5,390
5,438
307
1,315
2,933
2,403
1,913
1,957
SouthKorea
15,963
9,168
6,795
828
1,806
3,101
3,276
3,910
3,042
Others
15,057
7,242
7,815
1,155
2,636
3,858
2,933
2,320
2,155
SOUT
H AS
IA
518,
085
368,
392
149,
693
50,1
8280
,478
145,
430
112,
547
72,8
4856
,600
India
384,628
284,367
100,261
32,336
56,315
106,781
85,251
56,608
47,337
Maldives
79,371
47,790
31,581
11,762
14,023
21,993
16,424
9,714
5,455
Pakistan
31,815
21,182
10,633
3,773
6,373
10,111
5,918
3,557
2,083
Bangladesh
15,510
10,246
5,264
1,657
2,717
4,647
3,485
2,017
987
Others
6,761
4,807
1,954
654
1,050
1,898
1,469
952
738
AUST
RALA
SIA
92,0
0348
,098
43,9
0514
,109
14,0
9318
,247
13,4
3014
,639
17,4
85
Australia
81,281
42,534
38,747
12,558
12,246
15,999
11,803
12,926
15,749
NewZealand
10,332
5,363
4,969
1,490
1,788
2,171
1,570
1,651
1,662
Others
390
201
189
6159
7757
6274
TOTA
L 2,
116,
407
1,16
2,00
495
4,40
323
8,08
537
8,75
052
0,57
936
9,34
632
3,10
428
6,54
3Source:DepartmentofImmigration&Emigration
Table15(contd.)
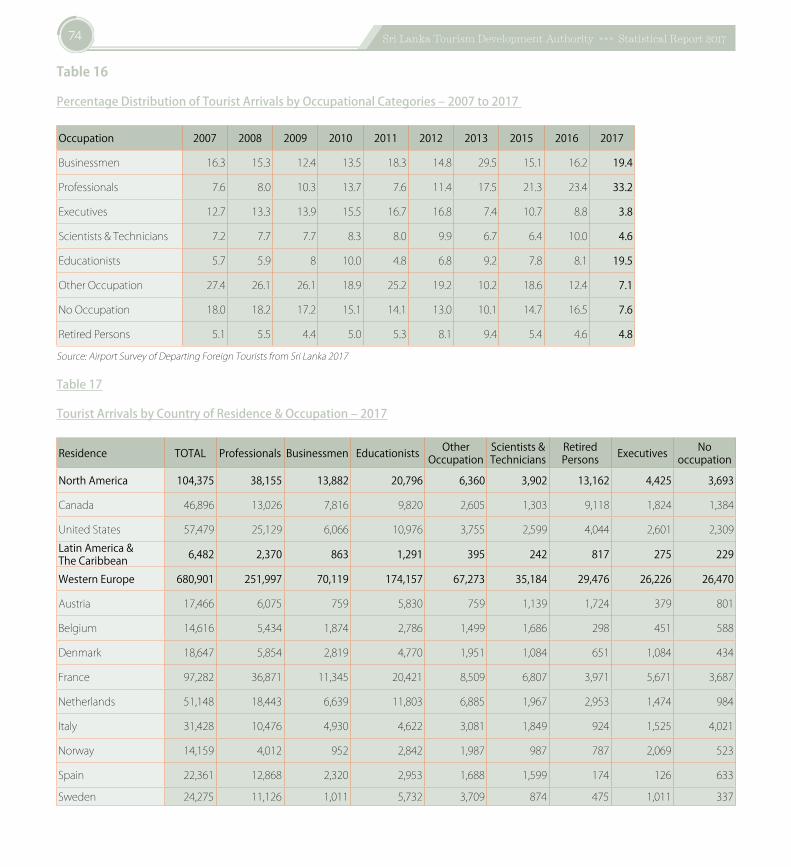
74 Sri Lanka Tourism Development Authority »»» Statistical Report 2017
Table16
PercentageDistributionofTouristArrivalsbyOccupationalCategories–2007to2017
Occupation 2007 2008 2009 2010 2011 2012 2013 2015 2016 2017
Businessmen 16.3 15.3 12.4 13.5 18.3 14.8 29.5 15.1 16.2 19.4
Professionals 7.6 8.0 10.3 13.7 7.6 11.4 17.5 21.3 23.4 33.2
Executives 12.7 13.3 13.9 15.5 16.7 16.8 7.4 10.7 8.8 3.8
Scientists&Technicians 7.2 7.7 7.7 8.3 8.0 9.9 6.7 6.4 10.0 4.6
Educationists 5.7 5.9 8 10.0 4.8 6.8 9.2 7.8 8.1 19.5
OtherOccupation 27.4 26.1 26.1 18.9 25.2 19.2 10.2 18.6 12.4 7.1
NoOccupation 18.0 18.2 17.2 15.1 14.1 13.0 10.1 14.7 16.5 7.6
RetiredPersons 5.1 5.5 4.4 5.0 5.3 8.1 9.4 5.4 4.6 4.8
Source:AirportSurveyofDepartingForeignTouristsfromSriLanka2017
Table17
TouristArrivalsbyCountryofResidence&Occupation–2017
Residence TOTAL Professionals Businessmen Educationists Other Occupation
Scientists & Technicians
Retired Persons Executives No
occupation
North America 104,375 38,155 13,882 20,796 6,360 3,902 13,162 4,425 3,693
Canada 46,896 13,026 7,816 9,820 2,605 1,303 9,118 1,824 1,384
UnitedStates 57,479 25,129 6,066 10,976 3,755 2,599 4,044 2,601 2,309Latin America &The Caribbean 6,482 2,370 863 1,291 395 242 817 275 229
Western Europe 680,901 251,997 70,119 174,157 67,273 35,184 29,476 26,226 26,470
Austria 17,466 6,075 759 5,830 759 1,139 1,724 379 801
Belgium 14,616 5,434 1,874 2,786 1,499 1,686 298 451 588
Denmark 18,647 5,854 2,819 4,770 1,951 1,084 651 1,084 434
France 97,282 36,871 11,345 20,421 8,509 6,807 3,971 5,671 3,687
Netherlands 51,148 18,443 6,639 11,803 6,885 1,967 2,953 1,474 984
Italy 31,428 10,476 4,930 4,622 3,081 1,849 924 1,525 4,021
Norway 14,159 4,012 952 2,842 1,987 987 787 2,069 523
Spain 22,361 12,868 2,320 2,953 1,688 1,599 174 126 633
Sweden 24,275 11,126 1,011 5,732 3,709 874 475 1,011 337
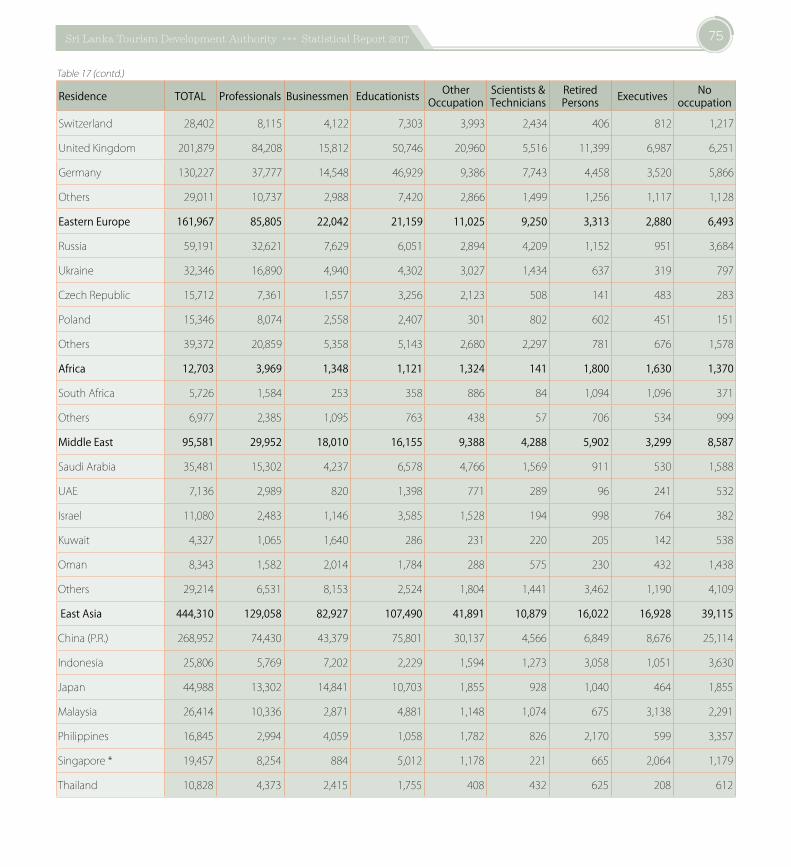
75Sri Lanka Tourism Development Authority »»» Statistical Report 2017
Residence TOTAL Professionals Businessmen Educationists Other Occupation
Scientists & Technicians
Retired Persons Executives No
occupation
Switzerland 28,402 8,115 4,122 7,303 3,993 2,434 406 812 1,217
UnitedKingdom 201,879 84,208 15,812 50,746 20,960 5,516 11,399 6,987 6,251
Germany 130,227 37,777 14,548 46,929 9,386 7,743 4,458 3,520 5,866
Others 29,011 10,737 2,988 7,420 2,866 1,499 1,256 1,117 1,128
Eastern Europe 161,967 85,805 22,042 21,159 11,025 9,250 3,313 2,880 6,493
Russia 59,191 32,621 7,629 6,051 2,894 4,209 1,152 951 3,684
Ukraine 32,346 16,890 4,940 4,302 3,027 1,434 637 319 797
CzechRepublic 15,712 7,361 1,557 3,256 2,123 508 141 483 283
Poland 15,346 8,074 2,558 2,407 301 802 602 451 151
Others 39,372 20,859 5,358 5,143 2,680 2,297 781 676 1,578
Africa 12,703 3,969 1,348 1,121 1,324 141 1,800 1,630 1,370
SouthAfrica 5,726 1,584 253 358 886 84 1,094 1,096 371
Others 6,977 2,385 1,095 763 438 57 706 534 999
Middle East 95,581 29,952 18,010 16,155 9,388 4,288 5,902 3,299 8,587
SaudiArabia 35,481 15,302 4,237 6,578 4,766 1,569 911 530 1,588
UAE 7,136 2,989 820 1,398 771 289 96 241 532
Israel 11,080 2,483 1,146 3,585 1,528 194 998 764 382
Kuwait 4,327 1,065 1,640 286 231 220 205 142 538
Oman 8,343 1,582 2,014 1,784 288 575 230 432 1,438
Others 29,214 6,531 8,153 2,524 1,804 1,441 3,462 1,190 4,109
East Asia 444,310 129,058 82,927 107,490 41,891 10,879 16,022 16,928 39,115
China(P.R.) 268,952 74,430 43,379 75,801 30,137 4,566 6,849 8,676 25,114
Indonesia 25,806 5,769 7,202 2,229 1,594 1,273 3,058 1,051 3,630
Japan 44,988 13,302 14,841 10,703 1,855 928 1,040 464 1,855
Malaysia 26,414 10,336 2,871 4,881 1,148 1,074 675 3,138 2,291
Philippines 16,845 2,994 4,059 1,058 1,782 826 2,170 599 3,357
Singapore* 19,457 8,254 884 5,012 1,178 221 665 2,064 1,179
Thailand 10,828 4,373 2,415 1,755 408 432 625 208 612
Table17(contd.)
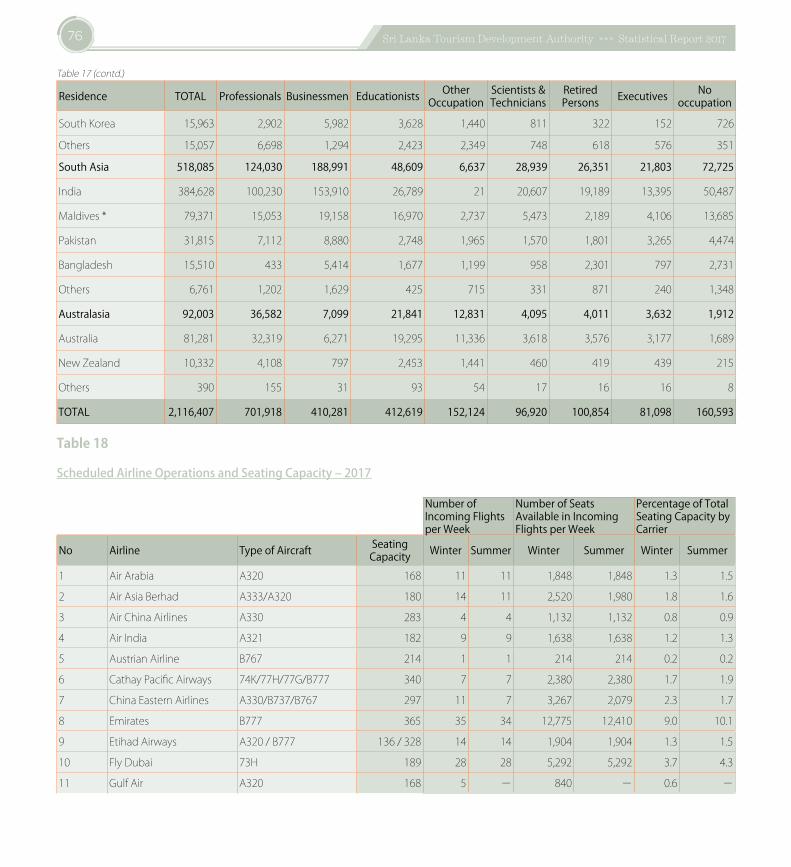
76 Sri Lanka Tourism Development Authority »»» Statistical Report 2017
Residence TOTAL Professionals Businessmen Educationists Other Occupation
Scientists & Technicians
Retired Persons Executives No
occupation
SouthKorea 15,963 2,902 5,982 3,628 1,440 811 322 152 726
Others 15,057 6,698 1,294 2,423 2,349 748 618 576 351
South Asia 518,085 124,030 188,991 48,609 6,637 28,939 26,351 21,803 72,725
India 384,628 100,230 153,910 26,789 21 20,607 19,189 13,395 50,487
Maldives* 79,371 15,053 19,158 16,970 2,737 5,473 2,189 4,106 13,685
Pakistan 31,815 7,112 8,880 2,748 1,965 1,570 1,801 3,265 4,474
Bangladesh 15,510 433 5,414 1,677 1,199 958 2,301 797 2,731
Others 6,761 1,202 1,629 425 715 331 871 240 1,348
Australasia 92,003 36,582 7,099 21,841 12,831 4,095 4,011 3,632 1,912
Australia 81,281 32,319 6,271 19,295 11,336 3,618 3,576 3,177 1,689
NewZealand 10,332 4,108 797 2,453 1,441 460 419 439 215
Others 390 155 31 93 54 17 16 16 8
TOTAL 2,116,407 701,918 410,281 412,619 152,124 96,920 100,854 81,098 160,593
Table18
ScheduledAirlineOperationsandSeatingCapacity–2017
Number of Incoming Flights per Week
Number of Seats Available in Incoming Flights per Week
Percentage of Total Seating Capacity by Carrier
No Airline Type of Aircraft Seating Capacity Winter Summer Winter Summer Winter Summer
1 AirArabia A320 168 11 11 1,848 1,848 1.3 1.5
2 AirAsiaBerhad A333/A320 180 14 11 2,520 1,980 1.8 1.6
3 AirChinaAirlines A330 283 4 4 1,132 1,132 0.8 0.9
4 AirIndia A321 182 9 9 1,638 1,638 1.2 1.3
5 AustrianAirline B767 214 1 1 214 214 0.2 0.2
6 CathayPacificAirways 74K/77H/77G/B777 340 7 7 2,380 2,380 1.7 1.9
7 ChinaEasternAirlines A330/B737/B767 297 11 7 3,267 2,079 2.3 1.7
8 Emirates B777 365 35 34 12,775 12,410 9.0 10.1
9 EtihadAirways A320/B777 136/328 14 14 1,904 1,904 1.3 1.5
10 FlyDubai 73H 189 28 28 5,292 5,292 3.7 4.3
11 GulfAir A320 168 5 − 840 − 0.6 −
Table17(contd.)
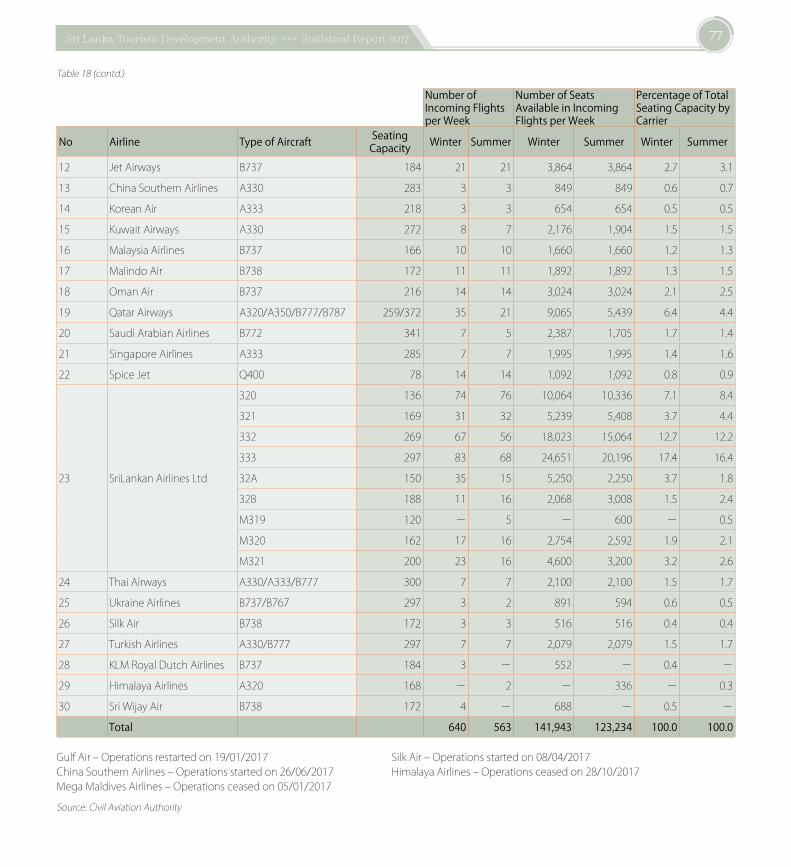
77Sri Lanka Tourism Development Authority »»» Statistical Report 2017
Number of Incoming Flights per Week
Number of Seats Available in Incoming Flights per Week
Percentage of Total Seating Capacity by Carrier
No Airline Type of Aircraft Seating Capacity Winter Summer Winter Summer Winter Summer
12 JetAirways B737 184 21 21 3,864 3,864 2.7 3.1
13 ChinaSouthernAirlines A330 283 3 3 849 849 0.6 0.7
14 KoreanAir A333 218 3 3 654 654 0.5 0.5
15 KuwaitAirways A330 272 8 7 2,176 1,904 1.5 1.5
16 MalaysiaAirlines B737 166 10 10 1,660 1,660 1.2 1.3
17 MalindoAir B738 172 11 11 1,892 1,892 1.3 1.5
18 OmanAir B737 216 14 14 3,024 3,024 2.1 2.5
19 QatarAirways A320/A350/B777/B787 259/372 35 21 9,065 5,439 6.4 4.4
20 SaudiArabianAirlines B772 341 7 5 2,387 1,705 1.7 1.4
21 SingaporeAirlines A333 285 7 7 1,995 1,995 1.4 1.6
22 SpiceJet Q400 78 14 14 1,092 1,092 0.8 0.9
23 SriLankanAirlinesLtd
320 136 74 76 10,064 10,336 7.1 8.4
321 169 31 32 5,239 5,408 3.7 4.4
332 269 67 56 18,023 15,064 12.7 12.2
333 297 83 68 24,651 20,196 17.4 16.4
32A 150 35 15 5,250 2,250 3.7 1.8
32B 188 11 16 2,068 3,008 1.5 2.4
M319 120 − 5 − 600 − 0.5
M320 162 17 16 2,754 2,592 1.9 2.1
M321 200 23 16 4,600 3,200 3.2 2.6
24 ThaiAirways A330/A333/B777 300 7 7 2,100 2,100 1.5 1.7
25 UkraineAirlines B737/B767 297 3 2 891 594 0.6 0.5
26 SilkAir B738 172 3 3 516 516 0.4 0.4
27 TurkishAirlines A330/B777 297 7 7 2,079 2,079 1.5 1.7
28 KLMRoyalDutchAirlines B737 184 3 − 552 − 0.4 −
29 HimalayaAirlines A320 168 − 2 − 336 − 0.3
30 SriWijayAir B738 172 4 − 688 − 0.5 −
Total 640 563 141,943 123,234 100.0 100.0
GulfAir–Operationsrestartedon19/01/2017 SilkAir–Operationsstartedon08/04/2017ChinaSouthernAirlines–Operationsstartedon26/06/2017 HimalayaAirlines–Operationsceasedon28/10/2017MegaMaldivesAirlines–Operationsceasedon05/01/2017
Source:CivilAviationAuthority
Table18(contd.)
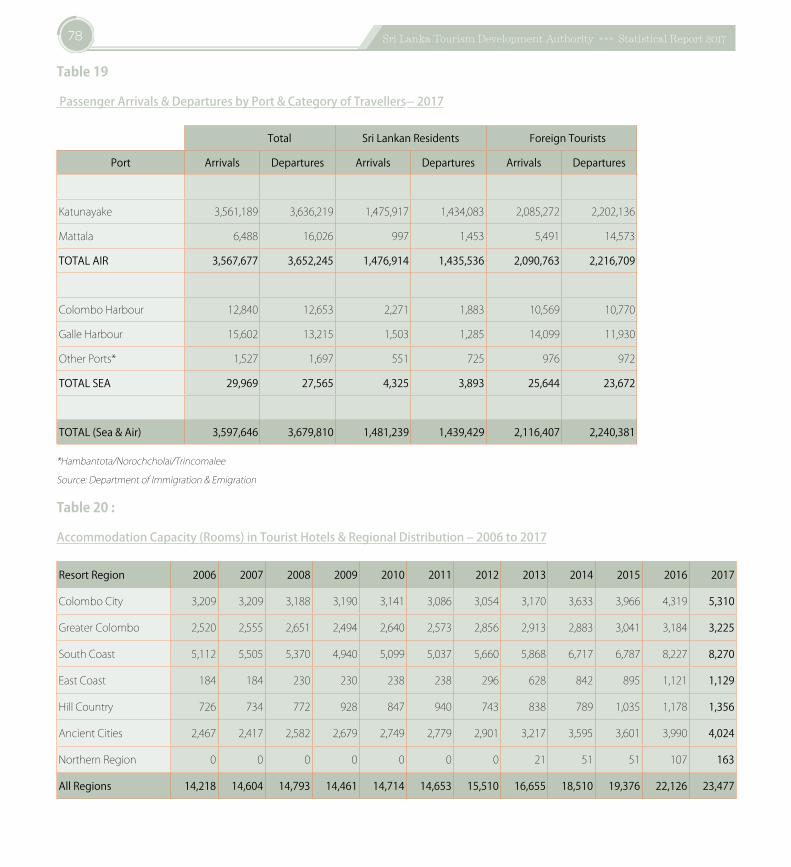
78 Sri Lanka Tourism Development Authority »»» Statistical Report 2017
Table19
PassengerArrivals&DeparturesbyPort&CategoryofTravellers–2017
Total Sri Lankan Residents Foreign Tourists
Port Arrivals Departures Arrivals Departures Arrivals Departures
Katunayake 3,561,189 3,636,219 1,475,917 1,434,083 2,085,272 2,202,136
Mattala 6,488 16,026 997 1,453 5,491 14,573
TOTAL AIR 3,567,677 3,652,245 1,476,914 1,435,536 2,090,763 2,216,709
ColomboHarbour 12,840 12,653 2,271 1,883 10,569 10,770
GalleHarbour 15,602 13,215 1,503 1,285 14,099 11,930
OtherPorts* 1,527 1,697 551 725 976 972
TOTAL SEA 29,969 27,565 4,325 3,893 25,644 23,672
TOTAL (Sea & Air) 3,597,646 3,679,810 1,481,239 1,439,429 2,116,407 2,240,381
*Hambantota/Norochcholai/Trincomalee
Source:DepartmentofImmigration&Emigration
Table20:
AccommodationCapacity(Rooms)inTouristHotels&RegionalDistribution–2006to2017
Resort Region 2006 2007 2008 2009 2010 2011 2012 2013 2014 2015 2016 2017
ColomboCity 3,209 3,209 3,188 3,190 3,141 3,086 3,054 3,170 3,633 3,966 4,319 5,310
GreaterColombo 2,520 2,555 2,651 2,494 2,640 2,573 2,856 2,913 2,883 3,041 3,184 3,225
SouthCoast 5,112 5,505 5,370 4,940 5,099 5,037 5,660 5,868 6,717 6,787 8,227 8,270
EastCoast 184 184 230 230 238 238 296 628 842 895 1,121 1,129
HillCountry 726 734 772 928 847 940 743 838 789 1,035 1,178 1,356
AncientCities 2,467 2,417 2,582 2,679 2,749 2,779 2,901 3,217 3,595 3,601 3,990 4,024
NorthernRegion 0 0 0 0 0 0 0 21 51 51 107 163
All Regions 14,218 14,604 14,793 14,461 14,714 14,653 15,510 16,655 18,510 19,376 22,126 23,477
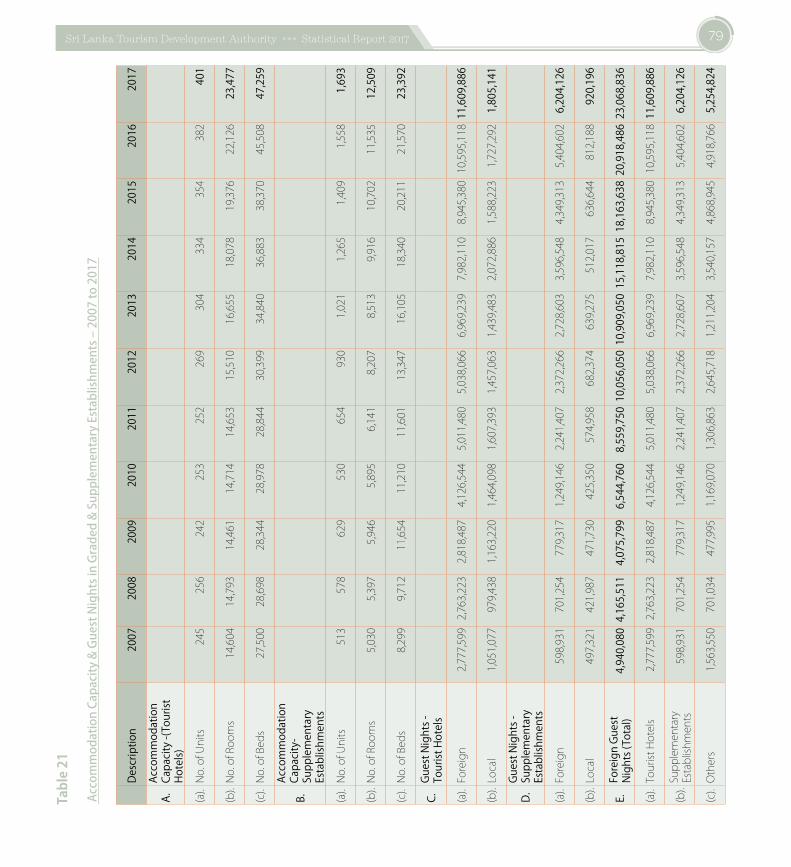
79Sri Lanka Tourism Development Authority »»» Statistical Report 2017
Table21
AccommodationCapacity&GuestNightsinGraded&SupplementaryEstablishments–2007to2017
Desc
riptio
n20
0720
0820
0920
1020
1120
1220
1320
1420
1520
1620
17
A.Ac
com
mod
atio
nCa
pacit
y -(T
ouris
tHo
tels)
(a).No.ofUnits
245
256
242
253
252
269
304
334
354
382
401
(b).No.ofRooms
14,604
14,793
14,461
14,714
14,653
15,510
16,655
18,078
19,376
22,126
23,4
77
(c).No.ofBeds
27,500
28,698
28,344
28,978
28,844
30,399
34,840
36,883
38,370
45,508
47,2
59
B.Ac
com
mod
atio
nCa
pacit
y-Su
pple
men
tary
Es
tabl
ishm
ents
(a).No.ofUnits
513
578
629
530
654
930
1,021
1,265
1,409
1,558
1,69
3
(b).No.ofRooms
5,030
5,397
5,946
5,895
6,141
8,207
8,513
9,916
10,702
11,535
12,5
09
(c).No.ofBeds
8,299
9,712
11,654
11,210
11,601
13,347
16,105
18,340
20,211
21,570
23,3
92
C.Gu
est N
ight
s -To
urist
Hot
els
(a).Foreign
2,777,5992,763,2232,818,4874,126,5445,011,4805,038,0666,969,2397,982,1108,945,38010,595,118
11,6
09,8
86
(b).Local
1,051,077979,438
1,163,2201,464,0981,607,3931,457,0631,439,4832,072,8861,588,2231,727,292
1,80
5,14
1
D.Gu
est N
ight
s -Su
pple
men
tary
Es
tabl
ishm
ents
(a).Foreign
598,931
701,254
779,317
1,249,1462,241,4072,372,2662,728,6033,596,5484,349,3135,404,602
6,20
4,12
6
(b).Local
497,321
421,987
471,730
425,350
574,958
682,374
639,275
512,017
636,644
812,188
920,
196
E.Fo
reig
n Gu
est
Nigh
ts (T
otal
)4,
940,
080
4,16
5,51
14,
075,
799
6,54
4,76
08,
559,
750
10,0
56,0
5010
,909
,050
15,1
18,8
1518
,163
,638
20,9
18,4
8623
,068
,836
(a).TouristHotels
2,777,5992,763,2232,818,4874,126,5445,011,4805,038,0666,969,2397,982,1108,945,38010,595,118
11,6
09,8
86
(b).Supplementary
Establishments
598,931
701,254
779,317
1,249,1462,241,4072,372,2662,728,6073,596,5484,349,3135,404,602
6,20
4,12
6
(c).Others
1,563,550701,034
477,995
1,169,0701,306,8632,645,7181,211,2043,540,1574,868,9454,918,766
5,25
4,82
4
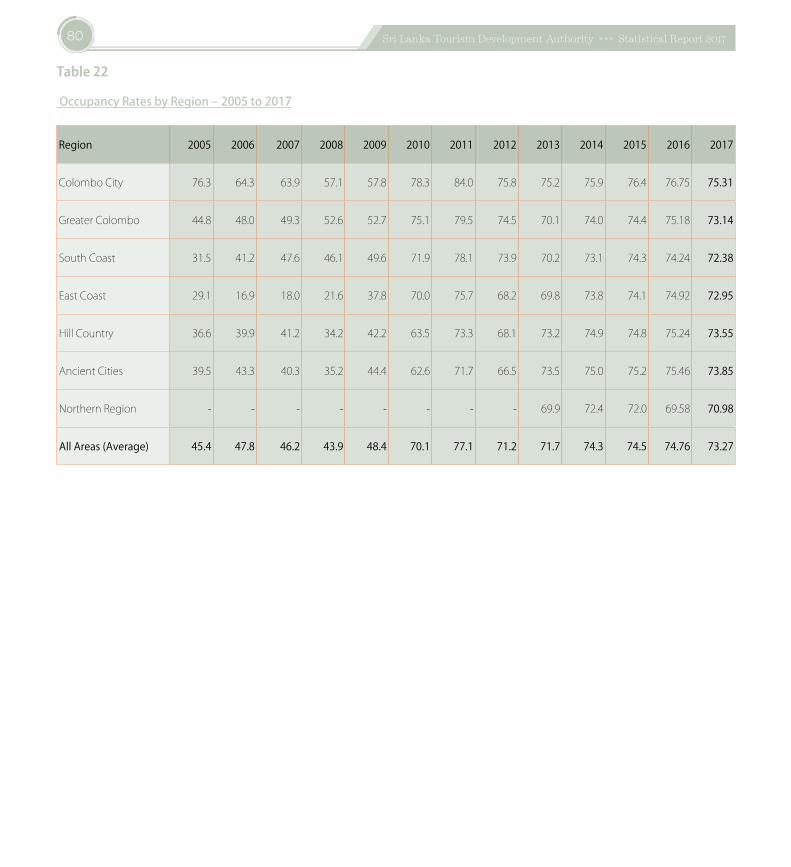
80 Sri Lanka Tourism Development Authority »»» Statistical Report 2017
Table22
OccupancyRatesbyRegion–2005to2017
Region 2005 2006 2007 2008 2009 2010 2011 2012 2013 2014 2015 2016 2017
ColomboCity 76.3 64.3 63.9 57.1 57.8 78.3 84.0 75.8 75.2 75.9 76.4 76.75 75.31
GreaterColombo 44.8 48.0 49.3 52.6 52.7 75.1 79.5 74.5 70.1 74.0 74.4 75.18 73.14
SouthCoast 31.5 41.2 47.6 46.1 49.6 71.9 78.1 73.9 70.2 73.1 74.3 74.24 72.38
EastCoast 29.1 16.9 18.0 21.6 37.8 70.0 75.7 68.2 69.8 73.8 74.1 74.92 72.95
HillCountry 36.6 39.9 41.2 34.2 42.2 63.5 73.3 68.1 73.2 74.9 74.8 75.24 73.55
AncientCities 39.5 43.3 40.3 35.2 44.4 62.6 71.7 66.5 73.5 75.0 75.2 75.46 73.85
NorthernRegion - - - - - - - - 69.9 72.4 72.0 69.58 70.98
All Areas (Average) 45.4 47.8 46.2 43.9 48.4 70.1 77.1 71.2 71.7 74.3 74.5 74.76 73.27
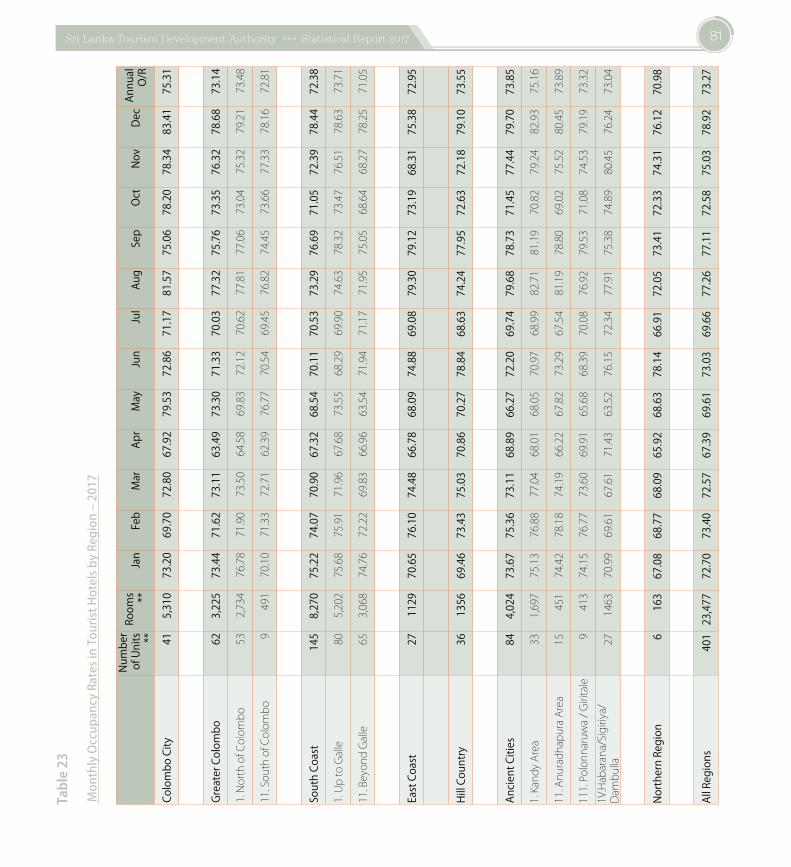
81Sri Lanka Tourism Development Authority »»» Statistical Report 2017
Table23
MonthlyOccupancyRatesinTouristHotelsbyRegion–2017
Num
ber
of U
nits
**
Room
s **Ja
nFe
bM
arAp
rM
ayJu
nJu
lAu
gSe
pOc
tNo
vDe
cAn
nual
O/
R
Colo
mbo
City
415,
310
73.2
069
.70
72.8
067
.92
79.5
372
.86
71.1
781
.57
75.0
678
.20
78.3
483
.41
75.3
1
Grea
ter C
olom
bo62
3,22
573
.44
71.6
273
.11
63.4
973
.30
71.3
370
.03
77.3
275
.76
73.3
576
.32
78.6
873
.14
1.NorthofColombo
532,734
76.78
71.90
73.50
64.58
69.83
72.12
70.62
77.81
77.06
73.04
75.32
79.21
73.48
11.SouthofColombo
9491
70.10
71.33
72.71
62.39
76.77
70.54
69.45
76.82
74.45
73.66
77.33
78.16
72.81
Sout
h Co
ast
145
8,27
075
.22
74.0
770
.90
67.3
268
.54
70.1
170
.53
73.2
976
.69
71.0
572
.39
78.4
472
.38
1.UptoGalle
805,202
75.68
75.91
71.96
67.68
73.55
68.29
69.90
74.63
78.32
73.47
76.51
78.63
73.71
11.BeyondGalle
653,068
74.76
72.22
69.83
66.96
63.54
71.94
71.17
71.95
75.05
68.64
68.27
78.25
71.05
East
Coa
st27
1129
70.6
576
.10
74.4
866
.78
68.0
974
.88
69.0
879
.30
79.1
273
.19
68.3
175
.38
72.9
5
Hill C
ount
ry36
1356
69.4
673
.43
75.0
370
.86
70.2
778
.84
68.6
374
.24
77.9
572
.63
72.1
879
.10
73.5
5
Ancie
nt C
ities
844,
024
73.6
775
.36
73.1
168
.89
66.2
772
.20
69.7
479
.68
78.7
371
.45
77.4
479
.70
73.8
5
1.KandyArea
331,697
75.13
76.88
77.04
68.01
68.05
70.97
68.99
82.71
81.19
70.82
79.24
82.93
75.16
11.AnuradhapuraArea
15451
74.42
78.18
74.19
66.22
67.82
73.29
67.54
81.19
78.80
69.02
75.52
80.45
73.89
111.Polonnaruwa/Giritale
9413
74.15
76.77
73.60
69.91
65.68
68.39
70.08
76.92
79.53
71.08
74.53
79.19
73.32
1V.Habarana/Sigiriya/
Dambulla
271463
70.99
69.61
67.61
71.43
63.52
76.15
72.34
77.91
75.38
74.89
80.45
76.24
73.04
North
ern
Regi
on6
163
67.0
868
.77
68.0
965
.92
68.6
378
.14
66.9
172
.05
73.4
172
.33
74.3
176
.12
70.9
8
All R
egio
ns40
123
,477
72.7
073
.40
72.5
767
.39
69.6
173
.03
69.6
677
.26
77.1
172
.58
75.0
378
.92
73.2
7
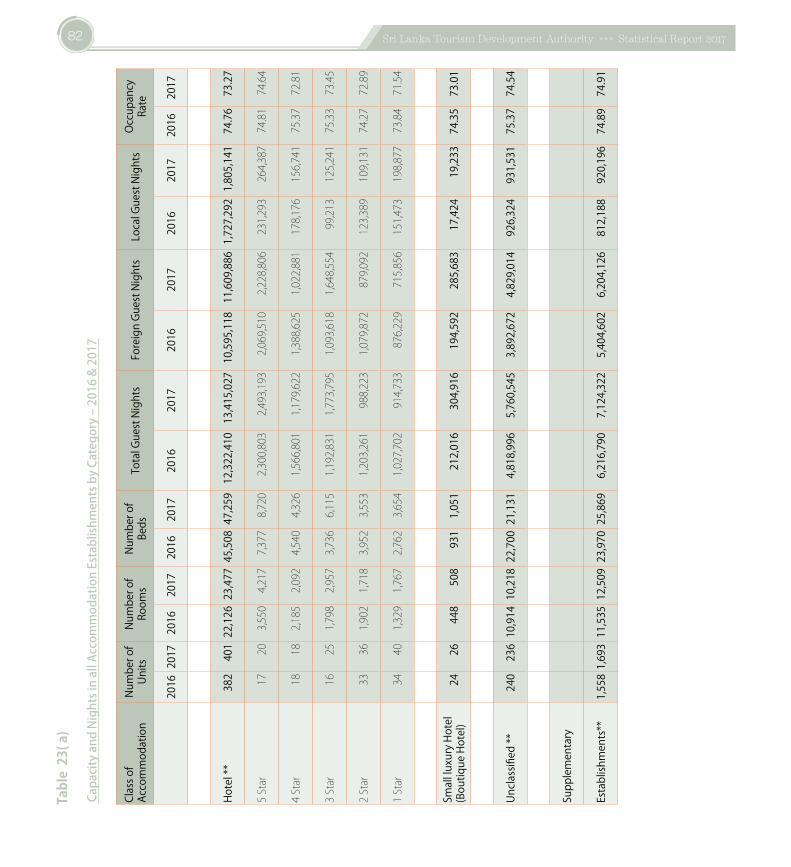
82 Sri Lanka Tourism Development Authority »»» Statistical Report 2017
Table23(a)
CapacityandNightsinallAccommodationEstablishmentsbyCategory–2016&2017
Clas
s of
Acco
mm
odat
ion
Num
ber o
f Un
itsNu
mbe
r of
Room
sNu
mbe
r of
Beds
Tota
l Gue
st N
ight
sFo
reig
n Gu
est N
ight
sLo
cal G
uest
Nig
hts
Occu
panc
y Ra
te
20
1620
1720
1620
1720
1620
1720
1620
1720
1620
1720
1620
1720
1620
17
Hote
l **
382
401
22,1
2623
,477
45,5
0847
,259
12,3
22,4
1013
,415
,027
10,5
95,1
1811
,609
,886
1,72
7,29
21,
805,
141
74.7
673
.27
5Star
1720
3,550
4,217
7,377
8,720
2,300,803
2,493,193
2,069,510
2,228,806
231,293
264,387
74.81
74.64
4Star
1818
2,185
2,092
4,540
4,326
1,566,801
1,179,622
1,388,625
1,022,881
178,176
156,741
75.37
72.81
3Star
1625
1,798
2,957
3,736
6,115
1,192,831
1,773,795
1,093,618
1,648,554
99,213
125,241
75.33
73.45
2Star
3336
1,902
1,718
3,952
3,553
1,203,261
988,223
1,079,872
879,092
123,389
109,131
74.27
72.89
1Star
3440
1,329
1,767
2,762
3,654
1,027,702
914,733
876,229
715,856
151,473
198,877
73.84
71.54
Smal
l luxu
ry H
otel
(B
outiq
ue H
otel
)24
2644
850
893
11,
051
212,
016
304,
916
194,
592
285,
683
17,4
2419
,233
74.3
573
.01
Uncla
ssifi
ed **
240
236
10,9
1410
,218
22,7
0021
,131
4,81
8,99
65,
760,
545
3,89
2,67
24,
829,
014
926,
324
931,
531
75.3
774
.54
Supp
lem
enta
ry
Esta
blish
men
ts**
1,55
81,
693
11,5
3512
,509
23,9
7025
,869
6,21
6,79
0 7,
124,
322
5,40
4,60
26,
204,
126
812,
188
920,
196
74.8
974
.91
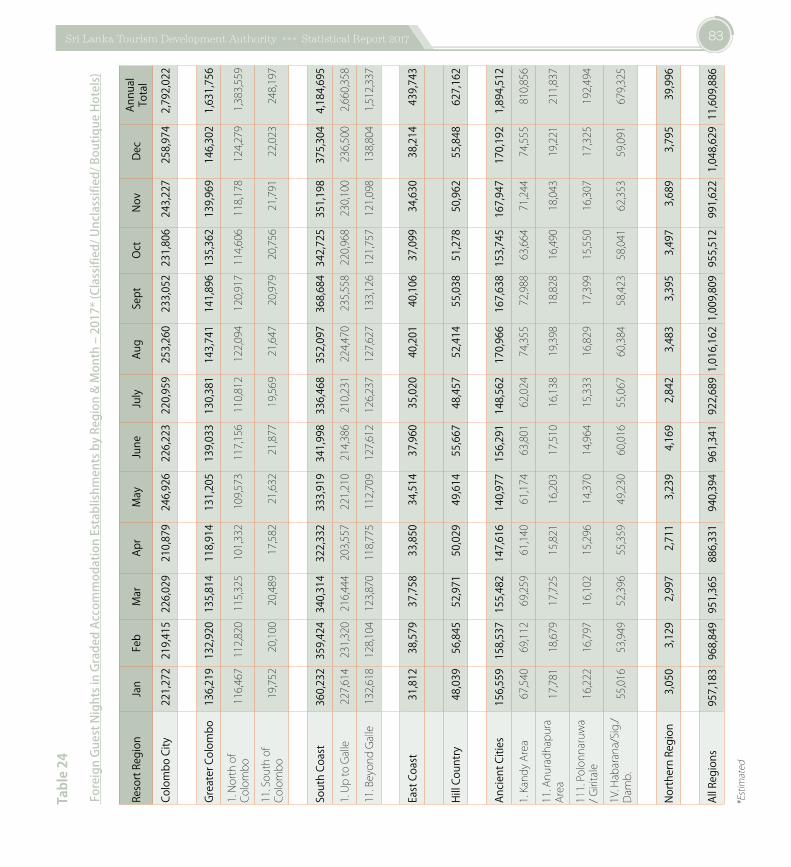
83Sri Lanka Tourism Development Authority »»» Statistical Report 2017
Table24
ForeignGuestNightsinGradedAccommodationEstablishmentsbyRegion&Month–2017*(Classified/Unclassified/BoutiqueHotels)
Reso
rt Re
gion
Jan
Feb
Mar
Ap
rM
ayJu
neJu
lyAu
gSe
ptOc
tNo
vDe
cAn
nual
To
tal
Colo
mbo
City
221,
272
219,
415
226,
029
210,
879
246,
926
226,
223
220,
959
253,
260
233,
052
231,
806
243,
227
258,
974
2,79
2,02
2
Grea
ter C
olom
bo13
6,21
913
2,92
013
5,81
411
8,91
413
1,20
513
9,03
313
0,38
114
3,74
114
1,89
613
5,36
213
9,96
914
6,30
21,
631,
756
1.Northof
Colombo
116,467
112,820
115,325
101,332
109,573
117,156
110,812
122,094
120,917114,606
118,178
124,279
1,383,559
11.Southof
Colombo
19,752
20,100
20,489
17,582
21,632
21,877
19,569
21,647
20,97920,756
21,791
22,023
248,197
Sout
h Co
ast
360,
232
359,
424
340,
314
322,
332
333,
919
341,
998
336,
468
352,
097
368,
684
342,
725
351,
198
375,
304
4,18
4,69
5
1.UptoGalle
227,614
231,320
216,444
203,557
221,210
214,386
210,231
224,470
235,558220,968
230,100
236,500
2,660,358
11.BeyondGalle
132,618
128,104
123,870
118,775
112,709
127,612
126,237
127,627
133,126121,757
121,098
138,804
1,512,337
East
Coa
st31
,812
38,5
7937
,758
33,8
5034
,514
37,9
6035
,020
40,2
0140
,106
37,0
9934
,630
38,2
1443
9,74
3
Hill C
ount
ry48
,039
56,8
4552
,971
50,0
2949
,614
55,6
6748
,457
52,4
1455
,038
51,2
7850
,962
55,8
4862
7,16
2
Ancie
nt C
ities
156,
559
158,
537
155,
482
147,
616
140,
977
156,
291
148,
562
170,
966
167,
638
153,
745
167,
947
170,
192
1,89
4,51
2
1.KandyArea
67,540
69,112
69,259
61,140
61,174
63,801
62,024
74,355
72,98863,664
71,244
74,555
810,856
11.Anuradhapura
Area
17,781
18,679
17,725
15,821
16,203
17,510
16,138
19,398
18,82816,490
18,043
19,221
211,837
111.Polonnaruwa
/Giritale
16,222
16,797
16,102
15,296
14,370
14,964
15,333
16,829
17,39915,550
16,307
17,325
192,494
1V.Habarana/Sig./
Damb.
55,016
53,949
52,396
55,359
49,230
60,016
55,067
60,384
58,42358,041
62,353
59,091
679,325
North
ern
Regi
on3,
050
3,12
92,
997
2,71
13,
239
4,16
92,
842
3,48
33,
395
3,49
73,
689
3,79
539
,996
All R
egio
ns95
7,18
396
8,84
995
1,36
588
6,33
194
0,39
496
1,34
192
2,68
91,
016,
162
1,00
9,80
995
5,51
299
1,62
21,
048,
629
11,6
09,8
86
*Estimated
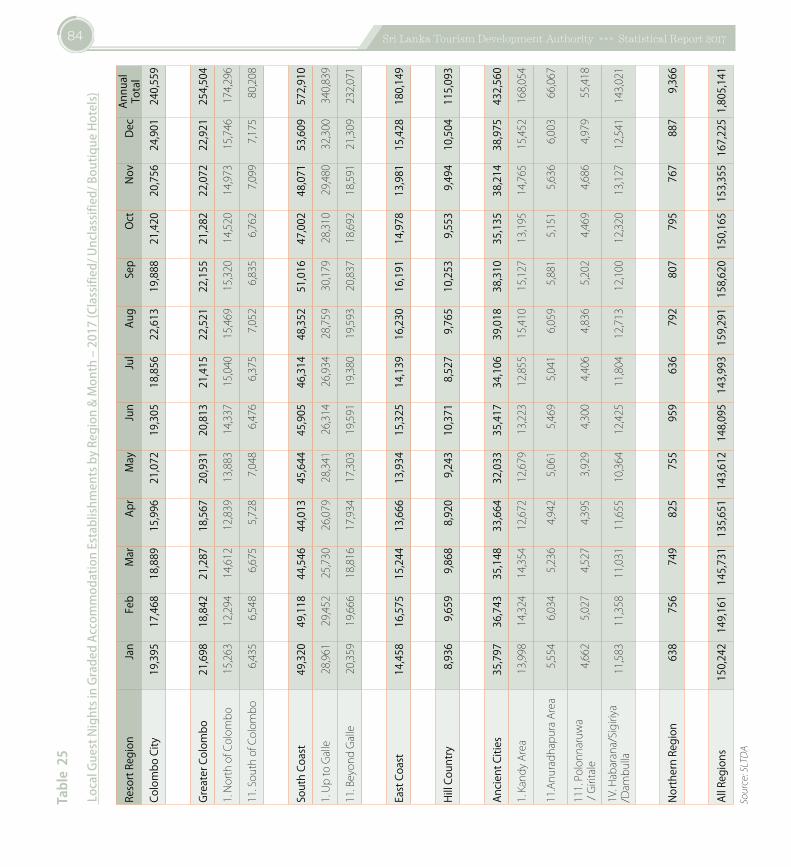
84 Sri Lanka Tourism Development Authority »»» Statistical Report 2017
Table25
LocalGuestNightsinGradedAccommodationEstablishmentsbyRegion&Month–2017(Classified/Unclassified/BoutiqueHotels)
Re
sort
Regi
onJa
nFe
bM
arAp
rM
ayJu
nJu
lAu
gSe
pOc
tNo
vDe
cAn
nual
To
tal
Colo
mbo
City
19,3
9517
,468
18,8
8915
,996
21,0
7219
,305
18,8
5622
,613
19,8
8821
,420
20,7
5624
,901
240,
559
Grea
ter C
olom
bo21
,698
18,8
4221
,287
18,5
6720
,931
20,8
1321
,415
22,5
2122
,155
21,2
8222
,072
22,9
2125
4,50
4
1.NorthofColombo
15,263
12,294
14,612
12,839
13,883
14,337
15,040
15,469
15,320
14,520
14,97315,746174,296
11.SouthofColombo
6,435
6,548
6,675
5,728
7,048
6,476
6,375
7,052
6,835
6,762
7,099
7,175
80,208
Sout
h Co
ast
49,3
2049
,118
44,5
4644
,013
45,6
4445
,905
46,3
1448
,352
51,0
1647
,002
48,0
7153
,609
572,
910
1.UptoGalle
28,961
29,452
25,730
26,079
28,341
26,314
26,934
28,759
30,179
28,310
29,48032,300340,839
11.BeyondGalle
20,359
19,666
18,816
17,934
17,303
19,591
19,380
19,593
20,837
18,692
18,59121,309232,071
East
Coa
st14
,458
16,5
7515
,244
13,6
6613
,934
15,3
2514
,139
16,2
3016
,191
14,9
7813
,981
15,4
2818
0,14
9
Hill C
ount
ry8,
936
9,65
99,
868
8,92
09,
243
10,3
718,
527
9,76
510
,253
9,55
39,
494
10,5
0411
5,09
3
Ancie
nt C
ities
35,7
9736
,743
35,1
4833
,664
32,0
3335
,417
34,1
0639
,018
38,3
1035
,135
38,2
1438
,975
432,
560
1.KandyArea
13,998
14,324
14,354
12,672
12,679
13,223
12,855
15,410
15,127
13,195
14,76515,452168,054
11.AnuradhapuraArea
5,554
6,034
5,236
4,942
5,061
5,469
5,041
6,059
5,881
5,151
5,636
6,003
66,067
111.Polonnaruwa
/Giritale
4,662
5,027
4,527
4,395
3,929
4,300
4,406
4,836
5,202
4,469
4,686
4,979
55,418
1V.Habarana/Sigiriya
/Dambulla
11,583
11,358
11,031
11,655
10,364
12,425
11,804
12,713
12,100
12,320
13,12712,541143,021
North
ern
Regi
on63
875
674
982
575
595
963
679
280
779
576
788
79,
366
All R
egio
ns15
0,24
214
9,16
114
5,73
113
5,65
114
3,61
214
8,09
514
3,99
315
9,29
115
8,62
015
0,16
515
3,35
516
7,22
51,
805,
141
Source:SLTDA
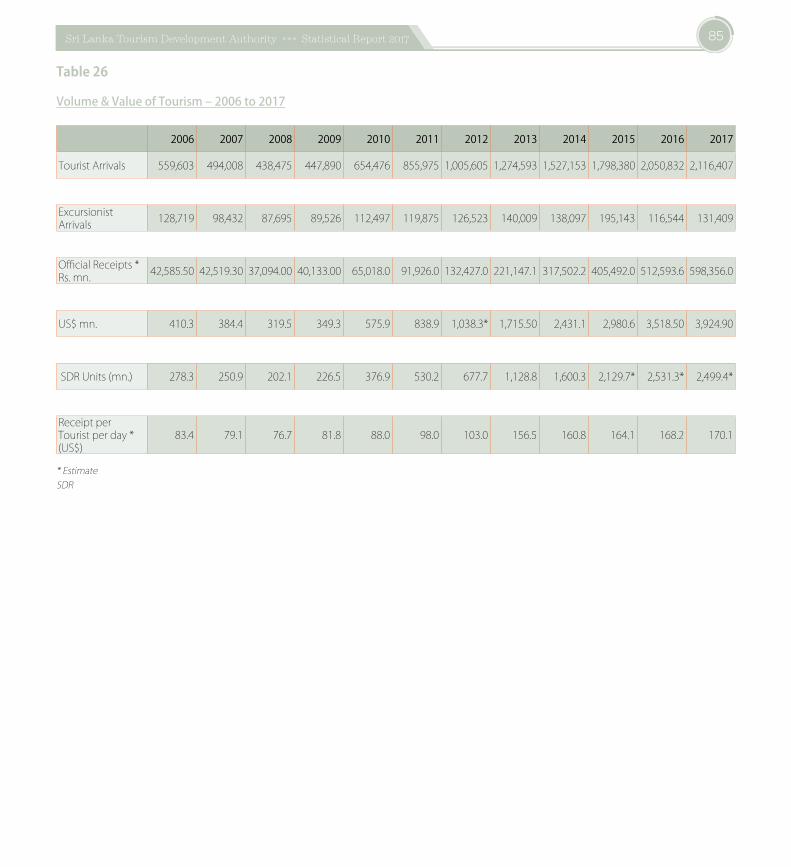
85Sri Lanka Tourism Development Authority »»» Statistical Report 2017
Table26
Volume&ValueofTourism–2006to2017
2006 2007 2008 2009 2010 2011 2012 2013 2014 2015 2016 2017
TouristArrivals 559,603 494,008 438,475 447,890 654,476 855,975 1,005,605 1,274,593 1,527,153 1,798,380 2,050,832 2,116,407
ExcursionistArrivals 128,719 98,432 87,695 89,526 112,497 119,875 126,523 140,009 138,097 195,143 116,544 131,409
OfficialReceipts*Rs.mn. 42,585.50 42,519.30 37,094.00 40,133.00 65,018.0 91,926.0 132,427.0 221,147.1 317,502.2 405,492.0 512,593.6 598,356.0
US$mn. 410.3 384.4 319.5 349.3 575.9 838.9 1,038.3* 1,715.50 2,431.1 2,980.6 3,518.50 3,924.90
SDRUnits(mn.) 278.3 250.9 202.1 226.5 376.9 530.2 677.7 1,128.8 1,600.3 2,129.7* 2,531.3* 2,499.4*
ReceiptperTouristperday*(US$)
83.4 79.1 76.7 81.8 88.0 98.0 103.0 156.5 160.8 164.1 168.2 170.1
*EstimateSDR
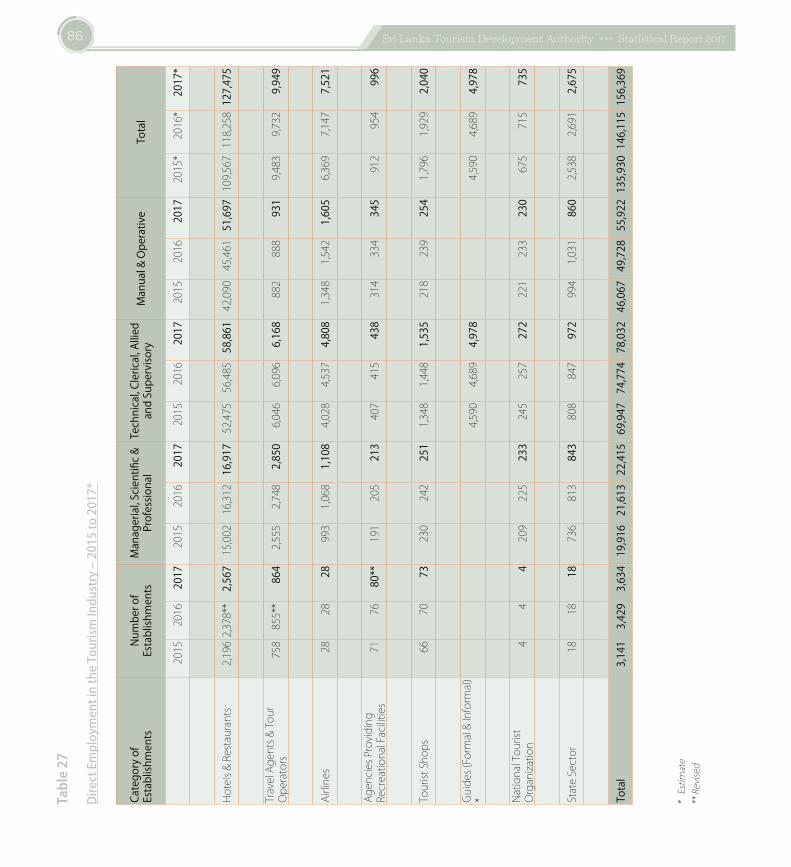
86 Sri Lanka Tourism Development Authority »»» Statistical Report 2017
Table27
DirectEmploymentintheTourismIndustry–2015to2017*
Cate
gory
of
Esta
blish
men
tsNu
mbe
r of
Esta
blish
men
tsM
anag
eria
l, Scie
ntifi
c &
Prof
essio
nal
Tech
nica
l, Cle
rical
, Allie
d an
d Su
perv
isory
Man
ual &
Ope
rativ
eTo
tal
2015
2016
2017
2015
2016
2017
2015
2016
2017
2015
2016
2017
2015*2016*
2017
*
Hotels&Restaurants
2,1962,378**
2,56
715,00216,312
16,9
1752,47556,485
58,8
6142,09045,461
51,6
97109,567118,258
127,
475
TravelAgents&Tour
Operators
758855**
864
2,555
2,748
2,85
06,046
6,096
6,16
8882
888
931
9,483
9,732
9,94
9
Airlines
2828
28993
1,068
1,10
84,028
4,537
4,80
81,348
1,542
1,60
56,369
7,147
7,52
1
AgenciesProviding
RecreationalFacilities
7176
80**
191
205
213
407
415
438
314
334
345
912
954
996
TouristShops
6670
73230
242
251
1,348
1,448
1,53
5218
239
254
1,796
1,929
2,04
0
Guides(Formal&Informal)
*4,590
4,689
4,97
84,590
4,689
4,97
8
NationalTourist
Organization
44
4209
225
233
245
257
272
221
233
230
675
715
735
StateSector
1818
18736
813
843
808
847
972
994
1,031
860
2,538
2,691
2,67
5
Tota
l3,
141
3,42
9 3,
634
19,9
16
21,6
13
22,4
15
69,9
47
74,7
74
78,0
32
46,0
67
49,7
28
55,9
22 1
35,9
30 1
46,1
15 1
56,3
69
*Estimate
**Revised
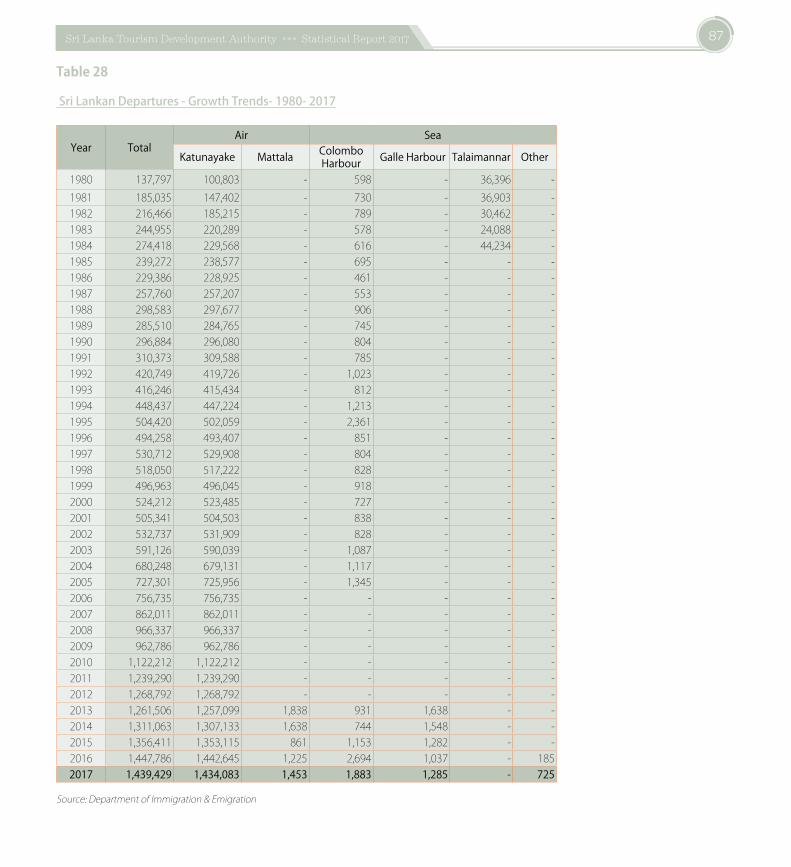
87Sri Lanka Tourism Development Authority »»» Statistical Report 2017
Table28
SriLankanDepartures-GrowthTrends-1980-2017
Year TotalAir Sea
Katunayake Mattala Colombo Harbour Galle Harbour Talaimannar Other
1980 137,797 100,803 - 598 - 36,396 -1981 185,035 147,402 - 730 - 36,903 -1982 216,466 185,215 - 789 - 30,462 -1983 244,955 220,289 - 578 - 24,088 -1984 274,418 229,568 - 616 - 44,234 -1985 239,272 238,577 - 695 - - -1986 229,386 228,925 - 461 - - -1987 257,760 257,207 - 553 - - -1988 298,583 297,677 - 906 - - -1989 285,510 284,765 - 745 - - -1990 296,884 296,080 - 804 - - -1991 310,373 309,588 - 785 - - -1992 420,749 419,726 - 1,023 - - -1993 416,246 415,434 - 812 - - -1994 448,437 447,224 - 1,213 - - -1995 504,420 502,059 - 2,361 - - -1996 494,258 493,407 - 851 - - -1997 530,712 529,908 - 804 - - -1998 518,050 517,222 - 828 - - -1999 496,963 496,045 - 918 - - -2000 524,212 523,485 - 727 - - -2001 505,341 504,503 - 838 - - -2002 532,737 531,909 - 828 - - -2003 591,126 590,039 - 1,087 - - -2004 680,248 679,131 - 1,117 - - -2005 727,301 725,956 - 1,345 - - -2006 756,735 756,735 - - - - -2007 862,011 862,011 - - - - -2008 966,337 966,337 - - - - -2009 962,786 962,786 - - - - -2010 1,122,212 1,122,212 - - - - -2011 1,239,290 1,239,290 - - - - -2012 1,268,792 1,268,792 - - - - -2013 1,261,506 1,257,099 1,838 931 1,638 - -2014 1,311,063 1,307,133 1,638 744 1,548 - -2015 1,356,411 1,353,115 861 1,153 1,282 - -2016 1,447,786 1,442,645 1,225 2,694 1,037 - 1852017 1,439,429 1,434,083 1,453 1,883 1,285 - 725
Source:DepartmentofImmigration&Emigration
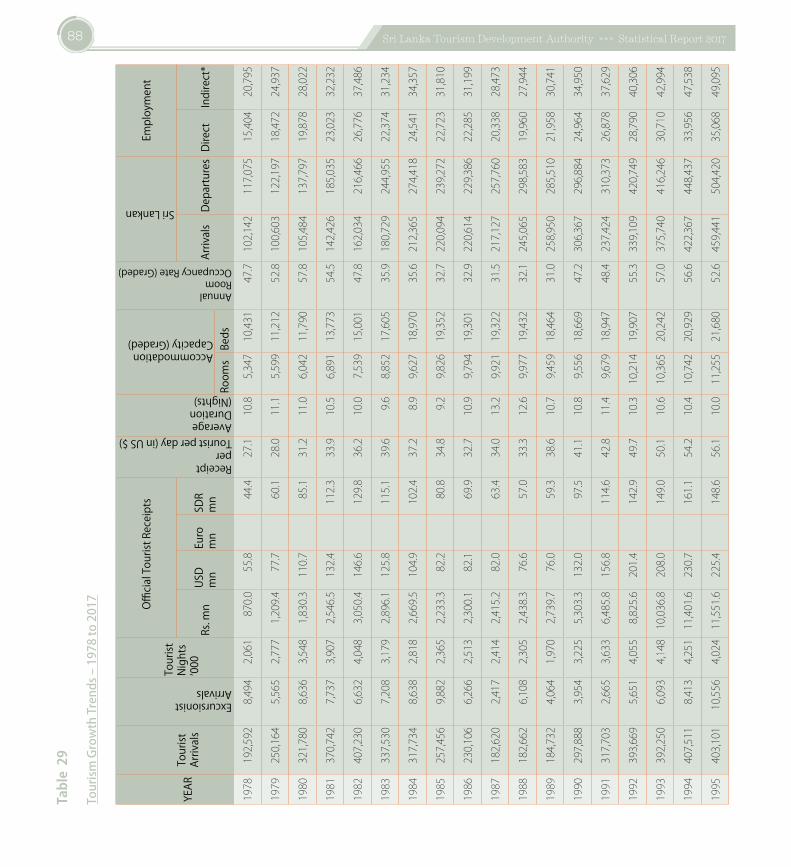
88 Sri Lanka Tourism Development Authority »»» Statistical Report 2017
Table29
TourismGrowthTrends–1978to2017
YE
AR
To
urist
Ar
rival
s
ExcursionistArrivals
Tour
istNi
ghts
‘0
00
O
fficia
l Tou
rist R
ecei
pts
ReceiptperTourist per day (in US $)AverageDuration(Nights)
AccommodationCapacity (Graded)
AnnualRoomOccupancy Rate (Graded)
Sri Lankan
Empl
oym
ent
Rs. m
nUS
D m
nEu
ro
mn
SDR
mn
Arriv
als
Depa
rture
s D
irect
Indi
rect
*Ro
oms
Beds
1978
192,592
8,494
2,061
870.0
55.8
44.4
27.1
10.8
5,347
10,431
47.7102,142
117,075
15,40420,795
1979
250,164
5,565
2,777
1,209.4
77.7
60.1
28.0
11.1
5,599
11,212
52.8100,603
122,197
18,47224,937
1980
321,780
8,636
3,548
1,830.3
110.7
85.1
31.2
11.0
6,042
11,790
57.8105,484
137,797
19,87828,022
1981
370,742
7,737
3,907
2,546.5
132.4
112.3
33.9
10.5
6,891
13,773
54.5142,426
185,035
23,02332,232
1982
407,230
6,632
4,048
3,050.4
146.6
129.8
36.2
10.0
7,539
15,001
47.8162,034
216,466
26,77637,486
1983
337,530
7,208
3,179
2,896.1
125.8
115.1
39.6
9.68,852
17,605
35.9180,729
244,955
22,37431,234
1984
317,734
8,638
2,818
2,669.5
104.9
102.4
37.2
8.99,627
18,970
35.6212,365
274,418
24,54134,357
1985
257,456
9,882
2,365
2,233.3
82.2
80.8
34.8
9.29,826
19,352
32.7220,094
239,272
22,72331,810
1986
230,106
6,266
2,513
2,300.1
82.1
69.9
32.7
10.9
9,794
19,301
32.9220,614
229,386
22,28531,199
1987
182,620
2,417
2,414
2,415.2
82.0
63.4
34.0
13.2
9,921
19,322
31.5217,127
257,760
20,33828,473
1988
182,662
6,108
2,305
2,438.3
76.6
57.0
33.3
12.6
9,977
19,432
32.1245,065
298,583
19,96027,944
1989
184,732
4,064
1,970
2,739.7
76.0
59.3
38.6
10.7
9,459
18,464
31.0258,950
285,510
21,95830,741
1990
297,888
3,954
3,225
5,303.3
132.0
97.5
41.1
10.8
9,556
18,669
47.2306,367
296,884
24,96434,950
1991
317,703
2,665
3,633
6,485.8
156.8
114.6
42.8
11.4
9,679
18,947
48.4237,424
310,373
26,87837,629
1992
393,669
5,651
4,055
8,825.6
201.4
142.9
49.7
10.310,21419,907
55.3339,109
420,749
28,79040,306
1993
392,250
6,093
4,14810,036.8
208.0
149.0
50.1
10.610,36520,242
57.0375,740
416,246
30,71042,994
1994
407,511
8,413
4,25111,401.6
230.7
161.1
54.2
10.410,74220,929
56.6422,367
448,437
33,95647,538
1995
403,101
10,5564,02411,551.6
225.4
148.6
56.1
10.011,25521,680
52.6459,441
504,420
35,06849,095
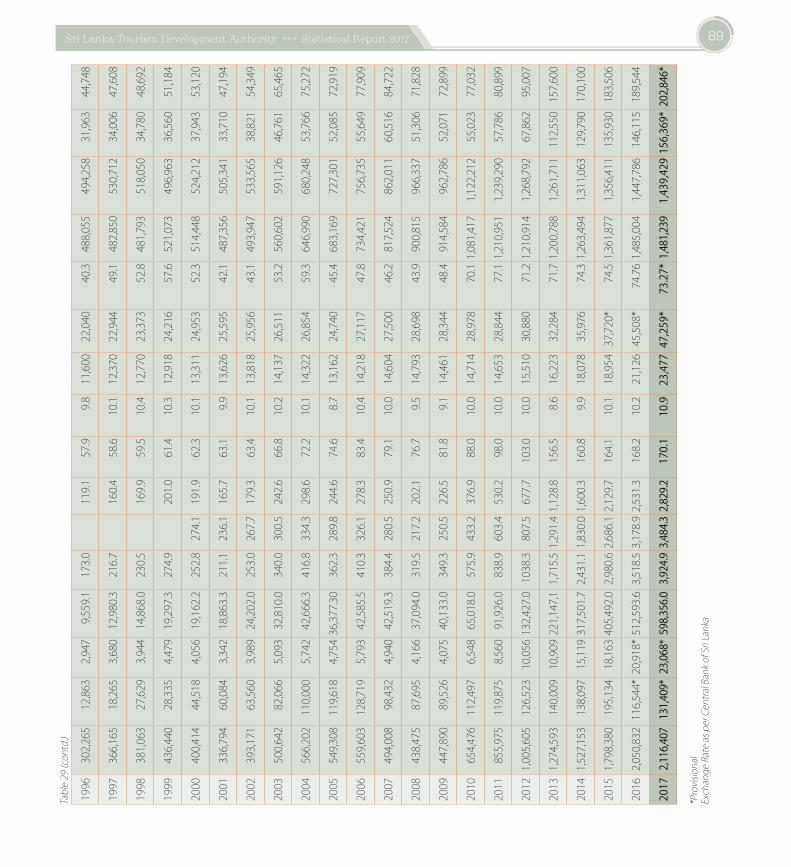
89Sri Lanka Tourism Development Authority »»» Statistical Report 2017
1996
302,265
12,8632,947
9,559.1
173.0
119.1
57.9
9.811,60022,040
40.3488,055
494,258
31,96344,748
1997
366,165
18,2653,68012,980.3
216.7
160.4
58.6
10.112,37022,944
49.1482,850
530,712
34,00647,608
1998
381,063
27,6293,94414,868.0
230.5
169.9
59.5
10.412,77023,373
52.8481,793
518,050
34,78048,692
1999
436,440
28,3354,47919,297.3
274.9
201.0
61.4
10.312,91824,216
57.6521,073
496,963
36,56051,184
2000
400,414
44,5184,05619,162.2
252.8
274.1
191.9
62.3
10.113,31124,953
52.3514,448
524,212
37,94353,120
2001
336,794
60,0843,34218,863.3
211.1
236.1
165.7
63.1
9.913,62625,595
42.1487,356
505,341
33,71047,194
2002
393,171
63,5603,98924,202.0
253.0
267.7
179.3
63.4
10.113,81825,956
43.1493,947
533,565
38,82154,349
2003
500,642
82,0665,09332,810.0
340.0
300.5
242.6
66.8
10.214,13726,511
53.2560,602
591,126
46,76165,465
2004
566,202
110,000
5,74242,666.3
416.8
334.3
298.6
72.2
10.114,32226,854
59.3646,990
680,248
53,76675,272
2005
549,308
119,618
4,75436,377.30362.3
289.8
244.6
74.6
8.713,16224,740
45.4683,169
727,301
52,08572,919
2006
559,603
128,719
5,79342,585.5
410.3
326.1
278.3
83.4
10.414,21827,117
47.8734,421
756,735
55,64977,909
2007
494,008
98,4324,94042,519.3
384.4
280.5
250.9
79.1
10.014,60427,500
46.2817,524
862,011
60,51684,722
2008
438,475
87,6954,16637,094.0
319.5
217.2
202.1
76.7
9.514,79328,698
43.9900,815
966,337
51,30671,828
2009
447,890
89,5264,07540,133.0
349.3
250.5
226.5
81.8
9.114,46128,344
48.4914,584
962,786
52,07172,899
2010
654,476
112,497
6,54865,018.0
575.9
433.2
376.9
88.0
10.014,71428,978
70.11,081,4171,122,212
55,02377,032
2011
855,975
119,875
8,56091,926.0
838.9
603.4
530.2
98.0
10.014,65328,844
77.11,210,9511,239,290
57,78680,899
20121,005,605126,52310,056132,427.01038.3807.5
677.7
103.0
10.015,51030,880
71.21,210,9141,268,792
67,86295,007
20131,274,593140,00910,909221,147,11,715.51,291.41,128.8
156.5
8.616,22332,284
71.71,200,7881,261,711112,550157,600
20141,527,153138,09715,119317,501.72,431.11,830.01,600.3
160.8
9.918,07835,976
74.31,263,4941,311,063129,790170,100
20151,798,380195,13418,163405,492.02,980.62,686.12,129.7
164.1
10.118,95437,720*
74.51,361,8771,356,411135,930183,506
20162,050,832116,544*20,918*512,593.63,518.53,178.92,531.3
168.2
10.221,12645,508*
74.761,485,0041,447,786146,115189,544
2017
2,116
,407
131,4
09*
23,06
8*59
8,356
.03,9
24.9
3,484
.32,8
29.2
170.
110
.923
,477
47,2
59*
73.2
7*1,4
81,23
91,
439,
429
156,
369*
202,8
46*
*Provisional
ExchangeRateasperCentralBankofSriLanka
Table29(contd.)
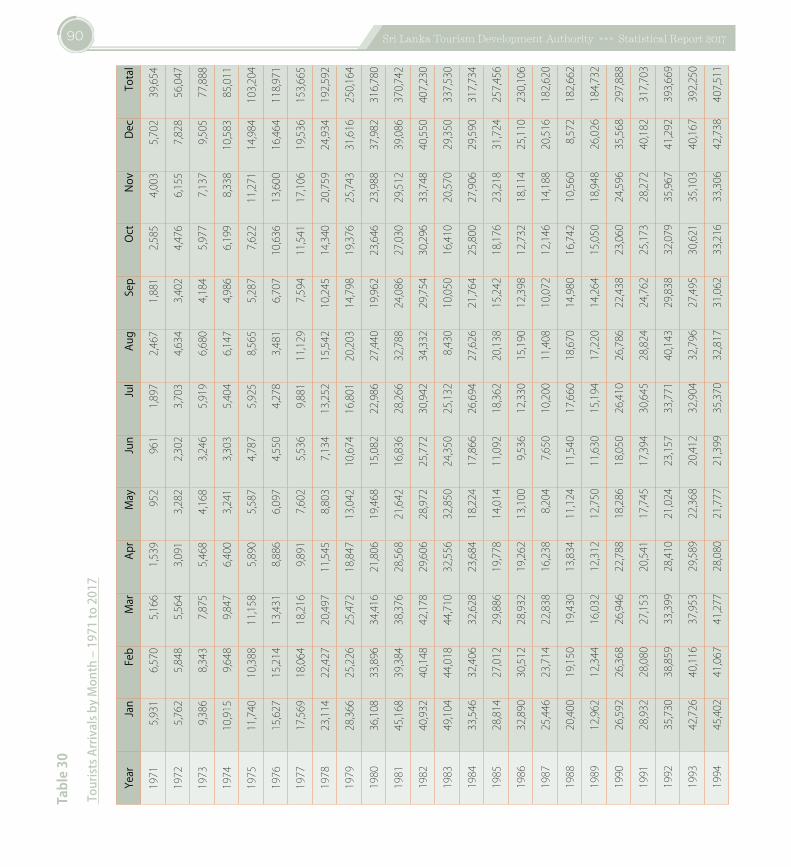
90 Sri Lanka Tourism Development Authority »»» Statistical Report 2017
Table30
TouristsArrivalsbyMonth–1971to2017
Year
Jan
Feb
Mar
Apr
May
Jun
Jul
Aug
Sep
Oct
Nov
Dec
Tota
l
1971
5,931
6,570
5,166
1,539
952
961
1,897
2,467
1,881
2,585
4,003
5,702
39,654
1972
5,762
5,848
5,564
3,091
3,282
2,302
3,703
4,634
3,402
4,476
6,155
7,828
56,047
1973
9,386
8,343
7,875
5,468
4,168
3,246
5,919
6,680
4,184
5,977
7,137
9,505
77,888
1974
10,915
9,648
9,847
6,400
3,241
3,303
5,404
6,147
4,986
6,199
8,338
10,583
85,011
1975
11,740
10,388
11,158
5,890
5,587
4,787
5,925
8,565
5,287
7,622
11,271
14,984
103,204
1976
15,627
15,214
13,431
8,886
6,097
4,550
4,278
3,481
6,707
10,636
13,600
16,464
118,971
1977
17,569
18,064
18,216
9,891
7,602
5,536
9,881
11,129
7,594
11,541
17,106
19,536
153,665
1978
23,114
22,427
20,497
11,545
8,803
7,134
13,252
15,542
10,245
14,340
20,759
24,934
192,592
1979
28,366
25,226
25,472
18,847
13,042
10,674
16,801
20,203
14,798
19,376
25,743
31,616
250,164
1980
36,108
33,896
34,416
21,806
19,468
15,082
22,986
27,440
19,962
23,646
23,988
37,982
316,780
1981
45,168
39,384
38,376
28,568
21,642
16,836
28,266
32,788
24,086
27,030
29,512
39,086
370,742
1982
40,932
40,148
42,178
29,606
28,972
25,772
30,942
34,332
29,754
30,296
33,748
40,550
407,230
1983
49,104
44,018
44,710
32,556
32,850
24,350
25,132
8,430
10,050
16,410
20,570
29,350
337,530
1984
33,546
32,406
32,628
23,684
18,224
17,866
26,694
27,626
21,764
25,800
27,906
29,590
317,734
1985
28,814
27,012
29,886
19,778
14,014
11,092
18,362
20,138
15,242
18,176
23,218
31,724
257,456
1986
32,890
30,512
28,932
19,262
13,100
9,536
12,330
15,190
12,398
12,732
18,114
25,110
230,106
1987
25,446
23,714
22,838
16,238
8,204
7,650
10,200
11,408
10,072
12,146
14,188
20,516
182,620
1988
20,400
19,150
19,430
13,834
11,124
11,540
17,660
18,670
14,980
16,742
10,560
8,572
182,662
1989
12,962
12,344
16,032
12,312
12,750
11,630
15,194
17,220
14,264
15,050
18,948
26,026
184,732
1990
26,592
26,368
26,946
22,788
18,286
18,050
26,410
26,786
22,438
23,060
24,596
35,568
297,888
1991
28,932
28,080
27,153
20,541
17,745
17,394
30,645
28,824
24,762
25,173
28,272
40,182
317,703
1992
35,730
38,859
33,399
28,410
21,024
23,157
33,771
40,143
29,838
32,079
35,967
41,292
393,669
1993
42,726
40,116
37,953
29,589
22,368
20,412
32,904
32,796
27,495
30,621
35,103
40,167
392,250
1994
45,402
41,067
41,277
28,080
21,777
21,399
35,370
32,817
31,062
33,216
33,306
42,738
407,511
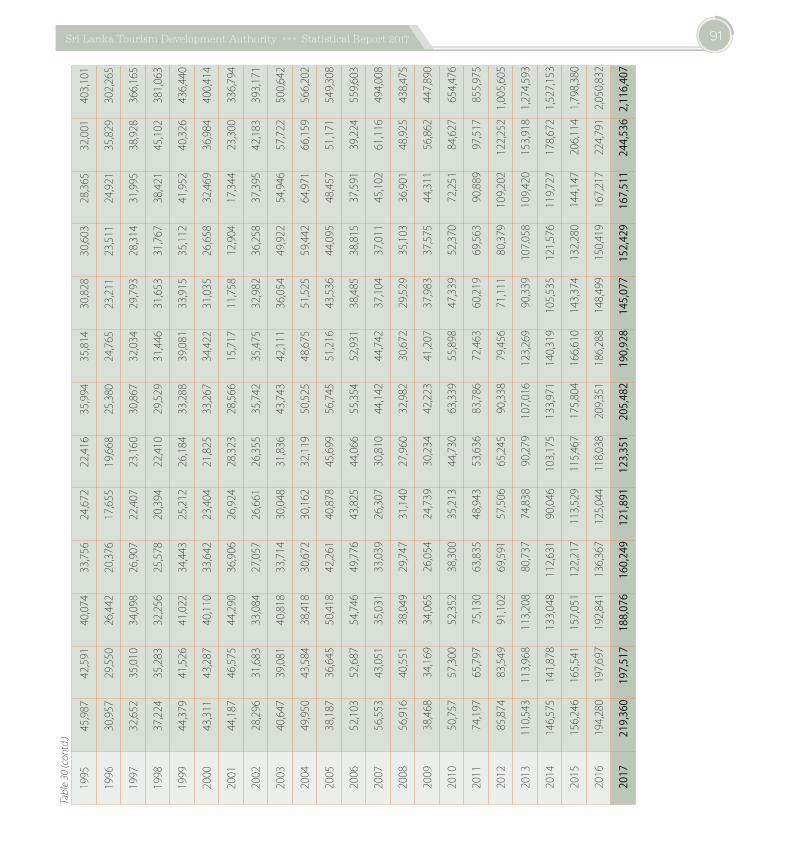
91Sri Lanka Tourism Development Authority »»» Statistical Report 2017
1995
45,987
42,591
40,074
33,756
24,672
22,416
35,994
35,814
30,828
30,603
28,365
32,001
403,101
1996
30,957
29,550
26,442
20,376
17,655
19,668
25,380
24,765
23,211
23,511
24,921
35,829
302,265
1997
32,652
35,010
34,098
26,907
22,407
23,160
30,867
32,034
29,793
28,314
31,995
38,928
366,165
1998
37,224
35,283
32,256
25,578
20,394
22,410
29,529
31,446
31,653
31,767
38,421
45,102
381,063
1999
44,379
41,526
41,022
34,443
25,212
26,184
33,288
39,081
33,915
35,112
41,952
40,326
436,440
2000
43,311
43,287
40,110
33,642
23,404
21,825
33,267
34,422
31,035
26,658
32,469
36,984
400,414
2001
44,187
46,575
44,290
36,906
26,924
28,323
28,566
15,717
11,758
12,904
17,344
23,300
336,794
2002
28,296
31,683
33,084
27,057
26,661
26,355
35,742
35,475
32,982
36,258
37,395
42,183
393,171
2003
40,647
39,081
40,818
33,714
30,048
31,836
43,743
42,111
36,054
49,922
54,946
57,722
500,642
2004
49,950
43,584
38,418
30,672
30,162
32,119
50,525
48,675
51,525
59,442
64,971
66,159
566,202
2005
38,187
36,645
50,418
42,261
40,878
45,699
56,745
51,216
43,536
44,095
48,457
51,171
549,308
2006
52,103
52,687
54,746
49,776
43,825
44,066
55,354
52,931
38,485
38,815
37,591
39,224
559,603
2007
56,553
43,051
35,031
33,039
26,307
30,810
44,142
44,742
37,104
37,011
45,102
61,116
494,008
2008
56,916
40,551
38,049
29,747
31,140
27,960
32,982
30,672
29,529
35,103
36,901
48,925
438,475
2009
38,468
34,169
34,065
26,054
24,739
30,234
42,223
41,207
37,983
37,575
44,311
56,862
447,890
2010
50,757
57,300
52,352
38,300
35,213
44,730
63,339
55,898
47,339
52,370
72,251
84,627
654,476
2011
74,197
65,797
75,130
63,835
48,943
53,636
83,786
72,463
60,219
69,563
90,889
97,517
855,975
2012
85,874
83,549
91,102
69,591
57,506
65,245
90,338
79,456
71,111
80,379
109,202
122,2521,005,605
2013
110,543
113,968
113,208
80,737
74,838
90,279
107,016
123,269
90,339
107,058
109,420
153,9181,274,593
2014
146,575
141,878
133,048
112,631
90,046
103,175
133,971
140,319
105,535
121,576
119,727
178,6721,527,153
2015
156,246
165,541
157,051
122,217
113,529
115,467
175,804
166,610
143,374
132,280
144,147
206,1141,798,380
2016
194,280
197,697
192,841
136,367
125,044
118,038
209,351
186,288
148,499
150,419
167,217
224,7912,050,832
2017
219,
360
197,
517
188,
076
160,
249
121,
891
123,
351
205,
482
190,
928
145,
077
152,
429
167,
511
244,
536
2,11
6,40
7
Table30(contd.)
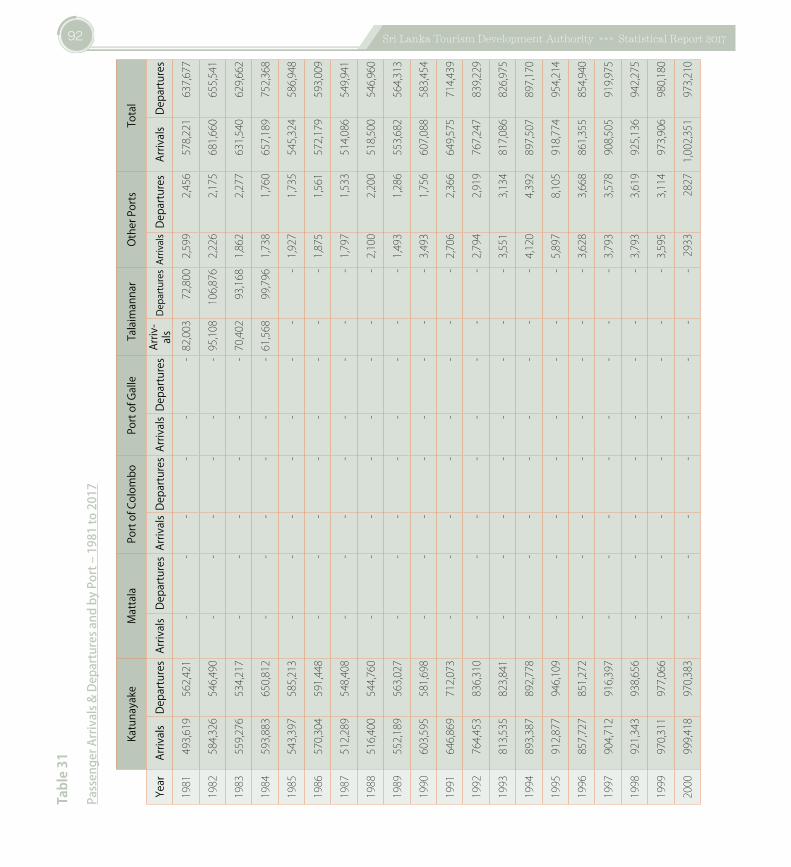
92 Sri Lanka Tourism Development Authority »»» Statistical Report 2017
Table31
PassengerArrivals&DeparturesandbyPort–1981to2017
Ka
tuna
yake
Mat
tala
Port
of C
olom
boPo
rt of
Gal
leTa
laim
anna
rOt
her P
orts
Tota
l
Year
Arriv
als
Depa
rture
sAr
rival
sDe
partu
res
Arriv
als
Depa
rture
sAr
rival
sDe
partu
res
Arriv
-al
sDe
partu
res
Arriv
als
Depa
rture
sAr
rival
sDe
partu
res
1981
493,619
562,421
--
--
--82,003
72,8002,599
2,456
578,221
637,677
1982
584,326
546,490
--
--
--95,108106,876
2,226
2,175
681,660
655,541
1983
559,276
534,217
--
--
--70,402
93,1681,862
2,277
631,540
629,662
1984
593,883
650,812
--
--
--61,568
99,7961,738
1,760
657,189
752,368
1985
543,397
585,213
--
--
--
--1,927
1,735
545,324
586,948
1986
570,304
591,448
--
--
--
--1,875
1,561
572,179
593,009
1987
512,289
548,408
--
--
--
--1,797
1,533
514,086
549,941
1988
516,400
544,760
--
--
--
--2,100
2,200
518,500
546,960
1989
552,189
563,027
--
--
--
--1,493
1,286
553,682
564,313
1990
603,595
581,698
--
--
--
--3,493
1,756
607,088
583,454
1991
646,869
712,073
--
--
--
--2,706
2,366
649,575
714,439
1992
764,453
836,310
--
--
--
--2,794
2,919
767,247
839,229
1993
813,535
823,841
--
--
--
--3,551
3,134
817,086
826,975
1994
893,387
892,778
--
--
--
--4,120
4,392
897,507
897,170
1995
912,877
946,109
--
--
--
--5,897
8,105
918,774
954,214
1996
857,727
851,272
--
--
--
--3,628
3,668
861,355
854,940
1997
904,712
916,397
--
--
--
--3,793
3,578
908,505
919,975
1998
921,343
938,656
--
--
--
--3,793
3,619
925,136
942,275
1999
970,311
977,066
--
--
--
--3,595
3,114
973,906
980,180
2000
999,418
970,383
--
--
--
--2933
2827
1,002,351
973,210
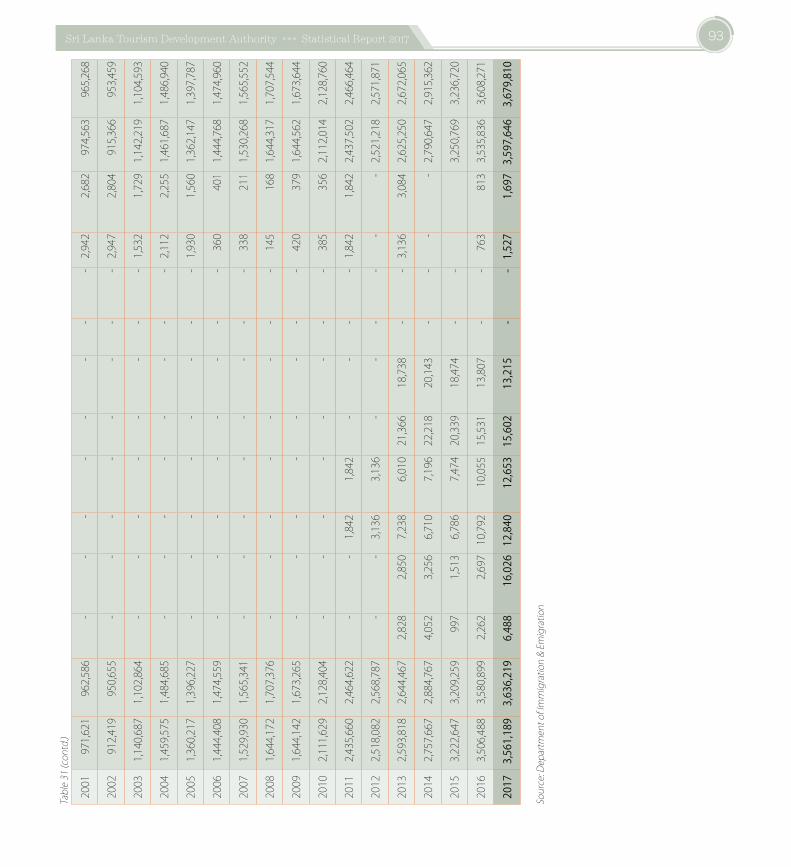
93Sri Lanka Tourism Development Authority »»» Statistical Report 2017
2001
971,621
962,586
--
--
--
--2,942
2,682
974,563
965,268
2002
912,419
950,655
--
--
--
--2,947
2,804
915,366
953,459
2003
1,140,6871,102,864
--
--
--
--1,532
1,729
1,142,2191,104,593
2004
1,459,5751,484,685
--
--
--
--2,112
2,255
1,461,6871,486,940
2005
1,360,2171,396,227
--
--
--
--1,930
1,560
1,362,1471,397,787
2006
1,444,4081,474,559
--
--
--
--
360
4011,444,7681,474,960
2007
1,529,9301,565,341
--
--
--
--
338
2111,530,2681,565,552
2008
1,644,1721,707,376
--
--
--
--
145
1681,644,3171,707,544
2009
1,644,1421,673,265
--
--
--
--
420
3791,644,5621,673,644
2010
2,111,6292,128,404
--
--
--
--
385
3562,112,0142,128,760
2011
2,435,6602,464,622
--1,842
1,842
--
--1,842
1,842
2,437,5022,466,464
2012
2,518,0822,568,787
--3,136
3,136
--
--
--2,521,2182,571,871
2013
2,593,8182,644,467
2,828
2,850
7,238
6,010
21,366
18,738
--3,136
3,084
2,625,2502,672,065
2014
2,757,6672,884,767
4,052
3,256
6,710
7,196
22,218
20,143
--
--2,790,6472,915,362
2015
3,222,6473,209,259
997
1,513
6,786
7,474
20,339
18,474
--
3,250,7693,236,720
2016
3,506,4883,580,899
2,262
2,69710,792
10,05515,531
13,807
--
763
8133,535,8363,608,271
2017
3,56
1,18
93,
636,
219
6,48
816
,026
12,8
4012
,653
15,6
0213
,215
--
1,52
71,
697
3,59
7,64
63,
679,
810
Source:DepartmentofImmigration&Emigration
Table31(contd.)

94 Sri Lanka Tourism Development Authority »»» Statistical Report 2017
REVENUEFROMTOURISM
Table32
ConferencesHeld&RevenueEarnedatBandaranaikeMemorialInternationalConferenceHall(BMICH)–1987to2017
YearConference Status Number of Delegates Revenue
National International Local Foreign in Rs. ’0001987 50 8 25,410 376 1,619.01988 42 4 13,850 156 1,264.31989 34 9 8,639 592 777.11990 31 7 12,145 2,011 1,201.31991 40 6 12,000 2,500 1,700.01992 127 33 69,601 5,248 13,939.31993 141 11 20,080 5,540 7,798.21994 105 9 35,080 1,730 4,906.71995 120 10 40,000 1,900 5,933.21996 152 16 58,000 1,300 5,411.21997 98 10 48,415 3,150 4,157.51998 101 5 49,475 1,550 6,039.41999 125 1 55,855 350 4,759.02000 134 4 54,110 600 6,685.52001 83 13 35,001 400 3,574.52002 577 6 285,545 1,005 46,244.72003 594 4 324,565 650 61,762.12004 642 4 432,510 1,550 70,700.52005 660 12 502,335 2,120 101,381.02006 804 17 916,845 2,560 120,490.42007 844 3 310,100 625 142,919.12008 758 3 294,870 475 137,504.42009 751 3 289,080 725 146,730.52010 442 1 175,980 200 133,426.72011 441 3 163,275 625 178,289.52012 496 10 223,650 4500 239,228.62013 595 4 349,850 250 233,781.42014 768 7 591,200 1200 400,210.02015 866 4 645,000 750 389,760.12016 994 6 965,000 1,350 551,405.02017 1068 6 750,000 850 648,841.6
Source:BMICH
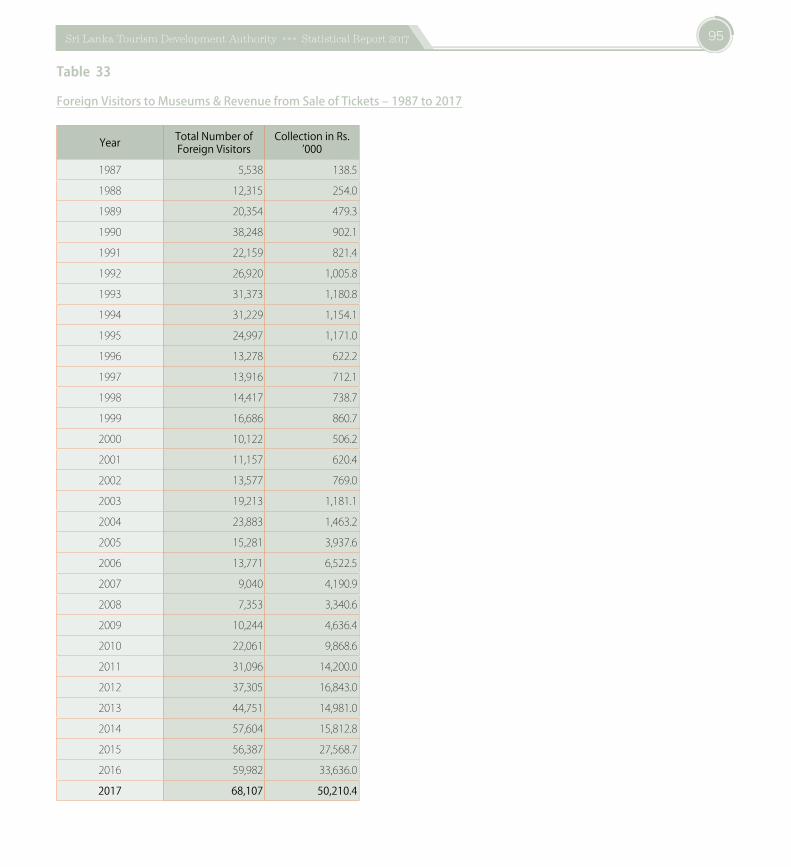
95Sri Lanka Tourism Development Authority »»» Statistical Report 2017
Table33
ForeignVisitorstoMuseums&RevenuefromSaleofTickets–1987to2017
Year Total Number of Foreign Visitors
Collection in Rs. ’000
1987 5,538 138.5
1988 12,315 254.0
1989 20,354 479.3
1990 38,248 902.1
1991 22,159 821.4
1992 26,920 1,005.8
1993 31,373 1,180.8
1994 31,229 1,154.1
1995 24,997 1,171.0
1996 13,278 622.2
1997 13,916 712.1
1998 14,417 738.7
1999 16,686 860.7
2000 10,122 506.2
2001 11,157 620.4
2002 13,577 769.0
2003 19,213 1,181.1
2004 23,883 1,463.2
2005 15,281 3,937.6
2006 13,771 6,522.5
2007 9,040 4,190.9
2008 7,353 3,340.6
2009 10,244 4,636.4
2010 22,061 9,868.6
2011 31,096 14,200.0
2012 37,305 16,843.0
2013 44,751 14,981.0
2014 57,604 15,812.8
2015 56,387 27,568.7
2016 59,982 33,636.0
2017 68,107 50,210.4
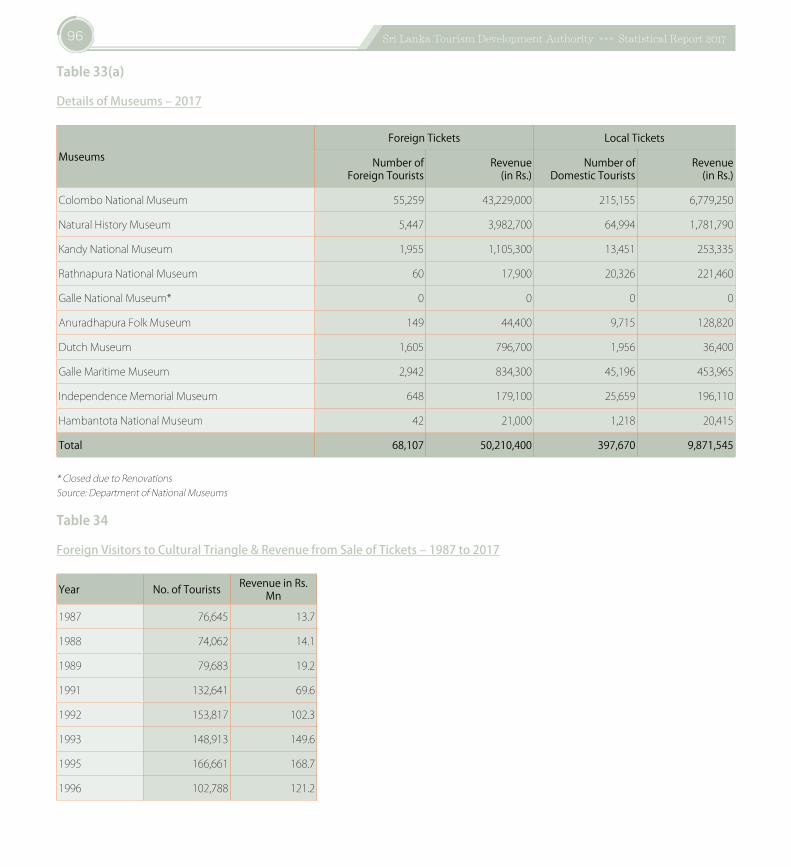
96 Sri Lanka Tourism Development Authority »»» Statistical Report 2017
Table33(a)
DetailsofMuseums–2017
MuseumsForeign Tickets Local Tickets
Number of Foreign Tourists
Revenue(in Rs.)
Number of Domestic Tourists
Revenue(in Rs.)
ColomboNationalMuseum 55,259 43,229,000 215,155 6,779,250
NaturalHistoryMuseum 5,447 3,982,700 64,994 1,781,790
KandyNationalMuseum 1,955 1,105,300 13,451 253,335
RathnapuraNationalMuseum 60 17,900 20,326 221,460
GalleNationalMuseum* 0 0 0 0
AnuradhapuraFolkMuseum 149 44,400 9,715 128,820
DutchMuseum 1,605 796,700 1,956 36,400
GalleMaritimeMuseum 2,942 834,300 45,196 453,965
IndependenceMemorialMuseum 648 179,100 25,659 196,110
HambantotaNationalMuseum 42 21,000 1,218 20,415
Total 68,107 50,210,400 397,670 9,871,545
*ClosedduetoRenovationsSource:DepartmentofNationalMuseums
Table34
ForeignVisitorstoCulturalTriangle&RevenuefromSaleofTickets–1987to2017
Year No. of Tourists Revenue in Rs. Mn
1987 76,645 13.7
1988 74,062 14.1
1989 79,683 19.2
1991 132,641 69.6
1992 153,817 102.3
1993 148,913 149.6
1995 166,661 168.7
1996 102,788 121.2
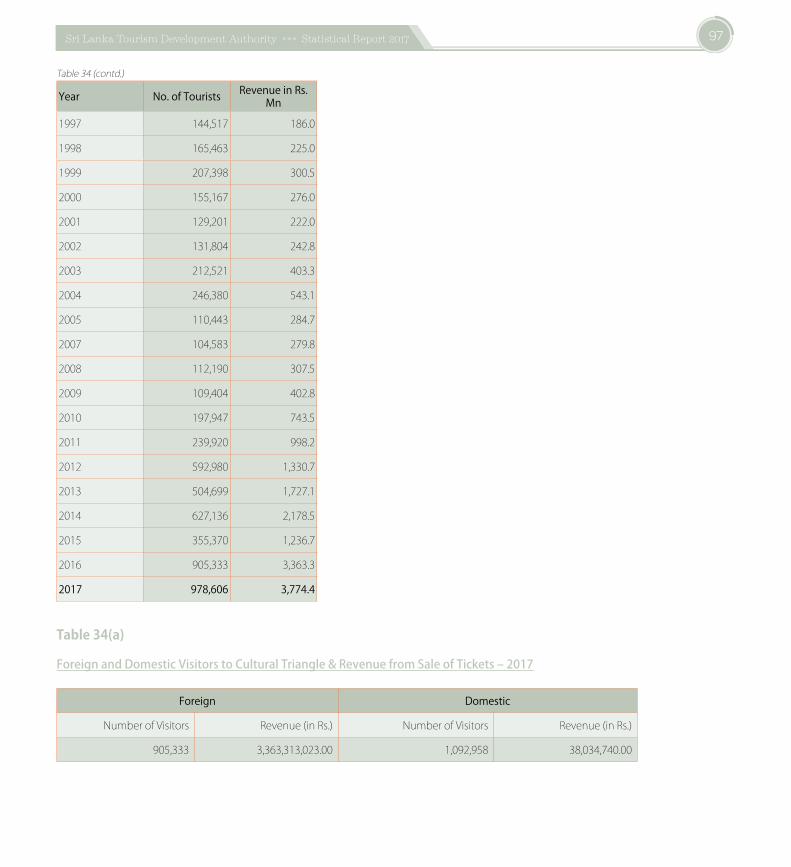
97Sri Lanka Tourism Development Authority »»» Statistical Report 2017
Year No. of Tourists Revenue in Rs. Mn
1997 144,517 186.0
1998 165,463 225.0
1999 207,398 300.5
2000 155,167 276.0
2001 129,201 222.0
2002 131,804 242.8
2003 212,521 403.3
2004 246,380 543.1
2005 110,443 284.7
2007 104,583 279.8
2008 112,190 307.5
2009 109,404 402.8
2010 197,947 743.5
2011 239,920 998.2
2012 592,980 1,330.7
2013 504,699 1,727.1
2014 627,136 2,178.5
2015 355,370 1,236.7
2016 905,333 3,363.3
2017 978,606 3,774.4
Table34(a)
ForeignandDomesticVisitorstoCulturalTriangle&RevenuefromSaleofTickets–2017
Foreign Domestic
NumberofVisitors Revenue(inRs.) NumberofVisitors Revenue(inRs.)
905,333 3,363,313,023.00 1,092,958 38,034,740.00
Table34(contd.)
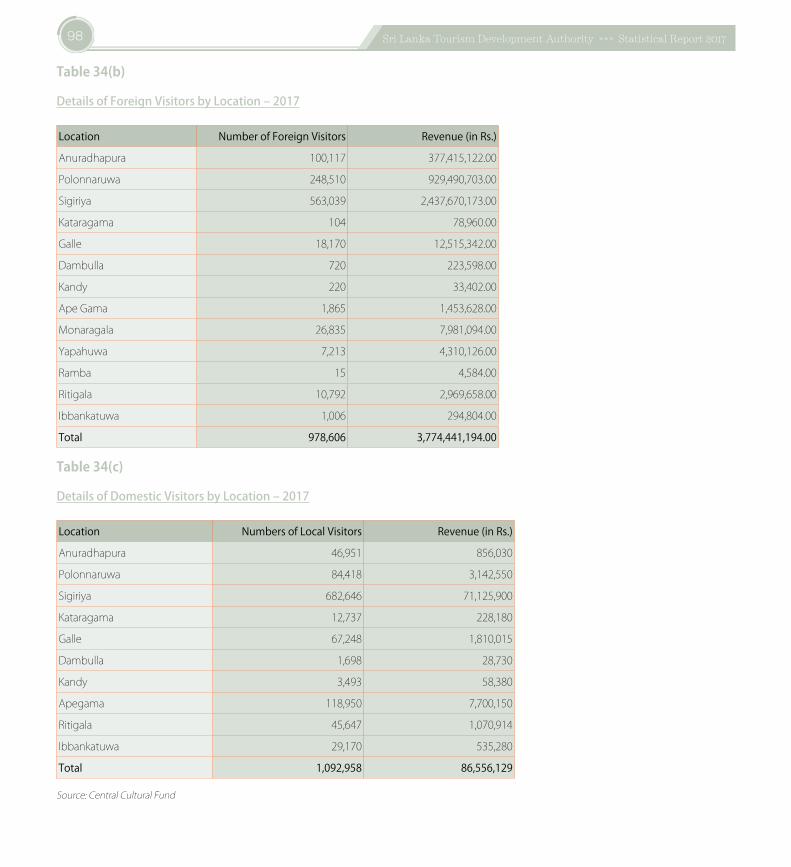
98 Sri Lanka Tourism Development Authority »»» Statistical Report 2017
Table34(b)
DetailsofForeignVisitorsbyLocation–2017 Location Number of Foreign Visitors Revenue (in Rs.)
Anuradhapura 100,117 377,415,122.00
Polonnaruwa 248,510 929,490,703.00
Sigiriya 563,039 2,437,670,173.00
Kataragama 104 78,960.00
Galle 18,170 12,515,342.00
Dambulla 720 223,598.00
Kandy 220 33,402.00
ApeGama 1,865 1,453,628.00
Monaragala 26,835 7,981,094.00
Yapahuwa 7,213 4,310,126.00
Ramba 15 4,584.00
Ritigala 10,792 2,969,658.00
Ibbankatuwa 1,006 294,804.00
Total 978,606 3,774,441,194.00
Table34(c)
DetailsofDomesticVisitorsbyLocation–2017
Location Numbers of Local Visitors Revenue (in Rs.)
Anuradhapura 46,951 856,030
Polonnaruwa 84,418 3,142,550
Sigiriya 682,646 71,125,900
Kataragama 12,737 228,180
Galle 67,248 1,810,015
Dambulla 1,698 28,730
Kandy 3,493 58,380
Apegama 118,950 7,700,150
Ritigala 45,647 1,070,914
Ibbankatuwa 29,170 535,280
Total 1,092,958 86,556,129
Source:CentralCulturalFund
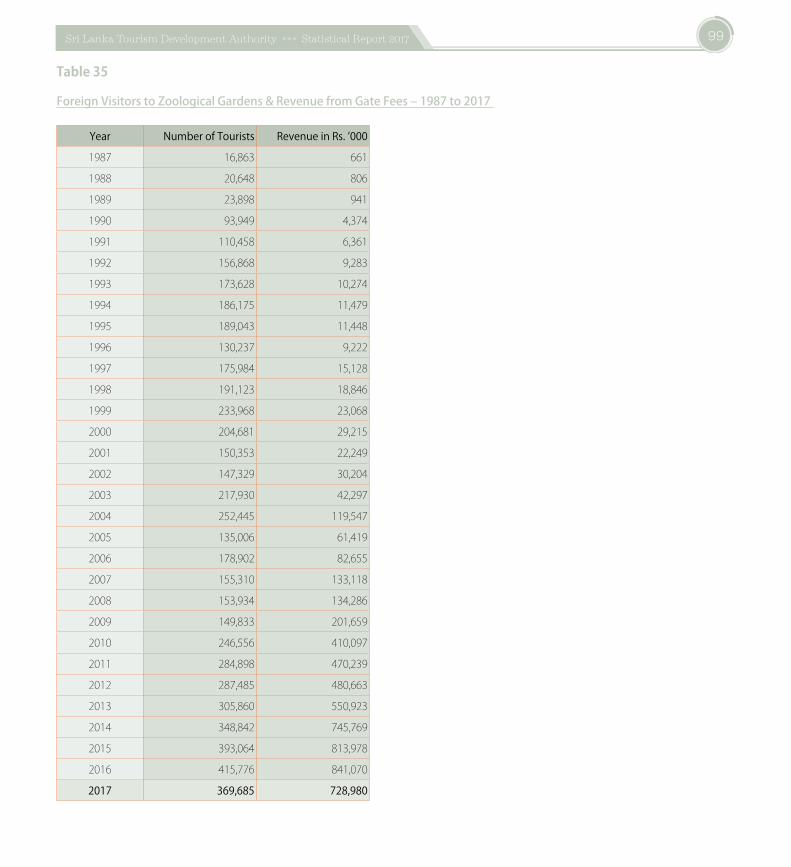
99Sri Lanka Tourism Development Authority »»» Statistical Report 2017
Table35
ForeignVisitorstoZoologicalGardens&RevenuefromGateFees–1987to2017
Year Number of Tourists Revenue in Rs. ’000
1987 16,863 661
1988 20,648 806
1989 23,898 941
1990 93,949 4,374
1991 110,458 6,361
1992 156,868 9,283
1993 173,628 10,274
1994 186,175 11,479
1995 189,043 11,448
1996 130,237 9,222
1997 175,984 15,128
1998 191,123 18,846
1999 233,968 23,068
2000 204,681 29,215
2001 150,353 22,249
2002 147,329 30,204
2003 217,930 42,297
2004 252,445 119,547
2005 135,006 61,419
2006 178,902 82,655
2007 155,310 133,118
2008 153,934 134,286
2009 149,833 201,659
2010 246,556 410,097
2011 284,898 470,239
2012 287,485 480,663
2013 305,860 550,923
2014 348,842 745,769
2015 393,064 813,978
2016 415,776 841,070
2017 369,685 728,980
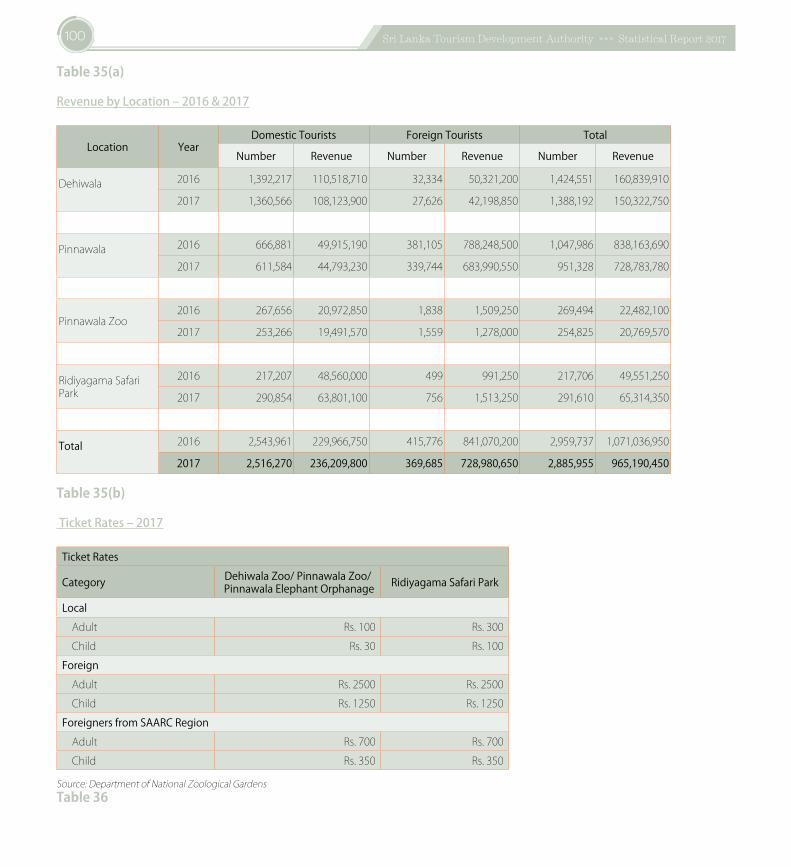
100 Sri Lanka Tourism Development Authority »»» Statistical Report 2017
Table35(a)
RevenuebyLocation–2016&2017
Location YearDomestic Tourists Foreign Tourists Total
Number Revenue Number Revenue Number Revenue
Dehiwala
2016 1,392,217 110,518,710 32,334 50,321,200 1,424,551 160,839,910
2017 1,360,566 108,123,900 27,626 42,198,850 1,388,192 150,322,750
Pinnawala
2016 666,881 49,915,190 381,105 788,248,500 1,047,986 838,163,690
2017 611,584 44,793,230 339,744 683,990,550 951,328 728,783,780
PinnawalaZoo2016 267,656 20,972,850 1,838 1,509,250 269,494 22,482,100
2017 253,266 19,491,570 1,559 1,278,000 254,825 20,769,570
RidiyagamaSafariPark
2016 217,207 48,560,000 499 991,250 217,706 49,551,250
2017 290,854 63,801,100 756 1,513,250 291,610 65,314,350
Total
2016 2,543,961 229,966,750 415,776 841,070,200 2,959,737 1,071,036,950
2017 2,516,270 236,209,800 369,685 728,980,650 2,885,955 965,190,450
Table35(b)
TicketRates–2017
Ticket Rates
Category Dehiwala Zoo/ Pinnawala Zoo/ Pinnawala Elephant Orphanage Ridiyagama Safari Park
LocalAdult Rs.100 Rs.300Child Rs.30 Rs.100ForeignAdult Rs.2500 Rs.2500Child Rs.1250 Rs.1250Foreigners from SAARC RegionAdult Rs.700 Rs.700Child Rs.350 Rs.350
Source:DepartmentofNationalZoologicalGardensTable36
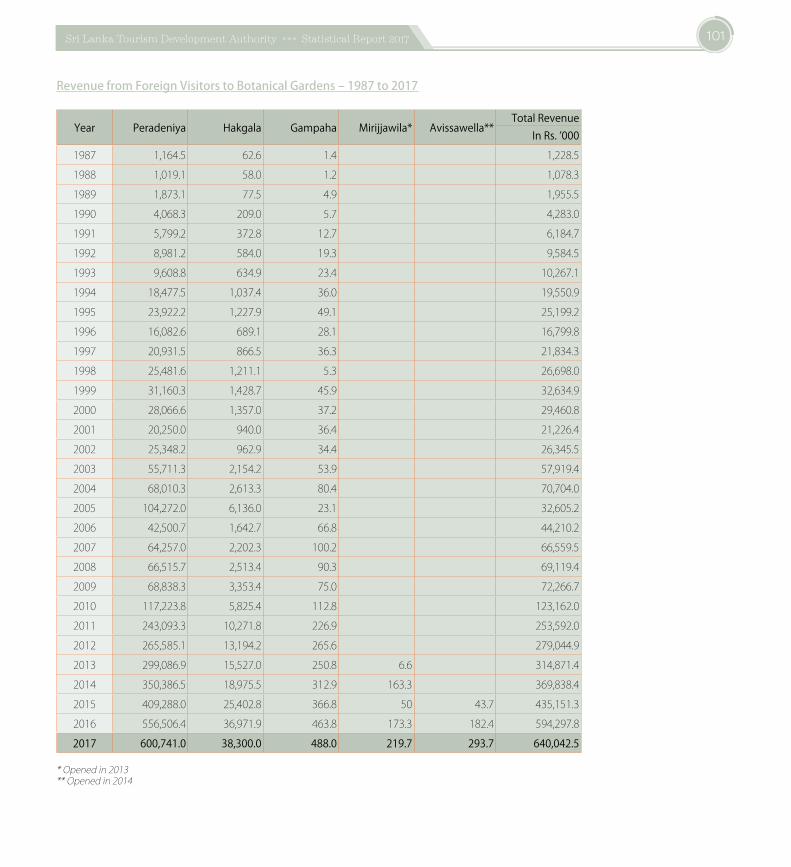
101Sri Lanka Tourism Development Authority »»» Statistical Report 2017
RevenuefromForeignVisitorstoBotanicalGardens–1987to2017
Year Peradeniya Hakgala Gampaha Mirijjawila* Avissawella**Total Revenue
In Rs. ’0001987 1,164.5 62.6 1.4 1,228.51988 1,019.1 58.0 1.2 1,078.31989 1,873.1 77.5 4.9 1,955.51990 4,068.3 209.0 5.7 4,283.01991 5,799.2 372.8 12.7 6,184.71992 8,981.2 584.0 19.3 9,584.51993 9,608.8 634.9 23.4 10,267.11994 18,477.5 1,037.4 36.0 19,550.91995 23,922.2 1,227.9 49.1 25,199.21996 16,082.6 689.1 28.1 16,799.81997 20,931.5 866.5 36.3 21,834.31998 25,481.6 1,211.1 5.3 26,698.01999 31,160.3 1,428.7 45.9 32,634.92000 28,066.6 1,357.0 37.2 29,460.82001 20,250.0 940.0 36.4 21,226.42002 25,348.2 962.9 34.4 26,345.52003 55,711.3 2,154.2 53.9 57,919.42004 68,010.3 2,613.3 80.4 70,704.02005 104,272.0 6,136.0 23.1 32,605.22006 42,500.7 1,642.7 66.8 44,210.22007 64,257.0 2,202.3 100.2 66,559.52008 66,515.7 2,513.4 90.3 69,119.42009 68,838.3 3,353.4 75.0 72,266.72010 117,223.8 5,825.4 112.8 123,162.02011 243,093.3 10,271.8 226.9 253,592.02012 265,585.1 13,194.2 265.6 279,044.92013 299,086.9 15,527.0 250.8 6.6 314,871.42014 350,386.5 18,975.5 312.9 163.3 369,838.42015 409,288.0 25,402.8 366.8 50 43.7 435,151.32016 556,506.4 36,971.9 463.8 173.3 182.4 594,297.82017 600,741.0 38,300.0 488.0 219.7 293.7 640,042.5
*Openedin2013**Openedin2014
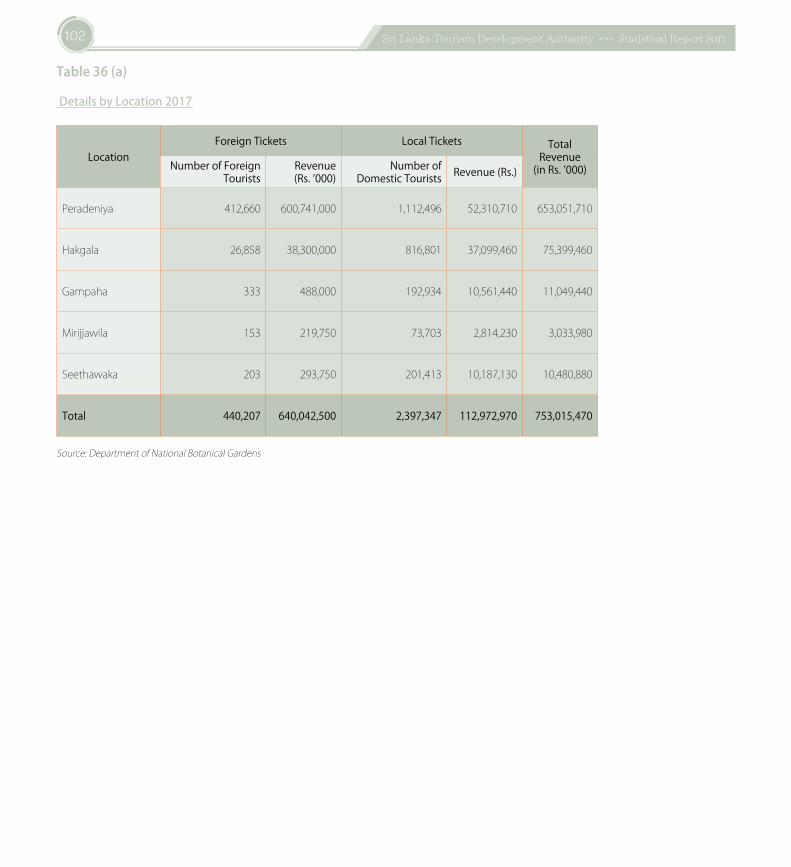
102 Sri Lanka Tourism Development Authority »»» Statistical Report 2017
Table36(a)
DetailsbyLocation2017
LocationForeign Tickets Local Tickets Total
Revenue (in Rs. ’000) Number of Foreign
TouristsRevenue(Rs. ’000)
Number of Domestic Tourists Revenue (Rs.)
Peradeniya 412,660 600,741,000 1,112,496 52,310,710 653,051,710
Hakgala 26,858 38,300,000 816,801 37,099,460 75,399,460
Gampaha 333 488,000 192,934 10,561,440 11,049,440
Mirijjawila 153 219,750 73,703 2,814,230 3,033,980
Seethawaka 203 293,750 201,413 10,187,130 10,480,880
Total 440,207 640,042,500 2,397,347 112,972,970 753,015,470
Source:DepartmentofNationalBotanicalGardens
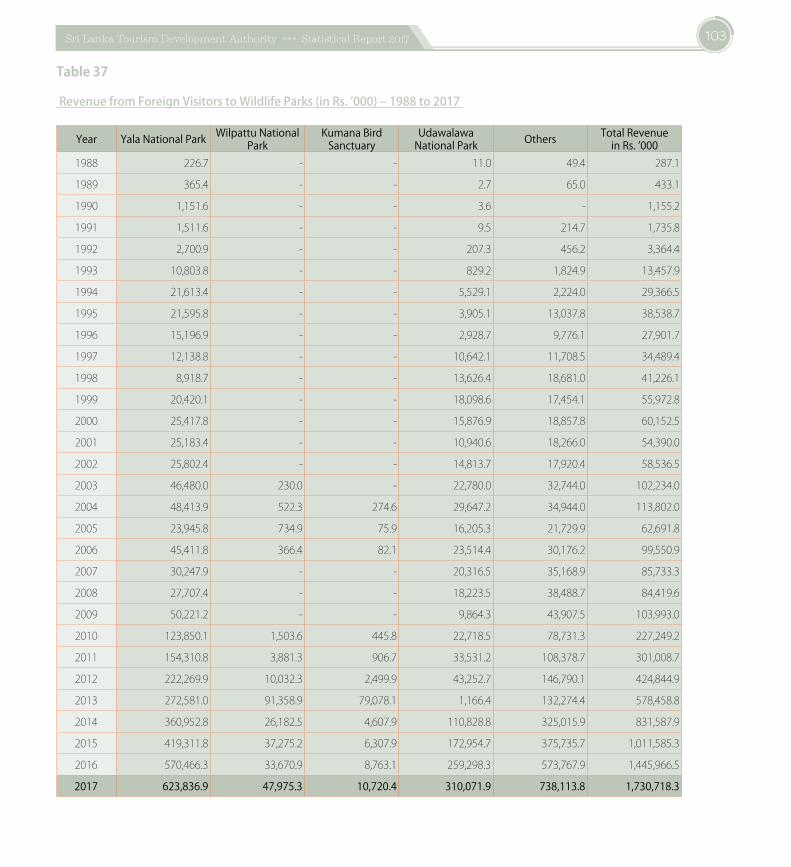
103Sri Lanka Tourism Development Authority »»» Statistical Report 2017
Table37
RevenuefromForeignVisitorstoWildlifeParks(inRs.’000)–1988to2017
Year Yala National Park Wilpattu National Park
Kumana Bird Sanctuary
UdawalawaNational Park Others Total Revenue
in Rs. ’0001988 226.7 - - 11.0 49.4 287.1
1989 365.4 - - 2.7 65.0 433.1
1990 1,151.6 - - 3.6 - 1,155.2
1991 1,511.6 - - 9.5 214.7 1,735.8
1992 2,700.9 - - 207.3 456.2 3,364.4
1993 10,803.8 - - 829.2 1,824.9 13,457.9
1994 21,613.4 - - 5,529.1 2,224.0 29,366.5
1995 21,595.8 - - 3,905.1 13,037.8 38,538.7
1996 15,196.9 - - 2,928.7 9,776.1 27,901.7
1997 12,138.8 - - 10,642.1 11,708.5 34,489.4
1998 8,918.7 - - 13,626.4 18,681.0 41,226.1
1999 20,420.1 - - 18,098.6 17,454.1 55,972.8
2000 25,417.8 - - 15,876.9 18,857.8 60,152.5
2001 25,183.4 - - 10,940.6 18,266.0 54,390.0
2002 25,802.4 - - 14,813.7 17,920.4 58,536.5
2003 46,480.0 230.0 - 22,780.0 32,744.0 102,234.0
2004 48,413.9 522.3 274.6 29,647.2 34,944.0 113,802.0
2005 23,945.8 734.9 75.9 16,205.3 21,729.9 62,691.8
2006 45,411.8 366.4 82.1 23,514.4 30,176.2 99,550.9
2007 30,247.9 - - 20,316.5 35,168.9 85,733.3
2008 27,707.4 - - 18,223.5 38,488.7 84,419.6
2009 50,221.2 - - 9,864.3 43,907.5 103,993.0
2010 123,850.1 1,503.6 445.8 22,718.5 78,731.3 227,249.2
2011 154,310.8 3,881.3 906.7 33,531.2 108,378.7 301,008.7
2012 222,269.9 10,032.3 2,499.9 43,252.7 146,790.1 424,844.9
2013 272,581.0 91,358.9 79,078.1 1,166.4 132,274.4 578,458.8
2014 360,952.8 26,182.5 4,607.9 110,828.8 325,015.9 831,587.9
2015 419,311.8 37,275.2 6,307.9 172,954.7 375,735.7 1,011,585.3
2016 570,466.3 33,670.9 8,763.1 259,298.3 573,767.9 1,445,966.5
2017 623,836.9 47,975.3 10,720.4 310,071.9 738,113.8 1,730,718.3
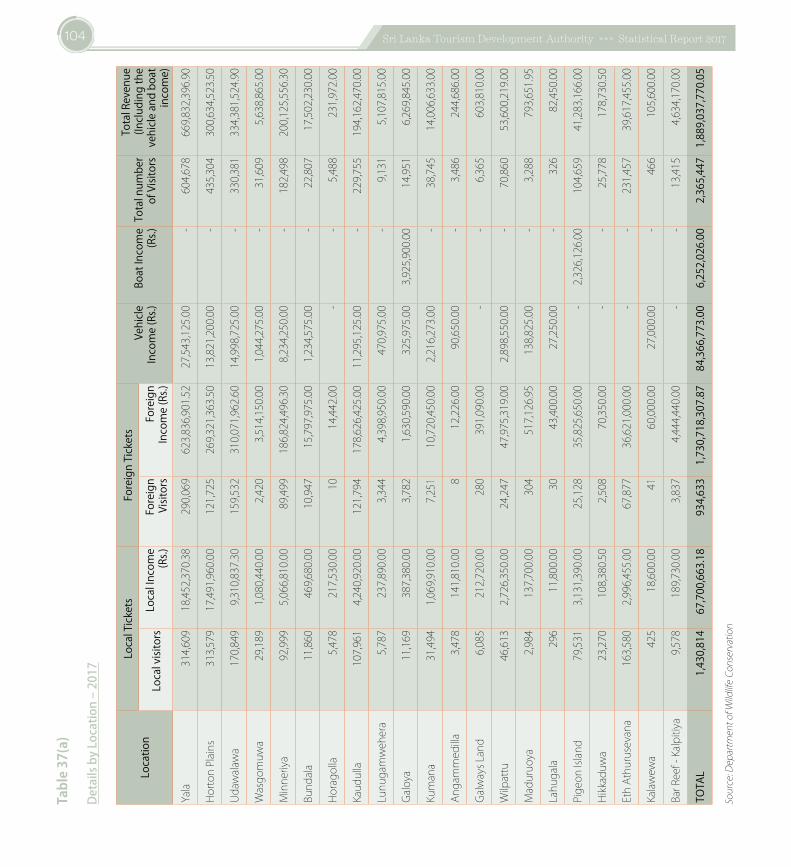
104 Sri Lanka Tourism Development Authority »»» Statistical Report 2017
Table37(a)
DetailsbyLocation–2017
Loca
tion
Loca
l Tick
ets
Fore
ign
Tick
ets
Vehi
cleIn
com
e (R
s.)Bo
at In
com
e (R
s.)To
tal n
umbe
r of
Visi
tors
Tota
l Rev
enue
(Inclu
ding
the
vehi
cle an
d bo
at
inco
me)
Loca
l visi
tors
Loca
l Inco
me
(Rs.)
Fore
ign
Visit
ors
Fore
ign
Inco
me
(Rs.)
Yala
314,609
18,452,370.38
290,069
623,836,901.52
27,543,125.00
-604,678
669,832,396.90
HortonPlains
313,579
17,491,960.00
121,725
269,321,363.50
13,821,200.00
-435,304
300,634,523.50
Udawalawa
170,849
9,310,837.30
159,532
310,071,962.60
14,998,725.00
-330,381
334,381,524.90
Wasgomuwa
29,189
1,080,440.00
2,420
3,514,150.00
1,044,275.00
-31,609
5,638,865.00
Minneriya
92,999
5,066,810.00
89,499
186,824,496.30
8,234,250.00
-182,498
200,125,556.30
Bundala
11,860
469,680.00
10,947
15,797,975.00
1,234,575.00
-22,807
17,502,230.00
Horagolla
5,478
217,530.00
1014,442.00
--
5,488
231,972.00
Kaudulla
107,961
4,240,920.00
121,794
178,626,425.00
11,295,125.00
-229,755
194,162,470.00
Lunugamwehera
5,787
237,890.00
3,344
4,398,950.00
470,975.00
-9,131
5,107,815.00
Galoya
11,169
387,380.00
3,782
1,630,590.00
325,975.00
3,925,900.00
14,951
6,269,845.00
Kumana
31,494
1,069,910.00
7,251
10,720,450.00
2,216,273.00
-38,745
14,006,633.00
Angammedilla
3,478
141,810.00
812,226.00
90,650.00
-3,486
244,686.00
GalwaysLand
6,085
212,720.00
280
391,090.00
--
6,365
603,810.00
Wilpattu
46,613
2,726,350.00
24,247
47,975,319.00
2,898,550.00
-70,860
53,600,219.00
Maduruoya
2,984
137,700.00
304
517,126.95
138,825.00
-3,288
793,651.95
Lahugala
296
11,800.00
3043,400.00
27,250.00
-326
82,450.00
PigeonIsland
79,531
3,131,390.00
25,128
35,825,650.00
-2,326,126.00
104,659
41,283,166.00
Hikkaduwa
23,270
108,380.50
2,508
70,350.00
--
25,778
178,730.50
EthAthurusevana
163,580
2,996,455.00
67,877
36,621,000.00
--
231,457
39,617,455.00
Kalawewa
425
18,600.00
4160,000.00
27,000.00
-466
105,600.00
BarReef-Kalpitiya
9,578
189,730.00
3,837
4,444,440.00
--
13,415
4,634,170.00
TOTA
L1,
430,
814
67,7
00,6
63.1
893
4,63
31,
730,
718,
307.
8784
,366
,773
.00
6,25
2,02
6.00
2,36
5,44
71,
889,
037,
770.
05
Source:DepartmentofWildlifeConservation
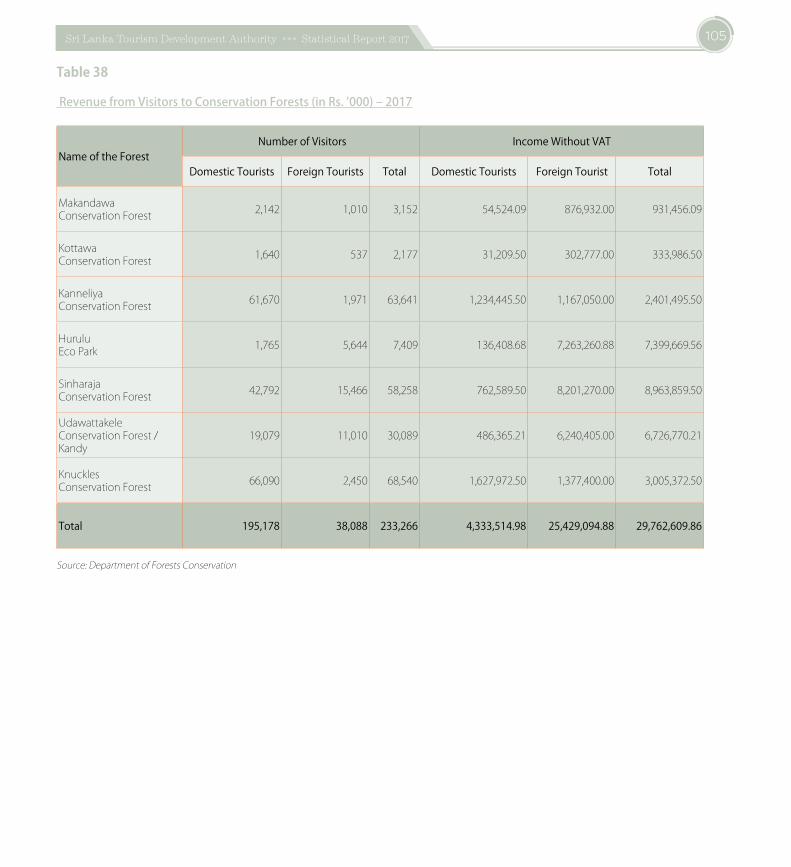
105Sri Lanka Tourism Development Authority »»» Statistical Report 2017
Table38
RevenuefromVisitorstoConservationForests(inRs.’000)–2017
Name of the Forest Number of Visitors Income Without VAT
Domestic Tourists Foreign Tourists Total Domestic Tourists Foreign Tourist Total
MakandawaConservationForest 2,142 1,010 3,152 54,524.09 876,932.00 931,456.09
KottawaConservationForest 1,640 537 2,177 31,209.50 302,777.00 333,986.50
KanneliyaConservationForest 61,670 1,971 63,641 1,234,445.50 1,167,050.00 2,401,495.50
HuruluEcoPark 1,765 5,644 7,409 136,408.68 7,263,260.88 7,399,669.56
SinharajaConservationForest 42,792 15,466 58,258 762,589.50 8,201,270.00 8,963,859.50
UdawattakeleConservationForest/Kandy
19,079 11,010 30,089 486,365.21 6,240,405.00 6,726,770.21
KnucklesConservationForest 66,090 2,450 68,540 1,627,972.50 1,377,400.00 3,005,372.50
Total 195,178 38,088 233,266 4,333,514.98 25,429,094.88 29,762,609.86
Source:DepartmentofForestsConservation
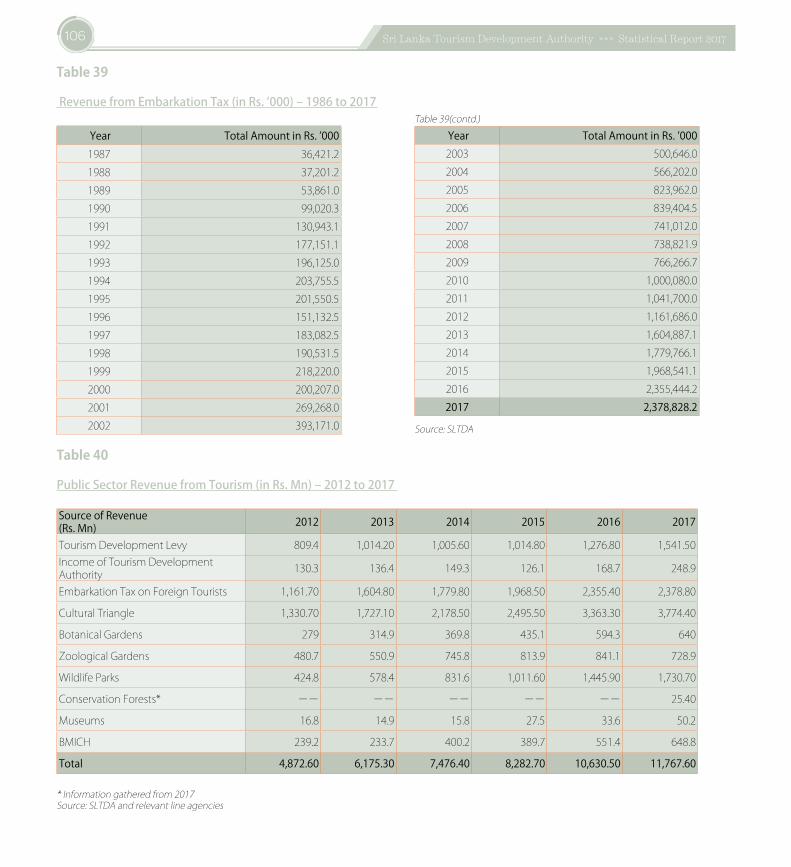
106 Sri Lanka Tourism Development Authority »»» Statistical Report 2017
Table39
RevenuefromEmbarkationTax(inRs.’000)–1986to2017
Year Total Amount in Rs. ’0001987 36,421.21988 37,201.21989 53,861.01990 99,020.31991 130,943.11992 177,151.11993 196,125.01994 203,755.51995 201,550.51996 151,132.51997 183,082.51998 190,531.51999 218,220.02000 200,207.02001 269,268.02002 393,171.0
Table40
PublicSectorRevenuefromTourism(inRs.Mn)–2012to2017
Source of Revenue (Rs. Mn) 2012 2013 2014 2015 2016 2017
TourismDevelopmentLevy 809.4 1,014.20 1,005.60 1,014.80 1,276.80 1,541.50IncomeofTourismDevelopmentAuthority 130.3 136.4 149.3 126.1 168.7 248.9
EmbarkationTaxonForeignTourists 1,161.70 1,604.80 1,779.80 1,968.50 2,355.40 2,378.80
CulturalTriangle 1,330.70 1,727.10 2,178.50 2,495.50 3,363.30 3,774.40
BotanicalGardens 279 314.9 369.8 435.1 594.3 640
ZoologicalGardens 480.7 550.9 745.8 813.9 841.1 728.9
WildlifeParks 424.8 578.4 831.6 1,011.60 1,445.90 1,730.70
ConservationForests* −− −− −− −− −− 25.40
Museums 16.8 14.9 15.8 27.5 33.6 50.2
BMICH 239.2 233.7 400.2 389.7 551.4 648.8
Total 4,872.60 6,175.30 7,476.40 8,282.70 10,630.50 11,767.60
*Informationgatheredfrom2017Source:SLTDAandrelevantlineagencies
Year Total Amount in Rs. ’0002003 500,646.02004 566,202.02005 823,962.02006 839,404.52007 741,012.02008 738,821.92009 766,266.72010 1,000,080.02011 1,041,700.02012 1,161,686.02013 1,604,887.12014 1,779,766.12015 1,968,541.12016 2,355,444.22017 2,378,828.2
Source:SLTDA
Table39(contd.)
Research & International Relations DivisionSri Lanka Tourism Development AuthorityP. O. Box 1504No. 80, Galle RoadColombo – 03Sri Lanka.
Tel : +94 11 243 7055/ +94 11 242 6800Fax : + 94 11 238 0943Email : [email protected] : www.sltda.lk
Printed by Karunaratne & Sons (Pvt) Ltd.Printed by Karunaratne & Sons (Pvt) Ltd.