Embed Size (px)
Citation preview
COUNTRY REPORT
Sri Lanka
May 2000
The Economist Intelligence Unit15 Regent St, London SW1Y 4LRUnited Kingdom
At a glance: 2000-01OVERVIEWThe security climate is set to worsen, as the fighting in the north escalatesand opposition mounts to the constitutional reforms. The People’s Alliance(PA) is unlikely to secure a clear majority at the parliamentary election dueby August 2000. Heightening political uncertainty will impede the pace ofeconomic reform and increased military spending may derail fiscal targets.Nevertheless, accelerating world growth will facilitate a recovery in exports,raising GDP growth to an annual average of 5.2% in 2000-01. Inflation willremain below its historical trend, with prices relatively stable. The currentaccount will remain under pressure, with the trade component the largestsource of the deficit.
Key changes from last monthPolitical forecast• The government is facing greater uncertainty in the run-up to the
parliamentary election due by August 2000, with the failure to defeat theLTTE (Tamil Tigers) and the loss of the Elephant Pass seen largely as theresult of the PA’s incompetence.
Economic policy outlook• The government will continue to liberalise the economy in its efforts to
improve the rate of economic growth. The PA is pro-competition andforeign investment. However, its ability to carry through reforms isseverely hampered by the war, with all available resources and effortsbeing concentrated on the ethnic conflict.
Economic forecast• Economic growth is expected to remain below trend, but is unlikely to be
greatly affected by the war. The improved outlook for the world economyon the mainstay of growth, exports, should help to negate the impact ofthe war on confidence. However, the government has announced asupplementary budget for defence, which has raised the EIU’s forecast forthe budget deficit. This will exert some pressure on interest rates andinflation in 2000-01.
The Economist Intelligence UnitThe Economist Intelligence Unit is a specialist publisher serving companies establishing and managingoperations across national borders. For over 50 years it has been a source of information on businessdevelopments, economic and political trends, government regulations and corporate practice worldwide.
The EIU delivers its information in four ways: through our digital portfolio, where our latest analysis isupdated daily; through printed subscription products ranging from newsletters to annual referenceworks; through research reports; and by organising conferences and roundtables. The firm is a memberof The Economist Group.
LondonThe Economist Intelligence Unit15 Regent StLondonSW1Y 4LRUnited KingdomTel: (44.20) 7830 1000Fax: (44.20) 7499 9767E-mail: [email protected]
New YorkThe Economist Intelligence UnitThe Economist Building111 West 57th StreetNew YorkNY 10019, USTel: (1.212) 554 0600Fax: (1.212) 586 1181/2E-mail: [email protected]
Hong KongThe Economist Intelligence Unit25/F, Dah Sing Financial Centre108 Gloucester RoadWanchaiHong KongTel: (852) 2802 7288Fax: (852) 2802 7638E-mail: [email protected]
Website: http://www.eiu.com
Electronic deliveryThis publication can be viewed by subscribing online at http://store.eiu.com/brdes.html
Reports are also available in various other electronic formats, such as CD-ROM, Lotus Notes, on-linedatabases and as direct feeds to corporate intranets. For further information, please contact your nearestEconomist Intelligence Unit office
London: Jan Frost Tel: (44.20) 7830 1183 Fax: (44.20) 7830 1023New York: Alexander Bateman Tel: (1.212) 554 0600 Fax: (1.212) 586 1181Hong Kong: Amy Ha Tel: (852) 2802 7288/2585 3888 Fax: (852) 2802 7720/7638
Copyright© 2000 The Economist Intelligence Unit Limited. All rights reserved. Neither this publication norany part of it may be reproduced, stored in a retrieval system, or transmitted in any form or by anymeans, electronic, mechanical, photocopying, recording or otherwise, without the prior permissionof The Economist Intelligence Unit Limited.
All information in this report is verified to the best of the author's and the publisher's ability. However,the EIU does not accept responsibility for any loss arising from reliance on it.
ISSN 0269-4174
Symbols for tables“n/a” means not available; “–” means not applicable
Printed and distributed by Redhouse Press Ltd, Unit 151, Dartford Trade Park, Dartford, Kent DA1 1QB, UK
Sri Lanka 1
EIU Country Report May 2000 © The Economist Intelligence Unit Limited 2000
Contents
3 Summary
4 Political structure
5 Economic structure5 Annual indicators6 Quarterly indicators
7 Outlook for 2000-017 Political forecast8 Economic policy outlook9 Economic forecast
12 The political scene
15 Economic policy
19 The domestic economy19 Economic trends20 Industry22 Agriculture24 Infrastructure25 Financial and other services
27 Foreign trade and payments
List of tables
10 International assumptions summary11 Forecast summary23 Tea production, Jan-Dec26 Stockmarket indicators28 Trade balance, Jan-Dec28 Composition of exports, Jan-Dec29 Composition of imports, Jan-Dec
List of figures
12 Gross domestic product12 Sri Lanka rupee real exchange rate19 GDP by sector24 World rubber prices27 Current-account balance

.
Sri Lanka 3
EIU Country Report May 2000 © The Economist Intelligence Unit Limited 2000
Summary
May 2000
The security climate is set to worsen, as fighting in the north escalates, andthere is mounting opposition to constitutional reforms. The People’s Alliance(PA) is unlikely to secure a clear majority at the general election due by August2000. Heightening political uncertainty will impede the pace of economicreform and increased military spending may derail fiscal targets. Neverthelessaccelerating world growth will facilitate a recovery in exports, raising GDPgrowth to an annual average of 5.2% in 2000-01.
The Tamil Tigers have overrun the key Elephant Pass camp. Fighting in thenorth has intensified, inflicting heavy casualties on both sides. The governmenthas imposed the Public Security Act (PSA). The influential Buddhist clergy andthe LTTE have vociferously opposed the reform package.
Key proposals announced in the 2000 budget were a rationalisation of fiscalconcessions, broader tax coverage and the introduction of a two-band tariffstructure. The government hopes to contain the fiscal deficit in 2000 at 7.6%of GDP. Privatisation proceeds will be used to retire government debt. TheIndo-Lanka Free Trade Agreement has been finalised.
Real GDP grew by 4.3% in 1999, underpinned by an impressive performanceby the agricultural sector. Output of tea, coconut and paddy reached recordlevels. Tea prices have remained on an upward trend. Manufacturing growthslumped to 4.4% in 1999. Growth in the apparel industry was sustained athigher levels and increased investment has anchored its future growthpotential. Foreign direct investment rose to a new high of US$231m. A 60-mwdiesel power plant will be commissioned by June. Telephone density hascontinued to rise, and Sri Lanka Telecom is planning a major investment in2000. A new pier is being built in Galle port. Financial services have beenliberalised further. Restructuring of the two state banks has begun. The reducedgrowth in financial services is underscored by the downturn in the stockmarketand stagnant demand for loans.
The current-account deficit widened under the weight of a larger trade deficit.Lower prices led to a contraction in export earnings, while the import ofaircraft boosted the import bill. Textile and garment exports accounted for overhalf of total export earnings, as the value of agricultural exports contracted. Allthree import categories recorded decreases in value. Exports and importsposted a strong recovery in January-February 2000.
Editor: Kilbinder DosanjhEditorial closing date: May 10th 2000
All queries: Tel: (44.20) 7830 1007 E-mail: [email protected] report: Full schedule on www.eiu.com/schedule
May 31st 2000
Outlook for 2000-01
The political scene
Economic policy
The domestic economy
Foreign trade andpayments
4 Sri Lanka
EIU Country Report May 2000 © The Economist Intelligence Unit Limited 2000
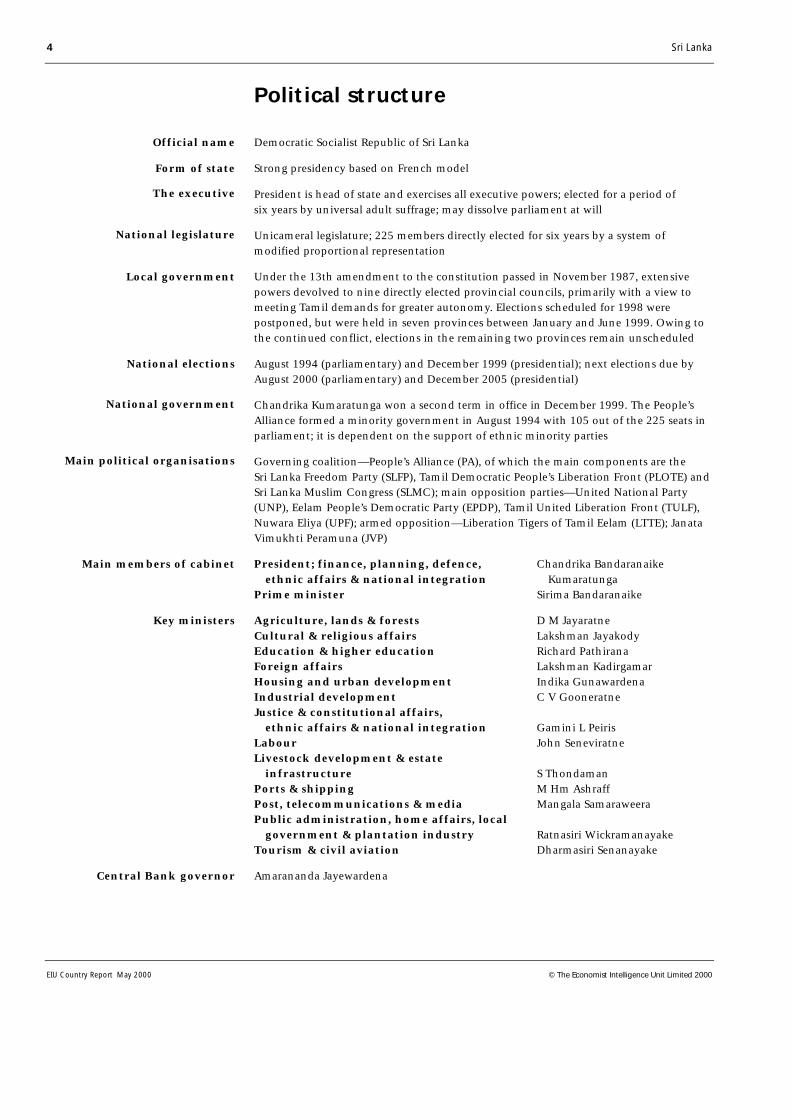
Political structure
Democratic Socialist Republic of Sri Lanka
Strong presidency based on French model
President is head of state and exercises all executive powers; elected for a period ofsix years by universal adult suffrage; may dissolve parliament at will
Unicameral legislature; 225 members directly elected for six years by a system ofmodified proportional representation
Under the 13th amendment to the constitution passed in November 1987, extensivepowers devolved to nine directly elected provincial councils, primarily with a view tomeeting Tamil demands for greater autonomy. Elections scheduled for 1998 werepostponed, but were held in seven provinces between January and June 1999. Owing tothe continued conflict, elections in the remaining two provinces remain unscheduled
August 1994 (parliamentary) and December 1999 (presidential); next elections due byAugust 2000 (parliamentary) and December 2005 (presidential)
Chandrika Kumaratunga won a second term in office in December 1999. The People’sAlliance formed a minority government in August 1994 with 105 out of the 225 seats inparliament; it is dependent on the support of ethnic minority parties
Governing coalition—People’s Alliance (PA), of which the main components are theSri Lanka Freedom Party (SLFP), Tamil Democratic People’s Liberation Front (PLOTE) andSri Lanka Muslim Congress (SLMC); main opposition parties—United National Party(UNP), Eelam People’s Democratic Party (EPDP), Tamil United Liberation Front (TULF),Nuwara Eliya (UPF); armed opposition—Liberation Tigers of Tamil Eelam (LTTE); JanataVimukhti Peramuna (JVP)
President; finance, planning, defence, Chandrika Bandaranaike ethnic affairs & national integration KumaratungaPrime minister Sirima Bandaranaike
Agriculture, lands & forests D M JayaratneCultural & religious affairs Lakshman JayakodyEducation & higher education Richard PathiranaForeign affairs Lakshman KadirgamarHousing and urban development Indika GunawardenaIndustrial development C V GooneratneJustice & constitutional affairs, ethnic affairs & national integration Gamini L PeirisLabour John SeneviratneLivestock development & estate infrastructure S ThondamanPorts & shipping M Hm AshraffPost, telecommunications & media Mangala SamaraweeraPublic administration, home affairs, local government & plantation industry Ratnasiri WickramanayakeTourism & civil aviation Dharmasiri Senanayake
Amarananda Jayewardena
Official name
Form of state
The executive
National legislature
Local government
National elections
National government
Main political organisations
Main members of cabinet
Key ministers
Central Bank governor
Sri Lanka 5
EIU Country Report May 2000 © The Economist Intelligence Unit Limited 2000
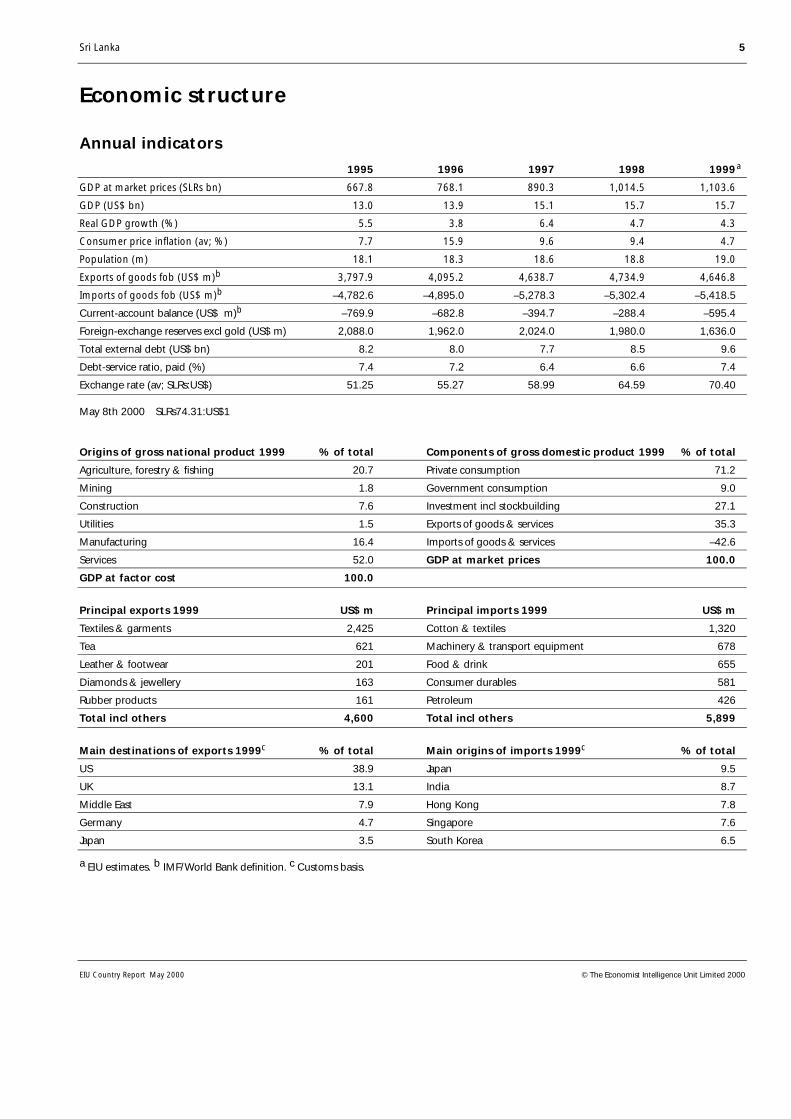
Economic structure
Annual indicators
1995 1996 1997 1998 1999a
GDP at market prices (SLRs bn) 667.8 768.1 890.3 1,014.5 1,103.6
GDP (US$ bn) 13.0 13.9 15.1 15.7 15.7
Real GDP growth (%) 5.5 3.8 6.4 4.7 4.3
Consumer price inflation (av; %) 7.7 15.9 9.6 9.4 4.7
Population (m) 18.1 18.3 18.6 18.8 19.0
Exports of goods fob (US$ m)b 3,797.9 4,095.2 4,638.7 4,734.9 4,646.8
Imports of goods fob (US$ m)b –4,782.6 –4,895.0 –5,278.3 –5,302.4 –5,418.5
Current-account balance (US$ m)b –769.9 –682.8 –394.7 –288.4 –595.4
Foreign-exchange reserves excl gold (US$ m) 2,088.0 1,962.0 2,024.0 1,980.0 1,636.0
Total external debt (US$ bn) 8.2 8.0 7.7 8.5 9.6
Debt-service ratio, paid (%) 7.4 7.2 6.4 6.6 7.4
Exchange rate (av; SLRs:US$) 51.25 55.27 58.99 64.59 70.40
May 8th 2000 SLRs74.31:US$1
Origins of gross national product 1999 % of total Components of gross domestic product 1999 % of total
Agriculture, forestry & fishing 20.7 Private consumption 71.2
Mining 1.8 Government consumption 9.0
Construction 7.6 Investment incl stockbuilding 27.1
Utilities 1.5 Exports of goods & services 35.3
Manufacturing 16.4 Imports of goods & services –42.6
Services 52.0 GDP at market prices 100.0
GDP at factor cost 100.0
Principal exports 1999 US$ m Principal imports 1999 US$ m
Textiles & garments 2,425 Cotton & textiles 1,320
Tea 621 Machinery & transport equipment 678
Leather & footwear 201 Food & drink 655
Diamonds & jewellery 163 Consumer durables 581
Rubber products 161 Petroleum 426
Total incl others 4,600 Total incl others 5,899
Main destinations of exports 1999c % of total Main origins of imports 1999c % of total
US 38.9 Japan 9.5
UK 13.1 India 8.7
Middle East 7.9 Hong Kong 7.8
Germany 4.7 Singapore 7.6
Japan 3.5 South Korea 6.5
a EIU estimates. b IMF/World Bank definition. c Customs basis.
6 Sri Lanka
EIU Country Report May 2000 © The Economist Intelligence Unit Limited 2000
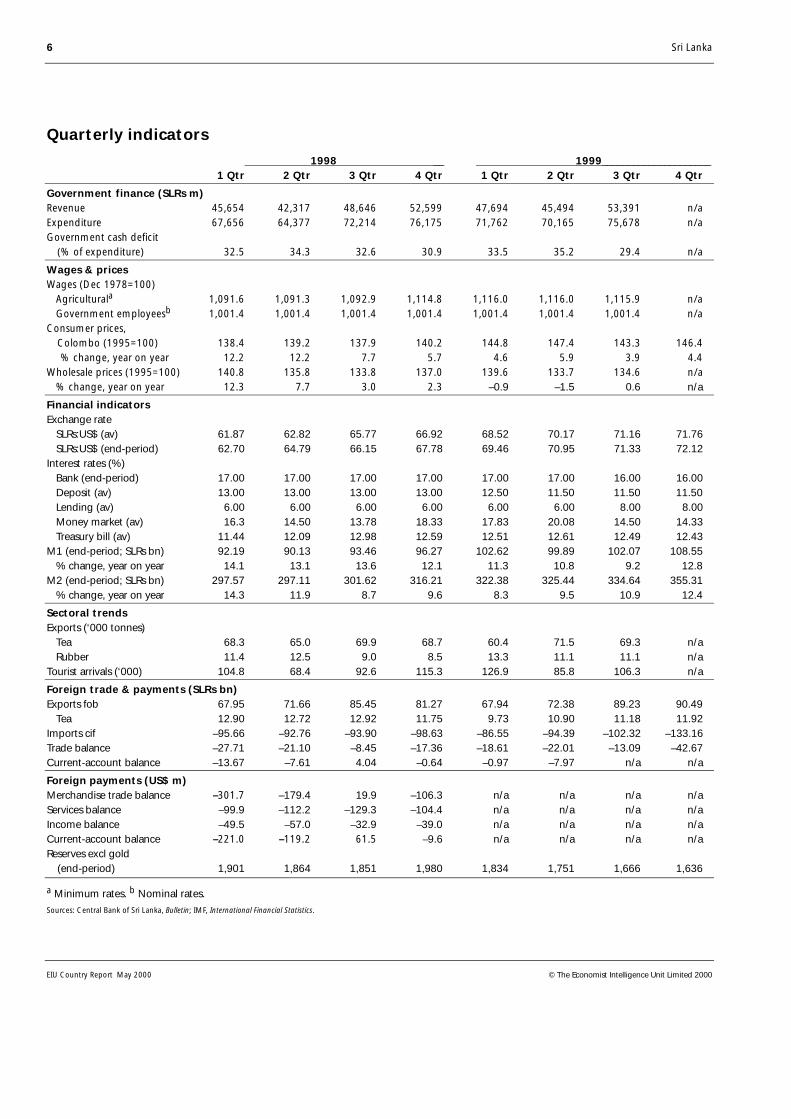
Quarterly indicators
1998 __ 1999_____________________1 Qtr 2 Qtr 3 Qtr 4 Qtr 1 Qtr 2 Qtr 3 Qtr 4 Qtr
Government finance (SLRs m)Revenue 45,654 42,317 48,646 52,599 47,694 45,494 53,391 n/aExpenditure 67,656 64,377 72,214 76,175 71,762 70,165 75,678 n/aGovernment cash deficit (% of expenditure) 32.5 34.3 32.6 30.9 33.5 35.2 29.4 n/a
Wages & pricesWages (Dec 1978=100) Agriculturala 1,091.6 1,091.3 1,092.9 1,114.8 1,116.0 1,116.0 1,115.9 n/a Government employeesb 1,001.4 1,001.4 1,001.4 1,001.4 1,001.4 1,001.4 1,001.4 n/aConsumer prices, Colombo (1995=100) 138.4 139.2 137.9 140.2 144.8 147.4 143.3 146.4 % change, year on year 12.2 12.2 7.7 5.7 4.6 5.9 3.9 4.4Wholesale prices (1995=100) 140.8 135.8 133.8 137.0 139.6 133.7 134.6 n/a % change, year on year 12.3 7.7 3.0 2.3 –0.9 –1.5 0.6 n/a
Financial indicatorsExchange rate SLRs:US$ (av) 61.87 62.82 65.77 66.92 68.52 70.17 71.16 71.76 SLRs:US$ (end-period) 62.70 64.79 66.15 67.78 69.46 70.95 71.33 72.12Interest rates (%) Bank (end-period) 17.00 17.00 17.00 17.00 17.00 17.00 16.00 16.00 Deposit (av) 13.00 13.00 13.00 13.00 12.50 11.50 11.50 11.50 Lending (av) 6.00 6.00 6.00 6.00 6.00 6.00 8.00 8.00 Money market (av) 16.3 14.50 13.78 18.33 17.83 20.08 14.50 14.33 Treasury bill (av) 11.44 12.09 12.98 12.59 12.51 12.61 12.49 12.43M1 (end-period; SLRs bn) 92.19 90.13 93.46 96.27 102.62 99.89 102.07 108.55 % change, year on year 14.1 13.1 13.6 12.1 11.3 10.8 9.2 12.8M2 (end-period; SLRs bn) 297.57 297.11 301.62 316.21 322.38 325.44 334.64 355.31 % change, year on year 14.3 11.9 8.7 9.6 8.3 9.5 10.9 12.4
Sectoral trendsExports (‘000 tonnes) Tea 68.3 65.0 69.9 68.7 60.4 71.5 69.3 n/a Rubber 11.4 12.5 9.0 8.5 13.3 11.1 11.1 n/aTourist arrivals (‘000) 104.8 68.4 92.6 115.3 126.9 85.8 106.3 n/a
Foreign trade & payments (SLRs bn)Exports fob 67.95 71.66 85.45 81.27 67.94 72.38 89.23 90.49 Tea 12.90 12.72 12.92 11.75 9.73 10.90 11.18 11.92Imports cif –95.66 –92.76 –93.90 –98.63 –86.55 –94.39 –102.32 –133.16Trade balance –27.71 –21.10 –8.45 –17.36 –18.61 –22.01 –13.09 –42.67Current-account balance –13.67 –7.61 4.04 –0.64 –0.97 –7.97 n/a n/a
Foreign payments (US$ m)Merchandise trade balance –301.7 –179.4 19.9 –106.3 n/a n/a n/a n/aServices balance –99.9 –112.2 –129.3 –104.4 n/a n/a n/a n/aIncome balance –49.5 –57.0 –32.9 –39.0 n/a n/a n/a n/aCurrent-account balance –221.0 –119.2 61.5 –9.6 n/a n/a n/a n/aReserves excl gold (end-period) 1,901 1,864 1,851 1,980 1,834 1,751 1,666 1,636
a Minimum rates. b Nominal rates.Sources: Central Bank of Sri Lanka, Bulletin; IMF, International Financial Statistics.
Sri Lanka 7
EIU Country Report May 2000 © The Economist Intelligence Unit Limited 2000
Outlook for 2000-01
Political forecast
Despite the advantage of having won the presidential election in December,the president, Chandrika Kumaratunga, cannot be assured that her People’sAlliance (PA) coalition will win the general election due in August 2000. ThePA has been strengthened by Mrs Kumaratunga’s victory, and has a slight edgeover the opposition United National Party (UNP). However, Mrs Kumaratunga’sfailure to implement the constitutional reforms she promised during thegeneral and presidential election campaign in 1994, and again when shesought re-election last year has placed the president and her party in anunenviable situation. They have to make an attempt to introduce the reformsto satisfy the minorities, the peace lobby and the international community. Butdoing so will rekindle the deep-rooted objections and prejudices of powerfulsections of the majority community, and their ire could cost her many valuablevotes. The greatest threat to the PA’s electoral chances are the recent militaryvictories by the Liberation Tigers of Tamil Eelam (LTTE or Tamil Tigers) in theJaffna peninsula. The heavy casualties the army has taken are seen to be asmuch the fault of government incompetence as they are of a military failure.
The no-win situation that the PA finds itself in will test the loyalties of evensome of the constituent parties of the coalition, as well as those of seniorministers of the government. This makes for a volatile and unpredictablepolitical environment, which will remain at least until the elections areconcluded, and will continue to keep the government preoccupied withpolitical issues at the expense of focusing on economic development.
For Mrs Kumaratunga, who has blamed the PA’s lack of progress on key issueson its failure to obtain a two-thirds majority in parliament in 1994, theprospects of improving the balance of power appear slim. Despite offers by theUNP to support government efforts to implement constitutional reforms aimedat ending the ethnic conflict, mounting opposition from the Buddhist clergyand other Sinhalese elements will be a major stumbling-block to theconclusion of the reform process during the forecast period. However, evenwith the criticism the government is facing over the military defeats, the UNP,which is beset by internal problems, and which is seen as having few solutionsof its own, is likely to face difficulty in taking advantage of a discreditedgovernment.
Meanwhile, the LTTE will try to exploit the stalemate to maximum advantage,by maintaining pressure on the military in the Jaffna peninsula. TheNorwegian government is working on bringing the warring parties to thenegotiating table, an initiative that has been backed by the EU. Such talks maytake place when it is politically expedient for the conflicting parties, butbecause of the fundamental and seemingly irreconcilable differences that stillexist between them, these talks are ultimately bound to fail. More fighting istherefore expected. The LTTE’s victories of recent months, coupled with theneed for the government to show its resolve in standing up to the rebels as the
Domestic politics
8 Sri Lanka
EIU Country Report May 2000 © The Economist Intelligence Unit Limited 2000
parliamentary election approaches, means that fighting is likely to overshadowany prospects for talks in 2000.
At this point what the PA government desperately needs, and is running outof, is time. Several top government politicians are reportedly looking at thepossibility of extending the life of the present parliament by two years, in orderto enable the government to implement its devolution package. With thecurrent term of parliament due to end in August, a general election would beheld by August under normal circumstances. Whether an extension of the lifeof the current parliament would be possible without the support of the UNPand a national referendum (where the PA would have to face the electorateanyway) is questionable. Considering the mood of some of the government’sopponents, it could also be risky. In addition, with the imposition of the PublicSecurity Act (PSA) in early May—a move condemned by the opposition and setto remain in force until July—the government is concentrating its energies onthe military crisis.
Sri Lanka maintains good relations with its main trading partners andgeographical neighbours. These have been strengthened in recent yearsfollowing an improvement in the country’s human rights record and efforts toend the ethnic conflict, although its main donors, including the EU, havehinted recently that further aid may be linked to the government’s programmeof ending the ethnic conflict. However, the current problems in the Jaffnapeninsula have shown that Sri Lanka cannot fully rely on its closest neighbour,India, for support in the conflict. With the military taking heavy losses, andfacing a shortage of munitions, Sri Lanka has also re-established ties with Israelafter 30 years, reflecting its desperation in finding new sources of militarysupplies.
Economic policy outlook
Political uncertainty, including the scheduled general election, the escalationin military hostilities and the threat of terrorist violence, will prevent a markedimprovement in the policy environment and will continue to slow the pace ofeconomic reform. The budget outlined in February was investor-friendly, witha relaxation on foreign equity restrictions in previously regulated sectors suchas banking, insurance and other financial services. The government alsoannounced measures to further liberalise the economy. Foreign equity limits infinancial services have been relaxed; the opening up of previously closedsectors such as petroleum has been confirmed; and by allowing the gasmonopoly permitted by the government to lapse, the government hasdemonstrated it is committed to encouraging greater market competition.However, despite these moves and the likelihood that the trend towards lessgovernment involvement in the economy is set to continue, the currentfighting will, at least temporarily, stall implementation of the policy outlined,as the government concentrates all its efforts on the war.
International relations
Policy trends
Election watch
Sri Lanka 9
EIU Country Report May 2000 © The Economist Intelligence Unit Limited 2000
Although the original budget deficit target was set at a realistic level of 7.6% ofGDP, the escalation in fighting (which will probably lead to a surge in defencespending) threatens to derail the government’s expenditure projections. Muchof the success in curtailing the deficit will also depend on the privatisationprogramme, and although concrete steps have been taken to step up the paceof reform, the ability of the programme to generate the targeted revenue isuncertain, given the depressed state of the stockmarket. The passing of thePublic Security Act (PSA) at the beginning of May, and government statementsthat the defeats in the Jaffna peninsula will require the diversion of all fundsnot allocated for essential development work to be used to pay for the war,now make this target look optimistic. Although, as the original budgetassumed heavy defence expenditure, the impact on the overall budget deficitwill depend on how successful the government is in diverting funds from othersources, rather than raising overall expenditure. With a general electionapproaching, the government will be determined to spend any amountnecessary to maintain its presence in the north. As a consequence, the EIUexpects the budget deficit to remain at its 1999 level of 7.5% of GDP(excluding grants and privatisation), before falling to 7.2% of GDP in 2001, asrevenue rises in line with stronger GDP growth and the streamlined tax systemannounced in the budget for 2000 improves government income.
The continued decline in net foreign assets in the banking system and inprivate-sector credit growth witnessed at the beginning of 2000 is expected toreverse as the economy begins to recover. The Central Bank of Sri Lanka willattempt to ease monetary policy during the forecast period, in an effort tofacilitate increased investment. However, the continued pressure from highbudget deficits—necessitating increased government borrowing—may result inupward pressure on domestic interest rates.
Economic forecast
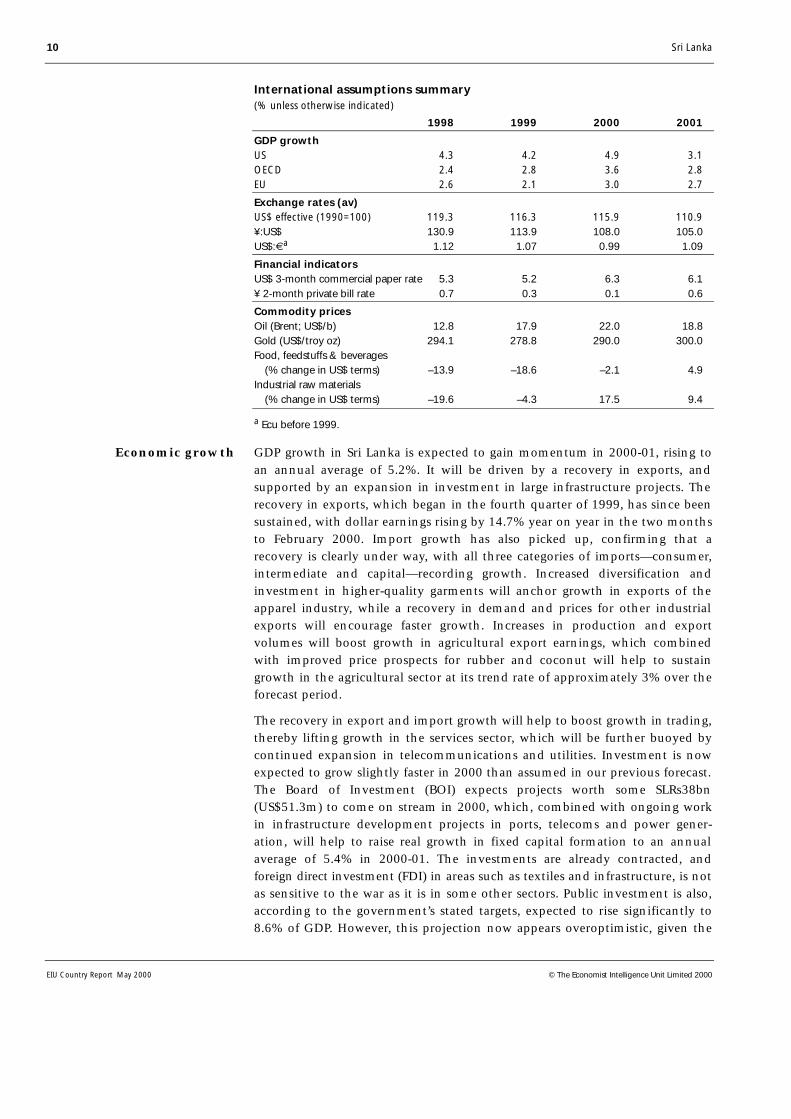
World growth will continue to recover in 2000-01, although it will remainbelow trend. Real GDP growth in the US—Sri Lanka’s main export market—isexpected to strengthen to 4.9% in 2000, from 4.2% in 1999, before decreasingto 3.1% in 2001. This will result in an increase in export earnings. Exportgrowth will be further strengthened by an expected recovery in Sri Lanka’sother leading markets—the EU and Japan. As a result, textile exports willstrengthen in the forecast period. In addition, lower than expected globalrubber and tea production in 1999 are likely to result in higher internationalprices in 2000, before they stabilise in 2001. These factors will raise Sri Lanka’sdollar export earnings, although continued strength in international oil pricesand rising non-oil commodity prices will increase the import bill. As aconsequence, the trade component of the current account will not improvesignificantly.
Fiscal policy
Monetary policy
International assumptions
10 Sri Lanka
EIU Country Report May 2000 © The Economist Intelligence Unit Limited 2000
International assumptions summary(% unless otherwise indicated)
1998 1999 2000 2001
GDP growthUS 4.3 4.2 4.9 3.1OECD 2.4 2.8 3.6 2.8EU 2.6 2.1 3.0 2.7
Exchange rates (av)US$ effective (1990=100) 119.3 116.3 115.9 110.9¥:US$ 130.9 113.9 108.0 105.0US$:€a 1.12 1.07 0.99 1.09
Financial indicatorsUS$ 3-month commercial paper rate 5.3 5.2 6.3 6.1¥ 2-month private bill rate 0.7 0.3 0.1 0.6
Commodity pricesOil (Brent; US$/b) 12.8 17.9 22.0 18.8Gold (US$/troy oz) 294.1 278.8 290.0 300.0Food, feedstuffs & beverages (% change in US$ terms) –13.9 –18.6 –2.1 4.9Industrial raw materials (% change in US$ terms) –19.6 –4.3 17.5 9.4
a Ecu before 1999.
GDP growth in Sri Lanka is expected to gain momentum in 2000-01, rising toan annual average of 5.2%. It will be driven by a recovery in exports, andsupported by an expansion in investment in large infrastructure projects. Therecovery in exports, which began in the fourth quarter of 1999, has since beensustained, with dollar earnings rising by 14.7% year on year in the two monthsto February 2000. Import growth has also picked up, confirming that arecovery is clearly under way, with all three categories of imports—consumer,intermediate and capital—recording growth. Increased diversification andinvestment in higher-quality garments will anchor growth in exports of theapparel industry, while a recovery in demand and prices for other industrialexports will encourage faster growth. Increases in production and exportvolumes will boost growth in agricultural export earnings, which combinedwith improved price prospects for rubber and coconut will help to sustaingrowth in the agricultural sector at its trend rate of approximately 3% over theforecast period.
The recovery in export and import growth will help to boost growth in trading,thereby lifting growth in the services sector, which will be further buoyed bycontinued expansion in telecommunications and utilities. Investment is nowexpected to grow slightly faster in 2000 than assumed in our previous forecast.The Board of Investment (BOI) expects projects worth some SLRs38bn(US$51.3m) to come on stream in 2000, which, combined with ongoing workin infrastructure development projects in ports, telecoms and power gener-ation, will help to raise real growth in fixed capital formation to an annualaverage of 5.4% in 2000-01. The investments are already contracted, andforeign direct investment (FDI) in areas such as textiles and infrastructure, is notas sensitive to the war as it is in some other sectors. Public investment is also,according to the government’s stated targets, expected to rise significantly to8.6% of GDP. However, this projection now appears overoptimistic, given the
Economic growth
Sri Lanka 11
EIU Country Report May 2000 © The Economist Intelligence Unit Limited 2000
implementation of the PSA and the diversion of resources that this entails.Nevertheless, we expect capital spending to rise steadily in 2000-01. This islikely to manifest itself in increased investment in roads and transport, whichare in dire need of a capital infusion, especially towards the latter part of theforecast period.
Forecast summary(% unless otherwise indicated)
1998a 1999b 2000c 2001c
Real GDP growth 4.7 4.3 4.7 5.3
Agricultural production growth 2.5 4.5 2.4 3.7
Gross fixed investment growth 15.3 2.2 4.2 6.5
Unemployment rate (av) 10.7 11.0 11.0 10.6
Consumer price inflation Average 9.4 4.7 7.6 7.1 Year-end 3.7 5.4 7.1 6.9
Short-term interbank rate 15.1 13.3 12.0 11.8
Government balance (% of GDP) –8.5 –5.5 –6.5 –5.8
Exports of goods fob (US$ bn) 4.7 4.7 5.2 5.8
Imports of goods fob (US$ bn) –5.3 –5.5 –6.0 –6.6
Current-account balance (US$ bn) –0.3 –0.6 –0.6 –0.6 % of GDP –1.8 –3.7 –3.4 -3.3
Total foreign debt (year-end; US$ bn) 8.5 9.5 10.6 11.3
Exchange rates (av) SLRs:US$ 64.59 70.40 75.54 80.53 SLRs:¥100 49.34 61.81 69.94 76.70 SLRs: 57.67 65.99 76.11 73.88
a Actual. b EIU estimates. c EIU forecasts.
Inflation is expected to rise to an annual average rate of 7.4% in 2000-01. In2000 the main upward pressure on consumer prices will come from thedelayed impact of an increase in fuel and transport prices and an increase ininternational prices of industrial raw materials. During the forecast periodincreased imports and higher domestic production will help to curb cost-pushinflationary pressures, as will a slower depreciation of the rupee, stable interestrates and increased competition in domestic markets. Demand pressures will beheld in check by slower growth in government consumption, althoughborrowing to fund the war effort will exert some upward pressure, and this willin turn permit a small loosening in monetary control, keeping interest ratesstable in the 12-13% range over the forecast period.
The rupee has depreciated by 2.65% since end-December 1999, toSLRs74.08:US$1 in the first week of May 2000. We expect the Central Bank tolimit the depreciation of the rupee to an annual average of 6.8% and 6.2% in2000 and 2001 respectively, thereby limiting the cost-push inflationarypressures of rising oil prices and the expected strengthening in world prices offoodstuffs and raw materials. An improvement in export performance, under-
Inflation
Exchange rates
12 Sri Lanka
EIU Country Report May 2000 © The Economist Intelligence Unit Limited 2000
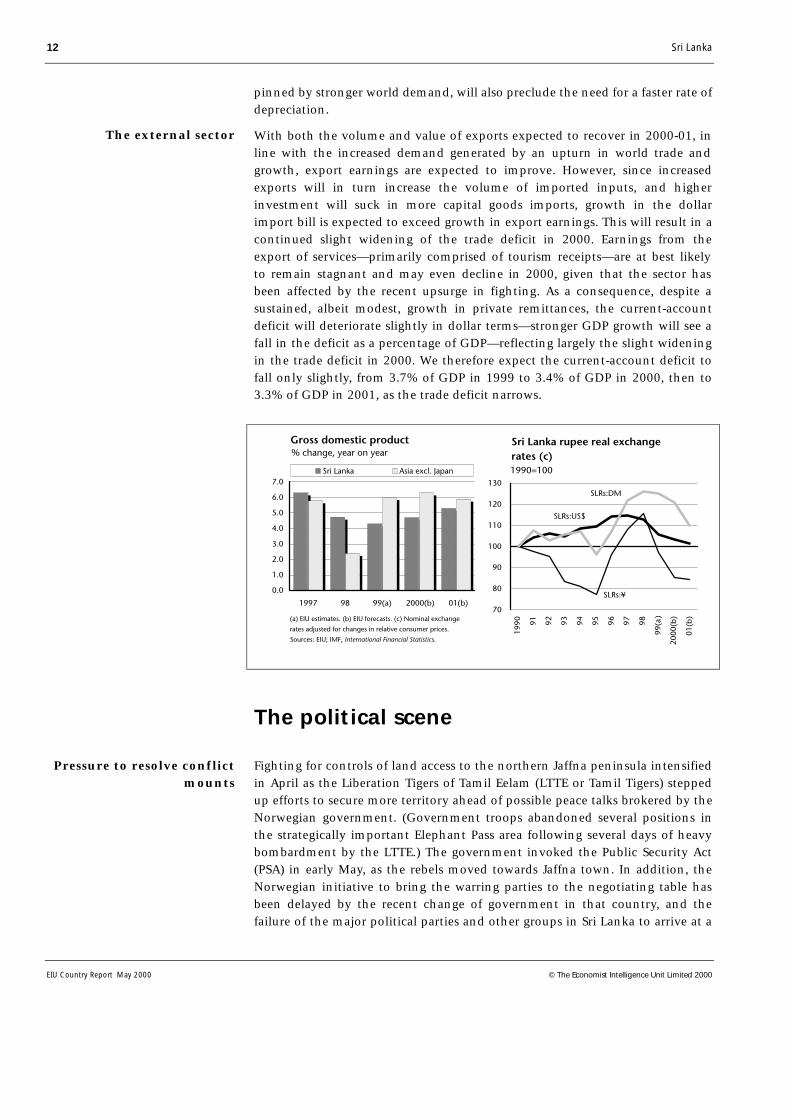
pinned by stronger world demand, will also preclude the need for a faster rate ofdepreciation.
With both the volume and value of exports expected to recover in 2000-01, inline with the increased demand generated by an upturn in world trade andgrowth, export earnings are expected to improve. However, since increasedexports will in turn increase the volume of imported inputs, and higherinvestment will suck in more capital goods imports, growth in the dollarimport bill is expected to exceed growth in export earnings. This will result in acontinued slight widening of the trade deficit in 2000. Earnings from theexport of services—primarily comprised of tourism receipts—are at best likelyto remain stagnant and may even decline in 2000, given that the sector hasbeen affected by the recent upsurge in fighting. As a consequence, despite asustained, albeit modest, growth in private remittances, the current-accountdeficit will deteriorate slightly in dollar terms—stronger GDP growth will see afall in the deficit as a percentage of GDP—reflecting largely the slight wideningin the trade deficit in 2000. We therefore expect the current-account deficit tofall only slightly, from 3.7% of GDP in 1999 to 3.4% of GDP in 2000, then to3.3% of GDP in 2001, as the trade deficit narrows.
The political scene
Fighting for controls of land access to the northern Jaffna peninsula intensifiedin April as the Liberation Tigers of Tamil Eelam (LTTE or Tamil Tigers) steppedup efforts to secure more territory ahead of possible peace talks brokered by theNorwegian government. (Government troops abandoned several positions inthe strategically important Elephant Pass area following several days of heavybombardment by the LTTE.) The government invoked the Public Security Act(PSA) in early May, as the rebels moved towards Jaffna town. In addition, theNorwegian initiative to bring the warring parties to the negotiating table hasbeen delayed by the recent change of government in that country, and thefailure of the major political parties and other groups in Sri Lanka to arrive at a
Pressure to resolve conflictmounts
The external sector
Sri Lanka 13
EIU Country Report May 2000 © The Economist Intelligence Unit Limited 2000
consensus on the basis for a political solution to the conflict. With a generalelection due later this year, the ruling Peoples’ Alliance (PA) coalition, led bythe president, Chandrika Kumaratunga, is under pressure to make sometangible progress in resolving the protracted crisis. Aid donors, particularly theEU, are also showing signs of impatience as the stalemate continues, and asthere appears to be a deterioration of democratic freedoms and human rights.Issues such as good governance and the conduct of free and fair elections areexpected to be linked to future aid, adding to the pressure on the government.However, given the recent setbacks, the international community’s response toinvoking the PSA has been somewhat muted.
An offer by the opposition United National Party (UNP) to support thegovernment’s package of political reforms following the defeat of the party’scandidate, Ranil Wickremasinghe, at the presidential election on December21st, has been welcomed by the international community. UNP delegations ledby Mr Wickremasinghe and delegations of the PA, led by Mrs Kumaratunga,held six rounds of talks in March and April. The purpose of the talks was toformulate a set of constitutional reforms acceptable to the two major parties.While some progress has been made, the most contentious issues, such as thedefinition of the unit of devolution (the regional assembly that will beresponsible for governing the provinces) and the powers to be devolved tothese assemblies, remain unresolved. The gains made by the LTTE will alsomake finding a common basis for talks more difficult, particularly if Jaffnatown falls—while the LTTE is incapable of holding large areas of territory in thelong run, the recent victories may strengthen their resolve to reject anythingless than an independent homeland—and this will mean the government isentering talks from a significantly weakened position.
Many relatively trivial domestic political issues have also adversely affected theatmosphere at the talks. These include allegations by Mrs Kumaratunga thatthe UNP had conspired with the LTTE to assassinate her, and a campaign(believed by Mrs Kumaratunga to be UNP-sponsored) by sections of the mediaalleging that the president had made false claims about her educationalachievements. The government has also restarted its bid to push through arevised version of the Crossover Bill, which was postponed in January after theUNP leadership agreed to hold talks on devolution (1st quarter 2000, page 12).With talks faltering and the military experiencing setbacks, the governmentmay use this bill to strengthen its own position, while weakening the UNPahead of the general election (due by August 2000).
Efforts by the government to take a fast-track approach to reforms and theNorwegian government’s initiative peace talks have led to opponents of reformin the majority Sinhalese community articulating their objections. One of themost influential of these groups is the powerful Buddhist clergy. Large numbersof monks and other nationalistic elements demonstrated on the streets ofColombo against the Norwegian peace initiative in April, burning Norwegianflags and carrying placards accusing Norway of being sympathetic to the LTTE.The Buddhist clergy has identified seven non-negotiable principles, whichmake it clear that they will oppose the fundamental objective of the political
Bipartisan talks on reformsbegin
Disputes remain
The Buddhist clergyopposes the reforms
14 Sri Lanka
EIU Country Report May 2000 © The Economist Intelligence Unit Limited 2000
reforms, which is the devolution of power to the provinces. According to theseprinciples, Sri Lanka should continue to be a unitary state. In addition, theBuddhist clergy does not recognise the concept of a “traditional homeland” asarticulated by Tamil separatists, and insists that devolution of power shouldnot be used to resolve what it calls a “non-existent” ethnic problem. Theinfluence of the Buddhist clergy means that its stance is a serious obstacle tothe government’s efforts to resolve the separatist conflict politically.
Meanwhile the LTTE, the key player on the other side of the ethnic divide, alsoremains opposed to the constitutional reforms on the grounds that thedevolution package offered falls far short of the group’s demands. Statementsin the international media in April had indicated that the rebels would insiston an internationally monitored ceasefire and on withdrawal to barracks ofgovernment troops from civilian areas in the north as a precondition to talks.The government’s position is that talks should begin without preconditionsand that the de-escalation of the conflict could take place as talks progress. Thepossible loss of Jaffna town is unlikely to change this position, given theapproaching parliamentary election, ahead of which the PA government willnot want to be seen as having given in to the Tigers. Adding confusion to thelikely response of the LTTE to the devolution package, the LTTE’s willingness tohold talks with the aid of the Norwegian government in an effort to achievegreater autonomy, was contradicted in mid-April. A political representative ofthe Tigers, Anton Balasingham, stated that the Tigers were “not interested inpackages, accords of constitutional reforms”. However, more recently,Mr Balasingham has stated that a goodwill delegation representing theNorwegian government has accepted an invitation from the LTTE to meet theleader of the Tigers, Vellupillai Prabhakaran.
Despite the frequent references to peace talks by both sides, the LTTE continuesto mount attacks on civilians as well as on government troops. In one incidentin March, the rebels mounted an attack on the highway to parliament. A fiercegun battle with the police and Special Task Force commandos then ensued. Ittook more than 12 hours and five teams of commandos with helicoptersupport to bring the situation under control. The incident, which took placeinside the security cordon thrown around the parliament when it is in session,was a grim reminder of the ability of the LTTE’s suicide cadres to infiltrate evenhigh-security areas.
The attack on the outskirts of Colombo was followed up by a series of land-and sea-borne attacks during March-May on troop positions at Elephant Pass, astrategically positioned military base that controls movements along thenarrow strip of land that connects the Jaffna peninsula to the mainland. Therebels also mounted attacks on troops holding sections of the A9 highway toJaffna. Fortunes fluctuated during four weeks of fighting in which hundreds ofsoldiers and rebel fighters lost their lives. The intensity of the rebel attackscaused serious concern to the government, prompting Mrs Kumaratunga toorder changes in the operational command and to instruct her militarycommanders to remain in the peninsula. The LTTE’s determination to dislodgetroops from Elephant Pass—which was taken in early May—and from the
The LTTE sends conflictingsignals
The rebels have stepped upattacks on civilians
Troops are dislodged in thenorth
Sri Lanka 15
EIU Country Report May 2000 © The Economist Intelligence Unit Limited 2000
Jaffna peninsula as a whole is motivated by the prospect, however slim, ofpeace talks later this year. The group would want to control as much territoryas possible before a possible cessation of hostilities if and when talks take place.
In a sign of the government’s growing desperation, as the LTTE moves closer toJaffna town, the government imposed the Public Services Act (PSA) in earlyMay. This invokes emergency measures which put the country on a “warfooting” and which will be in place for up to three months. The measuresinclude the following.
• The domestic press is required to submit any reports relating to the conflictfor censorship by the government before being printed. The government isallowed to seize the printing presses of and close any newspaper which fails todo this. While the domestic media were already required to submit war-relatedstories to the government (although without the threat of closure), this is nowalso required of foreign press based in Sri Lanka.
• Any property, in particular aircraft and ships, deemed useful for the wareffort may be seized.
• The security services are authorised to hold and question any individualthey believe may have links with the LTTE.
• All strikes and demonstrations are banned.
• Any criticism of Mrs Kumaratunga (in her role as president) is banned.
The government also stated that, with the country on a war footing, all non-essential development expenditure will be diverted to the war effort.
The measures were immediately condemned by the leader of the UNP,Mr Wickremasinghe, prompting Mrs Kumaratunga to hold talks with him toallay any fears. (The UNP remains opposed to the emergency measures.) Thereare currently over 35,000 government troops trapped in Jaffna town. In thefirst week of May, with the imminent prospect of the LTTE taking the town,the government requested assistance from India in evacuating troops by sea.India’s refusal has effectively forced the army into consolidating its position,and there are indications that the army, with the support of the air force, mayprevent the LTTE from progressing any further.
Economic policy
According to the Treasury, improved tax collection and a reduction in recurrentexpenditure helped to reduce the 1999 fiscal deficit to 7.5% of GDP (excludinggrants and privatisations), from 9.2% of GDP in 1998. Government revenuegrew by 12% in nominal terms and—reversing the declining trend seen since1996—helped to raise the revenue/GDP ratio to 17.6% in 1999 from 17.3% in1998. The increase in public revenue was primarily due to a 33% increase incollections from the National Security Levy (NSL) and a 19% increase in exciseduty revenue. Revenue from the goods and services tax (GST) also improved,
The Public Security Act isimposed
The tax performanceimproved in 1999
16 Sri Lanka
EIU Country Report May 2000 © The Economist Intelligence Unit Limited 2000
indicating that initial teething problems are being worked out. Improved taxadministration contributed further to a growth in income tax revenue, by animpressive 38% in nominal terms, to SLRs28.2bn from SLRs20.4bn in 1998.
The growth in total expenditure was curtailed to a modest 4% in nominalterms; hence the total expenditure/GDP ratio declined to 25.1% year on yearfrom 26.3% year on year in 1998. A 5.5% nominal reduction in defencespending (which as a percentage of GDP decreased to 4.3% from 5% in 1998)helped to cut the recurrent expenditure/GDP ratio to 18.1% from 19.6% a yearearlier, despite increases in interest costs and the civil service wage bill.However, although military expenditure—estimated at SLRs48.1bn in 1999—was lower than in 1998 (a year when defence spending peaked), it was stillnearly 7% higher than the original target of SLRs44.9bn. Debt-service pay-ments rose by 13% following a sharp increase in government borrowing in1998, while the wage bill rose by 9%, primarily owing to increasedemployment in the civil service. The decline in the expenditure/GDP ratio wasalso made possible by a drop in the public investment/GDP ratio, which fell to6.4% in 1999 from 6.7% in the previous year.
In a rather dramatic departure from tradition, the budget for 2000 was pres-ented to parliament on February 19th by the president, ChandrikaKumaratunga, in her capacity as finance minister. (No president has everpresented the budget.) The central themes of the budget were fiscal consol-idation, extended liberalisation and privatisation. Other key reforms announ-ced were: the rationalisation of the fiscal incentive structure, broadening of thetax base and the replacement of the three-tier tariff regime with a two-bandtariff structure.
The original target for the budget deficit for 2000 was set at a realistic—prior tothe increased hostilities—7.6% of GDP (excluding grants and privatisations).Government revenue is expected to rise by 19% in nominal terms toSLRs234bn (equivalent to 18.7% of GDP); growth in recurrent expenditure is tobe curtailed at SLRs227bn, representing a 9.7% increase over the actual 1999level, and public investment is to increase by 30% in absolute terms. As apercentage of GDP, capital spending is targeted to reach 8.1%. This will resultin raising the overall expenditure/GDP ratio to 26.3% (based upon theassumption that real GDP will grow by 5.5%) from 25.7% in 1999. However,following the implementation of the Public Security Act (PSA) at the beginningof May this target, which looked realistic when announced, is unlikely to bemet. The government has stated that the defeats in the Jaffna peninsula (seeThe political scene) will require that all funds not allocated to essentialdevelopment work be now diverted towards the war effort. The impact on theoverall budget deficit will depend on how successful the government is indiverting funds from other sources, rather than raising overall expenditure.
The principal measures announced in the budget to boost revenue were arationalisation of the fiscal incentives regime and an extension in the coverageof the GST and NSL. Items previously exempt from GST, such as meat products,
Government expenditurewas curtailed
The 2000 budget ispresented to parliament
The fiscal deficit in 2000will remain high
Indirect tax revenue isexpected to rise
Sri Lanka 17
EIU Country Report May 2000 © The Economist Intelligence Unit Limited 2000
have been drawn into the net, while the coverage of the NSL has been widenedto include all services with the exception of 12 specified categories.
The narrowing of the scope of fiscal incentives was a step in the right direction.International lending agencies have long been pressing for such reforms.Myriad tax concessions have complicated the tax system and made it lesstransparent, but the proliferation of tax incentives in recent years has alsoeroded and reduced the buoyancy of the direct tax base. The budgetannounced that the 10-20-year tax holiday would be restricted to export-oriented ventures with an investment exceeding SLRs500m and to largedevelopment projects with a minimum investment of SLRs3.5bn. Projects notmeeting these criteria will have to pay a 15% concessionary rate of tax. Inaddition, minimum investment levels would be set for all areas eligible forBoard of Investment (BOI) concessions.
To curtail growth in recurrent expenditure—by curbing rising interestpayments—high-cost public debt is to be retired using privatisation proceeds.The government hopes to contain interest costs at SLRs59bn in 2000, aboutSLRs3bn lower than the actual amount incurred in 1999. Other expenditurerationalisation measures include a freeze of 5% of the budgeted expenditure ofall government spending units, including public corporations and banks, andimproved financial management.
The success of the government in adhering to its 2000 revenue-collectiontargets to a large extent hinges on the success of the rather ambitious privat-isation programme planned for 2000/01 fiscal year. The government hopes toraise SLRs30bn from privatisation proceeds, from just SLRs134m in 1999, whenthe programme ground to a virtual halt. The government has taken steps tojump-start the privatisation process. In February the Public Enterprise ReformCommission (PERC) announced the selection of HSBC Investment Bank plcand its local partner, Merchant Bank of Sri Lanka, as the lead managers for theInitial Public Offering (IPO) of Sri Lanka Telecom (SLT). The original date to beset for the IPO flotation on international stockmarkets as well as the ColomboStock Exchange (CSE) was the middle of 2000. However, given the impact ofthe government’s “war alert” in early May on investor sentiment, and as thegovernment will now concentrate on the war effort, the offering is likely to bedelayed (see The political scene). In addition, the percentage of shares to bedivested is still undecided—although the initial plan was for a 10.5% slice, it islikely that this will be increased to 30-40% provided the price is attractive. Ifthe government succeeds in disposing of 40% the issue will generate aroundSLRs30bn (US$400m), thereby meeting the target for privatisation proceeds inthe current fiscal year.
The management of the second large privatisation issue—the sale of 39% ofthe National Insurance Corporation—has been awarded to Arthur AndersenConsulting. The sale of 90% of the government’s holdings in the two state-owned dairy farms in Ambewela and Patipola to Lanka Milk Foods Ltd was alsofinalised in February. The Ambewela farm fetched SLRs48m and the Patipolafarm SLRs42m. The purchase agreement also calls for a combined investment
Fiscal concessions will bereduced
There are hopes of lowerdebt-service expenditure
Privatisation programme isto be revitalised
18 Sri Lanka
EIU Country Report May 2000 © The Economist Intelligence Unit Limited 2000
of SLRs128m in both farms by Lanka Milk Foods. The listing of 20% of thegovernment’s shares in four plantation companies (deferred in 1999 due to thedepressed state of the local stockmarket and the downturn in tea prices) is alsolikely to be completed in 2000.
As a complement to extended privatisation the government announced thatother sectors of the economy are to be deregulated. Candidates for deregul-ation are ports, airports and aviation, and water supply. The supply of water toselected urban areas has been identified as an area that will be opened to theprivate sector in the near future.
Steps are also under way to restructure the Ceylon Electricity Board (CEB).Offers submitted by seven short-listed consultancy firms are currently beingevaluated by the Asia Development Bank (ADB), which is financing theproject. The restructuring envisages the separation of generation, transmissionand distribution into autonomous bodies, with independent managementstructures. At least two companies will be set up for power distribution. Thecompanies will initially be state controlled but (with the exception of thetransmission company) will subsequently be divested through the stockexchange. Legislation to establish these companies will be presented forparliamentary approval by mid-2001. The CEB Act is also to be amended toallow for the creation of a power regulatory authority, which the World Bankhas undertaken to establish.
In line with the prescribed timetable for tariff reform, the budget alsoannounced a further rationalisation of the tariff structure, with the existingthree-tier structure (with rates of 10%, 20% and 30%) being cut to two bandswith standard duty rates of 10% and 25%. The 35% tariff for key agriculturalproducts is to be retained to afford protection to the sector, following theliberalisation of agricultural imports.
The Indo-Lanka Free Trade Agreement has been finalised after nearly a year ofnegotiations. Under the terms of the agreement India has granted a 100% tariffconcession on 1,351 items, while a 50% duty concession (giving way to a fullduty concession in three years) has been extended to 2,800 items. However, SriLanka has been allowed only restricted access for two of its key exports,garments and tea, on which India has imposed quantitative barriers. Forgarments, the limit is 8m pieces and for tea 15m kg. These items will be subjectto a 7.5% duty. Sri Lanka has a lengthy negative list of 1,180 items comparedwith India’s 419 items. It has given 100% tariff concession on a modest 319items (chiefly agricultural products) and 50% duty concession on 819 products.To qualify for the duty concessions under the agreement, exports from eithercountry must have a 35% domestic value-added component. The immediatebenefit to Sri Lanka under the agreement is likely to be cheaper raw materialsand other inputs sourced from India and, as mentioned above, increased (albeitstill restricted) market access for its tea and garment industry. Sri Lanka ishoping the agreement will attract foreign investors to set up in Sri Lanka as ameans of penetrating the Indian market, but whether this will translate intoreality is uncertain.
Deregulation continues
The power sector is to beopened up
A two-band tariff structureis announced
A free-trade agreementwith India is finalised
Sri Lanka 19
EIU Country Report May 2000 © The Economist Intelligence Unit Limited 2000
The domestic economy
Economic trends
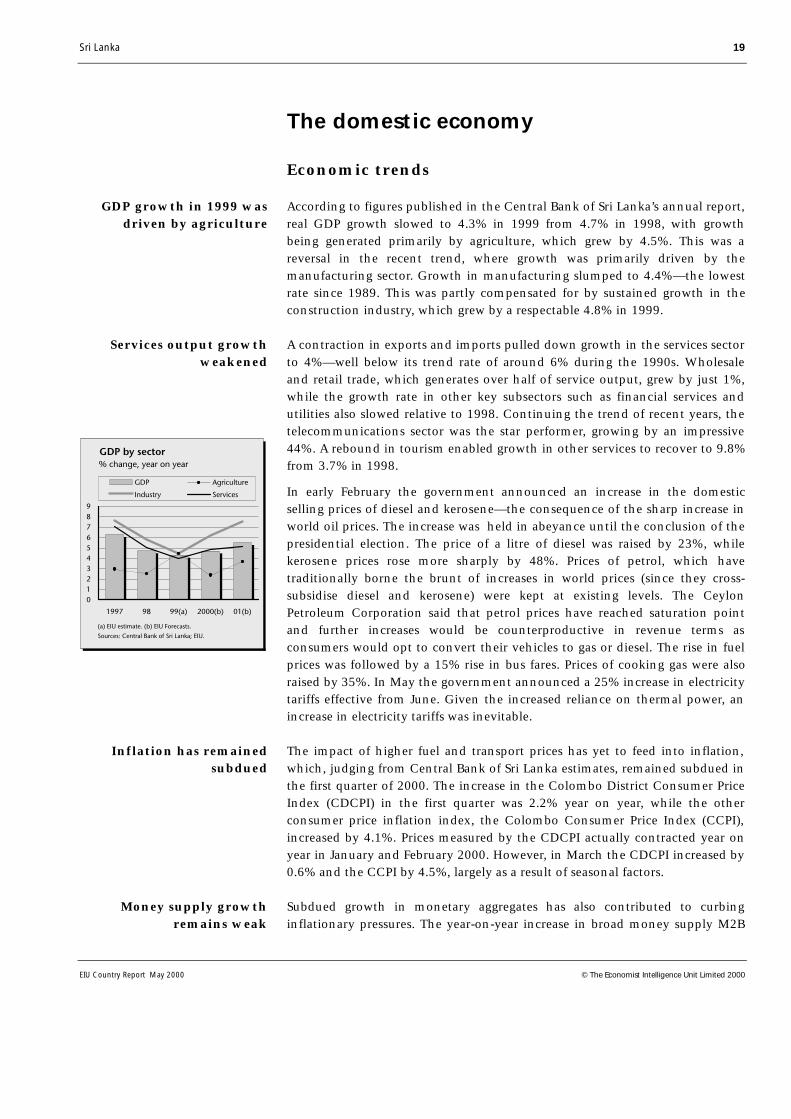
According to figures published in the Central Bank of Sri Lanka’s annual report,real GDP growth slowed to 4.3% in 1999 from 4.7% in 1998, with growthbeing generated primarily by agriculture, which grew by 4.5%. This was areversal in the recent trend, where growth was primarily driven by themanufacturing sector. Growth in manufacturing slumped to 4.4%—the lowestrate since 1989. This was partly compensated for by sustained growth in theconstruction industry, which grew by a respectable 4.8% in 1999.
A contraction in exports and imports pulled down growth in the services sectorto 4%—well below its trend rate of around 6% during the 1990s. Wholesaleand retail trade, which generates over half of service output, grew by just 1%,while the growth rate in other key subsectors such as financial services andutilities also slowed relative to 1998. Continuing the trend of recent years, thetelecommunications sector was the star performer, growing by an impressive44%. A rebound in tourism enabled growth in other services to recover to 9.8%from 3.7% in 1998.
In early February the government announced an increase in the domesticselling prices of diesel and kerosene—the consequence of the sharp increase inworld oil prices. The increase was held in abeyance until the conclusion of thepresidential election. The price of a litre of diesel was raised by 23%, whilekerosene prices rose more sharply by 48%. Prices of petrol, which havetraditionally borne the brunt of increases in world prices (since they cross-subsidise diesel and kerosene) were kept at existing levels. The CeylonPetroleum Corporation said that petrol prices have reached saturation pointand further increases would be counterproductive in revenue terms asconsumers would opt to convert their vehicles to gas or diesel. The rise in fuelprices was followed by a 15% rise in bus fares. Prices of cooking gas were alsoraised by 35%. In May the government announced a 25% increase in electricitytariffs effective from June. Given the increased reliance on thermal power, anincrease in electricity tariffs was inevitable.
The impact of higher fuel and transport prices has yet to feed into inflation,which, judging from Central Bank of Sri Lanka estimates, remained subdued inthe first quarter of 2000. The increase in the Colombo District Consumer PriceIndex (CDCPI) in the first quarter was 2.2% year on year, while the otherconsumer price inflation index, the Colombo Consumer Price Index (CCPI),increased by 4.1%. Prices measured by the CDCPI actually contracted year onyear in January and February 2000. However, in March the CDCPI increased by0.6% and the CCPI by 4.5%, largely as a result of seasonal factors.
Subdued growth in monetary aggregates has also contributed to curbinginflationary pressures. The year-on-year increase in broad money supply M2B
GDP growth in 1999 wasdriven by agriculture
Services output growthweakened
Inflation has remainedsubdued
Money supply growthremains weak
20 Sri Lanka
EIU Country Report May 2000 © The Economist Intelligence Unit Limited 2000
(which includes the operations of foreign-currency banking units) at end-January was 13.6% (latest figures available) compared with 12.9% a year ago.The continued decline in net foreign assets in the banking system has curbedmonetary expansion. Private-sector credit growth has also remained weak,recording a 9% year-on-year increase in January, since the economy is still inthe initial phase of recovery.
Interest rates have remained relatively stable, with the average weighted primelending rate fluctuating in the 13.5-14% range in February. However, the primerate moved up to 15.1% by the end of March, where it has remained. Interestrates usually move up in this period as a result of increased cash requirementsduring the Sinhalese and Tamil New Year period. The three-month and 12-month Treasury-bill rates have also remained stable in the narrow ranges of11.3-11.5% and 11.9-12.1% respectively in the same period.
The rupee has depreciated by 2.65% since end-December 1999, reachingSLRs74.08:US$1 by the beginning of May 2000. This is almost equivalent to therate of depreciation between end-1998 and May 1999. Stability in foreign-exchange markets, a recovery in exports, and more importantly low domesticinflation have prevented pressures for a faster rate of depreciation of thecurrency. Fears of stoking cost-push inflationary pressures (given the hike infuel prices) will prompt the Central Bank to maintain a slower depreciation ofthe rupee, a stance that will be helped by the pick-up in export demand.
Industry
The growth rate in the industrial sector slumped to 4.5%. This dismalperformance was largely due to a sharp deceleration in export-orientatedindustries in the first half of 1999 as earnings from key industrial exportsstagnated. With the exception of the apparel and non-metallic industrialsubsectors, all major industrial categories grew at significantly slower rates in1999 than in 1998. Growth in the food, beverage and tobacco industrydecelerated sharply to 2.4% compared with 9.6% in 1998, while output in thechemicals, petroleum and rubber industries increased by just 0.2%, comparedwith an increase of 12.9% year on year in 1998. However, a recovery waswitnessed in several industries in the fourth quarter, including food products,garments and diamonds, and this is likely to continue in 2000, as world tradeand growth continue to recover.
The deceleration in the growth of export-oriented industries was partlycompensated for by a strong performance in industries catering for thedomestic market. This was particularly evident in products such as flour,processed meat products, pharmaceuticals, detergents, and cement and otherbuilding materials. This follows improvements in quality and distribution,combined with a relative price advantage and increased advertising, whichhave enabled these products to capture an increasing share of the market fromforeign operators.
Interest rates remain stable
The rupee has depreciatedat a steady pace
Poor exports weakenedmanufacturing in 1999
The non-export sectorperformed well
Sri Lanka 21
EIU Country Report May 2000 © The Economist Intelligence Unit Limited 2000
Despite increased international competition, and a reduction in demand andprices in certain categories, the textile and apparel sector retained its pre-eminence as the leading industrial category, posting a growth rate of 7.3% yearon year, compared with an increase of 4.7% in 1998. This clearly indicates thatthe sector is becoming better geared to face international competition. Inrecent years Sri Lanka’s garment industry has been consolidating and movingincreasingly into higher-end garments, as well as forging links with establishedbuyers, who value quality and delivery over price. Several large companies withstrong marketing links to the US and EU have managed to obtain large orders,enabling exporters to anchor their position among leading retailers. This ispartly due to the higher labour standards in Sri Lanka relative to other textile-producing countries, which has become an increasingly important consider-ation for retailers in Western countries.
This in turn has encouraged increased investment in the industry. In January2000 construction commenced on a SLRs4bn lingerie manufacturing facility.The project is a joint venture between Mast Industries of the US, Courtaulds ofthe UK and MAS Holdings of Sri Lanka. The country has also embarked on amajor effort to attract leading retailers to outsource their requirements in SriLanka. Marks & Spencer, a UK retailer, has decided to set up a large logisticscentre to enable the company to airfreight 80% of its products manufacturedin Sri Lanka.
The government has given the green light to the entry of two more companiesto sell gas in the local market once Shell Gas Lanka’s monopoly ends inNovember 2000. The monopoly has been in force since 1995, when the CeylonGas Company was privatised and acquired by Royal Dutch Shell. The twocompanies are the US-based Caltex and the Hong Kong-based Mundo Gas.Existing investments by Mundo Gas include the construction of a pipeline atHambantota, while Caltex is expected to invest SLRs800m on a storage andbottling plant in Muthurajawela. Since 1995 the supply of liquefied petroleumgas (LPG) cylinders has increased by 67% and imports by 47%. Shell has alsoinvested US$90m in a gas storage facility in Muthurajawela.
According to data released by the Board of Investment (BOI), in 1999 foreigndirect investment (FDI) inflows from BOI companies (including expansion byexisting companies) increased by an impressive 54% to US$231m—the mostsince 1995. The surge in investment was primarily due to investments ininfrastructure. Five projects accounted for the bulk of the FDI. South AsiaGateway Terminals (port development) invested US$35.95m, Lanka BellUS$26.2m and Lanka Cellular Services US$16m (both these in tele-communications).
The number of government investment approvals, however, declined by 16%to 340 projects, while the number of investment agreements signed alsodropped by 10% to 207. The BOI attributes this to overcapacity in the garmentindustry, a decline in new investments from South Korea (Sri Lanka’s leadingsource of investment) and the erosion in profit margins. However, the declinein approvals was more than compensated for by the increase in the average
Higher value-addedclothing exports have risen
Investment in the textilesector is recovering
Increased competition inthe gas industry is likely
FDI reached a record levelin 1999
Manufacturing attractedincreased investment
22 Sri Lanka
EIU Country Report May 2000 © The Economist Intelligence Unit Limited 2000
investment value per project, which increased by 61.5%. The number of newprojects that commenced in 1999 was 149, over half being fully foreign ownedor a joint venture with foreign equity participation. Of the 149 projects, 100were in manufacturing—42 in the apparel industry. BOI-approved projectshave emerged as the mainstay of the export industry. In 1999 it is estimatedthat these enterprises accounted for 62% of all exports, 80% of industrialexports and 34% of total imports.
Agriculture
In 1999 the agricultural sector turned in one of its best performances in recentyears, its three principal crops—tea, coconut and paddy—recording new highsin production. Rubber output rose, reversing the declining trend witnessedsince 1996. Other crops also recorded increased production levels, while theoutput of the fisheries subsector rose by 2.9% year on year.
Paddy production rose to 2.9m tonnes, surpassing its 1995 peak production by2%. The increase in output was entirely due to the secondary Yala harvest (themain Maha crop was 2% below that achieved in 1998), with production risingyear on year by 23%. Average yields, on a rising trend since 1996, improved by1% to 3,672 kg/ha, as did the extent of land under paddy cultivation, whichrose to 896,000 ha from 848,000 ha in 1998. Despite these improvements, SriLanka has still not reached self-sufficiency in rice. Domestic productionsatisfied 89% of total consumption in 1999, necessitating imports of 207,000tonnes. It is unlikely, given weather patterns, that last year’s output will besurpassed in 2000. Current trends indicate that the main harvest is likely to fallslightly below output in 1999, as a result of the dry weather conditions thathave prevailed on the island.
The plantation crop sector performed well: all three crops—coconut, rubberand tea—recorded increases in output. Coconut output recovered stronglyfrom the second quarter of 1999, increasing by 10% to reach 2,808m nuts—thehighest level since 1986. This was the combined result of good weatherconditions in the preceding year (coconuts respond to weather conditions witha one year time lag) and higher international prices, which encouragedincreased fertiliser application. Among coconut products, the sharpest increasewas seen in desiccated coconut, whose output rose by a spectacular 50% to540m nuts equivalent. Growth in earnings from coconut products was equallyimpressive, rising by 50%, following rises both in production volumes and inprices on international markets.
Tea production was strong in 1999, reaching 283.7m kg, 1.3% more than therecord output of 280m kg in 1998. The increase was generated entirely by high-grown teas, whose output rose by 7%. Low-country teas continued to accountfor over half of total production (52.5% of the total in 1999). The performanceof the sector was, however, affected by adverse weather in the first part of theyear, and so output contracted slightly. Sri Lanka was the only country amongmajor tea producing nations to record an increase in output.
Agricultural growthstrengthened in 1999
A record paddy harvest ledthe growth
Coconut output reachedrecord levels
Tea production continuedto reach new levels
Sri Lanka 23
EIU Country Report May 2000 © The Economist Intelligence Unit Limited 2000
Despite a small contraction in exported volumes, which fell year on year by1.4% to 268m kg from 272m kg in 1998, Sri Lanka remained the world’sleading exporter of tea in 1999 in volume terms. However, the sharp drop inprices witnessed in the first half of 1999, together with the decline in volumesof value-added teas (packeted and tea bags), reduced the value of exports toSLRs44bn from SLRs50bn in the previous year. Despite the financial crisis inRussia, the countries of the Commonwealth of Independent States (CIS)remained Sri Lanka’s biggest export market, increasing their purchases from43.9m kg in 1998 to 48.2m kg in 1999, and represented approximately 18% oftotal export earnings. The United Arab Emirates was the next leading market,despite a drop in purchases from 29.2m kg to 25.2m kg. Markets which boughtmore teas from Sri Lanka in 1999 were Iran and UK, but this was offset bydecreased sales to Turkey, Saudi Arabia and Egypt.
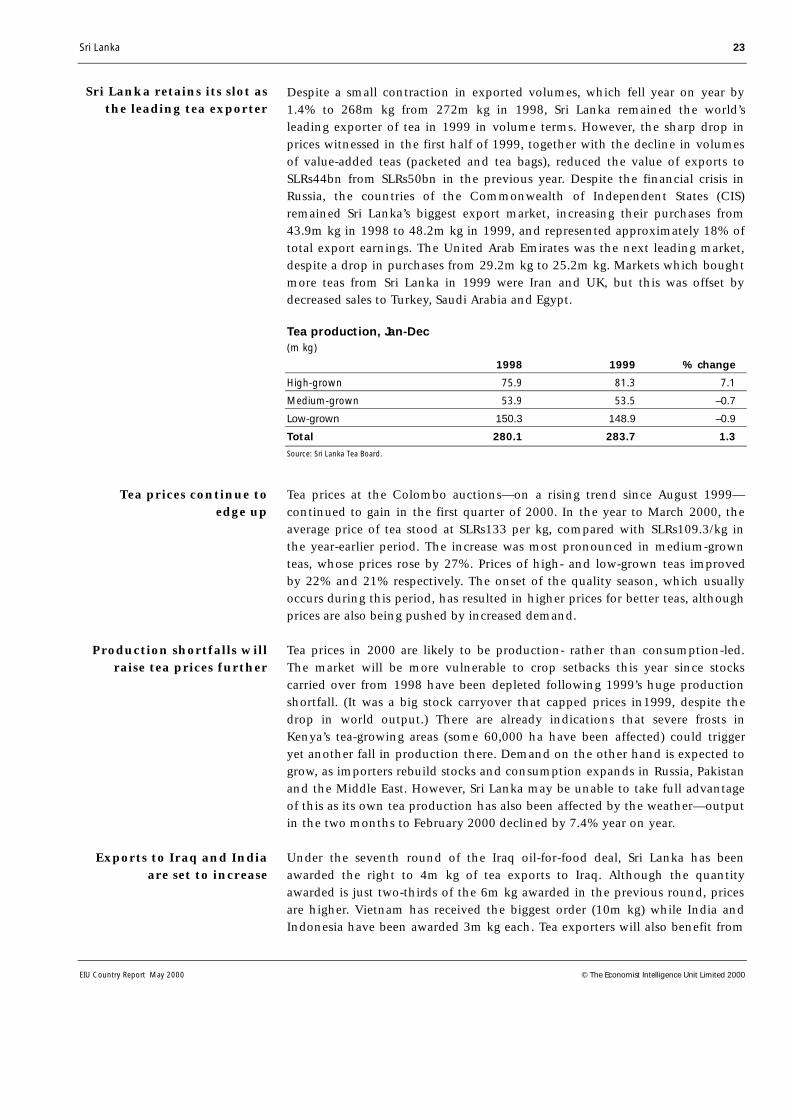
Tea production, Jan-Dec(m kg)
1998 1999 % change
High-grown 75.9 81.3 7.1
Medium-grown 53.9 53.5 –0.7
Low-grown 150.3 148.9 –0.9
Total 280.1 283.7 1.3
Source: Sri Lanka Tea Board.
Tea prices at the Colombo auctions—on a rising trend since August 1999—continued to gain in the first quarter of 2000. In the year to March 2000, theaverage price of tea stood at SLRs133 per kg, compared with SLRs109.3/kg inthe year-earlier period. The increase was most pronounced in medium-grownteas, whose prices rose by 27%. Prices of high- and low-grown teas improvedby 22% and 21% respectively. The onset of the quality season, which usuallyoccurs during this period, has resulted in higher prices for better teas, althoughprices are also being pushed by increased demand.
Tea prices in 2000 are likely to be production- rather than consumption-led.The market will be more vulnerable to crop setbacks this year since stockscarried over from 1998 have been depleted following 1999’s huge productionshortfall. (It was a big stock carryover that capped prices in1999, despite thedrop in world output.) There are already indications that severe frosts inKenya’s tea-growing areas (some 60,000 ha have been affected) could triggeryet another fall in production there. Demand on the other hand is expected togrow, as importers rebuild stocks and consumption expands in Russia, Pakistanand the Middle East. However, Sri Lanka may be unable to take full advantageof this as its own tea production has also been affected by the weather—outputin the two months to February 2000 declined by 7.4% year on year.
Under the seventh round of the Iraq oil-for-food deal, Sri Lanka has beenawarded the right to 4m kg of tea exports to Iraq. Although the quantityawarded is just two-thirds of the 6m kg awarded in the previous round, pricesare higher. Vietnam has received the biggest order (10m kg) while India andIndonesia have been awarded 3m kg each. Tea exporters will also benefit from
Sri Lanka retains its slot asthe leading tea exporter
Tea prices continue toedge up
Production shortfalls willraise tea prices further
Exports to Iraq and Indiaare set to increase
24 Sri Lanka
EIU Country Report May 2000 © The Economist Intelligence Unit Limited 2000
the recently concluded Free Trade Agreement between India and Sri Lanka,under which India has allowed for the import of 15m kg of tea at a preferentialtariff of 7.5%, compared with the existing 15%.
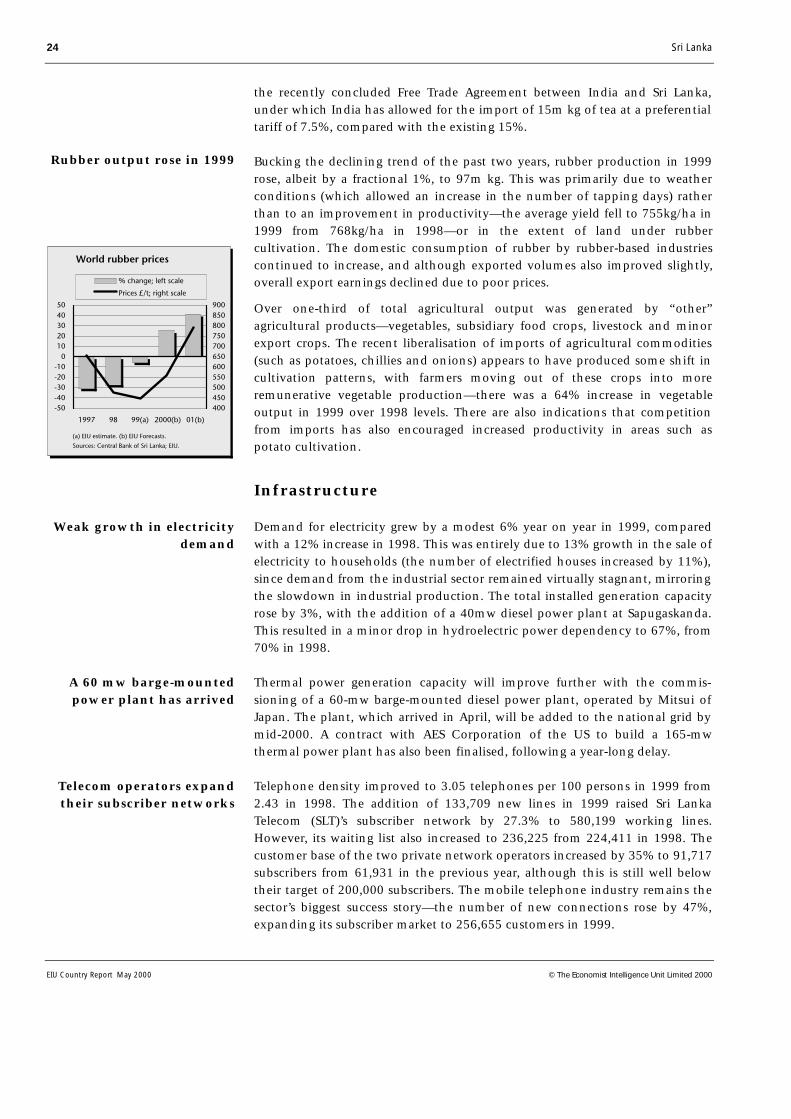
Bucking the declining trend of the past two years, rubber production in 1999rose, albeit by a fractional 1%, to 97m kg. This was primarily due to weatherconditions (which allowed an increase in the number of tapping days) ratherthan to an improvement in productivity—the average yield fell to 755kg/ha in1999 from 768kg/ha in 1998—or in the extent of land under rubbercultivation. The domestic consumption of rubber by rubber-based industriescontinued to increase, and although exported volumes also improved slightly,overall export earnings declined due to poor prices.
Over one-third of total agricultural output was generated by “other”agricultural products—vegetables, subsidiary food crops, livestock and minorexport crops. The recent liberalisation of imports of agricultural commodities(such as potatoes, chillies and onions) appears to have produced some shift incultivation patterns, with farmers moving out of these crops into moreremunerative vegetable production—there was a 64% increase in vegetableoutput in 1999 over 1998 levels. There are also indications that competitionfrom imports has also encouraged increased productivity in areas such aspotato cultivation.
Infrastructure
Demand for electricity grew by a modest 6% year on year in 1999, comparedwith a 12% increase in 1998. This was entirely due to 13% growth in the sale ofelectricity to households (the number of electrified houses increased by 11%),since demand from the industrial sector remained virtually stagnant, mirroringthe slowdown in industrial production. The total installed generation capacityrose by 3%, with the addition of a 40mw diesel power plant at Sapugaskanda.This resulted in a minor drop in hydroelectric power dependency to 67%, from70% in 1998.
Thermal power generation capacity will improve further with the commis-sioning of a 60-mw barge-mounted diesel power plant, operated by Mitsui ofJapan. The plant, which arrived in April, will be added to the national grid bymid-2000. A contract with AES Corporation of the US to build a 165-mwthermal power plant has also been finalised, following a year-long delay.
Telephone density improved to 3.05 telephones per 100 persons in 1999 from2.43 in 1998. The addition of 133,709 new lines in 1999 raised Sri LankaTelecom (SLT)’s subscriber network by 27.3% to 580,199 working lines.However, its waiting list also increased to 236,225 from 224,411 in 1998. Thecustomer base of the two private network operators increased by 35% to 91,717subscribers from 61,931 in the previous year, although this is still well belowtheir target of 200,000 subscribers. The mobile telephone industry remains thesector’s biggest success story—the number of new connections rose by 47%,expanding its subscriber market to 256,655 customers in 1999.
Rubber output rose in 1999
Weak growth in electricitydemand
A 60 mw barge-mountedpower plant has arrived
Telecom operators expandtheir subscriber networks
Sri Lanka 25
EIU Country Report May 2000 © The Economist Intelligence Unit Limited 2000
SLT has unveiled an ambitious development programme involving an expectedinvestment of approximately SLRs12bn (US$161m) over the next two years.Over half the investment will be financed by three donor agencies, includingthe Japan Bank for International Co-operation and the Swedish InternationalDevelopment Agency (SIDA), the balance being internally generated by SLT,supplemented by the SLRs1bn debenture issue floated in March this year. Theexpansion programme, which will encompass 12 major towns and a number ofrural areas, envisages the construction of 15 new exchanges, 100,000 newconnections (in 2000), an expansion in Internet connections from 16,000 to25,000, and the introduction of a number of technologically advanced value-added services.
A new pier is being constructed at Galle port to accommodate the sharpincrease in cargo volumes, which has resulted from the growth of theindustrial sector (primarily cement plants and flour mills) in the area. TheSLRs525m project is being financed by the Sri Lanka Ports Authority and is aninterim project aimed at meeting the immediate needs of the port, until thegovernment can find foreign investors willing to finance the construction of acontainer terminal.
Financial and other services
The overall slowdown in the economy, particularly exporting and importingindustries, had a knock-on effect on financial services in 1999. Growth slowedto 4.6% from 6.4% in 1998. Bank loans to the commercial sector, whichaccount for 40% of commercial banks’ advances, grew by just 8%, whileadvances to the industrial sector grew by 7%. However, personal credit loansexpanded by 25%. The share of corporate finance in commercial banks’ loansportfolios has been declining. This is not only because commercial banksincreasingly prefer to raise funds more cheaply in the capital markets, but isalso due to a tightening of banking regulations accompanied by an increase innon-performing loans (NPLs), which has made banks more cautious in theirlending practices. Commercial banks are therefore looking more towards thepersonal and housing loan market, which are deemed to be more profitableand less risky.
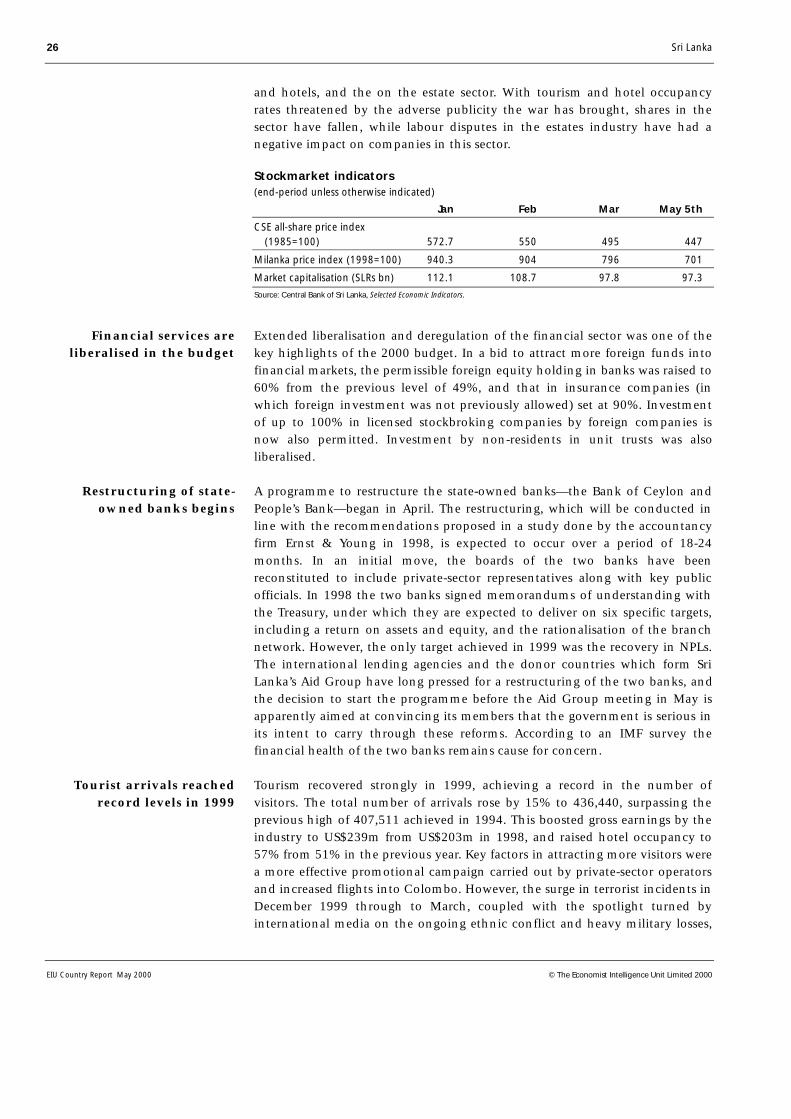
The Colombo stockmarket has continued to slide, as evidenced by the steadydownward trend in both the all-share price index (ASPI) and the sensitive priceindex, the Milanka (MPI). From around 564 points in early February, the ASPIhas moved steadily down, falling below the 500 mark at the end of March.Increased selling by foreign investors in February and March have heightenedthe bearish sentiment in the market. The market continued to fall in April andstood at 446.8 points on May 5th, reflecting the adverse effects of thegovernment imposing the Public Security Act (PSA) on May 4th (see Thepolitical scene). Even before imposition of the act the market fell by 2.6% in asingle day on May 3rd to 460.6 points (itself a nine-year low) as the LiberationTigers of Tamil Eelam (LTTE) gained ground against the military, with bothforeign and domestic investors selling. The market relies heavily on tourism
SLT unveils a massiveinvestment programme
A pier is being constructedat Galle port
Growth in financialservices slowed in 1999
The stockmarket continuesto lose ground
26 Sri Lanka
EIU Country Report May 2000 © The Economist Intelligence Unit Limited 2000
and hotels, and the on the estate sector. With tourism and hotel occupancyrates threatened by the adverse publicity the war has brought, shares in thesector have fallen, while labour disputes in the estates industry have had anegative impact on companies in this sector.
Stockmarket indicators(end-period unless otherwise indicated)
Jan Feb Mar May 5th
CSE all-share price index (1985=100) 572.7 550 495 447
Milanka price index (1998=100) 940.3 904 796 701
Market capitalisation (SLRs bn) 112.1 108.7 97.8 97.3
Source: Central Bank of Sri Lanka, Selected Economic Indicators.
Extended liberalisation and deregulation of the financial sector was one of thekey highlights of the 2000 budget. In a bid to attract more foreign funds intofinancial markets, the permissible foreign equity holding in banks was raised to60% from the previous level of 49%, and that in insurance companies (inwhich foreign investment was not previously allowed) set at 90%. Investmentof up to 100% in licensed stockbroking companies by foreign companies isnow also permitted. Investment by non-residents in unit trusts was alsoliberalised.
A programme to restructure the state-owned banks—the Bank of Ceylon andPeople’s Bank—began in April. The restructuring, which will be conducted inline with the recommendations proposed in a study done by the accountancyfirm Ernst & Young in 1998, is expected to occur over a period of 18-24months. In an initial move, the boards of the two banks have beenreconstituted to include private-sector representatives along with key publicofficials. In 1998 the two banks signed memorandums of understanding withthe Treasury, under which they are expected to deliver on six specific targets,including a return on assets and equity, and the rationalisation of the branchnetwork. However, the only target achieved in 1999 was the recovery in NPLs.The international lending agencies and the donor countries which form SriLanka’s Aid Group have long pressed for a restructuring of the two banks, andthe decision to start the programme before the Aid Group meeting in May isapparently aimed at convincing its members that the government is serious inits intent to carry through these reforms. According to an IMF survey thefinancial health of the two banks remains cause for concern.
Tourism recovered strongly in 1999, achieving a record in the number ofvisitors. The total number of arrivals rose by 15% to 436,440, surpassing theprevious high of 407,511 achieved in 1994. This boosted gross earnings by theindustry to US$239m from US$203m in 1998, and raised hotel occupancy to57% from 51% in the previous year. Key factors in attracting more visitors werea more effective promotional campaign carried out by private-sector operatorsand increased flights into Colombo. However, the surge in terrorist incidents inDecember 1999 through to March, coupled with the spotlight turned byinternational media on the ongoing ethnic conflict and heavy military losses,
Financial services areliberalised in the budget
Restructuring of state-owned banks begins
Tourist arrivals reachedrecord levels in 1999
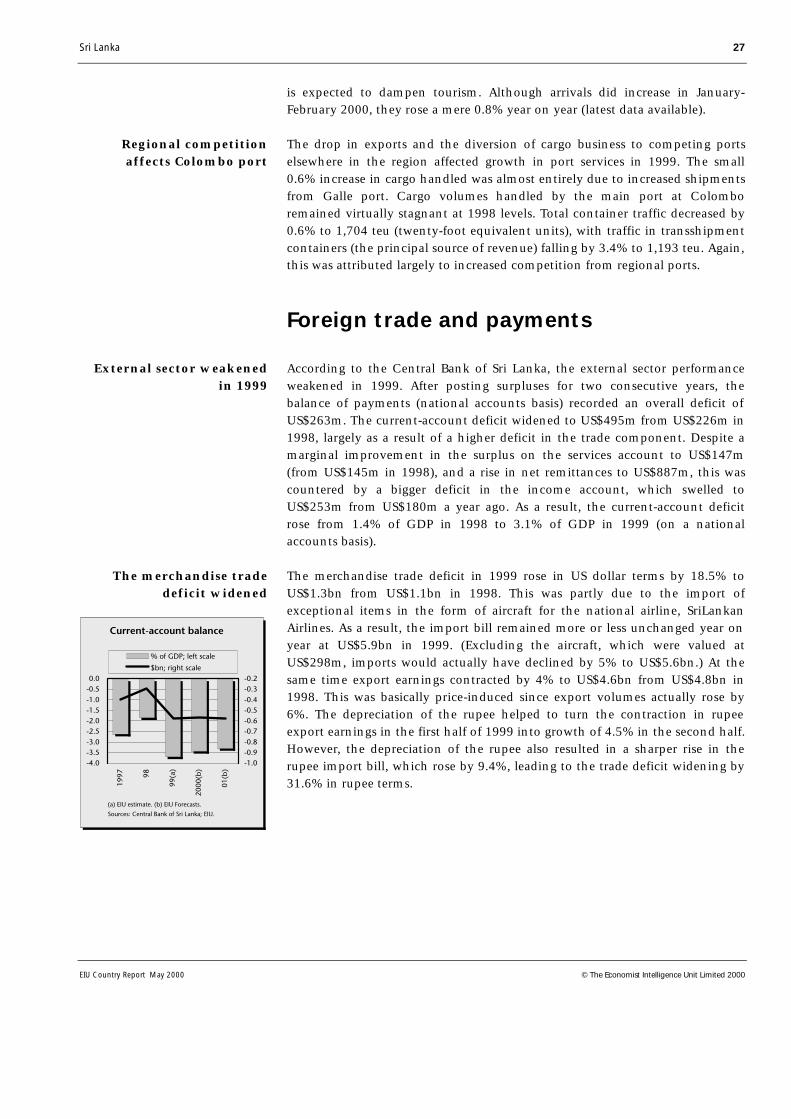
Sri Lanka 27
EIU Country Report May 2000 © The Economist Intelligence Unit Limited 2000
is expected to dampen tourism. Although arrivals did increase in January-February 2000, they rose a mere 0.8% year on year (latest data available).
The drop in exports and the diversion of cargo business to competing portselsewhere in the region affected growth in port services in 1999. The small0.6% increase in cargo handled was almost entirely due to increased shipmentsfrom Galle port. Cargo volumes handled by the main port at Colomboremained virtually stagnant at 1998 levels. Total container traffic decreased by0.6% to 1,704 teu (twenty-foot equivalent units), with traffic in transshipmentcontainers (the principal source of revenue) falling by 3.4% to 1,193 teu. Again,this was attributed largely to increased competition from regional ports.
Foreign trade and payments
According to the Central Bank of Sri Lanka, the external sector performanceweakened in 1999. After posting surpluses for two consecutive years, thebalance of payments (national accounts basis) recorded an overall deficit ofUS$263m. The current-account deficit widened to US$495m from US$226m in1998, largely as a result of a higher deficit in the trade component. Despite amarginal improvement in the surplus on the services account to US$147m(from US$145m in 1998), and a rise in net remittances to US$887m, this wascountered by a bigger deficit in the income account, which swelled toUS$253m from US$180m a year ago. As a result, the current-account deficitrose from 1.4% of GDP in 1998 to 3.1% of GDP in 1999 (on a nationalaccounts basis).
The merchandise trade deficit in 1999 rose in US dollar terms by 18.5% toUS$1.3bn from US$1.1bn in 1998. This was partly due to the import ofexceptional items in the form of aircraft for the national airline, SriLankanAirlines. As a result, the import bill remained more or less unchanged year onyear at US$5.9bn in 1999. (Excluding the aircraft, which were valued atUS$298m, imports would actually have declined by 5% to US$5.6bn.) At thesame time export earnings contracted by 4% to US$4.6bn from US$4.8bn in1998. This was basically price-induced since export volumes actually rose by6%. The depreciation of the rupee helped to turn the contraction in rupeeexport earnings in the first half of 1999 into growth of 4.5% in the second half.However, the depreciation of the rupee also resulted in a sharper rise in therupee import bill, which rose by 9.4%, leading to the trade deficit widening by31.6% in rupee terms.
Regional competitionaffects Colombo port
External sector weakenedin 1999
The merchandise tradedeficit widened
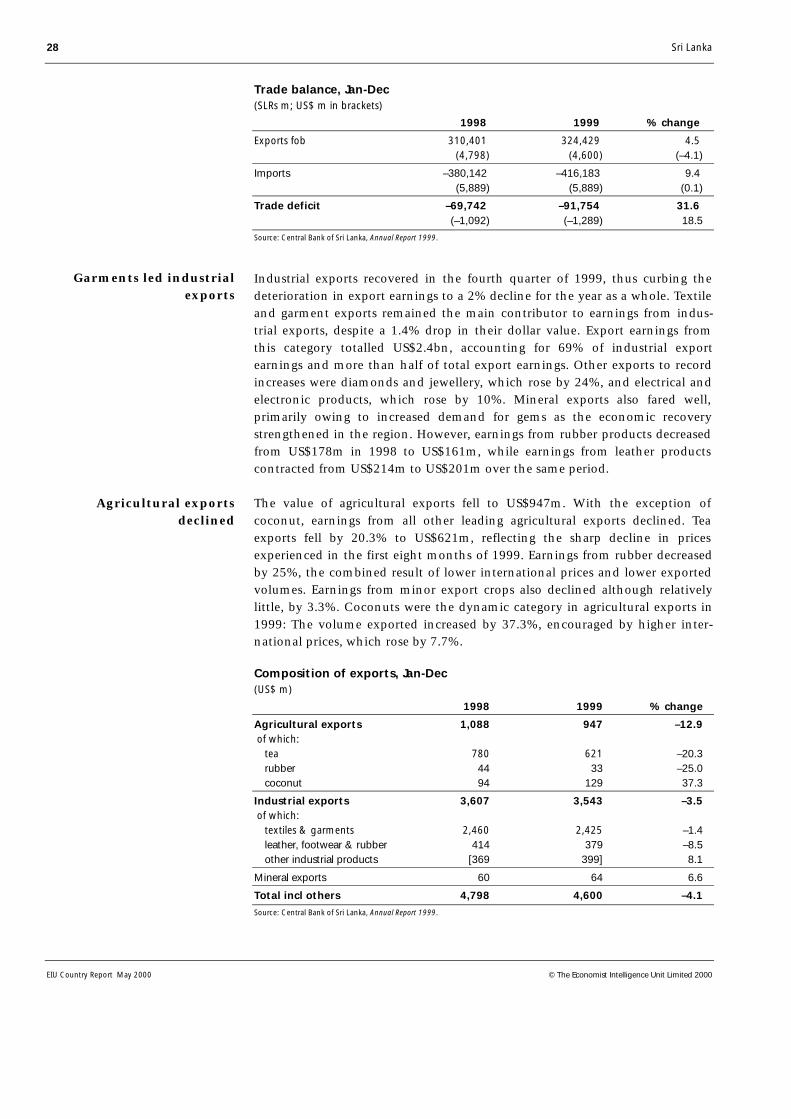
28 Sri Lanka
EIU Country Report May 2000 © The Economist Intelligence Unit Limited 2000
Trade balance, Jan-Dec(SLRs m; US$ m in brackets)
1998 1999 % change
Exports fob 310,401 324,429 4.5 (4,798) (4,600) (–4.1)
Imports –380,142 –416,183 9.4 (5,889) (5,889) (0.1)
Trade deficit –69,742 –91,754 31.6 (–1,092) (–1,289) 18.5
Source: Central Bank of Sri Lanka, Annual Report 1999.
Industrial exports recovered in the fourth quarter of 1999, thus curbing thedeterioration in export earnings to a 2% decline for the year as a whole. Textileand garment exports remained the main contributor to earnings from indus-trial exports, despite a 1.4% drop in their dollar value. Export earnings fromthis category totalled US$2.4bn, accounting for 69% of industrial exportearnings and more than half of total export earnings. Other exports to recordincreases were diamonds and jewellery, which rose by 24%, and electrical andelectronic products, which rose by 10%. Mineral exports also fared well,primarily owing to increased demand for gems as the economic recoverystrengthened in the region. However, earnings from rubber products decreasedfrom US$178m in 1998 to US$161m, while earnings from leather productscontracted from US$214m to US$201m over the same period.
The value of agricultural exports fell to US$947m. With the exception ofcoconut, earnings from all other leading agricultural exports declined. Teaexports fell by 20.3% to US$621m, reflecting the sharp decline in pricesexperienced in the first eight months of 1999. Earnings from rubber decreasedby 25%, the combined result of lower international prices and lower exportedvolumes. Earnings from minor export crops also declined although relativelylittle, by 3.3%. Coconuts were the dynamic category in agricultural exports in1999: The volume exported increased by 37.3%, encouraged by higher inter-national prices, which rose by 7.7%.
Composition of exports, Jan-Dec(US$ m)
1998 1999 % change
Agricultural exports 1,088 947 –12.9 of which: tea 780 621 –20.3 rubber 44 33 –25.0 coconut 94 129 37.3
Industrial exports 3,607 3,543 –3.5 of which: textiles & garments 2,460 2,425 –1.4 leather, footwear & rubber 414 379 –8.5 other industrial products [369 399] 8.1
Mineral exports 60 64 6.6
Total incl others 4,798 4,600 –4.1
Source: Central Bank of Sri Lanka, Annual Report 1999.
Garments led industrialexports
Agricultural exportsdeclined
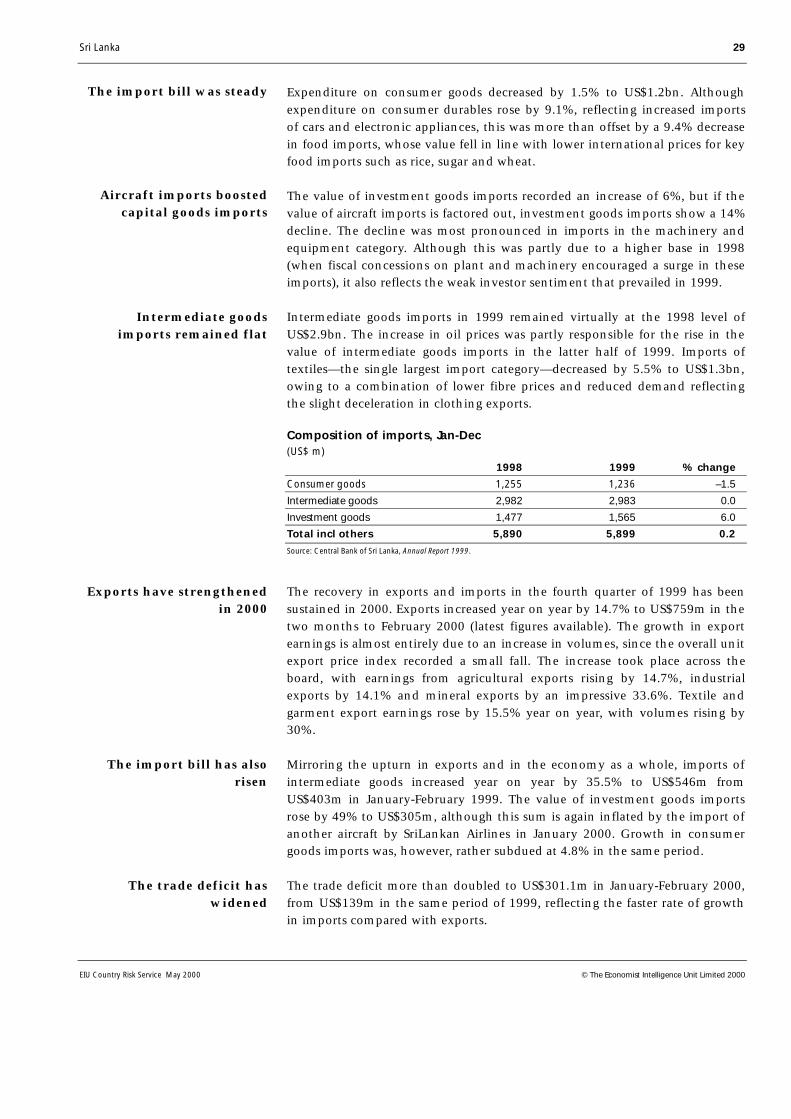
Sri Lanka 29
EIU Country Risk Service May 2000 © The Economist Intelligence Unit Limited 2000
Expenditure on consumer goods decreased by 1.5% to US$1.2bn. Althoughexpenditure on consumer durables rose by 9.1%, reflecting increased importsof cars and electronic appliances, this was more than offset by a 9.4% decreasein food imports, whose value fell in line with lower international prices for keyfood imports such as rice, sugar and wheat.
The value of investment goods imports recorded an increase of 6%, but if thevalue of aircraft imports is factored out, investment goods imports show a 14%decline. The decline was most pronounced in imports in the machinery andequipment category. Although this was partly due to a higher base in 1998(when fiscal concessions on plant and machinery encouraged a surge in theseimports), it also reflects the weak investor sentiment that prevailed in 1999.
Intermediate goods imports in 1999 remained virtually at the 1998 level ofUS$2.9bn. The increase in oil prices was partly responsible for the rise in thevalue of intermediate goods imports in the latter half of 1999. Imports oftextiles—the single largest import category—decreased by 5.5% to US$1.3bn,owing to a combination of lower fibre prices and reduced demand reflectingthe slight deceleration in clothing exports.
Composition of imports, Jan-Dec(US$ m)
1998 1999 % change
Consumer goods 1,255 1,236 –1.5
Intermediate goods 2,982 2,983 0.0
Investment goods 1,477 1,565 6.0
Total incl others 5,890 5,899 0.2
Source: Central Bank of Sri Lanka, Annual Report 1999.
The recovery in exports and imports in the fourth quarter of 1999 has beensustained in 2000. Exports increased year on year by 14.7% to US$759m in thetwo months to February 2000 (latest figures available). The growth in exportearnings is almost entirely due to an increase in volumes, since the overall unitexport price index recorded a small fall. The increase took place across theboard, with earnings from agricultural exports rising by 14.7%, industrialexports by 14.1% and mineral exports by an impressive 33.6%. Textile andgarment export earnings rose by 15.5% year on year, with volumes rising by30%.
Mirroring the upturn in exports and in the economy as a whole, imports ofintermediate goods increased year on year by 35.5% to US$546m fromUS$403m in January-February 1999. The value of investment goods importsrose by 49% to US$305m, although this sum is again inflated by the import ofanother aircraft by SriLankan Airlines in January 2000. Growth in consumergoods imports was, however, rather subdued at 4.8% in the same period.
The trade deficit more than doubled to US$301.1m in January-February 2000,from US$139m in the same period of 1999, reflecting the faster rate of growthin imports compared with exports.
The import bill was steady
Aircraft imports boostedcapital goods imports
Intermediate goodsimports remained flat
Exports have strengthenedin 2000
The import bill has alsorisen
The trade deficit haswidened