Embed Size (px)
Citation preview
SRIcapital
sustainable
investment
impact
governance
companies
responsible
social
environmental
2012REPORT ON Sustainable and Responsible Investing Trends in the United States 2012
2012
4 Report on Sustainable and Responsible Investing Trends in the United States
Donor Wallace Global Fund www.wgf.org
Visionary Sponsor Bloomberg www.bloomberg.com/bsustainable
Benefactor TIAA-CREF www.tcasset.com
General Sponsors BlackRockwww.blackrock.com
Breckinridge www.breckinridge.com
Christian Brothers Investment Services www.cbisonline.com
CRA Qualified Investment Fund www.crafund.com
Legg Mason www.leggmason.com
Neuberger Berman www.nb.com/sri
Sentinel Investments www.sentinelinvestments.com
Trillium Asset Management www.trilliuminvest.com
Walden Asset Management www.waldenassetmgmt.com
Wespath Investment Management www.wespath.com
Sponsors and Donors
Report on Sustainable and Responsible Investing Trends in the United States 5
Reflections on Sustainable and Responsible Investment, 2012
With a vision of a world in which investment capital helps build a sustainable and equitable economy, US SIF looks forward every two years to the release of our Trends report. The report anchors our understanding of the investment assets moving us in this direction. We are heartened to see that interest in this field continues to grow and that more and more assets are invested using sustainable and responsible investment (SRI) strategies.
At the same time, the country is still recovering from high unemployment and other effects of the financial crisis, legislative silence on climate change, continued concern about the financial regulatory system, unfettered secret corporate political spending, rising income inequality and soaring executive compensation. We are in the midst of what could be called a sustainability crisis.
The responsible investment field can help advance a more sustainable economy. We have already seen the industry build this capacity in a number of ways:
• As this report demonstrates, SRI assets are a significant part of the US financial market. Moreover, SRI strategies increasingly are being adopted by firms that have not historically identified them-selves as SRI. For example, the Principles for Responsible Investment has more than 1,000 signatory firms—with assets over $30 trillion—estimated to represent 20 percent of the total value of global capital mar-kets. These signatories include not only the pioneers of sustainable and responsible investing but also more conventional investment firms that are beginning to develop SRI divisions or to analyze how portfolio companies’ environmental, social and corporate governance (ESG) policies affect their financial returns. Today, there is no longer any “typical kind of firm” engaged in SRI.
• The expansion of sustainable and responsible investing can be measured across an array of asset classes. As this report details, for example, there has been a continued growth in alternative investments engaged in SRI.
• Foundations have deepened their practice of mission investing—using the tools of finance to create positive social impact aligned with their mission. And in recent years, numerous institutions have begun to use the term “impact investing” to describe the investment of capital into vehicles—private and public—that create social or environmental benefits alongside financial returns, very much like the goals of sustainable and responsible investment.
• Similarly, the rise of investment in sectors like clean technology, microfinance and community development finance indicates that investors have an appetite for profitable investments that can address societal challenges, including helping to alleviate poverty or reduce carbon emissions.
• In fact, community investing (typically via banks, credit unions, loan funds and venture capital funds that invest in underserved communitites here and abroad) is one of the fastest growing segments of SRI even though the assets in this space are small in comparison to other SRI assets. US SIF has recently undertaken several initiatives to broaden the definition of community investment and to engage a wider range of investors in this critical space.
• Changes in the professional investment industry driven by SRI professionals have generated new investment options for institutional and individual investors concerned about issues such as climate change, alternative energy, human rights, diversity and community investing. Specialized advisors, new products and access to retail platforms for community investment and other issues have all made for a more robust environment for individual investors interested in SRI.
• Globally, sustainable and responsible investors have changed investment practices by promoting
6 Report on Sustainable and Responsible Investing Trends in the United States
the creation of specialized stock exchanges that require companies to disclose sustainability data to qualify for listing. Additionally, the growing popularity of responsible investing has contributed to the creation of scores of global SRI indices, which have set standards for corporate ESG performance and become benchmarks for investors.
• As a response to shareholder engagement by SRI advocates, global corporations increasingly embrace ESG practices and disclosure and incorporate these standards into their operations. In the past year, there has been a sharpened focus on both “integrated reporting” (which links a company’s strategy, governance and financial performance with the ESG context in which it operates) and on the newly created Sustainability Accounting Standards Board (which is establishing standards for integrated reporting and an understanding of relevant and material issues to 35,000 publicly listed companies in the United States). These developments promise a fundamental change in corporate reporting that is also likely to spur more companies to consider and adopt sustainable business practices.
• The sustainable investment community has engaged in the federal regulatory and legislative arenas as another avenue through which to create the conditions for a low carbon, resource efficient, and socially accountable economy. The work we have undertaken in addressing the financial crisis, corporate disclosure, greenhouse gas emissions, integrated reporting, political contributions and consumer financial protection helps create a national framework in which environmental, social and governance considerations in investing are able to become the norm.
As we look to the close of 2012, we are buoyed by the many advances our field has made, and by the continued growth in assets that aim to integrate financial returns with environmental, social and governance impacts. And yet, it is clear we have much more to do in order to further advance the scale of sustainable and responsible investment and to effectively grapple with other challenges to building a robust, equitable and sustainable economy. We hope you will join us in this important work.
Lisa Woll, CEO
Report on Sustainable and Responsible Investing Trends in the United States 7
Table of Contents
List of Figures . . . . . . . . . . . . . . . . . . . . . . . . . . . . . . . . . . . . . . . . . . . . . . . . . . . . . . . . . . . . . . . . . . 8Acknowledgments . . . . . . . . . . . . . . . . . . . . . . . . . . . . . . . . . . . . . . . . . . . . . . . . . . . . . . . . . . . . . . 10Executive Summary . . . . . . . . . . . . . . . . . . . . . . . . . . . . . . . . . . . . . . . . . . . . . . . . . . . . . . . . . . . . . 11I. Introduction . . . . . . . . . . . . . . . . . . . . . . . . . . . . . . . . . . . . . . . . . . . . . . . . . . . . . . . . . . . . . . . . . 16
• Sustainable and Responsible Investing Defined . . . . . . . . . . . . . . . . . . . . . . . . . . . . . . . . . . . . 18• Sustainable and Responsible Investing Strategies . . . . . . . . . . . . . . . . . . . . . . . . . . . . . . . . . . 19• The Evolution of Sustainable and Responsible Investing. . . . . . . . . . . . . . . . . . . . . . . . . . . . . . 20• Structure of This Report . . . . . . . . . . . . . . . . . . . . . . . . . . . . . . . . . . . . . . . . . . . . . . . . . . . . . . . 23
II. ESG Incorporation by Money Managers and Financial Institutions . . . . . . . . . . . . . . . . . . . 25• Key Trends . . . . . . . . . . . . . . . . . . . . . . . . . . . . . . . . . . . . . . . . . . . . . . . . . . . . . . . . . . . . . . . . . 25• Background . . . . . . . . . . . . . . . . . . . . . . . . . . . . . . . . . . . . . . . . . . . . . . . . . . . . . . . . . . . . . . . . 26• Leading ESG Investing Themes and Motivations for Money Managers . . . . . . . . . . . . . . . . . . 28• ESG Incorporation by Types of Investment Vehicles . . . . . . . . . . . . . . . . . . . . . . . . . . . . . . . . . 33• Community Investing . . . . . . . . . . . . . . . . . . . . . . . . . . . . . . . . . . . . . . . . . . . . . . . . . . . . . . . . . 41
III. ESG Incorporation by Institutional Investors . . . . . . . . . . . . . . . . . . . . . . . . . . . . . . . . . . . . . 46• Key Trends . . . . . . . . . . . . . . . . . . . . . . . . . . . . . . . . . . . . . . . . . . . . . . . . . . . . . . . . . . . . . . . . . 46• Background . . . . . . . . . . . . . . . . . . . . . . . . . . . . . . . . . . . . . . . . . . . . . . . . . . . . . . . . . . . . . . . . 47• A Closer Look at Trends and Motivations . . . . . . . . . . . . . . . . . . . . . . . . . . . . . . . . . . . . . . . . . 48• ESG Incorporation by Type of Institution . . . . . . . . . . . . . . . . . . . . . . . . . . . . . . . . . . . . . . . . . 52• Conclusion and Outlook . . . . . . . . . . . . . . . . . . . . . . . . . . . . . . . . . . . . . . . . . . . . . . . . . . . . . . 58
IV. Shareholder Advocacy and Public Engagement . . . . . . . . . . . . . . . . . . . . . . . . . . . . . . . . . . 59• Key Trends . . . . . . . . . . . . . . . . . . . . . . . . . . . . . . . . . . . . . . . . . . . . . . . . . . . . . . . . . . . . . . . . 59• The Tools of Responsible Ownership . . . . . . . . . . . . . . . . . . . . . . . . . . . . . . . . . . . . . . . . . . . . 60• Responsible Investors and Public Policy . . . . . . . . . . . . . . . . . . . . . . . . . . . . . . . . . . . . . . . . . 65• The Money Managers and Institutions Involved in Shareholder Advocacy . . . . . . . . . . . . . . . 67• Highlights from Recent Proxy Seasons . . . . . . . . . . . . . . . . . . . . . . . . . . . . . . . . . . . . . . . . . . 69
V. Methodology . . . . . . . . . . . . . . . . . . . . . . . . . . . . . . . . . . . . . . . . . . . . . . . . . . . . . . . . . . . . . . . . 78VI. About the Publisher . . . . . . . . . . . . . . . . . . . . . . . . . . . . . . . . . . . . . . . . . . . . . . . . . . . . . . . . . . 85Endnotes . . . . . . . . . . . . . . . . . . . . . . . . . . . . . . . . . . . . . . . . . . . . . . . . . . . . . . . . . . . . . . . . . . . . . 86Bibliography . . . . . . . . . . . . . . . . . . . . . . . . . . . . . . . . . . . . . . . . . . . . . . . . . . . . . . . . . . . . . . . . . . . 89Additional SRI Resources . . . . . . . . . . . . . . . . . . . . . . . . . . . . . . . . . . . . . . . . . . . . . . . . . . . . . . . . 91Appendices1: Glossary of Environmental, Social and Governance (ESG) Criteria . . . . . . . . . . . . . . . . . . . . . . . 92 2: Mutual and Exchange-Traded Funds Incorporating ESG Criteria . . . . . . . . . . . . . . . . . . . . . . . . 943: Community Investing Institutions . . . . . . . . . . . . . . . . . . . . . . . . . . . . . . . . . . . . . . . . . . . . . . . . . 97 4: Money Managers Incorporating ESG Criteria . . . . . . . . . . . . . . . . . . . . . . . . . . . . . . . . . . . . . . 1045: Institutions Incorporating ESG Criteria . . . . . . . . . . . . . . . . . . . . . . . . . . . . . . . . . . . . . . . . . . . . 1066: Proponents of Shareholder Resolutions on ESG Issues 2010–2012 . . . . . . . . . . . . . . . . . . . . . 109
8 Report on Sustainable and Responsible Investing Trends in the United States
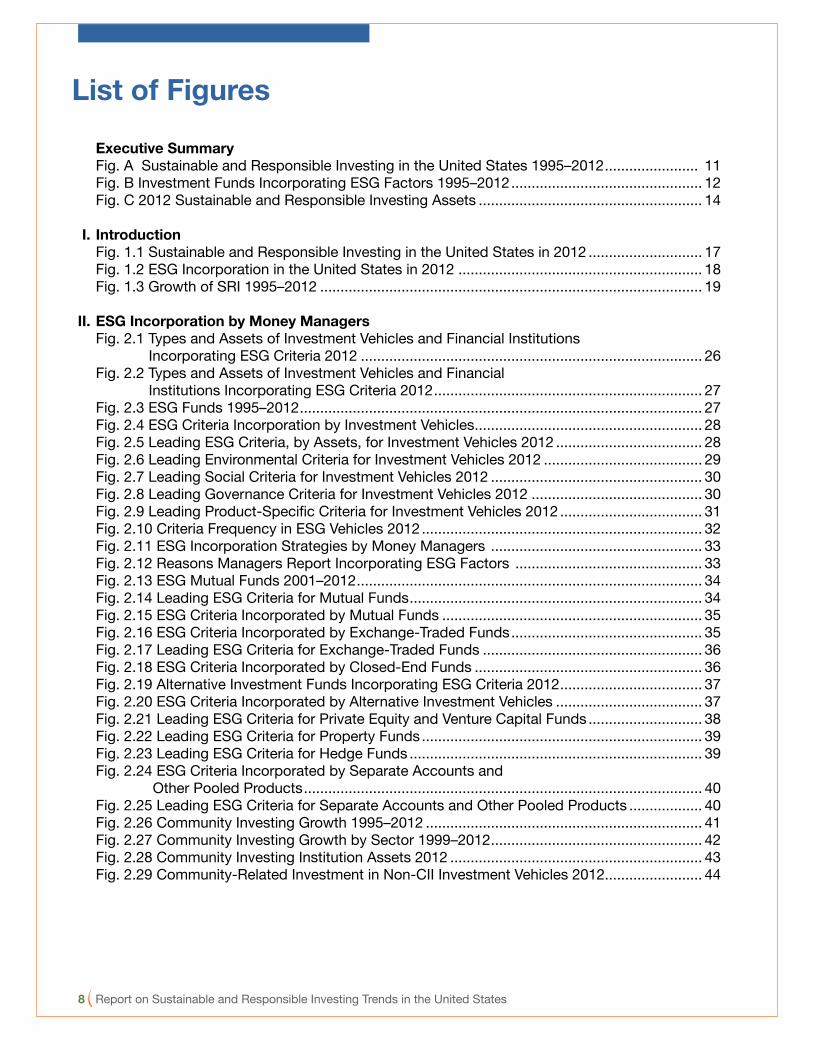
List of Figures
Executive Summary Fig. A Sustainable and Responsible Investing in the United States 1995–2012 ....................... 11 Fig. B Investment Funds Incorporating ESG Factors 1995–2012 ............................................... 12 Fig. C 2012 Sustainable and Responsible Investing Assets ....................................................... 14
I. Introduction Fig. 1.1 Sustainable and Responsible Investing in the United States in 2012 ............................ 17 Fig. 1.2 ESG Incorporation in the United States in 2012 ............................................................ 18 Fig. 1.3 Growth of SRI 1995–2012 .............................................................................................. 19
II. ESG Incorporation by Money Managers Fig. 2.1 Types and Assets of Investment Vehicles and Financial Institutions Incorporating ESG Criteria 2012 .................................................................................... 26 Fig. 2.2 Types and Assets of Investment Vehicles and Financial Institutions Incorporating ESG Criteria 2012 .................................................................. 27 Fig. 2.3 ESG Funds 1995–2012 ................................................................................................... 27 Fig. 2.4 ESG Criteria Incorporation by Investment Vehicles ........................................................ 28 Fig. 2.5 Leading ESG Criteria, by Assets, for Investment Vehicles 2012 .................................... 28 Fig. 2.6 Leading Environmental Criteria for Investment Vehicles 2012 ....................................... 29 Fig. 2.7 Leading Social Criteria for Investment Vehicles 2012 .................................................... 30 Fig. 2.8 Leading Governance Criteria for Investment Vehicles 2012 .......................................... 30 Fig. 2.9 Leading Product-Specific Criteria for Investment Vehicles 2012 ................................... 31 Fig. 2.10 Criteria Frequency in ESG Vehicles 2012 ..................................................................... 32 Fig. 2.11 ESG Incorporation Strategies by Money Managers .................................................... 33 Fig. 2.12 Reasons Managers Report Incorporating ESG Factors .............................................. 33 Fig. 2.13 ESG Mutual Funds 2001–2012 ..................................................................................... 34 Fig. 2.14 Leading ESG Criteria for Mutual Funds ........................................................................ 34 Fig. 2.15 ESG Criteria Incorporated by Mutual Funds ................................................................ 35 Fig. 2.16 ESG Criteria Incorporated by Exchange-Traded Funds ............................................... 35 Fig. 2.17 Leading ESG Criteria for Exchange-Traded Funds ...................................................... 36 Fig. 2.18 ESG Criteria Incorporated by Closed-End Funds ........................................................ 36 Fig. 2.19 Alternative Investment Funds Incorporating ESG Criteria 2012 ................................... 37 Fig. 2.20 ESG Criteria Incorporated by Alternative Investment Vehicles .................................... 37 Fig. 2.21 Leading ESG Criteria for Private Equity and Venture Capital Funds ............................ 38 Fig. 2.22 Leading ESG Criteria for Property Funds ..................................................................... 39 Fig. 2.23 Leading ESG Criteria for Hedge Funds ........................................................................ 39 Fig. 2.24 ESG Criteria Incorporated by Separate Accounts and Other Pooled Products .................................................................................................. 40 Fig. 2.25 Leading ESG Criteria for Separate Accounts and Other Pooled Products .................. 40 Fig. 2.26 Community Investing Growth 1995–2012 .................................................................... 41 Fig. 2.27 Community Investing Growth by Sector 1999–2012 .................................................... 42 Fig. 2.28 Community Investing Institution Assets 2012 .............................................................. 43 Fig. 2.29 Community-Related Investment in Non-CII Investment Vehicles 2012........................ 44
Report on Sustainable and Responsible Investing Trends in the United States 9
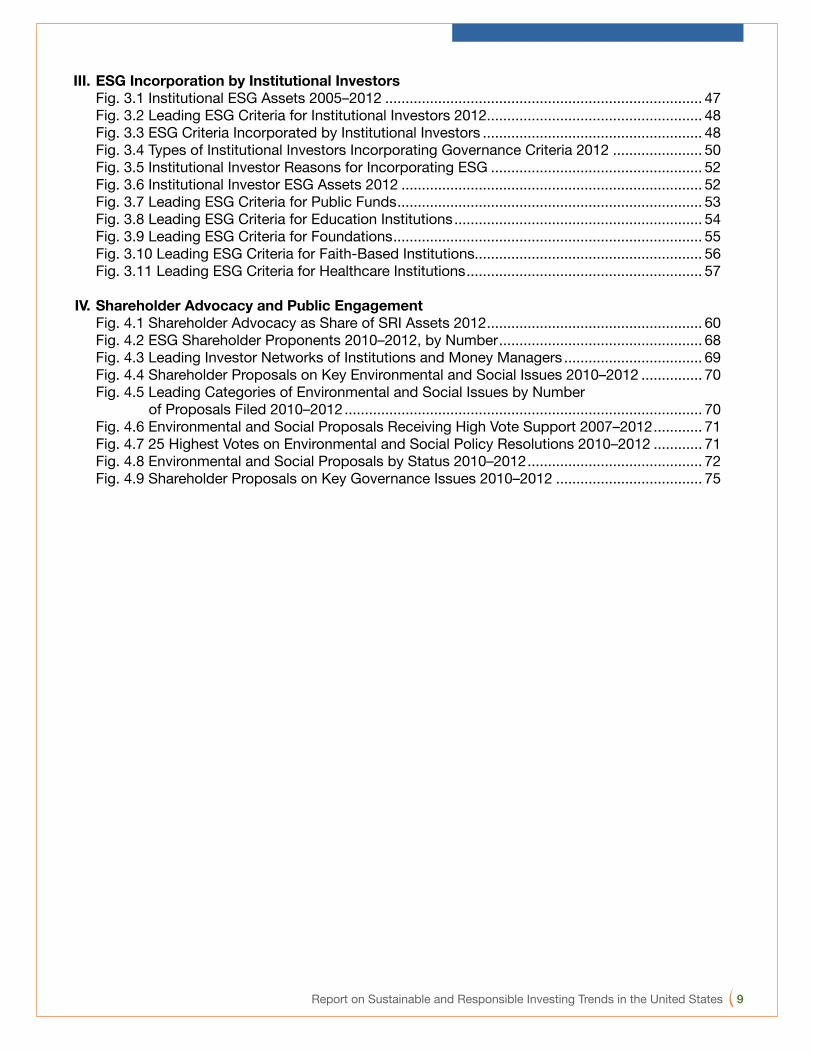
III. ESG Incorporation by Institutional Investors Fig. 3.1 Institutional ESG Assets 2005–2012 .............................................................................. 47 Fig. 3.2 Leading ESG Criteria for Institutional Investors 2012..................................................... 48 Fig. 3.3 ESG Criteria Incorporated by Institutional Investors ...................................................... 48 Fig. 3.4 Types of Institutional Investors Incorporating Governance Criteria 2012 ...................... 50 Fig. 3.5 Institutional Investor Reasons for Incorporating ESG .................................................... 52 Fig. 3.6 Institutional Investor ESG Assets 2012 .......................................................................... 52 Fig. 3.7 Leading ESG Criteria for Public Funds ........................................................................... 53 Fig. 3.8 Leading ESG Criteria for Education Institutions ............................................................. 54 Fig. 3.9 Leading ESG Criteria for Foundations ............................................................................ 55 Fig. 3.10 Leading ESG Criteria for Faith-Based Institutions........................................................ 56 Fig. 3.11 Leading ESG Criteria for Healthcare Institutions .......................................................... 57
IV. Shareholder Advocacy and Public Engagement Fig. 4.1 Shareholder Advocacy as Share of SRI Assets 2012 ..................................................... 60 Fig. 4.2 ESG Shareholder Proponents 2010–2012, by Number .................................................. 68 Fig. 4.3 Leading Investor Networks of Institutions and Money Managers .................................. 69 Fig. 4.4 Shareholder Proposals on Key Environmental and Social Issues 2010–2012 ............... 70 Fig. 4.5 Leading Categories of Environmental and Social Issues by Number of Proposals Filed 2010–2012 ........................................................................................ 70 Fig. 4.6 Environmental and Social Proposals Receiving High Vote Support 2007–2012 ............ 71 Fig. 4.7 25 Highest Votes on Environmental and Social Policy Resolutions 2010–2012 ............ 71 Fig. 4.8 Environmental and Social Proposals by Status 2010–2012 ........................................... 72 Fig. 4.9 Shareholder Proposals on Key Governance Issues 2010–2012 .................................... 75
10 Report on Sustainable and Responsible Investing Trends in the United States
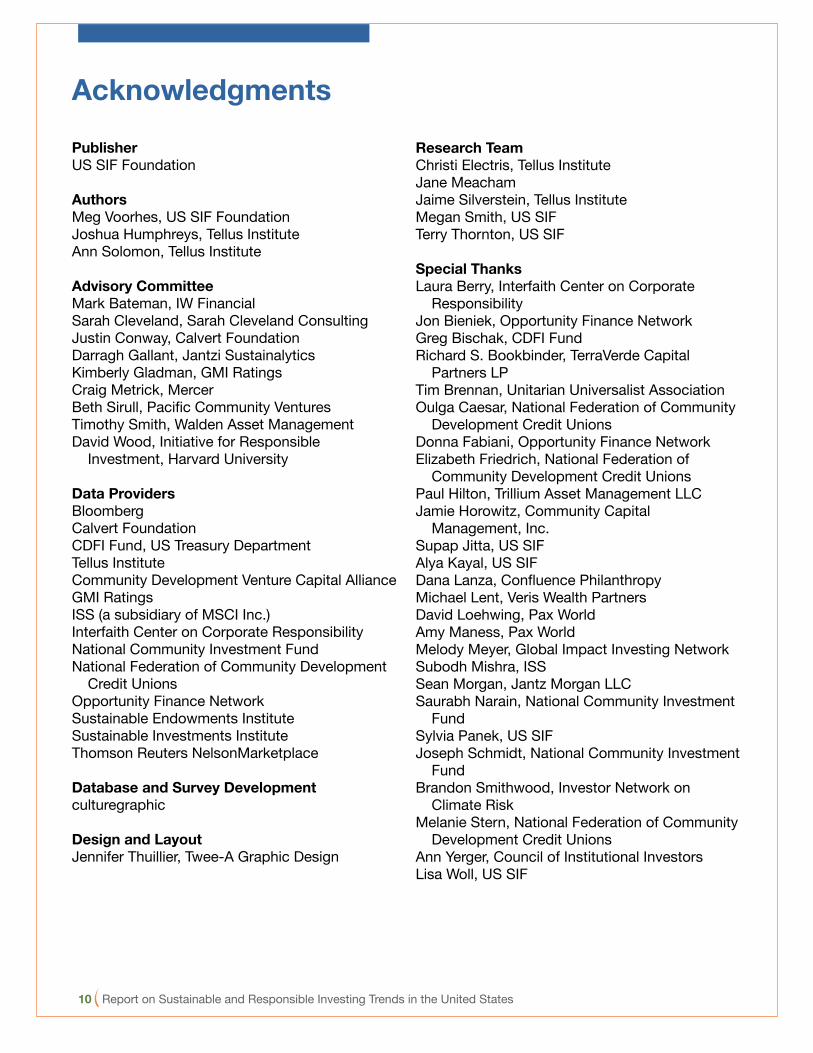
PublisherUS SIF Foundation
AuthorsMeg Voorhes, US SIF FoundationJoshua Humphreys, Tellus InstituteAnn Solomon, Tellus Institute
Advisory CommitteeMark Bateman, IW FinancialSarah Cleveland, Sarah Cleveland ConsultingJustin Conway, Calvert FoundationDarragh Gallant, Jantzi SustainalyticsKimberly Gladman, GMI RatingsCraig Metrick, MercerBeth Sirull, Pacific Community VenturesTimothy Smith, Walden Asset ManagementDavid Wood, Initiative for Responsible
Investment, Harvard University
Data ProvidersBloombergCalvert FoundationCDFI Fund, US Treasury DepartmentTellus InstituteCommunity Development Venture Capital AllianceGMI RatingsISS (a subsidiary of MSCI Inc.) Interfaith Center on Corporate ResponsibilityNational Community Investment FundNational Federation of Community Development
Credit UnionsOpportunity Finance NetworkSustainable Endowments InstituteSustainable Investments InstituteThomson Reuters NelsonMarketplace
Database and Survey Developmentculturegraphic
Design and LayoutJennifer Thuillier, Twee-A Graphic Design
Research TeamChristi Electris, Tellus InstituteJane MeachamJaime Silverstein, Tellus InstituteMegan Smith, US SIFTerry Thornton, US SIF
Special ThanksLaura Berry, Interfaith Center on Corporate
ResponsibilityJon Bieniek, Opportunity Finance NetworkGreg Bischak, CDFI FundRichard S. Bookbinder, TerraVerde Capital
Partners LPTim Brennan, Unitarian Universalist AssociationOulga Caesar, National Federation of Community
Development Credit UnionsDonna Fabiani, Opportunity Finance NetworkElizabeth Friedrich, National Federation of
Community Development Credit UnionsPaul Hilton, Trillium Asset Management LLCJamie Horowitz, Community Capital
Management, Inc.Supap Jitta, US SIFAlya Kayal, US SIFDana Lanza, Confluence PhilanthropyMichael Lent, Veris Wealth PartnersDavid Loehwing, Pax WorldAmy Maness, Pax WorldMelody Meyer, Global Impact Investing NetworkSubodh Mishra, ISS Sean Morgan, Jantz Morgan LLCSaurabh Narain, National Community Investment
FundSylvia Panek, US SIFJoseph Schmidt, National Community Investment
FundBrandon Smithwood, Investor Network on
Climate RiskMelanie Stern, National Federation of Community
Development Credit UnionsAnn Yerger, Council of Institutional InvestorsLisa Woll, US SIF
Acknowledgments
Report on Sustainable and Responsible Investing Trends in the United States 11
Executive Summary
2012 REPoRT oN SuSTAINABLE AND RESPoNSIBLE INVESTING TRENDS IN ThE uNITED STATES
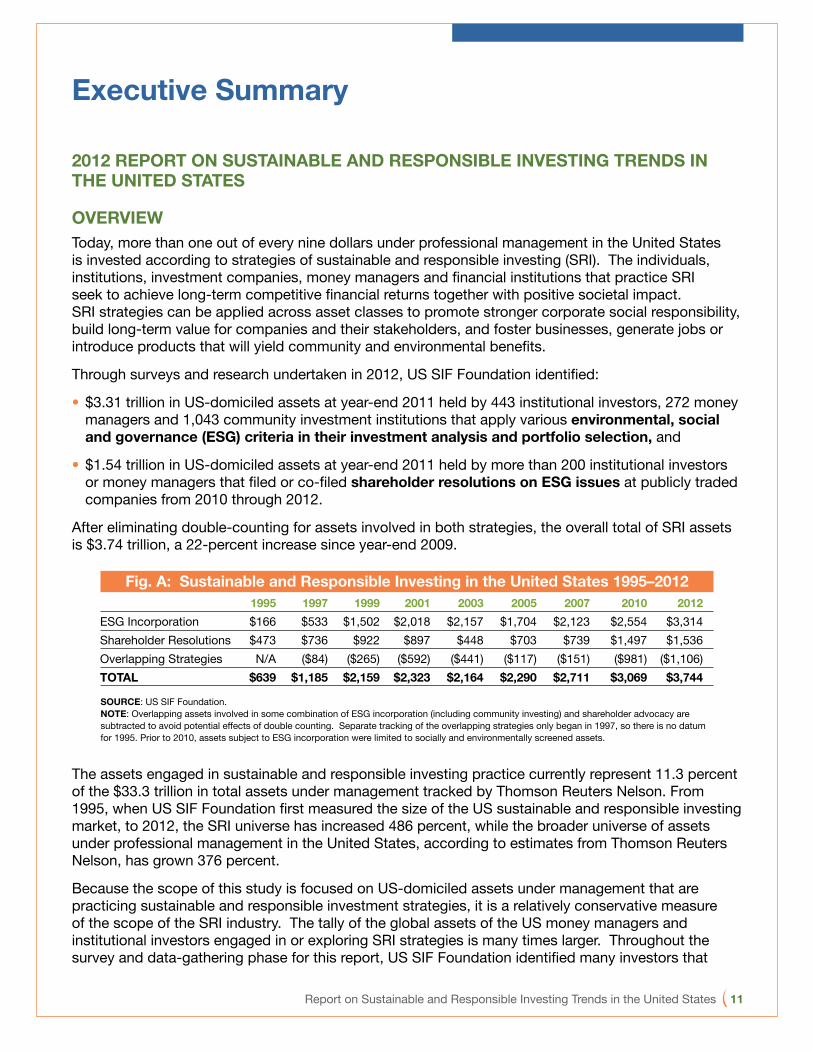
oVERVIEWToday, more than one out of every nine dollars under professional management in the United States is invested according to strategies of sustainable and responsible investing (SRI). The individuals, institutions, investment companies, money managers and financial institutions that practice SRI seek to achieve long-term competitive financial returns together with positive societal impact. SRI strategies can be applied across asset classes to promote stronger corporate social responsibility, build long-term value for companies and their stakeholders, and foster businesses, generate jobs or introduce products that will yield community and environmental benefits.
Through surveys and research undertaken in 2012, US SIF Foundation identified:
• $3.31 trillion in US-domiciled assets at year-end 2011 held by 443 institutional investors, 272 money managers and 1,043 community investment institutions that apply various environmental, social and governance (ESG) criteria in their investment analysis and portfolio selection, and
• $1.54 trillion in US-domiciled assets at year-end 2011 held by more than 200 institutional investors or money managers that filed or co-filed shareholder resolutions on ESG issues at publicly traded companies from 2010 through 2012.
After eliminating double-counting for assets involved in both strategies, the overall total of SRI assets is $3.74 trillion, a 22-percent increase since year-end 2009.
Fig. A: Sustainable and Responsible Investing in the united States 1995–2012 1995 1997 1999 2001 2003 2005 2007 2010 2012ESG Incorporation $166 $533 $1,502 $2,018 $2,157 $1,704 $2,123 $2,554 $3,314Shareholder Resolutions $473 $736 $922 $897 $448 $703 $739 $1,497 $1,536Overlapping Strategies N/A ($84) ($265) ($592) ($441) ($117) ($151) ($981) ($1,106)ToTAL $639 $1,185 $2,159 $2,323 $2,164 $2,290 $2,711 $3,069 $3,744
SouRCE: US SIF Foundation.NoTE: Overlapping assets involved in some combination of ESG incorporation (including community investing) and shareholder advocacy are subtracted to avoid potential effects of double counting. Separate tracking of the overlapping strategies only began in 1997, so there is no datum for 1995. Prior to 2010, assets subject to ESG incorporation were limited to socially and environmentally screened assets.
The assets engaged in sustainable and responsible investing practice currently represent 11.3 percent of the $33.3 trillion in total assets under management tracked by Thomson Reuters Nelson. From 1995, when US SIF Foundation first measured the size of the US sustainable and responsible investing market, to 2012, the SRI universe has increased 486 percent, while the broader universe of assets under professional management in the United States, according to estimates from Thomson Reuters Nelson, has grown 376 percent.
Because the scope of this study is focused on US-domiciled assets under management that are practicing sustainable and responsible investment strategies, it is a relatively conservative measure of the scope of the SRI industry. The tally of the global assets of the US money managers and institutional investors engaged in or exploring SRI strategies is many times larger. Throughout the survey and data-gathering phase for this report, US SIF Foundation identified many investors that
12 Report on Sustainable and Responsible Investing Trends in the United States
are beginning to develop their in-house capabilities to analyze ESG criteria or are privately reaching out to companies to discuss issues such as executive pay or climate change. These practices, while noteworthy, technically did not meet the test to be included in the measure of assets for this study. Nonetheless, these developments speak to the potential for further growth in the US sustainable and responsible investing market.
hIGhLIGhTS oF ThE 2012 REPoRT
ESG IncorporationThe total assets that are managed according to ESG factors that are explicitly incorporated into investment analysis and decision-making are valued at $3.31 trillion. Of this total, $1.41 trillion were identified within specific investment vehicles managed by money managers or community investing institutions, while $2.48 trillion were identified as owned or administered by institutional investors. Of these institutional ESG assets, $581.6 billion were managed for institutions through investment vehicles captured in research on money managers.
ESG incorporation by money managers and investment vehicles: The US SIF Foundation survey indentified 272 management firms and more than 1000 community investing institutions that incorporate ESG issues into their investment decision-making. Their combined $1.41 trillion in assets under management reflects nearly a doubling from the corresponding figure for year-end 2009. The growth in these ESG assets reflects several factors, including a dramatic increase in the number of mutual funds that consider corporate governance criteria or avoid companies doing business in the Sudan, the rise of alternative investment funds that consider ESG criteria, and the growth in assets of banks, credit unions and loan funds with an explicit mission of community development.
The broad outlines of the ESG issues incorporated by money managers are as follows:
• Environmental investment factors are incorporated in the management of 551 investment vehicles with $240 billion in assets under management,
• Social criteria, which include Sudan-avoidance policies, are the most prominent in asset-weighted terms, incorporated in the management of $1.2 trillion across a wide range of 622 investment vehicles,
• Governance issues are incorporated by a total of 346 investment vehicles with $623 billion in assets, and
• Product-specific criteria, such as restrictions on investment in tobacco and alcohol, are included in the management of 390 investment vehicles with $290 billion in assets.
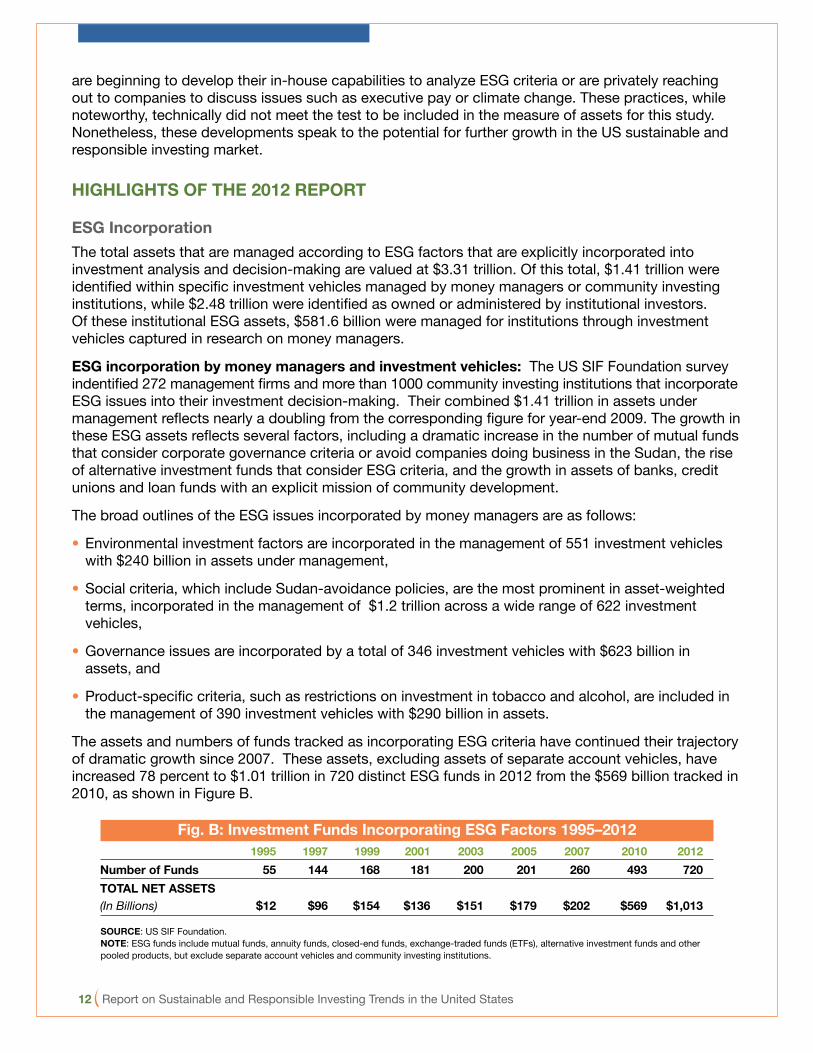
The assets and numbers of funds tracked as incorporating ESG criteria have continued their trajectory of dramatic growth since 2007. These assets, excluding assets of separate account vehicles, have increased 78 percent to $1.01 trillion in 720 distinct ESG funds in 2012 from the $569 billion tracked in 2010, as shown in Figure B.
Fig. B: Investment Funds Incorporating ESG Factors 1995–2012 1995 1997 1999 2001 2003 2005 2007 2010 2012Number of Funds 55 144 168 181 200 201 260 493 720ToTAL NET ASSETS (In Billions) $12 $96 $154 $136 $151 $179 $202 $569 $1,013
SouRCE: US SIF Foundation.NoTE: ESG funds include mutual funds, annuity funds, closed-end funds, exchange-traded funds (ETFs), alternative investment funds and other pooled products, but exclude separate account vehicles and community investing institutions.
Report on Sustainable and Responsible Investing Trends in the United States 13
Registered Investment CompaniesAmong the universe of investment vehicles that incorporate ESG factors into investment management, registered investment companies, such as mutual funds (including those underlying annuity products), exchange-traded funds (ETFs) and closed-end funds, accounted for $644 billion, invested through 361 funds.
Alternative Investment VehiclesUS SIF Foundation identified 301 different alternative investment vehicles—private equity and venture capital funds, responsible property funds and hedge funds—with a combined total of $132 billion in assets under management. This segment of the ESG investment market has experienced as much as 250 percent growth in assets since 2010, when US SIF Foundation identified just $37.8 billion in alternative investment vehicles that incorporated ESG criteria.
Other Investment Vehicles• Other Pooled Products: Forty-five other pooled products with $234.2 billion, typically commingled
portfolios managed primarily for institutional investors and high-net-worth individuals, were invested according to ESG criteria.
• Separate Account Vehicles: Among separate account managers, 178 distinctive separate-account vehicles or strategies with $337.7 billion incorporated ESG factors into investment management.
• Community Investing: A total of 1,043 community investment institutions (CIIs), including community development banks, credit unions, loan funds, and venture capital funds, collectively manage $61.4 billion.
ESG incorporation by institutional investors: With $2.7 trillion in assets involved in ESG incorpo-ration, in filing shareholder resolutions or in both strategies, institutional investors dominate the SRI universe documented in this report.
Institutional asset owners across the United States now consider environmental, social or corporate governance criteria in investment analysis and portfolio selection for aggregate assets of $2.48 trillion, a 23-percent increase since the start of 2010. This growth reflects, in large part, the near tripling of the assets, particularly those held by public funds, that review governance issues relating to executive pay or the quality and accountability of boards of directors, or that avoid investments in companies doing business in Iran. Another factor is the increased prominence of environmental issues, particularly relating to climate change and carbon emissions.
Shareholder AdvocacyA wide array of institutional investors—including public funds, religious investors, labor funds, foundations and endowments—and money managers file or co-file shareholder resolutions at US companies on ESG issues, and hundreds of these proposals come to votes each year. From 2010 to 2012, 176 institutional investors with $1.28 trillion in assets and 32 investment management firms with total assets under management of $251.3 billion filed or co-filed proposals. This level of involvement, both in terms of the numbers of institutions and managers involved and their overall assets under management, has been consistent since 2010, when US SIF Foundation similarly identified slightly more than 200 institutions and managers with combined assets of $1.5 trillion that filed resolutions from 2008 through mid-2010.
Additionally, US SIF Foundation identified substantially more managers since year-end 2009, and a 29-percent increase in the corresponding assets under management, that engage in dialogue with portfolio companies on ESG issues. This suggests that money managers increasingly are pursuing
14 Report on Sustainable and Responsible Investing Trends in the United States
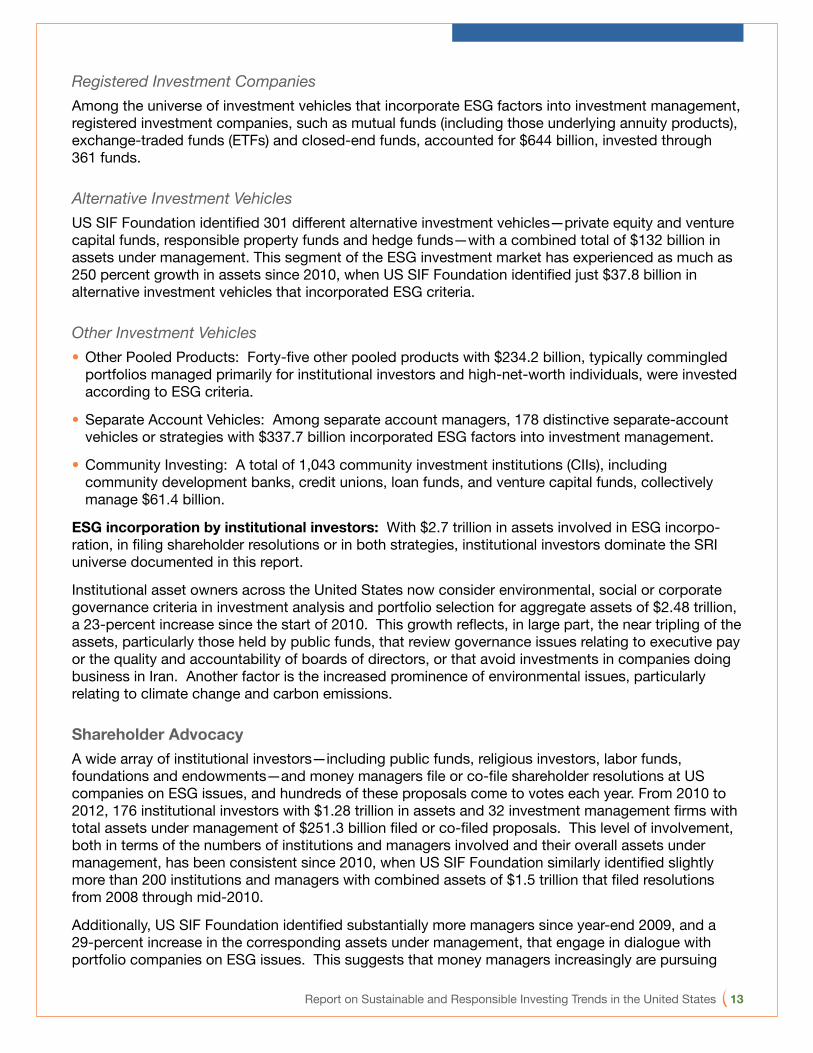
shareholder engagement strategies, even if they do not file shareholder resolutions. (As noted earlier, the assets involved in corporate engagement efforts are not counted towards the overall total of SRI assets unless they are also involved in filing shareholder resolutions or ESG incorporation.)
Figure C: 2012 Sustainable and Responsible Investing Assets ESG Incorporation Assets InvolvedMoney Managers & CIIs $ 1,411.9 Institutional Investors $ 2,483.9 Overlapping Assets $ (581.6) Subtotal $ 3,314.2 Shareholder ResolutionsMoney Managers $ 251.3 Institutional Investors $ 1,284.7 Subtotal $ 1,536.0 Overlapping Strategies $ (1,105.9) ToTAL $ 3,744.2
SouRCE: US SIF Foundation.NoTE: ESG Incorporation includes community investing institutions (CIIs).
Major SRI Drivers and Trends In recent years, the evolution and growth of SRI within US financial markets has been shaped by numerous trends:
• Money managers increasingly are incorporating ESG factors into their investment analysis and portfolio construction, driven by the demand for ESG investing products from institutional and individual investors and by the mission and values of their management firms. Client demand and values were the reasons most commonly cited by managers that responded to surveying—each motivation was cited by 72 percent of managers.
• The risks associated with the volatile and repressive Sudan regime continue to drive institutional investors and money managers to pursue targeted divestment from the country or active engagement with affiliated companies. Indeed, Sudan-related investment policies are the most prevalent ESG criteria incorporated into investment management, affecting more than $1.63 trillion in institutional assets and over $999 billion across all investment vehicles included in the money manager phase of research.
• The incorporation of governance criteria has become a leading ESG issue for institutional investors and money managers alike. Governance-related criteria affect $913.9 billion in institutional investor capital and are incorporated across 346 investment vehicles with combined assets of $623.3 billion. The most prevalent governance criteria considered in investment analysis and portfolio construction include executive pay, board issues, political contributions and broader policies on corporate governance.
• Consumer demand and campaigns persuading retail and other customers to “Move Your Money” from the large banks tarnished by the recent financial crisis boosted deposits in community-oriented banks and credit unions. Community development bank assets were up to $30.1 billion at the outset of 2012, a 73-percent increase since 2010. Community development credit unions experienced similarly strong growth, up 54 percent since 2010 to $17.1 billion.
Report on Sustainable and Responsible Investing Trends in the United States 15
• From 2010 to 2012, there has been a pronounced upward trend in vote support on environmental and social issues, with 24 percent or more of such resolutions each year receiving the support of more than 30 percent of the shares voted, up significantly from the levels of 2007 to 2009, when only 15 to 18 percent of environmental and social issues resolutions won such support levels.
• In response to shareholder campaigns for better corporate governance practices, a growing number of US companies are establishing more stringent standards for their board elections and no longer allow their chief executive officers to chair their boards.
• A leading concern for shareholders, especially since the Supreme Court’s Citizens United decision, is corporate political spending and lobbying; investors filed more than 100 resolutions annually in 2011 and 2012 seeking better review and disclosure by portfolio company management of these activities.
• Eighty-two money managers with $4.9 trillion in assets under management reported that they pursue dialogue with portfolio companies, up substantially from the 54 managers with $3.8 trillion in assets that answered this way at year-end 2009. This is a much larger pool of money managers and assets under management than those currently involved in filing shareholder resolutions.
Our approach to asset management is framed in an entirely different way.
For more than 90 years, TIAA-CREF Asset Management has been balancing innovation with time-tested investment strategies for clients worldwide. As a result, we now manage $495 billion* in assets across xed income, stable value, equities, real estate and alternatives.
To discover more about our strategic approach to SRI, please call 212 490-9000, ext. 23-7183, or visit www.tiaa-cref.org/AssetManagement.
* As of 9/30/12. TIAA-CREF personnel, through its investment management area, provide investment advice and portfolio management services through the following entities: Teachers Advisors, Inc., TIAA-CREF Investment Management, LLC, TIAA-CREF Alternatives Assets, LLC and Teachers Insurance and Annuity Association (TIAA). TIAA-CREF Individual & Institutional Services, LLC and Teachers Personal Investors Services, Inc., members FINRA, distribute securities products. ©2012 Teachers Insurance and Annuity Association-College Retirement Equities Fund (TIAA-CREF), 730 Third Avenue, New York, NY 10017.C7384
SociallyResponsiveInvesting
Legg Mason and our Affiliate investment managers ClearBridge Advisors and Legg Mason Investment Counsel are pleased to support the US SIF Foundation.
We are proud to support the
US SIF Foundation
For information on Neuberger Berman products and services, please visit www.nb.com/sri
©2012 Neuberger Berman Management Inc., distributor. All rights reserved.
K0515_1012_Social Investment Forum Ad_r1 1 10/11/12 3:03 PM
Proud to support theUS SIF Foundation
Stewardship is a serious responsibility that can be measured and proven over time. That’s why Sentinel Investments is committed to quality, consistency and sustainable results, counted in years rather than days, weeks or months.
www.sentinelinvestments.com/sustainable-investing
NOT FDIC INSURED • MAY LOSE VALUE • NO BANK GUARANTEEConsider a fund’s objectives, risks, charges and expenses carefully before investing. The prospectus contains this and other information and is available from your financial advisor or www.sentinelinvestments.com. Please read it carefully before you invest.Sentinel Investments is the unifying brand name for Sentinel Financial Services Company, Sentinel AssetManagement, Inc., and Sentinel Administrative Services, Inc. Sentinel Funds are distributed by SentinelFinancial Services Company, One National Life Drive, Montpelier, VT 05604 800.282.FUND
1.800.282.FUND | www.sentinelinvestments.com | @sentinelinvest
A Standard of Stewardship
Focusing exclusively on sustainable and responsible investing
Trillium is proud to support the US SIF Foundation’s
2012 Trends Report
800-548-5684www.trilliuminvest.com
Delivering Sustainable Investments since 1982 SM
wespath.com 847-866-4100
Wespath is pleased to support the US SIF Foundation. We have been an advocate and practitioner of ESG-based investing for many years.
We promote ESG-based investing through:• Advocacy• Proxyvoting• Shareholderresolutions• Publicpolicyengagement• Investmentscreening• Investmentstosupportcommunitydevelopment
adivisionoftheGeneralBoardofPensionandHealthBenefits of The United Methodist Church
A Leader in Sustainable
Investing