Embed Size (px)
Citation preview
Središnja medicinska knjižnica
Pećina-Šlaus, N., Žigmund, M., Kušec, V., Nikuševa Martić, T., Čačić, M., Šlaus, M. (2007) E-cadherin and beta-catenin expression patterns in malignant melanoma assessed by image analysis. Journal of Cutaneous Pathology, 34 (3). pp. 239-246. The definitive version is available at www.blackwell-synergy.com.
http://www.blackwell-synergy.com/doi/abs/10.1111/j.1600-
0560.2006.00601.x
http://dx.doi.org/10.1111/j.1600-0560.2006.00601.x
http://medlib.mef.hr/355
University of Zagreb Medical School Repository
http://medlib.mef.hr/
1
E-cadherin and beta-catenin expression patterns in malignant melanoma assessed by image analysis
Nives Pećina-Šlaus1, Martina Žigmund1, Vesna Kušec2, Tamara Nikuševa Martić1, Mirjana Čačić3, Mario Šlaus4
1Department of Biology, Croatian Institute for brain research, School of Medicine, University of Zagreb, Šalata 3, HR-10000 Zagreb, Croatia, e-mail: [email protected], tel. 385 01 4566952 2Clinical Institute of Laboratory Diagnosis, Clinical Hospital Centre Zagreb, Kišpatićeva 12, 10 000 Zagreb, Croatia 3Department of pathology, Clinical Hospital Centre Zagreb, Kišpatićeva 12, 10 000 Zagreb, Croatia 4Department of Forensic Medicine, School of Medicine University of Zagreb, Šalata 3, HR-10000 Zagreb, Croatia
Corresponding author: Nives Pećina-Šlaus1
Department of Biology, School of Medicine,
University of Zagreb, Šalata 3, HR-10000 Zagreb, Croatia,
e-mail: [email protected], tel. +385 1 46 21 140, fax:+385 1 45 50 744; +385 1 45 96
942; +385 1 49 20 050
Key words: E-cadherin, beta-catenin, malignant melanoma, image analysis Running title: E-cadherin and beta-catenin in melanoma.
2
Abstract
Background. We investigated the expression of E-cadherin and beta-catenin in
melanoma. Both proteins are components of adherens junctions, but also play
signaling roles in the wnt signal transduction pathway.
Materials and Methods. Seventy malignant melanomas were analysed by
immunohistochemistry and evaluated by image analysis as staining density, i.e. light
permeability (LP).
Results. Comparison of mean values of relative LP for E-cadherin and beta-catenin in
tumor tissue shows that levels of E-cadherin protein are significantly lower (259.67 to
116.23; t=22.7; P=0.000). The comparison of mean values of the relative LP of E-
cadherin in melanoma to the LP in the adjacent normal skin also shows that the
expression of E-cadherin in tumor is significantly lower (256.06 to 169.87; t=11.55,
P=0.000). Beta-catenin was observed in the cytoplasm in 30.6% of patients, in 24.2%
in the cell membrane, in 21% in both the cytoplasm and membrane, in 1.6% in the
membrane and nucleus, in 4.8% in the cytoplasm and nucleus, while in 17.7% of
patients' beta-catenin could not be observed. Patients with Clark 4 and 5 had
significantly less beta-catenin than patients with Clark 2 and 3 (χ2 = 12.854;
P=0.005).
Conclusions. Changes in E-cadherin and beta-catenin levels have important roles in
melanoma and could be used as molecular markers of disease progression.
3
Introduction
In our study we tried to investigate protein expression of two genes, E-
cadherin, CDH1 and beta-catenin, CTNNB1, in a series of superficial spreading and
nodular malignant melanomas.
E-cadherin is one of the most important molecules of cell-cell adhesion in
epithelial tissues. This 120 kDa transmembrane glycoprotein is generally localized on
the surfaces of epithelial cells in a region of cell-cell contact that is known as the
adherens junction1, 2. Besides its role in normal cells, this gene can play a major role
in malignant cell transformation, and especially in tumor development and
progression. Most tumors have abnormal cellular architecture, and loss of tissue
integrity can lead to local invasion. Thus, loss of function of E-cadherin tumor
suppressor protein correlates with increased invasiveness and metastasis of tumors,
resulting in it being referred to as the «suppressor of invasion» gene 3, 4.
The other gene investigated, beta-catenin, is a 92-kDa protein first identified
as a molecule associated with the cytoplasmic tail of E-cadherin 5. It shows great
homology to Armadillo of Drosophila melanogaster 6 and plays a role linking E-
cadherin to the cytoskeleton. In the cytoplasm, beta-catenin forms a complex together
with adenomatous polyposis coli (APC) tumor suppressor protein, axin and
GSK3beta. In the absence of a WNT signal, beta-catenin is phosphorylated and
targeted for degradation by the ubiquitin/proteasome machinery 7. In response to
WNT signalling, cytoplasmic beta-catenin is stabilized, accumulates in the cytoplasm
and enters the nucleus, where it finds a partner, a member of the DNA binding protein
family LEF/TCF (T cell factor-lymphoid enhancer factor) 8. Together they activate
new gene expression programs. One of the target genes for beta-catenin/TCF encodes
c-MYC protein 9, explaining why constitutive activation of the wnt pathway can lead
to cancer.
Although several molecular studies have examined alterations in oncogenes
and tumor suppressor genes in malignant melanoma 10, the etiology and pathogenesis
of this neoplasm is still not clear and needs to be elucidated. Main candidates
responsible for melanoma development and progression are CDKN2A and CDK4
genes residing on chromosomes 9p21 and 12q14, as well as MC1R gene located at
16q24 11, 12. These genes together with signal transduction pathways in which they are
implied are primarily changed in hereditary melanoma. Sporadic forms of melanoma
4
characterize changes of genes: BRAF, RAS, c-MET and PTEN 10 but findings on
their involvement are inconsistent and inconclusive.
There are several reasons why we propose studying E-cadherin and beta-
catenin protein expression in malignant melanoma. It has been well documented that
wnt genes, together with other components of wnt signalling pathway, are implicated
in cancer 13, especially in neoplasms of epithelial origin. Pigment producing cells of
the epidermis, melanocytes, undergo malignant transformation in melanoma.
Melanocytes are of neuroectodermal origin and during embrional development they
migrate in the epidermis. In normal human epidermis melanocytes reside at the
basement membrane and through their dendritic processes contact multiple
keratinocytes, the predominant cell type in the epidermis. Keratinocytes play essential
role in regulating melanocyte proliferation and phenotype 14 and this regulation is
mediated by a major adhesion molecule between these two cell types – E-cadherin.
And finally, melanoma shows a very high tendency of metastasis, a process
preceded by adherens junction disassembly, and both molecules that interested us are
important indicators of invasiveness.
The aim of our investigation is to detect and quantify expression changes of
two proteins, E-cadherin and beta-catenin, in order to identify molecular targets
involved in malignant melanoma development. We also aimed to correlate the level of
immunohistochemical staining to clinicopathological parameters.
Materials and Methods
Melanoma samples
A total of 70 primary melanoma tissues were collected from the Department of
Pathology Clinical Hospital Centre Rebro, Zagreb. The patients had no family history
of melanoma. The tumor tissue specimens and adjacent skin were obtained after
surgery during time period 1998-2004. Thirty normal skin tissue specimens were
collected from the Department of Plastic Surgery Clinical Hospital Centre Rebro,
Zagreb. The age of patients varied from 28 to 82 (mean age=57.79; s.d.=15.22;
median 62 years), and there were 36 females and 34 males. The mean ages at
diagnosis for both sexes were similar (M=57.52; F=58.03).
The samples were formalin fixed, paraffin embedded and 4 µm thick sections
were placed on Capillary gap microscope slides (DakoCytomation, Denmark). Of the
5
primary tumors a pathologist classified 58.6% as superficial spreading and 41.4% as
nodular. The pathohistological classification was assessed according to Clark 15. The
distribution of different Clark stages in our sample showed that prevailing stages were
4 and 3, 44.3% and 31% respectively. Clark 5 represented 12.9%, Clark 2 -11.4% of
the total sample, while Clark 1 was not present. The local Ethical committee approved
our study.
Immunohistochemistry
The sections were immunostained using the biotin-avidin-horseradish
peroxidase method. Deparaffinized and rehydrated sections were microwaved in Dako
Target Retrieval Solution (Dako Corporation, U.S.A.) three times for 5 minutes at 800
W to unmask eiptopes. To block endogenous peroxidase activity the cells were fixed
in methanol containing 3% H2O2. Non-specific binding was blocked by the
application of normal rabbit serum for 30 minutes in a humid chamber. Slides were
blotted and the primary antibodies at optimized dilutions of 1 : 100 (E-cadherin) and 1
: 200 (beta-catenin), respectively, were applied for 30 minutes at room temperature.
The antibodies used were: Monoclonal Mouse anti-human E-cadherin NCH-38, and
Monoclonal Mouse anti-human Beta-catenin – 1, both Dako Corporation, U.S.A.
After incubation the slides were washed 3 times in PBS/goat serum.
Secondary LINK antibody was applied for 25 minutes. The washing was repeated and
the slides were incubated with straptavidin horseradish peroxidase for another 25
minutes. All chemicals were from DakoCytomation, Denmark.
To discriminate melanin pigments from specific staining products we
counterstained the samples with Giemsa. Negative control in each experiment was the
sample that underwent same staining procedure with the exclusion of the primary
antibody. Normal skin sections and normal renal tissue sections served as positive
controls. The analysis of the labeling was performed by two independent observers,
i.e. blinded pathologists, experts in the field.
Image analysis
Protein expression was then quantified with the aid of Olympus BH-2
microscope and Image Analyzer. For each sample, the intensity of staining in a well
defined area was evaluated using image analysing software manufactured by Vamstec
(Zagreb, Croatia). Region of interest was chosen as one representative field under x
100 magnification, in the centre of either the malignant tissue or apparently normal
tissue with well preserved tissue components. All density measurements were
6
"calibrated" against its slide characteristics i.e. transparency. Density was depicted as
the intensity of light retained by tissue or tissue transparency, and expressed in grey
scale pixels ranging 0-255. Zero representing no transmission of light, and 255 total
transparency. Density in the area of tumor location was compared to density of the
most distant normal tissue in the same section.
Statistical Analysis
Following statistical methods were used: A nonparametric Kruskal-Wallis test
was used to correlate expression of E-cadherin and beta-catenin in tumor tissues to
Clark stages. The correlation between Clark stages and patients' sex and age at
diagnosis was also evaluated using Kruskal-Wallis. T-test was used to compare levels
of E-cadherin and beta-catenin expression in tumor tissues to the levels of their
expression in normal adjacent skin. To test the correlation between the levels of E-
cadherin and beta-catenin expression in tumor and corresponding skin to patients' sex
Mann-Whitney test was used. Mann-Whitney was also used to evaluate the
relationship of expression intensity of beta-catenin to its cellular location. Variance
analysis (a one-way ANOVA test) was used to correlate the intensity of expression of
investigated proteins to the patients' age at diagnosis.
All statistical evaluations were performed according to the SPSS statistical
package (SPSS Inc., Chicago, IL, USA).
Results E-cadherin expression levels
Seventy primary melanomas (41 superficial spreading, 29 nodular), as well as 30
normal skin sections were analyzed by immunohistochemistry for protein expression
of E-cadherin. In normal skin as well as in morphologically normal skin adjacent to
melanoma E-cadherin showed homogenous membranous staining of the epidermis.
However, in both superficial spreading and nodular melanomas E-cadherin expression
decreased significantly as compared to normal skin expression. No difference in
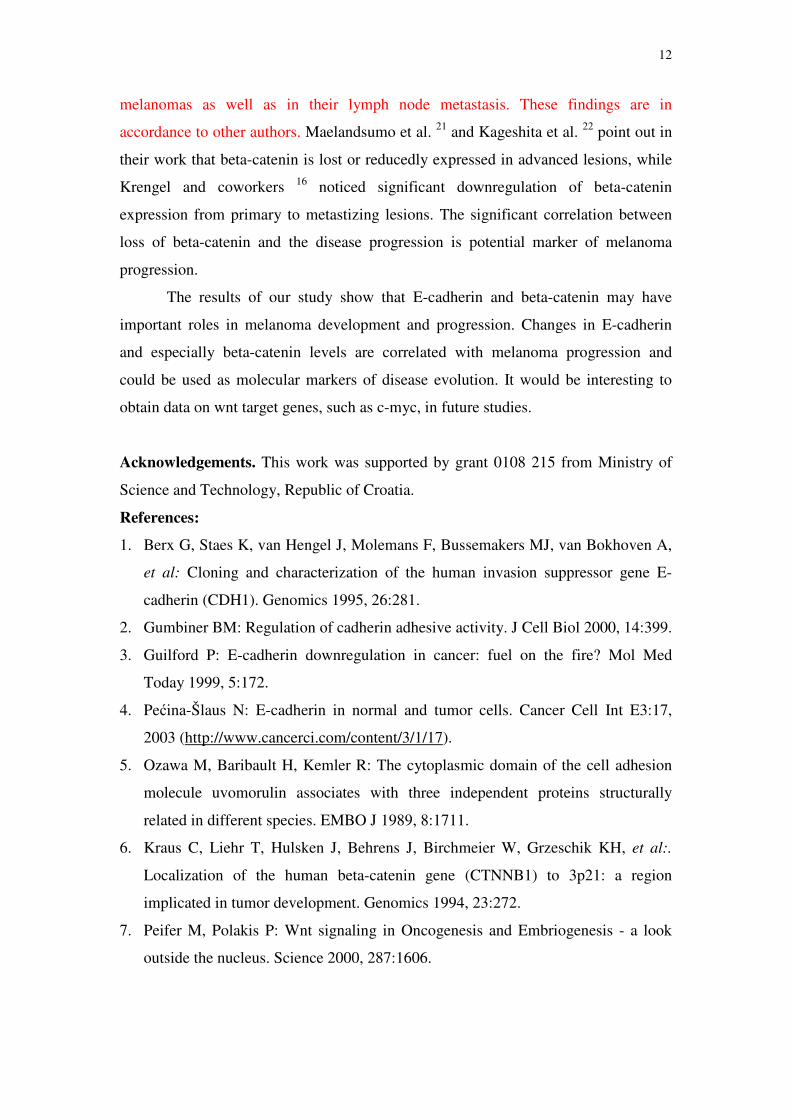
distribution was observed in those two groups. In a proportion of samples (26/70,
37%) a total loss of E-cadherin protein was observed. Figure 1A shows melanoma
sample where distinctive decrease of E-cadherin protein in melanoma cells was
observed, and B - immediate adjacent skin of the same patient.
7
Beta-catenin expression levels
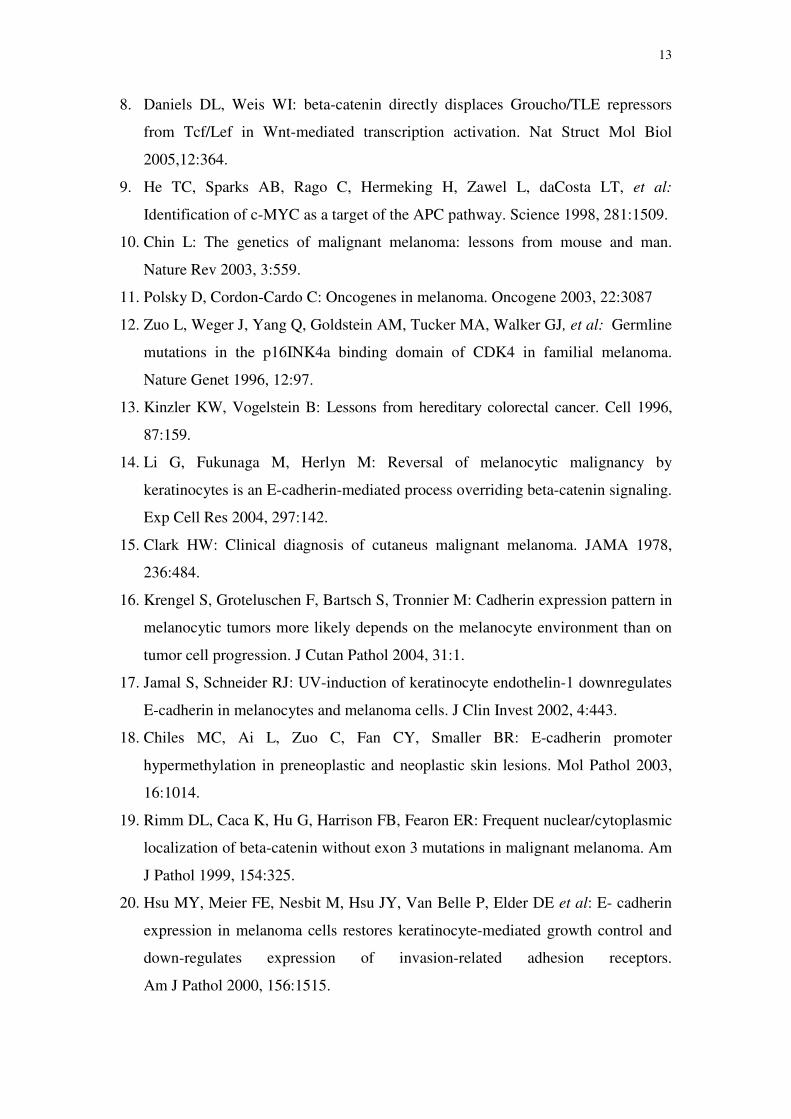
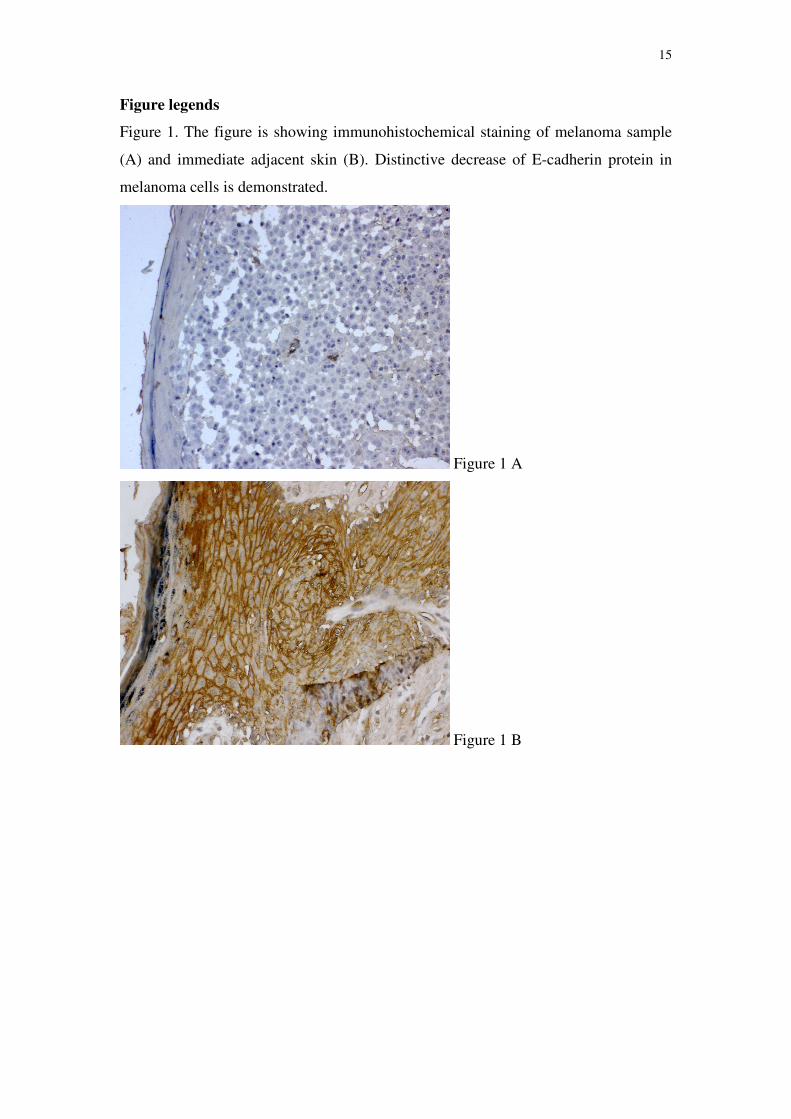
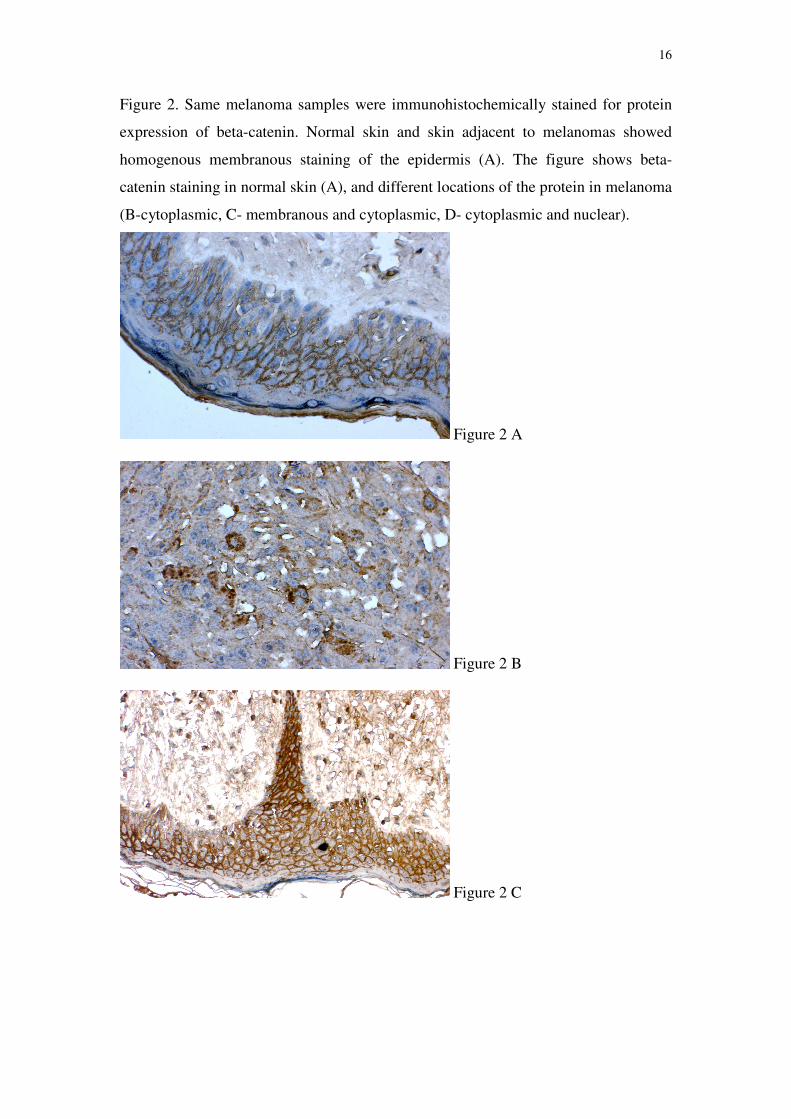
Same melanoma samples were immunohistochemically stained for protein
expression of beta-catenin. Normal skin and skin adjacent to melanomas showed
homogenous membranous staining of the epidermis, similar to the picture of E-
cadherin staining. Contrary to the situation in the normal skin, the cellular location of
beta-catenin in melanoma has changed. The protein could visually be determined in
the cytoplasm in 30.6% of analyzed patients, in 24.2% in the cell membrane, in 21%
in both the cytoplasm and membrane, in 1.6% in the membrane and nucleus, in 4.8%
in the cytoplasm and nucleus, while in 17.7% of patients beta-catenin could not be
observed. Figure 2 shows beta-catenin staining in normal skin (A), and different
locations of the protein in melanoma (B, C, D).
Image analysis and the correlations to the collected parameters
The obtained results were then evaluated by Image analysis as staining
density, i.e. light permeability (LP). To further specify the role that E-cadherin and
beta-catenin play in melanoma rise and progression we correlated all data collected.
Before interpretation of our results we had to standardize the values that Image
analysis gave us. The analysis of 30 normal skin samples unrelated to melanoma
showed that E-cadherin protein levels were slightly greater in normal skin of non-
melanoma patients than protein levels of E-cadherin in the skin adjacent to melanoma.
Beta-catenin levels were lower in normal skin of non-melanoma patients than levels
in the skin adjacent to melanoma. Mean values for light permeabilities for E-cadherin
in normal skin of non-melanoma patients was 65, and for beta-catenin 147. These
numbers enabled us to calculate relative LP increase or decrease of E-cadherin and
beta-catenin proteins in tumor tissue and adjacent skin. We introduced variables
relative increase of protein expression in tumor tissue and adjacent skin defined as:
Etmrel = etm/exnorms x 100 and Eskinrel = eskin/exnorms x 100, for E-cadherin, and
Btmrel = btm/bxnorms x 100 and Bskinrel = bskin/bxnorms x 100, for beta-catenin.
Etmrel and Btmrel represented relative increase or decrease of LP in tumor tissue for
E-cadherin/beta-catenin; etm and btm denoted measured LP in tumor tissue; exnorms
and bxnorms values of LP in normal skin, Eskinrel and Bskinrel – relative increase or
decrease of LP in the adjacent skin; and eskin and bskin measured values of LP in the
adjacent skin.
8
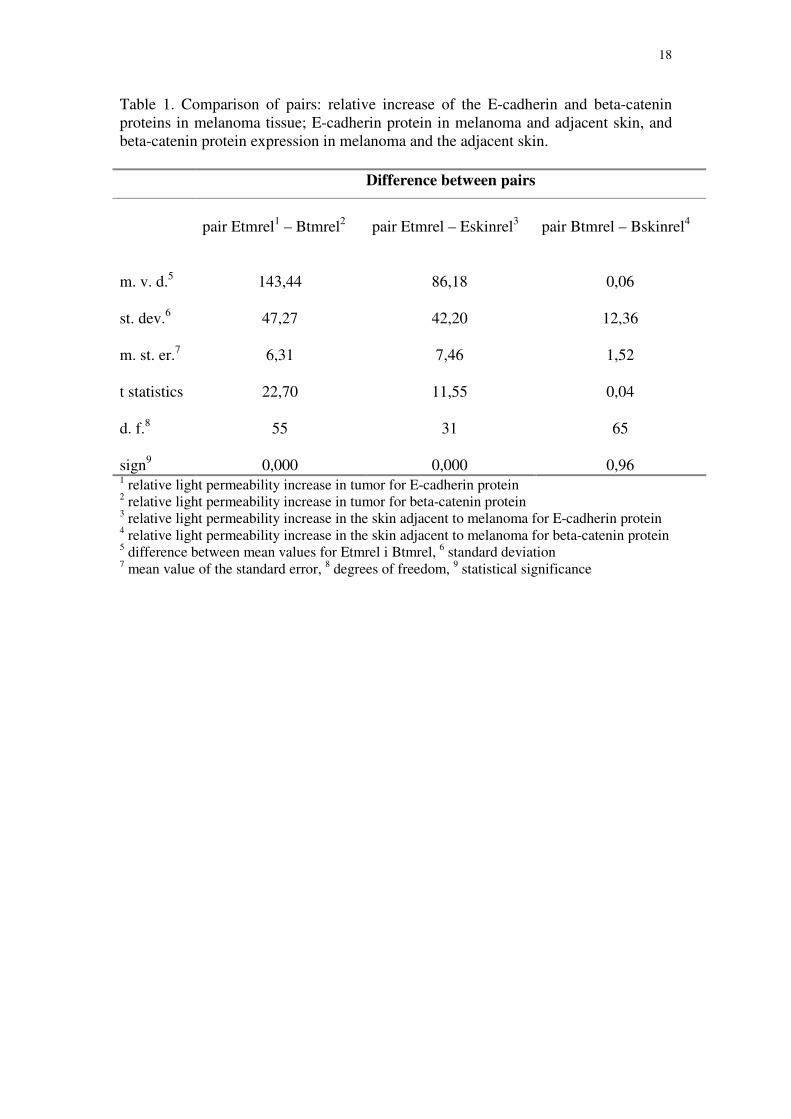
Comparison of mean values of relative LP for E-cadherin and beta-catenin in
tumor tissue showed that values for E-cadherin were significantly greater than those
for beta-catenin (259,67 to 116,23; t=22.70; P=0.000). Since greater LP indicated less
protein, our results showed that in the same patients levels of E-cadherin protein were
significantly lower than levels of beta-catenin.
Image analysis confirmed reduced staining of E-cadherin in all of the 70
melanoma samples, i.e. LP in grey scale pixels (reversely proportional to the protein
level) was greater in all melanoma tissues to the LP of the adjacent skin. The
comparison of mean values of the relative LP of E-cadherin in melanoma samples to
the LP in the immediately adjacent normal skin showed significantly greater values in
tumor tissue when compared to adjacent skin (256.06 to 169.87; t=11.55, P=0.000). It
was obvious that the expression of E-cadherin in tumor tissue was significantly lower
than that recorded in the adjacent skin.
To our surprise comparison of LP for beta-catenin in tumor tissue and the
adjacent skin did not show any relevant differences (115.30 compared to 115.24;
t=0.04, P=0.968). The results of Image analysis showing difference in light
permeabilities are demonstrated in table 1.
On the other hand, as we have pointed out earlier, the location of beta-catenin
protein has changed in melanoma cells. We divided our sample in two groups based
on the presence of the protein in the membrane. Comparison of mean values of the LP
of samples in which beta-catenin was visually determined in the cell membrane
(105.68) to that of cases where beta-catenin was not visually present in the cell
membrane (123.72) showed a statistically significant difference (Z= -2.525; P= 0.012)
indicating that higher levels of beta–catenin were correlated with the presence of the
protein in the cell membrane. No significant correlation of E-cadherin expression to
beta-catenin location in the cell was observed (Z= -1.291; P= 0.197).
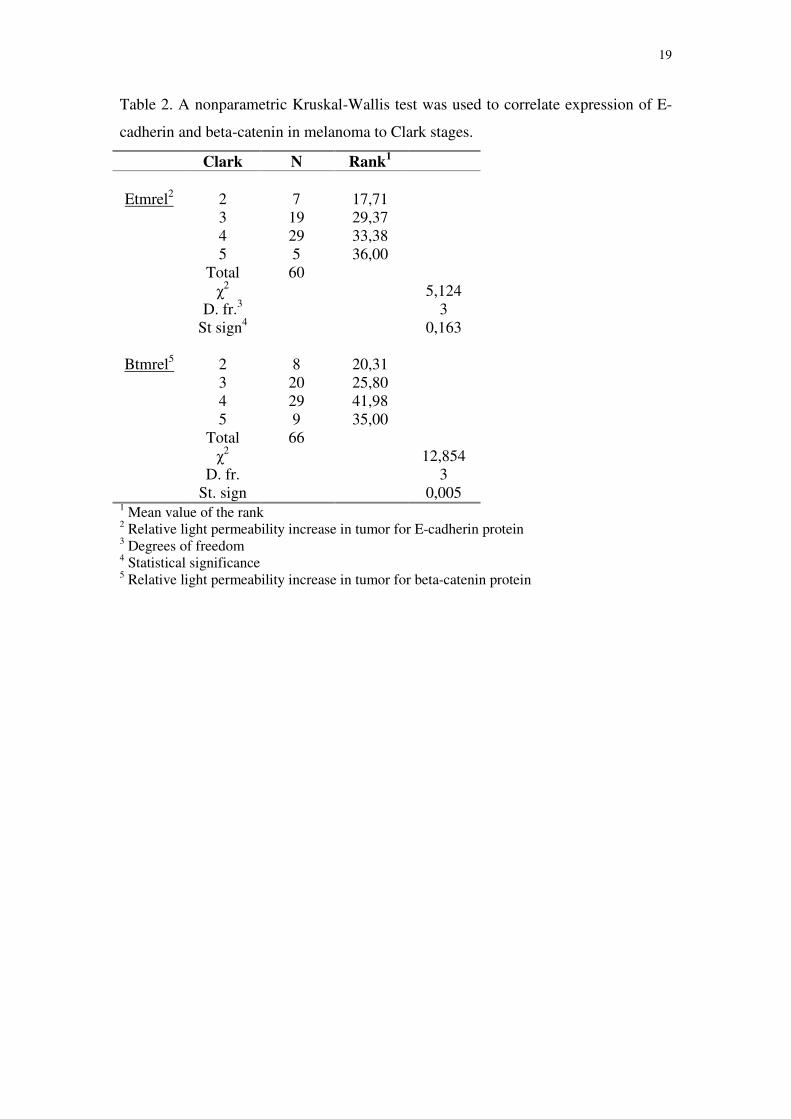
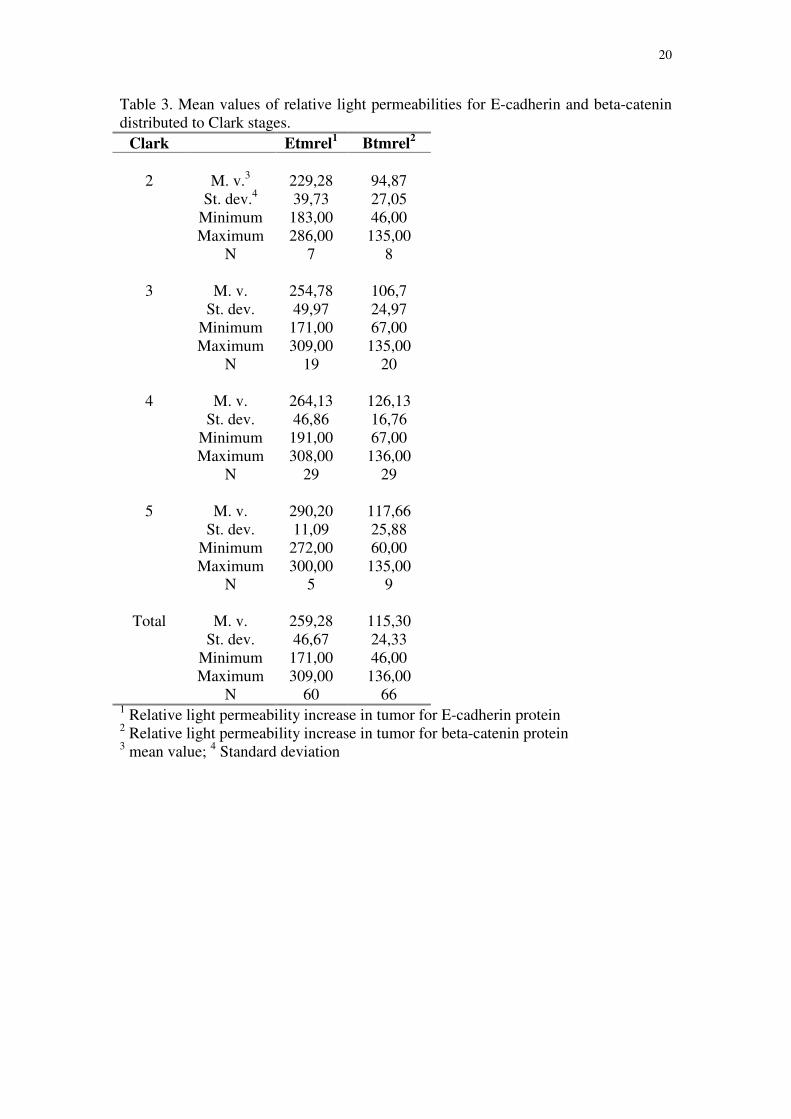
The pathohistological Clark stages (stages 2–5 were present in our sample) of
melanoma progression were not correlated with expression of the E-cadherin protein
(χ2 = 5.124; P=0.163). However, a significant difference in beta-catenin expression
was noted in the different Clark stages (χ2 = 12.854; P=0.005). Patients with Clark 4
and 5 had significantly less beta-catenin in melanoma cells than patients with Clark 2
and 3 (tables 2 and 3).
9
To determine and explain how age influenced expression of the investigated
proteins we divided our sample in two groups: patients younger than 62 and patients
older than 62 years of age (62 is the age median at diagnosis – 49% of analysed
patients are younger than 62 and 50.8% of patients are older). Variance analysis
(ANOVA) showed that patients older than 62 had significantly higher mean values of
LP for E-cadherin protein in tumor tissue in comparison to patients younger than 62
(270.75 to 235.70, F=7.303, P=0.009). E-cadherin in tumors of older patients was
therefore significantly lower than in patients younger than 62. Age at diagnosis of
those two subgroups was not correlated to the E-cadherin expression in the adjacent
skin, nor to beta-catenin expression in melanoma and adjacent skin.
Although the correlation of E-cadherin expression in tumor tissue to the
patient sex showed no significant difference (Mann-Whitney test, Z=-1.416,
P=0.157), and there was no difference in the E-cadherin expression in the adjacent
skin in males and females (Z = –0.378, P = 0.705), the analysis of beta-catenin
according to the sex of the patient showed significant differences between men and
women. Beta-catenin levels in melanoma were significantly lower in males, than its
protein levels in females (Mann-Whitney test, Z =–3.167, P = 0.002). Similar
discrepancy was observed in the adjacent skin, beta-catenin levels were also
significantly lower in men (Mann-Whitney test, Z = –2.829, P = 0.005).
Four metastatic melanomas together with their lymph node metastasis were
also analyzed. In all four metastatic melanoma there was drastic decrease in E-
cadherin expression (mean LP value 143) to the adjacent skin (mean LP value 82),
and the similar values were observed for their lymph node metastasis. Beta-catenin
levels were very low in lymph node metastatic lesions (mean measured LP 192) as
well as in metastatic tumors. Only one lymph node metastasis differed from its
melanoma in beta-catenin levels and had LP of 194 to the LP of 131 in melanoma. All
metastatic lesions had beta-catenin located in the cytoplasm and the one with different
LPs in cytoplasm and membrane.
Discussion
Our first finding on significantly lower E-cadherin protein levels in tumor
tissue to the levels of beta-catenin, which may suggest that E-cadherin′s expression is
inferior to beta-catenin′s in the same melanoma patients, indicates for the first time
10
the relation of quantities of those proteins. Since the proteins are bound to each other
in adherens junctions one would expect similar decrease in image analysis values.
It is possible that the disruption of adherens junctions changes the levels of
those two proteins in melanoma which is consistent to beta-catenin′s dual cellular
role- in signaling and structure. Although E-cadherin is not directly involved in the
wnt signaling, loss of its expression indirectly promotes the positive wnt signal, since
the disruption or nonformation of adherens junctions generates free cytoplasmic beta-
catenin. The question whether downregulation of E-cadherin precedes expression of
beta-catenin in melanocyte transformation and therefore unables its binding, or
whether the quantities of the two proteins are expressed independently still remains.
We should also consider the different quantities of the two proteins in our
normal skin samples (unrelated to melanoma). In normal skin homeostasis the
quantities of E-cadherin protein are higher than beta-catenin quantities. It is striking
that the quantities of those two molecules are inverse to their relation in melanoma.
We found significantly less E-cadherin protein in all melanomas examined to
its levels in the skin adjacent to tumors. This result indicates once again that the
integrity of intercellular adhesion is disrupted, since the main mediating molecule is
E-cadherin. Reports by other authors using melanoma cell lines are in accordance
with our results 16, 17. Since mutations of E-cadherin gene (CDH1) have not been
discovered in melanoma cells, an epigenetic cause for the decrease in E-cadherin
expression has been postulated 18.
The results that we obtained on beta-catenin expression were not so
straightforward. Quantification of beta-catenin protein expression showed that image
analysis values in melanoma and adjacent skin are almost identical in the samples we
analyzed. Nevertheless, the location of the protein was quite different in melanoma
than in the adjacent skin. In the biggest percentage of our sample (30.6%) the protein
was localized exclusively in the cytoplasm which also indicates beta-catenin's
signalling role. Twenty-four percent of our melanoma sample had beta-catenin
localized in the membrane. Other authors 19 have also found membranous staining in a
bigger part of their melanoma sample (83%). This finding could be explained by the
fact that instead of E-cadherin, transformed melanocytes express N-cadherin and
other types of cadherin molecules on their surfaces and that beta-catenin can bind to
the cytoplasmic domain of N-cadherin, same as it binds to E-cadherin in normal
11
skin 20. We can speculate that membranous localization of beta-catenin in melanoma
is the result of its binding to N-cadherin. It would be interesting for future studies to
investigate N-cadherin expression as well.
When we subdivided total sample in two groups: one with beta-catenin present
in the membrane and the other group where the protein was absent from the
membrane, the observed different quantities were found to be statistically significant.
Significantly stronger expression of beta-catenin was observed in the subgroup of
melanomas that had membranous staining. When beta-catenin acts in both
membranous location and signaling, its quantities are greater than when the junctions
are disrupted and solely signaling role remains.
Many investigators have reported on cytoplasmic localization of beta-catenin
in melanoma cells. Mælandsmo and coworkers 21 on a sample of 106 superficial
spreading melanomas detected cytoplasmic beta-catenin in 71% of their sample (and
in more than 50% of cells of each sample). On the other hand Kageshita et al. 22
showed that 42% of melanocytic nevi they investigated had exclusively cytoplasmic
staining, 10% mixed cytoplasmic and membranous, and 44% cytoplasmic and
nuclear. However, melanomas that same authors investigated showed cytoplasmic
staining in 70% of cases, and cytoplasmic and membranous staining in 20% which is
in consent to our 21%. Mælandsmo and coworkers 21 also found that beta-catenin is
totally absent in 5% of their cases, a number a bit lower than our finding of 17.7%.
Different numbers that we and other authors obtained could be explained by different
sample sizes, different evaluation of the staining and the use of monoclonal antibodies
that may have different sensitivities.
The incidence of malignant melanomas is increasing, and once metastasized
the prognosis is poor. Thus, early identification of patients with a high risk of
progression is of major importance. Besides thickness of the primary tumor, few
prognostic markers predicting patient outcome are available.
The analysis and correlations of the Image analysis values of protein
expression to clinical parameters, pathohistological diagnosis, age at diagnosis and
sex of the patients, have demonstrated interesting although difficult to interpret
results. The most interesting is definitely the finding that beta-catenin expression
significantly changes depending on Clark stage. Patients with Clark 4 and 5 have
significantly less beta-catenin protein (p=0.005) than patients with Clark 2 and 3. We
also observed very low levels of beta-catenin in a small sample of metastatic
12
melanomas as well as in their lymph node metastasis. These findings are in
accordance to other authors. Maelandsumo et al. 21 and Kageshita et al. 22 point out in
their work that beta-catenin is lost or reducedly expressed in advanced lesions, while
Krengel and coworkers 16 noticed significant downregulation of beta-catenin
expression from primary to metastizing lesions. The significant correlation between
loss of beta-catenin and the disease progression is potential marker of melanoma
progression.
The results of our study show that E-cadherin and beta-catenin may have
important roles in melanoma development and progression. Changes in E-cadherin
and especially beta-catenin levels are correlated with melanoma progression and
could be used as molecular markers of disease evolution. It would be interesting to
obtain data on wnt target genes, such as c-myc, in future studies.
Acknowledgements. This work was supported by grant 0108 215 from Ministry of
Science and Technology, Republic of Croatia.
References:
1. Berx G, Staes K, van Hengel J, Molemans F, Bussemakers MJ, van Bokhoven A,
et al: Cloning and characterization of the human invasion suppressor gene E-
cadherin (CDH1). Genomics 1995, 26:281.
2. Gumbiner BM: Regulation of cadherin adhesive activity. J Cell Biol 2000, 14:399.
3. Guilford P: E-cadherin downregulation in cancer: fuel on the fire? Mol Med
Today 1999, 5:172.
4. Pećina-Šlaus N: E-cadherin in normal and tumor cells. Cancer Cell Int E3:17,
2003 (http://www.cancerci.com/content/3/1/17).
5. Ozawa M, Baribault H, Kemler R: The cytoplasmic domain of the cell adhesion
molecule uvomorulin associates with three independent proteins structurally
related in different species. EMBO J 1989, 8:1711.
6. Kraus C, Liehr T, Hulsken J, Behrens J, Birchmeier W, Grzeschik KH, et al:.
Localization of the human beta-catenin gene (CTNNB1) to 3p21: a region
implicated in tumor development. Genomics 1994, 23:272.
7. Peifer M, Polakis P: Wnt signaling in Oncogenesis and Embriogenesis - a look
outside the nucleus. Science 2000, 287:1606.
13
8. Daniels DL, Weis WI: beta-catenin directly displaces Groucho/TLE repressors
from Tcf/Lef in Wnt-mediated transcription activation. Nat Struct Mol Biol
2005,12:364.
9. He TC, Sparks AB, Rago C, Hermeking H, Zawel L, daCosta LT, et al:
Identification of c-MYC as a target of the APC pathway. Science 1998, 281:1509.
10. Chin L: The genetics of malignant melanoma: lessons from mouse and man.
Nature Rev 2003, 3:559.
11. Polsky D, Cordon-Cardo C: Oncogenes in melanoma. Oncogene 2003, 22:3087
12. Zuo L, Weger J, Yang Q, Goldstein AM, Tucker MA, Walker GJ, et al: Germline
mutations in the p16INK4a binding domain of CDK4 in familial melanoma.
Nature Genet 1996, 12:97.
13. Kinzler KW, Vogelstein B: Lessons from hereditary colorectal cancer. Cell 1996,
87:159.
14. Li G, Fukunaga M, Herlyn M: Reversal of melanocytic malignancy by
keratinocytes is an E-cadherin-mediated process overriding beta-catenin signaling.
Exp Cell Res 2004, 297:142.
15. Clark HW: Clinical diagnosis of cutaneus malignant melanoma. JAMA 1978,
236:484.
16. Krengel S, Groteluschen F, Bartsch S, Tronnier M: Cadherin expression pattern in
melanocytic tumors more likely depends on the melanocyte environment than on
tumor cell progression. J Cutan Pathol 2004, 31:1.
17. Jamal S, Schneider RJ: UV-induction of keratinocyte endothelin-1 downregulates
E-cadherin in melanocytes and melanoma cells. J Clin Invest 2002, 4:443.
18. Chiles MC, Ai L, Zuo C, Fan CY, Smaller BR: E-cadherin promoter
hypermethylation in preneoplastic and neoplastic skin lesions. Mol Pathol 2003,
16:1014.
19. Rimm DL, Caca K, Hu G, Harrison FB, Fearon ER: Frequent nuclear/cytoplasmic
localization of beta-catenin without exon 3 mutations in malignant melanoma. Am
J Pathol 1999, 154:325.
20. Hsu MY, Meier FE, Nesbit M, Hsu JY, Van Belle P, Elder DE et al: E- cadherin
expression in melanoma cells restores keratinocyte-mediated growth control and
down-regulates expression of invasion-related adhesion receptors.
Am J Pathol 2000, 156:1515.

14
21. Mælandsmo GM, Holm R, Nesland JM, Fodstad O, Florenes VA: Reduced beta-
catenin expression in the cytoplasm of advanced-stage superficial spreading
malignant melanoma. Clin Cancer Res 2003, 9:3383.
22. Kageshita, T, Hamby, CV, Ishihara T, Matsumoto K, Saida T, Ono T: Loss of
beta-catenin expression associated with disease progression in malignant
melanoma. Br J Dermatol 2001, 145:210.
15
Figure legends
Figure 1. The figure is showing immunohistochemical staining of melanoma sample
(A) and immediate adjacent skin (B). Distinctive decrease of E-cadherin protein in
melanoma cells is demonstrated.
Figure 1 A
Figure 1 B
16
Figure 2. Same melanoma samples were immunohistochemically stained for protein
expression of beta-catenin. Normal skin and skin adjacent to melanomas showed
homogenous membranous staining of the epidermis (A). The figure shows beta-
catenin staining in normal skin (A), and different locations of the protein in melanoma
(B-cytoplasmic, C- membranous and cytoplasmic, D- cytoplasmic and nuclear).
Figure 2 A
Figure 2 B
Figure 2 C

17
Figure 2 D
18
Table 1. Comparison of pairs: relative increase of the E-cadherin and beta-catenin proteins in melanoma tissue; E-cadherin protein in melanoma and adjacent skin, and beta-catenin protein expression in melanoma and the adjacent skin.
Difference between pairs
pair Etmrel1 – Btmrel2 pair Etmrel – Eskinrel3 pair Btmrel – Bskinrel4
m. v. d.5 143,44 86,18 0,06 st. dev.6 47,27 42,20 12,36 m. st. er.7 6,31 7,46 1,52 t statistics 22,70 11,55 0,04 d. f.8 55 31 65 sign9 0,000 0,000 0,96 1 relative light permeability increase in tumor for E-cadherin protein 2 relative light permeability increase in tumor for beta-catenin protein 3 relative light permeability increase in the skin adjacent to melanoma for E-cadherin protein 4 relative light permeability increase in the skin adjacent to melanoma for beta-catenin protein 5 difference between mean values for Etmrel i Btmrel, 6 standard deviation 7 mean value of the standard error, 8 degrees of freedom, 9 statistical significance
19
Table 2. A nonparametric Kruskal-Wallis test was used to correlate expression of E-
cadherin and beta-catenin in melanoma to Clark stages.
Clark N Rank1
Etmrel2 2 7 17,71 3 19 29,37 4 29 33,38 5 5 36,00 Total 60 χ
2 5,124 D. fr.3 3 St sign4 0,163
Btmrel5 2 8 20,31 3 20 25,80 4 29 41,98 5 9 35,00 Total 66 χ
2 12,854 D. fr. 3 St. sign 0,005
1 Mean value of the rank 2 Relative light permeability increase in tumor for E-cadherin protein 3 Degrees of freedom 4 Statistical significance 5 Relative light permeability increase in tumor for beta-catenin protein
20
Table 3. Mean values of relative light permeabilities for E-cadherin and beta-catenin distributed to Clark stages.
Clark Etmrel1 Btmrel2
2 M. v.3 229,28 94,87 St. dev.4 39,73 27,05 Minimum 183,00 46,00 Maximum 286,00 135,00 N 7 8
3 M. v. 254,78 106,7 St. dev. 49,97 24,97 Minimum 171,00 67,00 Maximum 309,00 135,00 N 19 20
4 M. v. 264,13 126,13 St. dev. 46,86 16,76 Minimum 191,00 67,00 Maximum 308,00 136,00 N 29 29
5 M. v. 290,20 117,66 St. dev. 11,09 25,88 Minimum 272,00 60,00 Maximum 300,00 135,00 N 5 9
Total M. v. 259,28 115,30 St. dev. 46,67 24,33 Minimum 171,00 46,00 Maximum 309,00 136,00 N 60 66
1 Relative light permeability increase in tumor for E-cadherin protein 2 Relative light permeability increase in tumor for beta-catenin protein 3 mean value; 4 Standard deviation